Climate Change and Water - Metropolitan Water … 2016 background materials part 2/Udall MWD...
35
Climate Change and Water MWD Board Session Los Angeles, CA July 28, 2015 Brad Udall Senior Scientist/Scholar Colorado State University [email protected] Projected Runoff at 2100
Transcript of Climate Change and Water - Metropolitan Water … 2016 background materials part 2/Udall MWD...

Climate Change and Water
MWD Board Session
Los Angeles, CA
July 28, 2015
Brad Udall
Senior Scientist/Scholar
Colorado State University
Projected Runoff at 2100

*
* Climate Change Basics
* Evolution of Findings
* Regional Downscaling
* Climate Change Science
Weaknesses, Improvements
* Water Agency Key Points

*
• Earth is about 60F warmer than it should be
• Very Small Concentrations of Greenhouse Gasses (GHGs) are
the cause
• Almost every gas other than Oxygen (02) and Nitrogen
(N2) are GHGs. CO2 is most important one.
• Earth’s Temperatures have fluctuated widely over its 4.5B
year history
• But NOT during human ascendency of last 2k years
• Humans are adding enormous amounts of GHGs to the
atmosphere every day and it is increasing over time
• About half of emitted CO2 remains in the
atmosphere
• On a path to double CO2 by 2050
• Planet is now 1.4F warmer due to GHG emissions
• No other plausible explanation for the warming
• Total Warming will be related to GHG concentrations, not
emissions
• If you stop tomorrow, you still have a 1000-year
problem
• Humans are also modifying the planet in many other ways
• ‘The Anthropocene’

Why this problem is not going away anytime
soon….GHG emissions continue to increase
Source: IPCC, 2014

IPCC: All Kinds of Observations are Consistent with Climate Change
Expectations. Many are water cycle related.
90% of energy from warming here
Up by 8” since 1900,
may reach 1m by 2100
-53% decline in
June in NH
Up by
1.4F Since
1950, May
exceed 7F
by 2100
Up by 5%,
Consistent
with 7%/C Max
Rate
Up by ~0.5F
since 1950

*Climate Change is Water Change
* Heat Drives the Water Cycle –
1000 km3 evaporates daily from the oceans
* The Water Cycle mixes heat from areas of too much to too little
* As the Atmosphere Warms it Holds More Moisture:
~5F warming is 20% increase
* Heating Up the Earth (and uneven heating) results in Water Cycle changes
* More Evaporation, More Precipitation, More Moisture
* Changes in weather patterns
* Wet Wetter, Dry Drier Standard Rule
* More Intense Floods and Droughts
* All Kinds of Water Changes Already Noted
* More rain/less snow, Earlier Runoff, Higher Water Temps, More Intense Rain
* Many of the most critical impacts of climate change will arise through water cycle changes
driven by higher temps, not just higher temps rising temperatures

*
• Warming
• All Seasons Warm
• Less Warming on the Coast
• Average Warming is 4-5F
• 2 to 3X current warming of
~1.5F
• Precipitation
• Little Annual Precipitation
Change
• South Dries, North Wets
• Not Shown
• Much warming ‘baked in’
• Runoff is not Precipitation
• 3% decline / 1 °F
Warming
• 2:1 Leverage on P
Changes

IPCC 5th Results RCP 8.5 at 2081 to 2100
Source: IPCC 2013
Repeat after me: Precipitation is not runoff!

*
* Climate Change Basics
* Evolution of Findings
* Regional Downscaling
* Climate Change Science
Weaknesses, Improvements
* Water Agency Key Points

IPCC Statements Over the Years
(And How I feel Today)

* Long History of Climate Change Science
* Water Cycle Key Driver and Key Impact
* Amazingly Broad Support from Science Community
* Recent Evolution with IPCC FAR
* More Certainty as to Human Contribution
* More Sea Level Rise
* On the big scale, mostly continuity of findings
Keeling Charney
Fourier
Arrhenius
Callendar Revelle

*
* Downscaling Metaphor?
* Climate Change
* Evolution of Findings
* Regional Downscaling
* Weaknesses, Improvements
*Are we playing dumb?
* Water Agency Keys
* Closing Thoughts
*
• Provide More Realistic Future Simulations by
adding details to GCMs
• Necessary Evil for Some Purposes
• e.g., Hydrology/Operations Model in 2050
• What you can add/fix
• Topography
• Model “Biases”
• What you can not add/fix
• ENSO Changes
• Monsoons
• Model Precipitation Uncertainty
• Atmospheric Rivers
• Future of Downscaling
• Climate Models halve grids every 5 years
• 10-20 Years will reduce need
• Still helpful, so long as we don’t fool ourselves
• Use to help think
• “Envisioning the Future”
• Do not confuse accuracy with precision
*

*

*
* Climate Change
* Evolution of Findings
* Regional Downscaling
* Climate Change Science
Weaknesses, Improvements
* Water Agency Key Points
*
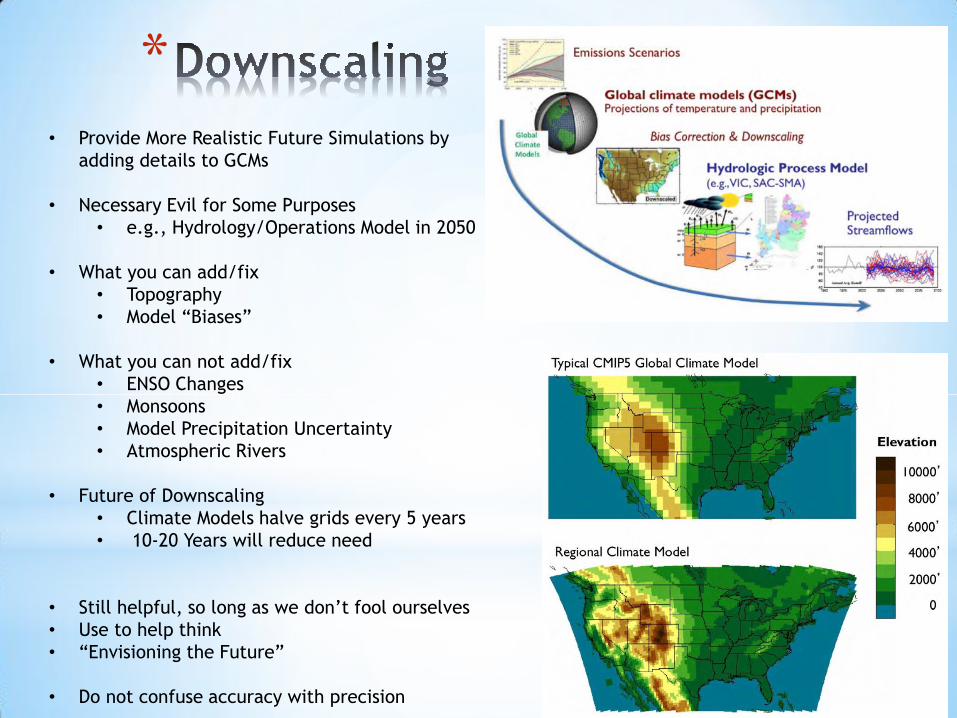
*Terrific, Thought-Provoking Article Worth a Read
*Key Points
*Large Uncertainties do not mean small risks
* Uncertainty can support immediate action in some cases
*A lack of certainty provides no rational argument against action
*Varieties of uncertainty:
* Imprecision – can be quantified by PDF
* Ambiguity – impacts known but can’t be quantified via PDF, e.g. 100 yr impacts
* Intractability – not solvable, e.g. no equations or lack computers
* Indeterminacy – also not solvable, e.g., a societal value or non-physical parm.
*“Models can increase our understanding long before they start providing realistic numbers.”
*These concepts not appreciated by both modeling community and user community
* Key Point: we need to move away from scientific uncertainty to managing risk
Uncertainty in science and its role in climate policy
Leonard Smith and Nicholas Stern
Phil. Trans. R. Soc. A (2011) 369, 1–24 doi:10.1098/rsta.2011.0149

*
* Emissions Uncertainties
* When do we stop emitting GHGs?
* Climate Response Uncertainties
* Feedbacks Critical: clouds, water vapor
* El Nino Southern Oscillation
* Natural Variability
* Amount of Warming – but not if it will warm
* Sea Level Rise
* Big Ice Sheet Dynamics not understood
* Regional Impacts
* Precipitation
Model
Scenario
Climate Variability
Scenario
Model
Climate Variability
British Isles
Global
*
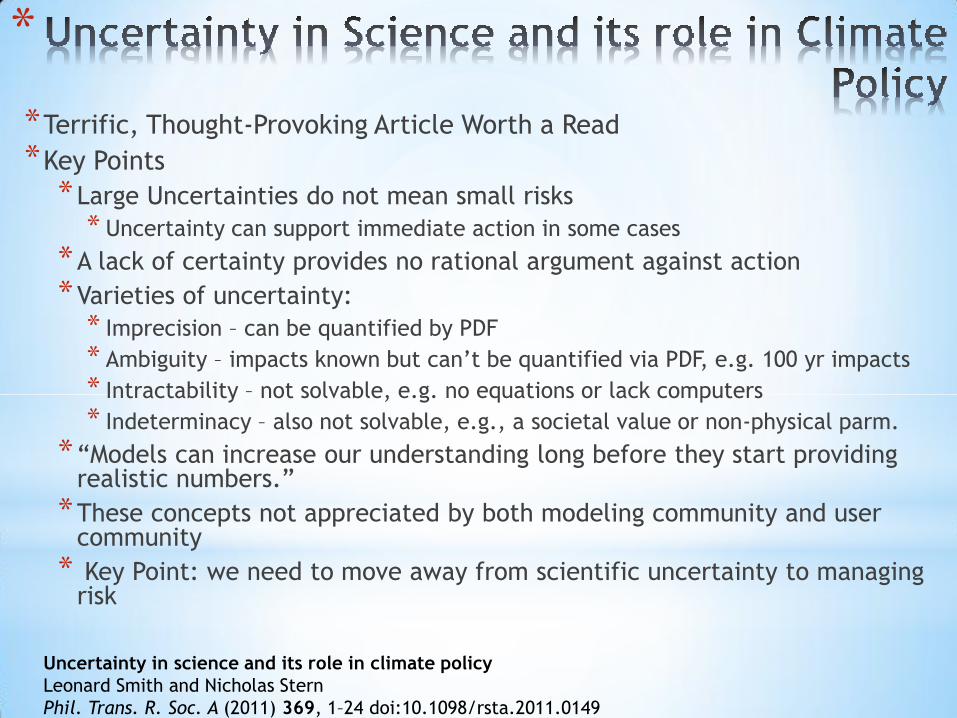
* This is a ‘poorly formed’ question. Really 3 Questions
Need to be Asked
* 1. Is this (drought/flood/etc) caused by climate
change?
* Natural Variability makes it hard to discern climate
change ‘signal’ from natural variability ‘noise’
* Usually the answer will be ‘No’ due to statistical
hurdles. Gives mistaken impression that climate
change is not happening or is not affecting events
* Scientists prefer to err on side of ‘Trojan Horse’
than ‘Cry Wolf’
* 2. Is climate change affecting this event?
* Generally, Yes.
* More atmospheric moisture for sure
* Higher temps and more drying
* Other factors may be at work, too
* Lots of possible climate change effects:
intensity, duration, frequency
* 3. How will climate change affect
future droughts/floods/etc ?
* All the usual answers apply
* More extremes: bigger droughts
and bigger floods
The 2 Kinds of Errors we make with Predictions
Truth No Climate Change Yes Climate Change
Scientific Prediction
No Climate Change
Good Prediction Trojan Horse Error
Yes Climate Change
Cry Wolf Error Good Prediction
Wandering Jet Stream and Extremes
Credits to: Trenberth, Gleick

*
* NOAA says the drought is just ‘natural variability’
* I think they are confused and this is the wrong message
* Lots of Push Back from Other Scientists
* Not Peer Reviewed
* Misses many things
* Holdren Testimony 2014:
* Ongoing debate over CA circulation patterns – variability vs.
change
* Climate change has 4 drought causing mechanisms all at work
here: (1) more downpours and less absorption, (2) more rain
and less snow (3) earlier snow melts, (4) higher evaporation
* My take
* Intensity: Future droughts will be as intense or more intense
as this drought
* Duration: Hard to say
* Frequency: Hard to say but ….
* State will get slammed by floods, too, at some point
* And don’t forget about sea level rise
* Sources: Dan Swain Blog, Cliff Mass Blog, Revkin
Blog, Peter Gleick, Holdren, Michael Mann

*
* Climate Change
* Evolution of Findings
* Regional Downscaling
* Climate Change Science
Weaknesses, Improvements
* Water Agency Key Points

* Scientists often accused of exaggerating the risk of climate change but ought to be more emphatic about the risk
* Science is actually quite conservative and new knowledge met with skepticism
* Copernicus on Sun, Wegner on Continental Drift, Alvarez’s on Dinosaur Extinction Event
* 95% Confidence Limit Often used
* Avoids a 5% chance that the finding Is by chance
* A convention from early statistician, RA Fisher
* Has no basis in nature, a value judgment
* Avoids Type 1 Errors: Cry Wolf Error which scientists hate
* But automatically increases Type 2 Errors: Trojan Horse Error
* Leads us to understate the risk and play dumb
*But we are not dumb at all; we know climate change a big threat

** Climate Change is Real, Here, Important
* There is NO uncertainty about this
* Climate Change is Water Change
* Precipitation is not runoff
* Annual Runoff Does Not Tell the Whole Story
* A Shifting Hydrograph is a problem
* California will have all kinds of problems…
* Mediterranean Climate – Drying
* High Temperatures
* Sea Level Rise in the Delta
* Flooding via Atmospheric Rivers
* Loss of Snowpack – More rain, less snow
* Fires
* Is/Is Not Attribution Studies not helpful
* Some Scientists are Playing Dumb
* Climate Change affecting lots of things already
* Science very steady but also large range of futures
* Do not expect much more from science in at least next 10 years
* Uncertainty should not prevent action; We know enough to act
* Act to Manage Risks
* Risk: probability * consequence
* Especially Consider Low Probability High Consequence Events
* Climate Change makes ______ Worse
* ____ = CA Delta, Drought, Floods, CWA, ESA, And just about anything else in the Southwest
* “Americans always do the Right Thing” ~ Churchill


*

IPCC FAR Results RCP 8.5 at 2081 to 2100

IPCC FAR Results: RCP 8.5 Precipitation at 2081-2100
Source: IPCC 2013

IPCC FAR Results: RCP 8.5 Temps at 2081-2100

* 2F Warming since 1900
* Snowpack Reductions and Changes in Runoff Timing Already Present
*Most Severe Drought since records kept
* Powell and Mead at 50% of capacity now, full 2000
* Tree Mortality Rates High
* Increase in Wildfire Frequency
* Drought may be natural, but exacerbated by higher temperatures
* Snowpack Reductions and Runoff Timing attributed to climate change
* Continued drying likely as temperatures increase and storm tracks shift
*Megadroughts independent of climate change a possibility with severe
consequences if combined with warming
Science, June 25,
2010

Recent Science Articles on Similar Themes
“Many regional modelers don’t
do an adequate job of
quantifying issues of
uncertainty.”
“We are not confident predicting
the things people are most
interested in being predicted.”
“The problem is that precision is
often mistaken for accuracy.”
~ Christopher Bretherton
University of Washington

*
* Models can’t be calibrated – simulating never before seen state
* Contrast with Weather where models interpolate
* Climate models: no archive over time, run once, projection times >> model life
* PDFs can be made but what they represent is not what we thought
* We thought a ‘PDF of the Future’ initially
* But models are only a Lower Bound on Range of Uncertainty
* True Future PDF is wider
* At least 3 Sources of Uncertainty
* Forcing
* Emissions Scenario
* Initial Conditions
* Makes a Difference to End Results
* Does Not Make a Difference to End Results
* Model Imperfection
* Model Uncertainty – e.g. parameters for physical processes
* Model Inadequacy – incorrect formulation
* No rational way to weight models now
Confidence, uncertainty and decision-support relevance in climate
predictions
D.A Stainforth, M.R Allen, E.R Tredger and L.A Smith
Phil. Trans. R. Soc. A 2007 365, 2145-2161 doi: 10.1098/rsta.2007.2074

*
• Multiple Theories about the fate of the
‘missing’ extra heat
• El Nino works both ways –
• 1998 Released Heat
• La Nina can store heat deep in the
ocean via winds
• Other Contributors
• We may not be measuring polar
temperatures correctly
• Slightly less solar output (but not
much!)
• Volcanic Cooling?
Some are evening saying warming is
accelerating
Surface Air Temps

*

*
*Failure to simulate synoptic patterns that drive rainfall, especially
extremes
*Large Scale Processes not well simulated: ENSO, IOD, Others
* Not understood, either
*Of 39 GCM runs, 22 show increases, 17 show decreases in
precipitation
*None of the models could reproduce the drying trend since mid
1990s
*GCMs couldn’t distinguish between wet coastal strip and dry interior
300 km away
*Climate model outputs at monthly and submonthly scale do not
reproduce historical climate and show significant biases
* Downscaling (Bias Correction and Change Factor) introduce ‘false precision’ and
introduce an additional layer of uncertainty
* Bias Corrections assumed to be stationary over time
*Climate to Hydrology Connection is Poorly Understood
* Current Hydrology models calibrated to current conditions, not future
* When does such calibration cease to be useful?

** Step 1: Communication Between Climate Scientists, Hydrologists, and
Water Resource Managers
* Define what is ‘practically useful’
* Disconnects about what can be expected and How to act in face of uncertainty
* Step 2: Quantify Baseline Risk Associated with Natural Climate Variability
* Need to understand paleoclimate better
* How dry can it get and for how long?
* Need to understand drivers of variability
* Stochastic Framework needed to integrate both
* Step 3: Incorporate the Projected Impacts of Anthropogenic Change
* Identify physical processes driving hydroclimate
* Identify or Develop models that simulate these processes
* Determine how processes will change in the future and apply changes in
stochastic framework
* Step 4: Develop Appropriate Adaptation Strategies
* Need Reliable Probabilities of Uncertainties
* Robust Quantification of Uncertainties Needed
* Identify Win-win Adaptation Strategies
* Step 5: Ongoing Communication
* Address Intensity, Time Span, Frequency