Climate Change and Trade Policy - World Bank · Climate change and trade policy: ... Section 4...
35
Policy Research Working Paper 5378 Climate Change and Trade Policy From Mutual Destruction to Mutual Support Patrick A. Messerlin e World Bank July 2010 WPS5378 Public Disclosure Authorized Public Disclosure Authorized Public Disclosure Authorized Public Disclosure Authorized Public Disclosure Authorized Public Disclosure Authorized Public Disclosure Authorized Public Disclosure Authorized
Transcript of Climate Change and Trade Policy - World Bank · Climate change and trade policy: ... Section 4...

Policy Research Working Paper 5378
Climate Change and Trade Policy
From Mutual Destruction to Mutual Support
Patrick A. Messerlin
The World BankJuly 2010
WPS5378P
ublic
Dis
clos
ure
Aut
horiz
edP
ublic
Dis
clos
ure
Aut
horiz
edP
ublic
Dis
clos
ure
Aut
horiz
edP
ublic
Dis
clos
ure
Aut
horiz
edP
ublic
Dis
clos
ure
Aut
horiz
edP
ublic
Dis
clos
ure
Aut
horiz
edP
ublic
Dis
clos
ure
Aut
horiz
edP
ublic
Dis
clos
ure
Aut
horiz
ed
Produced by the Research Support Team
Abstract
The Policy Research Working Paper Series disseminates the findings of work in progress to encourage the exchange of ideas about development issues. An objective of the series is to get the findings out quickly, even if the presentations are less than fully polished. The papers carry the names of the authors and should be cited accordingly. The findings, interpretations, and conclusions expressed in this paper are entirely those of the authors. They do not necessarily represent the views of the International Bank for Reconstruction and Development/World Bank and its affiliated organizations, or those of the Executive Directors of the World Bank or the governments they represent.
Policy Research Working Paper 5378
Contrary to what is still often believed, the climate and trade communities have a lot in common: a common problem (a global “public good”), common foes (vested interests using protection for slowing down climate change policies), and common friends (firms delivering goods, services, and equipment that are both cleaner and cheaper). They have thus many reasons to buttress each other. The climate community would enormously benefit from adopting the principle of “national treatment,” which would legitimize and discipline the use of carbon border tax adjustment and the principle of “most-favored nation,” which would ban carbon tariffs. The main effect of this would be to fuel a dual world economy of clean countries trading between themselves and dirty countries trading between themselves at a great cost for climate change. And the trade community would enormously benefit from a climate community capable of designing
This paper—a product of the a product of the DFID supported Global Trade and Financial Architecture (GTFA) project-—is part of a larger effort to explore the links between climate change and trade policies. Policy Research Working Papers are also posted on the Web at http://econ.worldbank.org. The author may be contacted at [email protected]..
instruments that would support the adjustment efforts to be made by carbon-intensive firms much better than instruments such as antidumping or safeguards, which have proved to be ineffective and perverse. That said, implementing these principles will be difficult. The paper focuses on two key problems. First, the way carbon border taxes are defined has a huge impact on the joint outcome from climate change, trade, and development perspectives. Second, the multilateral climate change regime could easily become too complex to be manageable. Focusing on carbon-intensive sectors and building “clusters” of production processes considered as having “like carbon-intensity” are the two main ways for keeping the regime manageable. Developing them in a multilateral framework would make them more transparent and unbiased.

1
Climate change and trade policy: From mutual destruction to mutual support*
Patrick A. Messerlin Groupe d’Economie Mondiale de SciencesPo Paris
Keywords: trade liberalization, WTO, national treatment, most-favored nation, carbon border tax adjustment, carbon tariffs, carbon conditional measures, carbon policies. JEL codes: F13, F18, F5, Q54, Q56, Q58. This paper is a contribution to the DFID-World Bank Global Trade and Finance Architecture project. It is based on a presentation made at the Séminaire de la Chaire Développement Durable, Ecole Polytechnique et Sciences Po, 20 December 2009. I would like to thank very much Claude Henry for inducing me to work on this issue, and Olivier Cattaneo, Jim de Melo, Julien Hanoteau, Bernard Hoekman, Petros Mavroidis, Michael Moore, Joost Pauwelyn and the participants of the Séminaire for very useful comments and discussions.
2
Introduction
A decade ago, the relations between the climate and trade communities were marked by
mutual ignorance at best, more often by (deep) hostility when dealing with the issue of carbon
emissions on which this note focuses.1 The climate community did not want to be hindered in
any way by trade constraints. The trade community was so afraid of the damages that climate
change policies could do to the world trade regime that it was adamantly opposed to any
consideration of such concerns. Mutual destruction looked inevitable.
This negative phase has begun to give way to more positive attitudes on both sides, as
illustrated by the recent literature [Charnovitz 2003, Pauwelyn 2007, WTO 2007, Houser et
al. 2008, Antholis 2009, Hufbauer et al. 2009, Kommerskollegium 2009, Horn and Mavroidis
2010, Hufbauer and Kim 2010, Low et al. 2010]. However, this literature focuses on the existing
trade rules as they could be interpreted. Such a precautionary approach makes sense to the
extent that relevant trade provisions are often written in a general language not yet tested by a
robust case law. But, it is inevitably biased towards a systematic magnification of the scope
of conflicts since it examines the many putative conflicts raised by creative trade lawyers
while it underestimates the flexibility of the world trade regime (the main exceptions being
Hufbauer et al. 2009 and Hufbauer and Kim 2010).
Meanwhile, the Copenhagen Conference has amply shown that climate change
negotiators from all countries keep a close eye on their trade interests since, for most
countries—be developed, emerging or developing—trade is such a substantial share of their
economic activity. Emerging economies do not want to take firm commitments on cutting
emissions if they are not reassured on the way their exports to the developed countries will be
treated in the future. Developed countries do not want to take firm commitments on cutting
emissions if they are not reassured on the way their imports from developing countries could
be treated in the future.
Tackling the trade dimension of the world climate change regime is thus a necessary
condition for a robust treaty on climate change. Moreover, it is a key input in solving the
other essential condition for a robust treaty—how developed and developing countries should
share the efforts for coping with the emissions “inherited” from past industrialization. Absent
this second condition, no agreement on climate change could be expected to be correctly
1 By contrast, there have been numerous discussions and potential agreements on broader environmental issues (such as tariff cuts on environmental goods and services) between these two communities.

3
enforced (both in terms of compliance and participation), as indeed it happened with the
developing economies under the world trade regime until the early 1990s.
The note is organized as follows. Section 1 develops the following basic proposition:
the climate and trade communities have much more in common than perceived at a first
glance. Hence, they have many reasons and opportunities to buttress each other, a point
present in Antholis [2009]. Sixty years ago, the world trade regime had to solve problems
faced today by the climate community. It would be very unfortunate that the trade
community would not share its experience, and remain inert by lack of vision or inability to
conclude the Doha Round. At the same time, the climate community could help the trade
community to rectify some of the errors it made sixty years ago when designing the world
trade regime. In short, there are “two-way” benefits. Mutual support is highly desirable.
Sections 2 and 3 describe the benefits that the climate community could derive from
the world trade regime for buttressing the Copenhagen Accord. By the same token, they
make a clear distinction between carbon border taxes and carbon tariffs, two radically
different concepts though generally treated as similar. If properly designed and disciplined,
carbon border taxes may be desirable, while carbon tariffs should be avoided at any cost from
both a trade and climate change perspectives. Section 4 turns to a third instrument—carbon
conditional measures (hereafter CCMs). It argues that they should also be avoided at any cost
from both a trade and climate change perspective. It also explains the gains that the trade
regime could get from the world climate change regime if such a regime succeeds to define
sound adjustment measures, a point that the trade regime has failed to address properly so far.
A final section concludes.
1. Common problem, common foes, common friends
The climate community has been disappointed, to say the least, by the outcome of the 2009
Copenhagen Conference. It could get some comfort—and, more importantly, some insights
on what to do—by looking at how the world trade regime was established sixty years ago.
The La Havana Conference was convened in 1948 in order to design an ambitious
treaty for the world trading system. The complete Conference failure left distressed
negotiators with a few provisions having a limited scope (the so-called General Agreement on
Trade and Tariffs) and a series of commitments on tariff cuts which were both already
negotiated and agreed in 1947, but with no wide legal framework to enforce them.2 As a
2 This note uses the term General Agreement for the text of the Agreement, and the acronym GATT for the institution in charge of monitoring its implementation and of hosting multilateral trade negotiations (“Rounds”).

4
result, the General Agreement on Tariffs and Trade (hereafter GATT) and the commitments
on tariff cuts entered into force under a “protocol of provisional application” which was not a
treaty, which was initially signed by only 19 countries and which did not include the many
substantive chapters of the defunct Havana Charter, such as those on economic development
or on business practices. In many respects, the GATT was (still is) a “political” text
dominated by good intentions and by loose language dubbed as “creative ambiguity”.
This short history of GATT birth is so similar to what has happened in the 2009
Copenhagen Conference that it raises the following questions. Is there a common problem
which could lie behind such a parallel? Have the climate and trade communities the same
foes and friends? Which is the value of multilateralism in a climate change context?
1.1 Common problem
The climate and trade communities face the same basic problem: they deal with a “public
good” at the world level. Climate change is a public good: countries unwilling to contribute
to a climate change policy can undermine the results of those making efforts. Freer trade is a
public good: its benefits are bigger and faster to emerge if all the countries move together.
These similar basic problems require a similar solution—an adequate multilateral regime.
However, GATT history shows that, if a multilateral regime “enhances” national
decisions, unilateral policies by country are needed to initiate the process and to keep it
rolling.3 This is because, despite robust economic analysis, most countries continue to believe
that they would be better off if they impose tariffs on their imports while getting free access to
the markets of the rest of the world. In such a context, countries moving ahead—from Britain
in the early 1800s to the U.S. in the mid 1900s to China in the late 1900s—showed a critical
leadership.4 During the past two to three decades, sixty percent of trade liberalization has
been unilateral decisions made by national governments, with these decisions being (partly)
consolidated later in the world trade regime [World Bank 2005, Martin and Messerlin 2007].
3 This is not a new phenomenon. In trade, Britain started in the 1840s, followed by France in 1860. Indeed, the 1860 Franco-British Treaty triggered a complex web of bilateral treaties which echoes the polycentric approach envisaged by Ostrom [2009] in the climate change context. However, the XIXth century trade regime collapsed largely because countries were unable to “structure” all these agreements, for instance by adopting the principle of the most favored nation [Tumlir 1983]. This explains the focus of the GATT founding fathers on a multilateral agreement, though they were friendly to regional trade agreements (as shown by GA Article XXIV). It will be interesting to see whether this complex dynamics of the world trade regime over two centuries will occur in the future world climate change regime. 4 Leading countries (the U.S. in particular) have been instrumental for launching the long and difficult trade Rounds which have allowed progress towards world freer trade in the rest of the world.

5
The emerging world climate change regime seems to follow the same pattern. The
annexes to the Copenhagen Accord rely entirely on unilateral climate change commitments
[UNFCCC 2010]. There will also be a need of unilateral movers in climate change because a
similar skepticism exists in climate change: most countries believe that they could escape
most of the effects of climate change if the others take appropriate measures to fight climate
change, while they do not do it themselves.
That said, the public good aspect of climate change and trade is not valued in an
exactly similar way. If freer trade is implemented in an economically sound way (that is, with
the appropriate complementary domestic policies) it is a powerful policy for growth and
poverty reduction. It is thus an attractive option for countries willing to catch up (poor
countries) and a less attractive option for countries which feel their existing supremacy
challenged (rich countries). The converse situation prevails for climate change. As climate
change concerns depend upon the income level, poor countries tend to value climate change
policies less highly than rich countries. The corollary is that a world climate change regime
hurting the trade interests of the poor countries runs high risks to be rejected, as amply shown
during the Copenhagen Conference. There is thus a need to define efficient climate change
policies which do not hurt trade, hence growth perspectives.5 As seen below, such climate
change policies do exist.
1.2. Common foes: already there
Trade and climate communities face also the same foes. There are mostly vested industrial
interests in carbon-intensive activities (aluminum, cement, chemicals, glass, paper, steel to
name the most important) although the situation is more nuanced than often said. Such vested
interests may try to use trade protection as a way to oppose or to slow down changes in the
climate change front, and to use the climate change argument to keep their existing trade
protection.
As the trade community has faced similar problems during the last six decades, it is
very well aware of the capacity of vested interests to capture and re-shape policies to the
detriment of the whole country’s interests. By contrast, some members of the climate
community seem ready to follow those vested interests, hoping that the climate change policy
5 Growth and climate change are often perceived as antagonistic. However, there is a vast literature showing that their interactions are much more complex, with growth-related trade having a scale effect (generally negative on climate change) a composition effect (ambiguous) and a technological effect (generally positive on climate change).

6
would benefit from such a coalition. Section 4.2 argues that it is unlikely to be the case and
provides robust evidence on these common foes.
1.3. Common friends: emerging
A crucial strength of the world trade regime has been its capacity to mobilize “positive”
economic forces against the above vested interests. These forces are pushing for market
opening because they are confident to deliver better products and/or charge cheaper prices.
Such a mobilization is relatively easy in a context of cutting tariffs (cutting taxes is always
popular for exporters and consumers) all the more because the trade community has been
lucky enough to know the level of the tariff maximizing economic welfare—zero (complete
free trade).6
The climate community has not such a luxury. Climate change policies consist in
imposing taxes or in introducing prices for taking into account a public good ignored so far.
Such tools do not look friendly to businesses and consumers, though there are ways to soften
this feeling.7 Moreover, as the level of tax (or price) ensuring the world global temperature
not to increase by more than 2 degrees Celsius is yet unknown, the climate community has to
create mechanisms revealing progressively such a level, a very difficult process.
That said, positive forces are also emerging in the climate change context. There is a
rising number of firms investing in products targeting climate change-driven demands. Some
countries (Germany, Sweden, but also China or India) are increasingly behaving as having
positive economic interests in a world climate change regime. A concrete illustration of such
forces is emerging in the negotiations on complete liberalization of trade in environmental
goods in the Doha Round. If these negotiations are bogged down by disagreements on the list
of such goods, it partly mirrors the fact that the process is only beginning, hence that there is
not yet a wide enough scope of interests. Eliminating tariffs on such equipments and products
would make more affordable climate change policies in the emerging and developing
countries.
6 Economic analysis shows that positive tariffs could increase the welfare of “large” countries or in case of “imperfect” competition. However, these arguments are not so strong for the coming decades. Emerging large economies erode fast the market power (if any) of the large developed countries. And it is very difficult to design the “strategic trade” policies associated to imperfect competition in a world dominated by rapid technological progress and economic changes as the current world is. 7 Some carbon tax schemes (such as the existing Swiss scheme or the proposed French scheme) compensate (or even more than compensate) via income tax rebates the income effect of carbon taxes.

7
1.4. Still a multilateral world—not yet a “one world”
The 2009 Copenhagen Conference has made clear that the ideal mechanism of a negotiated
world tax [Cooper 2008] or price [Cramton and Stoft 2010] is very far away. The annexes to
the Copenhagen Accord show that countries are not even capable to define their commitments
in identical terms (same base and target years, same criteria for measuring emission cuts,
etc.).
What may be in reach is therefore a multilateral regime relying on national carbon
schemes. As mentioned above, such a regime is not without benefits to the extent that it
allows “willing” countries to take the lead and go ahead. But, these countries may also be
tempted to take extra-territorial actions by defining the climate change norms to be enforced
by its partners, as most recently illustrated by the EC Renewable Energy Directive [Schaus
and Lendle 2010]. A truly multilateral system and extra-territorial actions are hardly
compatible.
What follows assumes a truly multilateral regime: each country imposes its own
carbon tax(es) on its domestic emitters, and it takes the climate change policies of its partners
as granted—exactly as it defines its own trade and fiscal policy and takes the trade and fiscal
policies of its partners as granted. The focus of the paper is on the mechanism of a carbon tax,
and not on price or cap-and-trade. A first reason for adopting such an approach is
convenience. As carbon taxes and tariffs are very similar from a legal and economic point of
view, legal and conceptual problems are minimized. The last thing one wants is to design a
multilateral climate change regime riddled with legal and conceptual problems at the onset.
Section 4.4 provides a wider set of reasons in favor of such a choice.
The first key question is: what are the provisions that have been the source of the
success of the trade regime and that are absent in the Copenhagen Accord? The answers are
“national treatment” and “most-favored nation”.
2. National treatment: A robust framework for carbon border taxes
In 1947, the GATT did not impose the principle of free trade which was then (still is) as out
of political reach as a world carbon tax (price) today. It defined only two principles more
politically acceptable and yet economically sound. The first is “national treatment” (NT).
a country should impose the same domestic tax(es) on the goods imported and on the
like-products produced domestically (GATT Article III);
any country violating this rule would be exposed to compensation or retaliation by all
the GATT Members concerned.

8
This principle has created a level playing field between foreign and domestic products
credible enough for trade to flourish at an astounding rate during the last sixty years.
Transposing the NT principle into the climate change regime would ensure the same level
playing field. But, it also raises serious implementation issues to be examined carefully.
2.1. The NT principle, taxation and world trade
The NT principle addresses the major concern of the climate community—the fear that trade
rules would inhibit the development of stricter climate change policies in countries willing to
move ahead. This key point can be illustrated by what has happened in fiscal policies. During
the last sixty years, the NT principle has allowed the multilateral trade regime to thrive in a
world where different national indirect tax rates have been the rule rather than the exception,
as best illustrated by the European Community (EC) with its huge internal trade and the many
different rates of value-added tax (VAT) in the various EC Member States. Interestingly
enough, the current debate on climate change and trade largely echoes the debate raging in the
1970s in the U.S. after the adoption of VAT by the EC Member States.8
Managing trade and fiscal policies has required the combination of the NT rule with
the principle of taxation of the country of destination (see the review by Horn and Mavroidis
[2010]). The latter states that, when country A does not impose the same tax on a given
product than country B, the domestic tax imposed by country A on its product should be
removed when the product is exported to country B, and replaced by the domestic tax of
country B, once the good has entered country B market. Simultaneously, a “border tax
adjustment” (hereafter, border tax for simplicity sake) is also applied to products exported
from country B to country A. “Two-way” border taxes have been the routine procedure
allowing to cope with differences in indirect taxes between trading partners for the last three
decades.
2.2. The NT principle and the climate change regime
Transposing the “two-way” procedure into the climate change context imposes thus two
obligations on every country. First, when exporting goods, the country eliminates its
domestic carbon taxes (if any) on the exported products. Second, when importing goods, the
country imposes its own domestic carbon tax on the imported products (free of the carbon tax
imposed by the exporting countries). 8 It is not a mere coincidence that this U.S. issue with VAT has recently resurfaced in the trade debate in the U.S. [Lighthizer 2010].

9
This procedure deserves several remarks. First, it makes sense only if the
domestically-produced and foreign goods are “similar” (or “like”). Defining “similarity” has
always been a source of serious problems in trade policy. Economic analysis links similarity
to price cross-elasticities and relevant markets. Such a view has never prevailed in the trade
policy context where similarity is generally defined on arbitrary grounds: two goods are
similar if they pertain to the same tariff line, or if they share some precise technical feature, or
if they are perceived as similar by the consumers, etc. [Horn and Mavroidis 2008]. In the
climate change context, these problems are amplified by the fact that similarity involves not
only the good per se but also its process of production (some processes for producing a good
can be more carbon-intensive than others). This point is so important that sections 2.7 and 2.8
below come back to it.
Second, the two-way procedure allows to make a key distinction between two-way
carbon border taxes and “carbon tariffs”—a distinction which is generally ignored in the
current literature. Viewed from an import perspective, two-way border taxes subject goods
from all origins (foreign and domestic) to the carbon tax prevailing in the consumption
country. By contrast, tabled carbon tariffs would generally be imposed only on products
imported from “some” foreign countries. Hence, carbon tariffs are discriminatory in two
respects: between imports of different origins (some of them will be subjected to carbon
tariffs, not the others) and between domestic products and imports from the targeted countries
(because the level of the carbon tariff is generally unspecified). Section 3 examines carbon
tariffs in detail, and concludes that they should be banned for the good of climate change
goals.
Third, viewed from an export perspective, “two-way” border taxes require the
elimination of the domestic carbon tax imposed on exported goods by the exporting country.
This feature is often seen by the climate community as generating risks to keep “dirty” plants
operating in a country only for export purposes. This concern ignores the dynamic inter-
actions between countries’ policies. For simplicity sake, let us assume that developed country
A keeps some dirty domestic output which is exported to developing country B which is
assumed to initially impose no domestic carbon tax. Country B has then the choice between
two options. Either it may continue to impose a zero domestic carbon tax. By doing so, it
maximizes the incentives (hence size) of dirty production to stay in country A, while it creates
no incentives for its own firms B to become cleaner, hence condemning them to face the
highest carbon border tax in country A if they want to export to A. Or developing country B
may decide to impose a domestic carbon tax (probably lower than the tax imposed by country
10
A, at least initially). By doing so, it reduces the incentives (hence size) of dirty production to
stay in A while it sends signals to its own producers to become progressively cleaner, hence to
become eligible for a lower carbon border tax in country A. Interestingly, this second option
is likely to be attractive for large emerging economies (as already observed in China, India,
etc.) hence may be the dominant option.
The above discussion deserves two additional remarks. First, it suggests that the link
between carbon tax and outsourcing activities is not as strong as alleged by vested industrial
interests. Second, in an effort to capture as much revenue as possible relative to the importing
countries, developing countries may levy export taxes on their industrial raw materials. As a
notable share of such products is carbon intensive, taxing exports may have a positive impact
on climate change in this context.
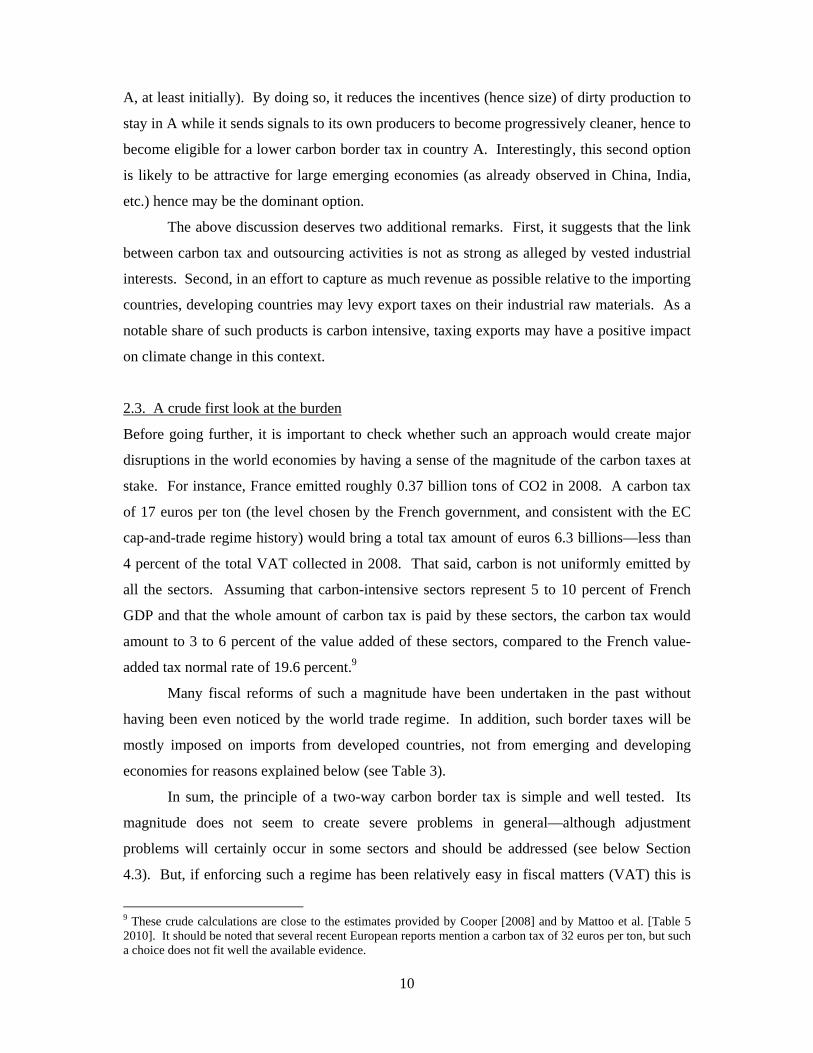
2.3. A crude first look at the burden
Before going further, it is important to check whether such an approach would create major
disruptions in the world economies by having a sense of the magnitude of the carbon taxes at
stake. For instance, France emitted roughly 0.37 billion tons of CO2 in 2008. A carbon tax
of 17 euros per ton (the level chosen by the French government, and consistent with the EC
cap-and-trade regime history) would bring a total tax amount of euros 6.3 billions—less than
4 percent of the total VAT collected in 2008. That said, carbon is not uniformly emitted by
all the sectors. Assuming that carbon-intensive sectors represent 5 to 10 percent of French
GDP and that the whole amount of carbon tax is paid by these sectors, the carbon tax would
amount to 3 to 6 percent of the value added of these sectors, compared to the French value-
added tax normal rate of 19.6 percent.9
Many fiscal reforms of such a magnitude have been undertaken in the past without
having been even noticed by the world trade regime. In addition, such border taxes will be
mostly imposed on imports from developed countries, not from emerging and developing
economies for reasons explained below (see Table 3).
In sum, the principle of a two-way carbon border tax is simple and well tested. Its
magnitude does not seem to create severe problems in general—although adjustment
problems will certainly occur in some sectors and should be addressed (see below Section
4.3). But, if enforcing such a regime has been relatively easy in fiscal matters (VAT) this is
9 These crude calculations are close to the estimates provided by Cooper [2008] and by Mattoo et al. [Table 5 2010]. It should be noted that several recent European reports mention a carbon tax of 32 euros per ton, but such a choice does not fit well the available evidence.

11
unfortunately not the case in the climate change context. What follows focuses on some key
enforcement issues.
2.4. Defining carbon border taxes in an international environment
First is the definition of carbon border taxes in an international context. In a closed economy,
carbon domestic taxes are defined in specific terms, that is, in dollars or euros per physical
unit of carbon (or any other mix of greenhouse gases). Such a definition makes a carbon tax
equivalent to a price signal, the goal sought after.
However, the huge heterogeneity among the world economies introduces
considerations requiring a more balanced way to define carbon border taxes. For instance,
poor economies tend to value climate change policies less highly than rich economies. Some
major emerging economies feel more immediately concerned by sulfur dioxide (SO2)
emissions or by water shortages (all the more because both cases raise local, not world,
problems) than by CO2 emissions. Ignoring such considerations lead to an impasse, as
recently illustrated by the Copenhagen Conference.
Table 1 shows how crucial and delicate the appropriate definition of carbon border
taxes is. It assumes that producing one widget in a developed (domestic) country would cost
$10,000 and emit 10 tons of carbon if the carbon tax is $60 per ton. Producing a similar
widget in a competitive developing (foreign) country would cost $8,500 and emit 20 tons of
carbon, the carbon tax imposed by the developing country being $6 per ton. In what follows,
expressing border taxes in ad valorem terms (that is, in percentage of the value added)
emerges as an interesting option for taking into account the world heterogeneity. Hence,
Table 1 shows the ad valorem equivalents of the various carbon taxes. Looking at each
country separately, the ad valorem equivalent of the domestic carbon tax is 6 percent in the
developed country, and 1.4 percent in the developing country.
Applying the NT rule combined with the country of destination principle requires first
that the exporting developing country eliminates the domestic carbon tax it imposes on its
exports. Hence, widgets exported by the developing country land at the border of the
importing developed country at a cost of $8,500 (row 4).
The importing country has three main possibilities for defining its carbon border tax,
as illustrated in Table 1. The first option (column “trade”) is based on the specific carbon tax
of the importing country combined with the carbon content of the exporting country. The
second option (column “specific”) is based on the specific carbon tax and carbon content of
the importing country. The third option (column “ad valorem”) is based on the ad valorem

12
equivalent of the specific carbon tax of the importing country, and this ad valorem equivalent
is applied on the price of the imported widget.
Table 1. The alternative definitions of a border tax Units Domestic Foreign
producer producer trade specific ad valorem
1. carbon tax (specific) $ per ton of carbon 60 6 60 60 ‐‐
2. carbon content tons per widget 10 20 20 10 ‐‐
3. carbon total tax per widget $ 600 120 1200 600 510
4. price per widget [a] $ 10000 8500 8500 8500 8500
5. carbon tax (ad valorem) percent 6.0 1.4 14.1 7.1 6.0
6. price per widget [b] $ 10600 8620 9700 9100 9010
Border tax definition based on
Note: [a] Excluding the relevant carbon tax. As Table 1 assumes a two-way border tax regime, the border tax imposed on the imported product is based on the price per widget excluding the exporting country’s carbon tax ($8,500). [b] Including the relevant carbon tax.
2.5. Choosing among the definitions: a first view
Developing countries are likely to perceive these three definitions very differently. First, they
will perceive the trade-based definition as very discriminatory for two reasons. First is related
to climate change. This definition requires that the products exported by developing countries
pay tons of carbon at the same price than those of the developed countries, although
developing countries could argue that their carbon emissions create climate problems because
of the stock of carbon accumulated by developed countries during the last sixty years.10 The
second reason is related to development. Developing countries will perceive the trade-based
definition as a “double penalty” to the extent that their large carbon emissions mirror their
pending development problems (dirty production process combined with low valuation of the
climate change issue for reasons related to poverty or other more pressing concerns). Their
views are reflected by the fact that the ad valorem equivalent of the carbon tax on widgets
imported from developing countries is 14 percent, compared to only 6 percent for the widgets
produced in developed countries. Of course, the sharper the erosion of the price advantage of
their exported widgets due to the imposition of the carbon border tax will be, the more vocal
developing countries will be.
By comparison, the second (specific-based) and third (ad valorem-based) definitions
look more acceptable to developing countries for two reasons. First, these two definitions are
more consistent with the NT approach than the trade-based definition since they rely on
10 In the carbon case (contrary to a normal good such as oil) there is the need to solve simultaneously the allocational (how many carbon emissions should be cut every year) and distributional (how to share the costs of these annual emissions cuts) problems.

13
parameters (carbon tax and carbon content) entirely defined by the conditions prevailing in
the importing country. Second, both definitions express climate change efforts in terms of
costs rather than of prices only—a shift aiming to introduce some equity in burden sharing.
They generate a cost increase which is more affordable than the one generated by the trade-
based definition (10 times the costs of the carbon tax in the developing country) but which is
still substantial enough (4 to 5 times the costs of the carbon tax in the developing country) to
send a strong signal to the developing countries’ producers concerned.
That said, the strong NT-consistency of these two definitions seems to create a
problem: producers from developing countries would have no incentives to cut emissions on
their own since their carbon border taxes are shaped by the conditions prevailing in the
importing country. In fact, such incentives do exist. Let us assume, for simplicity sake, that
the processes for producing widgets existing in the developed country exhibit the full range of
carbon-intensities. While Table 1 illustrates a relatively carbon-intensive process, another
production process operated in the developed country would require only five tons of carbon
per widget, hence be subject to lower specific-based and ad valorem-based domestic carbon
taxes (respectively $300 and 3 percent). Developing countries’ exporters would thus have an
incentive to invest in such a cleaner carbon-intensity process in order to be classified in the
same category than the cleaner process in the developed country, hence to benefit from the
corresponding lower carbon border taxes.
This discussion leads to a last question: do the specific-based and ad valorem-based
definitions differ? They look very similar in Table 1. However, it is easy to show that the
larger the difference between the prices of domestic and foreign widgets (row 4) is, the more
costly the specific-based definition is, compared to the ad valorem-based option.11 In short,
the specific-based definition is systematically biased against the interests of the poorest
countries since such countries tend to offer less elaborate, hence cheaper, products than the
rest of the developing countries.12
To sum up, equity and development—not trade—considerations suggest that, in the
current multilateral world characterized by high heterogeneity among countries, the best
definition of carbon border taxes is in ad valorem terms. Of course, all the above definitions
11 If the price of the widget produced by the developing country is $6,000 (all the other things being constant) the ad valorem equivalents (row 5) would be 10 percent (column specific) and 6 percent (column ad valorem). 12 Another way to deal with the poorest countries is to grant them some “special” treatment (see the conclusion of this note). The world trade regime suggests strongly that it is extremely difficult to design special treatment that has no perverse impacts on both the beneficiaries and the excluded developing countries. Moreover, special treatment does not exclude general mechanisms unbiased against the interests of the poorest countries.

14
of the carbon border tax could become acceptable to developing countries if these countries
would receive appropriate transfers (up to $1,080 per widget in the case of the trade-based
definition) from developed countries. But, negotiating such transfers for all the traded
products concerned would impose astronomical transaction costs, and it remains to be seen
whether such transfers would be politically acceptable by the public opinion of the developed
countries.
Such a conclusion may be seen as a setback for the world climate change policy since
the trade-based definition seems to generate the highest possible incentives for developing
countries’ producers to cut carbon emissions. But, paradoxically, the impact of the trade-
based definition on the world climate change is far to be certain—and the impact is what
ultimately counts. A trade-based definition may succeed to induce some producers in the
emerging countries to invest in clean plants. But, it may also induce the other producers in
the developing countries to continue to produce with dirty techniques, and to export these
products to the other developing countries. In short, because it imposes extreme constraints,
the trade-based definition has strong built-in incentives to create a dual world economy—a
clean economy around developed countries and some emerging economies’ producers, and a
dirty economy in the rest of the world. The net impact on the world climate change regime is
hard to predict. The higher the carbon border tax imposed by developed countries is, the
more likely the emergence of such a dual world economy would be, the bigger the share of
the world dirty economy would be, the more harmful for the climate change the impact would
be (developing countries are growing much faster than developed economies) and the more
durable it would be.
This remark underlines the high risks of unintended negative consequences when
adopting extreme policies. The most recent illustration of such unintended consequences is
provided by the German subsidies on photovoltaic panels, and their drastic cuts last year, due
to macroeconomic constraints. This policy has harmed German producers in two ways. First,
German subsidies were initially so lavish that they have induced German makers to produce
“too” sophisticated, hence expensive, panels—nearly 2 euro per watt [Kovalyova 2010]—
preventing the German producers to enter the Chinese mammoth market in its very early
years. Second, subsidies cuts are making the survival of German producers problematic,
while Chinese producers can enter the EC market with panels at about 1.2 euro per watt
[Kovalyova 2010].13
13 Similar self-inflicted damages abound in highly subsidized markets. In the climate change context, another archetypical case is solar energy in Spain [Rosenthal 2010].

15
2.6. Mutual support at its best: an illustration
Mattoo et al. [2009] provide calculations giving a sense of the vastly different impacts of
alternative definitions of carbon border tax. Table 2 assumes that developed countries enforce
unilaterally a climate change policy cutting their carbon emissions by 17 percent (roughly
their average current commitments). In other words, the various policy options described
below deliver exactly the same cuts of carbon emissions in the developed countries (it is
assumed that there is no climate change policy in the developing countries).
These four options are: trade-based border tax (the specific carbon tax of the
importing country is applied on the carbon content of the exporting country) on imports from
the developing countries; specific-based border tax (the specific carbon tax of the importing
country is applied on the carbon content of the importing country) on imports from the
developing countries; a “two-way” border tax which combines the imposition of a specific-
based border tax on imports from developing countries with the elimination of the carbon tax
imposed by the exporting countries on their exports; and no border tax on imports.
Table 2. Impact of alternative border tax regimes on total industrial exports, percent changes
Border tax regimes [a] U.S. EC Developing Brazil China India
countries [b]
1. BT only on imports (trade‐based) ‐10.1 ‐23.2 ‐14.8 1.9 ‐20.8 ‐16.0
2. BT only on imports (specific‐based) ‐6.5 ‐6.6 ‐3.2 ‐2.5 ‐3.4 ‐3.2
3. Two‐way BT (specific‐based) 0.0 0.5 ‐2.0 ‐0.6 ‐1.8 ‐2.1
4. No BT ‐2.3 ‐2.1 ‐0.1 1.0 ‐0.9 ‐0.3 Source: Mattoo et al. [2009]. Developed countries are assumed to reduce unilaterally their emissions by 17 percent. Notes: [a] BT: border taxes. Two-way BT: elimination of the carbon tax imposed by the exporting country combined with the imposition of the carbon tax imposed by the importing country. Trade-based and specific-based: see Table 1. [b] Low and middle income developing countries.
Table 2 provides three main results:
clearly, mutual destruction is a possibility: trade-based border taxes on imports
deteriorate massively the situation of almost all the countries, to the point to put at risk
world growth, hence the willingness and/or capacity to pursue climate change policies.
the impact of specific-based border taxes may be less dramatic, but it hurts notably
most developing countries, ensuring political international turmoil.

16
two border tax regimes have a (much) lower impact on trade: the two-way border tax
regime, and the no border tax regime.14
The choice between these two last regimes depends largely on whether developed
countries want to do what they preach, or not. If one believes what developed countries
preach, they are cutting their carbon emissions for the sake of human welfare. Their preferred
choice should then be the no border tax regime: developed countries would accept a (small)
decline of their exports because it minimizes the decline of the low and middle income
developing countries’ exports. The no border tax emerges thus as the preferable option from
the joint point of view of climate change (the targeted CO2 cut is achieved in developed
countries) trade and development: it is mutual support at its best.
However, developed countries may not do what they preach. Rather, they may follow
their narrow interests. In this case, the two-way border tax regime emerges as their preferred
solution. The consequences are still bearable for the low and middle income countries—their
trade, hence growth perspectives, is not too much reduced. Hence, it may not be too costly in
terms of international peace, and its negative effects may be small enough to be compensated
by aid from developed countries to the low and middle income countries—provided that the
public opinion of the developed countries supports such an aid policy.
2.7. More about implementation problems: mind-boggling complexity
The second most important implementation problem comes from the fact that the climate
community pays a lot of attention to the production processes. This attention is legitimate:
what counts is not so much the carbon content of an individual product, but the whole “carbon
footprint” aggregating the carbon emitted at every step of the production process of the good
in question.
If this approach makes sense in the climate change context, it means that perfectly
similar products are different if they have different carbon contents due to the use of different
production processes. Such a prospect has made the trade community very nervous because
of the sheer complexity generated by adding the dimension of production processes. In short,
it becomes critically important to strike the right balance between exhaustiveness and
simplicity.
Today, there are roughly 10,000 different tariff lines defining “products” in a typical
tariff schedule. Taking into account the various production processes capable to obtain each 14 Table 1 suggests that a two-way trade regime based on the ad valorem definition could be even less distortive than the one based on the specific definition.

17
of these products would require to define tariff lines in terms of “products times production
processes times firms”. Such a challenge is not new in the world trade regime. “Rules of
origin” which determine where a good comes from or “export processing zones” have created
very similar problems the large costs of which are well documented (equivalent to a price
increase of 12 percent in the NAFTA case [Cadot et al. 2005]). But, the climate change
context has the capacity to generate such problems to an extent unknown before. Pushed to
its extreme, it could easily negate the notion of similar products that is so essential in a world
witnessing an endless expansion of varieties of products in order to better satisfy consumers.
The literature revealing the full extent of the problems of implementing climate
change policies in an international context is relatively recent [Brenton, Edward-Jones and
Jensen 2009, Jensen 2010, Moore 2010]. Too many observers continue to stick to the naïve
solution according to which each exporter would provide the carbon footprint of its product to
the Customs of the importing country. Such a solution faces two problems. First, its logic
would require a gigantic database “products times production processes times firms”
generating astronomical transaction costs (again assuming that data would exist). Second,
costs would be compounded by the huge risks of corruption that are inevitably associated to
complexity in an international context. Such risks and costs would be (much) higher for the
emerging and developing countries, precisely those countries that should be induced—not
inhibited—to participate to a world climate change regime.
2.8. From exhaustiveness to simplicity: dealing with the “similarity” issue
The full conformity of the specific-based or ad valorem-based carbon border taxes with the
NT principle has a last crucial consequence: when calculating them, countries rely only on
domestic information that they know best. As a result, the huge risks of misinformation on
carbon footprint are reduced [Brenton, Edward-Jones and Jensen 2009, Jensen 2010, Moore
2010] but they are not completely eliminated.
The remaining delicate step in terms of information is when the importing country
“maps” the various production processes operated in exporting countries into its own
domestic processes, that is, when it assesses to which of its own production processes a
foreign process is similar. This step is made easier by the fact that developed countries (the
most eager to impose carbon taxes) are likely to have the knowledge for most of, if not all the

18
production processes (from the dirtiest to the cleanest) existing in the world and involved in
world trade.15
This “mapping” exercise should be used as an opportunity to strike the best possible
balance between exhaustiveness and simplicity in order to run a manageable system. It is
beyond the scope of this note to examine such simplification schemes in detail (for a recent
careful analysis of the legal complexities raised by product-related and non-product related
production processes, see Low et al. 2010). Only a couple of options, ideally to be combined,
are briefly described as a possible basis for a workable approach.
A first, obvious, option would be to reduce the number of products to be subjected to a
strict enforcement of a carbon (domestic and border) tax to those produced by the most
carbon-intensive sectors, that is, the ones where risks of carbon leakage may be the highest.
The key question is how long will be such a list. The EC debate shows how wide the answers
can be. At one end of the spectrum, experts suggest only a few sectors (aluminum, cement,
some chemicals, steel) based on their results showing limited carbon leakage [OECD 2006,
CE Delft 2008, Graichen et al. 2008, Hourcade et al. 2007, Kommerskollegium 2009, Monjon
and Quirion 2010]. At the other end of the spectrum, the list of sectors with an allegedly
“significant risk of carbon leakage” set up by the Commission includes no less than 164
sectors or sub-sectors [European Commission 2009]. Section 4.2 below explains the reasons
for such a huge difference, and why the list of the Commission over-estimates massively such
risks—to the point to endanger the emergence of sound climate change policies.
A second option would be to aggregate the different processes used for producing a
product into a number of clusters as small as possible, and to consider all the production
processes included in the same cluster as having the same carbon footprint, hence being
subjected to the same carbon (domestic and border) tax. Using the ad valorem-based
definition would require to calculate the ad valorem-carbon tax for each domestic cluster.16
This ad valorem carbon tax would then be applied on the imports from the rest of the world,
following the same procedures than those used today in case of VAT adjustment.
15
The dirtiest processes may disappear faster in developed countries than in developing countries. In such cases, the carbon border tax calculated which was imposed on the domestic process could still be imposed on foreign producers, although the domestic carbon tax will be no more imposed on domestic processes. It will be more difficult to find a satisfactory solution for the converse case—when firms in developing countries will adopt cleaner technologies faster than firms in developed countries. 16 The tax rate is given by the ratio between the carbon domestic tax paid (based on the carbon content of the cluster and the specific carbon tax per ton of carbon for the cluster) and the value added of the cluster in question. An elaborate description of how such clusters could be managed is provided by Barrett [2007].

19
Of course, these two options could be defined by each country independently from
what the other countries decide to do. However, it would be much better, from a climate
change and trade perspectives, that these options would be defined in a multilateral
framework, leading to the same list of core sectors and clusters, and generating disciplines
benefiting from lessons generated by WTO Agreement on sanitary and phytosanitary
measures. Such a multilateral approach makes sense all the more because similarity in a
climate change context should be based on scientific evidence.17
3. Most-Favored Nation: Prohibiting carbon tariffs
Article I of the General Agreement provides the second fundamental principle of the world
trade regime, the so-called “most-favored nation” (MFN):
a country should impose the same tariff on the imports of a given good independently
from the country of origin
any country violating this rule would be exposed to compensation or retaliation by all
the GATT Members concerned.
Contrary to the NT rule, the MFN rule does not echo immediate concerns of the climate
community. However, it would play a crucial role for protecting the climate community from
the high risks of climate change policies being captured by vested industrial interests trying to
impose discriminatory duties on some countries (but not on others).
Often, such duties are called “border taxes” in the existing literature. But, it is
essential to underline that they are radically different from the border taxes examined in the
previous section since they will be imposed exclusively on imports from countries qualified as
having “non-comparable” climate change policies or on imports from countries “that are not
part of a global agreement to cut carbon emissions” (to use the terms of the French-Italian
17 Indeed, the history of the VAT suggests forces for a convergence of rates, if not complete harmonization. When VAT were introduced several decades ago, many governments embarked on complex VAT regimes based on many VAT rates. Their intent was to favor some sectors, those they judged as strategic, while ignoring or even penalizing the other sectors. However, the following decades have witnessed a general movement of consolidating these many initial VAT rates into an increasingly smaller number of rates. Today, there is a limited number of VAT rates (the “normal” rate plus one or two (at most) reduced rates). For the few products bearing much higher indirect taxes (some alcoholic beverages, tobacco, gasoline) the indirect taxes are not VAT. For instance, the French indirect tax on the gasoline (the taxe intérieure sur les produits pétroliers, TIPP) is a consumption tax calculated in ways that have little in common with the VAT ad valorem approach. As TIPP fluctuates with the world oil price, it varied from 180 to 400 percent, compared to the normal VAT of 19.6 percent, during the last decade.

20
proposal tabled April 15, 2010 [Euractiv 2010]).18 As a result, this note uses the term of
carbon tariffs, as noted in the introduction.
Carbon tariffs have a feature which is undesirable from both a climate change and
trade perspectives: they may distort the ranking among foreign competitors in the importing
market in ways that reflect only loosely climate change concerns, but that may be costly from
the point of view of the relative efficiencies of the world economies. (In sharp contrast, the
carbon border taxes analyzed in the previous section do not modify the ranking among foreign
products since their level is independent from the country’s origin.) Carbon tariffs may make
imports from the so-called “non-comparable” countries more expensive than imports from
other countries even if the latter are only marginally less carbon-intensive than the former.
While gains in terms of carbon emissions may be small, losses in terms of efficiency may be
high. Such a possibility is likely all the more because the carbon tariffs currently proposed
clearly target emerging (relatively efficient) economies.
Carbon tariffs reflect a serious misunderstanding of basic facts in climate change and
trade. They assume that the targeted “non-conform” emerging economies are exporting
carbon-intensive products more massively than developed (“conform”) countries. Table 3
shows that a small share of the U.S. and EC imports of carbon-intensive goods come from the
emerging economies. This is largely because most exports from the emerging economies still
consist in products or activities that are not much carbon-intensive, such as clothing, shoes,
assembling parts, etc.
Table 3. EC and U.S. imports of carbon intensive products, 2007
China India China IndiaAluminum 1.5 0.3 6.1 0.5Cement 18.4 4.7 18.1 8.9Chemicals 1.5 0.6 4.9 1.8Copper 1.3 0.2 4.9 0.2Glass 6.3 0.4 25.1 0.4Paper 2.0 0.1 12.4 0.3Steel 5.8 1.4 13.8 3.4Wood pulp 0.2 0.0 0.2 0.0
EC imports from U.S. imports from
Source: Kommerskollegium [2009].
Note: The figures show the imports from China and India as a percentage of total EC and U.S. imports.
As a result, carbon tariffs are unlikely to achieve their intended goal to “convince” the
emerging economies to join a world climate change policy. The same could be said a fortiori
18 Interestingly, the supporters of the proposal say that “carbon tariffs” should respect WTO rules. Germany criticized this idea as “eco-imperialism” while popular support for such carbon tariffs does not seem to exist [Carasco 2010].

21
about the threat of carbon tariffs. The debate about such threats echoes the decades-long
discussions about the efficiency or inefficiency of Section 301 of the U.S. trade statute which
ended in its relinquishment in the mid-1990s—a de facto recognition of its failure.
Ironically, Table 3 suggests that, since trade of carbon-intensive products occur mostly
between developed countries, carbon tariffs may rather degenerate into trade conflicts
between developed countries, exacerbating the already substantial difficulties of the
developed countries to work together on a world climate change policy. Such risks are
magnified by the fact that some developed countries are much less carbon competitive than
they believe to be [Delgado 2007].
Carbon tariffs would also, almost inevitably, exacerbate the incentives for firms based
in these countries (often subsidiaries or joint-ventures of firms from developed economies) to
divert their “dirty” exports away from developed countries’ markets towards developing
countries markets. They will contribute to the “dual” world trade already evoked, with a
“clean” trade centered around the slow-growing developed economies, and a “dirty” trade
around the fast-growing emerging and developing countries. It is hard to see what would be
the gains from a world climate change perspective.
Adopting the MFN rule would make impossible such carbon tariffs. More generally,
it would reduce the risks of adopting “negative incentives” as a way to induce countries to
enforce climate change policies. By the same token, the MFN rule would induce the countries
with advanced climate change policies to look for the positive incentives which could induce
emerging economies to improve their climate change policies as quickly as possible.
4. The climate change regime: At the rescue of the world trade regime?
This section focuses on the benefits that the climate community could bring to the world trade
regime if it makes sound decisions.
4.1. Pressures for imposing trade barriers on the top of two-way carbon border taxes
Domestic carbon taxes are likely to impose substantial industrial adjustment on carbon-
intensive sectors. Vested industrial interests in developed countries will argue (they already
do) that they are at a severe disadvantage in global markets. Hence, they are likely to request
two types of trade barriers on the top of two-way border taxes. First are the carbon tariffs
examined in section 3. But, the “Most Favored Nation” principle will ban them.
The alternative type of trade barriers would be requests for protection to be lodged by
individual firms or group of firms following a conditional event allegedly “caused” by the

22
introduction of the climate change policy—such as an alleged loss in terms of output, market
share, profit or any other indicator of competitiveness.19 These “carbon conditional
measures” (CCMs) differ from carbon tariffs in several respects. They are subjected to legal
procedures (complaint, inquiry, causation determination, decision to impose a CCM or not,
review, etc.) quite different from those required for adopting carbon tariffs. They also tend to
focus on products, not on countries (as carbon tariffs do).
Calculations by Mattoo et al. [2009] give a sense of the pressures for getting CCMs.
Contrary to Table 2 which deals with all the industrial products, Table 4 focuses exclusively
on carbon-intensive products. It provides the changes in imports, exports and outputs in the
U.S. and in the EC (once again, the results reflect the fact that the U.S. and EC commitments
of cutting carbon emissions by 17 percent are fully implemented).
Table 4 shows serious effects on imports and exports, particularly in the case of trade-
based and specific-based border taxes on imports. For instance, the trade contraction created
by a trade-based border tax has a magnitude close to the trade collapse observed during the
2008-2009 Crisis.
Table 4. Impact of border tax regimes on carbon-intensive products, percent changes
Border tax regimes [a] U.S. EC U.S. EC U.S. EC
imports imports exports exports output output
1. BT only on imports (trade‐based) ‐10.1 ‐38.7 ‐15.9 ‐21.5 ‐2.5 1.8
2. BT only on imports (specific‐based) ‐4.6 ‐11.3 ‐14.1 ‐7.8 ‐3.6 ‐0.5
3. Two‐way BT (specific‐based) ‐1.1 ‐7.8 0.7 4.1 ‐0.8 1.0
4. No BT 3.5 3.1 ‐11.6 ‐5.2 ‐4.4 ‐1.9 Source: Mattoo et al. [2009]. Developed countries are assumed to reduce unilaterally their emissions by 17 percent. Notes: [a] BT: border taxes. Two way BT: elimination of the carbon tax of the exporting countries and imposition of the carbon tax of the importing countries. [b] Low and middle income developing countries.
More importantly, all the regimes show the emergence of negative outputs in the U.S.,
and, to less systematically, in the EC. This result reveals the magnitude of the pressures for
getting CCMs. The U.S. output decline may be substantial enough to induce U.S. carbon-
intensive sectors to request trade barriers on the top of two-way carbon border taxes (despite a
slight increase in exports and decline in imports). The situation may look better in the EC, but
probably not enough to induce EC carbon-intensive sectors not to follow U.S. industries’
requests, and not to argue that they also face “unfair” competition from foreign industries 19 This is not new. It already occurred during the 1970s when the U.S. steel industry tried to impose antisubsidy measures on the top of border taxes after the EC move to a VAT regime [Hufbauer and Gabyzon 1996, Ruffin 1979].

23
subjected to “laxer” climate change policies, hence that they need additional trade barriers
under the form of CCMs.
4.2. CCMs: a trap for the climate (and trade) communities
Some members of the climate community have already expressed some sympathy for CCMs.
In particular, they fear that pressures on carbon-intensive processes will induce EC-based
firms to outsource their dirty plants, generating “carbon leakage”. They see CCMs as a way
to fend off these pressures, hence to establish more rapidly and/or firmly domestic climate
change policies.
In this context, which lessons could be drawn from the trade side? The current world
trade regime has a panoply of trade instruments conditional to some kind of “unfair” events
that could be used by the vested interests in carbon-intensive sectors. GA Articles VI and
XIX allow antidumping, anti-subsidy and safeguard measures to eliminate “unfair” practices
(dumping and subsidies) or to bring relief in case of import “surges” (safeguard). Sixty years
later, an abundant literature provides the following robust evidence on the use of these
conditional trade measures:
The reasons supporting their use are deeply flawed: few believe today that selling
cheap steel bars mirrors unfair competition from developing countries or that
increased imports of t-shirts from developing countries was an “unforeseenable”
event.
Their use has been grossly diverted: such trade measures protect more the firms—
including foreign firms in markets prone to collusion and cartelization, such as
cement, glass, chemicals, or steel, that such conditional trade instruments promote and
nurture—than their workers.
In short, all these instruments have in fine been used in a purely protectionist manner, at huge
expenses to domestic tax-payers and consumers, and at the detriment of the domestic
allocation of resources and of the world trade regime.
Should these results be taken seriously by the climate community? Table 5 gives a
positive answer—sending a strong warning signal to the members of the climate community
who may be inclined to join forces with vested industrial interests. In Table 5 provides a
summary of the 164 industrial sectors and sub-sectors that the European Commission
considers to be exposed to a “significant risk of carbon leakage” (Annex A provides detail).
There is almost a perfect match between the sectors in the list and the main users of the

24
conditional trade instruments allowed by the GATT. Only a few sectors listed are considered
as carbon-intensive emitters by experts.
The “excessive” length of the Commission’s list deserves close attention since it
reveals the inability of the Commission to resist to protectionist pressures, leaving little doubt
about the ultimate capture of climate change policies by vested industrial interests if the
climate community is not vigilant.
Table 5. Industries with “significant risk of carbon leakage” (EU Commission)
Sectors Use of Sectors Use of Sectors Use of[a] contingent [b] contingent [c] contingent
protection [d] protection [d] protection [d]Aluminum D*** Ceramics Boards D***Cement D*** Chemicals D*** Expanded claySteel & iron D+C+S*** Glass D** Manganese D***
Pulp & paper D*** Man-made fibres D***Copper Nickel D*Magnesite D*** Starch D***Potassium D** Textiles D***Tyres D+S***ZincAviation [e]
Source: European Commission [2009]. Author’s list for conditional measures of protection. For the detailed list, see Annex A. Notes: [a] Industries quoted as “currently being analyzed”. [b] Industries quoted as “having provided preliminary information”. [c] Industries quoted as “having announced that they will provide information”. [d] ***: intensive petitioners of complaints. **,* : less frequent petitioners of complaints. D: antidumping complaints, C: antisubsidy complaints, S: safeguard complaints. [e] Important role of public procurement. Industries underlined are the ones generally considered as the carbon intensive sectors most prone to carbon leakage.
The drift from climate change concerns (which should be the core ones) to trade
concerns revealed by Table 5 occurred relatively recently. It mostly emerged when the EC
Directive 2003/87 was modified by the EC Directive 2009/29. These modifications included
the definition of criteria for defining sectors with significant risk of carbon leakage. The
criteria adopted defined three major groups of sectors [European Commission 2009]:
Sectors with a “particularly high” increase (more than 30 percent) of the ratio between
the costs due to carbon regulations and the gross value added. Clearly, this group
deserves attention from a climate change perspective. But, it accounts for only 2
clearly identified sectors (cement and lime) in the Commission’s list.
Sectors with a large trade intensity (above 30 percent) defined as the ratio between the
sum of imports and exports and the sum of gross value added and imports. Clearly,
this group has little to do with climate change concerns—but a lot to do with vested
interests eager to use climate change for plain protectionist purposes, or protection for

25
slowing down climate change policies. This group accounts for a huge number—117
clearly identified sectors in the Commission’s list. The fact that sectors such as
manufacture of wines, clocks, bicycles or underwear pertain to the list raises serious
questions on the way the list has been established.
Sectors with a “substantial” increase (more than 5 percent) of the ratio between the
costs due to carbon regulations and the value added, and with a low (more 10 percent)
trade intensity (defined as above). The climate change criterion is the dominant one,
but the trade threshold is so low that it is unlikely to bite seriously. This group
accounts for 11 clearly identified sectors in the Commission’s list.
4.3. The true challenge: designing appropriate adjustment measures
The climate community should thus be wise enough to reject the use of carbon conditional
measures. But, this will not be easy. CCMs will be presented as the price to pay to get a
climate change policy, exactly as conditional trade instruments (antidumping in particular)
were presented as the price to get a trade liberalization. In trade, there is now an abundant
literature showing that this rhetoric does not fit the facts. Thirty to twenty years later,
conditional trade instruments are still there, keeping the markets in question closed. It is hard
to see why things would be different in the climate change context.
That said, rejecting CCMs does not mean that no attention should be given to the
transition period during which carbon-intensive industries should restructure their activities in
order to adjust to stricter climate change policies. Rather, rejecting CCMs requires that the
climate community should make the necessary efforts to design much better adjustment
instruments than CCMs. The climate community should conceive instruments closely
targeted to the efforts to be made by the carbon-intensive sectors along the lines suggested by
recent research [OECD 2005, Richardson 2009, Banks 2010].
If the climate community succeeds in achieving such a task, it would have made a
huge service to the trade community which could then be inspired by the adjustment
instruments designed in the climate change context, hence which could adapt them to the
trade context, ultimately getting the opportunity to abandon (or at least to drastically reduce
the use of) conditional trade measures.
4.4. Managing quotas and auctions
For simplicity sake, the note has so far assumed that climate change policies would rely on
domestic carbon taxes and that such taxes would differ among countries. If the second
26
assumption seems realistic, the first assumption does not: during the recent years, developed
countries have seemed much more attracted by cap-and-trade regimes than by tax policies,
although recent developments may signal second thoughts (much) more favorable to a carbon
tax-based approach [Cooper 2008, Broder 2010].
It is beyond the scope of this note to present the pros and cons of a tax vs. a cap-and-
trade regime in the climate change context. There is a huge literature on this subject (in the
EC case, see Ellerman and al. [2010] for example). That said, it may be useful to present four
remarks related to the experience of the trade community in domestic quotas and auctions
which are the basic instruments of cap-and-trade regimes.
First, the last sixty years of trade policies have shown how it is difficult for
governments to implement quotas and auctions without being captured by key operators.
Quotas are much less transparent that it seems at a first glance, as amply illustrated by quotas,
tariff-rate quotas, and auctioned quotas implemented on a wide range of imported products,
from textile and clothing to agriculture to cars, etc. (see for instance, de Gorter and Kliauga
[2006]). Rents, not public revenues, are created. They tend to go to unintended receivers,
such as Mittal-Arcelor or Lafarge which, in 2009 again, emerge as the main beneficiaries of
the European Trading System (ETS, the EC cap-and-trade regime) by selling permits. They
also generate frauds, as indeed it already occurred in the ETS, with a euro 5 billion fraud
[Walzer 2009], that is, almost 4 percent of the cap-and-trade carbon market or 10 percent of
the estimated transfers. Finally, changing rules on quota management is very difficult
because of the opposition of entrenched vested interests. It is hard to find convincing reasons
suggesting that the same forces will not prevail in the climate change policies (all the more
because the banking sector has increasingly huge stakes in the cap-and-trade regimes).
Second, taxes may be more difficult to impose initially because they are unpopular and
visible. But, the principle of equality of the citizens in tax matters makes politically more
difficult to exclude large sectors from the coverage of a tax regime that it is the case with a
cap-and-trade regime. In a remarkable recent ruling, the highest French Supreme Court
rejected a government’s proposal for a carbon tax on the ground that it was excluding large
chunks of industrial sectors [Kanter 2009]. In fact, it must be mentioned that the EC chose a
cap-and-trade regime “by default”. Until 1997, the preferred instrument were carbon taxes
(already implemented in Britain and Denmark). The negotiations of the Kyoto Protocol, the
change of mind among European leaders in climate change policies (Britain and Denmark)

27
the perspective of privately profitable markets, the desire to have one European system at any
cost contributed to shift to a cap-and-trade regime in Europe.20
Third, so far domestic cap-and-trade regimes have been conceived without a reference
to a multilateral regime, hence without paying attention to the issue of carbon border taxes.
The few papers on designing carbon border taxes in the context of national cap-and-trade
regimes suggest that such a design is far to be simple [Monjon and Quirion 2010]. For
instance, taxes are not necessarily the best instrument to be used, and the intrinsic logic of a
cap-and-trade regime would rather suggest that it may be preferable to surrender allowances
(import side) or to get rebates on the amount of allowances (export side). This approach
raises endless legal issues from a trade perspective. If one sticks to the use of taxes, the
instrument which is the closest to a border tax under a cap-and-trade regime is a “variable
levy”, an instrument much used by the EC Common Agricultural Policy, or by the “price
band” system based on reference prices in agriculture adopted by Chile. The EC levies had to
be calculated every day, at a high cost for European consumers, but also for European and
world producers.
Last, but not least, the longest serving large cap-and-trade regime (the ETS) has not
yet been able to provide stable carbon prices (indeed, providing stable prices is not necessarily
the first virtue of markets). The price of carbon allowances in the ETS has ranged from
almost 0 euro (2006) to 30 euros per ton (mid-2008) to 10-15 euros per ton (2009) [Kanter
2010].
All these aspects make members of the trade community wary on cap-and-trade
regimes. It is fair to add that the trade community has reasons due to its own logic [Pauwelyn
2007]. In addition, if the GA rules on border taxes are manageable in case of carbon taxes,
they are open to legal interpretation in case of cap-and-trade regimes (especially in case of
free allowances). A Code approach, as suggested by Hufbauer et al. [2009], may solve these
legal hurdles, but at a cost hard to predict in case of large-scale caps-and-trade regimes.
Concluding remarks
There is no doubt that trade and climate change policies could be mutually destructive. But,
this note underlines the strong reasons for which they can be mutually supportive: a common
20 In the EC, a border tax system could be more flexible than a cap-and-trade, hence could fit better a much more heterogeneous EC with 27 Member States than the current arrangements required to accommodate the poorer Member States in a cap-and-trade context. This observation echoes the lack of negative impact of different VAT rates by EC Member States on the deepening of the Common Market in the 1960s and 1970s.

28
problem, common foes and common friends. Mutual support would be much stronger if the
world regimes for these two policies follow a few common principles (National Treatment
and Most-Favored Nation) and disciplines (adjustment policies, not conditional trade policies)
beneficial for both of them. In other words, the climate community should feel at ease within
the broad WTO principles. If it insists in having its own treaty, it should make sure to build it
on the same basic principles.21 Meanwhile, the trade community should grasp the opportunity
to benefit from the improved disciplines that the climate community could design when trying
to avoid the systemic failures of the trade regime.
This key conclusion should cast the many pending problems in a (hopefully much)
more positive perspective. The most pressing of these problems from our perspective
(production processes, carbon tariffs) have been examined above. But the note has left aside
many other important reasons advocating mutual support which should deserve full attention.
Hufbauer et al. [2009] and Hufbauer and Kim [2010] provide the most complete list of these
issues and, more importantly, they offer a wide range of potential solutions. As a result, what
follows lists only a few of them, ranked by order of increasing importance from our point of
view.
First are common negotiating techniques, a point emphasized by Antholis [2009]. The
climate community has already begun to negotiate on a “plurilateral” basis (a core of key
large countries with a few more countries representing well defined groups of small countries)
that the trade community would be well advised to adopt for concluding the Doha Round.
The second reason is the treatment of the developing and least developed countries,
also mentioned by Antholis. The trade regime allows a “special and differentiated treatment”
(SDT) for such countries. But, SDT can be best described as a trap for developing countries:
it is not generous when truly needed, and it is generally designed in such terms that it
generates perverse impacts (if any) on both the alleged beneficiaries and the developing
countries excluded from its scope. The climate change diplomacy has come up with a
concept that echoes SDT—the “common but differentiated responsibility” notion. In this
respect, it would be crucial that the climate community does not duplicate the mistakes done
by the world trade regime, and realizes that the full enforcement of the above principles takes
care of this notion [Hoekman et al. 2010].
21 Since the seminal work by Esty [1994, 1996], there is a debate on whether one would need a separate world climate and trade regimes, or not. Recently, the focus of this debate has shifted to the content of the two regimes, their legal and economic compatibility, and the broad political (“governance”) environment.

29
Third, the note is based on the implicit assumption of perfect forecasts in climate
change matters. But, available forecasts on more frequent and severe droughts in the coming
20 to 50 years diverge widely depending on the model used. An efficient way to address the
problems of increased scarcity of water, and of its unequal distribution in the world is more
trade between water-rich and/or water-efficient countries and the other countries—meaning
the opening of their agricultural sectors (which use 70 to 80 percent of the water resources) by
the developed countries. In short, freer trade emerges as the cheapest source of insurance
against unexpected shocks in climate change.
References
Antholis, W. 2009. Five “Gs”: Lessons from world trade for governing global climate change. In Bairnard, L. and I. Sorkin, editors. Climate change, trade and competitiveness: Is a collision inevitable. Brookings Trade Forum 2008/2009. The Brookings Institution. Banks, Gary, 2010. Gaining from trade liberalization : reflections on Australia’s experience, in An economy-wide view : Speeches on structural reform. Productivity Commission. Australian Government. Barrett, S. 2007. Barrett proposal: A multitrack climate treaty system. Policy brief. September 5. The Harvard Project on International Climate Agreements, Harvard Kennedy School. Brenton, P., G. Edwards-Jones and M.F. Jensen, 2009. Carbon labelling and low income country exports: A review of the development issues. Development Policy review. Overseas Development Institute, Vol. 27(3), pp. 243-267. Broder, J. 2010. Death of climate change idea. International Herald Tribune. March 25, 2010. Cadot, O., C. Carrère, J. de Melo and A. Portugal-Pérez. 2005. Market access and welfare under free trade agreements textiles under NAFTA. World Bank Economic Review. Vol.19, #3, pp. 379-405. Carasco, A. 2010. L’idée d’une taxe écologique aux frontières ne séduit guère. Le Monde. 25 Mars 2010. Charnovitz, S., 2003. Trade and climate: potential conflicts and synergies. Working draft. Pew Center on Global Climate Change. Washington, DC. CE Delft, 2008. Impact on competitiveness from EU Emissions Trading Scheme: An analysis of the Dutch industry. Delft, June. Cooper, R. 2008. The case for charges on greenhouse gas emissions. October, Discussion Paper 2008-10, The Harvard Project on International Climate Agreements, Harvard Kennedy School. Delgado, J. 2007. Why Europe is not carbon competitive. Policy brief 2007/05. Bruegel. Brussels. Ellerman, A.D., F.J. Convery and C. de Perthuis, 2010. Pricing carbon, The European Emissions Trading Scheme. Cambridge University Press. Cambridge, UK.

30
Esty, Daniel C. 1996 Greening World Trade, in the World Trading System: Challenges head (ed. Jeffrey Schott), Washington: Institute for International Economics Esty, Daniel C. 1994. Greening the GATT: Trade, Environment and the Future. Washington: Institute for International Economics. European Commission, 2009. Decision of determining, pursuant to Directive 2003/87/EC of the European Parliament and of the Council, a list of sectors and subsectors which are deemed to be exposed to a significant risk of carbon leakage. Website europa.eu. de Gorter, H. and E. Kliauga, 2006. Reducing tariffs versus expanding tariff rate quotas. In K. Anderson and W. Martin, Editors. Agricultural trade reforms and the Doha Development Agenda. World Bank. Washington, DC. Graichen, V., K. Schumacher, F.C. Matthes, L. Mohr, V. Duscha, J. Schleich and J. Diekman, 2008. Impacts of the EU Emissions Trading Scheme on the industrial competitiveness in Germany. Unweltbundesamt Research report 3707-41-501. Hoekman, B., W. Martin and A. Mattoo, 2010. Conclude Doha: It matters!” Policy research working paper 5135, World Bank. Washington, DC. Horn, H. and P. Mavroidis, 2008. The permissible reach of national environmental policies. Mimeo 24 May 2008. ENWINED project. Horn, H. and P. Mavroidis, 2010. Border Carbon Adjustments and the WTO. Mimeo. CEPR, London. Hourcade, J.C., D. Demailly, K. Neuhoff and M. Sato, 2008. Differentiation and dynamics of EU ETS industrial competitiveness impact. Climate Strategies, available at http://www.climate-strategies.org Houser, T., R. Bradley, B. Childs, J. Werksman and R. Heilmayr, 2008. Leveling the carbon playing field. Peterson Institute for International Economics and World Resources Institute. Washington, DC. Hufbauer, G.C. and C. Gabyzon, 1996. Fundamental tax reform and border tax adjustments. Peterson Institute for International Economics. Washington, DC. Hufbauer, G.C., Charnovitz, S. and J. Kim, 2009. Global warming and the world trading system. Peterson Institute for International Economics. Washington, DC. Hufbauer, G.C. and J. Kim, 2010. Climate change and trade: Searching for ways to avoid a train wreck. Second Conference on climate change, trade and competitiveness, The Graduate Institute Geneva, Center for Trade and Economic Integration. Jensen, M.F., 2009. Leveling or mining the playing field? Implementation problems of carbon-motivated adjustment taxes. Mimeo, November. Global Trade and Finance Architecture (GTFA), World Bank-DFID. Kanter, J. 2009. Council in France blocks a carbon tax as weak on polluters. Green Inc. Available on http://greeninc.blogs.nytimes.com Kanter, J. 2010. Moments of truth for CO2 permits. International Herald Tribune. April 1, 2010. Kovallyova, S. 2010. Subsidy cuts in Europe to help China. International Herald Tribune. February 16, 2010.

31
Kommerskollegium (Swedish National Board of Trade), 2009. Climate measures and trade: legal and economic aspects of border carbon adjustment. Stockholm, Sweden. Lockwood, B. and J. Whalley, 2008. Climate change-related border tax adjustments. Mimeo. University of Warwick and University of Western Ontario/CIGI/NBER/CESifo. Low, P., G. Marceau and J. Reinaud, 2010. The interface between the trade and climate change regimes: Scoping the issue. Second Conference on climate change, trade and competitiveness, The Graduate Institute Geneva, Center for Trade and Economic Integration. Martin, W. and P. Messerlin, 2007. Why is it so difficult? Trade liberalization under the Doha Agenda. Oxford Review of Economic Policy, Vol 23(3), pp. 347-366. Mattoo, A., A. Subramanian, D. van der Mensbrugghe and J. He., 2010. Reconciling climate change and trade policy. Working paper #09-15. Peterson Institute for International Economics. Washington, DC. Monjon, S. and P. Quirion, 2010. How to design a border adjustment for the EU Emissions Trading Scheme. CIRED-CNRS. Energy Policy, forthcoming. Moore, Michael O., 2010. Implementing carbon tariffs: A fool’s errand? Mimeo. April. Department of Economics and Elliot School, Institute for International Economic policy, George Washington University. Washington, DC. OECD, 2005. Trade and structural adjustment: Embracing globalisation. OECD, Paris. OECD, 2006. The political economy of environmentally related taxes. OECD, Paris. Ostrom, E. 2009. A polycentric approach for coping with climate change, Policy Research Working Paper WPS5095, The World Bank. Pauwelyn, J. 2007. U.S. federal climate policy and competitiveness concerns: The limits and options of international trade law. Nicholas Institute for Environmental Policy Solutions. Duke University. Richardson, J.D., 2009. Notes on American adjustment policies for global-integration pressures. In B. Hoekman and G. Porto. Adjustment costs and impact on trade. Forthcoming. World Bank. Ruffin, R., 1979. Border tax adjustments and countervailing duties. Weltwirschaftliches Archiv, Heft 115-2, pp. 351-355. Schaus, M. and A. Lendle. 2010. The EU’s renewable energy Directive: Consistent with the GATT-WTO TBT rules? Trade Law Clinic. Mimeo. Hautes Etudes Internationales, Geneva. Tumlir, J. International Economic Order and Democratic Constitutionalism, Ordo, vol. 34, 1983, Walzer, R.P. 2009. Europol: $7.4 billion lost from carbon trading fraud in Europe. Green Inc. Available on http://greeninc.blogs.nytimes.com World Trade Organization (WTO). 2007. Trade and environment at the WTO. WTO, Geneva. World Bank. 2005. Global Economic Prospects 2005: Trade, regionalism and development. World Bank, Washington, DC.

32
Annex A. The NACE list of industries with a “significant risk of carbon leakage”
The NACE codes have been selected on the basis of the quantitative criteria set out in Article 10a (13) of Directive 2003/87/EC. The legal basis for their selection is:
Column 1: codes based on paragraphs 15 and 16, at NACE-4 level. Column 2: codes based on paragraph 15, at NACE-4 level. Column 3: codes based on paragraph 16, point a, at NACE-4 level. Column 4: codes based on paragraph 16, point b, at NACE-4 level. Column 5: codes based on paragraphs 15 and 16, at NACE-5 and beyond level. Column 6: codes based on paragraphs 17, at NACE-4 level.
Letter T means that the code is considered as having a significant risk in its entirety.
The above text mentions four sub-sectors (NACE-5 digit and beyond): wines (1593) watches and clocks (3350) bicycles (3542) and underwear (1823). The total number of NACE sectors at the 4-digit level is 124. Code Description of NACE-4 sectors 1 2 3 4 5 6 All codes
covered01.1 Growing of crops; market gardening; horticulture01.2 Farming of animals01.3 Growing of crops combined with farming of animals (mixed farming)01.4 Agricultural and animal husbandry service activities, except veterinary activities; landscape gardening01.5 Hunting, trapping and game propagation, including related service activities02.0 Forestry, logging and related service activities05.0 Fishing, fish farming and related service activities10.1 Mining and agglomeration of hard coal T 110.2 Mining and agglomeration of lignite10.3 Extraction and agglomeration of peat11.1 Extraction of crude petroleum and natural gas T 111.2 Service activities incidental to oil and gas extraction, excluding surveying12.0 Mining of uranium and thorium ores13.1 Mining of iron ores T 113.2 Mining of non-ferrous metal ores, except uranium and thorium ores T 114.1 Quarrying of stone 1411 114.2 Quarrying of sand and clay 1422 114.3 Mining of chemical and fertilizer minerals T 114.4 Production of salt14.5 Other mining and quarrying n.e.c. T 115.1 Production, processing and preserving of meat and meat products15.2 Processing and preserving of fish and fish products T 115.3 Processing and preserving of fruit and vegetables 15331427 115.4 Manufacture of vegetable and animal oils and fats 1541 115.5 Manufacture of dairy products 155120-53-54 115.6 Manufacture of grain mill products, starches and starch products 1562 115.7 Manufacture of prepared animal feeds15.8 Manufacture of other food products 1583 15891333 215.9 Manufacture of beverages 1597 1592-95 1591-93 316.0 Manufacture of tobacco products17.1 Preparation and spinning of textile fibres 1711 1712-13-14-15-16-17 217.2 Textile weaving 1721-22-23-24-25 117.3 Finishing of textiles T 117.4 Manufacture of made-up textile articles, except apparel T 117.5 Manufacture of other textiles 1751-52-53-54 117.6 Manufacture of knitted and crocheted fabrics T 117.7 Manufacture of knitted and crocheted articles 1771-72 118.1 Manufacture of leather clothes T 118.2 Manufacture of other wearing apparel and accessories 1821-22-23-24 118.3 Dressing and dyeing of fur; manufacture of articles of fur T 119.1 Tanning and dressing of leather T 119.2 Manufacture of luggage, handbags and the like, saddlery and harness T 119.3 Manufacture of footwear T 120.1 Sawmilling and planing of wood; impregnation of wood T 120.2 Manufacture of veneer sheets; manufacture of plywood, laminboard, particle board, fibre board and other panels T 120.3 Manufacture of builders' carpentry and joinery20.4 Manufacture of wooden containers20.5 Manufacture of other products of wood; manufacture of articles of cork, straw and plaiting materials 2052 121.1 Manufacture of pulp, paper and paperboard 2112 2111 221.2 Manufacture of articles of paper and paperboard 2124 122.1 Publishing 2215 122.2 Printing and service activities related to printing22.3 Reproduction of recorded media

33
Annex A (cont’d) Code Description of NACE-4 sectors 1 2 3 4 5 6 All codes
covered23.1 Manufacture of coke oven products T 123.2 Manufacture of refined petroleum products T 123.3 Processing of nuclear fuel T 124.1 Manufacture of basic chemicals 2413-14-15-17 2412 24111150-60-70 2416 424.2 Manufacture of pesticides and other agro-chemical products T 124.3 Manufacture of paints, varnishes and similar coatings, printing ink and mastics 243021 124.4 Manufacture of pharmaceuticals, medicinal chemicals and botanical products 2441-42 124.5 Manufacture of soap and detergents, cleaning and polishing preparations, perfumes and toilet preparations 2452 124.6 Manufacture of other chemical products 2463-64-65-66 24621030 224.7 Manufacture of man-made fibres 2470 125.1 Manufacture of rubber products 2511 125.2 Manufacture of plastic products26.1 Manufacture of glass and glass products 2611-13 2615 261411 326.2 Manufacture of non-refractory ceramic goods other than for construction purposes; manufacture of refractory ce 2622-22-23-24-25-26 126.3 Manufacture of ceramic tiles and flags T 126.4 Manufacture of bricks, tiles and construction products, in baked clay26.5 Manufacture of cement, lime and plaster 2651-52 126.6 Manufacture of articles of concrete, plaster and cement26.7 Cutting, shaping and finishing of ornamental and building stone26.8 Manufacture of other non-metallic mineral products 2681 26821400-1620 227.1 Manufacture of basic iron and steel and of ferro-alloys T 127.2 Manufacture of tubes 2721 2722 227.3 Other first processing of iron and steel 2731 127.4 Manufacture of basic precious and non-ferrous metals 2742-44-45 2743 2741 327.5 Casting of metals 2751-53 128.1 Manufacture of structural metal products28.2 Manufacture of tanks, reservoirs and containers of metal; manufacture of central heating radiators and boilers28.3 Manufacture of steam generators, except central heating hot water boilers28.4 Forging, pressing, stamping and roll forming of metal; powder metallurgy28.5 Treatment and coating of metals; general mechanical engineering28.6 Manufacture of cutlery, tools and general hardware 2861-62 128.7 Manufacture of other fabricated metal products 2874-75 129.1 Manufacture of machinery for the production and use of mechanical power, except aircraft, vehicle and cycle e 2911-12-13-14 129.2 Manufacture of other general purpose machinery 2921-23-24 129.3 Manufacture of agricultural and forestry machinery 2931 2932 229.4 Manufacture of machine tools 2941-42-43 129.5 Manufacture of other special purpose machinery 2951-52-53-54-55-56 129.6 Manufacture of weapons and ammunition T 129.7 Manufacture of domestic appliances n.e.c. 2971 130.0 Manufacture of office machinery and computers 3001-02 131.1 Manufacture of electric motors, generators and transformers T 131.2 Manufacture of electricity distribution and control apparatus T 131.3 Manufacture of insulated wire and cable T 131.4 Manufacture of accumulators, primary cells and primary batteries T 131.5 Manufacture of lighting equipment and electric lamps T 131.6 Manufacture of electrical equipment n.e.c. 3162 132.1 Manufacture of electronic valves and tubes and other electronic components T 132.2 Manufacture of television and radio transmitters and apparatus for line telephony and line telegraphy T 132.3 Manufacture of television and radio receivers, sound or video recording or reproducing apparatus and associate T 133.1 Manufacture of medical and surgical equipment and orthopaedic appliances T 133.2 Manufacture of instruments and appliances for measuring, checking, testing, navigating and other purposes, e T 133.3 Manufacture of industrial process control equipment33.4 Manufacture of optical instruments and photographic equipment T 133.5 Manufacture of watches and clocks T 134.1 Manufacture of motor vehicles34.2 Manufacture of bodies (coachwork) for motor vehicles; manufacture of trailers and semi-trailers34.3 Manufacture of parts and accessories for motor vehicles and their engines35.1 Building and repairing of ships and boats 3511-12 135.2 Manufacture of railway and tramway locomotives and rolling stock35.3 Manufacture of aircraft and spacecraft T 135.4 Manufacture of motorcycles and bicycles 3541-42-43 135.5 Manufacture of other transport equipment n.e.c. T 136.1 Manufacture of furniture36.2 Manufacture of jewellery and related articles 3621-22 136.3 Manufacture of musical instruments T 136.4 Manufacture of sports goods T 136.5 Manufacture of games and toys T 136.6 Miscellaneous manufacturing n.e.c. 3661-62-63 137.1 Recycling of metal waste and scrap37.2 Recycling of non-metal waste and scrap
All NACE sectors and sub-sectors: shares of the various criteria used (%) 13.5 11.2 2.2 79.8 10.1 5.6 100.0