Climate Change and Energy, Industry ( incl. mining / quarrying, manufacturing)
18
Climate Change and Energy, Industry ( incl. mining / quarrying, manufacturing) James Renwick NIWA [email protected]
-
Upload
clinton-galloway -
Category
Documents
-
view
27 -
download
0
description
Climate Change and Energy, Industry ( incl. mining / quarrying, manufacturing). James Renwick NIWA [email protected]. A huge canvas…. Physical climate change Warming, precipitation changes, winds Natural interannual-decadal variability May accelerate or retard long-term trends - PowerPoint PPT Presentation
Transcript of Climate Change and Energy, Industry ( incl. mining / quarrying, manufacturing)

Climate Change and Energy, Industry( incl. mining / quarrying, manufacturing)
James RenwickNIWA
A huge canvas…• Physical climate change
– Warming, precipitation changes, winds– Natural interannual-decadal variability
• May accelerate or retard long-term trends
• Effects in New Zealand on– Temperature, rainfall, winds, snow storage, seasonality
• Energy effects– Storage and generation capacity– Demand: heating, cooling, irrigation, industry– Transmission– RISK
• Political/social pressures– Resource scarcity – peak oil?– Migration– Technological change… ????

Planning for climate changePlanning now for human-induced climate change becomes more important towards the right
(R. Jones CSIRO, from “Climate Change in S Australia”, 2002)
• Longevity of infrastructure– vulnerability
• Planning needed now– Diversification
– Risk management
• Barriers– Large investment, inertia
– Social acceptance

Climate Variability & Change
• Variability– Dominates hydro storage, modulates demand– Large effects on seasonal & annual precipitation– Extended periods of low storage
• Change– More reliable precipitation & wind resources– Changed seasonality of flows & snow pack– Changed demand patterns, & seasonality of demand
• Energy efficiency, DG, insulation etc
• Security/risk profile changes dynamically– Knowledge of the recent past a poor guide to the
future?

Variability: River flows
• Changes in mean levels– Impacts on national hydro storage– Recent years a poor guide to future risks
200
400
600
800
1000
1945 1950 1955 1960 1965 1970 1975 1980 1985 1990 1995 2000 2005 2010
Ann
ual m
ean
flow
(m3/s
)
Mean = 536 m3/s
Mean = 614 m3/s
Mean = 535 m3/s
Clutha River at Balclutha, 1947-2007 (1 Oct – 30 Sept)(data courtesy Contact Energy Ltd)
IPOInterdecadal
El Niño etcInterannual

Low carbon future
• New Zealand carbon-neutral– 100% renewable electricity– Strongly reduced GHG emissions from energy sector
• Large increase in wind generation– Tidal, wave?
• Distributed generation– Wind and solar
• Electric vehicle technology• Political & economic issues
– Focus on local production– Reduced international trade, travel– A relatively stable world?

High carbon future• “Exploitation” mentality – business as usual
– In short, the world is not on course to achieve a sustainable energy future (IPCC AR4 WGIII)
• Strong mining sector, export of coal– Increased local thermal production– Continued high GHG emissions from energy sector
• Development of renewables– More wind, further hydro?– Significant thermal backup
• Political & economic issues– Global trade & exporting
• Global changes, loss of production• Economic instability?
– Migration pressures, conflict, instability
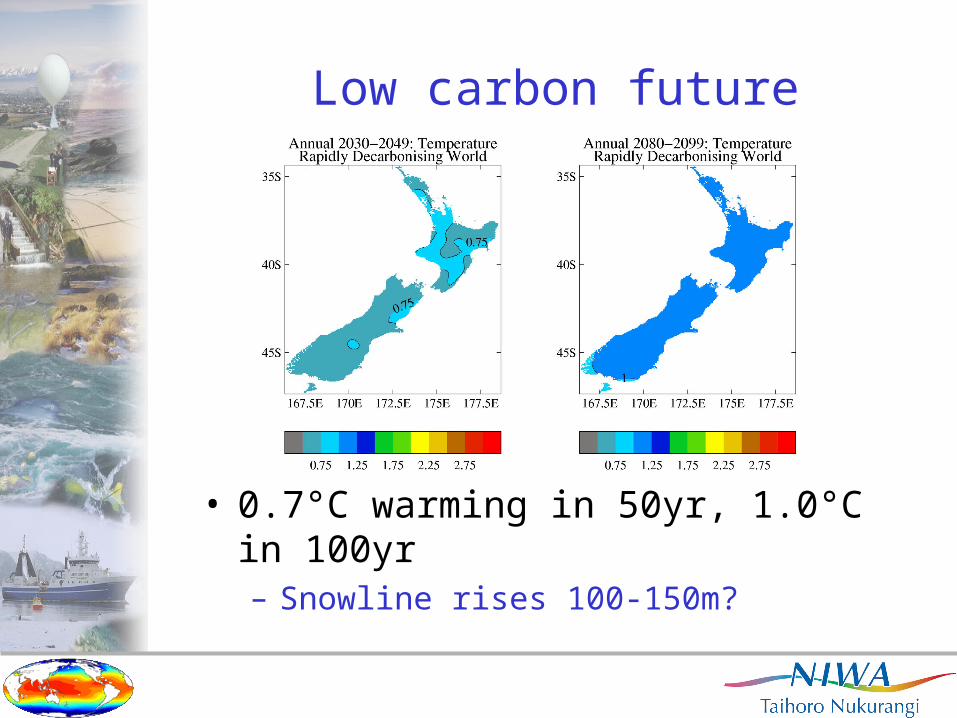
Low carbon future
• 0.7°C warming in 50yr, 1.0°C in 100yr– Snowline rises 100-150m?

Low carbon future
• 10% more alpine precipitation in 50yr– Analogous to IPO phase change
• 15+% in 100yr• 5% windier in winter/spring?

Changes in max snow accumulation
• Percentage difference for 2040s and 2090s, for “mid-carbon” future– 20% reduction by 2090s, for low-carbon future

Low carbon future• Some reduction of seasonality of flows
– Snow pack reduced 10-20%?
• Natural variability (IPO, ENSO) dominates through mid-century
• Moderate reduction in winter demand– Significant decrease in cold nights
• Moderate increase in summer demand– More cooling, irrigation demand
• Need for careful management of hydro capacity– 50% increase in peak flood volumes by 2090?
• Large increase in wind, plus DG/solar/etc

High carbon future
• 0.9°C warming in 50yr, 2.5°C in 100yr– Snowline rises 150-350m?– 30-50% reduction in max snowpack by 2090?

High carbon future
• 10% more alpine precipitation in 50yr– Analogous to IPO phase change
• 30% in 100yr – very significant• 10% windier in winter/spring?

High carbon future• Significant reduction of seasonality of flows
– Snow pack reduced 30-50%?
• Significant reduction in winter demand– No frosts in population centres by 2090’s
• Significant increase in summer demand– Much more cooling, irrigation demand
• Managing hydro capacity a serious issue– Peak flood volumes double through the century– Flood return intervals more than halve?
• Large increase in wind (?), some DG/solar/etc• Large increase in thermal generation• Transmission – heat sagging, line losses• Windiness damage to lines/infrastructure?

Summary (1)• Warming
– Changing demand patterns, effects on transmission
• Rainfall changes– Wetter in alpine regions– Heavier rain, when it falls – water management
– Water stress in eastern regions, competition for resource
• Stronger westerly winds, especially in winter– Better for wind generation, risk of more wind-related damage
• Snow storage changes– Rising snowline: less at lower levels, more on the tops?– Reduced seasonal cycle of accumulation & melt
• Demand– Less winter heating, more summer cooling– Irrigation demand in eastern regions

Summary (2)
• Climate variability will continue– Decadal variability a key for planning– Climate change will increase in importance
• Rate dependent on emissions scenario
• Need to understand changing risks– System modelling a key (climate+energy)
• Political, social, technological changes– Commitment to carbon neutrality– Public pressure– New technology (renewables, cleaner thermal, …)– International trade, politics


Aside: Downscaling Climate Change
• Dynamical downscaling– Regional detail from a high-res physical model– More detail, and better for extremes– Combining with enhanced statistical modelling