Climate adaptation economics · short-term strategic decision making under conditions of long-term...
63
1 Stockholm Environment Institute, Oxford, 29 Grove Street, Unit 2 Oxford, UK OX2 7JT 2 Future Water Costerweg 1G, 6702 AA Wageningen, The Netherlands Climate adaptation economics Kenya water sector Jillian Dyszynski 1 , Peter Droogers 2 , Ruth Butterfield 1 Stockholm Environment Institute 2009
Transcript of Climate adaptation economics · short-term strategic decision making under conditions of long-term...

1 Stockholm Environment Institute, Oxford, 29 Grove Street, Unit 2 Oxford, UK OX2 7JT 2Future Water Costerweg 1G, 6702 AA Wageningen, The Netherlands
Climate adaptation economics Kenya water sector
Jillian Dyszynski1, Peter Droogers2, Ruth Butterfield1
Stockholm Environment Institute
2009

2
Table of Contents
Introduction 3
Conceptual framing and attribution issues 3
Deep uncertainty for water sector planning 4
Adaptation economics methods 6 Investment and Financial Flows (I&FF) 6 Adaptation Signatures 8 Integrated water modeling case study (WEAP, Tana River Basin) 10
Background: Economic importance of water resources 11 Estimated resource endowment 11 Kenya’s water-driven economy 13 Costs of current climate variability and resource degradation 16 Future demand 17 Development planning horizons 19
Preliminary I&FF analysis 22 Sectoral scope 22 Historical I&FF data 23 Baseline scenario 23 Defining an adaptation scenario 26 I&FF for adaptation scenario 28 Comparison with global estimates 29 Policy implications and recommendations 30
Adaptation signatures 31 Background of Tana River Basin 32 Adaptation signature: Tana River Basin 33
WEAP model case study 34 Setting up model 34 Calibration and validation of model 36
WEAP model projections and Scenarios 40 Framing 40 Climate change scenarios 40 Socio/economic scenarios 43 Adaptation strategies 43
WEAP Tana Results 45 Introduction 45 Impact of Climate Change 45 Adaptation cost estimates 49 Performance of adaptation options 49
Case study conclusions and recommendations 52
WEAP results in current planning context 53
National scaling 54

3
Study conclusions and recommendations 56 Synthesizing multiple lines of evidence 56 Management challenges 57
Conclusions: 58
Recommendations: 59
References: 61
Introduction Effective water resources management is a pillar of sustainable development and coping with climatic risks. Systemic reliance across key market and non-market sectors underscores the economic importance of safe and reliable water supplies. Highly uncertain regional manifestations of human-induced climate change require robust measures to achieve climate resilient development goals. The following study explores three methods for assessing climate change adaptation costs in the Kenyan water sector. Methods include an partial investment flows and financial flows (IF&FF, UNDP) analysis, adaptation signatures (SEI) and an illustrative basin-level case study for costing integrated adaptation strategies (WEAP, SEI). Results of the methods were compared, along with highly aggregated macroeconomic estimates. Together these comprise multiple evidence lines for assessing indicative costs of climate adaptation in Kenya’s water sector.
Conceptual framing and attribution issues The attribution of anthropogenic climate forcing to present and future impacts at the national or sub-national level is a highly uncertain science. Apart from impacts related to sea level rise and temperature changes (e.g. average, diurnal), probabilistic predictions of altered precipitation and seasonal regimes are beyond the capacity of current global climate models (GCMs). While model projections based on reference emissions scenarios remain the primary source of information about future climates, their outputs can be misleading in current contexts dominated by natural climate variability and management regimes. Extreme uncertainty associated with model-based impact approaches to adaptation planning calls for an alternative conceptual framework. One such framework is focused around actual and intended development pathways, and exposure, sensitivity and adaptive capacity to current climate risks. Hence, the starting point for this framework is current development and adaptation needs, rather than vulnerability assessments based on projected impacts. Identified adaptation strategies ideally perform to “good enough” standards across a range of scenario futures, resulting in few or no-regrets that do not limit future management options and offer development co-benefits.

4
However, the challenge of attribution remains prominent among methodologies used to cost robust strategies. Figure 1 illustrates the substantial “grey area” in which present and projected future development and adaptation financing needs overlap. The complexity of these overlaps demonstrates a need for process-based rather than optimization approaches to adaptation, with emphasis on adaptive management systems, learning by doing and knowledge sharing. In this regard, the significance of institutional capacity and possibly transformation is evident as climate change impacts manifest over time and development investments become sources of adaptation benefits or liabilities. At present, the latter distinctions are extremely tenuous and unreliable for shaping current planning horizons. Therefore, increasing adaptive capacity within present development and climate adaptation contexts appears to be the most robust conceptual framework for strategic adaptation investment decisions. Figure 1: Schematic of present and future development and climate adaptation investment needs, and resulting “grey area” of overlaps across interventions.
Deep uncertainty for water sector planning At the global level, uncertain socio-economic development pathways and climate system responses to related forcing makes attribution and planning for future climate change extremely difficult. In the Kenyan context, this is compounded by other deeply uncertain biophysical and socioeconomic parameters (Table 1).
Table 1: Uncertain parameters Biophysical:
Climate variability and change Natural water resource fluctuations Current resource endowment Ecosystem demand
Socioeconomic:

5
Population growth and geographic distribution
Sectoral demand and end use efficiency
Global market forces Future supply development Waste collection, disposal, and
treatment development
For example, the substantial uncertainty in projected precipitation anomalies against present averages for the period of 2045-2065 is illustrated in Figure 2 for indicative stations in Kenya’s five main catchment basins.
Figure 2. Projected changes in monthly precipitation anomalies across 9 GCM models for the period of 2045-2065, statistically downscaled to Nairobi, Meru, Wajir, Lodwar and Kisumu stations within Kenya’s five catchment basins. Climate Change Explorer (CCE) tool, Climate Systems Analysis Group and SEI, 2009. Furthermore, a history of poor resource management in the Kenyan water sector has led to deficits in present knowledge and capacity that exacerbate future uncertainty. A lack of comprehensive resource accounting, monitoring, and regulation has resulted in excessive demand, frequent supply shortages and unaccounted for supply losses that are 50% or greater in many urban and rural piped water distribution systems (NWDR, 2006).

6
Deep uncertainty surrounding the present and future values and interaction of these and other variables creates a challenge for water resource managers. This presents a need to bolster adaptive management systems and decision-making that is robust against an envelope of uncertain scenario futures. For instance, a scenario of negative precipitation anomalies, high population growth and low end use efficiency among sectors may continue to exhaust urban and rural water supplies in arid and semi-arid lands. While it is beyond the scope of this study to conduct such integrated scenario analysis at the country-level, this approach is illustrated in a case study of adaptation interventions in the Tana River Basin.
Adaptation economics methods Three primary methods were used to explore the costs of adaptation to climatic risks for the Kenyan water sector. These include Investment and Financial Flows (I&FF) and Adaptation Signatures analyses at the national scale, and scenario-based modeling of adaptation costs in the Tana River Basin (Table 2). Table 2: Adaptation economics assessment methods used Costing method Description Scale Developer
Investment and financial flows
(I&FF)
Nationally aggregated assessment of changing
investments needs from climate adaptation or mitigation
National-aggregated UNDP
Adaptation signatures
Disaggregated national assessment of project and program-level adaptation
National- disaggregated by
Kenyan Water Services Board (WSBs)
SEI
Water Evaluation And Planning
(WEAP) Scenario-based model
Stylized scenario-based costing of Integrated Water Resource
Management (IWRM) adaptation
Tana River Basin SEI
In line with the overall conceptual framework, present development and adaptation needs were the basis of analysis. Results are very preliminary and only indicative of actual costs of adapting to future climate change. In addition, it is worth emphasizing that the methods are not mutually exclusive and can be combined to suit specific analyses. For example, use of scenario-based modeling techniques such as WEAP are recommended in I&FF guidelines. Each of the methods is described below.
Investment and Financial Flows (I&FF)

7
Developed by the United Nations Development Programme (UNDP), this methodology was designed to assist developing countries in examining their Investment and Financial Flows (IF&FF) for addressing climate change. The overall aim of the exercise is to build capacity among country planners to assess changes in investments in physical assets (IF) and programmatic measures (FF) needed for climate adaptation or mitigation. Operation and Maintenance Costs (O&M) are also accounted for. The conceptual framework of the method is oriented around two future scenarios, 1) a baseline “business as usual” based on current policies and plans and 2) a climate change scenario in which either (but not both) mitigation or adaptation measures are taken. Investment costs of the baseline and climate change scenario are compared to determine future changes in investment that are needed. Investment entities identified to take on present and projected future costs include households and foreign and domestic corporations and governments. Figure 3 illustrates the nine steps recommended to carry out a full I&FF for priority sectors. Figure 3. Steps in sectoral assessments of I&FF to address climate change (UNDP, 2009). For a comprehensive description of these procedures, the UNDP methodological guidelines are available at www.undpcc.org. While a comprehensive sectoral I&FF analysis was not possible under the time and resource constraints of the

8
study, a partial analysis was conducted with available national data. These data include baseline information sourced from government investment plans based on Vision 2030 and Millennium Development Goals, as well as development partner investments in water supply and sanitation in Kenya. Baseline and projected I&FFs for the water sector were assessed in reference to current climate risks of floods and droughts. Present funding gaps and areas for potential future climate investment opportunities were identified. These results were discussed in light of recent institutional efforts relevant to climate adaptation.
Adaptation Signatures
Adaptation ‘signatures’ or ‘pathways’ is an analytical approach developed for short-term strategic decision making under conditions of long-term uncertainty. The approach is useful in situations for which no or low-regret approaches are needed for adaptation investment decisions. In the Kenyan context, where budgets are tightly constrained and expensive sectoral protection programmes risky, typologies of adaptation options including institutional capacity building, risk reduction and pilot-based actions for experimental adaptation strategies were explored (Figure 4). Figure 4. Typology of adaptation options, SEI, 2009. Development of signatures involves the construction of a narrative based on present adaptation strategies and actions to be carried out by identified actors at a specific scale. The matrix in Table 3 illustrates the scope of scales, actors, strategies and actions available for constructing signatures.

9
Table 3. Conceptual matrix of scales, actors, strategies and actions for adaptation signatures, SEI, 2009. In order to link climate information in developing country contexts to strategic decision-making, five theoretical levels of action were identified to guide the above conceptual framework (Figure 5). Figure 5. Theoretical levels of adaptation actions, adapted from SEI, 2009. In the present context, levels of action 1-3 are likely to be the most immediate whereas institutional reconfiguration/creation and preparation for climate change-induced collapse events within society remain largely hypothetical. Once one or more adaptation signatures have been constructed, a method of costing the long-term evolution of associated costs and benefits of the interventions can be identified. Methods are not limited, but appropriateness will vary based on the scale and level of action, as well as resource and data constraints. Most adaptation investments have direct or indirect development co-benefits and address adaptation to a range of current and future climate risks. Figure 6 presents a stylized version of a costed adaptation signature scenario pathway.

10
Figure 6. Stylized costs of scenario adaptation signature, SEI, 2009. For the purposes of this work, an illustrative case study using the adaptation signatures approach was carried out for the Tana River Basin using a newly developed costing model coupled with the Water Evaluation and Planning (WEAP) system, described in later sections.
Integrated water modeling case study (WEAP, Tana River Basin)
WEAP is short for Water Evaluation and Planning System. It is a computer tool for integrated water resources planning that provides a comprehensive, flexible and user-friendly framework for policy analysis. WEAP’s integrated approach to simulating water systems is useful for examining alternative water development and management strategies (Droogers et al., 2009). WEAP operates on the basic principles of a water balance. The analyst represents the system in terms of its various supply sources (e.g. rivers, creeks, groundwater, and reservoirs); withdrawal, transmission and wastewater treatment facilities; ecosystem requirements, water demands and pollution generation. The data structure and level of detail may be easily customized to meet the requirements of a particular analysis, and to reflect the limits imposed by restricted data. Based on this structure, WEAP is applicable to many scales, municipal and agricultural systems, single catchments or complex transboundary river systems. The Tana River catchment basin was selected as an illustrative case study for the use of WEAP given the river powers 75% of Kenya’s electricity production and provides 80% of Nairobi’s water supply (Droogers et al., 2006). Figure 7 illustrates the schematic overview of the WEAP water balance model, integrating various supply and demand nodes within the Tana Basin.

11
Figure 7. Schematic representation of the WEAP model of the Tana River Basin. For the purposes of this study, four adaptation scenarios were identified and the costs and benefits of their implementation tested across and envelope of climate scenarios. The adaptation scenarios were derived from Adaptation Signature analyses and included demand and supply side interventions, ecosystem management, and a “full adaptation” scenario combining all three options. Projected climatic data was taken from the highest and lowest monthly anomalies produced from nine statistically downscaled GCM models to the Meru meteorological station located in the Tana Basin. The Climate Change Explorer (CCE) tool was the source of projection data while water supply and demand data were collected at the basin-level. Discussion of the structure, functions and parameter values underlying the WEAP Tana Basin analysis are comprehensively explored in the case study section of this report. Further details about WEAP can be found on the WEAP website and manuals (http://www.weap21.org/). Details how WEAP compares to other modeling tools has been described elsewhere (Droogers et al., 2006).
Background: Economic importance of water resources
Estimated resource endowment
Kenya’s water resources are simultaneously scarce by natural endowment and underdeveloped under current supply systems. Kenya is classified as a chronically water-scarce country since its annual renewable freshwater supply of 647 cubic meters per capita is below standards of global minimum supply of 1000 m3/capita. Of the surface and ground water available, only a certain proportion can be used safely due to technical accessibility and ecosystem

12
demand requirements. Figure 8 shows national estimates of Kenya’s actual and potential “safe yield” levels in which only 15% of safe freshwater yields are developed (World Bank, 2006). Figure 8. Actual and potential safe yield levels for surface and groundwater abstraction (World Bank, 2006). Availability of up to date data on current water resources are limited. National water Master Plans (e.g. 1992, 1998) were used as primary references for estimates of the geographic distribution of resources across in Kenya’s five drainage basins. These include the Lake Victoria, Rift Valley, Athi River, Tana River and Ewaso Ngiro North basins (Figure 9). Figure 9. Five major drainage basins of Kenya. National Water Master Plan, July 1998, cited in The State of the Environment 2006/7, Kenya. The spatial distribution of surface and groundwater resources is dependent on regional rainfall patterns, geology and hydrogeology, and ecosystem regulation of storage and discharge. Table 4 depicts estimates of water resources among the five drainage basins (National Water Master Plan, 1992). Recent analysis indicates that among these basins, only Tana and Lake Victoria Basins are said to have surplus water while the rest have water deficits (Kenya State of the Environment Report, 2006/7). This correlates with the high annual rainfall rates

13
and estimated surface and ground water potential of these basins. Significantly, however, about 54% of Kenya’s water resources are shared with neighboring countries. For example, while Lake Victoria provides an estimated 54% of Kenya’s total water resources, Kenya also provides 45% of all surface water inflows into Lake Victoria, comprising the upper source of the Nile (Kenya State of the Environment, 2006/7). Hence, transboundary water rights significantly impact politically politically safe yields of Kenya’s water resources (Kenya State of the Environment Report, 2006/7). Table 4. Distribution of estimated water resources and uses by drainage basin. Drainage Mean
Annual Rainfall (mm)
Size in Km3
Estimated ground water potential (m3)
Estimated surface water potential (m3)
% total national water resources
Percentage of water abstracted
Main water uses
Lake Victoria
1,368 46,000 115.7 11.672 54.1 2.2 Domestic, Industrial, small-scale irrigation (HEP development in progress)
Rift Valley 562 130,000 125.7 2.784 3.4 1.7 Domestic, Industrial, Livestock, Large & small-scale irrigation, HEP
Athi 739 67,000 86.7 1.152 4.3 11.6 Domestic, TanaLarge & small-scale
Tana 697 126,000 147.3 3.744 32.3 15.9 Domestic, Large & small-scale irrigation, Livestock, Industrial, major HEP
Ewaso Nyiro
411 210,000 142.4 0.339 5.8 12.4 Livestock, domestic, Major & minor irrigation
Source: Adapted from 1992 National Water Master Plan, cited in NWDR, 2006.
Kenya’s water-driven economy
The origins of the basins supplying Kenya’s water resources are five montane forest systems that make up the largest forest blocks in the country. They include Mt. Kenya, Aberderes, Mau complex, Mt. Elgon, and the Cherangani. Referred to as “water towers”, the forests comprise the upper catchments of Kenya’s main rivers, except the Tsavo River originating from Mt. Kilimanjaro (Figure 10). These ecosystems are the foundation of Kenya’s water-driven economy (Table 5).

14
Figure 10. Kenya’s five “Water Towers”, from The Atlas of Kenya’s Changing Environment, 2009. Table 5. Economic value of Kenya’s water towers
Source: Kenya State of the Environment 2006/7.

15
Direct dependence on freshwater resources among Kenya’s principle economic sectors is dominated by irrigated agriculture (Table 6). Accounting for around 76% of total demand, coffee, tea and horticulture are the primary users. According to government estimates, agricultural productivity from irrigation directly contributes about 3% of GDP and provides about 18% of the value of all agriculture produce. The water resource needs of rain-fed agriculture are equally vital to the Kenyan economy. Occupying 20% of Kenya’s land surface, which carries 80% of the population, rain-fed agriculture supports subsistence farmers that make up over 70% of the Kenyan workforce and supply the majority of national food requirements (Kenya SIP, 2009). Domestic water consumption among urban and rural users comprises the second largest direct source of water demand, with significant non-market implications for health and well being. At present, it is estimated that 40% and 60% of rural and urban areas have access to water, respectively (Kenya SIP, 2009). Livestock water demand is also significant and provides the principle livelihood for Kenya’s Arid and Semi-Arid Lands (ASALs) that span 80% of the country and carry about 45.5% of the total livestock population (World Bank, 2006). While direct industrial demand of water is only 4% the overall demand, 75% of Kenya’s domestically generated electricity comes from hydroelectric generation (Droogers et al., 2006). Hence, there is significant indirect dependence on water resources through hydroelectric power reliance among industrial and service sectors, which together make up 70% of the Kenyan economy (Figure 11). Table 6. Estimated water demand, 1990-2010 (thousands of m3/day)
Source: Republic of Kenya, 1992, cited in World Bank, 2006.

16
Figure 11. Principle economic sectors, Republic of Kenya, 2002, cited in World Bank, 2006.
Costs of current climate variability and resource degradation
The economic impacts of climatic extremes in the form of floods and droughts, occurring roughly every 5 and 7 years, respectively, are a significant drag to the Kenyan economy estimated at 2.4% GDP (Ksh 16 billion per annum). Compounded by the impacts of resource degradation estimated to be at least 0.5%, together these costs are about 50% of the annual GDP growth of the 1990s (Figure 12).
That is, droughts and general degradation of the resource base, in addition to the steady deterioration in the country’s infrastructure, are exerting a huge impact on economic production (World Bank, 2006).
Figure 12. Relative annualized impacts of floods, droughts and resourced degradation to the Kenyan economy (World Bank, 2006). The highest cost impacts of flood and drought events, and water resource degradation are detailed in Table 7 and Figure 13 below. Loss of industrial production and increased electricity generation costs from droughts, and infrastructure damage from floods dominate market costs of extreme events while estimates from resource degradation are small in comparison. Table 7: Estimated highest cost impacts of floods, droughts and water resource degradation.

17
Source: World Bank, 2006. Figure 13. Estimated highest cost impacts of floods, droughts and water resources degradation, from World Bank, 2006.
Future demand
From Kenya’s National Water Resources Management Strategy (NWRMS), the estimated total available water resources in Kenya are 7,400 million m3 per year safe yield of surface water, and 1000 million m3 per year annual safe yield of groundwater. As part of the NWRMS, future water demand was projected based on population growth trends and estimates of 30% improvement in water use efficiency in irrigation, compared to the present estimate of 1 litre/se per Ha (used 50% of the time) (Kenya SIP, 2009). Base on these assumptions, by 2030 estimated water use approaches total available resources, reaching an average of
Attribute Highest cost impacts Total estimated cost (‘000,000) Ksh $USD
Flood Road network, communication, buildings and water infrastructure damage
62,000 777
Health treatment costs 4,500 56 Water systems 3,600 45
Drought Loss of industrial production 110,000 1,400 Increased cost of generation 51,000 632 Crop loss 19,000 241
Resource degradation
Increased pumping costs for Nairobi
870 11
Cost of urban water treatment 850 11 Desalinization 600 7 Reduced fish production 680 9
Total 252,420 3,180

18
7,000 million m3. This highlights the urgency of efficiency gains in irrigated agriculture in particular (Table 8, Figure 14). Table 8. Total water use projections (2008-2030)
Figure 14. Future water use based on sectoral demand and population growth projections, Kenya SIP, 2009. As a result of increased consumption from key economic sectors and projected demands of a rapidly growing population, total water availability per capita decreases from 242 to and average of 152 m3/capita/annum (Figure 15). Figure 15. Future water availability, Kenya SIP, 2009. However, it is important to stress the extreme uncertainty of such projections, as they do not account for scenario climatic change and are founded upon uncertain baseline resources, population growth and use efficiency estimates, which also result in discrepancies with other projected estimates. Nevertheless, present water scarcity and demand projections underscore the need for immediate

19
investment in storage, efficiency and improved catchment and water resources management (Kenya SIP, 2009).
Development planning horizons
By 2030, it is Kenya’s development vision to become a middle-income country (Vision 2030). This and other poverty reduction and development objectives are shaping sectoral planning horizons and related water resource development. Overall objectives of key initiatives directly related to water are summarized in Table 9. These include Vision 2030, Kenya’s Economic Recovery Strategy (ERS), the Millennium Development Goals (MDGs), and Nile Basin Initiative. Table 9. Primary development objections related to water resources Source Initiative Overall Objective
Vision 2030, medium (2008-12) and long-term plan
Ensure improved water and sanitation are available and accessible to all, and increased agricultural productivity
Economic Recovery Strategy (ERS) and PRSP Provide water and sanitation to the majority of the poor at a reasonable distance (~2km) with active local community and authority involvement in management of water and sewage services
Millennium Development Goal 7, Target 10 Halve by 2015 the proportion of people without sustainable access to safe drinking water and sanitation services
Nile Basin Initiative Shared Vision Achieve sustainable socioeconomic development through the equitable utilization of, and benefit from, the common Nile Basin water resources
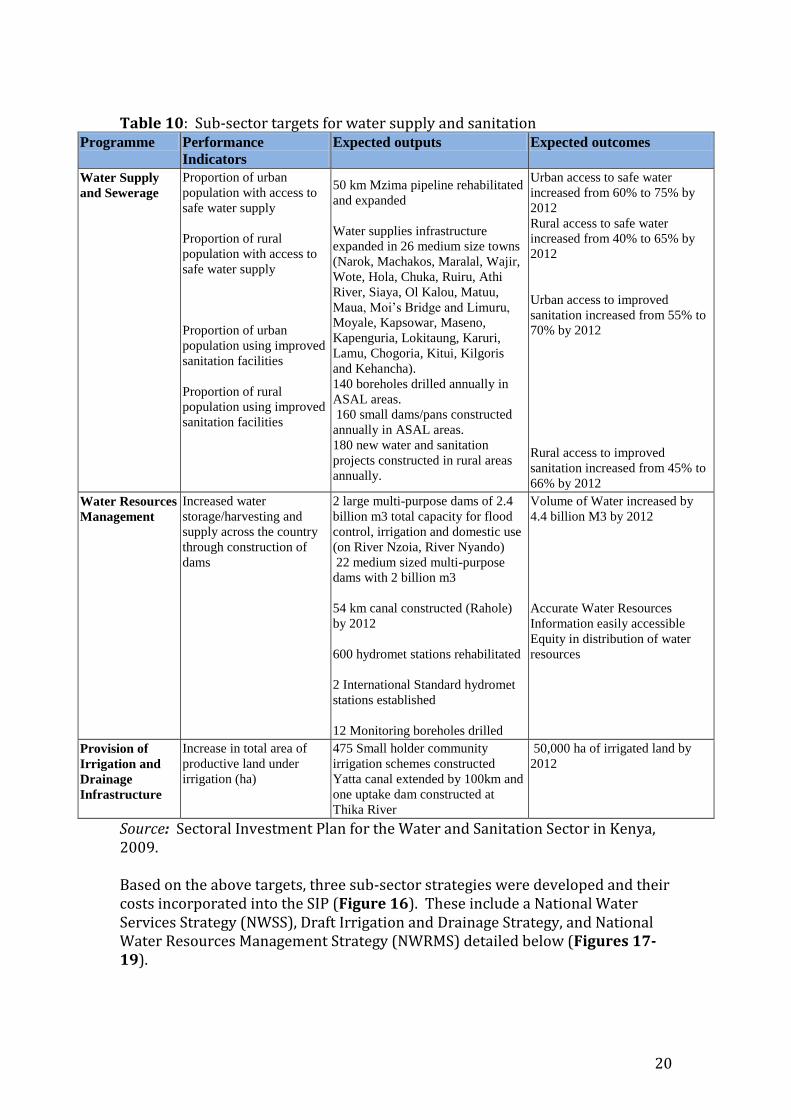
In 2009, as part of a revised planning framework for the water and sanitation sector, Kenya released a Sectoral Investment Plan (SIP) covering the period from 2008-2030. The objective of the SIP is to present a strategic outlook and investment needs to reach the MDGs and the Government’s Vision 2030. In addition to the SIP, strategies exist for each of Kenya’s 11 Water Sector Institutions (WSIs), operating under the guidance of the Ministry of Water and Irrigation. The investment framework for the SIP is structured around targets for sub-sectors including i) Water Services, ii) Sanitation, iii) Irrigation, Drainage & Land Reclamation and iv) Water Resources Management, as well as overall sector management goals (Table 10). Note that these programme targets incorporate flagship projects for the water sector outlined in Vision 2030.
20
Table 10: Sub-sector targets for water supply and sanitation
Programme Performance
Indicators
Expected outputs Expected outcomes
Water Supply
and Sewerage
Proportion of urban
population with access to
safe water supply
Proportion of rural
population with access to
safe water supply
Proportion of urban
population using improved
sanitation facilities
Proportion of rural
population using improved
sanitation facilities
50 km Mzima pipeline rehabilitated
and expanded
Water supplies infrastructure
expanded in 26 medium size towns
(Narok, Machakos, Maralal, Wajir,
Wote, Hola, Chuka, Ruiru, Athi
River, Siaya, Ol Kalou, Matuu,
Maua, Moi’s Bridge and Limuru,
Moyale, Kapsowar, Maseno,
Kapenguria, Lokitaung, Karuri,
Lamu, Chogoria, Kitui, Kilgoris
and Kehancha).
140 boreholes drilled annually in
ASAL areas.
160 small dams/pans constructed
annually in ASAL areas.
180 new water and sanitation
projects constructed in rural areas
annually.
Urban access to safe water
increased from 60% to 75% by
2012
Rural access to safe water
increased from 40% to 65% by
2012
Urban access to improved
sanitation increased from 55% to
70% by 2012
Rural access to improved
sanitation increased from 45% to
66% by 2012
Water Resources
Management
Increased water
storage/harvesting and
supply across the country
through construction of
dams
2 large multi-purpose dams of 2.4
billion m3 total capacity for flood
control, irrigation and domestic use
(on River Nzoia, River Nyando)
22 medium sized multi-purpose
dams with 2 billion m3
54 km canal constructed (Rahole)
by 2012
600 hydromet stations rehabilitated
2 International Standard hydromet
stations established
12 Monitoring boreholes drilled
Volume of Water increased by
4.4 billion M3 by 2012
Accurate Water Resources
Information easily accessible
Equity in distribution of water
resources
Provision of
Irrigation and
Drainage
Infrastructure
Increase in total area of
productive land under
irrigation (ha)
475 Small holder community
irrigation schemes constructed
Yatta canal extended by 100km and
one uptake dam constructed at
Thika River
50,000 ha of irrigated land by
2012
Source: Sectoral Investment Plan for the Water and Sanitation Sector in Kenya, 2009. Based on the above targets, three sub-sector strategies were developed and their costs incorporated into the SIP (Figure 16). These include a National Water Services Strategy (NWSS), Draft Irrigation and Drainage Strategy, and National Water Resources Management Strategy (NWRMS) detailed below (Figures 17-19).

21
Figure 16. Water sector investment plan (2008-2030), Kenya SIP, 2009. Figure 17. National Water Services Strategy (NWSS), Kenya SIP, 2009. Figure 18. Draft Irrigation and Drainage Strategy, Kenya SIP, 2009.

22
Figure 19. National Water Resources Management Strategy (NWRMS), Kenya SIP, 2009. SIP projections estimate the financing needed to achieve each of the sub-sector strategies nationally. This information will in turn guide relevant WSIs through the 3-Year Sector Plans and Medium Expenditure Framework (MTEF). Results of this initial SIP exercise lay out a baseline and scenario investment framework for sustainable sectoral development towards 2030.
Preliminary I&FF analysis As a step in the process of building up an evidence base for investments in climate adaptation, the Investment and Financial Flows (I&FF) methodology is one of many emerging techniques (UNDP, 2009). Under UNDP support, ongoing I&FF assessments for either sector-based adaptation or mitigation are being pilot tested in 10 developing country contexts, including 7 in Africa. Publically available sector-based methodological guidelines were used for the following preliminary assessment for adaptation investments in the Kenya water sector (www.undpcc.org). The sequence of steps suggested when undertaking I&FF analysis include defining the sectoral scope, compiling historical I&FF data, establishing a baseline and adaptation scenarios coupled with respective I&FF projections (Figure 3). Due to the limited time and resources available for this study, a preliminary national-level I&FF assessment was carried out and drawn almost exclusively from Kenya’s 2009 Sectoral Investment Plan. SIP calculations determining sector investment requirements were carried out using a Strategic Investment Model (SSIM). In order to obtain more accurate historical I&FF data, and inform adaptation scenario development, it is recommended that a full I&FF be carried out through a country-led stakeholder engagement process.
Sectoral scope
Due to the significant socio-economic impacts of current floods and drought events and resource degradation, an I&FF adaptation investment assessment was conducted for the Kenyan water sector. Given the uncertainty surrounding future climate risks to Kenya’s water sector, a conceptual approach focusing primarily on projections of both available and needed funding to address existing climate risks and development targets was used. Key parameters for the assessment were based on Kenya’s 2009 SIP consisting of three sub-sector strategies including i) the National Water Services Strategy, ii) Draft Irrigation and Drainage Strategy, and iii) National Water Resources Management Strategy.

23
Historical I&FF data
Historical I&FF data were based on recent analyses covering the period of 2007-2010. A longer timeframe was not explored given data finding constraints, in addition to the substantial institutional re-organization and legislative changes prior to this period, which significantly altered funding allocation. Limited availability of national-level investment information restricted historical investment analysis to the recurrent and development expenditures of the Government of Kenya (GoK) and its foreign development partners (DPs). Based on total GoK and DP investments, recurrent budgets supporting water sector institutions have remained stable over the period of 2007-2010, while development budgets have nearly doubled in the last two years from Kshs 11.65 billion (gross) in 2007/8 to 24.7 billion in 2009/10 (Figure 20). This reflects increased government and donor commitment to water resource development (WSTG Budget Analysis, 2009).
Figure 20. Development investment commitments in Kenya’s water sector budget (2007/8 -2010/11), from WSTG Budget Analysis, 2009. Appropriation in Aid (AIA) (red line) represents total development partner contributions. Net budget (blue line) represents GoK investments. Gross (green line) represents combined GoK and DP budget contributions.
Baseline scenario
A baseline scenario for Kenya’s water resources was derived from the Sectoral Investment Plan. In line with the sectoral targets outlined in the Vision 2030 and MDGs, the four sub-sector strategies of the SIP served as a development baseline

24
scenario. Parameters capturing financing need categories for these plans are detailed in Table 11.
Table 11. Categories of sector financing needs Sectoral Financing Needs
Water Services Sanitation Irrigation, Drainage and Land Reclamation (ID&LR) Water Resources Management Operations Water Resources Management Infrastructure Sector Management
I&FF estimates for baseline scenario
A baseline scenario for future sector funding based on current plans was derived from investment and financial flows, and operating and maintenance (O&M) costs using the calculations a Strategic Sectoral Investment Model (SSIM) directly from Kenya’s SIP analysis. Outputs of this analysis include water sector investment per sub-sector (Figure 21), level of water sector funding by source (Figure 22, Table 12), and total sector funding (Figure 23).
Figure 21, Figure 22: Investments per sub-sector and sector funding by source. Abbreviations: Water resources management (WRM), Irrigation, drainage and land reclamation (ID&LR), Local Authorities Transfer Fund (LATF), Development Partners (DP) Constituency Development Fund (CDF), Kenya SIP, 2009

25
Table 12. Projected water sector funding by source
Source: Kenya SIP, 2009.
Figure 23: Projected available water sector funding by source, Kenya SIP, 2009. From Figures 21 and 22, water services and sanitation are the primary sub-sector investments, paid for mostly by service revenues and user contributions. According to these projections, 57% of total water sector funding is anticipated to come from user contributions in the form of WRM fees and water user charges, farmer and private sector investment in irrigation. As noted in the SIP, it is important to highlight that “this is to some extent an incorrect picture” since estimated O&M costs associated with ID&LR investments are not included under the assumption they are covered fully by farmers. However, O&M costs were included for water services funding requirements, and sanitation includes investments by users in on-site sanitation. Hence, these results should be seen as highly illustrative and in the case of irrigation, significant underestimates. In terms of domestic and foreign public contributions, direct funding from Government (development and recurrent budgets) and foreign donors are 16% and 13%, respectively. NGO and off-budget donor support is potentially as high as 50% of Government and on-budget donor funding, therefore an additional contribution of 10% was added to Table 10.

26
Taken upon the assumptions underlying the Strategic Sectoral Investment Model, by 2030 an average of Ksh 95.5 billion/yr (USD$ 1.3 billion) is projected to be available for water sector funding across public and private investment entities. Between 2008 and 2030, a cumulative amount of Ksh 1,834 billion (USD$ 24.5 billion) is projected to be available for investment in the six priority sub-sector areas. In order to validate SSIM calculations for the base year of 2008, results were compared with current Government and development partner investments in the water sector (Table 13). Table 13. Actual and SIP derived investment in the water sector by public investment entities Public investment entity
SIP 2008/9 (Ksh million)
Actual 2008/9 (Ksh million)
Development Recurrent Development Recurrent
GoK 8,357 3,343 12,051 3,530
Development partners
13,322 Not calculated
6,146 1,147
Sub-total 21,679 3,343 18,197 4,678
Grand total 25,022 22,875
Source: Kenya SIP, 2009, Kenya’s water sector development budget, 2007/8 -2010/11, from WSTG Budget Analysis, 2009. Results of the comparison between actual and SIP investments by foreign and domestic public investors are favorable. SIP estimates are not dramatically different (>Ksh 2,147 million) than total actual development and recurrent expenditure by the GoK and development partners. Moreover, use of the SIP projected available funding as a baseline I&FF appears reasonable based on current knowledge.
Defining an adaptation scenario
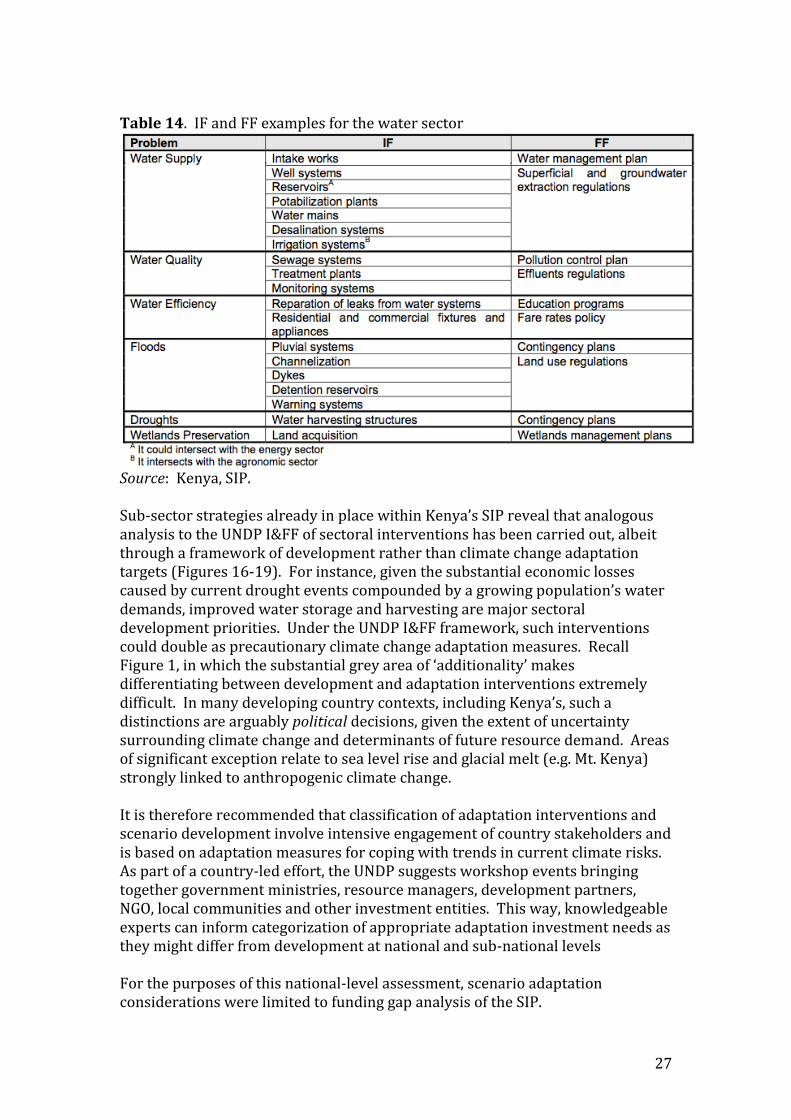
According to the UNDP guidelines, I&FF analysts are instructed to compile detailed descriptions of adaptation options to be implemented, and assess the implications of those measures. Table 14 shows suggested I&FF investments from the water sector I&FF guidelines.
27
Table 14. IF and FF examples for the water sector
Source: Kenya, SIP. Sub-sector strategies already in place within Kenya’s SIP reveal that analogous analysis to the UNDP I&FF of sectoral interventions has been carried out, albeit through a framework of development rather than climate change adaptation targets (Figures 16-19). For instance, given the substantial economic losses caused by current drought events compounded by a growing population’s water demands, improved water storage and harvesting are major sectoral development priorities. Under the UNDP I&FF framework, such interventions could double as precautionary climate change adaptation measures. Recall Figure 1, in which the substantial grey area of ‘additionality’ makes differentiating between development and adaptation interventions extremely difficult. In many developing country contexts, including Kenya’s, such a distinctions are arguably political decisions, given the extent of uncertainty surrounding climate change and determinants of future resource demand. Areas of significant exception relate to sea level rise and glacial melt (e.g. Mt. Kenya) strongly linked to anthropogenic climate change. It is therefore recommended that classification of adaptation interventions and scenario development involve intensive engagement of country stakeholders and is based on adaptation measures for coping with trends in current climate risks. As part of a country-led effort, the UNDP suggests workshop events bringing together government ministries, resource managers, development partners, NGO, local communities and other investment entities. This way, knowledgeable experts can inform categorization of appropriate adaptation investment needs as they might differ from development at national and sub-national levels For the purposes of this national-level assessment, scenario adaptation considerations were limited to funding gap analysis of the SIP.

28
I&FF for adaptation scenario
Although an explicit adaptation scenario was not developed from the SIP-based I&FF baseline, the gap arising between projected investment needs and available funds is used as a possible entry point for discussions for adaptation I&FF scenario development. Within the 2008-2030 planning period, an annual financing gap of approximately Ksh 20 billion (USD $264 million) develops. From SIP analysis, this arises mainly due to increasing funding requirements for investment in irrigation and in major water resource management infrastructure such as dams (Table 15, Figure 24). By 2030, the gap grows to Ksh 564.8 billion. Table 15. Total water sector funding gap
Source: Kenya SIP, 2009.
Figure 24. Total water sector funding gap, Kenya SIP, 2009. Filling all or part of such funding gaps as they arise presents is a possible opportunity for outside investment entities to target adaptation financing. This would support Kenya in achieving its Vision 2030 and MDG commitments, and possibly increase long-term institutional and local resilience to future climate change. Further consideration might be given for an additional percentage of current financing needs to be added as an adaptation finance ‘buffer’. Given the SIP assumption that user contributions will account for 57% of projected investment costs of sub-sector strategies, it seems reasonable to also assume that it may

29
require significant amounts of time for such contributions to be fully realized. Adaptation financing that subsidizes sector investments and cost-recovery programmes targeting low-income groups frequently exposed to extreme events might be considered to supplement this. Additional financing might also be needed if water use efficiency improvements in agriculture and irrigation O&M costs covered by farmers carrying prove unrealistic. While bottom-up estimates of additional adaptation financing needed to realize sectoral development targets would ideally come from a process of stakeholder engagement, the following section briefly discusses aggregated global estimates of these additional climate change adaptation costs.
Comparison with global estimates
The projected annual funding gap of Ksh 20 billion (USD $264 million) was compared with projections of future climate adaptation costs needed for Africa and Kenya in order to contextualize both findings. Based on research by the International Institute for Environment and Development (IIED) and Grantham Institute, UNFCCC estimates of required adaptation financing flows globally for the water sector of USD$ 11 billion/yr as a substantial underestimate (Table 16). Table 16. Summary of IIED/Grantham findings (2009) on the UNFCCC (2007) assessment.
Sector UNFCCC Global Flow IIED commentary on UNFCCC estimates
Agriculture forestry & fisheries
$14 billion/yr Considers a reasonable first approximation
Water resources $11 billion/yr Considers a potentially substantial under-estimate, due to omission of flood risk, water transfers, and ensemble range
Coastal Zones $11 billion/yr Considers underestimate by factor of 3 due to higher potential sea level rise
Human health $5 billion/yr Considers underestimate as only includes 30-50% of extra disease burden from climate change in developing countries
Infra-structure $8 - 130 billion/yr Consider major underestimate as low levels of future development in some regions (so less infrastructure to protect), only large events, and relatively low mark-up.
Eco-systems Not included Omitted in UNFCC so underestimate (cites $65–$300 billion/yr)
Other sectors Not included Not included
TOTAL $49 - 171 billion/yr Considers investment needs are 2 – 3 times higher than UNFCCC
Source: SEI, 2009. Based on the IIED/Grantham review, estimates for adaptation finance needs in Africa were made 2 – 3 times higher than the UNFCCC numbers. Different approaches can be used to scale these revised estimates to the country-level. Table 17 details the breakdown of the USD $11 billion estimate using population, GDP and land area to allocate investment across East African countries. Note, this method of allocation is purely illustrative and does not take into account relative economic differences (e.g. LDC vs. non-LDC) or indicators of vulnerability to climate climatic risk.

30
Table 17. Country-level adaptation funding needs based on UNFCCC estimates
$ million / year Scaled on the basis of
Population GDP Land area
All Africa 14346 - 29793
Burundi 124 - 258 16 - 67 9 - 37
Kenya 557 - 1156 131 - 542 120 - 497
Rwanda 144 - 299 33 - 138 7 - 30
Tanzania 601 - 1248 84 - 348 84 - 348
Uganda 455 - 946 128 - 532 53 - 222
East Africa 1881 - 3907 392 -1627 273 - 1134
Note: data of population, GDP (2006), and land area used here were obtained from WHO statistics, UN data,
the World Factbook (2006), FAO dataset, and Yale University 2005 Environmental Sustainability Index
(ESI). Note scaling by the GDP in 2030, rather than currently, would make a difference to the numbers, and
is a source of uncertainty given these apply to future investment flows.
Source: SEI, 2009.
Based on population, Kenya would receive the highest proportion of adaptation finance, estimated between USD $557 and $1,156 million. Compared to the estimated funding gap of USD $264 million for the Kenyan water sector, it is conceivable that global adaptation financing flows could supplement this gap and additional adaptation costs conceived by country stakeholders in future I&FF assessments.
Policy implications and recommendations
At global and national levels, estimates of the additional costs of climate adaptation are many and growing. While of potential use for country delegations to climate policy negotiations, such estimates are of marginal value to sectoral planners at national and sub-national levels. The latter may be attributed to considerable overlaps or ‘grey areas’ between recommended adaptation options and current development plans, and lack of grounding in unique country contexts. Moreover, rigorous estimation of current and future investment needs to achieve sectoral development targets is a valuable exercise for contextualizing additional climate change adaptation investment decisions. Estimates from Kenya’s SIP assessment represent a strong step in the right direction for making the process of adaptation investment decisions more transparent. This is particularly true with regard to identifying sources of projected available development funding relative to estimated investment needs. From the perspective of climate change adaptation as a socio-institutional process, however, the challenge of investment needs assessments is not the costing of decisions, but the decisions themselves. How Kenyans decided to appropriate available revenues and outside investments to prepare for climate change is a highly political, national and sub-national process. In order to facilitate this strategic decision-making, it may be recommendable for entirely new institutions to be formed that have the capacity and mandate to coordinate

31
adaptation investment decisions in the context of diverse sectoral and cross-sectoral development ambitions. In addition, significant capacity investments should be considered for robust, scenario-based decision making to inform future planning processes, and adapt as conditions change. Support for institutional transformation or creation is an immediate and clearly additional adaptation finance investment opportunity. In the case of Kenya’s water sector, positive signals have been seen since the transformational institutional changes following the Water Act of 2002. Investment in improved data collection and coordination among water sector institutions, development of the SIP, stakeholder engagement, anticipated scenario-based investment planning techniques (e.g. use of MIKE Basin) and pro-poor sub-sector implementation plan (PPIP) represent progressive developments in a sector plagued by mismanagement and information scarcity. As the status of Kenya’s climate and development change, such improvements in current management processes may prove sufficient for adaptation needs. However, multiple stressors including demand changes under population growth and economic transitions, compounded by limited nature water endowments, may push such arrangements beyond stable states and necessitate formation of new institutions to manage complex and uncertain climate-society interactions. The appropriateness of these and other strategic adaptation decisions can only be determined through an ongoing process of country-led, multi-scale stakeholder engagement.
Adaptation signatures To illustrate the adaptation signature methodology, case study work was carried out for the Tana River Basin. Cost estimates based on the signature were derived using an adapted version of the Water Evaluation And Planning (WEAP) model (Droogers et al., 2009). Model results were discussed in the context of current Water Sector Board (WSB) development plans for the upper Tana Basin, and recommendations made for robust adaptation options below cost.

32
Background of Tana River Basin
The Tana River Basin performs water regulation functions of critical importance to the Kenyan economy and development. The forest watershed (“tower”) covering Mt. Kenya provides the source of the basin’s water flows. These flows power the Seven Forks hydroelectric cascade, powering Kenya with over 70% of its domestic electricity, and providing the majority of Nairobi’s water supply, accounting for 15.9% of basin abstractions (NWDR, 2006). Although of historically good water quality, high rates of siltation from poor land management in the upper catchment, over abstraction for irrigation, agricultural pollution and municipal sewage contamination have degraded the river. Water distribution in the basin is also not even, leaving some areas very dry and classified as part of Kenya’s arid and semi-arid lands where conflict over water access has erupted in recent years (Kenya State of the Environment Report, 2006/7). According to the Tana Water Services Board (WSB), an estimated 20% of the population has access to sustainable and safe water (Kenya SIP, 2009). Up-stream water management and abstraction have also led to the reduced productivity of downstream agriculture, pastoral and fishing operations as annual flooding events and water quality are reduced, and fish can no longer move freely through the upper and middle reaches of the river (NWDR, 2006). While water resource management issues arguably dominate external influences on the basin, flood and drought events, namely El Nino and La Nina related, have also resulted in significant physical impacts and economic losses (Table 18). Table 18. Primary water resource challenges and associated impacts for the Tana Basin, derived from NWDR, 2006 and World Bank, 2006.
Issue Description Major socio-economic costs Floods El Nino events, e.g.
1998 Dams and pans damaged from flood events resulted in costs estimated around Ksh 63 million. Storm damage due to El Nino affected food distribution in areas where roads were flooded, damaged, or washed away (notably the Tana River)
Droughts 1999/2000 (La Nina events), 2009
Hydroelectric power reductions of 41% from 3,062.5 GWh in 1999 to 1,793.8 GWh in 2000 Water and hydroelectricity shortages (2009)
Resource degradation
Siltation from catchment degradation Over-abstraction
Uncertain loss in Masinga Dam storage volume, but sedimentation rates much greater (10 million tons/yr) than design capacity of 3 million tons/yr Over-abstraction for irrigation purposes, e.g. Marunga River

33
Adaptation signature: Tana River Basin
Based on the Tana Basin’s water resource challenges in relation to climate risks and management issues, an adaptation signature was developed to explore the performance of interventions across scenario climate futures (Table 19). Table 19. Adaptation signature for Tana River Basin Source: SEI, 2009.
In light of growing demand from irrigated and rain-fed agriculture and urban areas, these are recommendable actions in the context of current development needs (Kenya SIP, 2009). Demand and supply-side management and ecosystem protection interventions were selected as they simultaneously increase resource availability, efficiency, and sustainability. As climate risk coping strategies, these considerations, in addition to improved monitoring networks and risk reduction policies, are considered robust actions in light of current flood and drought impacts.1 Given the considerable range in scenario projections of future climate change for this sub-region of Kenya, it is important to plan for both extremes in the short term (Figure 25). Figure 25. Projected total monthly precipitation anomaly for Meru station in the Tana River Basin from 9 statistically downscaled global climate models for the 2045-65 period. Climate Change Explorer Tool, Climate Systems Analysis Group and SEI, 2009.
1 There are about 24 water quality sampling stations distributed throughout the Basin. Out of 205 registered hydrometric stations, an estimated 66 were still operating in 2001, representing a 67% reduction in capacity (NWDR, 2006).
Strategy Level of action
Actions Regional actors (Private/public)
Demand-side management
1-3 Improved irrigation efficiency Improved urban water consumption
P/P P/P
Supply-side management
1-3 Domestic water harvesting Increased reservoir storage capacity
P/P Public
Ecosystem protection
1-3 Erosion control sustainable land management techniques
Improved rain-fed agriculture water use
P/P P/P
Monitoring 3 Rehabilitate hydrometric station network
Public
Risk reduction policies
3 Early warning system (flood, drought) Disaster risk and flood plains policies
Public Public

34
Levels of actions in the signature typology varied, due to the broad range of potential project or program approaches for implementing the five signature options across private (households, water service providers, NGOs, etc.) and public (GoK, DPs) actors. Levels 1 and 2, undertaken by individuals and households, and level 3 actions requiring institutional or outside support are considered the most likely in the near-term. Institutional change (level 4) might be considered for the medium to long-term future as adaptation needs increase. The individual and combined performance of the adaptation strategies was explored using the WEAP model, based on the demand and supply management, and ecosystem protection interventions. Monitoring and risk reduction policies could not be captured by the modeling technique, however, for the latter, scenario testing is recommended for future work. The primary measure to text options’ relative performance measures was hydroelectricity output, while the importance of other market and non-market costs is recognized.
WEAP model case study
Setting up model
The basis for the updated version of the WEAP model is the catchment approach. The Upper and Middle Tana basin (up to the proposed location of the Fourth-Fork dam) have been divided into nine catchments (Figure 26). Each catchment provides water resources through a rainfall-runoff process. These catchments are similar to the delineation used by the Kenyan Ministry of Water and Irrigation and the Tana Water Resources Management Authority (WRMA). A screenshot of the updated model can be seen in Figure 17. For each Catchment the most important characteristics included are:
Total area in ha Land cover in percentage for:
o Forest o Agriculture rainfed o Coffee o Tea o Irrigated agriculture o Rangeland o Open water
Land cover characteristics o Crop coefficient o Effective precipitation
Climate o Precipitation o Potential evapotranspiration
Other important features included in the model are:

35
Towns o Population o Water requirements o Water return flows
Reservoirs o Storage capacity o Hydropower generation o Cost / benefit hydropower
A detailed description of the value of each of these variables has been included in the Appendix. With this setup the WEAP model can be used as an integrated framework including water supply, water demand and hydropower cost/benefit analysis.
Tana
Sagana Thiba
Thika
Kazita
Ena
Mutonga
Ena
Embu
Meru
Nyeri
Kaongo
Migwani
Mareira
Manyata
Murang'a
Magutuni
Kahigaini
Mikinduri
Githunguri
Kathunguri
Chiokarige
0 25 5012.5 Km
±Tana Basin, Kenya
Figure 26. Upper Tana catchments.

36
Figure 17. Overview of the newly developed WEAP model.
Calibration and validation of model
Observed and simulated inflows into the Masinga Reservoir are plotted in Figure 28. Based on this figure it can be concluded that the model is performing very well in simulating streamflow. Observed annual average inflow into Masinga is 2131 MCM over these five years, while simulated inflow is 2189 MCM. For the five main reservoirs in the area observed outflows were available and were compared with simulated ones. 20 indicates that simulated outflows from the five reservoirs match reasonable well the observed ones for the years 2001 to 2004. For the years 2002 and 2003 simulated outflows are slightly higher than observed ones. The main reasons for this are two peak runoff events (Figure 29) for Kindaruma Reservoir. It is not completely clear what the reason for this mismatch is. Rainfall might be incorrect, but given the correct simulation of inflow into Masinga (Figure 28) this is unlikely. Given the fact that in WEAP rainfall-runoff processes are conceptual defined rather than physical, this might cause some errors. However, for most other months the model is performing very well. Another explanation might be that observations on outflow of the reservoirs do not include flows over the spill-way. In many reservoirs only water through the turbines is monitored and spill-way flows are often not monitored or recorded (This argument is confirmed when comparing with the recorded and simulated hydropower generation, see hereafter).

37
A last validation of the model performance is done by comparing reported hydropower generation to simulated hydropower by WEAP (Figure 30). It is surprising how close these two are if one considers the many factors that determine hydropower generation such as: discharge, rating characteristics, minimum and maximum turbine flow, tailwater elevation, plant factor, etc. Obviously, further calibration/validation could be performed to increase the accuracy of the model within the range of limitations given the conceptual nature of WEAP. However, based on the various comparisons between observed and simulated data as presented here, it can be concluded that the model is performing very well and can be used to undertake scenario analysis. Moreover, in the context of scenario analysis one should realize that relative accuracy of models is more important than absolute accuracy (Droogers et al. 2008).
Table 20. Observed and simulated outflows for the main reservoirs in Tana
Basin.
OUTFLOW MCM MCM
Masinga Observed Simulated
2001 1012 924
2002 2031 2561
2003 2909 3447
2004 1892 1709
Kamburu
2001 1438 1395
2002 2804 3521
2003 3619 4381
2004 2247 1891
Gitaru
2001 1530 1382
2002 2888 3518
2003 3576 4386
2004 2151 1892
Kindaruma
2001 1366 1370
2002 2688 3514
2003 3336 4391
2004 2157 1893
Kiambere
2001 1283 1564
2002 3101 4479
2003 3754 5593
2004 2436 2425

38
0
200
400
600
800
1000
1200
1400
Ja
n-0
1
Ap
r-0
1
Ju
l-0
1
Oc
t-0
1
Ja
n-0
2
Ap
r-0
2
Ju
l-0
2
Oc
t-0
2
Ja
n-0
3
Ap
r-0
3
Ju
l-0
3
Oc
t-0
3
Ja
n-0
4
Ap
r-0
4
Ju
l-0
4
Oc
t-0
4
Ja
n-0
5
Ap
r-0
5
Ju
l-0
5
Oc
t-0
5
(MC
M)
Inflow Obs
Inflow Sim
Figure 28. Observed and simulated inflow in Masinga Reservoir.
0
200
400
600
800
1000
1200
1400
Ja
n-0
1
Ap
r-0
1
Ju
l-0
1
Oc
t-0
1
Ja
n-0
2
Ap
r-0
2
Ju
l-0
2
Oc
t-0
2
Ja
n-0
3
Ap
r-0
3
Ju
l-0
3
Oc
t-0
3
Ja
n-0
4
Ap
r-0
4
Ju
l-0
4
Oc
t-0
4
Ja
n-0
5
Ap
r-0
5
Ju
l-0
5
Oc
t-0
5
(MC
M)
Outflow Obs
Outflow Sim
Figure 29. Observed and simulated outflow for Kindaruma Reservoir.

39
0
500
1000
1500
2000
2500
3000
3500
20
01
/02
_O
bs
20
01
/02
_S
im
20
02
/03
_O
bs
20
02
/03
_S
im
20
03
/04
_O
bs
20
03
/04
_S
im
20
04
/05
_O
bs
20
04
/05
_S
im
Gig
aw
att
-ho
ur
Kiambere
Kindaruma
Gitaru
Kamburu
Masinga
Figure 30. Reported and simulated hydropower generation.
40
WEAP model projections and Scenarios
Framing
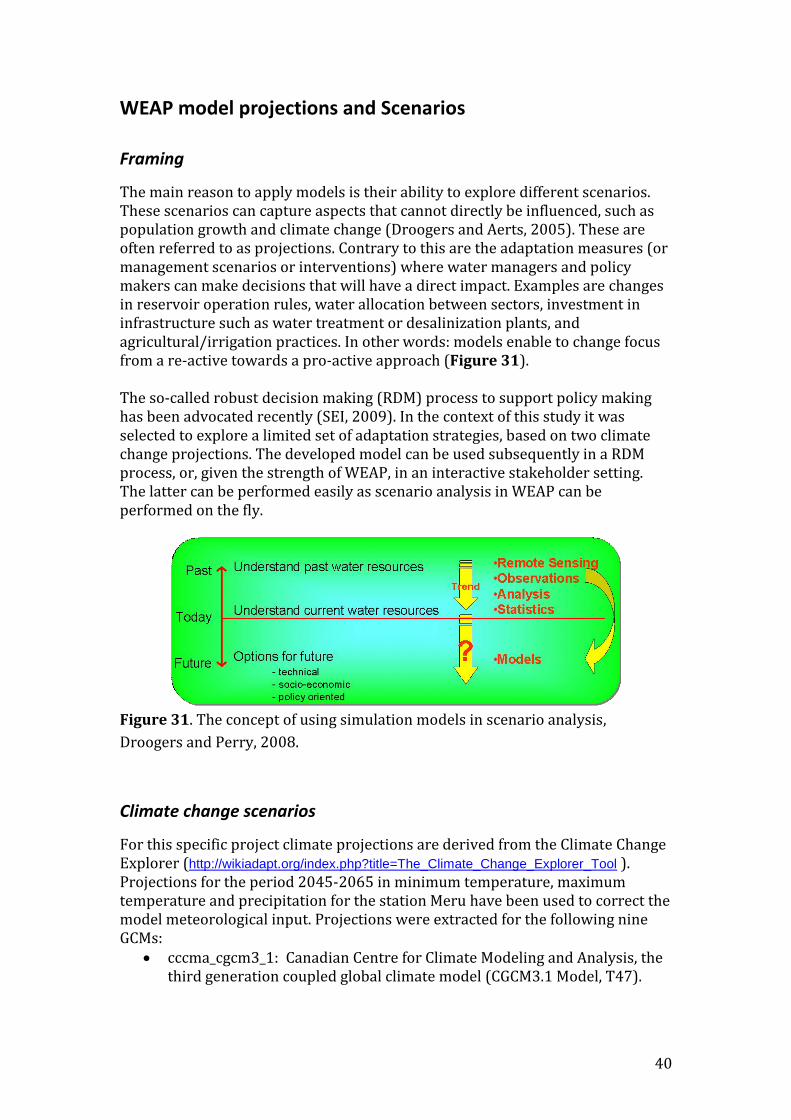
The main reason to apply models is their ability to explore different scenarios. These scenarios can capture aspects that cannot directly be influenced, such as population growth and climate change (Droogers and Aerts, 2005). These are often referred to as projections. Contrary to this are the adaptation measures (or management scenarios or interventions) where water managers and policy makers can make decisions that will have a direct impact. Examples are changes in reservoir operation rules, water allocation between sectors, investment in infrastructure such as water treatment or desalinization plants, and agricultural/irrigation practices. In other words: models enable to change focus from a re-active towards a pro-active approach (Figure 31). The so-called robust decision making (RDM) process to support policy making has been advocated recently (SEI, 2009). In the context of this study it was selected to explore a limited set of adaptation strategies, based on two climate change projections. The developed model can be used subsequently in a RDM process, or, given the strength of WEAP, in an interactive stakeholder setting. The latter can be performed easily as scenario analysis in WEAP can be performed on the fly.
Figure 31. The concept of using simulation models in scenario analysis,
Droogers and Perry, 2008.
Climate change scenarios
For this specific project climate projections are derived from the Climate Change Explorer (http://wikiadapt.org/index.php?title=The_Climate_Change_Explorer_Tool ). Projections for the period 2045-2065 in minimum temperature, maximum temperature and precipitation for the station Meru have been used to correct the model meteorological input. Projections were extracted for the following nine GCMs:
cccma_cgcm3_1: Canadian Centre for Climate Modeling and Analysis, the third generation coupled global climate model (CGCM3.1 Model, T47).
41
cnrm_cm3; Meteo-France, Centre National de Recherches Meteorologiques, the third version of the ocean-atmosphere model (CM3 Model)
csiro_mk3_5; CSIRO Atmospheric Research, Australia, MK3.5 Model gfdl_cm2_0; NOAA Geophysical Fluid Dynamics Laboratory, CM2.0
coupled climate model giss_model_e_r; NASA Goddard Institude for Space Studies, Model
E20/Russell. ipsl_cm4; IPSL/LMD/LSCE, France, CM4V1 Model miub_echo_g; Meteorological Institute of the University of Bonn
(Germany), Institute of KMA (Korea), and Model and Data Group. ECHO-G model
mpi_echam5; Max Planck Institute for Meteorology, Germany, ECHAM5 / MPI OM
mri_cgcm2_3_2a; Meteorological Research Institute, Japan Meteorological Agency, Japan, MRI-CGCM2.3.2a model
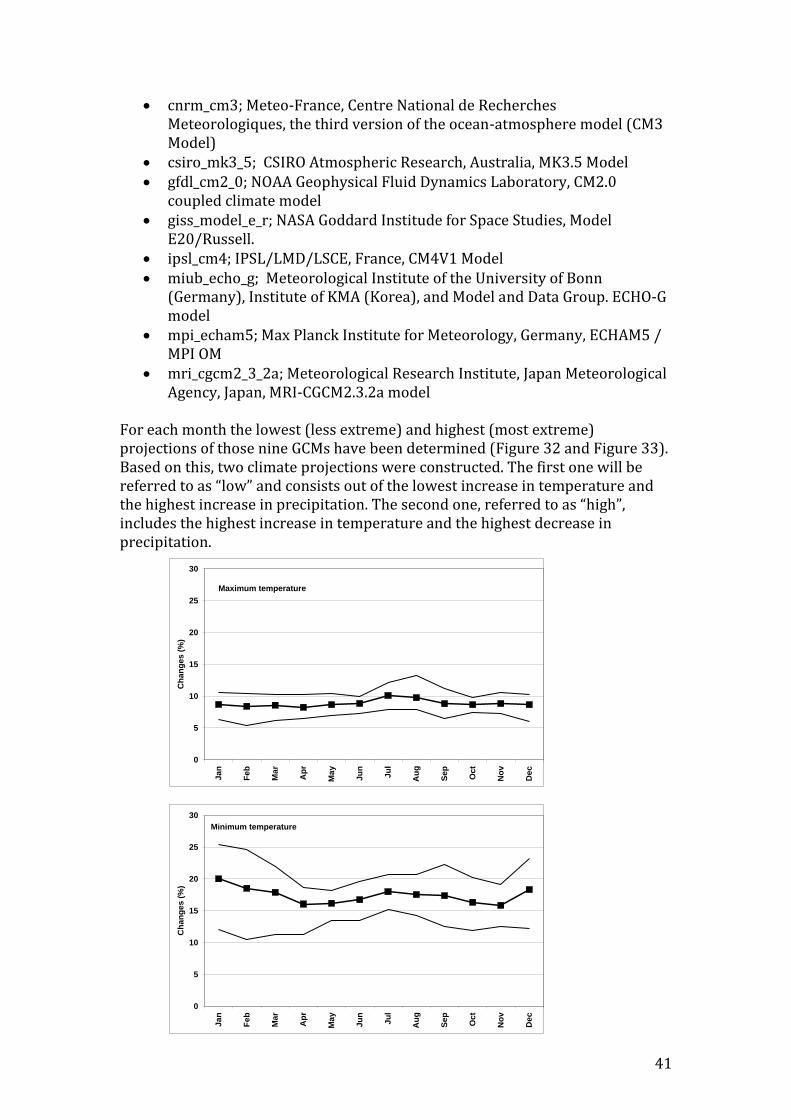
For each month the lowest (less extreme) and highest (most extreme) projections of those nine GCMs have been determined (Figure 32 and Figure 33). Based on this, two climate projections were constructed. The first one will be referred to as “low” and consists out of the lowest increase in temperature and the highest increase in precipitation. The second one, referred to as “high”, includes the highest increase in temperature and the highest decrease in precipitation.
0
5
10
15
20
25
30
Ja
n
Fe
b
Ma
r
Ap
r
Ma
y
Ju
n
Ju
l
Au
g
Se
p
Oc
t
No
v
Dec
Ch
an
ge
s (
%)
Minimum temperature
0
5
10
15
20
25
30
Ja
n
Fe
b
Ma
r
Ap
r
Ma
y
Ju
n
Ju
l
Au
g
Se
p
Oc
t
No
v
Dec
Ch
an
ge
s (
%)
Maximum temperature

42
Figure 32. Projections for temperature for the 2045-2065 (in oC) based on nine
GCMs.
Figure 33. Projections for temperature and precipitation change for 2045-2065
(in %). Lines indicate the minimum, maximum and average changes based on
nine GCMs.
0
5
10
15
20
25
30
Ja
n
Feb
Mar
Ap
r
May
Ju
n
Ju
l
Au
g
Se
p
Oct
No
v
Dec
Tem
pera
ture
(o
C)
Maximum temperature
current
high projection
low projection
0
5
10
15
20
25
30
Jan
Fe
b
Ma
r
Ap
r
Ma
y
Ju
n
Ju
l
Au
g
Sep
Oct
No
v
De
c
Te
mp
era
ture
(o
C)
Minimum temperature
current
high projection
low projection
-50
-25
0
25
50
75
100
125
150
Ja
n
Fe
b
Ma
r
Ap
r
Ma
y
Ju
n
Ju
l
Au
g
Se
p
Oc
t
No
v
Dec
Ch
an
ge
s (
%)
Precipitation
43
Socio/economic scenarios
Besides these changes in climate, the following two projections were included in the model as well for the period around 2050:
Increase in population by 20% Reduction of reservoir capacity by 30% due to siltation
Population growth has been estimated based on the following references:
Population in 2050 will be between 44 million and 80 million, depending on the success of family planning services and HIV/AIDS programs (Porritt, 2008)
Depending on the focus on family planning, the projected population in 2050 will be between 54 million and 83 million (Allbäck, 2009)
Population Keya: 35 million 2005; 65 million 2050 (IDB, 2009) Siltation of reservoirs has been estimated based on:
Loss of reservoir capacity between 2000 and 2030: 20% (Hoff et al., 2007)
Adaptation strategies
A coherent set of four adaptation strategies have been defined to be evaluated in line with the above adaptation signature approach:
1) Demand-side management: e.g. improved irrigation and other end-use efficiency improvements across demand nodes
2) Supply-side management: e.g. application of water harvesting technologies to mitigate over-abstraction, or perhaps "harder" options such as reservoir construction.
3) Ecosystem protection: e.g. sustainable land management (SLM) interventions in upstream agriculture to reduce soil erosion and dam siltation, improve electricity production efficiency, etc.
4) "Full sectoral protection": Implementing all of the above activities in the basin.
Within WEAP these scenarios are implemented in the model by the following parameters: 1) Demand-side management is implemented by:
Improved irrigation is implemented in the model by changing the crop coefficient Kc for irrigation from 1.3 to 1.1. This implies a reduction in water requirements while maintaining the same crop yield. In practice this can be achieved by a reduction in non-beneficial soil and open water evaporation and/or changing to improved crop varieties.
Improved urban water consumption by reducing the water supply from 14 m3 per capita per year to 10 m3 and by increasing the consumption from 30% to 40%.
2) Supply-side management is implemented by:
Assuming a higher water storage capacity. In the model this is achieved by assuming an increase in storage capacity of the reservoirs by 50%. In

44
practice this can be achieved by a set of measures including constructing additional reservoirs (Four Lakes), improved management of groundwater resources, and/or expanding current reservoir storage capacity.
3) Ecosystem protection is implemented by:
Erosion control so that siltation of reservoirs will be reduced from the current 30% in 2050 to only 10%. In practice this can be achieved by various sets of interventions such as mulching, contour tillage, terracing, contour strips and ridges.
Improved rainfed agriculture by increasing the effective use of precipitation from 65% to 75% and at the same time reduce non-beneficial evaporation by changing the crop coefficient Kc from 0.9 to 0.8. This implies a reduction in water requirements while maintaining the same crop yield. In practice this can be achieved by a reduction in non-beneficial soil and open water evaporation and/or changing to improved crop varieties.
4) Full adaptation is implemented by:
The combination of the previous three adaptation strategies. Figure 34 shows how these two projections and the four adaptation strategies are included in the WEAP model.
Figure 34. Management of scenarios in WEAP.

45
WEAP Tana Results
Introduction
The model as developed and presented in Chapter 2 and the projections and adaptation strategies as described in Chapter 3 will result in the following eleven cases:
1. Current, the situation as described by the years 2001-2005 2. Impact low and no adaptation. Lowest projected increase in temperature
and highest projected increase in precipitation. This is described for a five years period around year 2050.
3. Impact high and no adaptation. Highest projected increase in temperature and highest projected decrease in precipitation. This is described for a five years period around year 2050.
4. Demand-side adaptation for CClow 5. Supply-side adaptation for CClow 6. Ecosystem adaptation for CClow 7. Full adaptation for CClow 8. Demand-side adaptation for CChigh 9. Supply-side adaptation for CChigh 10. Ecosystem adaptation for CChigh 11. Full adaptation for CChigh
Each of these 11 sets was evaluated using a five years period to ensure that natural changes in year-to-year weather conditions are also included. Also, an initial year was simulated before this period of five years to ensure that initial conditions are realistic. This approach is often referred to as a “warming-up” year for the model. For the current situation actual conditions of the years 2001 to 2005 were used. For the climate change projections these five years were used again, but now altered using the projections as described in the previous chapter. In order to evaluate the impact of these projections and adaptation measures a set of indicators have been defined:
Hydropower generation Irrigation water shortage Rainfed agriculture shortage Urban water shortage
Output capabilities of the WEAP model are virtually unlimited. Output can be provided as graphs, tables and maps. In this report only some of the key output components of the model will be shown, while the model itself is available to undertake a more in-depth exploration.
Impact of Climate Change
The projected changes in climate, population and siltation of reservoirs are imposed on the model, assuming no adaptation will take place. A first rough

46
estimate of the financial consequences has been made as well, based on the following assumptions:
Changes in hydropower generation using a fixed revenue price of US$0.04 per kWh (KenGen, 2009)
Costs of unmet urban water supply at a fixed price of US$ 0.25 per m3. (Costs vary between 0.19 and 0.44 US$ / m3; Porras, 2001))
Costs of unmet irrigation water supply at a fixed price of US$ 0.10 per m3. (Average water productivity; Zwart. 2004).
Some important outputs of the impact of climate change are presented here for the low projection and the high projection bullet-wise:
Water demand, defined as the total water that should be abstracted from a source, will increase between 15% and 28% for the low and high projection, respectively. In the current situation water demand is on average 684 MCM per year, for the low and high projection this will be 781 and 873 MCM.
The major water demander is the irrigation sector, while urban demand is relatively low in comparison (Figure 35).
Total demand from natural surfaces (evapotranspiration) is substantially higher compared to the need for domestic and irrigation (Figure 36). This total demand will increase by 11% to 22% for the low and high projection, respectively.
Average hydropower generation will reduce substantially from 2,253 Gigawatt-Hour per year to levels between 1763 and 2144 GWhr / yr (Figure 37).
Average revenues from hydropower electricity are currently US$ 90 million per year. Under climate change this will reduce to revenues between US$86 and US$71 million for the low and high projection, respectively. In percentages this translates to a reduction between 5 and 22% (Figure 38).
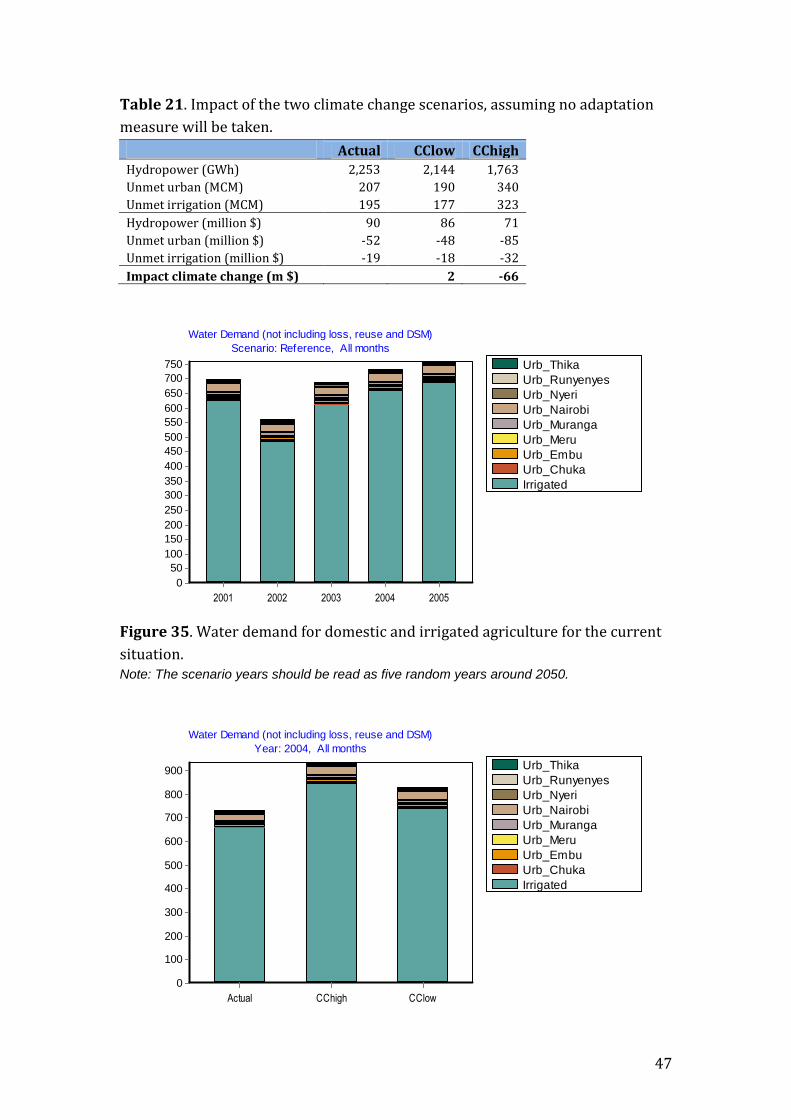
The overall impact of the two climate change projections using the performance indicators is presented in Table 21. For the low projection (= lowest increase in temperature and highest increase in precipitation) climate change will have a modest positive impact. Unmet demand for urban and irrigation is somewhat lower and hydropower generation is only slightly lower, leading to a small positive impact at an overall value of about US$ 2 million. However, the high projection is having a very negative impact with increasing water shortages for urban and irrigation and a substantial loss in hydropower.
47
Table 21. Impact of the two climate change scenarios, assuming no adaptation
measure will be taken.
Actual CClow CChigh
Hydropower (GWh) 2,253 2,144 1,763
Unmet urban (MCM) 207 190 340
Unmet irrigation (MCM) 195 177 323
Hydropower (million $) 90 86 71
Unmet urban (million $) -52 -48 -85
Unmet irrigation (million $) -19 -18 -32
Impact climate change (m $) 2 -66
Urb_Thika
Urb_Runyenyes
Urb_Nyeri
Urb_Nairobi
Urb_Muranga
Urb_Meru
Urb_Embu
Urb_Chuka
Irrigated
Water Demand (not including loss, reuse and DSM)
Scenario: Reference, All months
2001 2002 2003 2004 2005
Millio
n C
ubic
Mete
r
750
700
650
600
550
500
450
400
350
300
250
200
150
100
50
0
Figure 35. Water demand for domestic and irrigated agriculture for the current
situation. Note: The scenario years should be read as five random years around 2050.
Urb_Thika
Urb_Runyenyes
Urb_Nyeri
Urb_Nairobi
Urb_Muranga
Urb_Meru
Urb_Embu
Urb_Chuka
Irrigated
Water Demand (not including loss, reuse and DSM)
Year: 2004, All months
Actual CChigh CClow
Millio
n C
ubic
Mete
r
900
800
700
600
500
400
300
200
100
0

48
Figure 36. Changes in water demand for domestic and irrigated agriculture for
the current situation and the two projections around 2050.
Note: Figure is based on data for one representative year (2004).
Water
Tea
Rangeland
Irrigated
Forest
Coffee
AgrRainfed
ETPotential
Year: 2004, All months
Actual CChigh CClow
Millio
n C
ubic
Mete
r
22,000
20,000
18,000
16,000
14,000
12,000
10,000
8,000
6,000
4,000
2,000
0
Figure 37. Water demand for land for the current situation and the two
projections around 2050.
Note: Figure is based on data for one representative year (2004).
Masinga
Kindaruma
Kiambere
Kamburu
Gitaru
Hydropow er Generation
Year: 2004, All months
Actual CChigh CClow
Gig
aw
att-H
our
2,200
2,000
1,800
1,600
1,400
1,200
1,000
800
600
400
200
0
Figure 38. Hydropower generation for the current situation and the two
projections around 2050.
Note: Figure is based on data for one representative year (2004).

49
Adaptation cost estimates
A rough estimate of costs of the various adaptation measures has been made. An overview is shown in Table 22. This table was created based on the following assumptions (Dent and Kauffman, 2007):
Costs of improving the irrigated agriculture (such as reduction of non-beneficial soil evaporation, changing to improved crop varieties, farmer education) is roughly estimated at US$ 500 per ha.
Improving urban water supply is estimated at US$ 10 per capita. Costs of expanding water storage by constructing new reservoirs are
difficult to estimate. In general, investment costs are between US$ 1 million and US$ 5 million per MCM, although this is very location specific. Desiltation of reservoirs might be a factor 10 to 20 cheaper. For this specific study we assume a mixture of new reservoirs and desiltation with average costs of US$ 0.5 million per MCM.
Erosion control is estimated to cost about US$ 50 per ha.
Table 22. Estimated costs of adaptation strategies.
mUS$ mUS$
Adaptation costs Unit Unit
costs Total Years Per
year
Irrigation 71,295 ha 500 35.6 10 3.6
Urban 2.10E+06 capita 10 21.0 10 2.1
Supply 1,167 MCM 500,000 583.5 30 19.5
Erosion control 677,455 ha 50 33.9 10 3.4
Total costs 28.6
Total costs of implementing all options over the first ten-year period would cost
US $28.6 million for the basin.
Performance of adaptation options
The previous sections describe the impact of the two climate change projections for the period around the year 2050. Based on the analysis it was concluded that the lowest projection has an overall small positive impact and the highest projection a substantial negative impact. Policy makers are now confronted whether and which adaptation measures should be considered. One could argue that since the low climate change projection has no negative impact adaptation measures are not required. However, since the low projection provides additional opportunities (more rainfall) it would nevertheless be interesting to explore adaptation strategies as well to see how this additional water can be fully exploited. As typical output of WEAP hydropower generation is plotted in Figure 39 and Figure 40, for the low and the high climate change projection, respectively. For the low projection, slightly less electricity is produced under climate change. Although rainfall is higher, evapotranspiration is even higher, leading to a slightly lower inflow into the reservoirs. However, two adaptation strategies,

50
supply-side and full adaptation, can generate even more electricity compared to the current situation. For the more extreme climate change projection, impact on generated hydropower is severe and electricity production is expected to reduce substantially (Figure 40). Appropriate adaptation strategies might overcome this negative impact. However, adaptation strategies have a cost and the main question is whether adaptation should be considered. Table 23 summarizes the impact of the four adaptation strategies (compared to the no adaptation in the first column) and costs associated to implement the given adaptation. Implementation of, for example, the demand-side adaptation will have a positive impact of about US$ 17 million. Costs of implementing this adaptation are estimated at about US$ 6 million, so one could conclude that this adaptation strategy is feasible to implement. Costs of the other three adaptation strategies are higher than the expected benefits and are therefore not recommended. However, non-economic considerations such as for example poverty alleviation and ecosystem services, that may justify implementation of these adaptation strategies. If we consider the high climate change projection (Table 24), all four adaptation strategies are cost effective, e.g. the adaptation costs are lower than benefits after implementing the adaptation. The demand-side and the full adaptation strategies are particularly interesting options to consider. Based on these results, policy makers are confronted with uncertainty in the climate change projections and therefore in actions to be taken. In fact one could follow two approaches. The first one, referred to as “no-regret” approach, makes it clear that demand-side adaptation strategies are always attractive even if climate change will develop along the least extreme projections. On the other hand, if climate change will be more severe, negative impact will be substantial and one could argue that all possible measures should be implemented to reverse this trend.
Table 23. Four adaptation strategies imposed on the low climate change
projection.
CClow Deman
d Supply Ecosyste
m Full
Hydropower (GWh) 2,144 2,179 2,319 2,237 2,334
Unmet urban (MCM) 190 146 190 200 154
Unmet irrigation (MCM) 177 136 177 185 143
Hydropower (million $) 86 87 93 89 93
Unmet urban (million $) -48 -36 -48 -50 -38
Unmet irrigation (million $) -18 -14 -18 -19 -14
Impact adaptation (m $) 17 7 0 20
Adaptation costs (m $) -6 -19 -3 -29
Benefits of adaptation (m $) 11 -12 -3 -9

51
Table 24. Four adaptation strategies imposed on the high climate change
projection.
CChigh Deman
d Supply Ecosyste
m Full
Hydropower (GWh) 1,763 1,843 2,197 1,935 2,231
Unmet urban (MCM) 340 248 297 328 238
Unmet irrigation (MCM) 323 237 280 310 225
Hydropower (million $) 71 74 88 77 89
Unmet urban (million $) -85 -62 -74 -82 -59
Unmet irrigation (million $) -32 -24 -28 -31 -23
Impact adaptation (m $) 35 32 11 54
Adaptation costs (m $) -6 -19 -3 -29
Benefits of adaptation (m $) 29 13 8 25
Masinga
Kindaruma
Kiambere
Kamburu
Gitaru
Hydropow er Generation
Year: 2004, All months
Actual CClow EcoAdapt_low Supply Adapt_low
Gig
aw
att-H
our
2,200
2,000
1,800
1,600
1,400
1,200
1,000
800
600
400
200
0
Actu
al
CC
Dem
and
Ecosyste
m
Full
Supply
Figure 39. Hydropower generation for the current situation and the low climate
change projections as well as the four adaptation strategies.
Note: Figure is based on data for one representative year (2004).

52
Masinga
Kindaruma
Kiambere
Kamburu
Gitaru
Hydropow er Generation
Year: 2004, All months
Actual CChigh EcoAdapt_high Supply Adapt_high
Gig
aw
att-H
our
2,200
2,000
1,800
1,600
1,400
1,200
1,000
800
600
400
200
0
Actu
al
CC
De
ma
nd
Eco
syste
m
Fu
ll
Su
pp
ly
Figure 40. Hydropower generation for the current situation and the high climate
change projections as well as the four adaptation strategies.
Note: Figure is based on data for one representative year (2004).
Case study conclusions and recommendations
The overall objective of the case study was to undertake a rapid assessment of the impact of climate change on hydropower generation in Tana basin in Kenya using the adaptation signature and WEAP modeling approach. In the context of this study, a limited set of two climate change projections and four adaptation strategies were evaluated, leading to a total of 11 combinations to be evaluated and compared. The developed approach can be used subsequently in a RDM (robust decision making) process, or, given the strength of WEAP, in an interactive stakeholder setting. The approach applied here to use a minimum and maximum climate change projection, provide decision makers with a range of options on which policies might be developed. Analysis shows that the impact of climate change without any adaptation strategies ranges from a positive US$ 2 million to a cost of US$ 66 million for the hydropower, irrigation and drinking water sector. Taking into account the costs and benefits of adaptation strategies, the so-called “demand-side” measures are always positive ranging from US$ 11 million to US$ 29 million for the low and high climate projection, respectively. Supply-side and ecosystem adaptations are only profitable if the climate will evolve in the direction of the high projection. The study as presented can be further refined:

53
The WEAP model is developed as a scenario-based interactive tool. In a stakeholder setting additional adaptation strategies and/or refined assumptions can be discussed.
The following refinement in the model itself can be considered: (i) inclusion of groundwater, (ii) profits from rain-fed agriculture, (iii) profits from grasslands and forests, (iv) inclusion of livestock water requirements and (v) policy scenarios simulating managed flood events for downstream water users.
Results presented here reflect the situation around the year 2050, using the natural variation in climate of five years. This could be expanded to 30 years to be able to provide confidence intervals on the results.
WEAP results in current planning context Under the structure of Kenya’s reformed water sector, 7 regional Water Services Boards are responsible for ensuring the efficient and economical provision of water and sewage services (Kenya SIP, 2009). Based on current budget plans, average funding levels for the Tana WSB between 2009 and 2012 are an estimated USD $20.9 million. Compared to the $29 million estimated cost of full adaptation programs under the Tana WEAP analysis, two conclusions are possible: 1) funding outside of the GoK will be necessary to realize the annual investments needed for adaptation 2) under a range of low and high climate scenarios, at least $29 million of the projected benefits ($20-$54 million) would be required to break even on the investments, regardless of investment entity. Note, this is a highly uncertain cost benefit analysis and should be treated as indicative or illustrative at best. Table 25. Kenya’s water sector budget. Tana Water Services Board Funding (USD$ mill)
Printed 2008/9 2009/10 Estimates
2010/11 Estimates
2011/12 Estimates
5.7 20.2 20.9 21.6
Source: 2007/8 -2010/11, from WSTG Budget Analysis, 2009. To put the Tana WEAP results in further budgetary context, results were compared to available investment and revenue projections for the Tana WSB from Kenya’s SIP analysis. In line with the Tana WSP investment plans to increase water supply and sewage systems, projected annual investments for new and rehabilitated urban and rural water systems were assessed for the years 2008, 2012, 2015, and 2030. Data for projected urban and rural revenues were also available and interpreted as user investment contributions. Estimated GoK and development partner investments were derived from proportions estimated at the national level of 16% and 13%, respectively (Kenya SIP, 2009). Based on these assumptions, Table 26 presents the anticipated contributions of the three investment entities, as well as the total expected investment shortfall.

54
Table 26. Projected annual investment needs and contributions by investment entity. Annual investment unit
2008 2012 2015 2030
New urban water systems
572,951 786,143 1.2 892,738
New rural water systems (public + users)
16.3 26.1 33.6 18.9
Rehabilitation of urban water systems
1.4 1.4 1.5 1.2
Rehabilitation of rural water systems
16.9 17.4 18.9 19.6
Rural revenues 3.1 5.4 8.2 19.3 Rural O&M costs 9.3 13.8 17.6 29.1 Urban revenues 75 (US$ 999,334) 134 (US$1.8 mill) 207 (US$ 2.8 mill) 471 (US$ 6.3 mill) Urban O&M costs 176 (US$ 2.4 mill) 206 (US$ 2.8 mill) 240 (US$ 3.8 mill) 382 (US$ 5.1 mill)
Total 46.9 62.3 76.6 74.8 Investor contributions
GoK DP Users GoK DP Users GoK DP Users GoK DP Users
New and rehabilitated water systems (rural/urban) + O&M
7.5 6.1 4.1 10 8.1 7.2 12.3 10 11 12 9.7 25.6
Grand total 17.7 25.3 33.3 47.3 Total investment shortfall
-32.2 -37 -43.3 -27.5
The cumulative investment needs by 2030 for these developments is US$ 260.6 million while projected available funding is USD$ 140 million, representing an overall financing gap of 53%. From these results, it is clear that even after initial capital investments, operating ratios (O&M/revenue) for the Tana WSB will be over 100% from now until 2030 if all of the envisaged rural and urban investments in new supplies and rehabilitation are to be realized. Moreover, there is a large projected deficit in finance needs to meet existing development targets, let alone additional climate adaptation investments. In line with the evidence from the Tana WEAP model, and the net positive benefits from demand and supply-side investments and ecosystem protection, there is a strong argument that some form of adaptation financing should be used to supplement these development plans. Consideration might be given to financing to achieve breakeven costs for current development plans such as those of the Tana WSB, with additional financing to cover adaptation investments deemed appropriate by regional stakeholders.
National scaling A simple scaling procedure was carried to obtain course estimates for costs for the selected adaptation options at a national scale. This involved multiplying the costs of adaptation options for the Tana Basin by five to represent Kenya’s five catchment basins (Table 27). Given the impacts of adaptation measures for the

55
Tana Basin were highly specific to hydroelectricity production, scaling adaptation impacts and calculating benefits was not appropriate. Table 27. Adaptation options scaled to national level (USD$ mill/year) Scale Demand-
side Supply-side Ecosystem
protection Full adaptation
Tana Basin 6 19 3 29 National 30 95 15 145
While it is recommendable that a more rigorous analysis be carried out, results indicate that the full range of adaptation options would cost an estimated USD$ 145 million if implemented nationally. However, since this estimate fails to capture the diversity of basin contexts and management issues, it should be considered illustrative and interpreted with caution.

56
Study conclusions and recommendations Kenyans are heavily invested in their future. By 2030, the country endeavors to achieve growth rates of 10% per year and middle-income development status (Vision 2030). The future of water resources will greatly influence the success of these development ambitions. Plagued by water stress and extreme events, uncertain future manifestations of climate change have the potential to greatly destabilize an already fragile sector, and jeopardize development progress. As the 2009 drought has proven, current climate risks (attributable to climate change or not) are having devastating impacts on the livelihoods and well being of Kenyans (Oxfam, 2009). These impacts alone, and in the face of increased future risks, justify immediate action and support for adaptation.
Synthesizing multiple lines of evidence
Multiple lines of evidence were drawn from to determine to economic costs of climate adaptation for Kenya’s water sector. Based on available data and knowledge to date, “bottom-up and “top-down” analyses were conducted in order to compare results and discuss their policy relevance to climate adaptation funding. Figure 41 presents a summary of findings. Categories of results include annualized percentage of GDP costs of water resource degradation, climate variability and change (across sectors), projected available funding for sectoral investment, investment shortfall and range of climate adaptation costs.
Figure 41. Synthesis of resource degradation and climate related costs, projected water sector investment, and current sectoral and adaptation investment shortfalls. Background diagram of GDP and population growth rates (World Bank, 2006). Notes: Current water resource degradation >1% GDP, World Bank, 2006; Current climate variability cost is 2.4% of GDP (World Bank, 2006); Costs of climate change across all sectors (3-5%, SEI, 2009); Future water development costs US$ 1.3 billion/ year projected available funding

57
(Kenya SIP, 2009), representing 7% of GDP ($18.2 bill in constant 2001 dollars in 2008) from all investment entities; Development investment shortfall for water sector 1.5% GDP ($US 264 mill) (Kenya SIP, 2009); Adaptation investment needs for water sector 0.7%-6.4% (USD$ 120-1,156 mill/yr, IIED/Granthum/SEI, 2009), nationally scaled estimate of water sector adaptation costs based on Tana WEAP analysis (USD$ 145 million or 0.8% GDP).
Combined with the anticipated water sector investment shortfall (1.5% GDP), projected adaptation and unmet development needs could reach as high as 7.9% of GDP. The addition of these costs more than double anticipated sectoral investments of 7% across all public and private investment entities. Presuming that there is substantial overlap in what might be classified as a development versus climate adaptation investment, the range of costs of additional climate adaptation and current development investment needs is estimated between 9.2 and 14.9% GDP per year. Compounding these development and adaptation costs are the costs of current resource degradation (>1% GDP), climate variability (2.4% GDP) and future climate change (3-5% by 2030). By 2030, these costs could reach as high as 8.4% of GDP per year to the whole of the Kenyan economy.
Management challenges
Availability of development funds and corresponding ability to meet development targets is one of the greatest challenges facing water resource managers in Kenya. Financial resources determine the extent to which institutional capacity can be increased, capital investments made, and outreach, research and monitoring carried out. In addition, the ability of resource managers to raise adequate revenues through user fees and other investment contributions make planning decisions difficult. At the core of Kenya’s new water sector development plans is community ownership and engagement, e.g. through Water User Associations. This is reflected in the Sectoral Investment plan in which user fees and investments are anticipated to provide 57% of funds for development funds, with public sources supplying the majority of the balance. As circumstances become increasingly challenging under economic and political tribulations, recurrent climate threats in the form of extremes and changing seasonal patterns, reliability of available funds across public and private investment entities becomes more uncertain. An additional management challenge is the geographic distribution of Kenya’s surface and groundwater resources among the five drainage basins, which cross political boundaries delineated by WSBs and other service entities (Figure 42).

58
Figure 42. Differing political and geographic boundaries for water sector regulation, Kenya SIP, 2006 and Kenya State of the Environment, 2006/7. Alongside Kenya’s naturally low water resource endowment and growing population, resource managers and water users alike face considerable obstacles in progressing long-term, sustainable water resources development.
Conclusions:
Adaptation as a PROCESS: Climate adaptation is a process of socio-institutional learning involving a broad range of actors, strategies and actions that must be iterative and responsive as conditions change.
Value of adaptation ECONOMICS for decision making: Adaptation economics is a field in very early stages of development. The current state of knowledge allows for outputs that provide informative, but highly aggregated, results. While such outputs are of potential value to adaptation funding discussions at the global level, at present they are of marginal value to on-the-ground water resource decision makers and should be interpreted with caution.

59
Recommendations:
ADDITIONALITY and the value of development plans and investment strategies: Development targets and continued development of investment strategies are invaluable for helping clarify possible adaptation investment needs (SIP, flagship projects). Such work is particularly useful as the “additionality” of adaptation to development will likely play an important role in future adaptation finance allocation decisions.
Focus on CLIMATE RESILIENT development strategies: Uncertainty surrounding climate and development futures, and the urgency of current development investments, underscores the need to focus present adaptation investments on current climate risks already constraining sustainable development. In the water sector, this is particularly the case for investments in supply and demand-side management, sanitation and ecosystem protection.
Cross-sectoral and transboundary COOPERATION in water
adaptation investment planning: Climate change impacts cross sectoral, spatial and temporal boundaries, requiring strong sectoral cooperation to implement adaptation strategies. Intra- and inter-basin, and transboundary water issues greatly affect water access and related conflicts in Kenya, particularly ASAL and Lake Victoria regions. This highlights the need for close cooperation and stakeholder engagement on water issues (e.g. balancing irrigation and hydroelectricity needs). Kenya’s recent National Climate Change Response Strategy (NCCS) regional consultation process and the “Shared Vision” under the Nile Basin Initiative exemplify such efforts.
Dedicated ADAPTATION INSTITUTIONS: Given the inter-disciplinary
and multi-scale capacities needed for coordinating water sector adaptation strategies and actions, consideration should be given to the formation of dedicated adaptation institutions within the public sector. For example, within an “Adaptation Facility” framework, knowledge sharing among regional field centers would support regional water, energy, and agricultural/pastoral regulators, service providers, and households.
PILOT ACTIONS, MONITORING and adaptation effectiveness:
Strategic planning requires a strong evidence base in order to achieve robust and effective outcomes. Extensive experimentation with a range of adaptation intervention types and improved hydrometric and meteorological monitoring systems will help determine which interventions should be prioritized and up-scaled in specific contexts. For example, actions to support or monitor the effectiveness of sustainable hydroelectric output in the Tana region might be inappropriate or less effective in other basin contexts. This emphasizes the need for substantial

60
‘learning by doing’ and stakeholder engagement in the adaptation planning process.
SCENARIO-based adaptation planning: Deeply uncertain determinants
of climate and development futures (e.g. future water demand) suggest the need of scenario-based techniques for long-term water resource planning. Positive developments in this direction are being seen under current sectoral plans but further work incorporating variable climate futures appears necessary.

61
References: Allbäck, R. 2009. THE WORLD IN 2050: A Scientific Investigation of the Impact of Global Population Growth on a Divided Planet. http://www.populationmedia.org/2009/07/16/ The Atlas of Kenya’s Changing Environment (2009), Government of Kenya, 2009 CCE (2009), climate change projections, Climate Systems Analysis Group (CSAG) and the Stockholm Environment Institute (SEI) Oxford Office, Climate Change Explorer (CCE), 2009 Dent, D.L., S. Kauffman (2007), The spark has jumped the gap. Green Water Credits proof of concept. Green Water Credits Report 4. ISRIC – World Soil Information, Wageningen Droogers et al. (2006), Green and blue water services in the Tana River Basin, Kenya: exploring options usinga an integreated modeling framework, FutureWater Report 54, 2006 Droogers P., Perry, C. (2008), Scenario based water resources model to support policy making, FutureWater Report 79, 2008 Droogers, P., A. Van Loon, W. Immerzeel (2008), Quantifying the impact of model inaccuracy in climate change impact assessment studies using an agro- hydrological model. Hydrology and Earth System Sciences 12: 1-10. Droogers , P., Butterfield, R., and Dyszynski, J. (2009), Climate change and hydropower, impact and adaptation costs: case study Kenya, The Economics of Climate Change in Kenya project document, September 2009 Hoff, H., S. Noel, P. Droogers (2007), Quantifying water usage and demand in the Tana River basin: an analysis using the Water and Evaluation Planning Tool (WEAP). Green Water Credits Report 4. ISRIC – World Soil Information, Wageningen. IDB (2009), United states Census Bureau - International Data Base (IDB), Data extracted from WikiPedia: http://en.wikipedia.org/wiki/ List_of_countries_by_past_and_future_population KenGen (2009), Kenya Electricity Generating Company. http://www.kengen.co.ke/ Kenya SIP (2009), Sector investment plan for the water and sanitation sector in Kenya, Ministry of Water and Irrigation, February 2009 NCCRS (2009), National Climate Change Response Strategy, Government of Kenya, 2009

62
NWDR (2006), Kenya National Water Development Report, prepared for the 2nd UN World Water Development Report, ‘Water: A shared responsibility’, 2006 ERS (2005), Investment Programme The Economic Recovery Strategy for Wealth and Employment Creation 2003-2007, Government of Kenya, 2005 MDG (2000), United Nations Millennium Development Goals, http://www.un.org/millenniumgoals/ MTEF (2009), Medium Term Expenditure Framework, 2009/10 – 2011/12, Report for the Environment, Water and Sanitation Sector National Water Master Plan (1992), cited in NWDR (2006), Kenya National Water Development Report, prepared for the 2nd UN World Water Development Report, ‘Water: A shared responsibility’, 2006 Nile Basin Initiative Shared Vision, http://svpcp.nilebasin.org/ Oxfam (2009), Oxfam in Action: East Africa drought and food crisis http://www.oxfam.org.uk/oxfam_in_action/emergencies/east_africa.html Porras, I.T., J. Thompson, J. Tumwine, M.R. Mujwahuzi, M. Katui-Katua. 2001. The cost of water for domestic use in east africa: thirty years of change. In AWRA conference 2001. http://www.awra.org/proceedings/dundee01/Documents/Porras.pdf Porritt, J., (2008). http://www.jonathonporritt.com/pages/2008/06/population.html SEI (2009), The Economics of Climate Change in Kenya, the Stockholm Environment Institute (SEI) Oxford Office, 2009 SEI, (2005), WEAP water evaluation and planning system, Tutorial, Stockholm Environmental Institute, Boston Center, Tellus Institute. The State of the Environment Report (2006/7), Government of Kenya, 2006/7 Summary of IIED/Grantham findings (2009) on the UNFCCC (2007) assessment, in SEI, 2009 UNDP (2009), Methodology guidebook for the assessment of investment and financial flows to address climate change, Version 1.0, United Nations Development Programme (UNDP), March 2009 Vision 2030 (2008), Kenyan Vision 2030 Medium-Term Development Plan 2008-2012, Government of Kenya, 2008 World Bank (2006), Climate variability and water resources degradation in Kenya: improving water resources development and management, World Bank Working Paper No. 69, 2006
63
WSTG (2009), Water and Sanitation Technical Group, Budget analysis 2008/9 – 2009/10, WSTG meeting 9th September 2009 Zwart, S.J., W.G.M. Bastiaanssen (2004), Review of measured crop water productivity values for irrigated wheat, rice, cotton and maize, Agr. Water Management 69: 115-133