CLIMATE ACTION PLAN - Burlington, Vermont Action Plan.pdfThe City of Burlington has identified five...
25
Page BURLINGTON, VT CLIMATE ACTION PLAN
Transcript of CLIMATE ACTION PLAN - Burlington, Vermont Action Plan.pdfThe City of Burlington has identified five...
Page
BURLINGTON, VT
CLIMATE ACTION PLAN
Page 2
TABLE OF CONTENTS
WHY WE CARE?.................................................4
IMPACTS OF CLIMATE CHANGE ON VERMONT AND
BURLINGTON………….……………………………………5
CLIMATE AND EQUITY………………………………..6
WHERE ARE WE NOW? GOVERNMENT OPERATIONS…………………………………7
AIRPORT………………………………………………………. 8
COMMUNITY EMISSIONS…………………………………….. 9
WHERE ARE WE GOING?...................................10
HOW CAN WE REDUCE OUR EMISSIONS?.............11
MOVING FORWARD…………………………………..20
OUR STRATEGIES IN DETAIL…………………….…………21
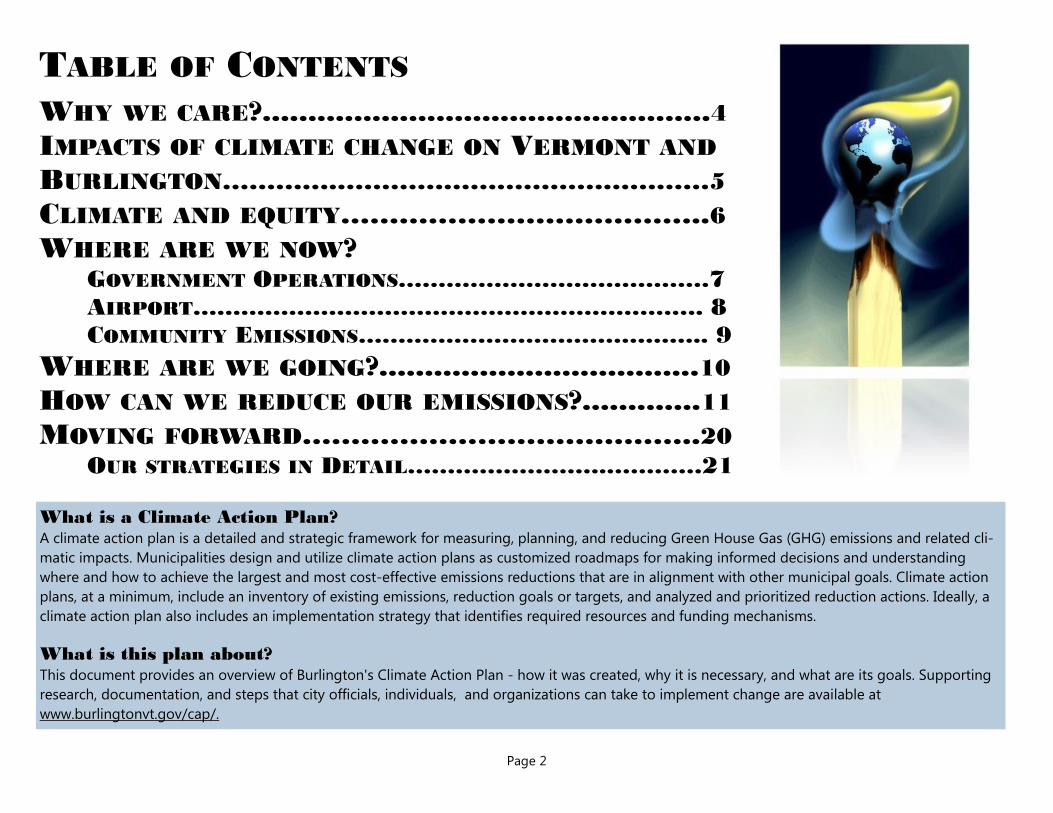
What is a Climate Action Plan? A climate action plan is a detailed and strategic framework for measuring, planning, and reducing Green House Gas (GHG) emissions and related cli-
matic impacts. Municipalities design and utilize climate action plans as customized roadmaps for making informed decisions and understanding
where and how to achieve the largest and most cost-effective emissions reductions that are in alignment with other municipal goals. Climate action
plans, at a minimum, include an inventory of existing emissions, reduction goals or targets, and analyzed and prioritized reduction actions. Ideally, a
climate action plan also includes an implementation strategy that identifies required resources and funding mechanisms.
What is this plan about? This document provides an overview of Burlington's Climate Action Plan - how it was created, why it is necessary, and what are its goals. Supporting
research, documentation, and steps that city officials, individuals, and organizations can take to implement change are available at
www.burlingtonvt.gov/cap/.
Page 3
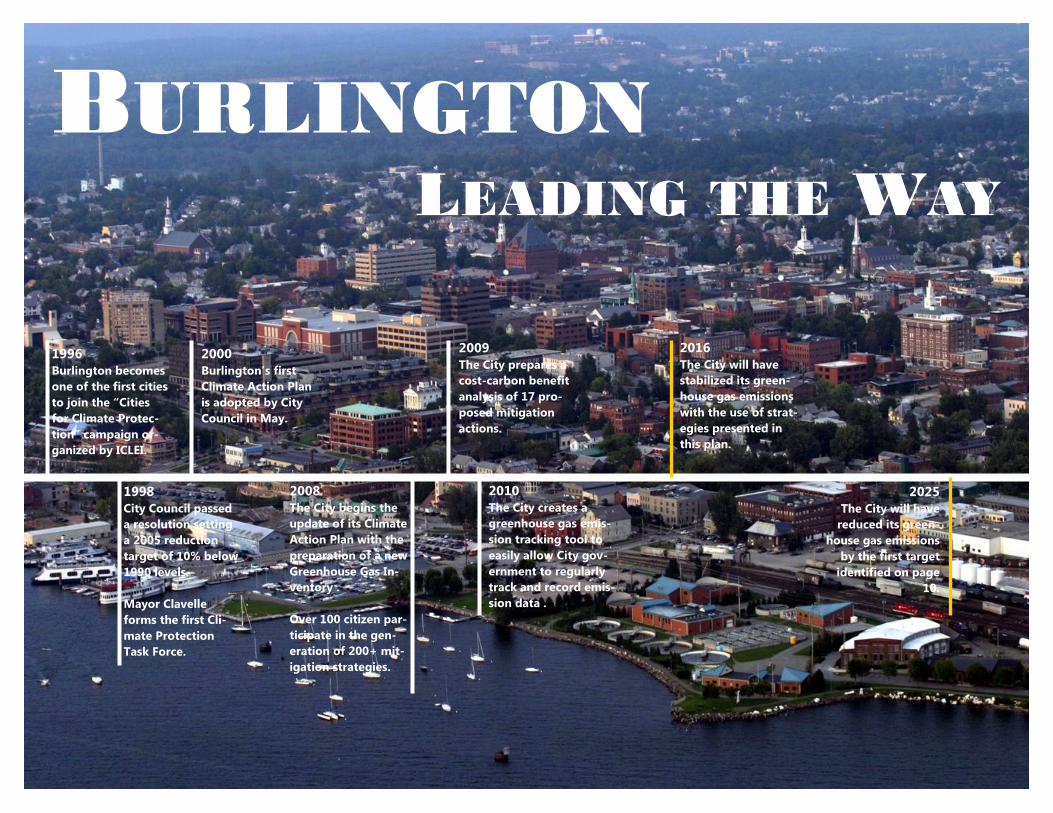
BURLINGTON LEADING THE WAY
1996
Burlington becomes
one of the first cities
to join the “Cities
for Climate Protec-
tion” campaign or-
ganized by ICLEI.
1998
City Council passed
a resolution setting
a 2005 reduction
target of 10% below
1990 levels.
Mayor Clavelle
forms the first Cli-
mate Protection
Task Force.
2000
Burlington’s first
Climate Action Plan
is adopted by City
Council in May.
2008
The City begins the
update of its Climate
Action Plan with the
preparation of a new
Greenhouse Gas In-
ventory .
Over 100 citizen par-
ticipate in the gen-
eration of 200+ mit-
igation strategies.
2009
The City prepares a
cost-carbon benefit
analysis of 17 pro-
posed mitigation
actions.
2010
The City creates a
greenhouse gas emis-
sion tracking tool to
easily allow City gov-
ernment to regularly
track and record emis-
sion data .
2016
The City will have
stabilized its green-
house gas emissions
with the use of strat-
egies presented in
this plan.
2025
The City will have
reduced its green-
house gas emissions
by the first target
identified on page
10.
Page 4
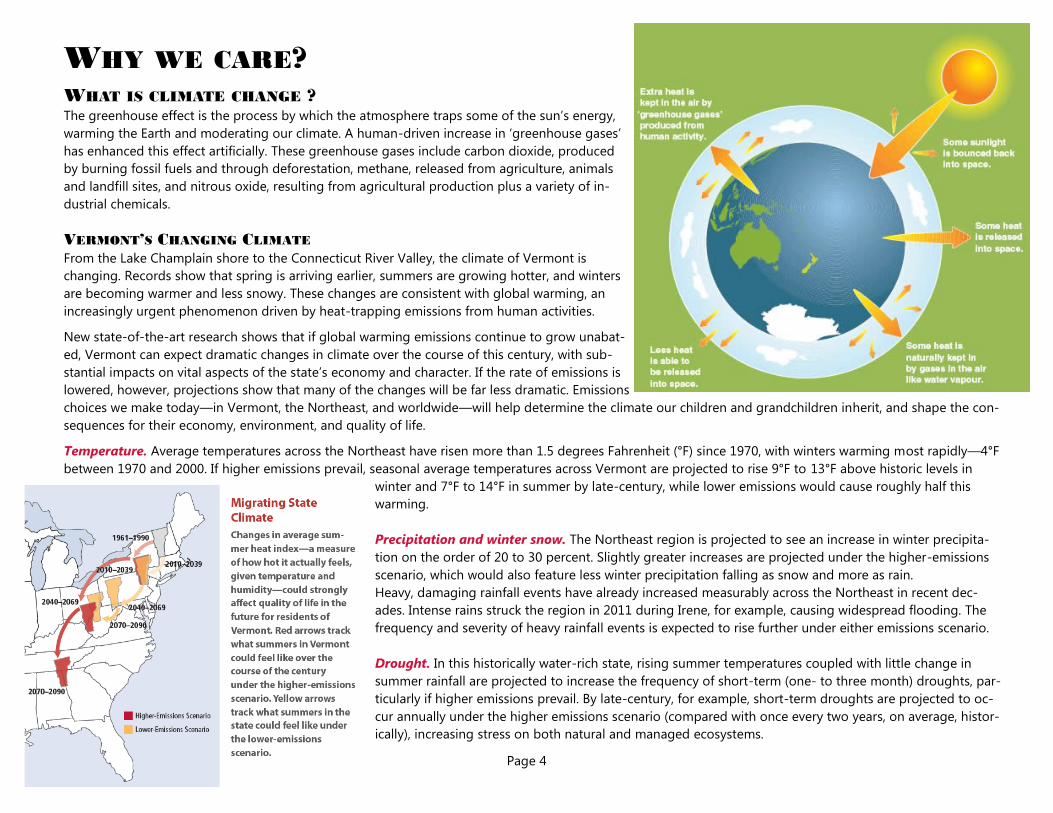
WHY WE CARE? WHAT IS CLIMATE CHANGE ? The greenhouse effect is the process by which the atmosphere traps some of the sun’s energy,
warming the Earth and moderating our climate. A human-driven increase in ‘greenhouse gases’
has enhanced this effect artificially. These greenhouse gases include carbon dioxide, produced
by burning fossil fuels and through deforestation, methane, released from agriculture, animals
and landfill sites, and nitrous oxide, resulting from agricultural production plus a variety of in-
dustrial chemicals.
VERMONT’S CHANGING CLIMATE
From the Lake Champlain shore to the Connecticut River Valley, the climate of Vermont is
changing. Records show that spring is arriving earlier, summers are growing hotter, and winters
are becoming warmer and less snowy. These changes are consistent with global warming, an
increasingly urgent phenomenon driven by heat-trapping emissions from human activities.
New state-of-the-art research shows that if global warming emissions continue to grow unabat-
ed, Vermont can expect dramatic changes in climate over the course of this century, with sub-
stantial impacts on vital aspects of the state’s economy and character. If the rate of emissions is
lowered, however, projections show that many of the changes will be far less dramatic. Emissions
choices we make today—in Vermont, the Northeast, and worldwide—will help determine the climate our children and grandchildren inherit, and shape the con-
sequences for their economy, environment, and quality of life.
Temperature. Average temperatures across the Northeast have risen more than 1.5 degrees Fahrenheit (°F) since 1970, with winters warming most rapidly—4°F
between 1970 and 2000. If higher emissions prevail, seasonal average temperatures across Vermont are projected to rise 9°F to 13°F above historic levels in
winter and 7°F to 14°F in summer by late-century, while lower emissions would cause roughly half this
warming.
Precipitation and winter snow. The Northeast region is projected to see an increase in winter precipita-
tion on the order of 20 to 30 percent. Slightly greater increases are projected under the higher-emissions
scenario, which would also feature less winter precipitation falling as snow and more as rain.
Heavy, damaging rainfall events have already increased measurably across the Northeast in recent dec-
ades. Intense rains struck the region in 2011 during Irene, for example, causing widespread flooding. The
frequency and severity of heavy rainfall events is expected to rise further under either emissions scenario.
Drought. In this historically water-rich state, rising summer temperatures coupled with little change in
summer rainfall are projected to increase the frequency of short-term (one- to three month) droughts, par-
ticularly if higher emissions prevail. By late-century, for example, short-term droughts are projected to oc-
cur annually under the higher emissions scenario (compared with once every two years, on average, histor-
ically), increasing stress on both natural and managed ecosystems.
Page 5
IMPACTS OF CLIMATE CHANGE ON VERMONT AND BURLINGTON IMPACTS ON WINTER
RECREATION
Snow and cold temperatures mean
big business for the Green Moun-
tain State. Ski areas provide recre-
ation for residents and visitors
along with thousands of jobs, and
contribute more than $1.1 billion a
year to the state’s economy. Win-
ters are already changing, and may
look and feel profoundly different
over the course of the century.
Snowmobiling. Vermont is part of a
six state network of snowmobile
trails totaling 40,500 miles and
contributing $3 billion a year to
the regional economy. Snowmo-
biling relies almost entirely on nat-
ural snowfall. Projected losses in
natural snow cover and the im-
practicality of snowmaking on this
vast system mean that the snow-
mobiling season could decline
dramatically by late-century.
Skiing. Milder winters are ex-
pected to shorten the ski season,
and the state’s ski areas may no
longer be viable by late-century.
Lake ice. Ice fishing and pond
hockey are winter favorites in Ver-
mont. However, global warming
will render lake ice cover increas-
ingly thin and shorten its duration.
Ice cover duration on Lake Cham-
plain has already declined in re-
cent decades.
IMPACTS ON FORESTS AND
AGRICULTURE
Forests cover nearly 80 percent of the
Vermont landscape. The state’s forest-
related manufacturing, recreation, and
tourism sectors contribute more than
$1.4 billion to the state’s economy and
provide jobs for many residents. These
woodlands also provide wildlife habitat,
protect watersheds, conserve soil, and
store carbon. Climate change has the
potential to dramatically alter the char-
acter of Vermont’s forests.
Agriculture has long been a vital part
of Vermont’s character and economy.
Global warming will present both op-
portunities and challenges to Vermont’s
growers. For example, increases in the
frequency of short-term drought could
necessitate increased irrigation and op-
erational costs, while a longer growing
season could benefit those farmers
seeking to invest in warmer weather
crops that are currently hard to grow.
By late-century, increasing summer
temperatures and heat stress could de-
press the yields of some of Vermont’s
economically important cool-weather
crops. Northward expansion of agricul-
tural pests and weeds are expected to
further impede crop production during
this time frame, and potentially pressure
farmers to increase their herbicide and
pesticide use (or, in the case of organic
farms, invest more heavily in labor-
intensive weed and pest control).
IMPACTS ON HUMAN HEALTH
From more intense summer heat waves
to deteriorating air quality, the effects of
global warming are expected to increase
the risk of a number of health problems.
Extreme heat. While Burlington resi-
dents are accustomed to the occasional
summer heat wave, the number of hot
days is projected to increase substan-
tially in much of the state by late-
century, with some areas experiencing
temperatures over 90°F on more than
half of July days. Very hot days are not
only unpleasant but also dangerous, as
they increase the risk of heat stress and
even death.
Air quality. Higher temperatures and
increasing levels of carbon dioxide
(CO2) in the air are also expected to
have significant impacts on human
health, which could include develop-
ment or reproductive harm, asthma at-
tacks, lung cancer, wheezing and
coughing, shortness of breath, cardio-
vascular harm, lung tissue redness,
swelling, etc.
Vector-borne disease. Mosquitoes and
ticks carry West Nile virus (WNV) and
Lyme disease-causing bacteria, and
spread them to animals and humans.
Projections for the Northeast of warmer
winters, hotter summers, and more fre-
quent summer dry periods punctuated
by heavy rainstorms can set the stage
for more frequent WNV outbreaks.
IMPACTS ON INFRASTRUCTURE AND
LAND
In the last decades, the frequency and severity
of storm events have increased tremendously
and in Burlington more specifically we have
seen increased flooding. Think of the Lake
Champlain flooding and Irene in 2011, and
Hurricane Sandy in 2012. Such flood events
equate to higher levels of stormwater and
have a direct impact on our water infrastruc-
ture in the City. During major storm events the
waterfront wastewater treatment plant cannot
always handle the increased flow in areas of
the city where the wastewater and stormwater
systems are combined. This means that un-
treated wastewater is sent directly to the Lake.
Given the age of our infrastructure, these ma-
jor storm events threaten their integrity and
we should expect to see more unanticipated
breaks, wash-outs and flooding.
Bank erosion is another impact of more se-
vere flooding. Damage that the Burlington
bike path and many lakeshore properties
quickly come to mind when remembering the
2011 events. The cost to repair and/or replace
eroded banks create an additional burden on
individuals, city finances and the cost often
has to ultimately be paid for by citizens.
Limited recreation opportunities from de-
creased water quality or physical constraints
due to flooding have also been more frequent,
i.e.: beach closures, prohibited swimming and/
or boating, limited bike path use, etc.
Page 6
CLIMATE CHANGE AND EQUITY Equity and inclusion are a high priority for the City of Burlington. To respond to the complex and intertwined issues of climate change and social equity. the City
must put forth a clear and unyielding effort to promote inclusion in all decision and policy-making processes, while at the same time applying an equity lens to
implementation strategies in order to create an integrated response that goes far beyond reducing carbon emissions. Addressing social equity will, in turn, help
foster strong, resilient natural systems and neighborhoods. Some areas for consideration include:
How can the City of Burlington build a more diverse and multi-disciplinary climate action stakeholder group?
By evaluating emissions mitigation strategies with attention to issues of equity, how might planning and implementation of infrastructure and behavioral
emissions reduction projects be enhanced?
In what ways does a more inclusive set of active stakeholders create a more effective and innovative emissions reduction program?
What are the synergies between equity and inclusion goals and climate action goals and how do these crossovers advance a community culture of sus-
tainability?
How can the City of Burlington help ensure the safety and health of all of its citizens in the face of a changing climate?
The City of Burlington has identified five key areas, which present pressing equity issues either presently or in the future. These issues will be explored in the fu-
ture to create a more comprehensive and transparent plan of action.
The City of Burlington, through its climate mitigation and adaption efforts, has already begun developing a comprehensive, integrated plan of action to respond
to and deal with the issues of climate change and equity.
Housing
Disparate concentrations of wealth in relation to floodplains and
green space
Individuals’ financial ability to adapt and respond to climatic changes
Access to energy efficient homes – including heating, cooling, and
weatherization
Infrastructure and Transportation
Individuals’ proximity to affordable, reliable
public transportation
Distance from town center and shopping
centers proportional to levels of income and
wealth
Extreme Weather Events and
Impacts
Flooding and tree falls
Effects of extreme weather on
livability, comfort, and crime
Food Security
Stability and viability of long-term, local agriculture
Access to and affordability of fresh, local foods
Community garden placement and supporting resources
Home garden and composting education
Participation, outreach, and education
Equitable community involvement in policy and decision making process such as
zoning and land use planning
Build on the work of the diverse stakeholders through a climate action education
designed to engage and inform all members of the community
Page 7
WHERE ARE WE NOW WITH GOVERNMENT OPERATIONS EMISSIONS? Snapshot in time
While based on extensive research and analysis, the Burlington Climate Action Plan represents a snapshot in time using the best information available today. The greenhouse gas
emissions inventory results depicted below and in the next few pages are always changing. The 2007 and 2010 inventories were prepared using the International Local Government
Greenhouse Gas (GHG) Emissions Analysis Protocol developed by the Climate Registry and ICLEI. It is our hope to update this information every 3 years to track progress.
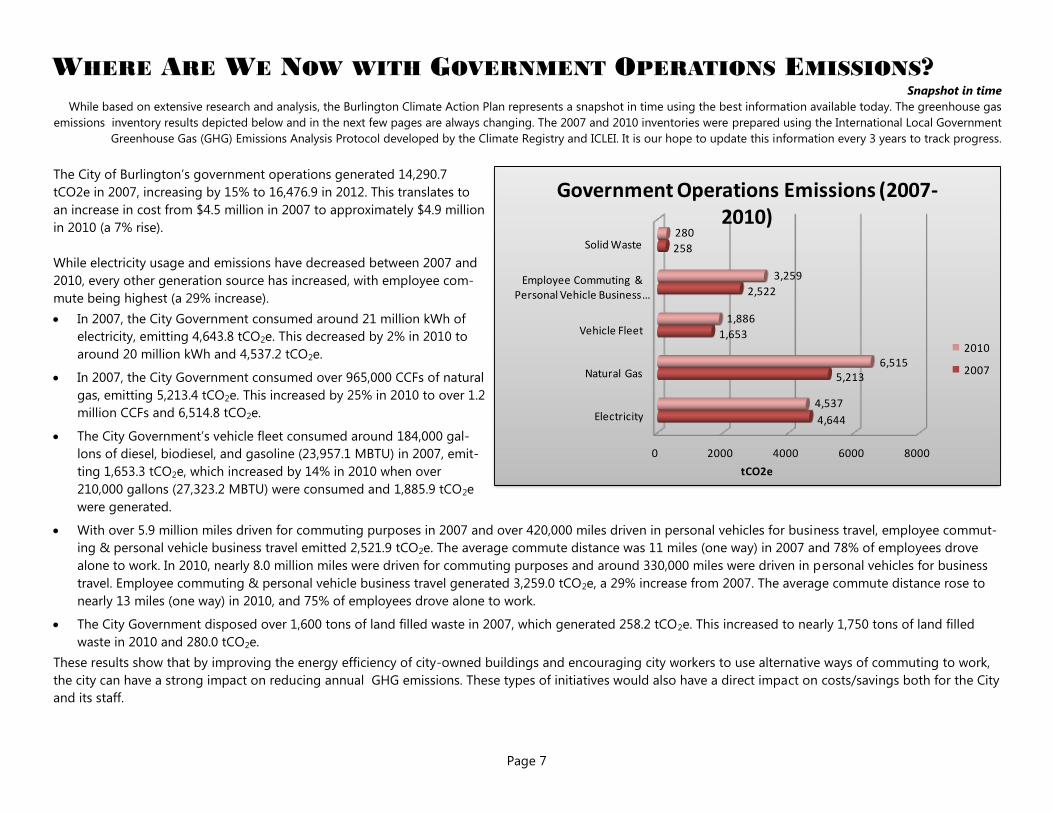
The City of Burlington’s government operations generated 14,290.7
tCO2e in 2007, increasing by 15% to 16,476.9 in 2012. This translates to
an increase in cost from $4.5 million in 2007 to approximately $4.9 million
in 2010 (a 7% rise).
While electricity usage and emissions have decreased between 2007 and
2010, every other generation source has increased, with employee com-
mute being highest (a 29% increase).
In 2007, the City Government consumed around 21 million kWh of
electricity, emitting 4,643.8 tCO2e. This decreased by 2% in 2010 to
around 20 million kWh and 4,537.2 tCO2e.
In 2007, the City Government consumed over 965,000 CCFs of natural
gas, emitting 5,213.4 tCO2e. This increased by 25% in 2010 to over 1.2
million CCFs and 6,514.8 tCO2e.
The City Government’s vehicle fleet consumed around 184,000 gal-
lons of diesel, biodiesel, and gasoline (23,957.1 MBTU) in 2007, emit-
ting 1,653.3 tCO2e, which increased by 14% in 2010 when over
210,000 gallons (27,323.2 MBTU) were consumed and 1,885.9 tCO2e
were generated.
With over 5.9 million miles driven for commuting purposes in 2007 and over 420,000 miles driven in personal vehicles for business travel, employee commut-
ing & personal vehicle business travel emitted 2,521.9 tCO2e. The average commute distance was 11 miles (one way) in 2007 and 78% of employees drove
alone to work. In 2010, nearly 8.0 million miles were driven for commuting purposes and around 330,000 miles were driven in personal vehicles for business
travel. Employee commuting & personal vehicle business travel generated 3,259.0 tCO2e, a 29% increase from 2007. The average commute distance rose to
nearly 13 miles (one way) in 2010, and 75% of employees drove alone to work.
The City Government disposed over 1,600 tons of land filled waste in 2007, which generated 258.2 tCO2e. This increased to nearly 1,750 tons of land filled
waste in 2010 and 280.0 tCO2e.
These results show that by improving the energy efficiency of city-owned buildings and encouraging city workers to use alternative ways of commuting to work,
the city can have a strong impact on reducing annual GHG emissions. These types of initiatives would also have a direct impact on costs/savings both for the City
and its staff.
0 2000 4000 6000 8000
Electricity
Natural Gas
Vehicle Fleet
Employee Commuting & Personal Vehicle Business …
Solid Waste
4,644
5,213
1,653
2,522
258
4,537
6,515
1,886
3,259
280
tCO2e
Government Operations Emissions (2007-2010)
2010
2007
Page 8
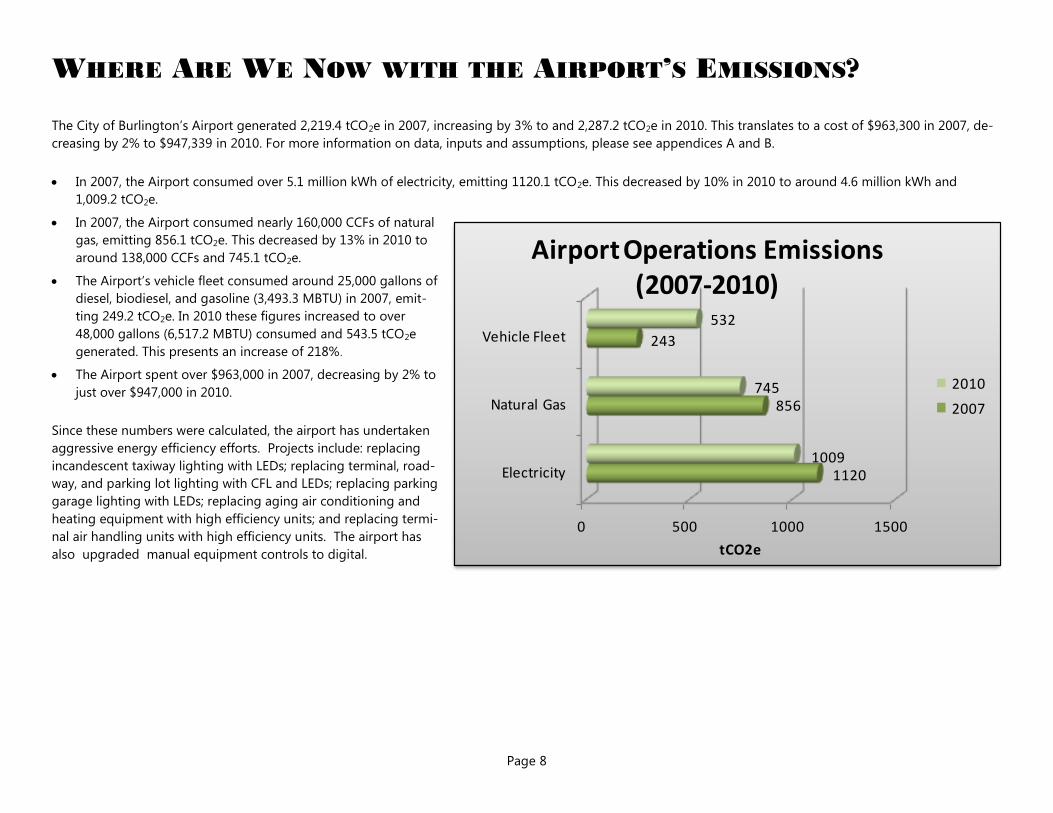
The City of Burlington’s Airport generated 2,219.4 tCO2e in 2007, increasing by 3% to and 2,287.2 tCO2e in 2010. This translates to a cost of $963,300 in 2007, de-
creasing by 2% to $947,339 in 2010. For more information on data, inputs and assumptions, please see appendices A and B.
In 2007, the Airport consumed over 5.1 million kWh of electricity, emitting 1120.1 tCO2e. This decreased by 10% in 2010 to around 4.6 million kWh and
1,009.2 tCO2e.
In 2007, the Airport consumed nearly 160,000 CCFs of natural
gas, emitting 856.1 tCO2e. This decreased by 13% in 2010 to
around 138,000 CCFs and 745.1 tCO2e.
The Airport’s vehicle fleet consumed around 25,000 gallons of
diesel, biodiesel, and gasoline (3,493.3 MBTU) in 2007, emit-
ting 249.2 tCO2e. In 2010 these figures increased to over
48,000 gallons (6,517.2 MBTU) consumed and 543.5 tCO2e
generated. This presents an increase of 218%.
The Airport spent over $963,000 in 2007, decreasing by 2% to
just over $947,000 in 2010.
Since these numbers were calculated, the airport has undertaken
aggressive energy efficiency efforts. Projects include: replacing
incandescent taxiway lighting with LEDs; replacing terminal, road-
way, and parking lot lighting with CFL and LEDs; replacing parking
garage lighting with LEDs; replacing aging air conditioning and
heating equipment with high efficiency units; and replacing termi-
nal air handling units with high efficiency units. The airport has
also upgraded manual equipment controls to digital.
WHERE ARE WE NOW WITH THE AIRPORT’S EMISSIONS?
0 500 1000 1500
Electricity
Natural Gas
Vehicle Fleet
1120
856
243
1009
745
532
tCO2e
Airport Operations Emissions (2007-2010)
2010
2007
Page 9
While energy produced from biomass may not always be carbon neu-
tral, the Climate Protection Protocol (the standard GHG tracking tool
used by cities around the world) does not require that GHG from bio-
mass be integrated into overall calculations. That said, should this
change and biomass be included in an updated Protocol, Burlington
will include this information when it collects future data.
The US Environmental Protection Agency reports that 2012 McNeil’s
Total Facility CO2e Emissions (excluding Biogenic CO2) were 8425 met-
ric tons and McNeil’s measured Biogenic CO2 was 344,501 metric tons.
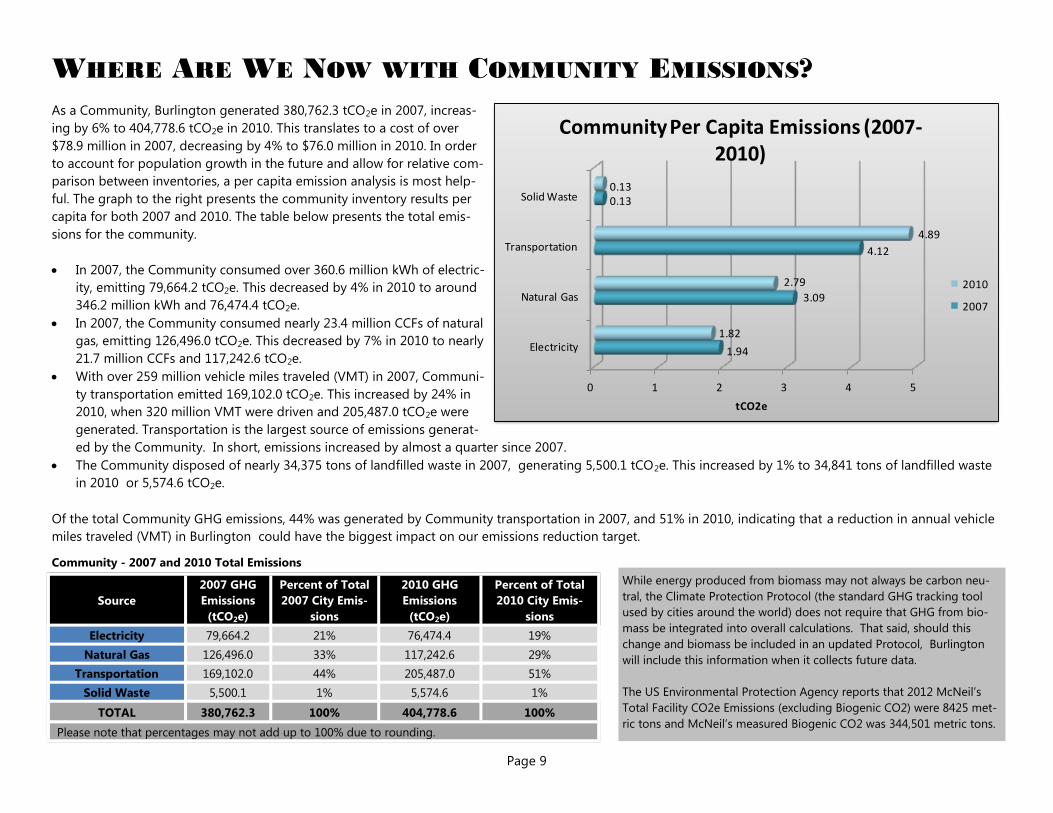
As a Community, Burlington generated 380,762.3 tCO2e in 2007, increas-
ing by 6% to 404,778.6 tCO2e in 2010. This translates to a cost of over
$78.9 million in 2007, decreasing by 4% to $76.0 million in 2010. In order
to account for population growth in the future and allow for relative com-
parison between inventories, a per capita emission analysis is most help-
ful. The graph to the right presents the community inventory results per
capita for both 2007 and 2010. The table below presents the total emis-
sions for the community.
In 2007, the Community consumed over 360.6 million kWh of electric-
ity, emitting 79,664.2 tCO2e. This decreased by 4% in 2010 to around
346.2 million kWh and 76,474.4 tCO2e.
In 2007, the Community consumed nearly 23.4 million CCFs of natural
gas, emitting 126,496.0 tCO2e. This decreased by 7% in 2010 to nearly
21.7 million CCFs and 117,242.6 tCO2e.
With over 259 million vehicle miles traveled (VMT) in 2007, Communi-
ty transportation emitted 169,102.0 tCO2e. This increased by 24% in
2010, when 320 million VMT were driven and 205,487.0 tCO2e were
generated. Transportation is the largest source of emissions generat-
ed by the Community. In short, emissions increased by almost a quarter since 2007.
The Community disposed of nearly 34,375 tons of landfilled waste in 2007, generating 5,500.1 tCO2e. This increased by 1% to 34,841 tons of landfilled waste
in 2010 or 5,574.6 tCO2e.
Of the total Community GHG emissions, 44% was generated by Community transportation in 2007, and 51% in 2010, indicating that a reduction in annual vehicle
miles traveled (VMT) in Burlington could have the biggest impact on our emissions reduction target.
WHERE ARE WE NOW WITH COMMUNITY EMISSIONS?
0 1 2 3 4 5
Electricity
Natural Gas
Transportation
Solid Waste
1.94
3.09
4.12
0.13
1.82
2.79
4.89
0.13
tCO2e
Community Per Capita Emissions (2007-2010)
2010
2007
Source
2007 GHG
Emissions
(tCO2e)
Percent of Total
2007 City Emis-
sions
2010 GHG
Emissions
(tCO2e)
Percent of Total
2010 City Emis-
sions
Electricity 79,664.2 21% 76,474.4 19%
Natural Gas 126,496.0 33% 117,242.6 29%
Transportation 169,102.0 44% 205,487.0 51%
Solid Waste 5,500.1 1% 5,574.6 1%
TOTAL 380,762.3 100% 404,778.6 100%
Please note that percentages may not add up to 100% due to rounding.
Community - 2007 and 2010 Total Emissions
Page 10
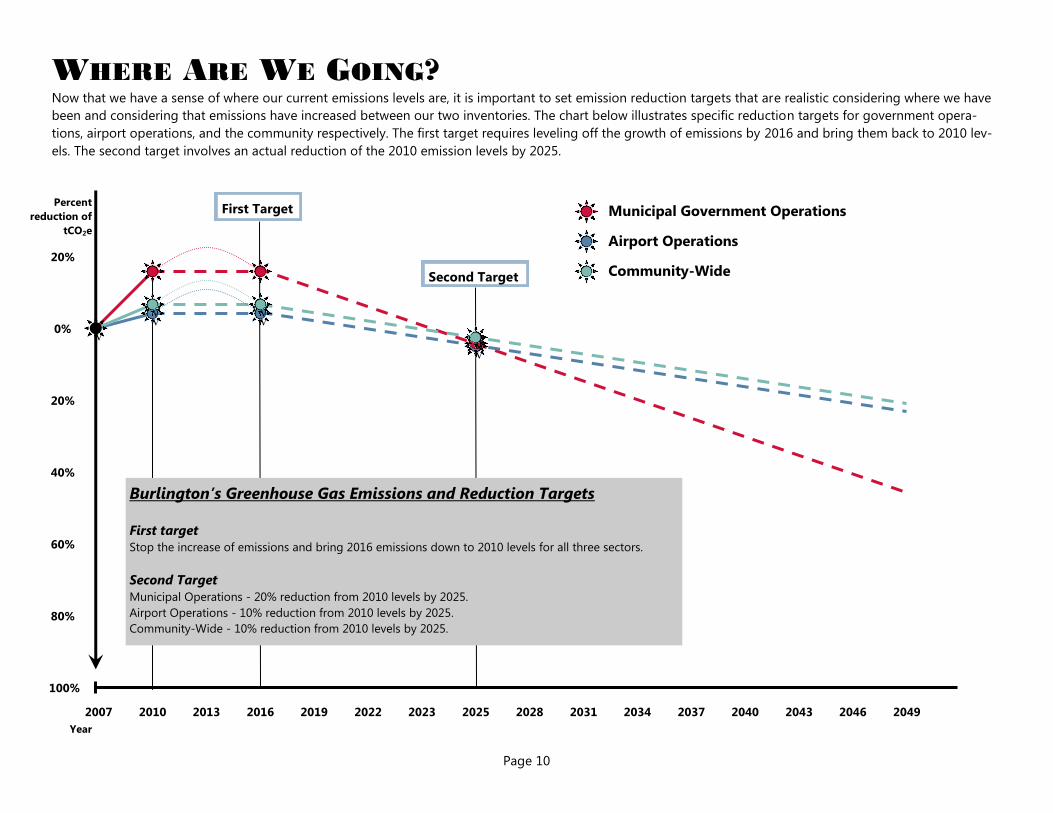
WHERE ARE WE GOING? Now that we have a sense of where our current emissions levels are, it is important to set emission reduction targets that are realistic considering where we have
been and considering that emissions have increased between our two inventories. The chart below illustrates specific reduction targets for government opera-
tions, airport operations, and the community respectively. The first target requires leveling off the growth of emissions by 2016 and bring them back to 2010 lev-
els. The second target involves an actual reduction of the 2010 emission levels by 2025.
2007
100%
80%
60%
40%
20%
0%
2010 2013 2016 2019 2022 2023 2025
v
2028 2031 2034 2037 2040
v v
v v
2043 2046 2049
v v
Municipal Government Operations
Airport Operations
Community-Wide
Percent
reduction of
tCO2e
Year
Burlington’s Greenhouse Gas Emissions and Reduction Targets
First target
Stop the increase of emissions and bring 2016 emissions down to 2010 levels for all three sectors.
Second Target
Municipal Operations - 20% reduction from 2010 levels by 2025.
Airport Operations - 10% reduction from 2010 levels by 2025.
Community-Wide - 10% reduction from 2010 levels by 2025.
20%
First Target
Second Target
Page 11
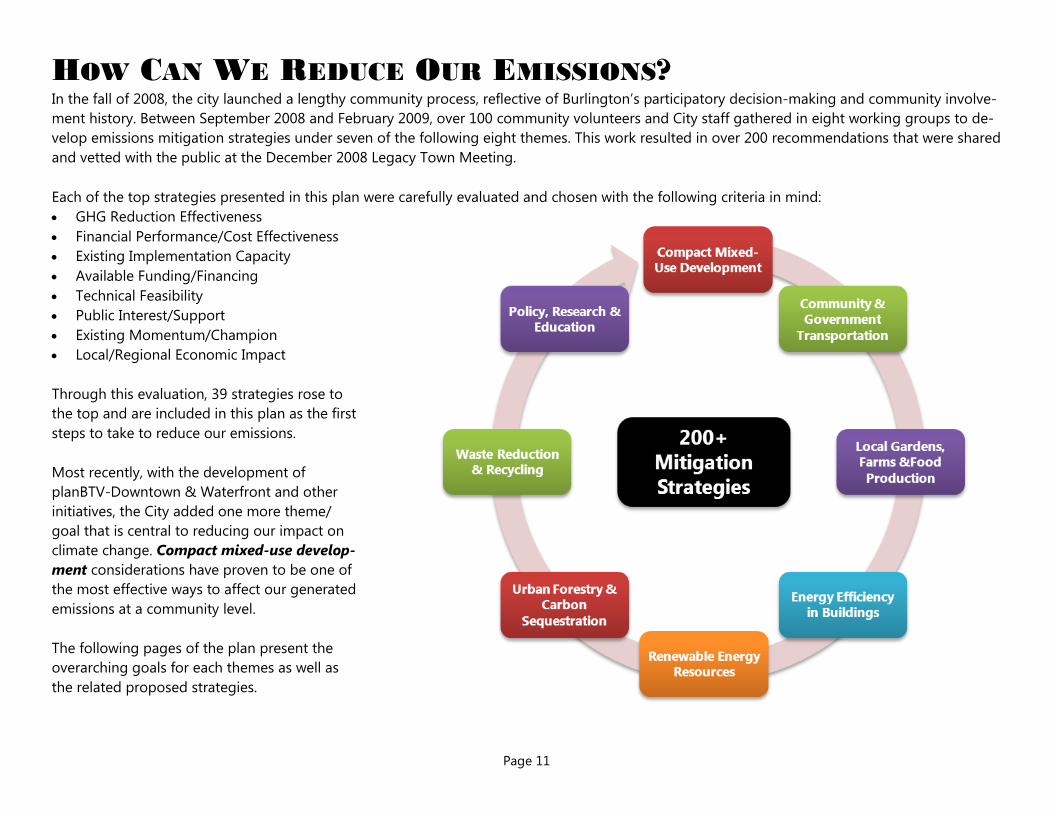
HOW CAN WE REDUCE OUR EMISSIONS? In the fall of 2008, the city launched a lengthy community process, reflective of Burlington’s participatory decision-making and community involve-
ment history. Between September 2008 and February 2009, over 100 community volunteers and City staff gathered in eight working groups to de-
velop emissions mitigation strategies under seven of the following eight themes. This work resulted in over 200 recommendations that were shared
and vetted with the public at the December 2008 Legacy Town Meeting.
Each of the top strategies presented in this plan were carefully evaluated and chosen with the following criteria in mind:
GHG Reduction Effectiveness
Financial Performance/Cost Effectiveness
Existing Implementation Capacity
Available Funding/Financing
Technical Feasibility
Public Interest/Support
Existing Momentum/Champion
Local/Regional Economic Impact
Through this evaluation, 39 strategies rose to
the top and are included in this plan as the first
steps to take to reduce our emissions.
Most recently, with the development of
planBTV-Downtown & Waterfront and other
initiatives, the City added one more theme/
goal that is central to reducing our impact on
climate change. Compact mixed-use develop-
ment considerations have proven to be one of
the most effective ways to affect our generated
emissions at a community level.
The following pages of the plan present the
overarching goals for each themes as well as
the related proposed strategies.
Page 12
Goal: Promote compact mixed-use development.
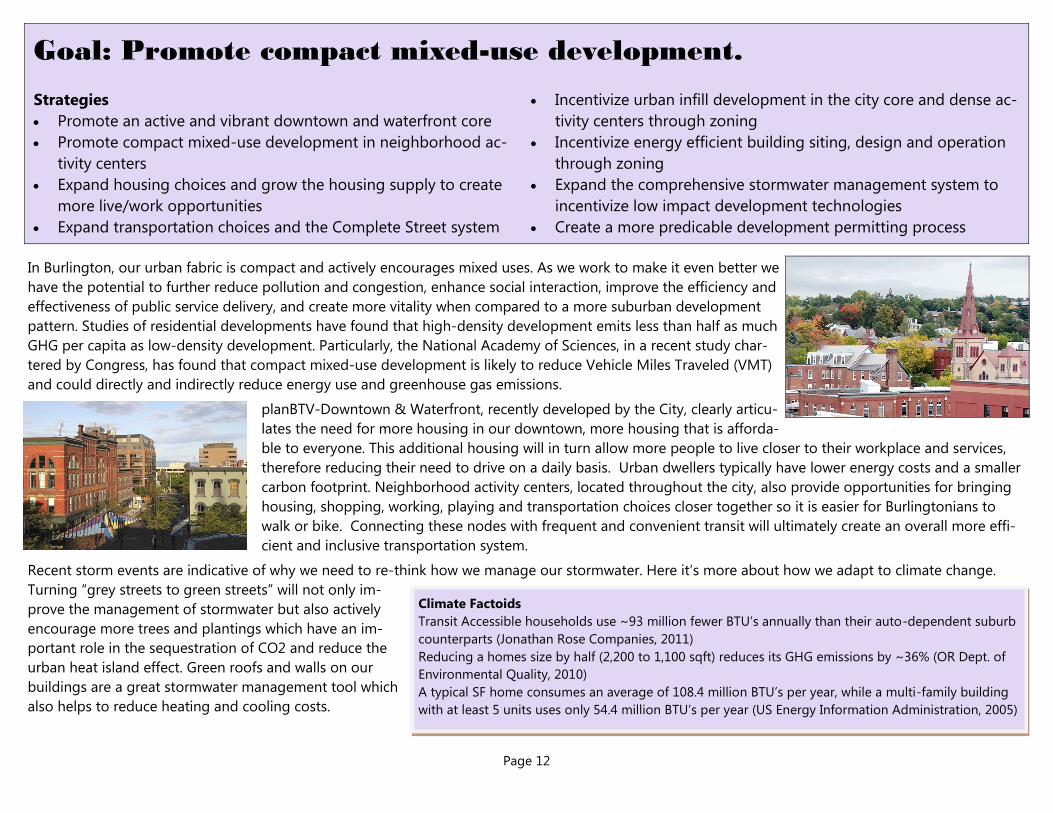
In Burlington, our urban fabric is compact and actively encourages mixed uses. As we work to make it even better we
have the potential to further reduce pollution and congestion, enhance social interaction, improve the efficiency and
effectiveness of public service delivery, and create more vitality when compared to a more suburban development
pattern. Studies of residential developments have found that high-density development emits less than half as much
GHG per capita as low-density development. Particularly, the National Academy of Sciences, in a recent study char-
tered by Congress, has found that compact mixed-use development is likely to reduce Vehicle Miles Traveled (VMT)
and could directly and indirectly reduce energy use and greenhouse gas emissions.
planBTV-Downtown & Waterfront, recently developed by the City, clearly articu-
lates the need for more housing in our downtown, more housing that is afforda-
ble to everyone. This additional housing will in turn allow more people to live closer to their workplace and services,
therefore reducing their need to drive on a daily basis. Urban dwellers typically have lower energy costs and a smaller
carbon footprint. Neighborhood activity centers, located throughout the city, also provide opportunities for bringing
housing, shopping, working, playing and transportation choices closer together so it is easier for Burlingtonians to
walk or bike. Connecting these nodes with frequent and convenient transit will ultimately create an overall more effi-
cient and inclusive transportation system.
Recent storm events are indicative of why we need to re-think how we manage our stormwater. Here it’s more about how we adapt to climate change.
Turning “grey streets to green streets” will not only im-
prove the management of stormwater but also actively
encourage more trees and plantings which have an im-
portant role in the sequestration of CO2 and reduce the
urban heat island effect. Green roofs and walls on our
buildings are a great stormwater management tool which
also helps to reduce heating and cooling costs.
Strategies
Promote an active and vibrant downtown and waterfront core
Promote compact mixed-use development in neighborhood ac-
tivity centers
Expand housing choices and grow the housing supply to create
more live/work opportunities
Expand transportation choices and the Complete Street system
Incentivize urban infill development in the city core and dense ac-
tivity centers through zoning
Incentivize energy efficient building siting, design and operation
through zoning
Expand the comprehensive stormwater management system to
incentivize low impact development technologies
Create a more predicable development permitting process
Climate Factoids
Transit Accessible households use ~93 million fewer BTU’s annually than their auto-dependent suburb
counterparts (Jonathan Rose Companies, 2011)
Reducing a homes size by half (2,200 to 1,100 sqft) reduces its GHG emissions by ~36% (OR Dept. of
Environmental Quality, 2010)
A typical SF home consumes an average of 108.4 million BTU’s per year, while a multi-family building
with at least 5 units uses only 54.4 million BTU’s per year (US Energy Information Administration, 2005)
Page 13
Goal: Reduce community-wide vehicle miles traveled (VMT) by
10% per capita by 2025.
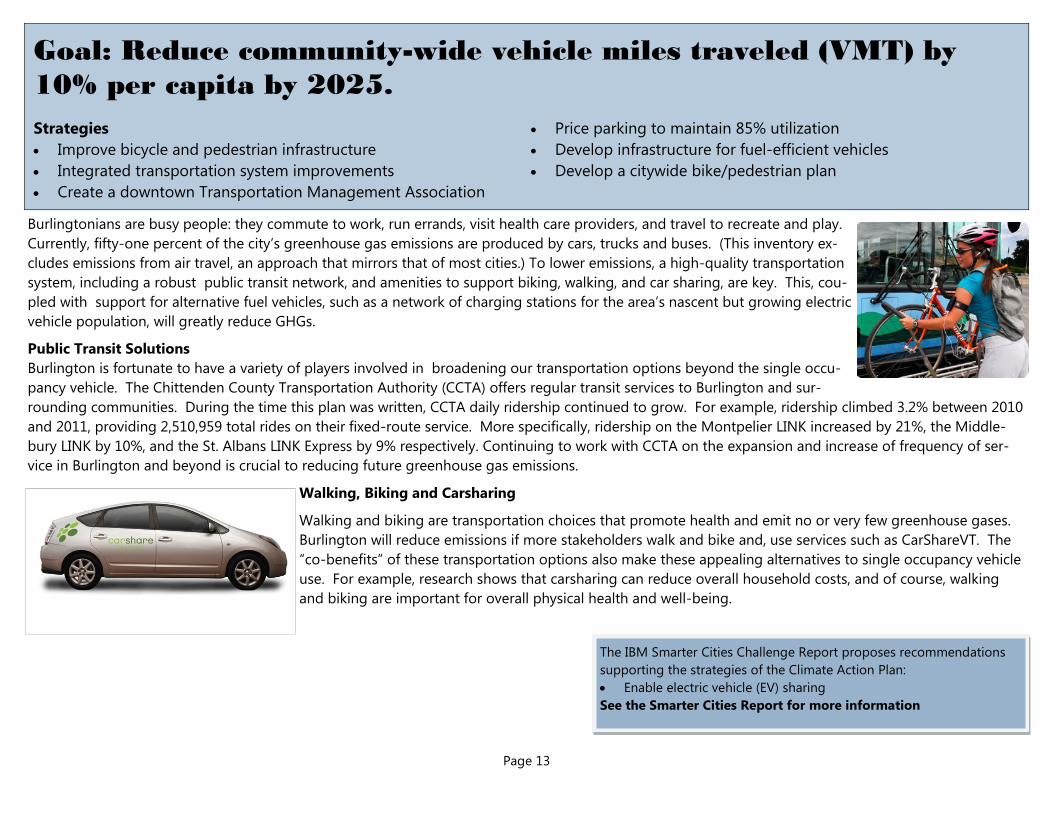
Burlingtonians are busy people: they commute to work, run errands, visit health care providers, and travel to recreate and play.
Currently, fifty-one percent of the city’s greenhouse gas emissions are produced by cars, trucks and buses. (This inventory ex-
cludes emissions from air travel, an approach that mirrors that of most cities.) To lower emissions, a high-quality transportation
system, including a robust public transit network, and amenities to support biking, walking, and car sharing, are key. This, cou-
pled with support for alternative fuel vehicles, such as a network of charging stations for the area’s nascent but growing electric
vehicle population, will greatly reduce GHGs.
Public Transit Solutions
Burlington is fortunate to have a variety of players involved in broadening our transportation options beyond the single occu-
pancy vehicle. The Chittenden County Transportation Authority (CCTA) offers regular transit services to Burlington and sur-
rounding communities. During the time this plan was written, CCTA daily ridership continued to grow. For example, ridership climbed 3.2% between 2010
and 2011, providing 2,510,959 total rides on their fixed-route service. More specifically, ridership on the Montpelier LINK increased by 21%, the Middle-
bury LINK by 10%, and the St. Albans LINK Express by 9% respectively. Continuing to work with CCTA on the expansion and increase of frequency of ser-
vice in Burlington and beyond is crucial to reducing future greenhouse gas emissions.
Walking, Biking and Carsharing
Walking and biking are transportation choices that promote health and emit no or very few greenhouse gases.
Burlington will reduce emissions if more stakeholders walk and bike and, use services such as CarShareVT. The
“co-benefits” of these transportation options also make these appealing alternatives to single occupancy vehicle
use. For example, research shows that carsharing can reduce overall household costs, and of course, walking
and biking are important for overall physical health and well-being.
Strategies
Improve bicycle and pedestrian infrastructure
Integrated transportation system improvements
Create a downtown Transportation Management Association
Price parking to maintain 85% utilization
Develop infrastructure for fuel-efficient vehicles
Develop a citywide bike/pedestrian plan
The IBM Smarter Cities Challenge Report proposes recommendations
supporting the strategies of the Climate Action Plan:
Enable electric vehicle (EV) sharing
See the Smarter Cities Report for more information
Page 14
Goal: Reduce the amount of municipal vehicle miles traveled (VMT) by
10% by 2025.
Although community-wide transportation generates the bulk of greenhouse gases (or approximately 205,000 tCO2e), 5,000 tCO2e are attributed to City
operations, and staff commuting to work.
To help reduce emissions, while opening up needed parking and alleviating congestion, the City provides
regional and local transit passes to all interested employees. The City has partnered with Local Motion on
bike-commute trainings several bicycles available to staff for work-related travel. CarShare Vermont, one
of the nation’s first non-profit car sharing operations, is available to staff who drive for work. Offering the
use of fuel efficient CarShare Vermont vehicles allows employees options beyond the city fleet, car rental,
or personal vehicle use for work-related travel. And personal CarShare membership frees up city staff to
take public transport to work by allowing them car share access during the day for private errands during
the lunch hour.
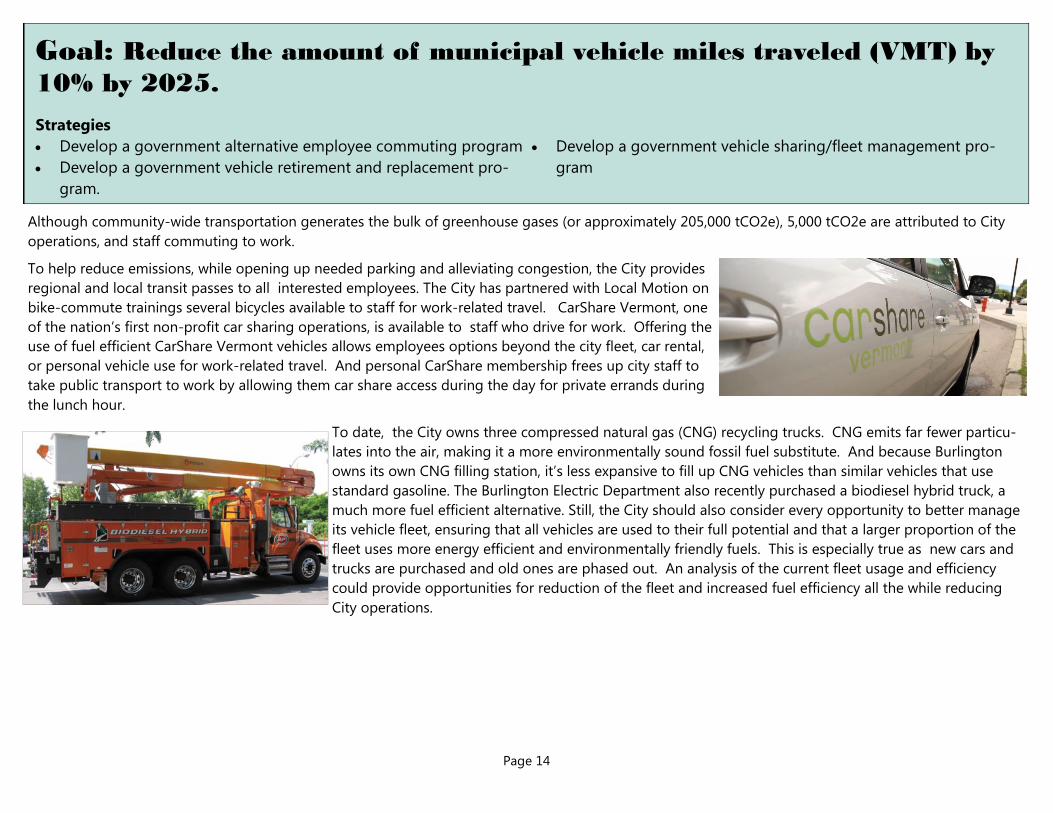
To date, the City owns three compressed natural gas (CNG) recycling trucks. CNG emits far fewer particu-
lates into the air, making it a more environmentally sound fossil fuel substitute. And because Burlington
owns its own CNG filling station, it’s less expansive to fill up CNG vehicles than similar vehicles that use
standard gasoline. The Burlington Electric Department also recently purchased a biodiesel hybrid truck, a
much more fuel efficient alternative. Still, the City should also consider every opportunity to better manage
its vehicle fleet, ensuring that all vehicles are used to their full potential and that a larger proportion of the
fleet uses more energy efficient and environmentally friendly fuels. This is especially true as new cars and
trucks are purchased and old ones are phased out. An analysis of the current fleet usage and efficiency
could provide opportunities for reduction of the fleet and increased fuel efficiency all the while reducing
City operations.
Strategies
Develop a government alternative employee commuting program
Develop a government vehicle retirement and replacement pro-
gram.
Develop a government vehicle sharing/fleet management pro-
gram
Page 15
Goal: Develop zoning, planning, and economic development policies that
support local food production.
Strategies
Develop public-private partnerships and infrastructure to support processing, preserving and storage of locally produced foods.
Create and implement a policy for raising non-domesticated animals
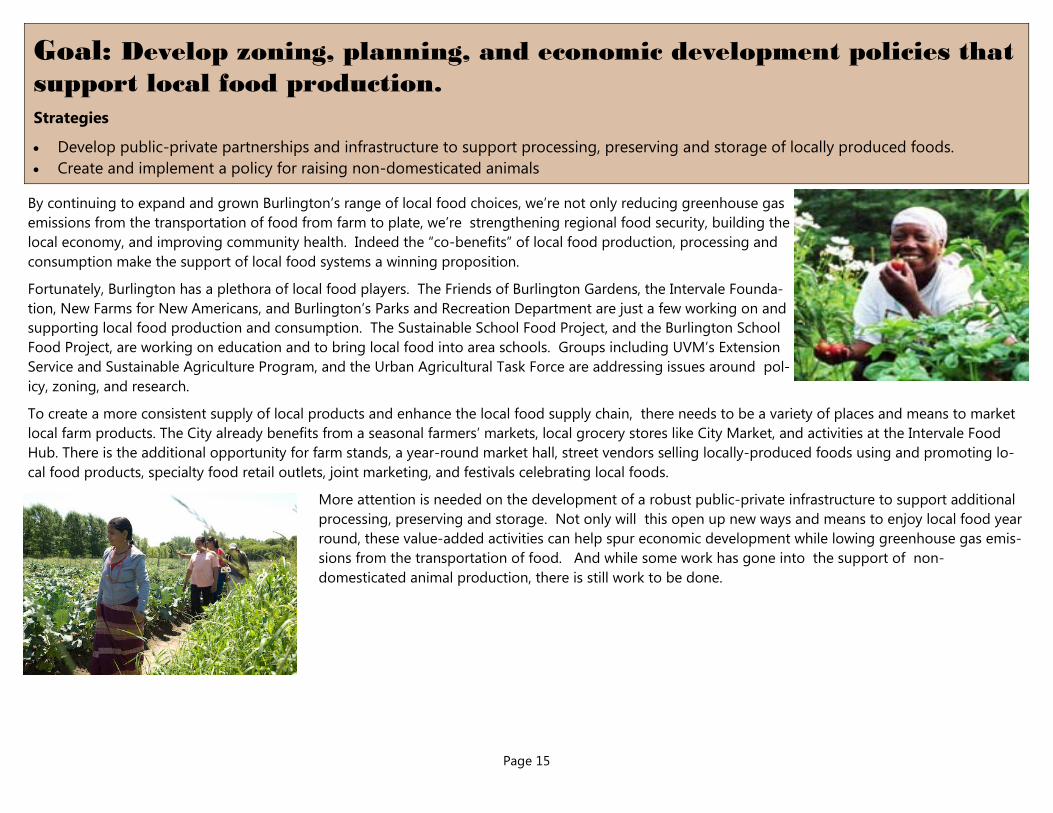
By continuing to expand and grown Burlington’s range of local food choices, we’re not only reducing greenhouse gas
emissions from the transportation of food from farm to plate, we’re strengthening regional food security, building the
local economy, and improving community health. Indeed the “co-benefits” of local food production, processing and
consumption make the support of local food systems a winning proposition.
Fortunately, Burlington has a plethora of local food players. The Friends of Burlington Gardens, the Intervale Founda-
tion, New Farms for New Americans, and Burlington’s Parks and Recreation Department are just a few working on and
supporting local food production and consumption. The Sustainable School Food Project, and the Burlington School
Food Project, are working on education and to bring local food into area schools. Groups including UVM’s Extension
Service and Sustainable Agriculture Program, and the Urban Agricultural Task Force are addressing issues around pol-
icy, zoning, and research.
To create a more consistent supply of local products and enhance the local food supply chain, there needs to be a variety of places and means to market
local farm products. The City already benefits from a seasonal farmers’ markets, local grocery stores like City Market, and activities at the Intervale Food
Hub. There is the additional opportunity for farm stands, a year-round market hall, street vendors selling locally-produced foods using and promoting lo-
cal food products, specialty food retail outlets, joint marketing, and festivals celebrating local foods.
More attention is needed on the development of a robust public-private infrastructure to support additional
processing, preserving and storage. Not only will this open up new ways and means to enjoy local food year
round, these value-added activities can help spur economic development while lowing greenhouse gas emis-
sions from the transportation of food. And while some work has gone into the support of non-
domesticated animal production, there is still work to be done.
Page 16
Goal: Increase energy efficiency in buildings.
Improving energy performance of city’s buildings is a key goal of the plan. Achieving this will require a concerted effort by government and it’s many pub-
lic and private partners, including single and multi-unit property owners . Not only does increased building efficiency — and the efficiency of our infra-
structure such as our City’s streetlights — result in financial savings, it can help spur the local economy by creating employment opportunities.
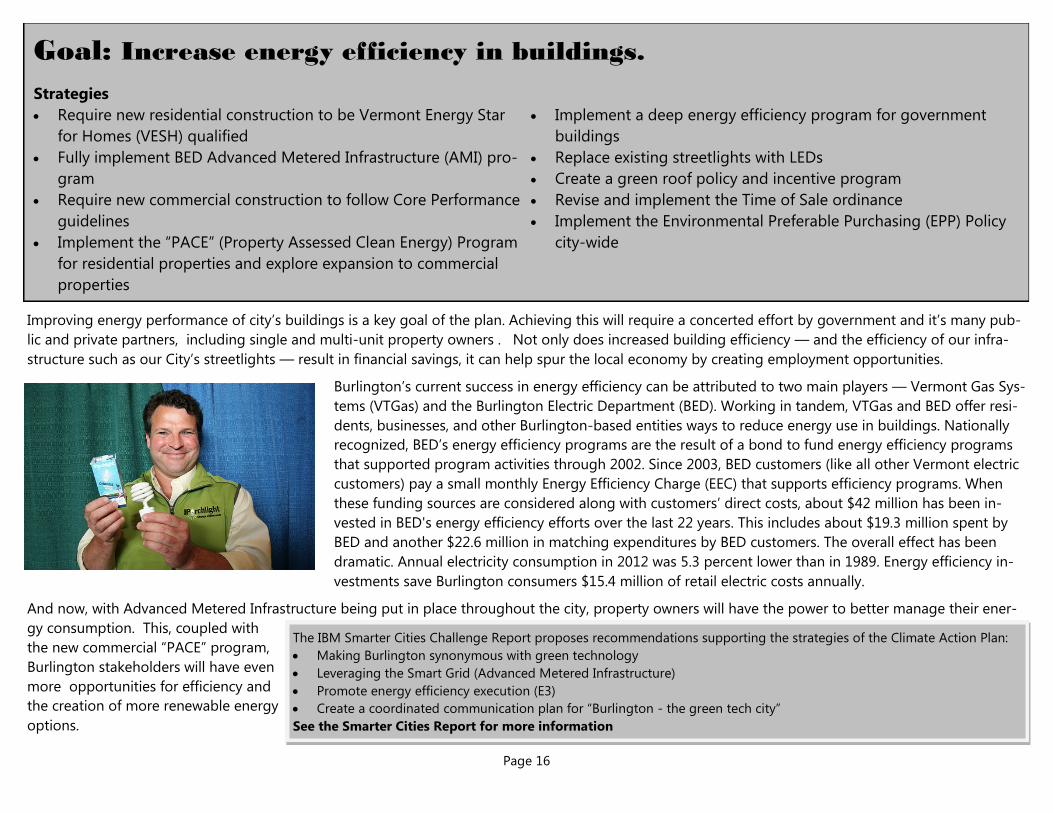
Burlington’s current success in energy efficiency can be attributed to two main players — Vermont Gas Sys-
tems (VTGas) and the Burlington Electric Department (BED). Working in tandem, VTGas and BED offer resi-
dents, businesses, and other Burlington-based entities ways to reduce energy use in buildings. Nationally
recognized, BED’s energy efficiency programs are the result of a bond to fund energy efficiency programs
that supported program activities through 2002. Since 2003, BED customers (like all other Vermont electric
customers) pay a small monthly Energy Efficiency Charge (EEC) that supports efficiency programs. When
these funding sources are considered along with customers’ direct costs, about $42 million has been in-
vested in BED's energy efficiency efforts over the last 22 years. This includes about $19.3 million spent by
BED and another $22.6 million in matching expenditures by BED customers. The overall effect has been
dramatic. Annual electricity consumption in 2012 was 5.3 percent lower than in 1989. Energy efficiency in-
vestments save Burlington consumers $15.4 million of retail electric costs annually.
And now, with Advanced Metered Infrastructure being put in place throughout the city, property owners will have the power to better manage their ener-
gy consumption. This, coupled with
the new commercial “PACE” program,
Burlington stakeholders will have even
more opportunities for efficiency and
the creation of more renewable energy
options.
Strategies
Require new residential construction to be Vermont Energy Star
for Homes (VESH) qualified
Fully implement BED Advanced Metered Infrastructure (AMI) pro-
gram
Require new commercial construction to follow Core Performance
guidelines
Implement the “PACE” (Property Assessed Clean Energy) Program
for residential properties and explore expansion to commercial
properties
Implement a deep energy efficiency program for government
buildings
Replace existing streetlights with LEDs
Create a green roof policy and incentive program
Revise and implement the Time of Sale ordinance
Implement the Environmental Preferable Purchasing (EPP) Policy
city-wide
The IBM Smarter Cities Challenge Report proposes recommendations supporting the strategies of the Climate Action Plan:
Making Burlington synonymous with green technology
Leveraging the Smart Grid (Advanced Metered Infrastructure)
Promote energy efficiency execution (E3)
Create a coordinated communication plan for “Burlington - the green tech city”
See the Smarter Cities Report for more information

Page 17
Goal: Increase the use of cleaner and renewable energy sources.
To reduce our greenhouse gases, Burlington should strive for higher efficiency from our existing
energy sources and continue to work towards its goal of 100% renewable power. Work on this
front will not only reduce emissions, but protect us from the whimsical forces of the traditional en-
ergy market.
As a municipal department for the City of Burlington, Burlington Electric Department has a long his-
tory of sourcing electricity from clean power mixes. This is reflected in the lower emissions from the
Burlington Electric Department Grid, shown in blue in the graph below. Generating electricity with
fossil fuels contributes to climate change. BED has long been a leader in renewable energy develop-
ment. BED’s 2012 Integrated Resource Plan established a goal to continue seeking long-term renewa-
ble resources to fill the remaining supply gap without substantial rate impacts. Since the 2012 IRP was
filed in September, 2012, BED has executed a five-year contract for energy from small existed hydro
facilities, received approval to exercise the option and started discussions to
pursue purchasing the Winooski One hydro facility, and the Georgia Moun-
tain Community Wind Project in Georgia Vermont has come on line and
begun delivering energy. Purchasing the Winooski One hydro facility will
meet another 8 - 9% of the city’s annual energy needs.
Under Mayor Weinberger’s initiative, on November 13, 2012, the City
Council passed a resolution to waive all building, electrical, plumbing and
zoning permit fees associated with the installation of solar photovoltaic
panels and thermal hot water equipment for a period of one year. This is
aimed at reducing barriers for such installations as well as strengthening
Burlington’s commitment clean and locally generated energy.
Strategies
Study feasibility of McNeil district heating project
Implement additional "Solar on Schools" projects
Implement BED "Renewable Energy Resource Rider" program
Implement a "Solar City" project on municipal buildings
Develop methane gas capture and CHP potential at City's
wastewater treatment plants
City of Burlington - 2007 and 2010 Electricity Emissions by Grid
The 2007 Burlington Electric Department Grid emissions were applied to the 2007 usage and
the 2010 Grid emissions were applied to the 2010 usage. For theoretical purposes, the emis-
sions factors for the regional grid, the NPCC New England Grid (2007), shown in green below,
and the National Grid (2006), shown in purple in the graph below, were applied to the 2007
and 2010 usage. The NPCC New England Grid provides cleaner electricity than the National
Grid, but not as clean as the Burlington Electric Department Grid.
City Market Solar Panels
The IBM Smarter Cities Challenge Report proposes recommendations support-
ing the strategies of the Climate Action Plan:
Optimize the Joseph C. McNeil
See the Smarter Cities Report for more information
Page 18
Goal: Increase carbon storage and sequestration with additional forest
and tree coverage. Strategy
Increase the Urban Tree Canopy (UTC)
Research indicates that carbon sequestration — or the process by which carbon is captured and stored to avoid release into the atmosphere — is a
sound and viable way to reduced greenhouse gasses. Because trees sequester carbon, Burlington is fortunate to have an extensive tree canopy, approxi-
mately 40% of Burlington’s land cover mass. Not only do trees sequester carbon, Burlington’s urban forest, a mosaic of planted landscapes and what re-
mains of the native forest, is a reflection of the city’s health, well being, and livability. It is an important part of Burlington’s character, giving the City a
special sense of place.
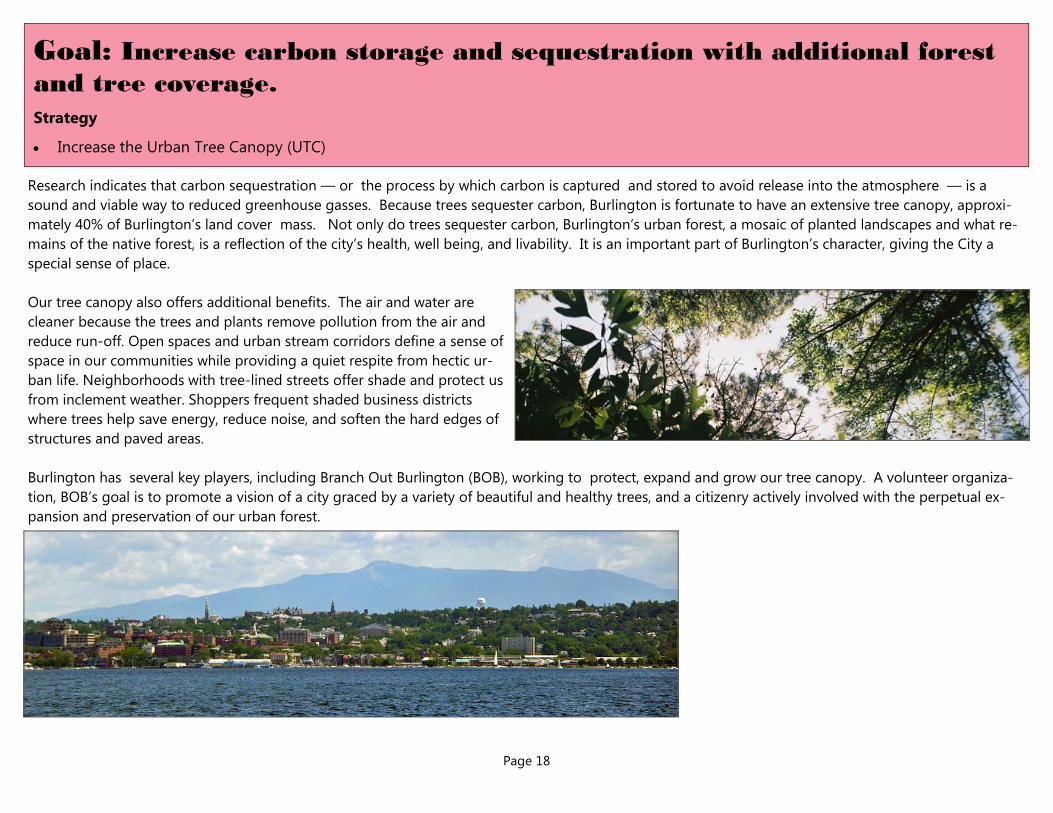
Our tree canopy also offers additional benefits. The air and water are
cleaner because the trees and plants remove pollution from the air and
reduce run-off. Open spaces and urban stream corridors define a sense of
space in our communities while providing a quiet respite from hectic ur-
ban life. Neighborhoods with tree-lined streets offer shade and protect us
from inclement weather. Shoppers frequent shaded business districts
where trees help save energy, reduce noise, and soften the hard edges of
structures and paved areas.
Burlington has several key players, including Branch Out Burlington (BOB), working to protect, expand and grow our tree canopy. A volunteer organiza-
tion, BOB’s goal is to promote a vision of a city graced by a variety of beautiful and healthy trees, and a citizenry actively involved with the perpetual ex-
pansion and preservation of our urban forest.
Page 19
Goal: Reduce the amount of waste sent to landfills
Burlington produces an estimated 34,000 tons of waste annually. To reduce the amount of waste we generated
as a community along with the associated environmental costs of transportation, individuals, government, and
the private sector must work together. Much of this effort will need to focus on behavior change, and encourag-
ing stakeholders to not only comply with mandatory recycling, but to compost and think critically about reduc-
ing waste at the point of purchase.
The waste reduction goal also requires that Burlington restructure its methods of garbage pickup and transport.
Currently, residences and businesses contract with haulers directly to pick up trash and compostable materials;
the City picks up recyclables. New approaches are being explored to reduce the amount of driving currently re-
quired to pickup waste, including consolidating trash hauling by district or neighborhood.
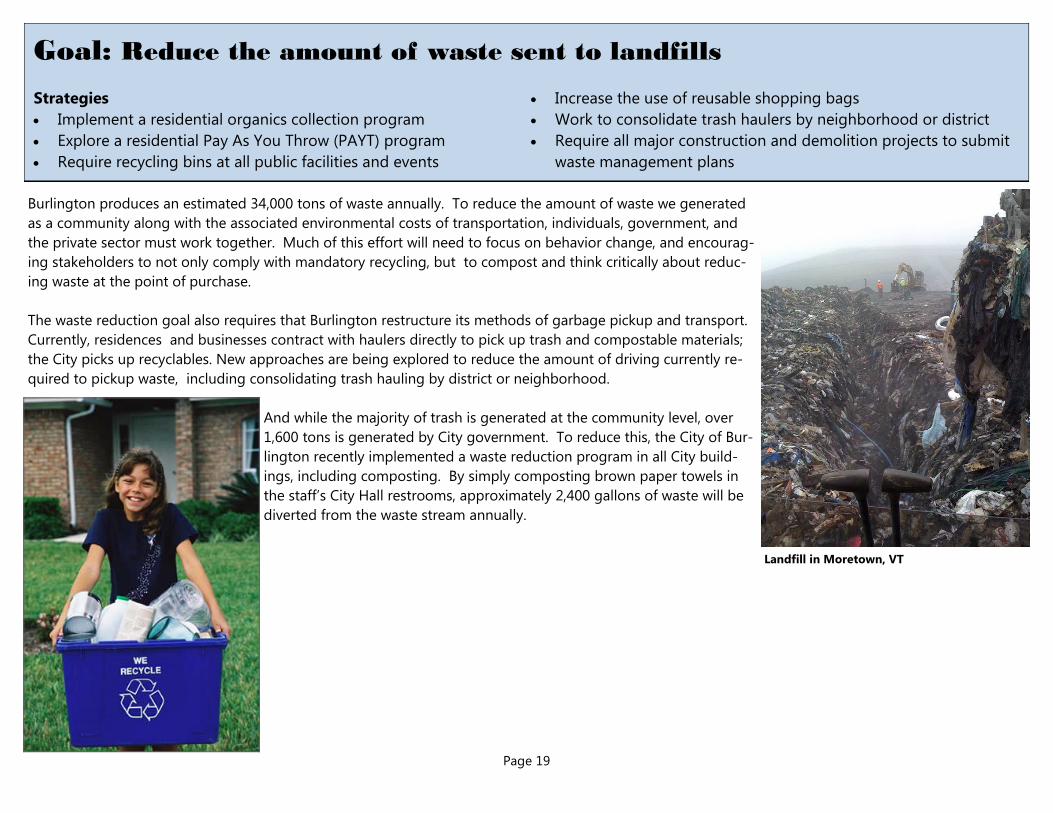
And while the majority of trash is generated at the community level, over
1,600 tons is generated by City government. To reduce this, the City of Bur-
lington recently implemented a waste reduction program in all City build-
ings, including composting. By simply composting brown paper towels in
the staff’s City Hall restrooms, approximately 2,400 gallons of waste will be
diverted from the waste stream annually.
Strategies
Implement a residential organics collection program
Explore a residential Pay As You Throw (PAYT) program
Require recycling bins at all public facilities and events
Increase the use of reusable shopping bags
Work to consolidate trash haulers by neighborhood or district
Require all major construction and demolition projects to submit
waste management plans
Landfill in Moretown, VT
Page 20
MOVING FORWARD The Burlington Climate Action Plan identifies a coordinated set of strategies that everyone who
lives in, works in or visits Burlington can adopt to help reduce our city’s carbon footprint and en-
hance our quality of life. It is a call to action for each of us to be thoughtful, persistent and com-
mitted.
Most of the strategies in the Plan will provide net benefits to residents, businesses and other or-
ganizations. While we recognize that these are aggressive goals, they can be achieved by working
together, spending money wisely, accomplishing multiple objectives with existing programs and
harnessing new funds from federal, state and local government, along with utilities, foundations
and corporations. As we move forward, each strategy must be continuously assessed and moni-
tored. To help with that process, the City’s Green Team has been formed to review performance
against our goals and to recommend revisions, adjustments and improvements.
Timely and efficient implementation this plan will require regular updates of our greenhouse gas
inventory so that progress can be tracked, allowing the City to evaluate and re-evaluate the effectiveness of the strategies. It is also essential to
note that current strategies might change or new strategies might surface depending on emerging technology, change in financial and staff re-
sources, and as our commitment to climate planning grows. These continuous efforts mean that the Climate Action Plan is a work-in-progress, re-
quiring on-going time, diligence, and effort.
The goal and strategies identified below have been developed and added to ensure a seamless and constant implementation of the strategies
identified in this plan:
GOAL: ENSURE THE IMPLEMENTATION OF THE CLIMATE ACTION PLAN (CAP) THROUGH CONSTANT COORDINATION
WITH STAKEHOLDERS AND REGULAR ANNUAL ASSESSMENT OF THE CITY’S PROGRESS.
Develop a progress assessment structure that would include: annual progress report format, GHG emissions inventory 3-year update and peri-
odical revisit of all strategies’ relevance.
Create a Sustainability Coordinator position responsible for the management and implementation of Burlington's Climate Action Plan. This
position will involve assessing progress as well as overseeing the involvement of partner agencies such as the City’s Green Team.
Empower the City’s Green Team to take on the implementation of the Climate Action Plan in conjunction with the Sustainability Coordinator.
Page 21
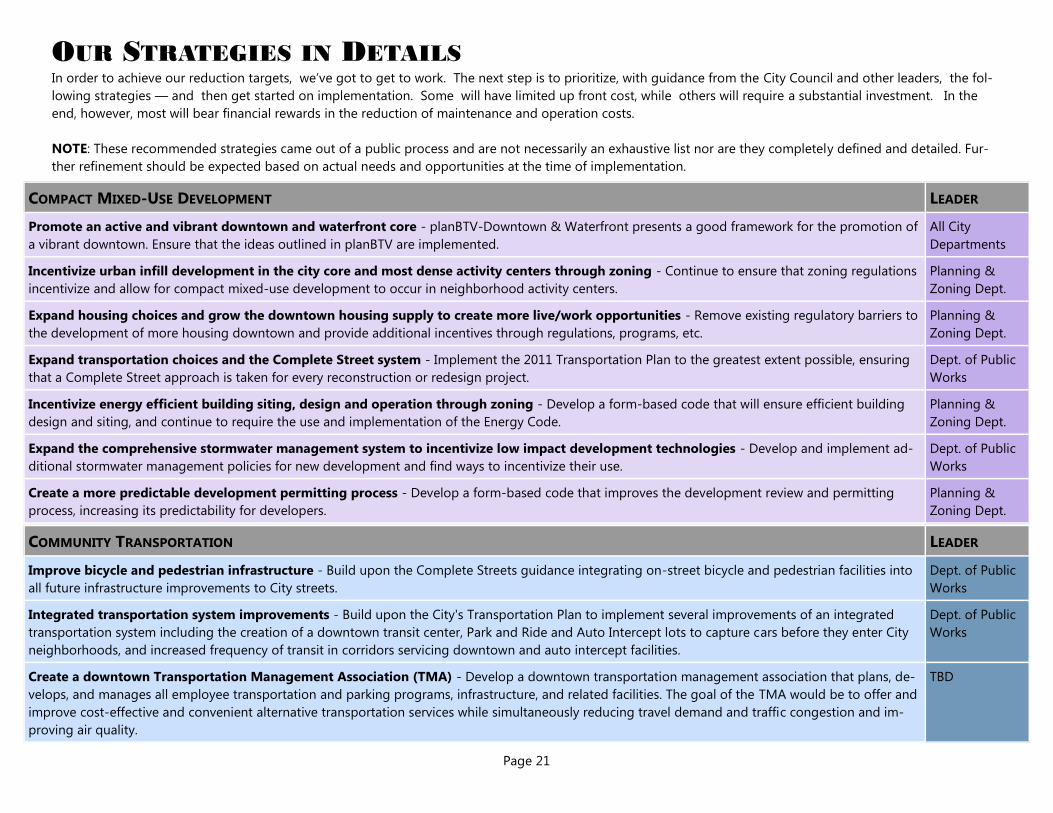
COMMUNITY TRANSPORTATION LEADER
Improve bicycle and pedestrian infrastructure - Build upon the Complete Streets guidance integrating on-street bicycle and pedestrian facilities into
all future infrastructure improvements to City streets.
Dept. of Public
Works
Integrated transportation system improvements - Build upon the City's Transportation Plan to implement several improvements of an integrated
transportation system including the creation of a downtown transit center, Park and Ride and Auto Intercept lots to capture cars before they enter City
neighborhoods, and increased frequency of transit in corridors servicing downtown and auto intercept facilities.
Dept. of Public
Works
Create a downtown Transportation Management Association (TMA) - Develop a downtown transportation management association that plans, de-
velops, and manages all employee transportation and parking programs, infrastructure, and related facilities. The goal of the TMA would be to offer and
improve cost-effective and convenient alternative transportation services while simultaneously reducing travel demand and traffic congestion and im-
proving air quality.
TBD
OUR STRATEGIES IN DETAILS
In order to achieve our reduction targets, we’ve got to get to work. The next step is to prioritize, with guidance from the City Council and other leaders, the fol-
lowing strategies — and then get started on implementation. Some will have limited up front cost, while others will require a substantial investment. In the
end, however, most will bear financial rewards in the reduction of maintenance and operation costs.
NOTE: These recommended strategies came out of a public process and are not necessarily an exhaustive list nor are they completely defined and detailed. Fur-
ther refinement should be expected based on actual needs and opportunities at the time of implementation.
COMPACT MIXED-USE DEVELOPMENT LEADER
Promote an active and vibrant downtown and waterfront core - planBTV-Downtown & Waterfront presents a good framework for the promotion of
a vibrant downtown. Ensure that the ideas outlined in planBTV are implemented.
All City
Departments
Incentivize urban infill development in the city core and most dense activity centers through zoning - Continue to ensure that zoning regulations
incentivize and allow for compact mixed-use development to occur in neighborhood activity centers.
Planning &
Zoning Dept.
Expand housing choices and grow the downtown housing supply to create more live/work opportunities - Remove existing regulatory barriers to
the development of more housing downtown and provide additional incentives through regulations, programs, etc.
Planning &
Zoning Dept.
Expand transportation choices and the Complete Street system - Implement the 2011 Transportation Plan to the greatest extent possible, ensuring
that a Complete Street approach is taken for every reconstruction or redesign project.
Dept. of Public
Works
Incentivize energy efficient building siting, design and operation through zoning - Develop a form-based code that will ensure efficient building
design and siting, and continue to require the use and implementation of the Energy Code.
Planning &
Zoning Dept.
Expand the comprehensive stormwater management system to incentivize low impact development technologies - Develop and implement ad-
ditional stormwater management policies for new development and find ways to incentivize their use.
Dept. of Public
Works
Create a more predictable development permitting process - Develop a form-based code that improves the development review and permitting
process, increasing its predictability for developers.
Planning &
Zoning Dept.
Page 22
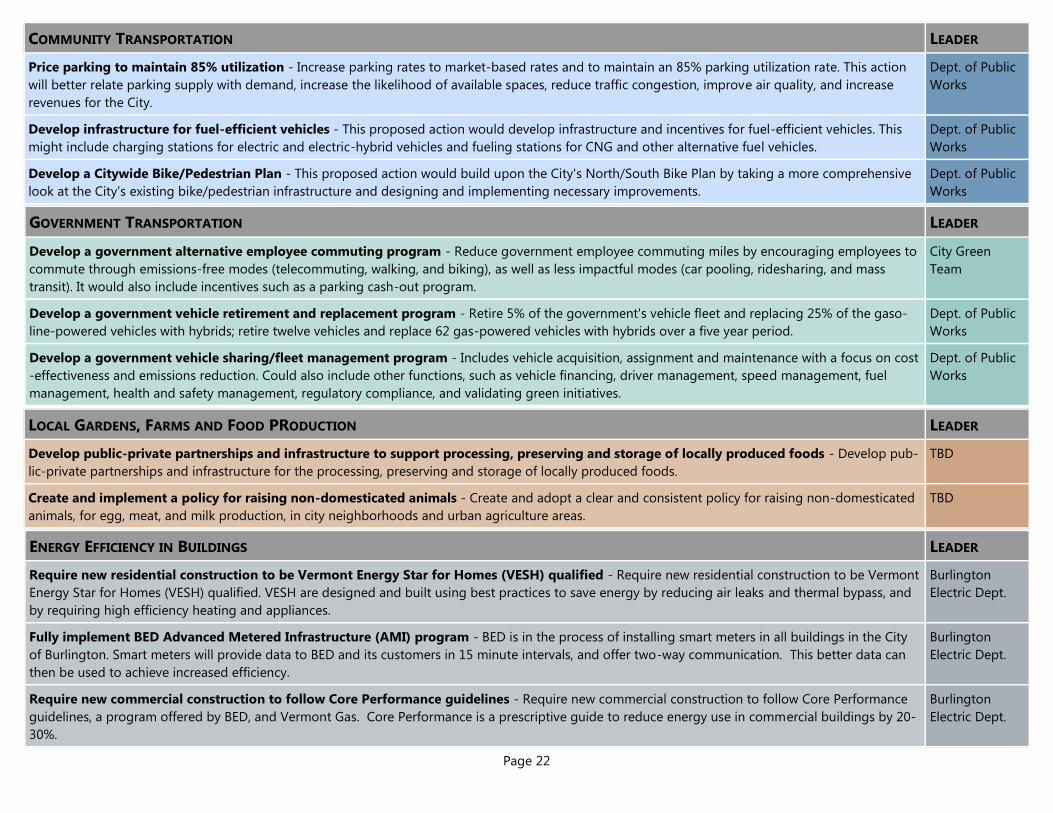
LOCAL GARDENS, FARMS AND FOOD PRODUCTION LEADER
Develop public-private partnerships and infrastructure to support processing, preserving and storage of locally produced foods - Develop pub-
lic-private partnerships and infrastructure for the processing, preserving and storage of locally produced foods.
TBD
Create and implement a policy for raising non-domesticated animals - Create and adopt a clear and consistent policy for raising non-domesticated
animals, for egg, meat, and milk production, in city neighborhoods and urban agriculture areas.
TBD
ENERGY EFFICIENCY IN BUILDINGS LEADER
Require new residential construction to be Vermont Energy Star for Homes (VESH) qualified - Require new residential construction to be Vermont
Energy Star for Homes (VESH) qualified. VESH are designed and built using best practices to save energy by reducing air leaks and thermal bypass, and
by requiring high efficiency heating and appliances.
Burlington
Electric Dept.
Fully implement BED Advanced Metered Infrastructure (AMI) program - BED is in the process of installing smart meters in all buildings in the City
of Burlington. Smart meters will provide data to BED and its customers in 15 minute intervals, and offer two-way communication. This better data can
then be used to achieve increased efficiency.
Burlington
Electric Dept.
Require new commercial construction to follow Core Performance guidelines - Require new commercial construction to follow Core Performance
guidelines, a program offered by BED, and Vermont Gas. Core Performance is a prescriptive guide to reduce energy use in commercial buildings by 20-
30%.
Burlington
Electric Dept.
GOVERNMENT TRANSPORTATION LEADER
Develop a government alternative employee commuting program - Reduce government employee commuting miles by encouraging employees to
commute through emissions-free modes (telecommuting, walking, and biking), as well as less impactful modes (car pooling, ridesharing, and mass
transit). It would also include incentives such as a parking cash-out program.
City Green
Team
Develop a government vehicle retirement and replacement program - Retire 5% of the government's vehicle fleet and replacing 25% of the gaso-
line-powered vehicles with hybrids; retire twelve vehicles and replace 62 gas-powered vehicles with hybrids over a five year period.
Dept. of Public
Works
Develop a government vehicle sharing/fleet management program - Includes vehicle acquisition, assignment and maintenance with a focus on cost
-effectiveness and emissions reduction. Could also include other functions, such as vehicle financing, driver management, speed management, fuel
management, health and safety management, regulatory compliance, and validating green initiatives.
Dept. of Public
Works
COMMUNITY TRANSPORTATION LEADER
Price parking to maintain 85% utilization - Increase parking rates to market-based rates and to maintain an 85% parking utilization rate. This action
will better relate parking supply with demand, increase the likelihood of available spaces, reduce traffic congestion, improve air quality, and increase
revenues for the City.
Dept. of Public
Works
Develop infrastructure for fuel-efficient vehicles - This proposed action would develop infrastructure and incentives for fuel-efficient vehicles. This
might include charging stations for electric and electric-hybrid vehicles and fueling stations for CNG and other alternative fuel vehicles.
Dept. of Public
Works
Develop a Citywide Bike/Pedestrian Plan - This proposed action would build upon the City's North/South Bike Plan by taking a more comprehensive
look at the City's existing bike/pedestrian infrastructure and designing and implementing necessary improvements.
Dept. of Public
Works
Page 23
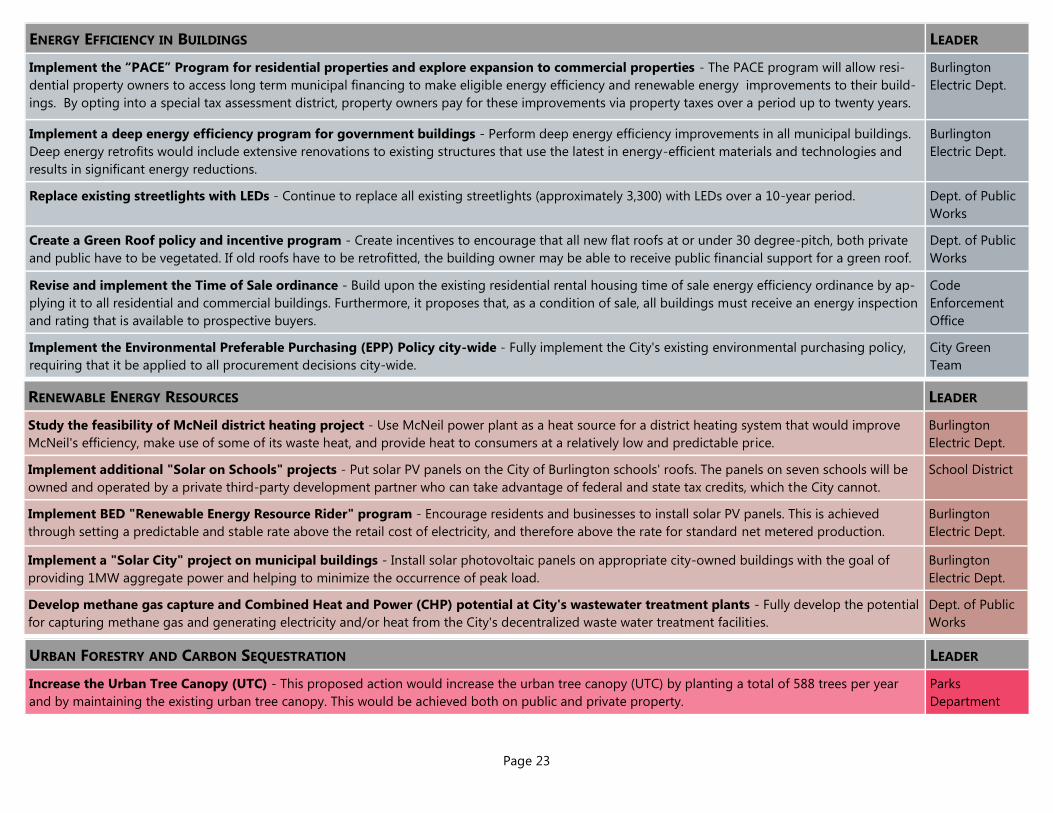
RENEWABLE ENERGY RESOURCES LEADER
Study the feasibility of McNeil district heating project - Use McNeil power plant as a heat source for a district heating system that would improve
McNeil's efficiency, make use of some of its waste heat, and provide heat to consumers at a relatively low and predictable price.
Burlington
Electric Dept.
Implement additional "Solar on Schools" projects - Put solar PV panels on the City of Burlington schools' roofs. The panels on seven schools will be
owned and operated by a private third-party development partner who can take advantage of federal and state tax credits, which the City cannot.
School District
Implement BED "Renewable Energy Resource Rider" program - Encourage residents and businesses to install solar PV panels. This is achieved
through setting a predictable and stable rate above the retail cost of electricity, and therefore above the rate for standard net metered production.
Burlington
Electric Dept.
Implement a "Solar City" project on municipal buildings - Install solar photovoltaic panels on appropriate city-owned buildings with the goal of
providing 1MW aggregate power and helping to minimize the occurrence of peak load.
Burlington
Electric Dept.
Develop methane gas capture and Combined Heat and Power (CHP) potential at City's wastewater treatment plants - Fully develop the potential
for capturing methane gas and generating electricity and/or heat from the City's decentralized waste water treatment facilities.
Dept. of Public
Works
URBAN FORESTRY AND CARBON SEQUESTRATION LEADER
Increase the Urban Tree Canopy (UTC) - This proposed action would increase the urban tree canopy (UTC) by planting a total of 588 trees per year
and by maintaining the existing urban tree canopy. This would be achieved both on public and private property.
Parks
Department
ENERGY EFFICIENCY IN BUILDINGS LEADER
Implement the “PACE” Program for residential properties and explore expansion to commercial properties - The PACE program will allow resi-
dential property owners to access long term municipal financing to make eligible energy efficiency and renewable energy improvements to their build-
ings. By opting into a special tax assessment district, property owners pay for these improvements via property taxes over a period up to twenty years.
Burlington
Electric Dept.
Implement a deep energy efficiency program for government buildings - Perform deep energy efficiency improvements in all municipal buildings.
Deep energy retrofits would include extensive renovations to existing structures that use the latest in energy-efficient materials and technologies and
results in significant energy reductions.
Burlington
Electric Dept.
Replace existing streetlights with LEDs - Continue to replace all existing streetlights (approximately 3,300) with LEDs over a 10-year period. Dept. of Public
Works
Create a Green Roof policy and incentive program - Create incentives to encourage that all new flat roofs at or under 30 degree-pitch, both private
and public have to be vegetated. If old roofs have to be retrofitted, the building owner may be able to receive public financial support for a green roof.
Dept. of Public
Works
Revise and implement the Time of Sale ordinance - Build upon the existing residential rental housing time of sale energy efficiency ordinance by ap-
plying it to all residential and commercial buildings. Furthermore, it proposes that, as a condition of sale, all buildings must receive an energy inspection
and rating that is available to prospective buyers.
Code
Enforcement
Office
Implement the Environmental Preferable Purchasing (EPP) Policy city-wide - Fully implement the City's existing environmental purchasing policy,
requiring that it be applied to all procurement decisions city-wide.
City Green
Team

Page 24
WASTE REDUCTION AND RECYCLING LEADER
Implement residential organics collection program - Collect residential organic food waste (no yard waste) to be composted and would be modeled
after the existing City residential recycling program, thus having a similar infrastructure and cost profile.
Dept. of Public
Works
Explore a residential Pay As You Throw (PAYT) program - Change the current residential collection payment system to a system in which residents
pay per unit of trash collected. Programs like these result in a decrease of solid waste, as well as overall cost savings to participants. The current physi-
cal system would remain the same.
Dept. of Public
Works
Require recycling bins at all public facilities and events - Require that recycling bins are available and maintained at all public facilities and events. Parks & Recrea-
tion Dept.
Increase the use of reusable shopping bags - Create incentives for increase usage of reusable shopping bags and the complementary reduction of
disposable plastic bags.
Businesses
Work to consolidate trash haulers by neighborhood or district - Consolidate trash haulers by neighborhood or district, thereby limiting the number
of trucks driving through the city, reducing vehicle miles and congestion, and improving air quality.
Chittenden
Solid Waste
District (CSWD)
Require all major construction and demolition projects to submit a waste management plan - Require construction and demolition (C&D) projects
to submit a waste management plan. Such a plan would include: waste recycling, salvage or reuse goals; estimated types and quantities of materials or
waste generated from the project site; proposed and intended disposal methods for these materials; and detailed instructions for subcontractors and
laborers on how to safely separate or collect the materials at the job site.
Planning &
Zoning Dept.
Page 25
ACKNOWLEDGEMENTS
Mayor
Miro Weinberger
Key City Staff
Jennifer Green, Community and Economic Development
Sandrine Thibault, Department of Planning & Zoning
Other Key Participants
Beth Truzanksy, Community and Economic Development Office
Bob Kiss, Mayor of Burlington (formerly)
Chris Burns, Burlington Electric Department
Chris Giard, Burlington School District
Dan Bradley, Department of Public Works (formerly)
David E. White, Department of Planning & Zoning
Gary Greenwood, Department of Public Works
Glenn McRae, Intervale Center (formerly)
Heather Kendrew, Burlington International Airport
Jake Yanulavich, Burlington Electric Department
James Gibbons, Burlington Electric Department
Jan Schultz, District Energy System Committee
Jarlath O’Neil-Dunne, University of Vermont
Jay Appleton, Department of Planning and Zoning
Jim Flint, Friends of Burlington Gardens
Jon Adams-Kollitz, Parks and Recreation Department
Julia B. Breul, University of Vermont
Ken Nolan, Burlington Electric Department
Laurie Adams, Department of Public Works
Marge Keough, Chittenden Solid Waste District
Mary Sullivan, Burlington Electric Department
Megan Moir, Department of Public Works
Nancy Plunkett, Chittenden Solid Waste District
Nathan Wildfire, Community and Economic Development Department
Nicole Losch, Department of Public Works
Pablo S. Bose, University of Vermont
Peter Owens, Community and Economic Development Department
Ron Lafountain, Burlington Electric Department
Steve Roy, Department of Public Works
Tim Grover, Department of Public Works
Tracey Tsugawa, University of Vermont & Vermont Human Rights Com-
mission
Warren Spinner, Department of Parks & Recreation
Consultants
Spring Hill Solutions
Shelly Martin, Earth Shift, formerly of Spring Hill Solutions
Funding for this project was largely provided by the Federal Recovery
Act – Energy Efficiency and Conservation Block Grants – Formula Grants