CLIMATE ACTION PLAN - Bedford 2020bedford2020.org/assets/Action Plan_Final.pdf · 4 | Bedford...
123
CLIMATE ACTION PLAN a project Final Draft | January 19, 2010 T own of B edford
Transcript of CLIMATE ACTION PLAN - Bedford 2020bedford2020.org/assets/Action Plan_Final.pdf · 4 | Bedford...

C L I M AT EACTION PLAN
a project
Final Draft | January 19, 2010
Town of Bedford

Town of BedfordBedford Town House321 Bedford RoadBedford Hills, NY 10507

LeTTer from the SuperviSor
We are at a watershed moment in Bedford’s history. After more than two years of inspired work by the Bedford Energy Advisory Panel our Climate Action Plan is ready to be unveiled and their successor organization, “Bedford 2020 Coali-tion” is about to be born. In April of 2007, the Town Board appointed an Energy Advisory Panel com-posed of nine individuals from a cross section of our three hamlets, all with a keen interest in the environment. These nine individuals deserve our heartfelt thanks for their countless hours of work and their commitment to our Town. The panel included; Mary Beth Kass; chair, Simon Skolnick, Mark Thielking, Janet Harckham, Dr. Stuart Weitzman, Neal Hundt, Shirley Bianco, Daniel Martin and Bill Abranowicz with early support from Lisa Schwartz. The panel’s charge was to measure our greenhouse gas emissions and to develop a plan for the Town of Bedford to reduce those emissions 20% by the year 2020. One of the most effective tools in this process was for the town to join ICLEI, Local Governments for Sustainability, an international organization dedicated to helping local governments measure their greenhouse gas emissions, es-tablish reduction targets, develop a plan to meet those targets, implement the measures in the town’s plan and, subsequently, monitor progress. The Bedford Plan focuses on four sectors; Energy, Transportation, Land + Wa-ter Use and Waste + Recycling. Within these sectors are many sub-categories that are incorporated into the broader topics. This is not a government plan or strictly for municipal use, but it encompasses our businesses, residences, schools and virtually every segment of our Town. We are all partners in this endeavor and we encourage your participation in helping us achieve our goal. This effort will affect everything we do, from the cars we drive, to the houses we build, to the food we eat; but the rewards will be great. We will be sav-ing money and we will be living healthier lives. By conserving energy we can achieve our ultimate goal of being a sustainable community. We cannot change the whole world but we can affect what happens in our Town and by doing so, insure a better future for ourselves and for generations to come.
Sincerely,
Lee V.A. RobertsSupervisor, Town of Bedford
1

Community GHG Emissions
Waste5%Transportation
27%
Residential53%
Commercial15%
Sector
Residential 146,451 1,806,823
Commercial 40,116 400,452
Transport 74,693 959,118
Waste 14,691
Total 275,951 3,166,393
GHGemissions
(tonnes
CO2e)
Energyequivalent
(MMBtu)
2 | Bedford Climate Action Plan
I. Bedford’s Commitment
In April, 2007, Supervisor Lee Roberts and the Bedford Town Board ap-pointed the Bedford Energy Advisory Panel (BEAP), consisting of nine in-dividuals representing a cross section of our community. The panel was asked to study the issues relating to climate change and carbon emissions and produce a Climate Action Plan for the Town of Bedford that would provide a blueprint for reducing community-wide greenhouse gas (GHG) emissions. BEAP’s first step was to join ICLEI, Local Governments for Sus-tainability, a membership association of more than 500 national and 1,000 international local governments committed to mitigating climate change. ICLEI assists in calculating a town’s GHG emissions, establishing targets to reduce those emissions, developing a Climate Action Plan to meeting defined targets, implementing the measures in the Climate Action Plan and monitoring progress.
In November 2007, the Town Board took further action by passing a resolu-tion, committing to a reduction of Bedford’s GHG emissions by 20% by the year 2020. This is an aggressive goal that will have a meaningful impact on the global effort to mitigate climate change through local action, and will improve the quality of life in our own town.
The Bedford Energy Advisory Panel has spent the last two years collecting and examining data on energy consumption and waste generation across all sectors, speaking with experts, researching best practices and working with the town department heads to select the reduction measures with the most impact and greatest feasibility for Bedford.
II. Bedford’s Greenhouse Gas Emissions Inventory (Pages 18-21)
The first step toward reducing greenhouse gas emissions is to identify base-line levels of emissions in the Town of Bedford, as well as the sources and sectors of our community and government operations most responsible for those emissions. This information was key in selecting our reduction target as well as the reduction measures contained in this plan.
execuTive Summary
Municipal GHGEmissions
Waste1%
Street Lights5%
Buildings74%
Vehicle Fleet20%
Sector
Buildings 4,000 64,611
Vehicle Fleet 1,056 13,466
Streetlights 251 2,118
Waste
Total 5,360 80,194
GHGemissions
(tonnes
CO2e)
Energyequivalent
(MMBtu)
53
3
Community Emissions Inventory
In our chosen base year 2004, the community of the Town of Bedford emit-ted approximately 275,951 tonnes of CO2 equivalent (CO2e). Residential use was the greatest contributor to GHG emissions at 53% of the total. The Commercial sector contributed 15%, Transportation contributed 27%, and Waste contributed 5% of the community’s total greenhouse gas output.
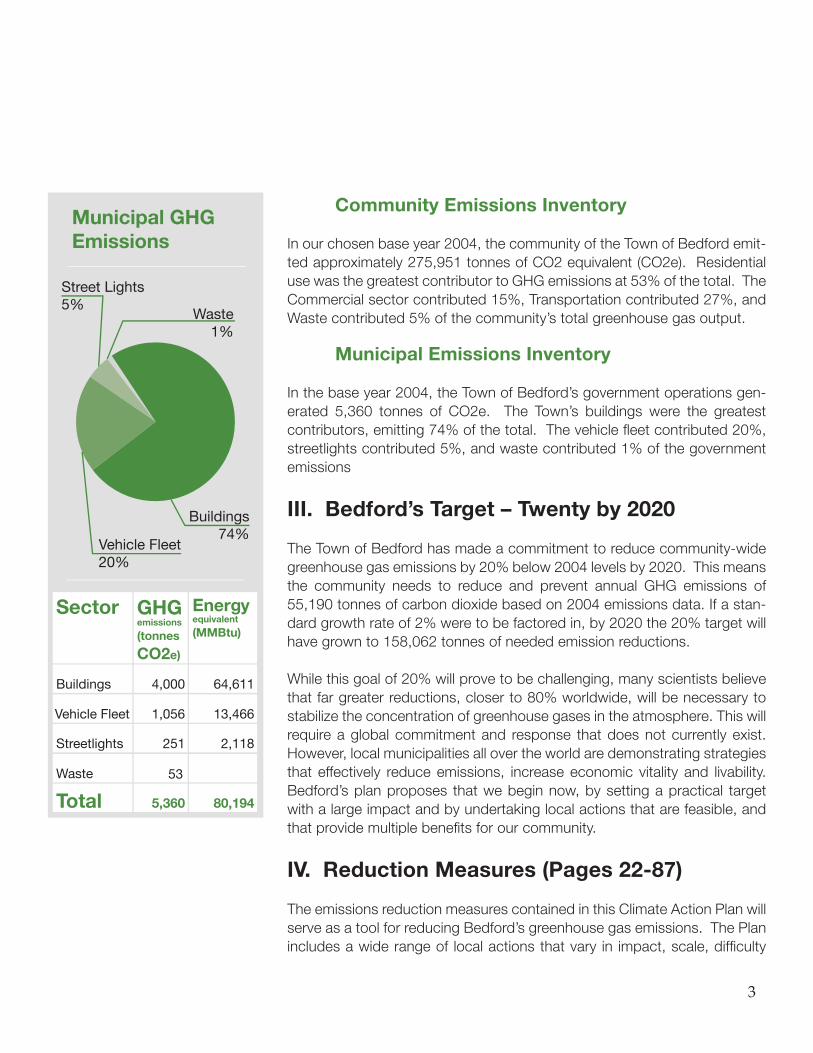
Municipal Emissions Inventory
In the base year 2004, the Town of Bedford’s government operations gen-erated 5,360 tonnes of CO2e. The Town’s buildings were the greatest contributors, emitting 74% of the total. The vehicle fleet contributed 20%, streetlights contributed 5%, and waste contributed 1% of the government emissions
III. Bedford’s Target – Twenty by 2020
The Town of Bedford has made a commitment to reduce community-wide greenhouse gas emissions by 20% below 2004 levels by 2020. This means the community needs to reduce and prevent annual GHG emissions of 55,190 tonnes of carbon dioxide based on 2004 emissions data. If a stan-dard growth rate of 2% were to be factored in, by 2020 the 20% target will have grown to 158,062 tonnes of needed emission reductions.
While this goal of 20% will prove to be challenging, many scientists believe that far greater reductions, closer to 80% worldwide, will be necessary to stabilize the concentration of greenhouse gases in the atmosphere. This will require a global commitment and response that does not currently exist. However, local municipalities all over the world are demonstrating strategies that effectively reduce emissions, increase economic vitality and livability. Bedford’s plan proposes that we begin now, by setting a practical target with a large impact and by undertaking local actions that are feasible, and that provide multiple benefits for our community.
IV. Reduction Measures (Pages 22-87)
The emissions reduction measures contained in this Climate Action Plan will serve as a tool for reducing Bedford’s greenhouse gas emissions. The Plan includes a wide range of local actions that vary in impact, scale, difficulty

4 | Bedford Climate Action Plan
and timeframe. This list is intended to inspire the community to change its behavior in myriad ways in order to reach our goal of Twenty by 2020. The recommended measures might be adopted in whole or in part or, some, not at all. Achieving the emissions reduction target will require a community-wide process that involves all sectors of the community – residents, busi-nesses, institutions and government.
The recommended actions contained in the plan have been grouped into four sectors: Energy, Transportation, Waste/Recycling and Land Use. Each sector is subdivided into municipal and community to illustrate how govern-ment and nongovernmental groups can take significant actions to achieve our goal.
These measures are intended to be recommendations. The many options listed in each category will be prioritized, refined and implemented in the months and years ahead. Some of these actions are already in progress, some will require further study, and some may not be feasible at this time.
Below is a summary of the recommended strategies for each sector in-cluded in the plan. See the corresponding pages for detailed recommenda-tions: 22-85
Energy (pages 25-49)
The measures contained in this section have the greatest potential to achieve our goal of Twenty by 2020. Implementation of these measures will encour-age us to examine how our homes and offices impact the environment, how we can live more economically and more sustainably by adopting the energy saving technologies available to us. Reducing GHG emissions from building energy use in Bedford will require action in two areas:
• Improving energy efficiency -- Achieving higher energy efficiency means being smarter about how we design and construct new buildings and also how we retrofit our existing housing and commercial stock.
• Increasing the number of renewable sources of electricity (such as so-lar, wind, hydroelectric and geothermal.) -- The support, research and development of clean, renewable sources of energy are also essential if we are to maintain our rate of growth and continued demand for energy. Unlike our existing fossil fuel infrastructure, renewables take advantage of infinite, natural and free resources and do not contribute to GHG emissions or air pollution.
Business as Usual
2004 2020
275,951
220,761
434,013
20%
Assuming an annual 2% growth rate, Bedford needs to reduce the predicted “Business as Usual” 2020 emissions by an additional 102,872 tonnes of CO2e in order to reach the desired 20% reduction below 2004 levels

5
Transportation (pages 51-66)
The measures contained in this section may be the most challenging to implement, as shifting demand away from the personal vehicle and toward alternative modes of transportation is dependent upon personal choice. In Bedford, transportation accounts for 27% of our greenhouse gas emis-sions, in addition to contributing countless other pollutants to the atmo-sphere. There are four principal ways to reduce the emissions from trans-portation vehicles in Bedford:
• Reduce the total number of miles traveled by switching transportation to mass transit, bicycling, and walking.
• Improve and increase bicyle use for transporation and recreation by con-structing more walkways and/or bicycle paths to connect the hamlets.
• Shift to more fuel-efficient cars by trading in larger, less efficient vehicles for smaller vehicles, or purchasing hybrid electric vehicles.
• Switch to fuels that emit fewer pollutants, such as biodiesel and com-pressed natural gas (CNG).
Waste + Recycling (pages 67-76)
The Waste Sector contributes 5% of the Town of Bedford’s annual green-house gas emissions. However, it is important to note that in gathering data for Bedford, we considered only waste that was generated within our town borders. Direct emissions are not reflected in our town’s data because Bedford does not have a landfill. However, the consumption habits and dis-posal methods of the residents of Bedford are contributing to greenhouse gas emissions that would be counted in the inventory of the city in which the landfill is located.
While we may not measure a high percentage of emissions from the Waste Sector in our town, we have a responsibility to examine our existing waste generation and disposal in order to reduce emissions wherever they are measured.
The measures outlined in this section focus on the following actions in our homes and businesses:
• Conducting a waste audit to determine the source and make up of Bedford’s waste.
• Reducing waste by encouraging less consumption, the purchasing of items with less packaging, and the reuse of items.

• Increasing recycling, composting and related services among Bedford residents and businesses and expanding the types of materials that can be recycled and composted.
Land + Water Use (Pages 77-87)
Land use planning includes strategies for preserving the natural environ-ment, conserving water, and minimizing the use of automobiles so that we can reduce greenhouse gas emissions and better enjoy the beauty and luxury of our natural resources. The measures contained within this sector of the Climate Action Plan support, enhance and complement the goals and recommendations in the Bedford Comprehensive Plan and focus on:
• Water conservation measures such as low flow fixtures and modifying water use behaviors
• Transit-oriented development that directs growth to areas within walk-ing and biking distance of mass transit
• Landscape alternatives, including the use of native plants and drought resistant grasses, planting trees to shade buildings and reduce runoff, organic landscape maintenance and the use of rain water collection systems such as rain barrels.
• Increasing the supply, availability, and consumption of local food.
V. Implementation (Pages 88-97)
Town Board approval of the Climate Action Plan will be the final step in tran-sitioning from the government appointed Bedford Energy Advisory Panel to a community-wide partnership including municipal government, residents, local businesses, schools, civic and religious entities. On the municipal lev-el, local government will implement municipal measures. On the community level, a new entity, the Bedford 2020 Coalition will be created as a private, nonprofit corporation whose mission will be to organize, facilitate and work with each stakeholder to implement the community actions set forth in the Climate Action Plan. It is anticipated that the Bedford 2020 Coalition will oversee the creation of a total of 11 Task Forces, led by community mem-bers, focused on the following six subject areas: energy, waste/recycling, transportation, land use, food/agriculture, and water. In addition, there will be four Task Forces focused on users in the community, such as residents, businesses, schools and civic/religious entities. The last Task Force will be focused on marketing and PR as we try to educate the community about the benefits of changed behavior. Under the leadership of the Bedford 2020 Coalition, each Task Force will be interacting with the others to assist in implementation of the Climate Action Plan.

TaBLe of conTenTS
I. Introduction . . . . . . . . . . . . . . . . . . . . . . . . . . . . 9 a. Climate Science . . . . . . . . . . . . . . . . . . . . . . . . 9 b. International & National Policy . . . . . . . . . . . . . . . . . 10 c. Our Climate Action Plan (CAP) . . . . . . . . . . . . . . . . 11 d. Sustainable Bedford . . . . . . . . . . . . . . . . . . . . . . 14 II. Greenhouse Gas Emissions Inventory . . . . . .18 a. Introduction . . . . . . . . . . . . . . . . . . . . . . . . . 18 b. Methodology and Model . . . . . . . . . . . . . . . . . . . . 19 c. Creating the Inventory . . . . . . . . . . . . . . . . . . . . . 19 d. Community Emissions Inventory . . . . . . . . . . . . . . 20 e. Municipal Emissions Inventory . . . . . . . . . . . . . . . . 21 f. Conclusion . . . . . . . . . . . . . . . . . . . . . . . 21
III. Reduction Measures . . . . . . . . . . . . . . . . . . . . . 22 a. Summary . . . . . . . . . . . . . . . . . . . . . . . . . . 22 b. Energy . . . . . . . . . . . . . . . . . . . . . . . . . . . 25 Municipal . . . . . . . . . . . . . . . . . . . . . . 26 Community . . . . . . . . . . . . . . . . . . . . . . 34 c. Transportation . . . . . . . . . . . . . . . . . . . . . . . . . 51 Municipal . . . . . . . . . . . . . . . . . . . . . . 52 Community . . . . . . . . . . . . . . . . . . . . . 56 d. Waste + Recycling . . . . . . . . . . . . . . . . . . . . . . 67 Municipal . . . . . . . . . . . . . . . . . . . . . . . 68 Community . . . . . . . . . . . . . . . . . . . . . . 70 e. Land + Water Use . . . . . . . . . . . . . . . . . . . . . . . 77 Municipal . . . . . . . . . . . . . . . . . . . . . . . 78 Community . . . . . . . . . . . . . . . . . . . . . . 81 IV. Implementation . . . . . . . . . . . . . . . . . . . . . . . 88 a. Bedford 2020 Coalition . . . . . . . . . . . . . . . . 88 b. Measuring Our Progress . . . . . . . . . . . . . . . . . . . 89 c. Implementation Timeframe Table . . . . . . . . . . . . . . . . 89
V. Glossary & Acronyms . . . . . . . . . . . . . . . . . . . 97 VI. Acknowledgements . . . . . . . . . . . . . . . . . . . . 100
VII. Sources . . . . . . . . . . . . . . . . . . . . . . . . . 101
VIII. Appendix . . . . . . . . . . . . . . . . . . . . . . . . . 102

Some of the infra-red radiation passes through the atmo-sphere, but most is absorbed and re-emitted in all direc-tions by greenhouse gas molecules and clouds. The effect of this is to warm the Earth’s surface and the lower atmo-sphere.
Solar radiation powers the climate system
About half of the solar ra-diation is absorbed by the earth’s surface and warms it
Infrared radiation is emit-ted from the earth’s sur-face.
The Greenhouse Effect
Some solar radiation is reflected by the earth and the atmosphere
8 | Bedford Climate Action PlanSource of data: the Union of Concerned Scientists

9
inTroducTionClimate change is fast becoming the most pressing issue facing the global community. The warning signs like intensified weather patterns, Arctic sea ice melt and sea level rise are only the beginning, and foreshadow far worse and more localized changes over the next century. The scientific consensus reveals human actions as the most likely cause of our climate’s destabiliza-tion, which leaves us with the task of reversing these changes and repairing our planet’s health.
a. Climate Science
The Earth’s atmosphere is naturally composed of a number of gases that blanket the surface and act like the glass panes of a greenhouse. These “greenhouse gases” (GHGs) absorb outgoing heat and re-radiate energy back down to the surface, warming the earth and making it stable and hospitable for life at an average temperature of 60ºF. Without the natural warming effect of these gases the average surface temperature of the Earth would be around 14ºF.
However, recently elevated concentrations of these gases in the atmosphere have had a de-stabilizing effect on the global climate, fueling the phenom-enon commonly referred to as climate change. Carbon dioxide (CO2) is the most important anthropogenic (caused or produced by humans) GHG. Our adoption of a highly industrialized economy has resulted in a need for fossil fuel industries that continuously pump additional CO2 into the atmo-sphere. Due to our current reliance on the burning of fossil fuels like oil and coal, annual CO2 emissions have grown between 1970 and 2004 by about 80%, and represent 77% of total anthropogenic GHG emissions in 2004. This drastic GHG increase since the mid 1970s has resulted in a noticeable warming, raising the average surface temperature by about 1°F in the last 40 years. The eight warmest years on record have all occurred since 2001, with the warmest year being 2005. Additionally, it is predicted that the cli-mate will continue to warm at a rate of about 0.29ºF/decade or more if we don’t act now.
Because the climate and the atmosphere do not react in a linear fashion to increased greenhouse gases, it is impossible to predict what impact a ton of carbon dioxide will actually have on the global climate. The Earth’s climate has a number of feedback loops and tipping points that scientists fear will increase the unwanted effects of greenhouse gases and climate destabilization beyond the rate at which it is currently occurring. For ex-ample, polar ice caps are composed of highly reflective expanses of ice that act effectively like a giant mirror, reflecting the sun’s rays back into
Greenhouse Gases
Carbon Dioxide (CO2)Emitted in residential, commercial, industrial and transportation sectors during the burning of fossil fuels like oil, natural gas, coal and wood. CO2 accounts for 85% of U.S. Greenhouse Gas Emissions.
Methane (CH4)Emitted primarily during organic decomposition in land fills, agriculture and the raising of livestock. Methane accounts for 8% of U.S. GHG emissions and is about 25 times as potent as CO2.
Nitrous Oxide (N2O)Emitted during agriculture and industrial activies. Accounts for 5% of U.S. GHG emissions.
Other man-made GHGs include hydrofluorocarbons (HFCs), perfluorocarbons (PFCs), and sulfur hexafluoride (SF6).
i
Source of data: Worcester CAP and the World Resources Institute
*Sources cited on page 101

1900 2000
1°C
- 1°C
space. As the planet warms and some of this ice melts away, a darker land or ocean surface is revealed. This darker surface will tend to absorb more heat, accelerating the speed at which the planet warms with each ton of greenhouse gas emitted, and in turn melting more arctic ice reinforcing the positive feedback loop. Another example is the behavioral feedback loop associated with air conditioner use. As the climate warms, people, not ac-customed to the temperature change, buy more air conditioners and run them for extended periods of time. This results in a need for more energy production (often from fossil fuel sources) which warms the climate and en-courages the purchase of more air conditioners.
b. International & National Policy
Although efforts have been made on international and national scales to slow the changes, none have had any considerable lasting effect on climate legislation. Between 1997 and 1999, the Kyoto Protocol was negotiated in Japan, hop-ing to inspire industrialized countries to reduce their GHG emissions by 5% below 1990 levels. Even though this ambitious agreement has involved most of the global community in GHG reductions, the United States has remained hesitant to pledge support and sign. Currently however, the US is working to pass climate legislation that would impose a cap on emissions and reduce them 80% by 2050 through a Cap and Trade program while preparing for another round of climate negotia-tions in Copenhagen for COP15. Although mindful that these efforts will come to fruition at some point, we, in Bedford, have decided to take action locally and as soon as possible. We have joined ICLEI – Local Governments for Sustainability, agreed on a 20% GHG reduction by the year 2020 and are now publishing this Climate Action Plan while waiting for broader legislation to pass.
Annual Average Global Surface Temperature Shown in terms of anomalies °C relative to 1901 - 2000
from the U.S. EPA

c. Our Climate Action Plan (CAP)
By consciously acting to reduce GHG emissions on a local level, we have the opportunity to address the challenge of climate change directly, save resources and preserve the quality of our lives. By adopting a climate action plan, we can save money, create jobs, improve our health, promote energy security, and work towards addressing climate change without drastically changing our daily behavior. Economic Benefits + Job Creation
A low carbon future will promote cost saving technologies and increase job creation across the nation. We will be encouraging the use of more ef-ficient appliances, energy audits and building retrofits and other reduction measures that will all dramatically lower your utility bills. The development of a renewable energy infrastructure featuring solar and wind power will reinforce the resiliency of our local and national economy. The purchase of fuel efficient and alternative fueled cars and trucks will keep energy dollars in our country and region instead of exporting them to often hostile nations overseas.
This will create more jobs, save money for Bedford’s residents and drive demand for locally produced products and services. Bedford spends an average of $5,250 per household annually on electricity and heating fuels. If all of our 6400 households achieved 30% efficiency improvements through energy audits and retrofits, or more efficient appliances, our households would save an average of $1,575 and the community would collectively save over $10 million and create many new jobs.
Similarly, in transportation, if 500 vehicles earning 30 mpg were swapped out for vehicles achieving 45 mpg, the burning of 109,000 gallons of im-ported gasoline would be avoided and $215,000 dollars would be saved. Quality of Life + Health
In addition to countless economic benefits, climate protection can also im-prove community well being. By reducing greenhouse gas emissions and waste, we can make our environment a much healthier place to live in with cleaner air and water. Living spaces designed with natural light in mind also make for a less stressful and more productive lifestyle within. Outdoors, as we rethink our transportation and zoning patterns, we can encourage a more active lifestyle through biking and walking. Similarly, by eating locally produced, fresh food, we can lower greenhouse gas emissions associated with food production and improve our daily diet. Modern day agribusiness promotes unsustainable farming practices for
11
Air Pollutants
PollutantNitrogen Oxides (NOx)
Health Effects
Decreases lung function. Associ-ated with respi-ratory disease in children.
Sulfur Dioxide (SO2)
Causes cough-ing, weezing, shortness of breath, nasal congestion & inflammation. Makes asthma worse & destab-alizes heart rhythms. Can cause low birth weight & increased risk of infant death.
CarbonMonoxide (CO)
Can cause cardiovascular problems, chest pain & vision problems. Reduces your ability to work or learn & complete complex tasks. High levels can cause serious respiratory problems or death
Volatile OrganicCompounds(VOCs)
Can cause eye, nose and throat irritation, head-aches, loss of coordination, nausea, damage to liver, and central nervous system. Some may also cause cancer.
Source of data: Worcester, MA CAP
*Sources cited on page 101

both people and the earth with excessive use of pesticides and emissions generated with food transport. Eating organic, local food means that you are reducing food miles and consuming a better, healthier product. As a rural town, Bedford has great potential to build local food infrastructure. In Bedford, we are already aware of the decreasing quality of our air and the increased prevalence of diseases. Climate Change will bring about severe and longer heat waves that can threaten the health of the most vulnerable. Heat waves have already led to power outages, resulting in heat stroke and stress among the aging. Further, the EPA has classified Westchester as an air quality nonattainment area (meaning, not in compliance with air quality standards under the Clean Air Act) due to persistent ground level smog (ozone) and particulates. Bedford’s proximity to highway 684 and the Saw Mill River Parkway exposes its residents to additional levels of pollutants as vehicular emissions increase. Worsening air quality from the combina-tion of vehicular emissions, increased heat, and increased electrical usage are predicted to contribute to increased cardiovascular and respiratory dis-eases. With warmer and longer summers, the pollen and mold season will be extended, leading to allergies and triggering increased asthma attacks. West Nile virus carried by mosquitoes and Lyme disease carried by ticks are expected to become more prevalent, with warmer temperatures and increased flooding. Energy Security America’s reliance on foreign oil and other fossil fuels threatens our environ-ment, our economic prosperity and our national security. Americans repre-sent less than 5% of the global population but consume nearly one quarter of the world’s produced oil for transportation and heating. Additionally the U.S. holds less than 2% of the world’s proven oil reserves but, in order to meet its needs, now imports 60% of its oil from foreign sources. The U.S. also holds around 2% of the world’s natural gas reserves. At current con-sumption rates, we will have to begin importing large quantities to generate electricity. Domestic oil production hit its peak in 1970 and since then has been declin-ing. The U.S., not being an oil rich area, cannot indefinitely exploit its dwin-dling oil reserves. Instead, the U.S. will import more and more fossil fuels from foreign nations. Foreign oil imports accounted for a third of America’s record trade deficit in 2006 and are responsible for half of the increasing imbalance since 2002. Importing oil and natural gas in such vast quantities creates a trade imbalance that weakens the U.S. dollar in the global econ-omy. This consequently drives up the cost of imported goods, and passes them along to American families. Additionally, this dependence makes the United States more dependent on, and vulnerable to, the decisions of other governments.
12 | Bedford Climate Action Plan
United States Oil Production + Imports
1920 2005
in millions of barrels/day
5
10
generated from EIA data
Domestic Oil Production
Foreign Imports
This situation leads to a heavy national security risk. Oil money is increas-ingly being used to fund governments and projects that are opposed to U.S. interests. Profits from oil often accumulate in the hands of totalitarian foreign governments that not only repress their own people, but in many cases, also fund terrorist cells and training camps that amplify anti-American senti-ment. This gives oil producing nations a great amount of power in global affairs. As oil supplies dwindle and consuming countries get increasingly desperate, competition for limited resources will intensify and oil producing nations will become ever-more powerful. Bedford relies on fuel oil, natural gas and electricity for energy used in homes and businesses. The vast majority of this energy is imported. Elec-tricity comes from generating facilities throughout the Northeast and east-ern Canada and is delivered over a network of transmission grids. Natural gas is delivered from an even wider area through pipelines. Independent dealers deliver fuel oil, which is derived mostly from overseas. Reduction of imported energy will not only address the national issues described above, but will also free more local dollars for other priorities. Bedford now has the opportunity to use cleaner, cheaper and more efficient methods to power our businesses, our homes, and our lives and to mitigate the national prob-lem of imported fossil based energy sources.
Climate
The development of environmentally friendly practices by our town, and eventually on a national scale, is the best way to ensure that our climate stays well-suited to human comfort. Never in the past 1000 years has the planet warmed at a faster rate than during the 20th century, and the most recent decade has been the warmest on record. If this trend to contin-ues it could result in decreased agricultural output, increased catastrophic weather events such as forest fires, drought and floods and displacement of entire populations due to rising sea levels. In the Northeast, we are beginning to see the devastating changes of ex-cessive greenhouse gas accumulation in the atmosphere and a changing climate. It has been predicted that winters could warm by 8 to 12°F and that summers could warm by 6 to 12°F by late this century. This means that our snow filled winters may soon be a thing of the past. In fact, models indicate that without change, only western Maine may be able to support skiing by the end of the century.
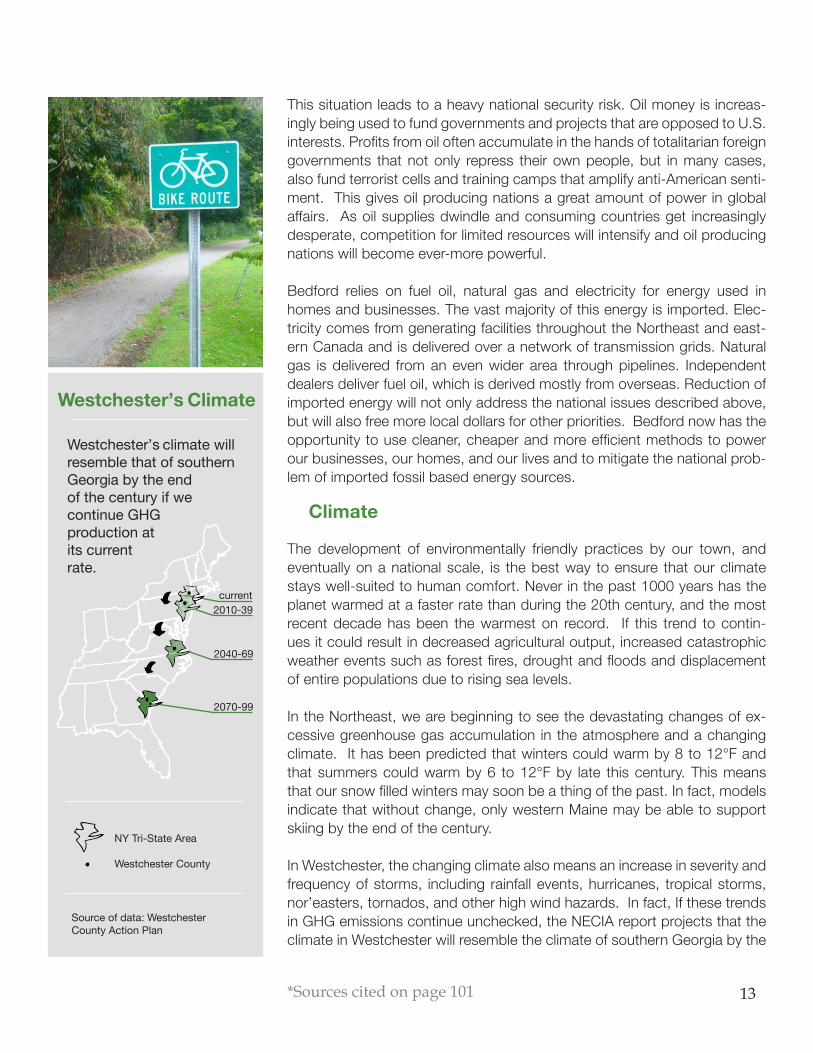
In Westchester, the changing climate also means an increase in severity and frequency of storms, including rainfall events, hurricanes, tropical storms, nor’easters, tornados, and other high wind hazards. In fact, If these trends in GHG emissions continue unchecked, the NECIA report projects that the climate in Westchester will resemble the climate of southern Georgia by the
13
Westchester’s Climate
Westchester’s climate willresemble that of southern Georgia by the end of the century if we continue GHGproduction at its current rate.
current2010-39
2040-69
2070-99
NY Tri-State Area
Westchester County
Source of data: WestchesterCounty Action Plan
*Sources cited on page 101

end of the century.
For Bedford, this means increased flooding of our low lying roadways like the Saw Mill River Parkway and increased power outages due to downed trees and extreme weather events.
d. A Sustainable Bedford
Over the past two years our town has achieved government support and ac-tion to significantly reduce GHG emissions. We have a proven track record of enlisting community, business, civic and residential engagement on these issues and we are now poised for the creation of a “Sustainable Bedford.”
The completion of our Climate Action Plan will finalize the transition from the government appointed Bedford Energy Advisory Panel to a community wide partnership and new entity to be known as the “Bedford 2020 Coalition”. This community wide stakeholders’ group will be organized into eleven task force areas, each charged with implementing the measures set forth in our Climate Action Plan.
No single sector of our community can reach the Town’s goal of a 20% reduction in GHG emissions by 2020 by acting alone. We must all work together. The Bedford 2020 Coalition Task Force user groups – residents, businesses, schools, religious and civic entities– will play an active role in carrying out the measures contained in the CAP. While the action steps are grouped by category, such as energy, waste, etc, we anticipate that each user group will focus on every measure that applies to them.
Residents Residential behavior is a critical component of climate change efforts in the Town of Bedford. The residential sector is the greatest contributor to community wide GHG emissions. 53% of the town’s GHG emissions comes from household energy use and personal vehicles. It is clear that the town’s reduction goals cannot be achieved without the commitment of Bedford’s residents. Since most individuals do not know what actions they can take in their own lives to do their part, the specific reduction measures contained the CAP must be accompanied by a community wide, public campaign to educate, inform and inspire Bedford’s residents to take action in their own lives.
Businesses
Bedford’s commercial sector contributes 15% of the community’s total GHG emissions. Businesses – both large and small - have the opportunity and responsibility to reduce GHG emissions in their own operations by focusing

on their own buildings and facilities, their business practices and their rela-tions with employees, vendors, contractors and customers.
Being green is good for business. It is the intention of the Bedford 2020 Coalition to work with local businesses to assist them in reducing their con-tributions to GHG emissions and to promote those businesses as strong partners in this effort. Ultimately, buying local is a significant component of a healthy, sustainable community. Additionally companies who want to prepare themselves to thrive in the future should be sensitive to the growing consumer demand for environmentally-responsible products and services, and willing to participate as full and active partners in the community’s ef-forts to be green.
Schools
The Town of Bedford recognizes that the two public school districts and the private schools within the town’s geographic borders are uniquely po-sitioned to help us reach our Twenty by 2020 goals. School campuses are a microcosm of the town. With multiple buildings, a vehicle fleet, waste generation and campus use contributing to their overall GHG emission, they are dealing with all four sectors of energy, transportation, waste/recycling and land use in their own sustainability efforts.
Both area public school districts--the Bedford Central School District (BCSD) and the Katonah Lewisboro School District (KLSD)-- have instituted Sustainability Policies establishing sustainability goals for the curriculum and campus operations. Their forward thinking actions are a model for the Town as we start the implementation of the Climate Action Plan. We are fortunate to count both school districts and the private schools as our partners in this town wide effort. As we move forward to educate the wider community about the full range of measures available to reduce GHG emis-sions, we will be looking to the schools – the administration, the students and the parent body as vital leaders and partners in this effort.
Civic and Religious Entities
Like the schools, most civic and religious entities in the Town of Bedford confront GHG emission issues in the management of their buildings and land, their waste and in their relationship with constituents. Like the schools, their leadership in the area of GHG emission reductions will have tremen-dous impact throughout the community. In particular, religious entities have the opportunity and the ability to model action – with energy audits and energy efficient upgrades of their houses of worship, community gardens established and run by parishioners, and by leadership in showing people how to become better stewards of the environment.
15
Rio
Eart
h Su
mm
it19
92
Kyot
o Pr
otoc
ol19
97
May
ors’
Clim
ate
Chan
ge A
gree
men
t20
05
16 | Bedford Climate Action Plan
Stak
ehol
ders
Sum
mit
- Int
rodu
ctio
n of
the
Pane
l N
ovem
ber 2
007
App
oint
men
t of t
he E
nerg
y Ad
viso
ry P
anel
and
Incl
usio
n of
all
of B
edfo
rdA
pril
2007
2006 20071992 - 2005
Tow
n of
Bed
ford
Com
preh
ensi
ve P
lan
Apr
il 20
03
Form
atio
n of
the
Wes
tche
ster
Cou
nty
Glo
bal W
arm
ing
Task
For
ceO
ctob
er 2
006
Supe
rvis
or R
ober
ts h
osts
mee
ting
abou
t Loc
al R
espo
nse
to C
limat
e Ch
ange
M
arch
200
7
Conv
ersa
tions
-for-
Actio
n, C
limat
e Ch
ange
Aw
aren
ess
Even
t in
Kat
onah
Mar
ch 2
007
Bedf
ord
Join
s IC
LEI,
Loca
l Gov
ernm
ents
for S
usta
inab
ility
Apr
il 20
07
Bedf
ord
Pass
es R
esol
utio
n to
redu
ce e
mis
sion
s 20
% b
y 20
20N
ovem
ber 2
007

17
Bedf
ord
Envi
ronm
enta
l Sum
mit
Janu
ary
2009
Gre
enho
use
Gas
Inve
ntor
y Co
mpl
eted
Mar
ch 2
009
Bedf
ord
Clim
ate
Act
ion
Plan
Dra
ft C
ompl
eted
Sept
embe
r 200
9
Bedf
ord
Dec
lare
s A
pril
“Ear
th M
onth
” Hol
ds a
Ser
ies
of E
vent
sA
pril
2008
Gre
en B
uild
ing
Sum
mit
for C
omm
erci
al S
truc
ture
sFe
brua
ry 2
008
2008 2009 2020
Publ
icat
ion
of th
e W
inte
r Too
lkit
Oct
ober
200
8
Cong
ress
Deb
ates
Gre
enho
use
Gas
Reg
ulat
ion
2009
COP1
5 Cl
imat
e Ch
ange
Con
fere
nce
Dec
embe
r 200
9
Bedf
ord
Reac
hes
Goa
l of a
20%
Gre
enho
use
Gas
Red
uctio
nD
ecem
ber 2
020

18 | Bedford Climate Action Plan
a. Introduction
In April 2007, the Town of Bedford joined ICLEI, Local Governments for Sus-tainability and the Town Board adopted a resolution committing the Town to taking action for climate protection. Through this resolution, the Town recognized the “profound effect” that greenhouse gases emitted by human activity are having on the Earth’s climate, as well as the Town’s opportunity to reduce these emissions, both through its government operations and by inspiring change throughout the community. With the assistance of ICLEI, the Town began its efforts to identify and reduce greenhouse gas emissions.
Presented here are estimates of greenhouse gas emissions resulting from our community as a whole, as well as those resulting from the Town’s inter-nal government operations. Due to availability, community and government operations data is based on the year 2004. This data will provide a baseline against which we will be able to compare future performance, enabling us to demonstrate progress in reducing emissions.
By adopting a resolution committing the Town to locally advancing climate protection, The Town of Bedford has joined an international movement of local governments. More than 1000 local governments, including over 500 in the United States, have joined ICLEI’s Cities for Climate Protection (CCP) campaign
The CCP campaign provides a framework for local communities to identify and reduce greenhouse gas emissions, organized along five milestones:
(1) Conduct an inventory of local greenhouse gas emissions; (2) Establish a greenhouse gas emissions reduction target; (3) Develop an action plan for achieving the emissions reduction target; (4) Implement the action plan; and, (5) Monitor and report on progress.
GreenhouSe GaS emiSSionS invenToryii

19
b. Methodology & Model
The first step toward reducing greenhouse gas emissions is to identify base-line levels of emissions in the Town of Bedford, as well as the sources and sectors of our community and government operations most responsible for those emissions. This information was key in selecting our reduction target as well as the reduction measures contained in this plan.
ICLEI’s Communities for Climate Protection methodology assists local gov-ernments in systematically tracking community energy and waste related activities, and in calculating the relative quantities of greenhouse gases pro-duced by each activity and sector. The inventory methodology involves per-forming two assessments: a community wide assessment and a separate inventory of government facilities and activities. The government inventory is a subset of the community inventory.
To facilitate community efforts to reduce greenhouse gas emissions, ICLEI developed the Clean Air and Climate Protection (CACP) software package with the State and Territorial Air Pollution Program Administrators (STAPPA), the Association of Local Air Pollution Control Officials (ALAPCO), and Torrie Smith Associates. This software calculates emissions resulting from energy consumption and waste generation. The CACP software determines emis-sions using specific factors (or coefficients) according to the type of fuel used. Greenhouse gas emissions are aggregated and reported in terms of equivalent carbon dioxide units, or CO2e. Converting all emissions to equivalent carbon dioxide units allows for the consideration of different greenhouse gases in comparable terms.
The emissions coefficients and methodology employed by the CACP soft-ware are consistent with national and international inventory standards es-tablished by the Intergovernmental Panel on Climate Change (1996 Revised IPCC Guidelines for the Preparation of National Inventories) and the U.S. Voluntary Greenhouse Gas Reporting Guidelines (EIA form1605). However, it is worth noting that, although the software provides the Town of Bedford with a sophisticated and useful tool, calculating emissions from energy use with precision is difficult. The model depends upon numerous assump-tions, and it is limited by the quantity and quality of available data. With this in mind, it is useful to think of any specific number generated by the model as an approximation of reality, rather than an exact value. Being exact is less important than being able to track progress by conducting future in-
Business as Usual
2004 2020
275,951
220,761
434,013
20%
Assuming an annual 2% growth rate, Bedford needs to reduce the predicted “Business as Usual” 2020 emissions by an additional 102,872 tonnes of CO2e in order to reach the desired 20% reduction below 2004 levels
Community GHG Emissions
Waste5%Transportation
27%
Residential53%
Commercial15%
Sector
Residential 146,451 1,806,823
Commercial 40,116 400,452
Transport 74,693 959,118
Waste 14,691
Total 275,951 3,166,393
GHGemissions
(tonnes
CO2e)
Energyequivalent
(MMBtu)
20 | Bedford Climate Action Plan
ventories using the same methodology – thus comparing apples to apples.
c. Creating the Inventory
Our greenhouse gas emissions inventory consists of two essentially distinct inventories: one for the Town of Bedford community as a whole, defined by our geographic borders, and one highlighting emissions resulting from the Town of Bedford’s internal government operations. The government inven-tory is a subset of the community-scale inventory (the two are not mutually exclusive). This allows the government, which formally committed to reduc-ing emissions, to track its individual facilities and vehicles and to evaluate the effectiveness of its emissions reduction efforts at a more detailed level. At the same time, the community-scale analysis provides a performance baseline against which we can demonstrate progress being made through-out the Town of Bedford community.
Creating our emissions inventory required the collection of information from a variety of sources (See Appendix for complete inventory source data.) Data from the year 2004 was used for both the community inventory and the government inventory.
When calculating the Town of Bedford’s emissions inventory, all energy con-sumed in the Town of Bedford was included. This means that, even though the electricity used by Town of Bedford residents is produced elsewhere, this energy and the emissions associated with it appears in the Town of Bedford’s inventory. The decision to calculate emissions in this manner reflects the general philosophy that a community should take full responsi-bility for the impacts associated with its energy consumption, regardless of whether or not the energy generation occurs within its geographic borders.
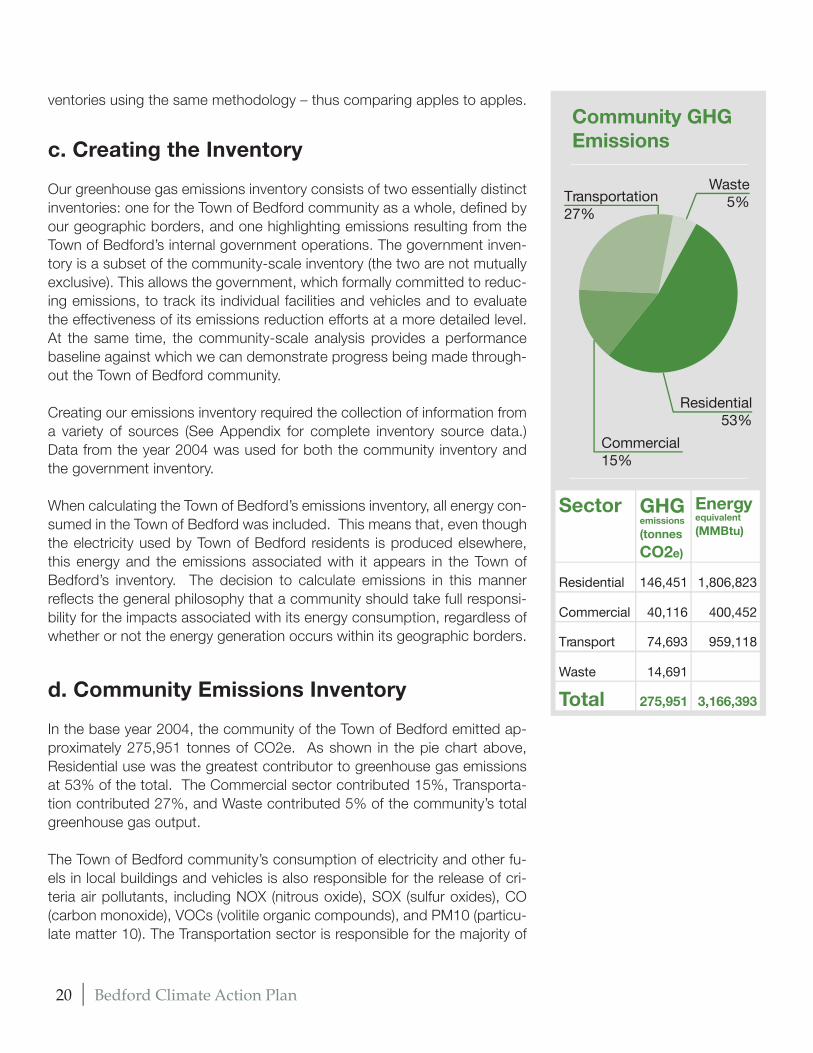
d. Community Emissions Inventory
In the base year 2004, the community of the Town of Bedford emitted ap-proximately 275,951 tonnes of CO2e. As shown in the pie chart above, Residential use was the greatest contributor to greenhouse gas emissions at 53% of the total. The Commercial sector contributed 15%, Transporta-tion contributed 27%, and Waste contributed 5% of the community’s total greenhouse gas output.
The Town of Bedford community’s consumption of electricity and other fu-els in local buildings and vehicles is also responsible for the release of cri-teria air pollutants, including NOX (nitrous oxide), SOX (sulfur oxides), CO (carbon monoxide), VOCs (volitile organic compounds), and PM10 (particu-late matter 10). The Transportation sector is responsible for the majority of

Municipal GHGEmissions
Waste1%
Street Lights5%
Buildings74%
Vehicle Fleet20%
Sector
Buildings 4,000 64,611
Vehicle Fleet 1,056 13,466
Streetlights 251 2,118
Waste
Total 5,360 80,194
GHGemissions
(tonnes
CO2e)
Energyequivalent
(MMBtu)
53
21
NOX, CO and VOC emissions, while energy used in buildings is primarily responsible for emissions of SOX and PM10.
e. Municipal Emissions Inventory
In the base year 2004, the Town of Bedford’s government operations gener-ated 5,360 tonnes of CO2e. The Town’s buildings were the greatest contribu-tors, emitting 74% of the total. The vehicle fleet contributed 20%, streetlights contributed 5%, and waste contributed 1% of the government emissions.
Government operations emissions in the Town of Bedford constitute about 2 percent of the community’s total greenhouse gas emissions. This is not un-usual; local government emissions typically account for around two percent of community levels. As a minor contributor to total emissions, actions to reduce government operations energy use will have a limited impact on the Town of Bedford community’s overall emissions levels. However, as previ-ously mentioned, government action has symbolic value that extends beyond the magnitude of emissions actually reduced.
f. Conclusion
In passing a resolution to join the Communities for Climate Protection cam-paign, the Town of Bedford made a formal commitment to reduce its emis-sions of greenhouse gases. This inventory lays the groundwork for those ef-forts by estimating baseline emissions levels against which future progress can be demonstrated.
The Bedford Climate Action Plan proposes that we reduce GHG emissions by 20 percent below 2004 levels by 2020. This means the community needs to reduce and prevent annual GHG emissions of 55,190 tonnes of carbon di-oxide based on 2004 emssions. Assuming a standard growth rate of 2%, by the year 2020 the 20% target will have grown to 158,062 tonnes of needed emission reductions. However, many scientists believe that far greater reduc-tions, closer to 80 percent worldwide, will be necessary to stabilize the con-centration of greenhouse gases in the atmosphere. This will require a glob-al commitment and response that does not currently exist. However, local municipalities all over the world are demonstrating strategies that effectively reduce emissions, increase economic vitality and livability. Bedford’s plan proposes that we begin now, by undertaking local actions that are feasible, impactful and that provide multiple benefits for our community.
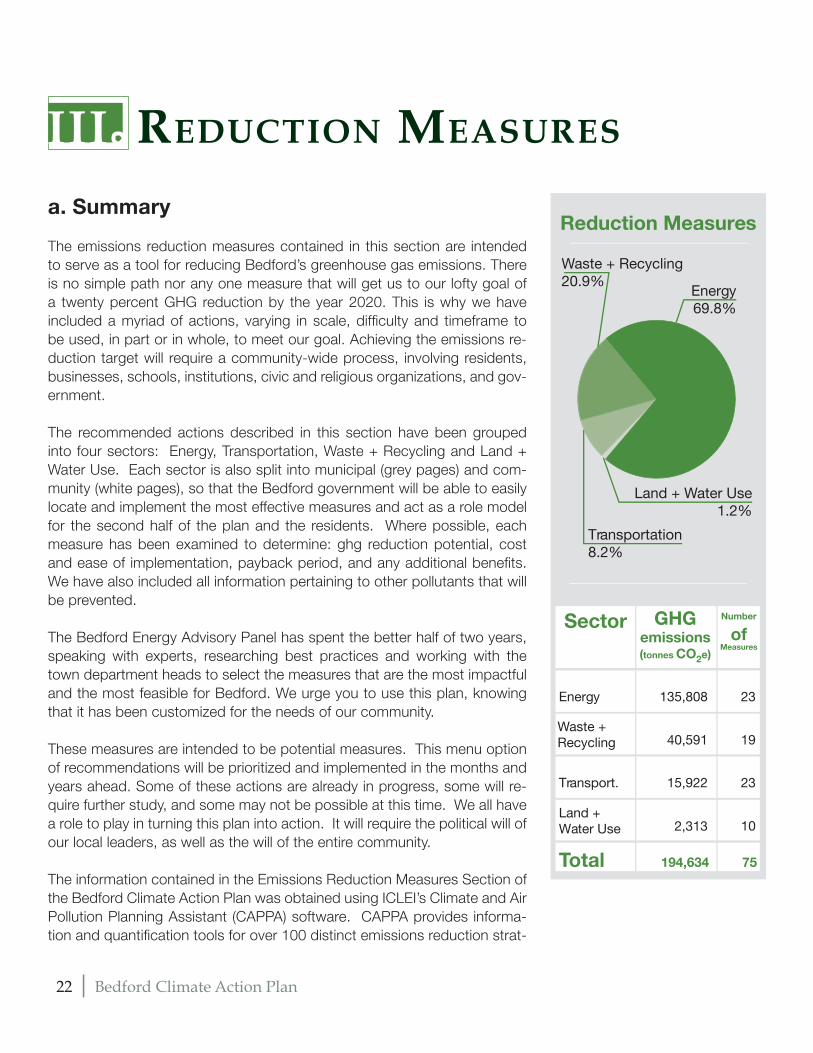
a. Summary
The emissions reduction measures contained in this section are intended to serve as a tool for reducing Bedford’s greenhouse gas emissions. There is no simple path nor any one measure that will get us to our lofty goal of a twenty percent GHG reduction by the year 2020. This is why we have included a myriad of actions, varying in scale, difficulty and timeframe to be used, in part or in whole, to meet our goal. Achieving the emissions re-duction target will require a community-wide process, involving residents, businesses, schools, institutions, civic and religious organizations, and gov-ernment.
The recommended actions described in this section have been grouped into four sectors: Energy, Transportation, Waste + Recycling and Land + Water Use. Each sector is also split into municipal (grey pages) and com-munity (white pages), so that the Bedford government will be able to easily locate and implement the most effective measures and act as a role model for the second half of the plan and the residents. Where possible, each measure has been examined to determine: ghg reduction potential, cost and ease of implementation, payback period, and any additional benefits. We have also included all information pertaining to other pollutants that will be prevented.
The Bedford Energy Advisory Panel has spent the better half of two years, speaking with experts, researching best practices and working with the town department heads to select the measures that are the most impactful and the most feasible for Bedford. We urge you to use this plan, knowing that it has been customized for the needs of our community.
These measures are intended to be potential measures. This menu option of recommendations will be prioritized and implemented in the months and years ahead. Some of these actions are already in progress, some will re-quire further study, and some may not be possible at this time. We all have a role to play in turning this plan into action. It will require the political will of our local leaders, as well as the will of the entire community.
The information contained in the Emissions Reduction Measures Section of the Bedford Climate Action Plan was obtained using ICLEI’s Climate and Air Pollution Planning Assistant (CAPPA) software. CAPPA provides informa-tion and quantification tools for over 100 distinct emissions reduction strat-
reducTion meaSureSiii
22 | Bedford Climate Action Plan
Reduction Measures
Energy69.8%
Waste + Recycling20.9%
Land + Water Use1.2%
Transportation8.2%
Sector
Energy 135,808 23
Waste + Recycling 40,591 19
Transport. 15,922 23
Land +Water Use 2,313
Total 194,634 75
GHGemissions(tonnes CO2e)
Number
ofMeasures
10

egies. The quantification calculator proved invaluable in selecting reduction measures for Bedford and determining which to include in our Climate Ac-tion Plan. We relied heavily on the measure descriptions provided by ICLEI for our Climate Action Plan (CAP) and tailored them to fit Bedford’s needs. CAPPA uses default assumptions regarding resulting performance of each strategy that are based on real-world data from other U.S. communities and a variety of expert sources. These assumptions can be customized to include more accurate local data, which we have done where such data is available.
It is important to note that CAPPA is a tool, designed to highlight the poten-tial of each reduction measure. However, its dependence on assumptions makes it limited by the quantity and quality of available data. Anytime we are able to find more detailed information, we will be adding data, leading to slight changes in our predicted outcomes.
The quantification data for each measure has been included in the CAP, where available, to assist in prioritizing actions for implementation. Data on scope, cost, and payback are estimates based on the best available current data. At the time of implementation, each measure will be further scoped for more accurate and detailed cost and payback projections.
ICLEI’s CAPPA tool measures heating fuel in terms of natural gas whereas the majority of Bedford resident’s use fuel oil to heat their homes. Where essential, we have attempted to con-vert the CAPPA numbers for fuel oil, but in most cases we stayed with the natural gas calculations, which you will see reflected in therms. This makes the “Annual Energy Saved” projections very conservative, as nat-ural gas has a higher energy content and a lower carbon intensity than fuel oil.
CAP Co-Benefits
Quality of Life &Health
Energy Security
Climate & Greenhouse Gas Reductions
Economic Benefits& Job Creation
Throughout the Bedford Climate Action Plan, the term Co-Benefits refers to positive impacts our pro-posed measures will have on our lifes.
23

24 | Bedford Climate Action Plan

25
b. Energy(69.7% )of total proposed GHG reductions
total GHG reduction in sector: 135,808 Tonnes CO2eco-benefits:
In the United States, residential and commercial buildings account for 48% of the country’s energy consumption. Furthermore, 75% of a build-ing’s lifetime costs are related to this large-scale consumption and its maintenance. In Bedford, the numbers are equally staggering - In 2004 residential, commercial, industrial, institutional and municipal buildings to-gether were responsible for the emission of 186,567 tonnes of CO2e into the atmosphere, making up 68% of the town’s total GHG emissions in that year. Of these emissions, about 78% can be attributed to residential structures.
Reducing GHG emissions from building energy use in Bedford will require action in two areas: improving energy efficiency and increasing the num-ber of renewable sources of electricity (such as solar, wind, hydroelectric and geothermal.)
Achieving higher energy efficiency means being smarter about how we design and construct new buildings but also how we retrofit our exist-ing housing and commercial stock. Retrofit recommendations can range from simple to complex including measures such as increasing building insulation; installing more efficient heating, ventilation, and air condition-ing (HVAC) equipment; and using more efficient lighting, appliances, and equipment.
The support, research and development of clean, renewable sources of energy are also essential if we are to keep up with our rate of growth and continued demand for energy. Unlike our existing fossil fuel infrastructure, renewables take advantage of infinite, natural and free resources and do not contribute to GHG emissions or air pollution.
The measures contained in this section have the biggest potential to get us to our Twenty by 2020 goal. The implementation of these measures will encourage us to rethink how our homes and offices impact the en-vironment, and how we can live more sustainably and economically with the energy-saving technologies available to us.

Total Cost: $215,532 annually ($0.10 per kWh additional cost)Payback: Not availableCo-Benefits:
Scope100% RE Purchased
Annual ReductionsCO2e: 803 Tonnes in total Commu-nity Emissions and 15% reduction in TOB total Emissions and 75% of 20% by 2020 goal)Energy: N/ANOx: 2,145 lbsSOx: 9,044 lbsCO: 2,246 lbsVOCs: 252 lbsPM10: 1,981 lbs
Community Scale Renewable Energy
Renewable energy - energy generated by natural resources - contributes little or no greenhouse gasses (GHG) to the atmosphere, reduces un-healthy by-products of burning fossil fuels and helps us reduce the need to import energy fuels from overseas. Renewable energy sources include: solar, wind, hydroelectric, and geothermal.
If the Town of Bedford purchased 100% renewable energy from conven-tional sources, such as those currently available through your utility, the cost would amount to over $215,000 annually. The Town of Bedford , working with the Bedford 2020 Coalition and its partners, should com-mence a study to identify all available renewable energy assets in the community as well as opportunity sites where RE projects might best be implemented to bring this cost down. In addition, the study would in-clude potential finance options. The results of this study could allow us to move toward increasing renewable energy production locally, bring down the incremental cost of using renewable energy, and ultimately move to 100% renewable energy use in town-owned buildings by 2020.
Cost: $166,885Payback: 4 yearsCo-Benefits:
Scope100% of 39,620sq/ft of Town of Bedford building space
Annual ReductionsCO2e: 177 tonnes (3.3% reduction in total TOB emissions, 4.4% reduc-tion in TOB Building Emissions and 16.5% of 20% by 2020 goal)Energy: 260,525kWh14,191 e/therms$: $42,231NOx: 498 lbsSOx: 1,103 lbsCO: 333 lbsVOCs: 44 lbsPM10: 247 lbs
Energy Efficiency Retrofits of Existing Town Owned Facilities
Town owned buildings account for 74% of total municipal energy use and the resulting GHG emissions attributed to Town operations. Many measures can be applied to existing buildings to improve their efficiency, including using efficient lightbulbs and fixtures, increasing insulation, re-placing windows, and upgrading HVAC systems for 15-40% energy sav-ings.
The CAP recommends that the Town of Bedford carry out the energy efficiency retrofits and upgrades that were recommended in the 2009 NYSERDA Energy Audit of the exisiting municipal buildings and facilities.
Municipal Energy Measures
26 | Bedford Climate Action Plan

Municipal Green Building Policy
The built environment has a profound impact on our natural environment, economy, health and productivity. Breakthroughs in building science, technology and operations are now available to designers, builders, oper-ators and owners who want to build green and maximize both economic and environmental performance.
The US Green Building Council developed LEED (Leadership in Energy & Environmental Design) certification system is the nationally recognized standard for green building. Many cities and counties have adopted ordi-nances requiring new construction or major renovation of public buildings to follow LEED standards. The LEED system establishes several levels of environmental achievement from a “Certified” rating to a “Silver” rating to a “Gold” rating to a “Platinum” rating. The ratings are attained by earning LEED points in the categories of Sustainable Sites, Water Efficiency, En-ergy & Atmosphere, Materials & Resources, Indoor Environmental Quality and Innovation & Design Process.
The Town of Bedford should show its commitment to minimizing the short-term and long-term negative impacts construction has on the environment by considering a municipal green building policy that requires all new or renovated Town structures to be LEED Certified.
27
Cost: Not availablePayback: Not available
Co-Benefits:
Municipal Energy Efficiency Purchasing Policy
Purchasing efficient products reduces energy costs without compromis-ing quality. Local governments may obtain significant reductions in en-ergy bills by adopting a procurement policy that sets a minimum efficiency standard for all new equipment purchased.
The Town of Bedford should propose a municipal policy in which, to the extent possible and in compliance with procurement regulations, all new municipal appliances, office equipment, electronic equipment, and HVAC infrastructure must be Energy Star compliant.
Cost: Not availablePayback: Not available
Co-Benefits:

Municipal Energy Measures
28 | Bedford Climate Action Plan
Energy Efficient/Energy Star Appliances (6)
ENERGY STAR is a partnership between the U.S. Environmental Protection Agency and industry to voluntarily label products that meet more stringent energy efficiency criteria. According to the EPA, more than 2 billion ENERGY STAR-certified products have been purchased since 1992, generating utility bill savings of $14 billion in 2006, saving an amount of energy equivalent to the gen-eration capacity of 70 power plants. These energy savings trans-late to a GHG emissions reduction of 37 million metric tons, equal to removing 25 million vehicles from the road.
The Town of Bedford should consider the adoption and imple-mentation of a Municipal Green Procurement Policy, in which newly purchased items are considered for the greatest energy efficiency possible. While purchasing appliances, the Town of Bedford should look for the ENERGY STAR label.
This measure includes data for Energy Efficient Computers, Printers, Refrigerators, Vending Machines, Water Coolers and Copiers.
Total Cost: $5,190Co-Benefits:
Total Annual ReductionsCO2e: 28 tonnes Energy: 76,102 kWh$: $7,610 annual savingsNOx: 76 lbsSOx: 320 lbsCO: 79 lbsVOCs: 9 lbsPM10: 69 lbs
1. Computers
Switching to Energy Star monitors and computers use 20-60% less energy than conventional systems.
Cost: $0 ($0 additional cost per unit)Payback: 0 years
Scope86 Computers Replaced with Energy Star Computers
Annual ReductionsCO2e: 15 tonnesEnergy: 39,302 kWh$: $3,930
2. Printers
New Energy Star qualified printers are, on average, 37% more ener-gy efficient than conventional ones. They reduce paper consumption by printing double-sided pages and air conditioning costs by running cooler. A new energy efficient printer yields 28% savings in energy and maintenance costs.
Cost: $3,550 ($50 additional cost per unit)Payback: 1.8 years
Scope71 Printers
Annual ReductionsCO2e: 7 tonnesEnergy: 19,291 kWh$: $1,929

29
4. Vending Machines
As contracts with vendor operators come up for renewal, local govern-ments can negotiate new contracts that include more energy efficient machines that will reduce GHG emissions and cost less to operate. Switching to just one ENERGY STAR-labeled vending machine can re-duce municipal CO2 emissions by 25,651.91 lbs over its 14-year life-cycle, equivalent to removing 3.11 cars from the road every year.
Cost: $0 additional cost per unitPayback: 0 years
Scope2 Vending Machines replaced
Annual ReductionsCO2e: 1 tonne
Energy: 3,318 kwh $: $332
5. Water Coolers
The office water cooler can use more electricity than a full-size refriger-ator. An ENERGY STAR water cooler reduces this energy use by 50%. An ENERGY STAR hot and cold water cooler can save $47 a year in energy, and a cold cooler can save $12 a year. (Coolers that produce both hot and cold water use more energy and offer more potential for savings).
3. Refrigerators
Refrigerators are usually the single biggest electricity user in a home and a significant user at the workplace. ENERGY STAR refrigerators use half the energy of those made before 1993, 40% less than refrig-erators made in 2001, and 15% less than required by federal regulation in 2007.
Cost: $800 ($100 additional cost per unit)
Payback: 2.2 years
Scope8 Refrigerators replaced
Annual ReductionsCO2e: 1 tonne
Energy: 3,712 kWh$: $371
Cost: $700 ($100 additional cost per unit)
Payback: 2.8 years
Scope7 Water Coolers replaced
Annual ReductionsCO2e: 1 tonne
Energy: 2,527 kwh $: $253
6. Copiers
Today, there are over 220 million imaging equipment units, such as fax machines and copiers, in US buildings. Together, these units consume 40 billion kWh each year, roughly 2% of US building sector electricity consumption. These are often the most energy-intensive type of office equipment because they are left on for long periods of time — in some case, 24 hours per day. Models that meet the revised ENERGY STAR imaging equipment criteria will be more efficient and save users money over the lifetime of the product.
Cost: $140 ($10 additional cost per unit)
Payback: < 1 year
Scope14 Copiers replaced
Annual Reductions
CO2e: 3 tonnesEnergy: 7,952 kWh
$: $795

Municipal Energy Measures
30 | Bedford Climate Action Plan
Heating and Cooling Efficiency (5 Measures)
Energy used to heat, cool, and ventilate contributes to the ma-jority of energy used in buildings. Improving the efficiency of the equipment used for these tasks reduces emissions and saves on climatization costs. Upgrading to the most efficient chillers, boilers, heating, ventilation, and air conditioning (HVAC) units and performing proper scheduled maintenance maximizes en-ergy savings.
The Town of Bedford should consider the adoption and imple-mentation of a Municipal Green Procurement Policy, in which newly purchased items are considered for the greatest energy efficiency possible.
This measure includes data for High Efficiency Water Heaters, Boilers, Chillers, HVAC Fans and Heat and Power Education.
Total Cost: $23,573Co-Benefits:
Total Annual ReductionsCO2e: 13 tonnes Energy: 17,240 kWh1,080 e/therms$: $2,955NOx: 35 lbsSOx: 73 lbsCO: 22 lbsVOCs: 3 lbsPM10: 16 lbs
1. Water Heaters
When Energy Star water heaters are purchased as a part of a broader energy efficiency program, a significant reduction in electricity, fuel oil and natural gas use can be realized. Communities with fossil fuel power plants within their airshed could contribute to the reduction of criteria air pollutants created from electricity generation through such a pro-gram. An Energy Star water heater can help reduce energy costs for the facility.
Cost: $5,500 ($1,100 additional cost per unit)Payback: 8.8 years
Scope5 Water Heaters replaced
Annual ReductionsCO2e: 3 tonnes Energy: 2,870 kWh 296 e/therms$: $624
2. Boiler Efficiency
When Energy Star boilers are purchased as a part of a broader en-ergy efficiency program, a significant reduction in electricity, fuel oil and natural gas use can be realized. Whether gas or oil, ENERGY STAR qualified boilers use about 6% less energy than a standard boiler. They achieve greater efficiency with improved features, such as electric igni-tion, which eliminates the need to have the pilot light burning all the time , and new combustion technologies that extract more heat from the same amount of fuel.
Cost: $14,263 ($0.36 additional cost of efficient boilers per sq. ft.)Payback: 15.9 years
Scope39,620 Square ft. of Facilities with Upgraded Boilers
Annual ReductionsCO2e: 4 tonnesEnergy: 784 e/therms$: $894

31
3. Chiller Efficiency
Air conditioning is one of the largest energy users in commercial build-ings. Replacing older chillers with appropriately-sized and the most efficient, new chillers can reduce energy use by 30%.
Cost: $3,600 ($0.36 additional cost of efficient chillers per sq. ft.)
Payback: 3.5 years
Scope10,000 sq ft of facilities with
upgraded chillers
Annual ReductionsCO2e: 4 tonnes
Energy: 10,230 kWh$: $1,023 annual savings
4. HVAC Fan Upgrades
HVAC fans, with the help of pumps, transfer heated or cooled air into homes or buildings. When efficient HVAC are purchased as a part of a broader energy efficiency program, a significant reduction in electricity, fuel oil and natural gas use can be realized.
Cost: $200 ($0.02 additional cost of efficient fans per sq. ft.)
Payback: < 1 year
Scope10,000 sq ft of facilities with
upgraded HVAC fans
Annual ReductionsCO2e: 2 tonnes
Energy: 4,140 kwh $: $414
5. Combined Heat and Power Infrastructure Education
Combined heat and power (CHP), also known as cogeneration, is the simultaneous production of electricity and heat from a single fuel source, such as: natural gas, biomass, biogas, coal, waste heat, or oil.
CHP is the sequential production and use of electricity and thermal en-ergy from a single fuel. CHP is inherently more efficiency than separate generation of electricity from central station power plants and thermal energy from boilers or other heating equipment.
ScopeNot unavailable

Total Cost: $18,621 ($0.47 additional cost of retrofit $/sq. ft.)Payback: 5.7 yearsCo-Benefits:
Scope39,620 sq. ft. retrofitted with ef-ficient lighting
Annual ReductionsCO2e: 12 tonnes Energy: 32,782 kWh $: $3,278NOx: 33 lbsSOx: 138 lbsCO: 34 lbsVOCs: 4 lbsPM10: 30 lbs
Efficient Lighting Retrofits
Lighting is typically the largest electricity user in commercial buildings. Many municipal buildings use fluorescent lighting, which is relatively ef-ficient, but many buildings still have older fixtures with magnetic ballasts and T-12 size fluorescent tubes. New electronic ballasts with T-8 size tubes use 30% less energy and can provide better light quality without flicker.
The Town of Bedford should identify lighting inefficiencies in town owned buildings and install more energy efficient lighting where necessary.
Cost: $2,377 ($0.06 per sq foot) Payback: < 1 yearCo-Benefits:
Scope39,620 sq ft installed with occu-pancy sensors
Annual ReductionsCO2e: 35 tonnes (.65% reduction in total TOB Emissions, .9% reduc-tion in TOB Building emissions and 3.3% of 20% by 2020 goal)Energy: 94,989 kWh$: $9,499NOx: 95 lbsSOx: 399 lbsCO: 99 lbsVOCs: 11 lbsPM10: 87 lbs
Lighting Occupancy Sensors
Lighting is typically the largest electricity user in commercial buildings. Much energy is wasted by lights left on when no one is using them. In-stallation of lighting occupancy sensors prevent this by using sensors to detect motion in the lighted space and turning lights off if no one is pres-ent. Sensors can reduce energy use for lighting by an average of 35%. When efficient lights and sensors are purchased as a part of a broader green procurement or energy efficiency program, a significant reduction in electricity use can be realized.
The Town of Bedford should identify lighting inefficiencies in town owned buildings and facilities and install interior and exterior lighting occupancy sensors where necessary.
Municipal Energy Measures
32 | Bedford Climate Action Plan

Total Cost: $375,000 (beforeincentives)
$120,000 (after State incentives)Payback: 60yrs (before State and
Federal Incentives) 20 yrs (after State Incentives)
Co-Benefits:
Scope50 kW of PV Installed
Annual ReductionsCO2e: 21 tonnes
Energy: 60,000 kWh$: $6,000
NOx: 57 lbsSOx: 241 lbs
CO: 60 lbsVOCs: 7 lbs
PM10: 53 lbs
Use Solar Photovoltaic (PV) Energy
Solar photovoltaic (PV) power harnesses sunlight to generate electric-ity. By substituting solar energy for fossil fuels, energy can be produced without generating GHG emissions. Solar Electric or PV systems create electricity that can be used in Municipal owned buildings to run appli-ances, lighting, and central air conditioning just as they would use the power from the utility’s electric grid.
The Town of Bedford should examine its town owned buildings to deter-mine the feasibility of installing Solar PV Energy. They should work with NYSERDA (New York State Energy Research and Development Authority) tools to access information about the cost and benefits of solar electric systems, as well as technical assistance for identifying installers and in-spectors.
33
Consider Solar Hot Water Systems for Town Owned Buildings
Solar Hot Water can help reduce the cost of making hot water in mu-nicipal buildings by 50-75%. Solar thermal collectors on the roof absorb the sun’s heat and transfer it into a solar storage tank adjacent to your existing hot water heater with the help of a small circulating pump. Solar thermal solutions are great for buildings that may not be eligible for PV systems because they don’t requires as much roof space and are less expensive.
The Town of Bedford should conduct a feasibility study around the poten-tial for use of solar hot water systems on town owned buildings.
Cost: Not availablePayback: Not available
Co-Benefits:

Cost: $54,366,000Household Cost: $8,500Payback: Avg 5.4 yearsCo-Benefits:
Scope100% of 6396 homes
Annual ReductionsCO2e: 46,257 tonnes in Residential GHG emissions. (32% reduction in Residential Emissions and a 17% reduction in total Community Emis-sions. 83.8% of 20% by 2020 goal.)Energy: 27,521,348 kWh6,426,061 e/therms$: $10,077,845NOx: 135,345 lbsSOx: 119,781 lbsCO: 56,528 lbsVOCs: 9,161 lbsPM10: 28,590 lbs
Financing for Residential Energy EfficiencyRetrofits
Most homes–even some newer ones–have not been constructed or tested to building performance standards that conserve energy. Many homes in Bedford are wasting considerable amounts of energy and money and are contributing unnecessary greenhouse gasses to the en-vironment.
The CAP recommends that the Town of Bedford form a Finance pro-gram, that would offer property owners the option to secure low cost funds to obtain home energy audits and install recommended energy efficiency measures in their buildings and homes. Building owners would pay for the cost over a 20-year period through a special tax collected on their property tax bill. These programs would allow the town to secure the loan by recording a Special Municipal Property Lien against the prop-erty. The Lien secures the owner’s obligation to pay the special taxes and secures a pool of lending capital. A key element of the programs is that they allow the transfer of the loan payments to succeeding property owners, in essence, matching the cost of the energy improvements with the energy savings. The goal of the program is to facilitate energy effi-ciency retrofits in Bedford’s existing residential housing stock to produce 30%+ energy savings throughout the community.
Cost: $13,886,000 ($0.10 per kWh additional cost)Payback: Not availableCo-Benefits:
Scope100% RE Purchased
Annual ReductionsCO2e: 51,753 tonnes (18.75% re-duction in total Community Emis-sions and 93.8% of 20% by 2020 goal)NOx: 138,168 lbsSOx: 582,667 lbsCO: 144,695 lbsVOCs: 16,247 lbsPM10: 127,615 lbs
Community Scale Renewable Energy
Renewable energy - energy generated by natural resources - contrib-utes little or no greenhouse gasses (GHG) to the atmosphere, reduces unhealthy by-products of burning fossil fuels and helps us reduce the need to import energy fuels from overseas. Renewable energy sources include: solar, wind, hydroelectric, and geothermal.
If the Town of Bedford community purchased 100% renewable energy from conventional sources, such as those currently available through your utility, the cost would amount to over 13.8 million annually. The Town of Bedford, working with the Bedford 2020 Coalition and its partners, should commence a study to identify all available renewable energy as-sets in the community as well as opportunity sites where RE projects might best be implemented to bring this cost down. In addition, the study would include potential finance options. The results of this study could allow us to move toward increasing renewable energy production locally, bring down the incremental cost of using renewable energy, and ultimately move to 100% renewable energy use by 2020.
Community Energy Measures
34 | Bedford Climate Action Plan

Cost: $7,065,000 ($3.20 per sq foot)Payback: 3.7 years
Co-Benefits:
Scope100% of 2.2mm sq/ft of com-
mercial space - 30% savings
Annual ReductionsCO2e: 7702 tonnes (2.7% reduc-tion in total Community Emissions and 19.1% reduction in Commercial Emissions and 13.9% of 20% by
2020 goal)Energy: 13,631,124 kWh
$: $1,896,574NOx: 21,425 lbsSOx: 57,509 lbs
CO: 16,232 lbsVOCs: 2,027 lbs
PM10: 12,767 lbs
Energy Efficiency Retrofits of Existing Commercial Facilities
Buildings account for 68% of total energy use and the resulting GHG emissions in Bedford. Many measures can be applied to existing build-ings to improve their efficiency, including using efficient lightbulbs and fixtures, increasing insulation, replacing windows, and upgrading HVAC systems for 15-40% energy savings.
The Town of Bedford, with the Bedford 2020 Coalition and its partners, should work with Bedford’s commercial and industrial sectors to inform them about New York State Energy Research and Development Au-thority’s (NYSERDA) programs that provide energy efficiency services for existing buildings, new construction, industrial facilities. NYSERDA programs include: Commercial Energy Audits (http://www.nyserda.org/programs/Technical_Assistance/default.asp), the New Construction Program, Existing Facilities Program, New Renewable, Clean Energy, or Energy Efficiency Product Manufacturing Business Incentive and the New York Energy $martSM Loan Program.
Cost: $704,000 (1,000 per Business)Payback: < 1 year
Co-Benefits:
Scope704 Businesses Participating
Annual ReductionsCO2e: 3,965 tonnes
Energy: 6,818,240 kWh254,144 e/Therms
$: $971,548NOx: 11,054 lbsSOx: 28,779 lbs
CO: 8,206 lbsVOCs: 1,033 lbsPM10: 6,396 lbs
Energy Efficiency Education for Businesses
Businesses, and particularly small businesses, represent a significant portion of energy use in our community. Businesses can enact many simple measures to save energy. Outreach and education programs that offer information about and encourage conservation measures can tap into this potential.
California’s “Flex Your Power” program gives awards to recognize busi-nesses showing leadership in energy efficiency and provides information on availble incentives and best pratice guides by industry. For more information, see: http://www.fypower.org/com.
The Town of Bedford, working with the Bedford 2020 Coalition and its partners, should develop and implement a technical assistance program targeted at the commercial and industrial sectors around energy efficien-cy and conservation, including: promotional materials, web resources, best practices sharing, training workshops and expert support. Busi-nesses that show leadership in energy efficiency should be recognized.
35

Cost: $500,000 ($500 per house-hold)Payback: Not availableCo-Benefits:
Scope1000 home transactions in 10yrs
Require Home Energy Rating (HERs) at Time of Sale
Buildings account for 68% of total energy use and the resulting GHG emissions in Bedford. Many measures can be applied to existing build-ings to improve their efficiency, including using efficient lightbulbs and fixtures, increasing insulation, air sealing and upgrading HVAC systems but currently Bedford lacks a standard to compare the relative building performance of our residential stock.
A HERs energy rating provides a standardized evaluation of a home’s energy efficiency and expected energy use costs. The evaluation is con-ducted in accordance with uniform standards and includes a detailed home energy use assessment, conducted by a certified Rater, using an advanced set of nationally accredited energy and economic analysis pro-cedures and verified software tools.
The HERs Index is a scoring system established by the Residential Ener-gy Services Network (RESNET) in which a home built to the specifications of the HERs Reference Home (based on the 2006 International Energy Conservation Code) scores a HERS Index of 100, while a net zero energy home scores a HERs Index of 0. The lower a home’s HERs Index, the more energy efficient it is in comparison to the HERs Reference Home.
In an effort to allow our residents to make informed decisions on where to invest in efficiency and which homes perform with more efficiency, the Town of Bedford should consider a local ordinance requiring that every home or apartment building sold or transferred in Bedford must obtain a Home Energy Rating (HERs) by 2015 and disclose this rating to any potential buyer of said structures. Retrofits to improve the performance of a building would be eligible for financing through the Sustainable Loan Program.
Community Energy Measures
36 | Bedford Climate Action Plan

Total Cost: $0Payback: 0 years
Co-Benefits:
Scope500 Homes weatherized
Annual ReductionsCO2e: 1,206 tonnes
Energy: 718,500 kWh167,450 e/therms
$: $262,743NOx: 3,528 lbsSOx: 3,127 lbsCO: 1,474 lbs
VOCs: 239 lbsPM10: 746 lbs
Promote Existing Home Weatherization Programs to Low Income Households and Seniors
A program to help low-income earners weatherize is a win-win opportu-nity to reduce emissions while saving money for low-income residents. A weatherization program can reduce energy costs, creating more in-come to be spent on necessities while, at the same time, reducing GHG emissions due to decreased energy use.
While low-income earners generally have smaller houses and fewer ap-pliances than higher-income earners, their homes are often older and poorly insulated. Low-income weatherization programs seal cracks around windows and doors, add insulation, and sometimes replace in-efficient appliances, reducing energy-use-related GHG emissions and lowering utility bills.
Helping low-income households save money on energy bills, can help improve residents’ quality of life and the affordability of our community, as well as stimulate the local economy by providing residents extra mon-ey to spend on education, leisure or savings.
The Town of Bedford, with the Bedford 2020 Coalition and its partners, should work with qualified low-income and senior residents to promote and increase participation in existing free assistance programs offered by Westchester County and New York State.
37

Cost: $4000 increased building cost per householdPayback: 2.5 years Co-Benefits:
Scope225 new housing units
Annual ReductionsCO2e: 1,628 tonnes Energy: 970,178 kWh226,058 e/therms$: $354,723 NOx: 4,763 lbsSOx: 4,222 lbsCO: 1,991 lbsVOCs: 322 lbsPM10: 1,008 lbs
Bedford Residential Building Energy Code
Buildings account for 68% of GHG emissions in Bedford. Design and construction of new buildings, or major renovation of existing ones, pro-vides an opportunity to implement energy saving measures that reduce GHG emissions. Green building design looks at buildings as a complete system to maximize health, comfort, and productivity of occupants while minimizing resource use for construction and operation
A New York ENERGY STAR labeled home uses approximately 30% less energy than conventionally built homes. These savings come from a va-riety of energy-saving features, doors, high-efficiency heating and cool-ing systems, and energysaving appliances and lighting. New York EN-ERGY STAR labeled homes must pass a stringent evaluation, including a computerbased energy analysis, inspections, and certification testing.
The Town of Bedford should consider legislation requiring all new resi-dential dwellings and all renovated residential dwellings where changes are equal or exceed 50% of the dwelling’s existing conditioned area to be built to comply with the current New York ENERGY STAR labeled homes requirements. Under this energy code, all applicants seeking a Building Permit for a new subject dwelling shall submit a Town of Bedford New York ENERGY STAR Building Permit affidavit. Special consideration must be given to Bedford’s historic building stock to be consistent with historical preservation laws and codes and to ensure that recommended measures achieve the greatest energy savings with the least alteration to the historic building.
Community Energy Measures
38 | Bedford Climate Action Plan

Cost: $4.00 Increased Building Cost ($ per square foot)
Payback: 6.3 yearsCo-Benefits:
Scope50,000 sq. ft. of new construc-
tion or renovation
Annual ReductionsCO2e: 124 tonnes
Energy: 259,500 kWh4,950 e/therms
$: $31,593 NOx: 341 lbs
SOx: 1,092 lbsCO: 292 lbs
VOCs: 35 lbsPM10: 241 lbs
Bedford Commercial Building Energy Code
The built environment has a profound impact on our natural environ-ment, economy, health and productivity. Breakthroughs in building sci-ence, technology and operations are now available to designers, build-ers, operators and owners who want to build green and maximize both economic and environmental performance.
The US Green Building Council developed LEED (Leadership in Energy & Environmental Design) certification system is the nationally recognized standard for green building. Many cities and counties have adopted or-dinances requiring new construction or major renovation of public build-ings follow LEED standards. The LEED system establishes several levels of environmental achievement from a “Certified” rating to a “Silver” rating to a “Gold” rating to a “Platinum” rating. The ratings are attained by earn-ing LEED points in the categories of Sustainable Sites, Water Efficiency, Energy & Atmosphere, Materials & Resources, Indoor Environmental Quality and Innovation & Design Process.
The Town of Bedford should demonstrate its commitment to minimiz-ing the short-term and long-term negative impacts construction has on the environment by proposing legislation requiring all new or renovated subject structures (excluding single family units) equal to or greater than 5,000 square feet of conditioned area to be Certified LEED.
The intent of this legislation is to provide owners and occupants of com-mercial buildings and offices, industrial buildings, and multiple residenc-es of greater than 4 units with the economic benefits of energy and water savings, good indoor air quality and healthy, pleasant and productive surroundings. A further intent of this article is to benefit the community by having buildings constructed that are resource-efficient and conserve energy.
39
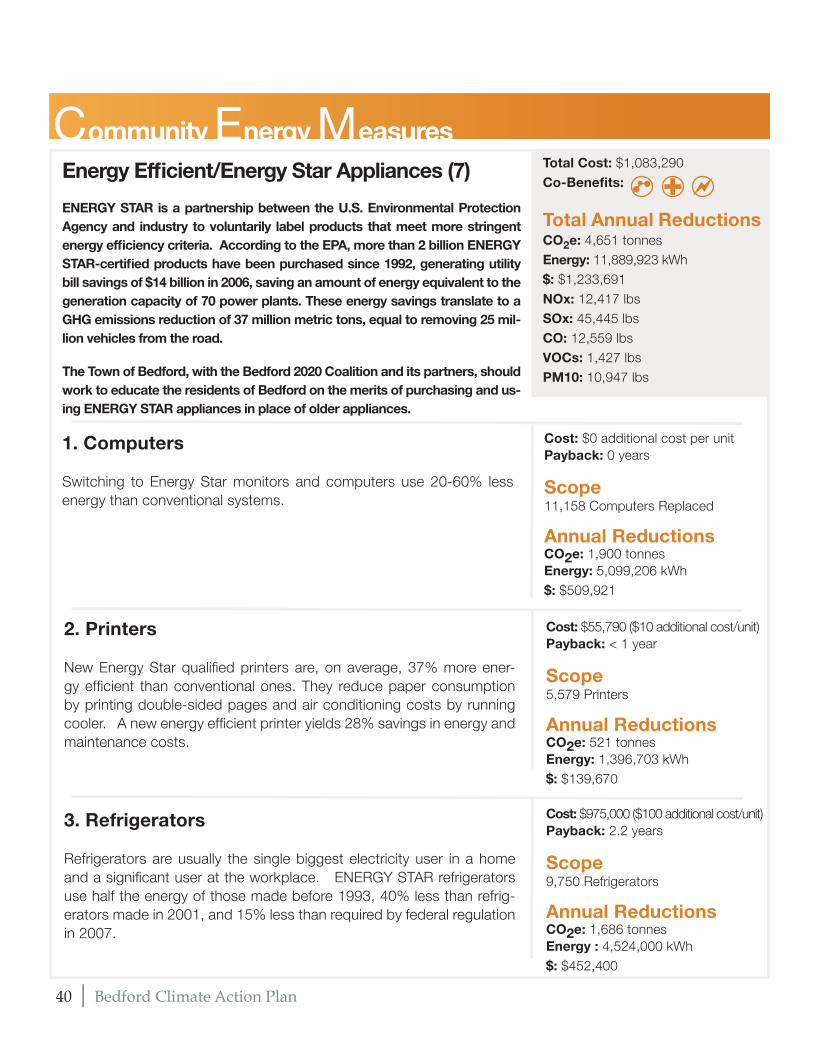
Community Energy Measures
40 | Bedford Climate Action Plan
Energy Efficient/Energy Star Appliances (7)
ENERGY STAR is a partnership between the U.S. Environmental Protection Agency and industry to voluntarily label products that meet more stringent energy efficiency criteria. According to the EPA, more than 2 billion ENERGY STAR-certified products have been purchased since 1992, generating utility bill savings of $14 billion in 2006, saving an amount of energy equivalent to the generation capacity of 70 power plants. These energy savings translate to a GHG emissions reduction of 37 million metric tons, equal to removing 25 mil-lion vehicles from the road.
The Town of Bedford, with the Bedford 2020 Coalition and its partners, should work to educate the residents of Bedford on the merits of purchasing and us-ing ENERGY STAR appliances in place of older appliances.
Total Cost: $1,083,290Co-Benefits:
Total Annual ReductionsCO2e: 4,651 tonnes Energy: 11,889,923 kWh$: $1,233,691NOx: 12,417 lbsSOx: 45,445 lbsCO: 12,559 lbsVOCs: 1,427 lbsPM10: 10,947 lbs
1. Computers
Switching to Energy Star monitors and computers use 20-60% less energy than conventional systems.
Cost: $0 additional cost per unitPayback: 0 years
Scope11,158 Computers Replaced
Annual ReductionsCO2e: 1,900 tonnesEnergy: 5,099,206 kWh$: $509,921
2. Printers
New Energy Star qualified printers are, on average, 37% more ener-gy efficient than conventional ones. They reduce paper consumption by printing double-sided pages and air conditioning costs by running cooler. A new energy efficient printer yields 28% savings in energy and maintenance costs.
Cost: $55,790 ($10 additional cost/unit)Payback: < 1 year
Scope5,579 Printers
Annual ReductionsCO2e: 521 tonnesEnergy: 1,396,703 kWh$: $139,670
Cost: $975,000 ($100 additional cost/unit)Payback: 2.2 years
Scope9,750 Refrigerators
Annual ReductionsCO2e: 1,686 tonnesEnergy : 4,524,000 kWh$: $452,400
3. Refrigerators
Refrigerators are usually the single biggest electricity user in a home and a significant user at the workplace. ENERGY STAR refrigerators use half the energy of those made before 1993, 40% less than refrig-erators made in 2001, and 15% less than required by federal regulation in 2007.

4. Dishwashers
Energy Star rated dishwashers consume less water as well as less en-ergy than traditional dishwashers. As part of a water conservation pro-gram, efficient dishwashers can help reduce the amount of water used and sewer water needed to be treated.
Cost: $0 additional cost per unitPayback: 0 years
Scope5,200 Dishwashers
Annual ReductionsCO2e: 422 tonnes
Energy: 543,514 kWh39,208 e/therms
$: $99,050 Gallons of water: 2,236,000
5. Vending Machines
As contracts with vendor operators come up for renewal, businesses can negotiate new contracts that include more energy efficient ma-chines that will reduce GHG emissions and cost less to operate. Switch-ing to just one ENERGY STAR-labeled vending machine can reduce a company’s CO2 emissions by 25,651.91 lbs over its 14-year lifecycle, equivalent to removing 3.11 cars from the road every year.
41
Cost: $0 additional cost per unitPayback: 0 years
Scope100 Vending Machines
Annual ReductionsCO2e: 62 tonnes
Energy: 165,900 kWh $: $16,590
6. Water Coolers
The office water cooler can use more electricity than a full-size refriger-ator. An ENERGY STAR water cooler reduces this energy use by 50%. An ENERGY STAR hot and cold water cooler can save $47 a year in energy, and a cold cooler can save $12 a year. (Coolers that produce both hot and cold water use more energy and offer more potential for savings).
Cost: $50,000 ($10 additional cost/unit)Payback: 4.9 years
Scope500 Water Coolers
Annual ReductionsCO2e: 38 tonnes
Energy: 102,000 kWh $: $10,200
7. Copiers
Today, there are over 220 million imaging equipment units, such as fax machines and copiers, in US buildings. Together, these units consume 40 billion kWh each year, roughly 2% of US building sector electricity consumption. These are often the most energy-intensive type of office equipment because they are left on for long periods of time — in some case, 24 hours per day. Models that meet the revised ENERGY STAR imaging equipment criteria will be more efficient and save users money over the lifetime of the product.
Cost: $2,500 ($10 additional cost/unit)Payback: < 1 year
Scope250 Copiers
Annual ReductionsCO2e: 22 tonnes
Energy: 58,600 kWh$: $5,860

Community Energy Measures
42 | Bedford Climate Action Plan
Heating and Cooling Efficiency (6 Measures)
Energy used to heat, cool, and ventilate contributes to the ma-jority of energy used in buildings. Improving the efficiency of the equipment used for these tasks reduces emissions and saves on climatization costs. Upgrading to the most efficient chillers, boilers, heating, ventilation, and air conditioning (HVAC) units and performing proper scheduled maintenance maximizes en-ergy savings.
The Town of Bedford, with the Bedford 2020 Coalition and its partners, should work to educate the residents of Bedford on the merits of energy efficient heating and cooling equipment.
Total Cost: $8,404,689Co-Benefits:
Total Annual ReductionsCO2e: 3,821 tonnes Energy: 2,955,270 kWh$: $849,127 NOx: 11,099 lbsSOx: 12,725 lbsCO: 5,184 lbsVOCs: 794 lbsPM10: 2,964 lbs
1. Water Heaters
When Energy Star water heaters are purchased as a part of a broader energy efficiency program, a significant reduction in electricity, fuel oil and natural gas use can be realized. Communities with fossil fuel power plants within their airshed could contribute to the reduction of criteria air pollutants created from electricity generation through such a pro-gram. An Energy Star water heater can help reduce energy costs for the facility.
Cost: $7,521,593 ($1,012 additional cost per unitPayback: 9.7 years
Scope6,761 Water Heaters Replaced
Annual ReductionsCO2e: 3,488 tonnesEnergy: 2,716,570 kWh 441,899 e/therms$: $775,422
2. Boiler Efficiency
When Energy Star boilers are purchased as a part of a broader en-ergy efficiency program, a significant reduction in electricity, fuel oil and natural gas use can be realized. Whether gas or oil, ENERGY STAR qualified boilers use about 6% less energy than a standard boiler. They achieve greater efficiency with improved features, such as electric igni-tion, which eliminates the need to have the pilot light burning all the time , and new combustion technologies that extract more heat from the same amount of fuel.
Cost: $794,818 ($0.36 additional cost of efficient boilers per sq. ft.)Payback: 15.9 years
Scope2,207,827 sq ft of facilities upgraded with new boilers
Annual ReductionsCO2e: 245 tonnesEnergy: 43,715 e/therms$: $49,835

4. Room Air Conditioners
Nationwide, room air conditioners consume 22 billion kWh of electricity a year. ENERGY STAR air conditioners use about 10% less energy than new non-ENERGY STAR units. If the air conditioner you are replacing is an older model, the savings can be much greater. A new ENERGY STAR unit can use half the energy of an air conditioner made in the 1970s. To save the most energy, look for the air conditioner with an Energy Star rating and the highest energy efficiency rating (EER).
Cost: $50,000 ($50 additional cost/unit)Payback: 5.3 years
Scope1000 Window Air Conditioners
Annual ReductionsCO2e: 35 tonnes
Energy: 95,000 kWh$: $9,500
5. HVAC Fan Upgrades
HVAC fans, with the help of pumps, transfer heated or cooled air into homes or buildings. When efficient HVAC are purchased as a part of a broader energy efficiency program, a significant reduction in electricity, fuel oil and natural gas use can be realized.
3. Chiller Efficiency
Air conditioning is one of the largest energy users in commercial build-ings. Replacing older chillers with appropriately-sized and the most efficient, new chillers can reduce energy use by 30%.
Cost: $36,000 ($0.36 additional cost of efficient boilers per sq. ft.)
Payback: 3.5 years
Scope100,000 sq ft of facilities upgraded
with energy efficient chillers
Annual ReductionsCO2e: 38 tonnes
Energy : 102,300 kWh$: $10,230
43
Cost: $2,000 ($0.02 additional cost of efficient fans per sq ft)
Payback: < 1 years
Scope100,000 sq ft of facilities upgraded
with energy efficient HVAC fans
Annual ReductionsCO2e: 15 tonnes
Energy: 41,400 kWh $: $4,140
6. Combined Heat & Power Infrastructure Education
Combined heat and power (CHP), also known as cogeneration, is the simultaneous production of electricity and heat from a single fuel source, such as: natural gas, biomass, biogas, coal, waste heat, or oil.CHP is the sequential production and use of electricity and thermal en-ergy from a single fuel. CHP is inherently more efficiency than separate generation of electricity from central station power plants and thermal energy from boilers or other heating equipment.
Scopedata unavailable

Cost: $2,580 ($2.50 per CFL)Payback: 0.5 yearsCo-Benefits:
Scope1,000 lightbulbs exchanged for CFLs
Annual ReductionsCO2e: 16 tonnes Energy: 44,000 kWh$: $4,814 NOx: 44 lbsSOx: 185 lbsCO: 46 lbsVOCs: 5 lbsPM10: 40 lbs
Compact Fluorescent Light Bulb (CFL) Distribution
Installing compact fluorescent light bulbs (CFLs) is one of the simplest and most cost-effective energy saving measures people can take in their homes. CFLs use about 75% less energy than incandescent bulbs, according to the U.S. Department of Energy. If every home in the U.S. replaced an incandescent bulb with a CFL bulb in just one light fixture, the country would save more than $600 million in energy costs per year, reducing GHG emissions by the equivalent of removing 800,000 cars from the road
The Town of Bedford, working with the Bedford 2020 Coalition and its partners, should encourage community members to purchase CFLs for their homes by holding promotional CFL giveaway days, in which resi-dents take home a free CFL bulb. This raises awareness of the benefits of CLFs, encouraging participants and their neighbors to buy additional bulbs on their own. They should also explore additional ways of offering free or discounted CFLs to residents, work to promote safe and proper recycling and explore additional local recycling sites.
Cost: $1,037,678 ($0.47 per sq ft)Payback: 3.3 yearsCo-Benefits:
Scope2,207,827 sq ft retrofitted with ef-ficient lighting
Annual ReductionsCO2e: 1,184 tonnesEnergy: 3,175,959 kWh$: $317,596 NOx: 3,160 lbsSOx: 13,326 lbsCO: 3,309 lbsVOCs: 372 lbsPM10: 2,919 lbs
Efficient Lighting Retrofits for Non-Residential Buildings
Artificial lighting consumes almost 15% of a household’s electricity use and is typically the largest electricity user in commercial buildings. light-ing technologies can reduce lighting energy use by selecting lighting and sources that use energy more efficiently, and by installing lighting con-trols.
The Town of Bedford, with the Bedford 2020 Coalition and its partners, should work on outreach and education on the merits of installing energy efficient lighting in all non residential buildings.
Community Energy Measures
44 | Bedford Climate Action Plan

Cost: $132,469 ($0.06 per sq. ft.)Payback: < 1 year
Co-Benefits:
Scope2,207,827 sq ft installed with oc-
cupancy sensors
Annual ReductionsCO2e: 1973 tonnes (.71% reduc-tion in total Community Emissions
and 3.6% of 20% by 2020 goal)Energy (annually): 5,293,265 kWh
$: $529,327NOx: 5,267 lbs
SOx: 22,211 lbsCO: 5,516 lbs
VOCs: 619 lbsPM10: 4,865 lbs
Lighting Occupancy Sensors for Non-Residential Buildings
Lighting is typically the largest electricity user in commercial buildings. Much energy is wasted by lights left on when no one is using them. In-stallation of lighting occupancy sensors prevent this by using sensors to detect motion in the lighted space and turning lights off if no one is pres-ent. Sensors can reduce energy use for lighting by an average of 35%. When efficient lights and sensors are purchased as a part of a broader green procurement or energy efficiency program, a significant reduction in electricity use can be realized.
The Town of Bedford, with the Bedford 2020 Coalition and its partners, should work on outreach and education on the merits of installing lighting occupancy sensors in all non-residential buildings.
Cost: $7,500 ($7.50 per LED light string)
Payback: 5 years Co-Benefits:
Scope1000 strings of LED lights
Annual ReductionsCO2e: 6 tonnes
Energy: 15,000 kWh$: $1,500
NOx: 15 lbsSOx: 63 lbsCO: 16 lbs
VOCs: 2 lbsPM10: 14 lbs
LED Holiday Lights
LED holiday lights use up to 95% less energy than incandescent lights. Each bulb in a light string is small, but together, with several strings per home, they can draw a lot of energy. One string can use 150 watts, or 16 kWh over the holiday season, while an LED string will use less than 1 kWh.
The Town of Bedford, with the Bedford 2020 Coalition and its partners, should work with Bedford’s residential and commercial sectors on out-reach and education on the merits of installing LED holiday lights.
45

Cost: $13,475,000 ($7,000 per kW)(before incentives)$6,737,000 (after State incentives)$2,694,000 (after State and Federal Incentives) Payback: 60 years (before State incentives)12 years (after State incentives)Co-Benefits:
Scope1,925 kW of PV Installed
Annual ReductionsCO2e: 825 tonnes Energy: 2,220,000 kWh$: $222,000NOx: 2,202 lbsSOx: 9,287 lbsCO: 2,306 lbsVOCs: 259 lbsPM10: 2,034 lbs
Solar Photovoltaic (PV) Energy
Solar photovoltaic (PV) power harnesses sunlight to generate electric-ity. By substituting solar energy for fossil fuels, energy can be produced without generating GHG emissions. Solar Electric or PV systems create electricity that can be used in your home or business to run your appli-ances, lighting, and central air conditioning just as you would use the power from your utility’s electric grid.
NYSERDA (New York State Energy Research and Development Author-ity) has several tools to help inform consumers about costs, installation and incentives.
The Town of Bedford, with the Bedford 2020 Coalition and its partners, should develop education and outreach opportunities to encourage in-stallation of Solar PV systems on community buildings.
Cost: $1,365,000 ($2,100 per home)Payback: 14 yearsCo-Benefits:
Scope650 Homes
Annual ReductionsCO2e: 454 tonnesEnergy: 211,413 kWh 66,985 e/therms$: $97,504NOx: 1,336 lbsSOx: 932 lbsCO: 511 lbsVOCs: 87 lbsPM10: 229 lbs
Solar Hot Water
Solar Hot Water can help reduce the cost of making hot water in your home or business by 50-75%. Solar thermal collectors on the roof ab-sorb the sun’s heat and transfer it into a solar storage tank adjacent to your existing hot water heater with the help of a small circulating pump.
Solar thermal solutions are great for homeowners that may not be eli-gible for PV systems because they don’t requires as much roof space and are less expensive. Although state rebates are not applicable to solar thermal systems, both Federal and State Tax Credits are available. A 25% state tax credit (capped at $5,000) and a 30% federal tax credit (with no cap) are available for homeowners in NY.
The Town of Bedford, with the Bedford 2020 Coalition and its partners, should develop education and outreach opportunities to encourage in-stalation of solar hot water systems on residential and commercial build-ings.
Community Energy Measures
46 | Bedford Climate Action Plan

Cost: $1,201,500 ($1,350 per home)Payback: 1.7 year
Co-Benefits:
Scope890 Homes
Annual ReductionsCO2e: 1,889 tonnes
Energy: 12,791,970 kWh$: $693,481
NOx: 4,096 lbsSOx: 53,331 lbsCO: 11,102 lbs
VOCs: 1,022 lbsPM10: 11,492 lbs
Switch Electric Heat to Natural Gas
Energy used to heat, cool, and ventilate contributes to the majority of en-ergy used in buildings. Using electricity for heat is only about one third as efficient as burning fuel directly for heat. Facilities with electric resistance heat can reduce emissions and save money on heating by switching to natural gas or propane, as electric heating is inherently inefficient.
The Town of Bedford, with the Bedford 2020 Coalition and its partners, should identify streets that have access to existing gas lines that would enable residents to replace electric heating systems with more efficient natural gas heating systems.
Cost: $50,000 (5,000 per unit, in-creased building cost)
Payback: 7.1 Co-Benefits:
Scope10 efficient multi-family housing units
Annual ReductionsCO2e: 29 tonnes
Energy: 51,400 kWh, 1,700 e/therms
$: $7,078NOx: 80 lbs
SOx: 217 lbsCO: 61 lbs
VOCs: 8 lbsPM10: 48 lbs
Energy Efficient Multi-Family Housing
Buildings account for 68% of GHG emissions in Bedford. Design and construction of new buildings, or major renovation of existing ones, pro-vides an opportunity to implement energy saving measures that reduce GHG emissions. Green building design looks at buildings as a complete system to maximize health, comfort, and productivity of occupants while minimizing resource use for construction and operation
The Town of Bedford, with the Bedford 2020 Coalition and its partners, should consider legislation that requires all new multi-family housing (greater than four family) and all renovated residential dwellings for the purposes of multi-family housing (greater than four family), where chang-es are equal or exceed 50% of the dwelling’s existing conditioned area to be built to comply with the LEED certified requirements. Under this certification, all applicants seeking a Building Permit to build multi-family housing units shall submit to the Town of Bedford New York a LEED Building Permit affidavit.
47

Ordinance Review for Renewable Energy Installation
The Town of Bedford, with the Bedford 2020 Coalition and its partners, should review all current town ordinances and codes and consider amending legislation that unnecessarily impedes or restricts the installa-tion and use of renewable energy in the town.
Residential Construction Feebate Program
Residential buildings are responsible for 68% of Bedford’s greenhouse gas emissions, and Bedford’s residents and businesses now spend at least $25 million each year to heat, cool and power our buildings. The Town’s goal to reach a 20% reduction of GHG emissions by 2020 must be achieved with an outlook on new building performance. Because buildings last for many decades, our new buildings will affect Bedford for the next century or more. Only 25% of the lifetime costs associated with a building represent construction and finance while three quarters of lifetime costs consist of energy, maintenance and fuel inputs. High performance efficient buildings offer one of the best solutions to improve environmental performance while strengthening the local economy and keeping buildings affordable in the long term.
For new residential construction projects, the program proposes a green building GHG emissions “feebate”—a market-based instrument that es-tablishes an optimal community baseline level of CO2 emissions for new buildings. This program then levies fees for new buildings with elevated GHG emissions, waives fees for those with GHG emission levels consis-tent with the baseline and rewards those with low GHG emissions. The feebate concept is not a “tax” and shouldn’t be confused with traditional revenue raising processes. Feebate programs are crafted to be revenue neutral policy that encourages the adoption of a municipal/community goal through market-based incentives.
The Town of Bedford, with the Bedford 2020 Coalition and its partners, should explore the feasibility of a program in which all new residential buildings in Bedford are compared against a pre-determined optimal baseline level of CO2 emissions. New buildings that have CO2 emis-sions below the determined baseline level are paid a rebate; those above the determined baseline level would pay a fee.
Community Energy Measures
48 | Bedford Climate Action Plan
Cost: Not availablePayback: Not availableCo-Benefits:
Cost: $0Payback: 0 yearsCo-Benefits:

Smart Grid
In today’s electricity markets, communities that can measurably reduce electric consumption on demand, are in a position to be compensated as if they were a power plant, and sell their “reductions” into the power market. New Smart Grid infrastructure and technology will provide users of electricity with the tools to automatically manage their electricity con-sumption and reduce demand while offering the potential to earn com-pensation. Automatically turning an appliance off on a moment’s notice, for a limited time, has the same effect as turning a power plant on, on a moment’s notice. These developing “demand response” services have reduced the need to switch on older, inefficient and costly power plants on short notice, and reduces the need to construct new plants.
Within six to twelve months our appliance stores will carry applianc-es that are labeled with a “Smart Appliance” tag. The owners of these appliances will have the option to connect to the Smart Grid and will have them automatically respond to calls from the grid to reduce de-mand. Participating Smart Grid communities will be compensated for measurable reductions in demand. Last year, end-users and their rep-resentatives were paid more than a billion dollars to shave their electric use at “peak times”, when electricity consumption was unusually heavy.
The Town of Bedford, with the Bedford 2020 Coalition and its partners, should work to educate our residents and position our community to receive the maximum benefit from the regional and nationwide move to Smart Grid infrastructure.
49
Cost: Not availablePayback: Not available
Co-Benefits:
Cost: Not availablePayback: Not available
Co-Benefits:
Accelerate Permitting Process for Green Buildings
The Town of Bedford recognizes that green building design and con-struction have a significant impact on our greenhouse gas reduction goals and create healthier buildings for the people who live and work in our community. The town should propose that applicants seeking a Building Permit for projects that exceed existing energy efficiency codes in Bedford (i.e. building to LEED or ENERGY STAR standards), receive accelerated permit processing. Applicants must still comply with all oth-er Town Building codes and regulations.

50 | Bedford Climate Action Plan

c.
51
(8.2% )of total proposed GHG reductions
total GHG reduction in sector: 15,922 Tonnes CO2eco-benefits:
Transportation
We, as a nation, have become completely reliant on our cars, trucks mini-vans and SUVs. Single occupancy vehicles provide a convenience and reliability that we have grown accustomed to for commuting, errands and trips of all length. In Bedford, transportation accounts for 27% of our greenhouse gas emissions in addition to contributing countless other pol-lutants to the atmosphere.
There are three principal ways to reduce the emissions from transporta-tion vehicles in Bedford: Reduce the total number of miles traveled by switching transportation to walking, bicycling, and mass transit; shift to more fuel efficient cars by trading in larger less efficient vehicles for small-er vehicles, or purchasing hybrid electric vehicles; and switch to fuels that emit fewer pollutants.
The measures contained in this section may be the most challenging to implement, as shifting demand away from the personal vehicle and to-ward alternative modes of transportation are dependent upon personal choice - but, we are certain that with some community infrastructure im-provements and educational components, the changes are feasible.

Cost: Not availableCo-Benefits:
Scope11 smaller vehicles
Annual ReductionsCO2e: 9 tonnesGasoline: 920 gallons$: $1,840NOx: 3 lbsCO: 622 lbsVOCs: 65 lbs
Use Smaller Fleet Vehicles
One easy way to improve the efficiency of vehicles is simply to use a smaller one. The smallest vehicle that can accomplish a task will usu-ally be the most efficient. When considering a vehicle purchase, identify whether an SUV or full-size sedan is actually necessary, or whether a compact car can do the same job.
The Climate Action Plan recommends that the Town of Bedford explore the feasibility of using smaller vehicles, scooters and small electric ve-hicles in its municipal fleet.
52 | Bedford Climate Action Plan
Municipal Transportation Measures
Cost: $50,000 ($10,000 addi-tional cost per EV)Payback: 18.7 yearsCo-Benefits:
Scope5 EVs
Annual ReductionsCO2e: 16 tonnesEnergy: -33,417 kWhGasoline: 3,011 gal. $: $2,679 NOx: -24 lbsSOx: -140 lbsCO: 2,000 lbsVOCs: 210 lbsPM10: -26 lbs
Electric Vehicles
Electric vehicles (EVs) run off of electricity and battery power as opposed to more traditional fuels types like gasoline and diesel fuel. EVs also use regenerative braking to capture and reuse the energy of the vehicles’ momentum. They will have a major impact on our fuel reduction, and, when paired with renewable energy sources, will also greatly reduce GHG emissions.
The Town of Bedford should encourage the use of electric vehicles with “plug-in” charging stations for commuter parking lots and other high trav-eled areas and explore the cost of plug-in installations. Town vehicles powered by alternative technologies should be labelled as such with an appropriate logo, to promote and reinforce an energy efficiency message to the public, thereby encouraging citizens to follow the lead of the Town when buying their next vehicle.

Cost: $45,000 (for 15 Hybrids)Payback: 4.3 years
Co-Benefits:
ScopeReplace 15 conventional-powered
vehicles with 15 hybrids.
Annual ReductionsCO2e: 49 tonnes
Gasoline: 5,250 gal. $: $10,500
NOx: 16 lbsSOx: 1 lb
CO: 3,549 lbsVOCs: 372 lbs
PM10: 8 lbs
Hybrid Vehicles in Municipal Fleet
Hybrid/electric vehicles couple an electric drive with a gasoline engine. They are widely available and are suited for a variety of applications. Electric drivetrains are much more efficient than the drivetrains used on standard internal combustion engine vehicles. Automakers are increas-ingly making hybrid/electric versions of existing models available.
The Town of Bedford should set a goal to add 15 hybrids vehicles to the municipal fleet over the next ten years. Town vehicles powered by alternative technologies should be labelled as such with an appropri-ate logo, to promote and reinforce an energy efficiency message to the public, thereby encouraging citizens to follow the lead of the Town when buying their next vehicle.
53
Cost: $0 additional costPayback: 0 years
Co-Benefits:
Scope58,943 gallons per year switched
from diesel to biodiesel
Annual ReductionsCO2e: 46 tonnes
NOx: -42 lbsSOx: 50 lbsCO: 296 lbs
VOCs: 183 lbsPM10: 29 lbs
Fleet Conversion to Biodiesel (B20)
Using biodiesel in municipal fleet vehicles is a simple and effective way to achieve large reductions in CO2 emissions from fleet operations. Gar-bage trucks, snowplows, fire trucks, maintenance vehicles, and transit buses are all good options for using biodiesel. There is no need to convert the vehicles, so there is no capital cost to the switch. Biodiesel can be used by itself (called B100 for 100% biodiesel), or mixed with petroleum diesel. A popular mix is B20, 20% biodiesel with 80% petro-leum diesel.
The Town of Bedford should consider replacing a portion of its diesel supply with biodiesel for use in the town fleet where appropriate. Town vehicles powered by alternative technologies should be labelled as such with an appropriate logo, to promote and reinforce an energy efficiency message to the public, thereby encouraging citizens to follow the lead of the Town when buying their next vehicle.

54 | Bedford Climate Action Plan
Municipal Transportation MeasuresCost: $2,500 ($500 per vehicle) Payback: 1.6 yearsCo-Benefits:
Scope5 vehicles
Annual ReductionsCO2e: 6 tonnesGasoline: 2,667 gallons$: $1,533NOx: 4 lbsSOx: 0 lbsCO: 1,488 lbsVOCs: 182 lbsPM10: 3 lbs
Compressed Natural Gas (CNG) Vehicles
Natural gas is a clean-burning alternative to gasoline or diesel for munici-pal and private fleet vehicles. While natural gas is a fossil fuel, it has lower carbon emissions per unit of energy than gasoline or diesel.
The Town of Bedford should explore bringing the necessary infrastructure (pumping stations) to the town and encourage the addition of 5 com-pressed natural gas vehicles to its municipal fleet. Town vehicles pow-ered by alternative technologies should be labelled as such with an ap-propriate logo, to promote and reinforce an energy efficiency message to the public, thereby encouraging citizens to follow the lead of the Town when buying their next vehicle.
Cost: Not availablePayback: Not availableCo-Benefits:
Scope10 additional employees daily transit passengers
Annual ReductionsCO2e: 17 tonnesGasoline: 2,388 gal.Energy: -14,219 kWhVehicle Miles: 47,040 mi $: $4,776 NOx: -7 lbs SOx: -59 lbsCO: 1,599 lbsVOCs: 168 lbsPM10: -10 lbs
Increase Rail Transit Ridership
Rail transit is much more efficient than personal automobiles. Encour-aging people to switch to taking the train for their daily commute re-duces emissions and local air pollution.
The Town of Bedford, with the Bedford 2020 Coalition and its partners, should consider a transportation survey to determine commuter pat-terns among the town’s employees. The results can assist with target-ing education and encouraging the use of rail transit, where possible.

55
Cost: $0Co-Benefits:
Scope24 vehicles
Annual ReductionsCO2e: 27 tonnes
Diesel: 2,880 gallons $: $7,200
NOx: 103 lbsSOx: 14 lbsCO: 131 lbs
VOCs: 42 lbsPM10: 14 lbs
Enforce Weschester County’s Anti-Idling Law for Town Owned Trucks
On February 10, 2009, Westchester County adopted the Anti Idling Law to limit idling, when a vehicle is not in motion, to three consecutive min-utes. This applies to all municipal vehicles with the exception of emer-gency vehicles and other external conditions. Idling a diesel vehicle for one hour a day is equivalent in engine wear to driving 64,000 miles and using over 500 gallons of fuel annually. Gasoline wasted while idling is the equivalent of 22 lbs of eCO2 for every hour of idling. In addition there are significant health benefits to improving air quality as studied by the American Cancer Foundation and the EPA. The Town of Bedford should enforce the anti idling restriction throughout its non-emergency municipal fleet.
Cost: Not availableCo-Benefits:
Scope12 employees
Annual ReductionsCO2e: 1 tonne
Vehicle Miles: 2,880 mi.Gasoline: 146 gallons
$: $292CO: 99 lbs
VOCs: 10 lbs
Promote Use of Public Transportation, Carpooling and Vanpooling
Using public transportation, or sharing a car or van to get to work is much more efficient than driving to work alone. The Town of Bedford should initiate incentives for those municipal employees who significantly reduce their vehicle miles traveled. Employees could reach this goal by car-pooling, van-pooling, using public transportation, and biking or walk-ing to work. Incentives can range from free lunch once a month to cash bonuses or extra time off. In addition, their personal savings at the gas station will be significant.
Cost: $1,000 cost of bike and training Payback: Not available
Co-Benefits:
Scope3 officers on bicycles
Annual ReductionsCO2e: 21 tonnes
Gasoline: 2,258 gallons$: $20,400
CO: 1,526 lbsVOCs: 160 lbs
Police on Bicycles
Reducing the use of vehicles in government operations reduces GHG emissions. Police cars are usually heavy cars with large engines that get poor mileage and produce a large amount of GHG emissions per vehicle. Bicycles, on the other hand, produce no emissions. Police on bicycles are more approachable, better able to connect with the public, and better able to observe what is happening. Also, police on bicycles can pursue suspects in places where cars can’t go.
The Town of Bedford should explore the feasibility of adding bicyles to its fleet and providing officers with the necessary training.

Cost: Not available Payback: Not availableCo-Benefits:
Scope6,410 smaller vehicles replacing larger cars
Annual ReductionsCO2e: 4,738 tonnesGasoline: 505,408 gal.$: $1,006,816NOx: 1,504 lbsSOx: 98 lbsCO: 340,315 lbsVOCs: 35,690 lbsPM10: 732 lbs
Use Smaller Fleet Vehicles
One easy way to improve the efficiency of vehicles is simply to use a smaller one. The smallest vehicle that can accomplish a task will usu-ally be the most efficient. When considering a vehicle purchase, identify whether an SUV or full-size sedan is actually necessary, or whether a compact car can do the same job.
In some communities, exhaust from cars and light trucks are the single biggest cause of local air pollution. Using fuel more efficiently reduces this pollution. In addition to reducing emissions and saving on fuel costs, smaller vehicles usually have a lower price.
The Town of Bedford, with the Bedford 2020 Coalition and its partners, should work to educate and inform the community about the benefits of using smaller cars and more efficient vehicles.
Community Transportation Measures
56 | Bedford Climate Action Plan
Cost: $1,500,000 ($3,000 addition-al cost per vehicle)Payback: 6.8 yearsCo-Benefits:
ScopeIncrease number of hybrids used by 500
Annual ReductionsCO2e: 1,031 tonnesGasoline: 109,565 gal.$: $219,130NOx: 327 lbsSOx: 21 lbsCO: 74,068 lbsVOCs: 7,768 lbsPM10: 159 lbs
Increase Ownership of Hybrid Vehicles
Hybrid/electric vehicles couple an electric drive with a gasoline engine and are widely available and are suited for a variety of applications. Elec-tric drivetrains are much more efficient than the drivetrains used on stan-dard internal combustion engine vehicles. Auto-makers are increasingly making hybrid/electric versions of existing models available.
The Town of Bedford, with the Bedford 2020 Coalition and its partners, should work to increase ownership of hybrids by 500 vehicles over the next ten years. Currently, hybrids are the most fuel efficient cars in each size class. The Town of Bedford offers a financial incentive in its two com-muter lots for owners of hybrid vehicles. Under this program, residents who own a hybrid receive a $50 annual incentive at the time of permitting. Additional opportunities to educate Bedford residents about the benefits of hybrid vehicles, and to offer additional incentive programs to increase ownership should be explored.

57
Cost: $6,500 ($1.00 per household)Payback: 0 years
Co-Benefits:
Scope6,500 households targeted
Annual ReductionsCO2e: 1,100 tonnes
Vehicle Miles: 2,302,186 miGasoline: 116,862 gal.
$: $233,724 NOx: 349 lbs
SOx: 23 lbsCO: 79,001 lbs
VOCs: 8,285 lbsPM10: 170 lbs
Education on Low-carbon Transportation Options
Educational and marketing efforts can have a significant effect in get-ting people to choose other transportation modes besides driving, in many cases comparable to the effect of much more expensive system upgrades. Successful marketing efforts involve a two-way flow of infor-mation, finding out what people want in transit and what information will help them use it.
Individualized marketing has been particularly successful, surveying peo-ple to find out their interest in automobile alternatives, then sending tar-geted information they request about what is available in their particular location.
The Town of Bedford, with the Bedford 2020 Coalition and its partners, should promote of a variety of transportation options (transit, ridesharing, walking, bicycling) which are more effective than just providing informa-tion on a single mode. A multi-modal access guide can help people find a car-free way from starting point to destination.
Cost: $0 additional costPayback: 0 years
Co-Benefits:
Scope383,250 gallons per year switched
from diesel to biodiesel (B20)
Annual ReductionsCO2e: 300 tonnes
NOx: -275 lbsSOx: 323 lbsCO: 1923 lbs
VOCs: 1191 lbsPM10: 190 lbs
Fleet Conversion to Biodiesel (B20)
Using biodiesel instead of diesel is a simple and effective way to achieve large reductions in CO2 emissions from vehicles. There is no need to convert the vehicles, so there is no capital cost to the switch. Biodiesel can be used by itself (called B100 for 100% biodiesel), or mixed with pe-troleum diesel. A popular mix is B20, 20% biodiesel with 80% petroleum diesel.
The Town of Bedford, with the Bedford 2020 Coalition and its partners, should work with area service stations to explore offering more wide-spread availability of biodiesel fuel to the public.

Community Transportation Measures
58 | Bedford Climate Action Plan
Cost: $1,000,000 ($10,000 addi-tional cost of each vehicle)Payback: 35.1 yearsCo-Benefits:
Scope100 electric vehicles
Annual ReductionsCO2e: 169 tonnesGasoline: 32,000 gal. Energy: - 355,200 kWh$: $28,480NOx: - 258 lbsSOx: -1,484 lbsCO: 21,263 lbsVOCs: 2,227 lbsPM10: -280 lbs
Electric Vehicles
Electric vehicles (EVs) run off of electricity and battery power as opposed to more traditional fuels types like gasoline and diesel fuel. EVs also use regenerative braking to capture and reuse the energy of the vehicles’ momentum. They will have a major impact on our fuel reduction, and, when paired with renewable energy sources, will also greatly reduce GHG emissions.
The Town of Bedford, with the Bedford 2020 Coalition and its partners, should explore community interest in and the feasibility of EV usage in our town, particularly the use of plug-in stations for commuter parking lots and other traveled areas.
Cost: $200,000 (Approx. $4,000 per station)Payback: Not availableCo-Benefits:
Scope50 Charging Stations
Annual ReductionsCO2e: 50 tonnesGasoline: 9,408 gallonsEnergy: - 104,429 kWh$: $8,373NOx: -76 lbsSOx: -436 lbsCO: 6,251 lbsVOCs: 655 lbsPM10: -82 lbs
Electric Vehicle Charging Stations in Parking Struc-tures and Other Locations
Electric vehicle (EVs) drive trains are much more efficient than the drive trains used on standard internal combustion engine vehicles. Electric mo-tors, rather than pistons and shafts, provide necessary propulsion. EVs use regenerative braking to capture and reuse the energy of the vehicle’s momentum in stop-and-go traffic, greatly increasing their efficiency in city driving. The availability of EV charging stations promotes the idea of switching to EVs. EV charging stations must be present before consum-ers purchase EVs.
The Town of Bedford, with the Bedford 2020 Coalition and its partners, should consider the feasibility of providing charging stations in strategic locations in the community, including parking spaces that are reserved for EVs and have a charging connection.

59
Cost: $384,000 ($3,000 addi-tional cost of CNG Vehicle)
Payback: 8.5 yearsCo-Benefits:
Scope128 vehicles
Annual ReductionsCO2e: 184 tonnes
Gasoline: 78,242 gal.$: $44,989
NOx: 113 lbsSOx: 11 lbs
CO: 43,669 lbsVOCs: 5,340 lbs
PM10: 94 lbs
Compressed Natural Gas (CNG) Vehicles
Natural gas is a clean-burning alternative to gasoline or diesel for munici-pal and private fleet vehicles. While natural gas is a fossil fuel, it has lower carbon emissions per unit of energy than gasoline or diesel.
The Town of Bedford, working with the Bedford 2020 Coalition and its partners, should explore bringing the necessary infrastructure (pumping stations) to the community and promote the merits of CNG vehicles.
Cost: Not availablePayback: Not available
Co-Benefits:
Scope4,886 employees offered carpool
and vanpool incentives
Annual ReductionsCO2e: 2,241 tonnes
Vehicle Miles: 4,690,560 miGasoline: 238,099 gallons
$: $476,199NOx: 711 lbs
SOx: 46 lbsCO: 160,960 lbs
VOCs: 16,880 lbsPM10: 346 lbs
Promote Use of Public Transportation, Carpooling and Vanpooling
Using public transportation or sharing a car or van to get to work is much more efficient than driving to work alone. Less fuel is used per passenger and vehicle costs are spread over more than one person.
Metropool’s NuRide program, available in Westchester County, is a free on-line ridesharing match, in which members are rewarded for carpooling and vanpooling. For more information, visit www.nuride.com
The Town of Bedford, with the Bedford 2020 Coalition and its partners, should consider education programs to inform the community about the cost savings, health benefits, and possible savings associated with the use of public transportation, carpooling and vanpooling.

Community Transportation Measures
60 | Bedford Climate Action Plan
Cost: $1.10 Costshare per milePayback: Not availableCo-Benefits:
Scope200 carshare participants
Annual ReductionsCO2e: 172 tonnesVehicle Miles: 360,000 mi Gasoline: 18,274 gal.$: $36,548 (+ $636,000 avoided cost of car ownership)NOx: 55 lbsSOx: 4 lbsCO: 12,354 lbsVOCs: 1,296 lbsPM10: 27 lbs
Initiate a Carshare
Carsharing provides an alternative by allowing access to a car when needed, at a per-mile or hourly charge. For people who use a car infre-quently, a carshare program is much less expensive than car ownership. People who participate in a carshare program drive 30-60% less than people who own cars.
Carsharing encourages a reduction in vehicle miles by shifting the fixed costs of car ownership to costs people think about each time they make a choice between driving and another transportation mode.
Zipcar is an example of a successful private company working with com-munities to reduce VMT. Zipcar has 180,000 members in many US and some European cities. It reports member driving reductions from 5295 miles/year before joining to 369 miles/year after.
The Town of Bedford, with the Bedford 2020 Coalition and its partners, should explore community interest in and the feasibility of a carshare pro-gram for Bedford.
Cost: Not availablePayback: Not availableCo-Benefits:
Scope100 additional daily transit passengers
Annual ReductionsCO2e: 132 tonnesVehicle Miles: 357,700 mi Gasoline: 18,157 galEnergy: - 108,127 kWh$: $36,314NOx: -53 lbsSOx: -450 lbsCO: 12,162 lbsVOCs: 1,275 lbsPM10: -73 lbs
Increase Rail Transit Ridership
Bedford is currently close to capacity on parking permits. To increase ridership by Bedford residents and neighboring towns to NYC or other stations in the County, the town should explore the option of additional parking. A thorough cost analysis should be completed along with en-gaging the partnership of the MTA in this long-term project.
The Town of Bedford, working with the Bedford 2020 Coalition and its partners, should also look for ways to increase rail ridership by: exploring the feasibility of a jitney service that will pick riders up at convenient loca-tions and take them to the area train stations, researching successful lo-cal models (such as the Housatonic Area Regional Transit (HART) shuttle that transports Ridgefield, CT residents to the Katonah train station), and exploring interest levels among residents for this type of service by con-ducting surveys.

61
Cost: Not availablePayback: Not available
Co-Benefits:
Scope796 additional daily bus
passengers
Annual ReductionsCO2e: 181 tonnes
Vehicle Miles: 1,162,160 Gasoline: 58,993 gal
Diesel: -39,318 galNOx: -1232 lbs
SOx: -183 lbsCO: 38,087 lbs
VOCs: 3603 lbsPM10: - 107 lbs
Increase School Bus Ridership
The Town of Bedford, with the Bedford 2020 Coalition and its partners, should work with Bedford Central and Katonah–Lewisboro School Dis-tricts to increase student use of buses or car-pooling by launching an education campaign on the cost and health benefits to parents, their families, and the community.
Cost: Not availablePayback: Not available
Co-Benefits:
Scope608 additional daily passengers
riding the bus / avoided car trips to station
Annual ReductionsCO2e: 69 tonnes
Gasoline: 22,530 gallonsDiesel: - 15,016 gallons
$: $65,111 or $107 per student (at $2.89/gal)
NOx: -471 lbsSOx: -70 lbs
CO: 14,546 lbsVOCs: 1,376 lbs
PM10: -41 lbs
Increase Bus Ridership + Regional Transportation Study to Determine Commuting Patterns
The Town of Bedford, working with the Bedford 2020 Coalition and its partners, should initiate a study to determine commuting patterns as well as community interest in and the feasibility of a commuter bus system linking the hamlets to Park and Rides and the Metro North train stations in our area. This study would also require a survey to all households in the town to best determine probable use and interest.

Community Transportation Measures
62 | Bedford Climate Action Plan
Cost: Not availablePayback: Not availableCo-Benefits:
Scope233 vehicles
Annual ReductionsCO2e: 266 tonnesDiesel: 27,960 gallons $: $69,900NOx: 1,001 lbsSOx: 138 lbsCO: 1,276 lbsVOCs: 412 lbsPM10: 137 lbs
Enforce Westchester County’s Anti-Idling Law for Trucks
On February 10, 2009, Westchester County adopted the Anti Idling Law to limit idling, when a vehicle is not in motion, to three consecutive min-utes. This law applies to all non emergency vehicles, including school buses on school property and venders doing business in the County of Westchester. Idling a diesel vehicle for one hour a day is equivalent in engine wear to driving 64,000 miles and using over 500 gallons of fuel annually. Gasoline wasted while idling is the equivalent of 22 lbs of eCO2 for every hour of idling.
The Town of Bedford, with the Bedford 2020 Coalition and its partners, should work together to enforce Westchester County’s anti-idling law for all commercial trucks doing business in the town. The town should con-sider tracking tickets issued and prohibit excessive offenders from doing business in the town.
Enforce Westchester County’s Anti-Idling Law for all Non-Emergency Cars
On February 10, 2009, Westchester County adopted the Anti Idling Law to limit idling, when a vehicle is not in motion, to three consecutive min-utes. This applies to all vehicles with the exception of emergency vehicles and several other external conditions, including temperatures below 32 degrees F.
The Town of Bedford, with the Bedford 2020 Coalition and its partners, should work to enforce Westchester County’s anti-idling law by creating and distributing information to the residents of town.
Cost: Not availablePayback: Not availableCo-Benefits:

63
Cost: Not availablePayback: Not available
Co-Benefits:
Scope145 buses
Annual ReductionsCO2e: 127 tonnesDiesel: 13,340 gal
$: $33,350 NOx: 478 lbs
SOx: 66 lbsCO: 609 lbs
VOCs: 196 lbsPM10: 65 lbs
Enforce Westchester County’s Anti-Idling Law for Local Transit Buses and School Buses
The Town of Bedford, working with the Bedford 2020 Coalition and its partners, should partner with Westchester County, the BeeLine sys-tem and the Bedford Central and Katonah Lewisboro school districts to launch an education campaign on the public health risks of idling. The campaign could support town-wide written material as well as anti-idling signs placed in common idling areas.
Cost: Not availablePayback: Not available
Co-Benefits:
Scope16,800 weekly trips switching from
car to bicycle
Annual ReductionsCO2e: 835 tonnes
Vehicle Miles: 1,747,200 mi Gasoline: 88,690 gal.
$: $177,381NOx: 265 lbs
SOx: 17 lbsCO: 59,957 lbs
VOCs: 6,288 lbsPM10: 129 lbs
Increase Bike and Pedestrian Infrastructure, Create Bicycle Friendly Zones
Dedicated bike paths and bicycle lanes on roadways reduce the danger motor vehicles pose to bicyclists. They also make bicycling faster and more pleasant. Well-maintained surfaces, good lighting, a feeling of se-curity, and strategic locations constitute the elements of a good bicycle route network. Adding crossing signals specifically for bicycles at major roads also helps to ensure efficient flow on the bike path network as well as providing greater safety for bicyclists at dangerous road interfaces.
The Town of Bedford, with the Bedford 2020 Coalition and its partners, should work to address the issues relating to bike and pedestrian use such as widening the shoulder of important commuting roads, fostering greater coordination with the Bicycle Advisory committee for additional projects and expansion ideas, tying new development permits to creating bike paths linked to adjacent public and private ways, and encouraging area stores to create a bicycle incentive program. (This will also encour-age local shopping).

Community Transportation Measures
64 | Bedford Climate Action Plan
Cost: Not availablePayback: Not availableCo-Benefits:
Scope2400 additional daily bike/transit trips replacing cars
Annual ReductionsCO2e: 4,036 tonnesVehicle Miles: 10,512,000 miGasoline: 533,604 gal.$: $1,087,208 annual savings @ $2 a gallonNOx: -1041 lbsSOx: -11,007 lbsCO: 357,969 lbsVOCs: 37,521 lbsPM10: -1657 lbs
Integrate Bicycles and Transit
Bicycles are the most efficient mode of transportation. They produce no air pollution and place minimal burdens on natural resources. Bicycles are especially appropriate in reducing the number of short trips—up to five miles or so—which constitute more than half of all driving. But bicycles can also serve longer trips, on their own or in combination with bus and rail. Combining bicycles with transit can extend the use of both, allow-ing transit to be used when the destination is too far from a transit stop for walking. A survey found that 30% of users of bike lockers at a transit station in Vancouver, BC had not used transit before the lockers were installed.
The Town of Bedford, with the Bedford 2020 Coalition and its partners, should work with Metro North Transit systems to provide bike lockers, shelters or other secure facilities at stations and stops, to design sta-tions with bike ramps and other amenities, and to educate the community about the benefits of bicycle use.
Cost: Not availablePayback: Not availableCo-Benefits:
Scope500 weekly trips switching from car to walking
Annual ReductionsCO2e: 6 tonnesVehicle Miles: 13,000 miGasoline: 660 gal. $: $1,320NOx: 2 lbsSOx: 0 lbsCO: 446 lbsVOCs: 47 lbsPM10: 1 lbs
Create Pedestrian Friendly Zones and Increase Hamlet Sidewalks
Walking brings health and environmental benefits, reduces traffic conges-tion, and brings customers to business along the walking routes. Plan-ning that prioritizes pedestrian needs will require a different design from that which prioritizes vehicles. People are more likely to walk in interesting and safe environments. This implies things like attractive sidewalks, barri-ers between pedestrians and traffic, slowing down traffic, etc.
The Town of Bedford, with the Bedford 2020 Coalition and its partners, should work with Bedford’s merchants to encourage pedestrian traffic by creating walkways and pedestrian-friendly outdoor areas linked to adja-cent public and private ways.

65
Cost: $18,250Payback: 2.2 years
Co-Benefits:
Scope73 bicycles available
Annual ReductionsCO2e: 38 tonnes
Vehicle Miles: 79,935 mi Gasoline: 4,058 gal
$: $8,115NOx: 12 lbs
SOx: 1 lbCO: 2,743 lbs
VOCs: 288 lbsPM10: 6 lbs
Provide Bicycles for Daily Trips
Many U.S. cities have adopted a bicycle-sharing program with easy dock-ing stations around town. Some programs take repaired donated bikes and simply place them on the sidewalk for use, usually painted a particu-lar color for identification. Other programs have bike stands at transit stations and areas with high pedestrian traffic, where bikes are unlocked with a coin deposit or magnetic card. The deposit is returned when the bike is brought to any station.
The Town of Bedford, with the Bedford 2020 Coalition and its partners, should explore the feasibility of such a bike sharing program as well as a partnership with a private organization that already runs economically successful programs in similar towns.
Cost: $0Payback: 0 years
Co-Benefits:
Scope200 students walking or biking
each day to school
Annual ReductionsCO2e: 55 tonnes
Vehicle Miles: 115,200 mi Gasoline: 5,848 gal
$: $17,543NOx: 17 lbs
SOx: 1 lbCO: 3,953 lbs
VOCs: 415 lbsPM10: 9 lbs
Safe Routes to School
The Town of Bedford, with the Bedford 2020 Coalition and its partners, should work with local community schools to: explore opportunities to create safe walking routes to school, launch an education campaign on the health benefits for children who walk to school, expand the pedestrian friendly zones and sidewalks where the Safe Routes to School program is used, and promote special “Walk to School” days.

Cost: $145,000 ($1,000 per bus, assumes 85% - 90% paid by avail-able funding)Payback: Not availableCo-Benefits:
Scope145 School Buses
Annual ReductionsCO: 11,315 lbsVOCs: 3,652 lbsPM10: 405 lbs
Retrofit School Buses with Oxidation Catalysts
The Town of Bedford, with the Bedford 2020 Coalition and its partners, should work with Katonah-Lewisboro and Bedford Central School Dis-tricts to retrofit school buses with oxidation catalysts and emission con-trols. This would promote measurable GHG emission reductions and significantly improve the air quality around the school bus areas where children congregate to board or depart the buses.
Community Transportation Measures
66 | Bedford Climate Action Plan
Cost: Cost: $145,000 ($1,000 per bus, assumes 85% - 90% paid by available funding)Payback: Not availableCo-Benefits:
Scope145 Buses
Annual ReductionsNOx: 247 lbsCO: 11,315 lbsVOCs: 3,652 lbsPM10: 1,216 lbs
School Bus Emissions Controls – Particulate Trap
Diesel particulates are carcinogenic and may contribute to asthma. Be-cause school buses operate in close proximity to children, whose lungs are the most vulnerable, it is important to control emissions from them. Par-ticulate filters remove soot and unhealthy matter from the air.
The Town of Bedford, with the Bedford 2020 Coalition and its partners, should work with the Katonah-Lewisboro and Bedford Central School Districts to explore the feasibility of adding particulate filters to all district school buses.

67
d. Waste + Recycling(20.9% )of total proposed GHG reductions
total GHG reduction in sector: 40,591 Tonnes CO2eco-benefits:
Greenhouse gas emissions from the waste sector come from both direct and indirect sources. Direct emissions can be easily attributed to the breakdown of waste buried in landfills, producing methane, while indirect emissions are a result of the energy needed to produce the materials we consume. There is currently no organized town wide trash collection in the Town of Bedford. Bedford residents contract directly with the carter of their choice and each picks up and hauls waste to various landfills or other dis-posal centers. The haulers have no reporting requirements to the town, making accurate data collection difficult. According to our Emissions Inventory, the Waste Sector contributes 5% of The Town of Bedford’s annual greenhouse gas emissions. In gathering data for Bedford, we considered only waste that was generated within our town borders. Direct emissions are not reflected because Bedford does not have a landfill. However, the consumption habits and disposal methods of the residents of Bedford are contributing to greenhouse gas emissions that would be counted in the inventory of the city in which the landfill is located. While we may not measure a high percentage of emissions from the Waste Sector in our town, we have a responsibility to examine our exist-ing waste generation and disposal and reduce emissions wherever they are measured. The actions outlined in this section focus on reducing emissions through reducing waste and increasing recycling and composting in both homes and businesses.

Zero Waste Goal for Public Events
Zero Waste is a strategy that considers the life cycle of all products (where did they come from and where do they end up after we are done with them). This strategy reduces cost, promotes health, and encourages ef-ficiency (waste is essentially inefficiency.)
The Town of Bedford should create a zero waste goal for all Town sanc-tioned public events. This means that non biodegradable or recyclable plastics should not be purchased and that all food and all waste should be, compostable recyclable or reusable. This will divert our waste from the landfill thereby reducing the global green house gasses associated with the manufacturing and transportation of products and the produc-tion of methane from the landfill.
Municipal Waste + Recycling Measures
68 | Bedford Climate Action Plan
Municipal Green Procurement and Recycling Policy
The purchasing decisions that we make and the disposal methods we choose have a profound impact on the environment.
The Town of Bedford should develop a Municipal Green Policy that re-quires environmental considerations into every aspect of acquisition. All items should be vetted through a sustainability lens before purchase to examine the life cycle of a each product (where it was made, where does it go after its usefulness). This would enable the town to reduce the use of products that are created with high energy content or no recycling potential, and would decrease the overall Ecological Footprint, as well as save money. The town should also consider a policy that requires the recycling of paper, cardboard, ink & toner cartridges, and e-waste in all municipal offices, buildings and recreational facilities.
Cost: Not availablePayback: Not availableCo-Benefits:
Cost: Not availablePayback: Not availableCo-Benefits:
Cost: Not availablePayback: Not availableCo-Benefits:
Composting Bins at Town Parks
The Town of Bedford should designate town property in town parks and recreational areas for the use of composting bins to be used to collect municipal organic waste such as leaves and yard waste. Not only would the Town be leading by example, but the location of composting bins in public areas would assist in the goal of educating the entire community about the benefits of composting. Proper signage at such areas could serve as an effective way of instructing the public about the benefits of composting. The Town should also explore the feasibility of including municipal food waste in these composting areas.

69
Cost: Not availablePayback: Not available
Co-Benefits:
Reuse/Recycling of Construction Materials
In the event of a remodel, or tear down, most materials are demolished and sent to the landfill. The wood, hardware, windows, kitchens cabinets, sinks that are traditionally discarded could be reused. There are many reclaim and reuse (deconstruction) companies that will take what would typically be discarded and find another use elsewhere. The energy ben-efit for Bedford in reusing products would be in diverting the GHG from the mining and transportation of raw materials to factories and wastes cre¬ated from the generation and transportation of new products as well as reducing emissions from the landfill.
The Town of Bedford should consider a policy in which all town construc-tion or renovation projects be regulated to require recycling of construc-tion debris.
Cost: Not availablePayback: Not available
Co-Benefits:
Low-VOC Procurement Policy for Cleaning Products and Paint
Many cleaning products release volatile organic compounds (VOC’s) that are harmful to health in indoor environments, and contribute to regional air pollution. These VOC’s contribute to ozone formations. Paints are a significant source of both indoor and outdoor air pollution. Oil-based and glossy paints and varnishes use VOCs as solvents, which evaporate into the air as the paint dries. Indoors, these VOCs can cause a variety of health problems, while outdoors they contribute to the formation of smog. Emissions can continue for up to six months after painting.
The Town of Bedford should require low or no VOC cleaning products in Town facilities to promote the health of the employees working in the environment and to reduce air pollution in the region.
Cost: Not availablePayback: Not available
Co-Benefits:
ScopeAll municipal buildings
Annual ReductionsVOCs: 100 lbs
Expand and Enhance Existing Municipal Composting
The Town of Bedford has a composting area on Beaver Dam Road for composting yard waste. The facility is currently utilized for town collected leaves and tree waste and is not open to residents. The town should re-evaluate its own municipal composting facility to explore how it might be used as a revenue generator, as an educational tool for composting and as a source of compost for the community.

Community Waste + Recycling Measures
70 | Bedford Climate Action Plan
Bedford Waste & Recycling Study
There is currently no organized town wide trash collection in the Town of Bedford. Bedford residents contract directly with the carter of their choice and each picks up and hauls to various landfills or other disposal centers. Under this current system, multiple carters may take the same route on the same day to collect residential and commercial waste, add-ing to our transportation emissions and creating basic inefficiencies. The haulers have no reporting requirements to the town, making accurate data collection difficult.
The Town of Bedford, working with the Bedford 2020 Coalition and its partners, should conduct a comprehensive study of waste and recycling in the Town of Bedford. Such a study should determine: the composition of our waste stream, the amount of waste generated, and the location and method of disposal. Best practices should be examined and evalu-ated to determine feasibility for Bedford, including: Pay As You Throw programs, Zero Waste programs, curbside collection of food waste and other compostable materials, deconstruction and reuse facilities, and the feasibility of an organic waste composting facility.
Cost: Not availablePayback: Not availableCo-Benefits:
Develop Reporting Requirements for Carters
The Town should use its permitting process to create an efficient and en-vironmentally responsible waste and recycling system. Under Bedford’s current multiple carter system, haulers must be permitted to operate in the town, but they have no reporting requirements. Detailed information from carters can help make informed decisions about how to allocate resources and target education toward source reduction, recycling and composting, thereby creating an environmentally friendly and efficient waste and recycling system and becoming better stewards of the eniron-ment.
The Town of Bedford, working with the Bedford 2020 Coalition and its partners, should develop reporting requirements for carters that they agree to at the time of permitting. Haulers should be required to report quarterly on such data as: routes and number of pick ups, weight and composition of waste, and the procedures, means and methods of dis-posal.
Cost: $0Payback: 0 yearsCo-Benefits:

71
Cost: $0Payback: 0 years
Co-Benefits:
Scope503 lbs per person/yr of waste di-
verted from landfills
Annual ReductionsCO2e: 14,499 tonnes
Energy: 20,728,970 kWhNOx: 62,042 lbsSOx: 27,549 lbs
CO: 1,182 lbsVOCs: 62 lbs
PM10: 166 lbs
Establish/Expand Curbside Recycling Programs & Increase Plastic Recycling Eligibility
Curbside recycling is an efficient way for residents to recycle as much as 85% of their home garbage. This would reduce a significant amount of waste material going to the landfill and preventing additional GHG emis-sions.
The Town of Bedford, with the Bedford 2020 Coalition and its partners, should work with our town carters to require the collection of additional items, such as: junk mail, cardboard, bottles and cans and all plastics 1-7.
Cost: Not availablePayback: Not available
Co-Benefits:
Waste & Recycling Education Campaign
The Town of Bedford, working with the Bedford 2020 Coalition and its partners, should consider a series of educational programs to commu-nicate with residents, businesses, schools, institutions, and civic and re-ligious entities to address the myriad issues surrounding consumption, waste and recycling. The focus of such programs might include: con-sumption patterns; the purchase of goods that are durable, repairable and reusable; minimal packaging; recycling of office materials such as paper, ink cartridges, computers, etc

Community Waste + Recycling Measures
72 | Bedford Climate Action Plan
Cost: Not availablePayback: Not availableCo-Benefits:
Scope300 lbs per person/yr of waste re-duced
Annual ReductionsCO2e: 8,263 tonnesEnergy: 11,912,999 kWhNOx: 35,656 lbsSOx: 15,832 lbsCO: 679 lbsVOCs: 36 lbsPM10: 95 lbs
Implement Pay-as-You-Throw Program
According to the EPA, 85% of all waste is either recyclable or composta-ble. Pay-as-you-throw programs provide a financial incentive for people to reduce the amount of waste they generate. Pay-as-you-throw pro-grams encourage recycling, reuse of items, and source reduction, where people may choose items with less packaging knowing they will have to pay for the disposal of that packaging. In addition, the program would encourage home composting of food and yard waste. This is a fair way to charge for garbage disposal services, as people pay in proportion to the amount of waste they generate. This program would decrease Bedford’s indirect GHG emissions significantly. Potentially only 15% of residential waste would be carted to the landfill decreasing the methane produced in the landfill, thereby curtailing our global greenhouse emissions.
The Town of Bedford, working with the Bedford 2020 Coalition and its partners, should explore community interest in, and the feasibility of, a pay-as-you-thow program for Bedford.
Cost: Not availablePayback: Not availableCo-Benefits:
Scope100 lbs per person/yr of waste pre-vented
Annual ReductionsCO2e: 6,652 tonnesEnergy: 11,531,520 kWhNOx: 34,514 lbsSOx: 15,325 lbsCO: 657 lbsVOCs: 35 lbsPM10: 92 lbs
Reuse Facilities/Programs
Reusing products instead of throwing them away eliminates the GHGs associated with the mining and transportation of raw materials and di-verts unnecessary waste from landfills.
The Town of Bedford, working with the Bedford 2020 Coalition and its partners, should establish a local Reuse Facility to encourage the ex-change of materials and products between residents and divert material from the waste stream.

73
Cost: $0Payback: 0 years
Co-Benefits:
Scope100 lbs per person/yr of waste di-
verted from landfill
Annual ReductionsCO2e: 3,156 tonnes
Energy: 4,599,832 kWhNOx: 13,767 lbs
SOx: 6,113 lbsCO: 262 lbs
VOCs: 14 lbsPM10: 37 lbs
Establish/Expand Business Recycling Programs
The Town of Bedford, working with the Bedford 2020 Coalition and its partners, should explore a town regulation that requires carters to collect junk mail, cardboard, bottles and cans, metals and all plastics 1-7 from business and commercial entities in the town of Bedford. This would decrease our GHG emissions by diverting waste to the landfill, and en-couraging a more conscientious business owner.
Cost: Not availablePayback: Not available
Co-Benefits:
Scope804 lbs per person/yr of waste di-
verted from landfill
Annual ReductionsCO2e: 4,052 tonnes
Organics Composting Facility
When organic matter like wood, paper, food, and yard waste is placed in landfills it decomposes anaerobically producing methane. Methane is a greenhouse gas 21 times as powerful as carbon dioxide. About 12% of municipal solid waste is food scraps, and another 12% is yard waste. Collecting and composting organic waste prevents emissions that would have been produced in a landfill.
The Town of Bedford, working with the Bedford 2020 Coalition and its partners, should promote organics composting in order to capitalize on GHG reductions associated with diverting waste from the landfill. To this end, they should consider establishing a composting facility in the Town of Bedford or work with the Northern Westchester Energy Action Coali-tion (NWEAC) to identify a regional composting site for all of northern Westchester. Such a facility should be set up to permit residents to drop off organic waste materials and take home compost for use in towns and gardens. The town should also explore the feasibility of commercial and residential food-waste collection.

Community Waste + Recycling Measures
74 | Bedford Climate Action Plan
Reuse/Recycling of Construction Materials
In the event of a remodel, or tear down, most materials are demolished and sent to the landfill. The wood, hardware, windows, kitchens cabinets, sinks that are traditionally discarded could be reused. There are many reclaim and reuse (deconstruction) companies that will take what would typically be discarded and find another use elsewhere.
The Town of Bedford, with the Bedford 2020 Coalition and its partners, should develop best practices to educate contractors, builders and the town on the benefits of recycling and reusing materials. They should also explore possible mandates that would require the reuse and recycling of debris on all contruction sites.
Cost: Not availablePayback: Not availableCo-Benefits:
Home Composting Initiative
Organic matter like food, wood, and yard waste decomposes extremely slowly in a landfill and when it does decompose, it manufactures methane gas. Methane is a GHG 21 times more potent than carbon dioxide.
The Town of Bedford, with the Bedford 2020 Coalition and its partners, should work to establish an expanded yard waste composting program and create community-wide education and demonstration projects to en-courage home yard and food waste composting.
Cost: Not availablePayback: Not availableCo-Benefits:
Scope300 lbs per person/yr of waste diverted from landfill
Annual ReductionsCO2e: 1,153 tonnes
Zero Waste Goal for Public Events and Events on Public Land
Zero Waste is a strategy that considers the life cycle of all products (where did they come from and where do they end up after we are done with them). This strategy reduces cost, promotes health, and encourages ef-ficiency (waste is, essentially, inefficiency).
The Town of Bedford, with the Bedford 2020 Coalition and its partners, should create a goal for all public events to be zero waste. This means that non biodegradable or recyclable plastics should not be purchased and that all food and all waste should be, compostable recyclable or re-usable. This will divert our waste from the landfill thereby reducing the global green house gasses associated with the manufacturing and trans-portation of products and the production of methane from the landfill.
Cost: Not availablePayback: Not availableCo-Benefits:

75
Plastic & Paper Bag Fee / Reusable Bag Distribution
Neither paper or plastic bags are a good choice for the environment - both consume large amounts of natural resources in their production, significantly pollute our environment, and are ineffectively recycled. Plas-tic bags are petroleum based and consume twelve million barrels of oil in annual production. According to EPA data, between 500 billion and one trillion plastic bags are consumed worldwide each year, and of those, less than one percent are recycled. 100 billion are sent to landfills and the rest end up in our trees, lakes, rivers and oceans. Paper bags are no better. Americans consume more than ten billion paper bags per year and only 10 to 15 percent are recycled. Their production significantly contributes to the pollution of our air and water, and also destroys forests. About 14 million trees are cut down annually for paper bag production.
The Town of Bedford, with the Bedford 2020 Coalition and its partners, should explore one of two options: either an outright ban or a fee on both plastic bags and paper bags in stores that have greater than 5000 sq. feet of space. A fee would fund a reusable bag distribution to Bedford town residents though the implementation of such a fee would probably require a Home Rule Exemption from the State of New York. A ban would not. The Pace Environmental Law Clinic has offered to study both options for the Town and help recommend sound and legally defensible policy.
Cost: Not availablePayback: Not available
Co-Benefits:
Cost: $50,000 ($100 per business)Payback: < 1year
Co-Benefits:
Scope500 participating businesses
Annual ReductionsCO2e: 2,816 tonnes
Energy: 4,842,500 kWh, 180,500 therms
$: $690,020 NOx: 7,851 lbs
SOx: 20,440 lbsCO: 5,828 lbs
VOCs: 733 lbsPM10: 4,543 lbs
Green Business Programs
Green business programs are voluntary programs to encourage busi-nesses to go beyond operations regulations and to conduct business in an environmental friendly manner. Businesses receive a checklist of mea-sures, and implement a certain number of them to be certified. The in-centive for businesses to participate is good publicity resulting from their efforts, the ability to advertise as a certified green business and lower business costs. Green businesses can help reduce GHG in all sectors: energy consumption, transportation and waste.
The Town of Bedford, with the Bedford 2020 Coalition and its partners, should work with Bedford’s business and commercial entities to discuss appropriate waste and recycling measures that would create a standard for a Bedford green business program.

Community Waste + Recycling Measures
76 | Bedford Climate Action Plan
#6 Plastic Ban
The Town of Bedford, with the Bedford 2020 Coalition and its partners, should consider a ban on all Polystyrene in products designed as dispos-able or single use in the Town of Bedford. This product material is not currently recyclable and has many toxins associated with it. There are many products to substitute for styrofoam and polystyrene that have life cycles that either are recyclable or are biodegradable at the end of their usefulness. This would reduce Bedford’s overall global green house gas emissions and contribute to better health of its residents.
Cost: $0Payback: 0 yearsCo-Benefits:
Tap Water Campaign
Plastic bottles are created with petroleum, and require more water to pro-duce than the bottle ultimately holds. The water used in the production of water bottles is ineffiecient and wasteful and the production requires tre-mendous energy. Bottled water is not regulated. Bedford’s Town water is closely monitored and most private well sources are clean, therefore there is no reason to buy bottled water. The eventual elimination of bottled water will significantly deminish the Town’s greenhouse gas emissions.
The Town of Bedford, working with the Bedford 2020 Coalition and its partners, should launch a campaign to create a new culture of tap water drinkers with a goal of eliminating plastic water bottles.
Cost: Not availablePayback: Not availableCo-Benefits:

77
e. Land + Water Use(1.2% )of total proposed GHG reductions
total GHG reduction in sector: 2,313 Tonnes CO2eco-benefits:
The Bedford Comprehensive Plan (www.bedfordny.info) and much of the work of Bedford’s Conservation Board are focused on land use principles that provide a framework for future development, preservation and con-servation of our community. Their areas of concern include open space and natural environment, residential development, business develop-ment, community services and facilities, transportation and community appearance and historic preservation.
The Measures contained within the Land Use sector of the Climate Action Plan address actions such as water conservation, transit oriented devel-opment and landscape alternatives, with specific metrics that will enable a calculation of GHG reductions when accomplished.
In addition, the Climate Action Plan focuses on the area of food and ag-riculture, specifically, the creation of a strong local food system that sig-nificantly increases the percentage of home grown and locally sourced food, accessibility to locally produced food, protection of farm land and the promotion and support of agricultural practices and initiatives in our community.
There is also a specific focus on trees as a natural means of curbing pol-lution, as a partial solution for storm water runoff, as shade providers, and as a significant element of native plant initiatives. The Climate Action Plan envisions a community wide effort to expand public and private pro-grams to encourage the planting and preserving of trees on municipal, commercial and private land and to educate the public about the many environmental, commercial and social benefits of trees.

Municipal Land + Water Use Measures
78 | Bedford Climate Action Plan
Water Conservation (3 Measures)
The Town of Bedford should evaluate and look to improve water conservation measures in its buildings and operations. These measures may include: use of gray water, low flow fix-tures, modifying water use behaviors, using native plants, xe-riscaping (landscape with little need for water) and rain col-lection techniques.
Total Cost: $22,817Co-Benefits:
Total Annual ReductionsCO2e: 2 tonnesEnergy (annually): 287,210 kWhWater (annually): 13,450 gal.$: $1,433NOx: 5 lbsSOx: 8 lbsCO: 3 lbsVOCs: 0 lbsPM10: 1 lbs
1. Water Saving Shower Heads
Federal regulations require showerheads to have a flow rate of less than 2.5 gallons per minute (gpm), but prior to 1992, some showerheads had flow rates of 5.5 gpm. Using low flow shower heads will save sig-nificant amounts of energy and water resources.
The Town of Bedford should replace older shower heads in all town owned buildings.
Cost: $145 ($29 per showerhead)Payback: < 1 year
Scope5 Showerheads replaced
Annual ReductionsCO2e: 1 tonneEnergy: 252 kWh 83 e/ thermsWater: 13,450 gallons$: $170
2. High Efficiency Toilets
Toilet flushing can account for one third of water use in commercial and office buildings. New High Efficiency Toilets with the WaterSense label use 1.3 gallons per flush or less, compared to the current federal standard of 1.6 gallons per flush. Old toilets may use 3.5 or 5 gallons or more per flush. High Efficiency Urinals use 0.5 gallons per flush or less compared to the current federal standard of 1.0 gallons per flush. Old urinals may use 2-3 gallons or more per flush.
The Town of Bedford should consider replacing older toilets and urinals with more efficient models in all town owned facilities.
Cost: $22,400 ($448 per toilet)Payback: 19.5 years
Scope50 toilets replaced
Annual ReductionsCO2e: 1 tonneEnergy: 1,549 kWhWater: 286,786 gallons$: $1,147

3. Water Saving Faucets
The aerator—the screw-on tip of the faucet—ultimately determines the maximum flow rate of a faucet. Typically, new kitchen faucets come equipped with aerators that restrict flow rates to 2.2 gpm, while new bathroom faucets have ones that restrict flow rates from 1.5 to 0.5 gpm.
Aerators are inexpensive to replace and they can be one of the most cost-effective water conservation measures. For maximum water ef-ficiency, purchase aerators that have flow rates of no more than 1.0 gpm. Some aerators even come with shut-off valves that allow you to stop the flow of water without affecting the temperature. When replac-ing an aerator, bring the one you’re replacing to the store with you to ensure a proper fit.
The Town of Bedford should examine all faucets within the town build-ings and replace older aerators with ones that allow no more than 1gpm flow.
Cost: $272 ($8 per faucet)Payback: 2.2 years
Scope34 faucets replaced
Annual ReductionsCO2e: 0 tonnes
Energy: 172 kWh57 e/therms
Water: 9,180 gallons $: $116
Cost: $4,480 ($224 per tree)Payback: 11 years
Co-Benefits:
Scope20 trees planted
Annual ReductionsCO2e: 2 tonnes
Energy: 4,080 kWh $: $408
NOx: 4 lbsSOx: 17 lbs
CO: 4 lbsVOCs: 0 lbsPM10: 4 lbs
Plant Trees to Shade Buildings
This measure considers the effect trees can have in reducing energy required to heat and cool buildings. Trees properly planted with energy savings in mind can reduce the amount of energy (electricity, natural gas, or other fuel) used to cool and heat buildings. This not only reduces associated emissions, but also saves money. The shade from a single well-placed mature tree reduces annual air conditioning use two to eight percent (in the range of 40-300 kWh), and peak cooling demand two to ten percent (as much as 0.15-0.5 kW).
The Town of Bedford should work with the Tree Advisory Board and lo-cal garden clubs to develop best practices to encourage tree planting for shading town owned buildings.
79

Cost: Not availablePayback: Not availableCo-Benefits:
Scope21 Acres of low maintenance land-scaping
Annual ReductionsCO2e: 2 tonnesEnergy: 0 kWhGasoline: 168 gallonsNOx: 1 lbsSOx: 0 lbsCO: 114 lbsVOCs: 813 lbsPM10: 0 lbs
Low-Maintenance Landscaping
Well-groomed green lawns are aesthetically pleasing, but they come with a number of environmental costs. Landscaping using local native plants can greatly reduce or eliminate the need for irrigation, pesticides, herbicides, fertilizers, and gasoline powered maintenance equipment.
The Town of Bedford, with the Bedford 2020 Coalition and its partners, should work with local garden clubs and other experts to develop best practices for Town administrators to encourage low maintenance land-scaping in our town owned lands.
Cost: Not availablePayback: Not availableCo-Benefits:
Non-Asphalt Pavements
Paving alternatives can reduce the urban heat island effect, reducing en-ergy use for cooling. Asphalt is made with petroleum products and can release large amounts of volatile organic compounds (VOCs), a primary component of smog, into the air while curing. In the Chicago metro-politan area, for example, asphalt paving emitted 13 tons of VOCs into the air each day during the summer peak smog season. One option for reducing emissions is to use asphalt with reduced VOC content. Many areas already prohibit the use of the high-VOC cutback asphalt, which uses petroleum-based thinner, during times when smog is a problem.
The Town of Bedford should work with local resources to develop best practices for encouraging the use of Non-Asphalt Pavements on our town roads and parking lots.
Municipal Land + Water Use Measures
80 | Bedford Climate Action Plan

Cost: Not availablePayback: Not available
Co-Benefits:
Scope100 residential units in Transit
Oriented Development
Annual ReductionsCO2e: 588 tonnes
Vehicle Miles: 1,230,660 mi $: $124,940
Gas Saved: 62,470 galNOx: 187 lbs
SOx: 12 lbsCO: 42,231 lbs
VOCs: 4,429 lbsPM10: 91 lbs
Transit Oriented Development
High density neighborhoods with good rail or bus transit, mixed resi-dential and commercial uses, and pedestrian-friendly development have much lower rates of car use than typical low-density suburban develop-ments. Transit oriented design (TOD) attempts to create such neighbor-hoods in planning of new or existing transit systems.
While recognizing that the transit oriented development possibilities in Bedford are very limited, The Town of Bedford, working with the Bedford 2020 Coalition and its partners, should identify opportunities that direct growth to within walking distance of mass transit – in the case of Bed-ford, to the Metro North train stations located in Katonah and Bedford Hills. TOD can also be developed around county bus lines, park-and-ride facilities and bike and pedestrian infrastructure located near the train that will encourage people to walk or bike to transit rather than driving. This may be a more viable option given the limited development conditions in the town.
81
Community Land + Water Use Measures
Build Storm Water Capacity through Municipal Codes and Regulations
The Town of Bedford, working with the Bedford 2020 Coalition and its partners, should explore the enhancement of municipal codes and regu-lations that conserve water, including: review building storm water reten-tion requirements and vegetation requirements, and revising codes to encourage organic land management practices.
Modified Town Water Billing System
While the majority of Bedford residents rely on private wells for their wa-ter, four water districts within the Town serve 2,720 households through public water supply systems. Water bills are rendered quarterly and fees are based on meter reading.
The Town of Bedford, working with the Bedford 2020 Coalition and its partners, should examining the existing rate structure and implement a more detailed sliding fee for water usage so that fees per unit of in-creased consumption increase with the amount of water consumed.
Cost: $0Payback: 0 years
Co-Benefits:
Cost: $0Payback: 0 years
Co-Benefits:

Community Land + Water Use Measures
82 | Bedford Climate Action Plan
Water Conservation (5 Measures)
The Town of Bedford, working with the Bedford 2020 Coali-tion and its partners, should evaluate and promote various water conservation measures among the residents and the landscaping industry. These measures may include: use of gray water, low flow fixtures, modifying water use behaviors, using native plants, xeriscaping (landscape with little need for water) and rain collection techniques.
Total Cost: $2,283,226Co-Benefits:
Total Annual ReductionsCO2e: 1,229 tonnes Energy: 1,229,354 kWhWater: 74,347,500 gal.$: $418,241 NOx: 3,533 lbsSOx: 5,250 lbsCO: 1877 lbsVOCs: 272 lbsPM10: 1201 lbs
1. Water Saving Shower Heads
Federal regulations require showerheads to have a flow rate of less than 2.5 gallons per minute (gpm), but prior to 1992, some showerheads had flow rates of 5.5 gpm. Using low flow shower heads save sig-nificant amounts of energy and water resources. Therefore, if you have fixtures that pre-date 1992, you might want to replace them and save money on energy used for less pumping or if you belong to the Water District, save on billing costs. You can purchase some quality, low-flow fixtures for around $10 to $20 a piece and achieve water savings of 25%–60%
Total Cost: $183,802 ($29 per showerhead)Payback: < 1 year
Scope6,638 showerheads replaced
Annual ReductionsCO2e: 756 tonnesEnergy: 500,153 kWh 101,670 e/thermsWater: 17,856,220 gallons$: $233,058
2. Efficient Clothes Washers
Clothes washers are the second biggest water user in most homes (af-ter toilets). High efficiency washers save water, energy, and detergent. Energy savings derive from reduced use of hot water and reduced wa-ter pumping costs. Efficient washers are also gentler on clothes, in-creasing their durability.
Total Cost: $78,000 ($150 incremental cost)Payback: 11 years
Scope5,200 clothes washers replaced
Annual ReductionsCO2e: 284 tonnesEnergy: 536,733 kWhWater: 36,176,400 gallons$: $70,787

4. High Efficiency Toilets
Toilet flushing can account for one third of water use in commercial and office building and usually a top user in the home. New High Ef-ficiency Toilets with the WaterSense label use 1.3 gallons per flush or less, compared to the current federal standard of 1.6 gallons per flush. Old toilets may use 3.5 or 5 gallons or more per flush. High Efficiency Urinals use 0.5 gallons per flush or less compared to the current federal standard of 1.0 gallons per flush. Old urinals may use 2-3 gallons or more per flushensure a proper fit.
Total Cost: $1,912,960 ($448 per toilet)
Payback: 28.7 years
Scope4,270 toilets replaced
Annual ReductionsCO2e: 34 tonnes
Energy: 89,933 kWhWater: 16,654,220 gallons
$: $66,617
5. Promote Education, Information and Training on Water Conservation and Re-Use Systems
The Bedford 2020 Coalition should provide education, information and training on various water conservation and re-use methods, through a series of workshops targeted at residents and landscapers. Topics will include: use of rain water collection systems such as Rain Barrels, use of drought resistant grasses and native plantings, rain gardens, green roofs and organic landscape maintenance.
3. Water Saving Faucets
The aerator—the screw-on tip of the faucet—ultimately determines the maximum flow rate of a faucet. Typically, new kitchen faucets come equipped with aerators that restrict flow rates to 2.2 gpm, while new bathroom faucets have ones that restrict flow rates from 1.5 to 0.5 gpm.
Aerators are inexpensive to replace and they can be one of the most cost-effective water conservation measures. For maximum water ef-ficiency, purchase aerators that have flow rates of no more than 1.0 gpm. Some aerators even come with shut-off valves that allow you to stop the flow of water without affecting the temperature. When replac-ing an aerator, bring the one you’re replacing to the store with you to ensure a proper fit.
Total Cost: $108,464 ($8 per faucet)
Payback: 2.1 years
Scope13,558 faucets replaced
Annual ReductionsCO2e: 155 tonnes
Energy: 102,535 kWh20,843 e/therms
Water: 3,660,660 gallons $: $47,779
83

Community Land + Water Use Measures
84 | Bedford Climate Action Plan
Increase Supply, Availability, and Consumption of Local Food
Food and agriculture are central to the vitality of the Bedford commu-nity. Over 10% of US carbon emissions result from the food system – it may be closer to 30% if one includes food importation, agricultural re-lated deforestation and soil degradation.
Individuals can reduce the impact of food choices on climate change by choosing locally produced and “low carbon” foods. By choosing to eat locally, individuals can reduce greenhouse gas emissions generated by food transportation, bolster the town’s economy and help preserve agricultural land in the Bedford area. By eating locally produced fresh food and by choosing grains, fruits and vegetables instead of meat, individuals also create a healthy diet.
The Town of Bedford, with the Bedford 2020 Coalition and its partners, should work together to create in Bedford a strong local food system that significantly increases the percentage of home grown and locally sourced food. In particular, the group should work to educate the com-munity on the skills needed to expand the growing of fruit and veg-etables in home gardens or in cooperation with neighbors. In addition, the group should work to facilitate the creation of both community and school gardens. The group should also explore other ways to increase community access to locally produced food, including expanded farm-ers’ markets, support of local community supported agriculture farms, support of local businesses providing access to local food and legisla-tive initiatives to protect agricultural land and promote farming. They might also consider how to bring more locally grown food to commu-nity outreach and feeding programs as well as community institutions such as hospitals.
Cost: Not availablePayback: Not availableCo-Benefits:

85
Plant and Preserve Trees
Trees remove CO2 from the atmosphere, use the carbon to form the physical structure of the tree (roots, trunk, branches and leaves), and return the oxygen to the atmosphere. A single mature tree can absorb as much as 48 lbs of CO2 per year. Trees are also natural pollution-control devices. They absorb carbon dioxide and return oxygen to the air. Their leaves, branches, and trunks help slow the runoff of storm water. They also provide sound buffering, shade, and measurably cooler temperatures on hot summer days, and breeding and roosting places for local and migratory birds, whose habitat has been disappearing. Trees also have the potential to increase busi-ness in commercial areas through beautification.
The Bedford 2020 Coalition should work with the Town, local garden clubs and other partners to expand public and private programs to encourage the planting and preserving of trees on municipal, com-mercial and private land with an emphasis on native species that are appropriate in size and form to each location. Threats to existing trees, such as invasive vines and the winter salting of area roads, should be closely examined and remedied. The group should also develop and implement an outreach campaign to educate the public about the many environmental, commercial and social benefits of trees. They should also focus on educating the community about existing tree regulations and tree maintenance and care.
Cost: $112,000 ($224 per tree)Payback: 320 yearsCo-Benefits:
Scope500 trees
Annual ReductionsCO2e: 126 tonnesEnergy: 3,500 kWh$: $350NOx: 3 lbsSOx: 15 lbsCO: 4 lbsVOCs: 3 lbsPM10: 0 lbs
Plant Trees to Shade Buildings
This measure considers the effect trees can have in reducing energy required to heat and cool buildings. Trees properly planted with energy savings in mind can reduce the amount of energy (electric-ity, natural gas, or other fuel) used to cool and heat buildings. This not only reduces associated emissions, but also saves money. The shade from a single well-placed mature tree reduces annual air con-ditioning use two to eight percent (in the range of 40-300 kWh), and peak cooling demand two to ten percent (as much as 0.15-0.5 kW).
The Town of Bedford, with the Bedford 2020 Coalition and its partners, should work with the Tree Advisory Board and local garden clubs to develop best practices to encourage tree planting for shading build-ings.
Cost: $112,000 ($224 per tree)Payback: 11 yearsCo-Benefits:
Scope500 trees
Annual ReductionsCO2e: 38 tonnesEnergy: 102,000 kWh$: $10,200NOx: 101 lbsSOx: 428 lbsCO: 106 lbsVOCs: 12 lbsPM10: 94 lbs

Community Land + Water Use Measures
86 | Bedford Climate Action Plan
Cost: Not availablePayback: Not available
Co-Benefits:
Scope6,500 Residents using low mainte-
nance landscaping
Annual ReductionsCO2e: 326 tonnes
Energy: 219,375 kWh Water: 87,750,000 gal
Gasoline: 26,000 galNOx: 296 lbsSOx: 926 lbs
CO: 17,805 lbsVOCs: 125,369 lbs
PM10: 239 lbs
Low-Maintenance Landscaping
Well-groomed green lawns are aesthetically pleasing, but they come with a number of environmental costs. Landscaping using local native plants can grealy reduce or eliminate the need for irrigation, pesticides, and gasoline powered maintenance equipment. The Town of Bedford, with the Bedford 2020 Coalition and its partners, should work with local garden clubs and other experts to develop best practices to encourage low maintenance landscaping in our community.
Gasoline Lawnmower Replacement
While the amount of fuel used by gasoline lawnmowers and yard equip-ment is small compared to the quantity used by automobiles, they pol-lute disproportionately--one mower can produce as much pollution as 43 cars. Overall, gasoline yard equipment can cause about 5% of local air pollution. Replacing these gasoline-powered tools with electric or human-powered ones can reduce emissions significantly.
The Town of Bedford, with the Bedford 2020 Coalition and its partners, should work with local garden clubs and other experts to develop best practices to encourage low maintenance landscaping in our community and the use of low or no emission maintenance equipment.
Cost: 15,000 ($60 per lawnmower)Payback: Not available
Co-Benefits:
Scope250 lawnmowers replaced
Annual ReductionsCO2e: N/A
VOCs: 4,750 lbs

Non-Asphalt Pavements
Paving alternatives can reduce the urban heat island effect, reduc-ing energy use for cooling. Asphalt is made with petroleum prod-ucts and can release large amounts of volatile organic compounds (VOCs), a primary component of smog, into the air while curing. In the Chicago metropolitan area, for example, asphalt paving emit-ted 13 tons of VOCs into the air each day during the summer peak smog season. One option for reducing emissions is to use asphalt with reduced VOC content. Many areas already prohibit the use of the high-VOC cutback asphalt, which uses petroleum-based thin-ner, during times when smog is a problem.
The Town of Bedford, with the Bedford 2020 Coalition and its partners, should work with local resources to develop best practices to en-courage the use of Non-Asphalt Pavements in our community.
Cost: Not availablePayback: Not availableCo-Benefits:
87

88 | Bedford Climate Action Plan
a. Bedford 2020 Coalition
Achieving meaningful reductions of GHG emissions and addressing the threats to our environment require significant effort at the local grassroots lev-el. The Town of Bedford is ready the for creation of a sustainable community.
The appointment of the Bedford Energy Advisory Panel and the resolu-tion, committing our town to a twenty percent reduction of community wide emissions by the year 2020, set the town on a course toward a sustainable way of life. Since April 2007, we have successfully engaged the community, completed a greenhouse gas emissions inventory and written a climate ac-tion plan, all readying us for the implementation phase.
Town Board approval of the Climate Action Plan will be the final step in tran-sitioning from the government appointed Bedford Energy Advisory Panel to a community-wide partnership including municipal government, residents, local businesses, schools, civic and religious entities. On the municipal lev-el, local government will implement municipal measures. On the community level, a new entity, the Bedford 2020 Coalition will be created as a private, nonprofit corporation whose mission will be to organize, facilitate and work with each stakeholder to implement the community actions set forth in the Climate Action Plan. It is anticipated that the Bedford 2020 Coalition will oversee the creation of a total of 11 Task Forces, led by community mem-bers, focused on the following six subject areas: energy, waste/recycling, transportation, land use, food/agriculture, and water. In addition, there will be four Task Forces focused on users in the community, such as residents, businesses, schools and civic/religious entities. The last Task Force will be focused on marketing and PR as we try to educate the community about the benefits of changed behavior. Under the leadership of the Bedford 2020 Coalition, each Task Force will interact with the others to assist in imple-mentation of the Climate Action Plan.
No single sector of our community can reach the Town’s goal of a 20% reduction in GHG emissions by 2020 by acting alone. We must all work together. Residents, businesses, schools and civic and religious institutions all have a unique role to play.
The residential sector is the greatest contributor to community wide GHG emissions. 53% of the town’s GHG emissions comes from household en-ergy use and personal vehicles. The Bedford 2020 Coalition will oversee a community wide, public campaign to educate, inform and inspire Bedford’s residents to take action in their own lives.
impLemenTaTioniv

The Bedford 2020 Coalition will work with businesses both large and small to reduce GHG emissions in their own operations by focusing on their own buildings and facilities, their business practices and their relations with em-ployees, vendors, contractors and customers. It is the intention of the Bed-ford 2020 Coalition to promote those businesses who are strong partners in this effort.
The two public school districts and the private schools within the town’s geographic borders are uniquely positioned to help us reach our Twenty by 2020 goals. With multiple buildings, a vehicle fleet, waste generation and campus use contributing to their overall GHG emission, they are dealing with all four sectors of energy, transportation, waste/recycling and land use in their own sustainability efforts. Both area school districts--the Bedford Central School District (BCSD) and the Katonah Lewisboro School District (KLSD)-- have instituted Sustainability Policies that are models for the Town.
Like the schools, most civic and religious entities in the Town of Bedford confront GHG emission issues in the management of their buildings and land, their waste and in their relationship with constituents. Like the schools, their leadership in the area of GHG emission reductions will have tremen-dous impact throughout the community.
b. Measuring our Progress To ensure effective implementation, our progress will be closely monitored by the Town of Bedford and the Bedford 2020 Coalition. We will be complet-ing periodic updates to our GHG emissions inventory in addition to occa-sionally surveying the town businesses and residents for observed behavior changes and input. This influx of data will allow us to track our progress, adjust our measures as needed and set new goals for the future. Progress reports will be made available to the public through both the town’s and Bedford 2020 Coalition’s websites.
c. Implementation Timeframe Table
We have organized the Climate Action Plan measures into a simplified table below. Each has been considered within a 10 year implementation time-frame, beginning immediately and ending with our goal at the end of 2020. Measures have been grouped into short, medium and long term projects. Short term, refers to measures targeted for implementation between now and 2012, medium: from 2012 until 2015, and long: 2015 until the end of 2020. These qualifiers refer to the amount of time it will take to galvanize support and start the implementation process, however as we move for-ward and circumstances change, there may be a shift in timeframe. Prog-ress will be reviewed regularly by the Town of Bedford and the Bedford 2020 Coalition. Some of these measures will be completed with a single action while others will require ongoing support in order for maximum success.
89
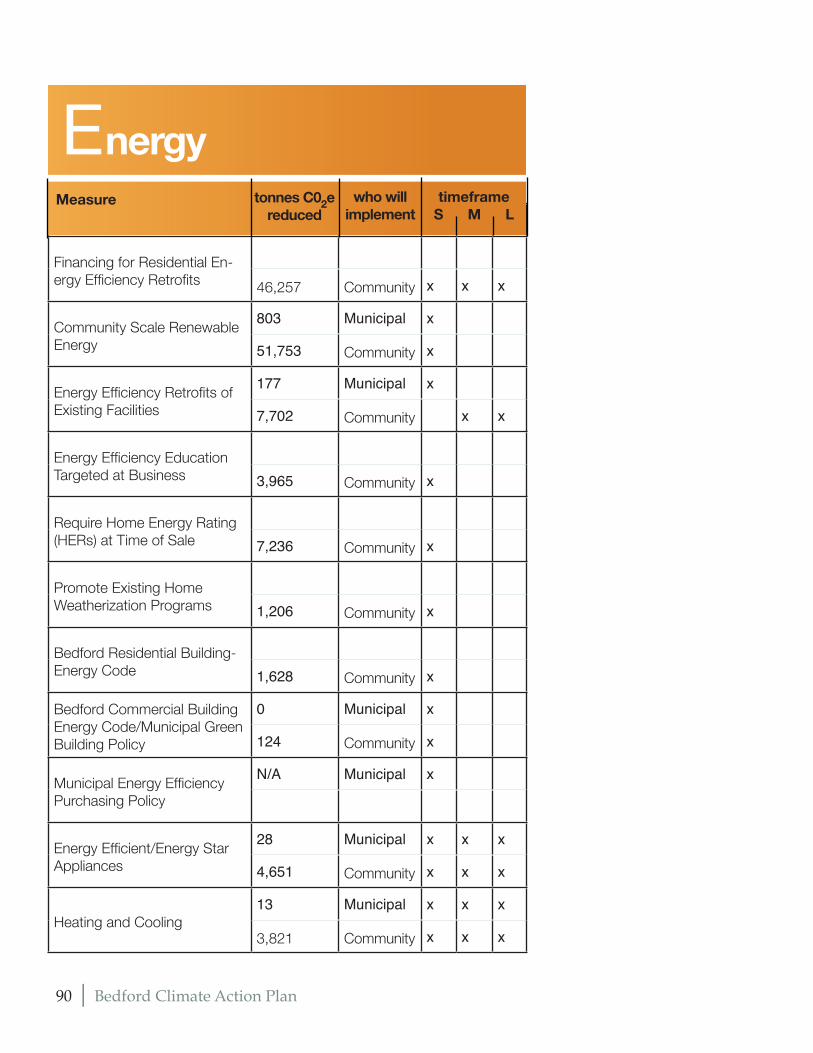
Financing for Residential En-ergy Efficiency Retrofits 46,257 Community x x x
Community Scale Renewable Energy
803 Municipal x
51,753 Community x
Energy Efficiency Retrofits of Existing Facilities
177 Municipal x
7,702 Community x x
Energy Efficiency Education Targeted at Business 3,965 Community x
Require Home Energy Rating (HERs) at Time of Sale 7,236 Community x
Promote Existing Home Weatherization Programs 1,206 Community x
Bedford Residential Building-Energy Code 1,628 Community x
Bedford Commercial Building Energy Code/Municipal Green Building Policy
0 Municipal x
124 Community x
Municipal Energy Efficiency Purchasing Policy
N/A Municipal x
Energy Efficient/Energy Star Appliances
28 Municipal x x x
4,651 Community x x x
Heating and Cooling13 Municipal x x x
3,821 Community x x x
90 | Bedford Climate Action Plan
EnergyMeasure who will
implementtonnes C02e
reducedtimeframe
S M L

Measure who will implement
tonnes C02ereduced
timeframeS M L
91
Compact Flourescent Light Bulb (CFL) Distribution 16 Community x
Efficient Lighting Retrofits (for Non-Residential Buildings)
12 Municipal x
1,184 Community x
Lighting Occupancy Sensors35 Municipal x
1,973 Community x
LED Holiday Lights6 Community
Solar Photovoltaic (PV) Energy21 Municipal x
825 Community x x x
Solar Hot WaterN/A Municipal x x
454 Community x x
Switch Electric Heat to Natural Gas 1,889 Community x x
Energy Efficient Affordable Housing 29 Community x x
Residential Construction Fee-bate Program N/A Community x
Ordinance Review for Renew-able Energy Installation N/A Community x
Smart MetersN/A Community x
Accellerate Permitting Pro-cess for Green Buildings N/A Community x

TransportationMeasure who will
implementtonnes C02e
reducedtimeframe
S M L
92 | Bedford Climate Action Plan
Use Smaller Fleet Vehicles9 Community x x
4,738 Municipal x x
Increase Ownership of Hybrid Vehicles
49 Community x x
1,031 Municipal x x
Fleet Conversion to Biodiesel (B20)
46 Community x
300 Municipal x
Education on Low-carbon Transportation Options 1,100 Community x
Electric Vehicles16 Community x
169 Municipal x
Electric Vehicle Charging Sta-tions on Parking Structures and Other Locations 50 Community x
Compressed Natural Gas (CNG) Vehicles
6 Municipal x
184 Community x
Promote Public Transporta-tion, Carpooling and Vanpool-ing
1 Municipal x
2,241 Community x
Initiate a Carshare172 Community x
Increase Rail Transit Ridership17 Municipal x
132 Community x x
Increase School Bus Rider-ship 181 Community x

Measure who will implement
tonnes C02ereduced
timeframeS M L
93
Increase Bus Ridership + Re-gional Transportation Study 69 Community x
Enforce Anti-Idling Law for Trucks
27 Municipal x
266 Community x
Enforce Anti-Idling Law for Non-Emergency Cars
N/A Municipal x
N/A Community x
Enforce Anti-Idling Law for Local Transit Buses and School Buses 127 Community x
Increase Bike and Pedestrian Friendly Infrastructure, Create Bicycle Friendly Zones 835 Community x
Integrate Bicycles and Transit4,036 Community x x
Create pedestrian friendly zones and increase hamlet sidewalks 6 Community x
Provide Bicycles for Daily Trips38 Community x
Police on Bicycles21 Municipal x
Safe Routes to School55 Community x
Retrofit School Buses with Oxydation Catalysts N/A Community x
School Bus Emissions Con-trols--Particulate Trap N/A Community x

Waste + RecyclingMeasure who will
implementtonnes C02e
reducedtimeframe
S M L
94 | Bedford Climate Action Plan
Bedford Waste and Recycling Study N/A Community x
Develop Reporting Require-ments for Carters N/A Community x
Establish/Expand Curbside Recycling Programs. IncreasePlastic Recycling Eligibility 14,499 Community x
Waste and Recycling Educa-tion Campaign N/A Community x
Implement Pay-as-You-Throw Program 8,263 Community x
Reuse Facilities/Programs6,652 Community x
Establish/Expand Business Recycling Programs 3,156 Community x
Organics Composting Facility4,052 Community x
Home Composting Initiative1,153 Community x
Expand/Enhance Existing Municipal Composting
N/A Municipal x
Composting Bins at Town Parks
N/A Municipal x

Reuse or Recycling of Con-struction Materials
N/A Municipal x
N/A Community x
Zero Waste Goal for Public Events and Events on Public Land
N/A Municipal x
N/A Community x
Green Business Programs2,816 Community x
Plastic & Paper Bag Fee/ Re-usable Bag Distribution N/A Community x
#6 Plastic BanN/A Community x
Tap Water CampaignN/A Community x
Municipal Greep Procurement and Recycling
N/A Municipal x
Low-VOC Procurement Policy for Cleaning Products and Paint
N/A Municipal x
Measure who will implement
tonnes C02ereduced
timeframeS M L
95

Land + Water UseMeasure who will
implementtonnes C02e
reducedtimeframe
S M L
96 | Bedford Climate Action Plan
Transit Oriented Development588 Community x x
Build Water Capacity through Municipal Codes and Regula-tions N/A Community x
Modified Town Water Billing System N/A Community x
Water Conservation2 Municipal x
1,229 Community x
Increase Supply, Availability and Consumption of Local Food N/A Community x x x
Plant and Preserve Trees126 Community x x
Plant Trees to Shade Buildings2 Municipal x x
38 Community x x
Low-Maintenance Landscap-ing
2 Municipal x
326 Community x
Gasoline Lawnmower Re-placement N/A Community x
Non-Asphalt PavementsN/A Municipal x
N/A Community x

Anthropogenic: Caused or produced by humans
B-20 Biodiesel: A blend of 20% biodiesel and 80% petroleum diesel
BEAP: The Bedford Energy Advisory Panel
CAP: Climate Action Plan
Cap and Trade: A policy that mandates cap on emissions while providing an ability to trade allowances. Successful cap and trade programs reward innovation, efficiency, and early action and provide strict environmental ac-countability without inhibiting economic growth.
CFL: Compact Fluorescent Light Bulbs
CH4: Methane, a powerful greenhouse gas
CNG: Compressed Natural Gas
CO: Carbon Monoxide
CO2: Carbon Dioxide
CO2e: Carbon dioxide equivalent units – converting all emissions to equiv-alent carbon dioxide units allows for the consideration of different green-house gases on comparable terms
Energy Star: ENERGY STAR is a partnership between the U.S. Environ-mental Protection Agency and industry to voluntarily label products that meet certain energy efficiency criteria
EPA: Environmental Protection Agency
Feedback Loops: A pattern of interacting processes where a change in one variable, through interaction with other variables in the system, either reinforces the original process (positive feedback) or suppresses the pro-cess (negative feedback).
GPM: Gallons per minute
Greenhouse Gas (GHG): the term used for gases that trap heat in the atmosphere. The principal greenhouse gases that enter the atmosphere as a result of human activity are carbon dioxide, methane, and nitrous oxide
HERs: Acronym for Home Energy Rating
GLoSSary
97 97
v

98 | Bedford Climate Action Plan
HVAC: Acronym for Heating, Ventilating, and Air Conditioning
ICLEI: The International Council for Local Environmental Initiatives, a mem-bership association of local governments focused on addressing the cli-mate challenge
IPCC: Intergovernmental Panel on Climate Change
kW: A kilowatt, equal to 1,000 watts
kWh: A kilowatt hour (1,000 watt-hours), the work performed by one kilo-watt of electric power in one hour
Kyoto Protocol: The United Nations Treaty that targets the reduction of greenhouse gas emissions
LED: Light emitting diode
LEED: Leadership in Energy and Environmental Design, a commonly used green building standard developed by the U.S. Green Building Council
Life Cycle Assessment: The investigation and valuation of the environ-mental impacts of a given product or service caused or necessitated by its existence
Metric ton: 1,000 kilograms (or 2204.6226 lbs.). Also known as a “tonne.”
MMBtu: Million British Thermal Units, unit of energy equivalent to 10 therms.
MPG: Miles Per Gallon
NOx: Nitrogen Oxides
NYSERDA: New York State Energy Research and Development Authority
PM10: Course Particulate Matter
PV: Photovoltaics, a solar power technology that converts sunlight into electricity
Renewable Energy (RE): Energy generated from natural resources - such as sunlight, wind, rain, tides and geothermal heat - which are naturally replenished.
Solar thermal: A technology that captures solar energy for heat
SOx: Sulfur Oxides
Bedford 2020 Coalition: Community-wide entity stakeholders formed to implement the measures contained in the Bedford CAP.

Therm: 100,000 British Thermal Units (BTUs), equivalent to approximately 100 standard cubic feet of natural gas
T/CO2e: Metric Tonnes of CO2 equivalent
TOD: Transit Oriented Development
VMT: Vehicle miles traveled
VOCs: Volatile Organic Compounds
Weatherization: The reduction of air infiltration by methods such as caulking and weather stripping
Xeriscaping: Landscape with little need for water
Zero Waste: The City’s goal to eliminate waste sent to the landfill by 2020. All of the community’s discarded material would be recycled or reused
99

The Bedford Climate Action Plan was designed and prepared by Jesse Catalano, A Middlebury College student, whose participation in this project was made possible by The Bedford Garden Club and the Open Space Institute’s Barnabus McHenry Grant. The members of the Bedford Energy Advisory Panel provided direction, data and review of this plan.
Town of BedfordLee V.A. Roberts, SupervisorChristopher Burdick, Town CouncilmanPeter Chryssos, Town Councilman, Deputy SupervisorFrancis Corcoran, Town CouncilmanDavid Gabrielson, Town Councilman
Bedford Energy Advisory Panel MembersWilliam AbranowiczShirley BiancoJanet HarkhamNeal HundtMary Beth Kass, Chair
Other Town of Bedford ContributorsGail Amyot, Planning DepartmentLisbeth Fumagalli, Town ClerkJoan Gallagher, Director of PersonnelWilliam Heidepriem, Superintendent, Recreation and Parks Department Kim Kowalski, Administrative Assistant to the Supervisor and Town ClerkRobert Mascianica, Deputy Commissioner, Department of Public WorksBill Magrino, Head Custodian and Head of the TOB Green TeamMarcy Marchiano, Confidential Secretary to the SupervisorRick Megna, Building InspectorChris Menzel, Chief of PoliceJeffrey Osterman, Director of PlanningThomas Polzella, AssessorEd Ritter, ComptrollerJoel H, Sachs, Esq., Keane & Beane, P.C. Kevin Winn, Commissioner, Department of Public Works
Bedford Twenty by 2020 logo designed by Carol Bouyoucous
Overall layout, photos, charts and graphs designed by Jesse Catalano
ICLEI - Local Governments for SustainabilityMissy Stults, Senior Program Officer, Northeast Regional Capacity Center
acknowLedGemenTS
Daniel MartinLisa SchwartzSimon SkolnikMark TheilkingDr. Stuart Weitzman
100 | Bedford Climate Action Plan
vi

101
We’d like to thank Westchester County, NY and the cities of Berkely CA, Worcester MA, Portland OR, Chicago, IL, Cambridge MA whose Climate Action Plans inspired us.
I. Introduction (p. 8-14) a. Climate Science • The Intergovernmental Panel on Climate Change, Third Assess- ment Report “Climate Change 2001: The Scientific Basis” • Environmental Protection Agency (EPA)
c. Our Climate Action Plan (Quality of Life & Health) • Cambridge, MA Climate Action Plan • Westchester County, NY Climate Action Plan • Environmental Protection Agency (EPA)
c. Our Climate Action Plan (Energy Security) • House Committee on Energy Independence & Global Warming
c. Our Climate Action Plan (Climate)
• NECIA Report: Confronting Climate Change in the U.S. Northeast 2007 • The Intergovernmental Panel on Climate Change, Third Assess- ment Report “Climate Change 2001: The Scientific Basis” • The Intergovernmental Panel on Climate Change, Fourth Assess- ment Report “Climate Change 2007” • Westchester County, NY Climate Action Plan
II. Greenhouse Gas Emissions Inventory (p. 18-21) • Town of Bedford, New York Greenhouse Gas Emissions Analysis, prepared by the Bedford Energy Advisory Panel with assistance for ICLEI, Local Governments for Sustainability
III. Reduction Measures (p. 22-87) • The Climate and Air Pollution Planning Assistant (CAPPA), devel- oped by ICLEI, Local Governments for Sustainability and spon- sored by the Environmental Protection Agency • Food Measures - Portland Oregon Climate Action Plan • Tree Measures - Christian Science Monitor, April 16, 2003 Edition
SourceSvii

102 | Bedford Climate Action Plan
appendix
I. Bedford Twenty by 2020 Resolution . . . . 103 II. Greenhouse Gas Emissions Analysis . . . 104 a. Acknowledgements . . . . . . . . . . . . . 105 b. Table of Contents . . . . . . . . . . . . . . . . 107 c. Introduction . . . . . . . . . . . . . . . . . . 108 d. Greenhouse Gas Emissions Inventory . . . . . . 109 e. Conclusion . . . . . . . . . . . . . . . . . 116
viii

appendix
103

Town of Bedford, New York Greenhouse Gas Emissions Analysis
2004 Community Emissions Inventory &
2004 Government Operations Emissions Inventory
March 12, 2009 Updated on 6/8/09 to reflect change in fuel oil data
104 | Bedford Climate Action Plan

Town of Bedford Emissions Inventory, March 2009
Credits and Acknowledgements Town of Bedford: Lee V.A. Roberts, Supervisor Christopher Burdick, Town Councilman Peter Chryssos, Town Councilman, Deputy Supervisor Francis Corcoran, Town Councilman David Gabrielson, Town Councilman Bedford Energy Advisory Panel Members: William Abranowicz Shirley Bianco Janet Harkham Neal Hundt Mary Beth Kass, Chair Daniel Martin Simon Skolnik Mark Theilking Dr. Stuart Weitzman Other Town of Bedford Contributors: Gail Amyot, Planning Department Lisbeth Fumagalli, Town Clerk Joan Gallagher, Director of Personnel William Heidepriem, Superintendent, Recreation and Parks Department Kim Kowalski, Administrative Assistant to the Supervisor and Town Clerk Rick Megna, Building Inspector Chris Menzel, Chief of Police Jeffrey Osterman, Director of Planning Thomas Polzella, Assessor Joel H, Sachs, Esq., Keane & Beane, P.C. Kevin Winn, Commissioner, Department of Public Works Bedford Twenty by 2020 logo designed by Carol Bouyoucous
105

Town of Bedford Emissions Inventory, March 2009
1
ICLEI – Local Governments for Sustainability Missy Stults, Senior Program Officer, Northeast Regional Capacity Center This report was prepared with assistance from ICLEI – Local Governments for Sustainability. The authors gratefully acknowledge the dedication of the staff of the town of Bedford, who provided much of the insight and local knowledge necessary for the completion of this report.
106 | Bedford Climate Action Plan

Town of Bedford Emissions Inventory, March 2009
Table of Contents 1 Introduction...................................................................................................................
1.1 Climate Change Background ................................................................................ 1 1.2 The Communities for Climate Protection Campaign ............................................. 2
2 Greenhouse Gas Emissions Inventory.......................................................................... 2 2.1 Methodology and Model....................................................................................... 2
2.1.1 CACP Software.............................................................................................. 3 2.2.2 Creating the Inventory ................................................................................... 3
2.2 Inventory Results.................................................................................................. 4 2.2.1 Community Emissions Inventory ..................................................................... 4 2.2.2 Government Emissions Inventory .................................................................... 5
3 Conclusion .................................................................................................................. 9 Appendix 1 Data Sources ............................................................................................ 10
Town of Bedford Community-Wide Emissions Inventory Source Data for 2004 ......... 10 Town of Bedford Government Operations Emissions Inventory Source Data for 200411
Appendix 2 Inventory Reports.................................................................................... 12 Community Emissions in 2004:: Detailed Report....................................................... 12 Government Emissions in 2004: Detailed Report...................................................... 13
107

Town of Bedford Emissions Inventory, March 2009
1
1 Introduction In April 2007, The Town of Bedford joined ICLEI; the Town Board adopted a resolution committing the Town to taking action for climate protection. Through this resolution, the Town recognized the “profound effect” that greenhouse gases emitted by human activity are having on the Earth’s climate, as well as the Town’s opportunity to reduce these emissions, both through its government operations and by inspiring change throughout the community. Through energy efficiency in its facilities and vehicle fleet, alternative clean energy sources, waste reduction efforts, land use and transit planning, and other activities, the Town of Bedford can achieve multiple benefits, including saving energy and money, reducing emissions, and preserving quality of life in our community. With the assistance of ICLEI – Local Governments for Sustainability, the Town has begun its efforts to identify and reduce greenhouse gas emissions. This document represents completion of the first milestone in ICLEI’s five milestone process: conducting an inventory of greenhouse gas emissions. Presented here are estimates of greenhouse gas emissions resulting from our community as a whole, as well as those resulting from the Town’s internal government operations. Due to data availability, community data and government operations data is based on the year 2004. This data will provide a baseline against which we will be able to compare future performance, enabling us to demonstrate progress in reducing emissions. 1.1 Climate Change Background A balance of naturally occurring gases dispersed in the atmosphere determines the Earth’s climate by trapping solar heat. This phenomenon is known as the greenhouse effect. Modern human activity, most notably the burning of fossil fuels for transportation and electricity generation, introduces large amounts of carbon dioxide and other gases into the atmosphere. Collectively, these gases intensify the natural greenhouse effect, causing global average surface temperature to rise, which is in turn expected to affect global climate patterns. Overwhelming evidence suggests that human activities are increasing the concentration of greenhouse gases in the atmosphere, causing a rise in global average surface temperature and consequent climate change. In response to the threat of climate change, communities worldwide are voluntarily reducing greenhouse gas emissions. The Kyoto Protocol, an international effort to coordinate mandated reductions, went into effect in February 2005 with 161 countries participating. The United States is one of three industrialized countries that chose not to sign the Protocol. In the face of federal inaction, many communities in the United States are taking responsibility for addressing climate change at the local level. Westchester County and the Town of Bedford are likely to be impacted by changes to local and regional weather patterns and species migration. Scientists also expect changing temperatures to result in more frequent and damaging storms accompanied by flooding and land slides, summer water shortages as a result of reduced snow pack, and disruption of ecosystems, habitats and agricultural activities.
108 | Bedford Climate Action Plan

109
Town of Bedford Emissions Inventory, March 2009
2
1.2 The Communities for Climate Protection Campaign By adopting a resolution committing the Town to locally advancing climate protection, The Town of Bedford has joined an international movement of local governments. More than 1000 local governments, including over 500 in the United States, have joined ICLEI’s Cities for Climate Protection (CCP) campaign.1 In addition to The Town of Bedford the neighboring towns of Cortland, Croton-on-Hudson, Dobbs Ferry, Greenburgh, Hastings-on-Hudson, Larchmont, Mamaroneck, Mt. Kisco, New Castle, New Rochelle, North Castle, Ossining, Tarrytown, Yonkers, Yorktown and Westchester County are all CCP participants. The CCP campaign provides a framework for local communities to identify and reduce greenhouse gas emissions, organized along five milestones:
(1) Conduct an inventory of local greenhouse gas emissions; (2) Establish a greenhouse gas emissions reduction target; (3) Develop an action plan for achieving the emissions reduction target; (4) Implement the action plan; and, (5) Monitor and report on progress.
This report represents the completion of the first CCP milestone, and provides a foundation for future work to reduce greenhouse gas emissions in The Town of Bedford. 2 Greenhouse Gas Emissions Inventory The first step toward reducing greenhouse gas emissions is to identify baseline levels and sources of emissions in The Town of Bedford, as well as the sectors of our community and government operations that are responsible for the bulk of these emissions. This information can later inform the selection of a reduction target and possible reduction measures. 2.1 Methodology and Model ICLEI’s Communities for Climate Protection methodology assists local governments to systematically track energy and waste related activities in the community, and to calculate the relative quantities of greenhouse gases produced by each activity and sector. The inventory methodology involves performing two assessments: a communitywide assessment and a separate inventory of government facilities and activities. The government inventory is a subset of the community inventory. Once completed, these inventories provide the basis for the creation of an emissions forecast, and allow for the quantification of emissions reductions associated with proposed measures.
1 ICLEI was formerly known as the International Council for Local Environmental Initiatives, but the name has been changed to ICLEI – Local Governments for Sustainability.

Town of Bedford Emissions Inventory, March 2009
3
2.1.1 CACP Software To facilitate community efforts to reduce greenhouse gas emissions, ICLEI developed the Clean Air and Climate Protection (CACP) software package with the State and Territorial Air Pollution Program Administrators (STAPPA), the Association of Local Air Pollution Control Officials (ALAPCO), and Torrie Smith Associates. This software calculates emissions resulting from energy consumption and waste generation. The CACP software determines emissions using specific factors (or coefficients) according to the type of fuel used. Greenhouse gas emissions are aggregated and reported in terms of equivalent carbon dioxide units, or CO2e. Converting all emissions to equivalent carbon dioxide units allows for the consideration of different greenhouse gases in comparable terms. For example, methane is twenty-one times more powerful than carbon dioxide on a per molecule basis in its capacity to trap heat, so the CACP software converts one ton of methane emissions to 21 tons of carbon dioxide equivalents. The CACP software is also capable of reporting input and output data in several formats, including detailed, aggregate, source-based and time-series reports. The emissions coefficients and methodology employed by the CACP software are consistent with national and international inventory standards established by the Intergovernmental Panel on Climate Change (1996 Revised IPCC Guidelines for the Preparation of National Inventories) and the U.S. Voluntary Greenhouse Gas Reporting Guidelines (EIA form1605). The CACP software has been and continues to be used by over 500 U.S. cities, towns, and counties to reduce their greenhouse gas emissions. However, it is worth noting that, although the software provides The Town of Bedford with a sophisticated and useful tool, calculating emissions from energy use with precision is difficult. The model depends upon numerous assumptions, and it is limited by the quantity and quality of available data. With this in mind, it is useful to think of any specific number generated by the model as an approximation of reality, rather than an exact value.
2.2.2 Creating the Inventory Our greenhouse gas emissions inventory consists of two essentially distinct inventories: one for the Town of Bedford community as a whole, defined by our geographic borders, and one highlighting emissions resulting from the Town of Bedford’s internal government operations. The government inventory is a subset of the community-scale inventory (the two are not mutually exclusive). This allows the government, which formally committed to reducing emissions, to track its individual facilities and vehicles and to evaluate the effectiveness of its emissions reduction efforts at a more detailed level. At the same time, the community-scale analysis provides a performance baseline against which we can demonstrate progress being made throughout the Town of Bedford community. Creating our emissions inventory required the collection of information from a variety of sources (See Appendix 1 for inventory source data.) Data from the year 2004 was used for both the community inventory and the government inventory.
110 | Bedford Climate Action Plan

Town of Bedford Emissions Inventory, March 2009
4
When calculating the Town of Bedford’s emissions inventory, all energy consumed in the Town of Bedford was included. This means that, even though the electricity used by Town of Bedford residents is produced elsewhere, this energy and the emissions associated with it appears in the Town of Bedford’s inventory. The decision to calculate emissions in this manner reflects the general philosophy that a community should take full responsibility for the impacts associated with its energy consumption, regardless of whether or not the energy generation occurs within its geographic borders. 2.2 Inventory Results
2.2.1 Community Emissions Inventory In the base year 2004, the community of The Town of Bedford emitted approximately 275,951 tonnes of CO2e. As shown in Table 1, and illustrated in the pie chart below, Residential use was the greatest contributor to greenhouse gas emissions at 53% of the total. The Commercial sector contributed 15%, Transportation contributed 27%, and Waste contributed 5% of the community’s total greenhouse gas output.
Table 1: The Town of Bedford Community-Wide Greenhouse Gas Emissions in 2004
Sector
Greenhouse Gas
Emissions (tonnes CO2e)
Energy Equivalent (MMBtu)
Residential 146,451 1,806,823 Commercial 40,116 400,452 Transportation 74,693 959,118 Waste 14,691 Total 275,951 3,166,393
111

Town of Bedford Emissions Inventory, March 2009
5
Figure 1. The Town of Bedford Community-Wide Greenhouse Gas Emissions in 2004
Resdential53%
Commercial15%
Transportation27%
Waste5%
Resdential
Commercial
Transportation
Waste
The Town of Bedford community’s consumption of electricity and other fuels in local buildings and vehicles is also responsible for the release of criteria air pollutants, including NOX, SOX, CO, VOCs, and PM10. The Transportation sector is responsible for the majority of NOX, CO and VOC emissions, while energy used in buildings is primarily responsible for emissions of SOX and PM10.
Table 2. The Town of Bedford Community-Wide Criteria Air Pollutant Emissions in 2004
Sector NOX (lbs)
SOX (lbs)
CO (tonne
s)
VOCs (lbs)
PM10 (lbs)
Residential 472,950 502,916 79 24,440 126,786 Commercial 110,210 305,689 37 9,756 68,026 Transportation 580,583 30,162 1,966 455,526 17,166 Total 1,163,743 838,766 2,082 489,722 211,977
2.2.2 Government Emissions Inventory In the base year 2004, The Town of Bedford’s government operations generated 5,360 tonnes of CO2e. The Town’s buildings were the greatest contributors, emitting 74% of the total. The vehicle fleet contributed 20%, streetlights contributed 5%, and waste contributed 1% of the government emissions. During 2004, the Town of Bedford government spent approximately $552,923 on energy-related expenses for its buildings, streetlights and vehicles. Beyond reducing harmful greenhouse gases, any future reductions in government operations’ energy use have the potential to reduce this expense, enabling the Town of Bedford to reallocate limited funds toward other deserving causes. Table 3 and Figure 2 below illustrate the breakdown of government operations emissions by
112 | Bedford Climate Action Plan
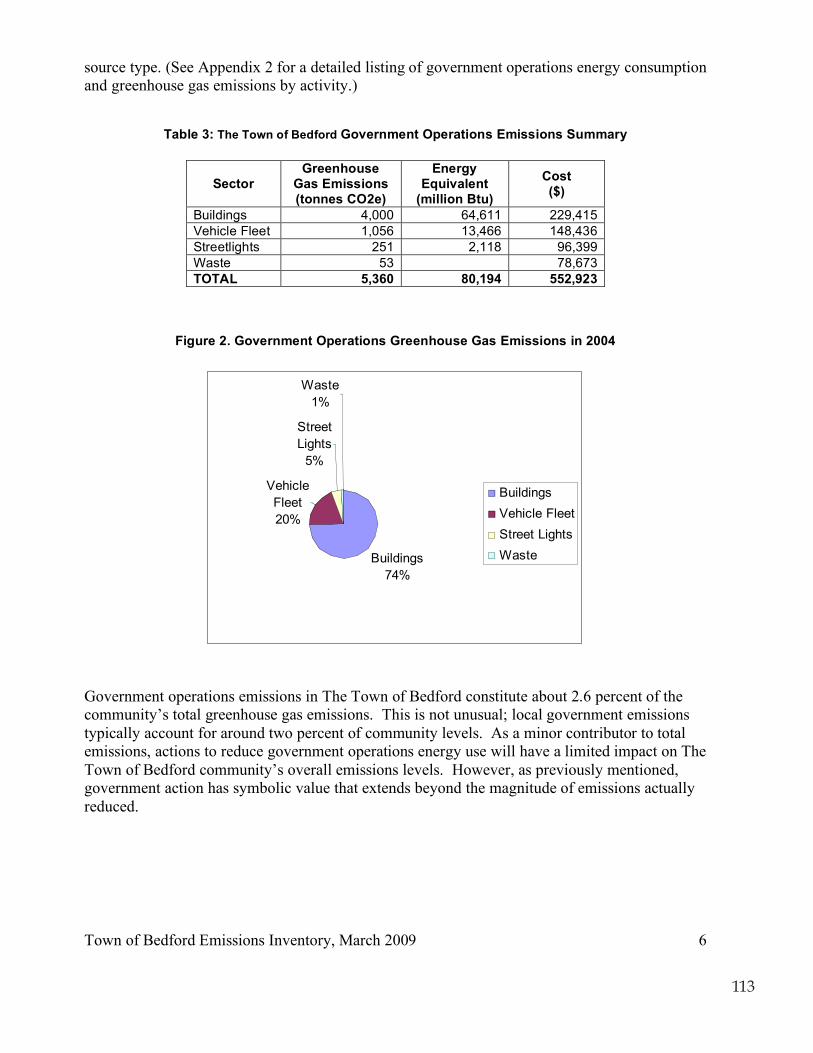
Town of Bedford Emissions Inventory, March 2009
6
source type. (See Appendix 2 for a detailed listing of government operations energy consumption and greenhouse gas emissions by activity.)
Table 3: The Town of Bedford Government Operations Emissions Summary
Sector Greenhouse
Gas Emissions (tonnes CO2e)
Energy Equivalent
(million Btu)
Cost ($)
Buildings 4,000 64,611 229,415 Vehicle Fleet 1,056 13,466 148,436 Streetlights 251 2,118 96,399 Waste 53 78,673 TOTAL 5,360 80,194 552,923
Figure 2. Government Operations Greenhouse Gas Emissions in 2004
Buildings74%
Vehicle Fleet20%
Street Lights
5%
Waste1%
BuildingsVehicle FleetStreet LightsWaste
Government operations emissions in The Town of Bedford constitute about 2.6 percent of the community’s total greenhouse gas emissions. This is not unusual; local government emissions typically account for around two percent of community levels. As a minor contributor to total emissions, actions to reduce government operations energy use will have a limited impact on The Town of Bedford community’s overall emissions levels. However, as previously mentioned, government action has symbolic value that extends beyond the magnitude of emissions actually reduced.
113

Town of Bedford Emissions Inventory, March 2009
7
Table 4. The Town of Bedford Building Energy Use Greenhouse Gas Emissions in 20042
Light fuel Oil Use (US
Gal) Electricity
Use Electricity
Cost Natural
Gas Use
Natural Gas Cost
Energy Equivalent
Site
Light fuel Oil Cost($) (kWh) ($) (therms) ($) (MMBtu)
Greenhouse Gas
Emissions (tonnes CO2e)
21 Park Ave 1,839 2,312 3,078 3,415
3,397
195
301 Adams 6,841 8,464 55,593 7,794
1,147
94
425 Cherry St 107,340 12,994
2,400
2,735
2,815
181
87 Adams 162 168
1
0
Annex 307, 309 Bedford Rd 26,563 3,329
91
11
BH Community House 4,308 5,525 18,263 3,169
3,402
1,042
4,136
247
Cedar Downs Pump house
34,072
6,061
34,757
1,948
Crusher Rd Garage 2,753 3,300
385
29
Depot Plaza 2,400 488 1,135 1,368
1,166
66
Guard Hill Tower 3,648 836
3,721
209
Haines Rd Soccer Fld 5,540 2,517
19
2
Charles Rd – Hwy 742 298
757
42
Rt 22 – Hwy Garage 16,384 2,281
56
7
Police Station 3,707 4,881 182,340 19,153
1,141
113 Rec – pools/filters/ bathhouse/concession
510 (propane) 704 236,821 28,137
856
99
Tenant Space 9,983 1,380 34 4
321 Bedford Road 183,520 22,087
7,020
7,644
7,788
476 Water Pumps/ Facilities/Tanks 687,108 77,333
2,345
278
Buildings Total 20,120 25,354 1,531,855 180,662 55,497 23,399
64,611
4000
114 | Bedford Climate Action Plan

Town of Bedford Emissions Inventory, March 2009
8
Table 5. The Town of Bedford Street and Traffic Lighting Greenhouse Gas Emissions in 2004
Site Electricity
Use (kWh)
Electricity Cost ($)
Energy Equivalent (MMBtu)
Greenhouse Gas Emissions (tonnes CO2e)
Traffic Signals 37,945 5,990 130 15 Parking Lots 72,546 11,300 248 29 Flashing Light – Rt 172 1,412 215 5 1 Kat.Bed/BH 472,384 73,326 1,612 191 B.H. Street Lighting 36,162 5,568 123 15 Street & Traffic Total 620,449 96,399 2,118 251
Table 6. The Town of Bedford Vehicle Fleet Greenhouse Gas Emissions in 2004
Department Gasoline
Consumption (gal)
Diesel Consumption
(gal)
Total Fuel Cost ($)
Energy Equivalent (MMBtu)
Greenhouse Gas Emissions (tonnes CO2e)
Police pump 40,564 57,306 5,095 395 Highway Pump 9,145 58,943 91,130 8,371 660 Vehicle Fleet Total 49,709 58,943 148,436 13,466 1,055
The Town of Bedford was also responsible for the release of criteria air pollution in 2004, as shown below. These pollutants have been linked with various environmental and public health outcomes and many of the actions we might take to reduce greenhouse gas emissions will also have a positive impact in reducing these pollutants as well.
Table 7. The Town of Bedford Government Operations Criteria Air Pollutant Emissions in 2004
Sector NOX (lbs)
SOX (lbs)
CO (tonnes)
VOCs (lbs)
PM10 (lbs)
Buildings 11,542 6,653 2 765 1,654 Streetlights 527 1,630 88 517 Vehicle Fleet 5,534 185 16 4,337 396 Total 17,604 8,467 18 5,190 2,568
115

Town of Bedford Emissions Inventory, March 2009
9
3 Conclusion In passing a resolution to join the Communities for Climate Protection campaign, The Town of Bedford made a formal commitment to reduce its emissions of greenhouse gases. This report lays the groundwork for those efforts by estimating baseline emissions levels against which future progress can be demonstrated. This analysis found that The Town of Bedford community as a whole was responsible for emitting 275,951 tonnes of CO2e in the base year 2004, with the residential sector contributing 53 percent, the commercial sector contributing 15 percent, the transportation sector contributing 27 percent and the waste sector contributing 5 percent to this total. The Town of Bedford’s government operations were responsible for 5,360 tonnes in 2004. The Town of Bedford’s government operations account for roughly 2 percent of the community’s total greenhouse gas emissions. Following the ICLEI methodology, we recommend that The Town of Bedford’s next forecast anticipated future emissions and engage in consideration of potential greenhouse gas reduction targets for both the community as a whole, and internal government operations. The Town should also begin to document emissions reduction measures that have already been implemented since the base years documented in this report, and to quantify the emissions benefits of these measures to demonstrate progress made to date. Next, the Town should begin to identify potential new emissions reduction measures that might be implemented in the future, including energy efficiency, clean energy, vehicle fuel efficiency or alternative fuel use, trip reduction strategies, waste reduction, and other projects. We feel confident that a number of opportunities exist for the Town to reduce emissions while saving taxpayer dollars, improving efficiency and reducing waste. The Town of Bedford’s Energy Advisory Panel will advise and support the Town Supervisor and Town Board in continuing the climate protection efforts of The Town of Bedford. The Panel is eager to aid the Town in its demonstrated leadership on this important issue.
116 | Bedford Climate Action Plan

Town of Bedford Emissions Inventory, March 2009
10
Appendix 1 Data Sources Community-Wide Emissions Inventory Source Data for 2004 Community-Wide Aggregate Utility Data
Electricity Natural Gas Light Fuel Oil Energy Equivalent
(kWh) (therms) (US Gal) (MMBtu) Residential 93,424,722 2,284,570 8,999,250 1,806,823 Commercial 45,455,743 790,520 569,620 313,914 Subtotal 138,880,465 3,075,090 9,568,870 2,120,737
Data provided: NYSEG and Con Edison data 2004 Community-Wide Transportation Data
Vehicle Miles Traveled (millions)
Energy Equivalent (MMBtu)
Subtotal 124.3 959,118
Transportation data from: New York Metropolitan Transportation Council – Michael Chiume (Senior Transportation Analyst) Community-Wide Waste Data Amount of Waste
Landfilled (tons)
Waste Composition
(%)
Equivalent CO2
(tonnes) Community Waste 15,239 100 14,691 Paper Products 5,791 38 Food Waste 1,981 13 Plant Debris 1,524 10 Wood/Textiles 610 4 All Other Waste 5,334 35 Total Waste Landfilled 15,239 100 14,691
Waste data from: Assumptions based on EAP data on waste generation per person/day
117

Town of Bedford Emissions Inventory, March 2009
11
Government Operations Emissions Inventory Source Data for 2004 The Town of Bedford Building Energy Use
Light Fuel Oil (US Gal)
Light Fuel Oil Cost ($)
Electricity Use (kWh)
Electricity Cost ($)
Natural Gas Use
(therms)
Natural Gas Cost ($)
Buildings Total 20,120
25,354 1,531,855 180,662 55,497 23,399
Data provided: All municipal data was obtained from 2004 invoices (Feb 2004-Jan 2005) filed in the “paid prior” files in the basement of the Town House, 321 Bedford Road The Town of Bedford Street and Traffic Lighting
Site
Electricity Use
(KWH) Electricity Cost
($) Traffic Signals 37,945 5,990 Parking Lots 72,564 11,300 FlashLight – Rt 172 1,412 215 Kat.Bed/BH 472,384 73,326 B.H. Street Lighting 36,162 5,568 Street/Traffic Total 620,467 96,399 Data provided by: All municipal data was obtained from 2004 invoices (Feb 2004-Jan 2005) filed in the “paid prior” files in the basement of the Town House, 321 Bedford Road The Town of Bedford Vehicle Fleet
Department Gasoline Consumption
(gal)
Diesel Consumption
(gal)
Total Fuel Cost ($)
Police Pump 40,564 57,306 Highway Pump 9145 58943 91,130 Subtotal Vehicle Fleet 49,709 58,943 148,436 Data provided by: All municipal data was obtained from 2004 invoices (Feb 2004-Jan 2005) filed in the “paid prior” files in the basement of the Town House, 321 Bedford Road
118 | Bedford Climate Action Plan

Town of Bedford Emissions Inventory, March 2009
12
Appendix 2 Inventory Reports Community Emissions in 2004: Detailed Report
Equiv CO2 Equiv CO2 Energy Equivalent
(tonnes) (%) (MMBtu) Residential Town of Bedford Aggregate Residential Energy Use Electricity 39,193 14.2 318,856 Light Fuel Oil 94,453 34.2 364,498 Natural Gas 12,805 4.6 228,457 Subtotal Residential 146,451 53.1 911,811 Commercial Town of Bedford Aggregate Commercial Energy Use Electricity 19,069 10.8 155,139 Industrial Electricity 612 0. 4,980 Municipal Electricity 10,025 0. 81,558 Light Fuel Oil 5,979 2.2 79,722 Natural Gas 4,431 1.6 79,052 Subtotal Commercial 40,116 14.5 400,452 Transportation Town of Bedford Community VMT Estimate Gasoline 61,860 22.4 796,135 Diesel 12,833 4.7 162,983 Subtotal Transportation 74,693 27.1 959,118 Waste Land filled Community Waste Paper Products 11,233 4.1 Food Waste 2,175 0.8 Plant Debris 948 0.3 Wood/Textiles 335 0.1 Subtotal Land filled Community Waste 14,691 5.3 Total 275,951 100.0 3,166,393
This report has been generated for The Town of Bedford, New York using STAPPA/ALAPCO and ICLEI's Clean Air and Climate Protection Software developed by Torrie Smith Associates Inc.
119

Town of Bedford Emissions Inventory, March 2009
13
Government Operations Emissions in2004: Detailed Report
Equiv CO2 Equiv CO2 Energy Equivalent (tonnes) (%) (MMBtu) Buildings Fuel Oil 204 3.8 2,722 Electricity 620 11.6 5,229 Natural Gas/Propane 3176 59.3 56,660 Subtotal Buildings 4,000 74.6 64,611
Vehicle Fleet Highway Pump Gasoline 89 1.7 1,150 Diesel 571 10.6 7,213 Subtotal DPW 660 12.3 8,371 Police Gasoline 395 7.4 5,095 Subtotal Police 395 7.4 5,095 Subtotal Vehicle Fleet 1,055 19.7 13,466
Streetlights Traffic Signals Electricity 15 .3 130 Subtotal Traffic Signals 15 .3 130 Parking Lots Electricity 29 .5 248 Subtotal Parking Lots 29 .5 248 Flashing Light-Rt 172 Electricity 1 0 5 Subtotal Flashing Light 1 0 5 Kat/Bed/BH Electricity 191 3.6 1,612 Subtotal Kat/Bed/BH 191 3.6 1,612 BH Street Lighting Electricity 15 .3 123 Subtotal BH Street Lighting 15 .3 123 Subtotal Streetlights 251 4.7 2,118 Waste 53 1.0 Subtotal Waste 53 1.0 Total 5,360 100.0 80,194
This report has been generated by The Town of Bedford, New York using STAPPA/ALAPCO and ICLEI's Clean Air and Climate Protection Software developed by Torrie Smith Associates Inc.
120 | Bedford Climate Action Plan

Town of BedfordBedford Town House321 Bedford RoadBedford Hills, NY 10507