Clickstream Big Party PPT
18
Big Data Analytic on Clickstream Data Group Name: Big Party Group Member: Taineng Lu Zheming Yuan Shenglei Zhao Tianmiao Zhou Instructor: Prof. Dobin Yim
-
Upload
shenglei-zhao -
Category
Documents
-
view
259 -
download
0
Transcript of Clickstream Big Party PPT

Big Data Analytic on Clickstream Data
Group Name: Big Party Group Member: Taineng Lu
Zheming Yuan Shenglei Zhao
Tianmiao ZhouInstructor: Prof. Dobin Yim

Introduction
• Objective:
Predict customer’s purchasing decision
Cluster customers to help marketing target
• Source data
• Clickstream data
• Product Purchase history
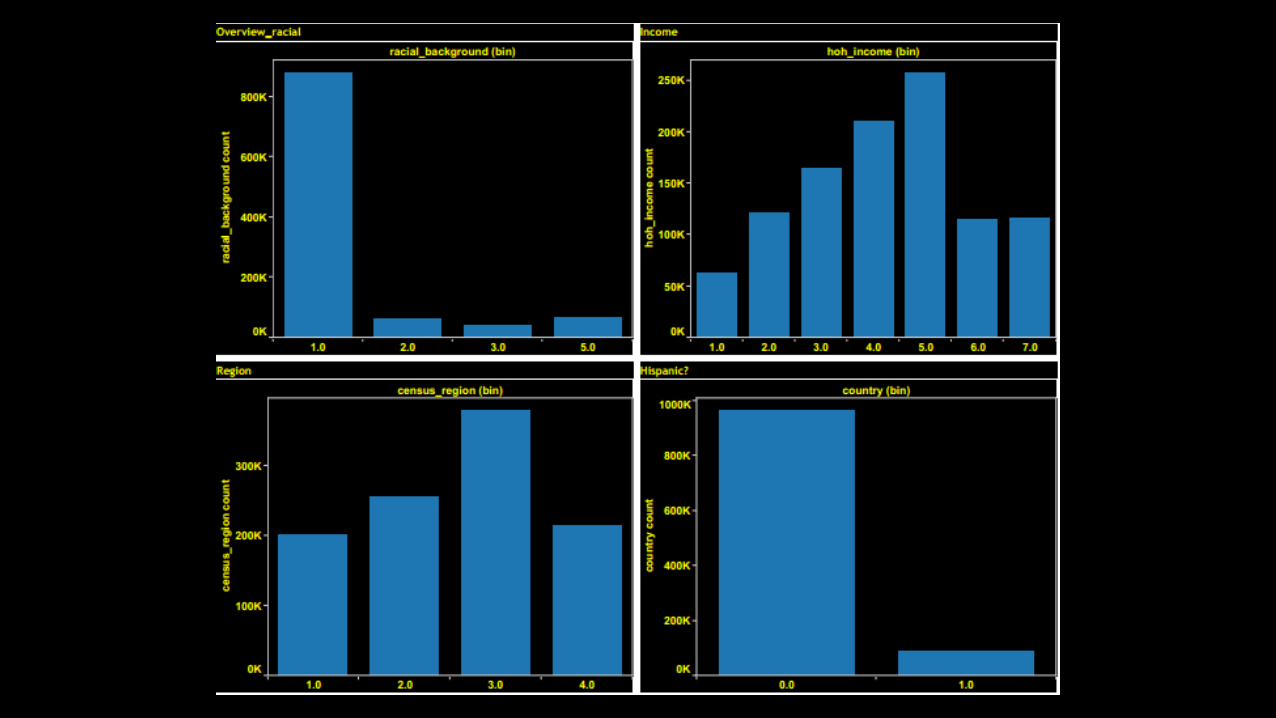
• Demographic data

Problem Statement
• Focuses on utilizing the Amazon Web Service to manipulate the dataset, and apply data mining on variables related to user’s browsing behavior as well as user’s demographic variables to explore insights from users pool
• Hypothesis: Customers’ purchase decision is determined by their browsing habit and demographic profile

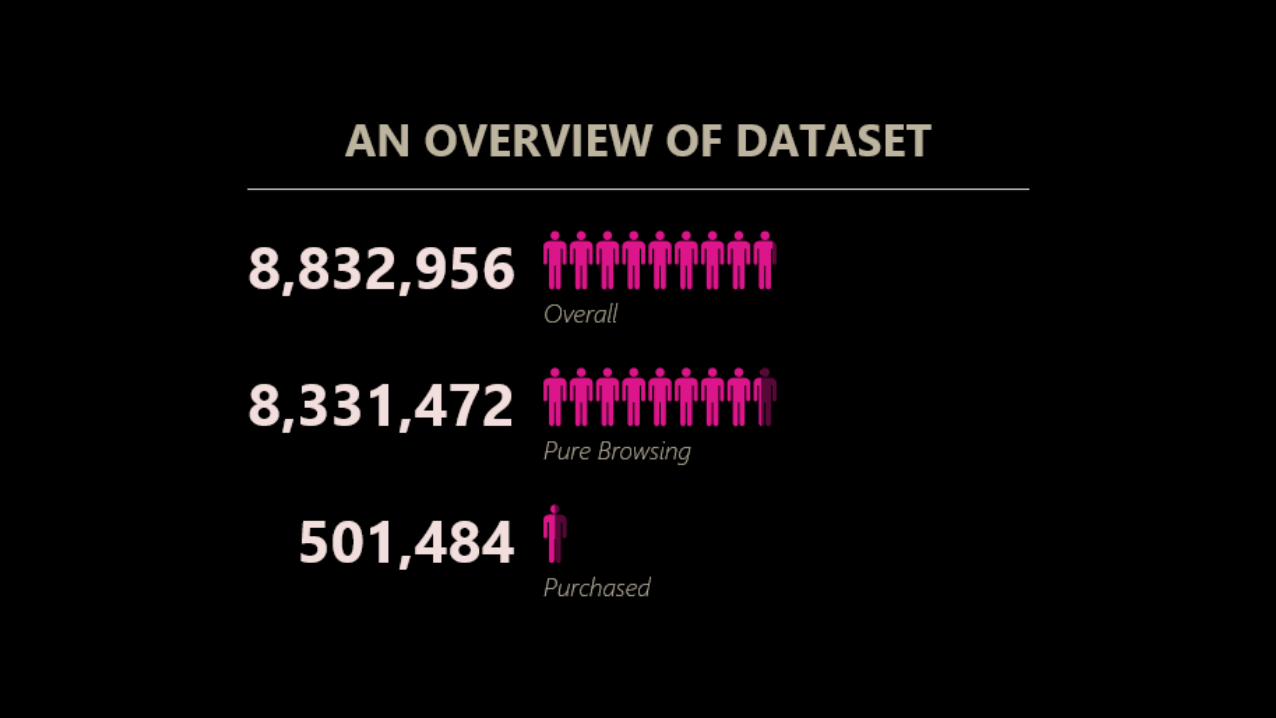
Data Manipulation• Three data sets:
• User’s browsing session data
• User’s demographic data
• User’s purchasing data
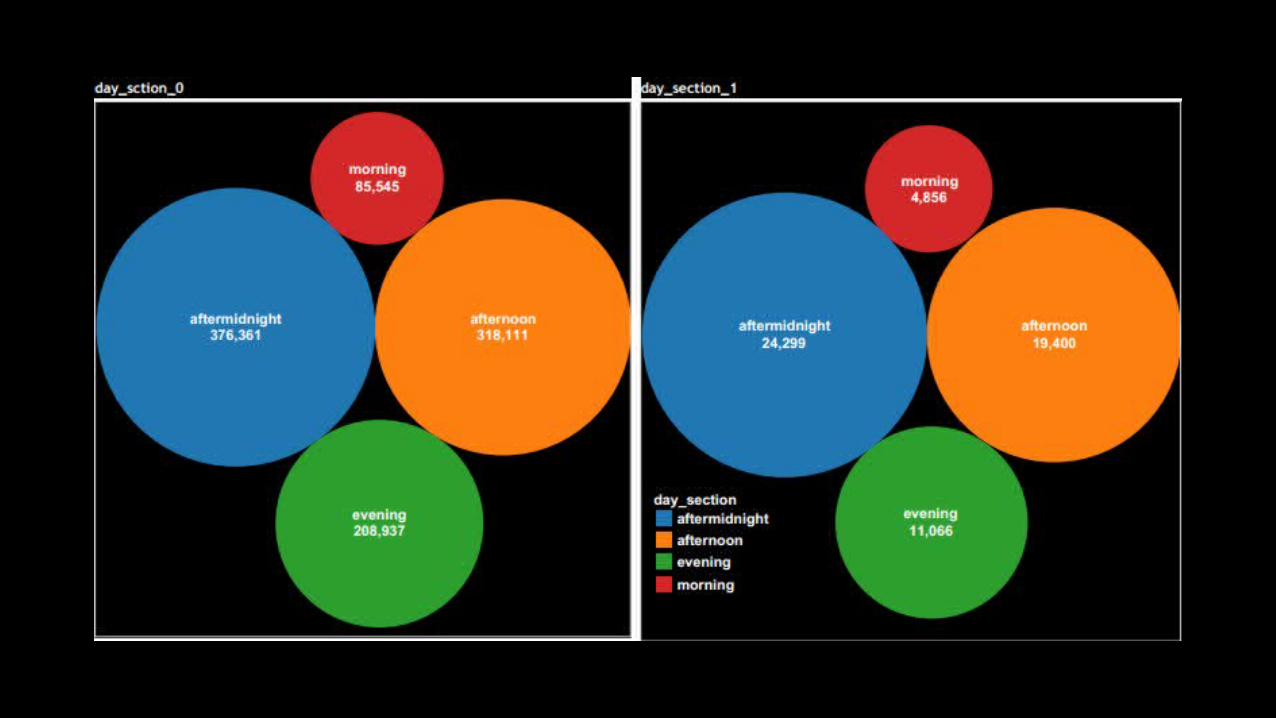
• Source data is organized by making each row a summary of session
• Analysis based on
• Defining the combination of each unique user and date a “user-date”
• Grouping data by each “user-date” and analyzed average duration per session, average number of page viewed per session, duration per page, percentage of empty records in reference domain and percentage of search engine records in reference domain

Data Manipulation
• Data manipulation was done through Hive by creating tables to record each file and joining several tables to combine all variables together
Original Sample Data Sample Hive Scripts for analysis & data manipulation

Variables


Amazon Web Service Machine Learning
1.Latest cloud machine learning as service
2.Loading Problem
3.Automatic Algorithm

Amazon Web Service Machine Learning
Sample Prediction Model Result.

Machine Learning Results in SPSS Modeler

Machine Learning Results in SPSS Modeler
1.Accuracy for testing data is 67.12%, which is not at a satisfying level.
Model needs improvement on variables or algorithm choice.
2. Balanced data has 52.55% portion of records with target ‘0’. Model
still has increased the accuracy of prediction compared to a
predictor which predicts majority class always.

Machine Learning Results in SPSS Modeler
1.From the predictor importance graph, page viewed per session is the most important factor in prediction.
2.Browsing behavior pattern related data has more influence on prediction than demographic ones

Machine Learning Results in SPSS Modeler
1.Clustering model used K-means algorithm and finally got 3 groups with quality score of 0.6, at a good level.
2.Predictor Importance graph shows the most important factors differentiate customers are percentage of search engine and percentage of empty records in reference domain.

Cluster Information1. Cluster 1 has relatively high percentage of empty records and extremely low percentage of search engine. It indicates that they might be direct buyer or knowledge builder, who knows where to find target information or products.
2. Cluster 3 has relatively low percentage of empty records and high percentage of search engine. It indicates that they might be hedonic browsers or searchers who depend on search engine to find interesting information.

Implication
1.Selected variables can help us improve accuracy of prediction and gain some insights into behavior pattern of customers
2.More variables can be added into prediction and clustering to measure other aspects of customers. (e.g. variety of page/domain/reference domain categories, returning records in reference domain)
3.More detailed target class could be applied, instead of buyer and non-buyer. (e.g. Hedonic browser, searcher, direct buyers and knowledge builder)