Click to edit Master title styles2.q4cdn.com/606446019/files/doc_presentations/2016/sep/...Click to...
44
TSX:KLG 1 klgold.com Denver Gold Forum | September 19, 2016 Corporate Presentation Presenter: Perry Ing, CFO VALUE & GROWTH FOCUSED ON GOLD
Transcript of Click to edit Master title styles2.q4cdn.com/606446019/files/doc_presentations/2016/sep/...Click to...

Click to edit Master title style
• Click to edit Master
text styles
– Second level
• Third level
– Fourth level
» Fifth level
• Click to edit Master
text styles
– Second level
• Third level
– Fourth level
» Fifth level
TSX:KLG 1 klgold.com
Denver Gold Forum | September 19, 2016
Corporate Presentation
Presenter: Perry Ing, CFO
VALUE & GROWTH
FOCUSED ON GOLD

Click to edit Master title style
• Click to edit Master
text styles
– Second level
• Third level
– Fourth level
» Fifth level
• Click to edit Master
text styles
– Second level
• Third level
– Fourth level
» Fifth level
TSX:KLG 2 klgold.com
Forward-Looking Statements
Cautionary Note Regarding Forward-Looking Statements.
Statements made in the Company’s handouts and as part of the corporate presentation contain statements which
constitute ”forward-looking statements”, including statements regarding the plans, intentions, beliefs and current
expectations of the Company with respect to the future business activities and operating performance of the Company. The
words “may”, “would”, “could”, “should”, “will”, “intend”, “plan”, “anticipate”, “believe”, “estimate”, “expect” and similar
expressions, as they relate to the Company, are intended to identify such forward-looking statements. Forward-looking
statements used in this presentation include, but may not be limited to; statements regarding the Company’s
guidance metrics for 2016 including, gold production, head grade, cash operating costs, AISC, and capital
expenditures; the exploration programs and associated budgets with respect to the Kirkland Lake Camp and East
Timmins Assets and the results and timing thereof, the medium to long-term strategy and potential of the
Company to continue to grow by way of organic growth and/or through various strategic transactions, including
mergers and acquisitions; increased throughput at the Holt and Taylor mines, and Company’s ability to further
reduce costs through various efficiency projects across the operations and the timing thereof.
With respect to the forward-looking information of Kirkland Lake Gold, concerning gold resources and reserves of the Kirkland Lake properties and
the PDFZ properties, the development of such properties are subject to various key assumptions described in the Annual Information Forms and
Technical Reports of both Kirkland Lake Gold and St Andrew Goldfields Ltd. referred to herein and as filed on the SEDAR profiles of both
companies at www.sedar.com and on the Company’s website at www.klgold.com.
Investors are cautioned that forward-looking statements are based on the opinions, assumptions and estimates of management considered
reasonable at the date the statements are made such as, without limitation, opinion, assumptions and estimates of management regarding the
Company’s business, its ability to increase its production capacity and decrease its production cost. Such opinions, assumptions and estimates, are
inherently subject to a variety of risks and uncertainties and other known and unknown factors that could cause actual events or results to differ
materially from those projected in the forward-looking statements. These factors are discussed in length in the Company's annual Management's
Discussion and Analysis for the interim period ended June 30, 2016, and Annual Information Form for the year ended December 31, 2015 filed with
the securities regulatory authorities in certain provinces of Canada and available at www.sedar.com.
Should one or more of these risks or uncertainties materialize, or should assumptions underlying the forward-looking statements prove
incorrect, actual results may vary materially from those described herein as intended, planned, anticipated, believed, estimated or
expected. Although the Company has attempted to identify important risks, uncertainties and factors which could cause actual results to
differ materially, there may be others that cause results not to be as anticipated, estimated or intended. The Company does not intend,
and does not assume any obligation, to update these forward-looking statements except as otherwise required by applicable law.

Click to edit Master title style
• Click to edit Master
text styles
– Second level
• Third level
– Fourth level
» Fifth level
• Click to edit Master
text styles
– Second level
• Third level
– Fourth level
» Fifth level
TSX:KLG 3 klgold.com
Investment Highlights
Cash Costs <US$650
AISC <US$1,050
C$24M Exploration
Program for 2016
~C$184M in Cash
Generated C$57.3M in
Free Cash Flow YTD
2.3M Oz’s of P&P
+
3.4M Oz’s of M&I
+
3.2M Oz’s of Inferred
*Example of forward-looking information
1 see Reserve and Resource Statements in Appendix of this presentation; 2 As at August 31, 2016 (see press release dated September 13, 2016)
Holt Mine
Taylor Mine Holt Mill
Macassa Mine Complex
Holloway Mine
2016 Production of
270-290k Oz’s

Click to edit Master title style
• Click to edit Master
text styles
– Second level
• Third level
– Fourth level
» Fifth level
• Click to edit Master
text styles
– Second level
• Third level
– Fourth level
» Fifth level
TSX:KLG 4 klgold.com
Diversified Assets In A Prolific, Mining Friendly Region
Holt Mine Complex
H1/16 Production1 50.6k Ozs Au
H1/16 Head Grade 5.1 g/t Au
Holt Mill 3,000 tpd (75% utilized)
Resources & Reserves* (operating assets only)
Total P&P 0.8M Ozs (5.1 g/t Au)
Holt Mine 591k Ozs (4.8 g/t Au)
Taylor Mine 156k Ozs (6.3 g/t Au)
Holloway Mine 40k Ozs (5.4 g/t Au)
Measured & Indicated 1.4M Ozs (4.1 g/t Au)
Inferred 1.8M Ozs (4.6 g/t Au)
Macassa Mine Complex
H1/16 Production 79.9k Ozs Au
H1/16 Head Grade 13.6 g/t Au
Macassa Mill 2,000 tpd (50% utilized)
Reserves & Resources* (operating assets only)
Total P&P Reserves
(Macassa Mine Complex) 1.5M Ozs (19.2 g/t Au)
Measured & Indicated
(Property Wide) 1.8M Ozs (17.4 g/t Au)
Inferred (Property Wide) 1.1M Ozs (20.1 g/t Au)
*Resources are exclusive of Reserves. See Company websites for NI 43-101 disclosure (www.kllgold.com; www.sasgoldmines.com)
QUÉBEC
1 Q1 Production from East Timmins Operations excludes 7,189 ounces from ETO from January 1 to January 25, 2016.
2 AISC is a non-GAAP measure, see Q1/16 MDA for reconciliation of non-GAAP measures

Click to edit Master title style
• Click to edit Master
text styles
– Second level
• Third level
– Fourth level
» Fifth level
• Click to edit Master
text styles
– Second level
• Third level
– Fourth level
» Fifth level
TSX:KLG 5 klgold.com
Financial Position
CASH 1
C$ 184 million Cash & cash equivalents
DEBT C$119 million convertible debentures
KGI.DB: 6% $15.00 conversion price
C$56.9MM mature Jun/2017
KGI.DB.A: 7.5% $13.70 conversion price
C$62.1MM mature Dec/2017
1 Cash balance as of August 31, 2016 (see press release dated September 13, 2016); 2 As at August 1, 2016; 3 Non-GAAP Measure, refer to MDA dated June 30, 2016
CAPITAL STRUCTURE 2
ISSUED SHARES 117.4 million
Stock Options ~3.5 million
FULLY DILUTED ~120.9 million
MARKET
CAPITALIZATION 2 C$1.3 billion
ROYALTY
BUYBACK 2.5% NSR Franco Nevada Corporation
Option to buyback 1% by October 31, 2016, at a cost of
US$36MM less any money paid against the 1% (Approx.
US$30MM)
$57.3M
Free Cash Flow3
$170.6M
Operating Cash Flow
$227.9M
Revenue
H1/2016 Financial Highlights

Click to edit Master title style
• Click to edit Master
text styles
– Second level
• Third level
– Fourth level
» Fifth level
• Click to edit Master
text styles
– Second level
• Third level
– Fourth level
» Fifth level
TSX:KLG 6 klgold.com
Share Structure and Relative Share Price Performance
Major Shareholders (~40%) 2
• Van Eck Associates Corporation (~13%)
• Fidelity Investments (~7%)
• Resolute Funds (~7%)
• Eric Sprott (~6%)
• Sentry Select (~5%)
• Abramson Family (~5%)
• Oppenheimer Funds Inc. (~3%)
• Sprott Asset Management (~3%)
52 Week Performance 2
HIGH C$12.39
LOW C$4.51
Current Share Price C$11.45
1 As at September 9, 2016: 2 As at August 19, 2016
50
75
100
125
150
175
200
225
250
Sep-15 Dec-15 Mar-16 Jun-16 Sep-16
Kirkland Lake GDX ETF (C$)
Spot Gold (C$)
18%
98%
124%

Click to edit Master title style
• Click to edit Master
text styles
– Second level
• Third level
– Fourth level
» Fifth level
• Click to edit Master
text styles
– Second level
• Third level
– Fourth level
» Fifth level
TSX:KLG 7 klgold.com
YTD Operational Performance
MACASSA MINE
COMPLEX
HOLT MINE
COMPLEX
Tonnes Milled 188,762 327,631
Head Grade (g/t) 13.6 5.0
Recovery 97.3% 94.4%
Ounces Produced 79,983 50,630
Cost per Tonne (C$/tonne)1 $335 $136
Cash Costs (US$/Oz) 1 $784 $669
1 Production excludes East Timmins for the first 25 days of January (7,189 ozs), as the acquisition of St Andrew Goldfields Ltd., did not close until January 26, 2016. 2 Cost per tonne and cash costs per ounce sold are non-GAAP performance measures. While they are common performance measures in the mining industry it does not
have any standardized meaning. The Company provides a reconciliation of its non-GAAP performance measures in its most recent Management Discussion & Analysis
(“MD&A”), for the period ended December 31, 2015. 3 USD:CAD exchange rate of 1.3

Click to edit Master title style
• Click to edit Master
text styles
– Second level
• Third level
– Fourth level
» Fifth level
• Click to edit Master
text styles
– Second level
• Third level
– Fourth level
» Fifth level
TSX:KLG 8 klgold.com
Tracking Well Against 2016 KPI’s
Guidance Metrics All figures are in C$ unless stated otherwise
Q1/16
Actual
Q2/16
Actual YTD Actual 2016 Guidance
Total Gold Production (kOzs) 62.3 68.4 130.6 270 - 290
Head Grade (g/t Au) 9.1 7.9 8.2 7.7
Cash Operating Cash Costs ($/Oz) US$569 $667 $641 US$600-US$650 3
All-In Sustaining Costs 2
($/Oz of gold sold) US$861 $990 $925 US$1,000- US$1,050 3
Total Capital Expenditures
(New & Sustaining Capital, Property, Plant
& Equipment)
$20.1M $21.0M $41.1M $120M
1 Production excludes East Timmins for the first 25 days of January (7,189 ozs), as the acquisition of St Andrew Goldfields Ltd., did not close until January 26, 2016. 2 AISC costs per ounce sold is a non-GAAP performance measures. While it is a common performance measures in the mining industry it does not have any
standardized meaning. The Company provides a reconciliation of its non-GAAP performance measures in its most recent Management Discussion & Analysis (“MD&A”),
for the period ended December 31, 2015. 3 USD:CAD exchange rate of 1.3
*Example of forward-looking information

Click to edit Master title style
• Click to edit Master
text styles
– Second level
• Third level
– Fourth level
» Fifth level
• Click to edit Master
text styles
– Second level
• Third level
– Fourth level
» Fifth level
TSX:KLG 9 klgold.com
2016 Exploration Program
2016 Budget of $24M (includes $6M FT dollars)
Kirkland Lake Properties
(including Macassa Mine Complex)
PDFZ Properties
(including Holt Mine Complex)
Surface Drilling (4-7 drills)
• SMC along strike
• Main Break at depth
• Amalgamated Break
Surface Drilling (5 drills)
• Holt-Holloway Property
• Taylor Property
• Hislop Property
Underground Drilling (3 drills)
• 5300’ Level - SMC infill/ expansion
• 4250’ Level - ’04 Break expansion
Underground Drilling (5 drills)
• Holloway Mine (Smoke Deep Zone)
• Taylor Mine (WPZ along strike and at depth)
• Holt Mine (Zone 4 and Ghost Zone)
The Company closed a $15M Flow-Through financing in July in order to enhance it’s exploration
efforts across its land holdings within the Kirkland Lake Camp and along the Porcupine-Destor Fault
Zone (PDFZ)

Click to edit Master title style
• Click to edit Master
text styles
– Second level
• Third level
– Fourth level
» Fifth level
• Click to edit Master
text styles
– Second level
• Third level
– Fourth level
» Fifth level
TSX:KLG 10 klgold.com
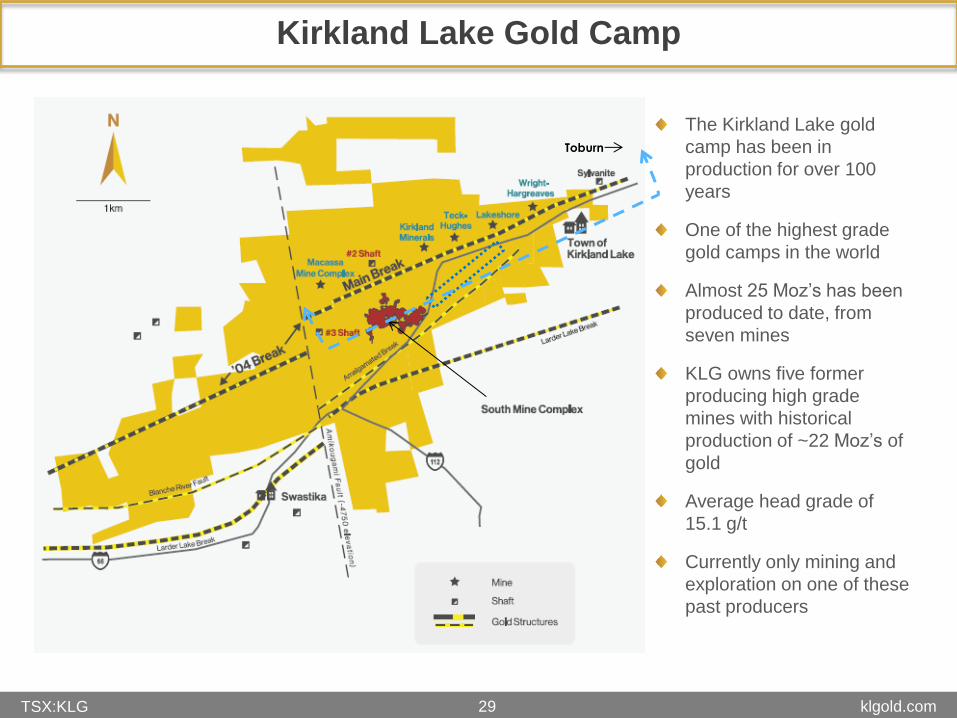
Kirkland Lake Gold Camp
The Kirkland Lake gold
camp has been in
production for over 100
years
One of the highest grade
gold camps in the world
Almost 25 Moz’s has been
produced to date, from
seven mines
KLG owns five former
producing high grade
mines with historical
production of ~22 Moz’s of
gold
Average head grade of
15.1 g/t
Currently only mining and
exploration on one of these
past producers
Toburn
Click to edit Master title style
• Click to edit Master
text styles
– Second level
• Third level
– Fourth level
» Fifth level
• Click to edit Master
text styles
– Second level
• Third level
– Fourth level
» Fifth level
TSX:KLG 11 klgold.com
Regional Exploration Across a Prolific Trend
• Initial results from our regional program do not appear to be Main Break related (Phase 1)
• Geophysics anomalies identified and follow-up targeting exercise completed as part of Phase 1a
• Phase 1a program has 2 remaining holes in progress.
• Phase 2 will target the Main Break at depth and consist of infill drilling.
Kirkland
Minerals
See press release dated January 19, 2016, as filed on SEDAR

Click to edit Master title style
• Click to edit Master
text styles
– Second level
• Third level
– Fourth level
» Fifth level
• Click to edit Master
text styles
– Second level
• Third level
– Fourth level
» Fifth level
TSX:KLG 12 klgold.com
Holt-Holloway Exploration Potential
Lightning
Smoke Deep Blacktop
Canamx
Deep Thunder
Ghost
Zone 4
Zone 6
Tousignant
Holt Property
Holloway Property Holloway West
(Harker) Lightval

Click to edit Master title style
• Click to edit Master
text styles
– Second level
• Third level
– Fourth level
» Fifth level
• Click to edit Master
text styles
– Second level
• Third level
– Fourth level
» Fifth level
TSX:KLG 13 klgold.com
A Profitable Mid-Tier Gold Producer
PRODUCTION
LOW COST & PROFITABLE
SUSTAINABLE
GROWTH
• Diversified production from 4 mines and 2 mills
o 2016 gold production 270-290k Oz’s
• Strong balance sheet and positive cash flow
generation
o Cash costs of US$600 - $650/Oz
o AISC of US$1,000 - $1,050/Oz
• Large reserve and resource base
o Supports long term sustainable production
• Highly prospective land holdings
o Increased exploration spending to support
organic growth potential
Leveraged to the Canadian dollar
*Example of forward-looking information

Click to edit Master title style
• Click to edit Master
text styles
– Second level
• Third level
– Fourth level
» Fifth level
• Click to edit Master
text styles
– Second level
• Third level
– Fourth level
» Fifth level
TSX:KLG 14 klgold.com
www.klgold.com
Suzette N Ramcharan, CPIR
Director of Investor Relations
+1-647-361-0200

Click to edit Master title style
• Click to edit Master
text styles
– Second level
• Third level
– Fourth level
» Fifth level
• Click to edit Master
text styles
– Second level
• Third level
– Fourth level
» Fifth level
TSX:KLG 15 klgold.com
APPENDIX
Notes, additional disclosure and other
information

Click to edit Master title style
• Click to edit Master
text styles
– Second level
• Third level
– Fourth level
» Fifth level
• Click to edit Master
text styles
– Second level
• Third level
– Fourth level
» Fifth level
TSX:KLG 16 klgold.com
Directors and Management
Eric Sprott 2 Non-executive Chairman Barry Cooper, B.Sc., MBA 1 Non-executive Director
Barry Olson, M.Sc. 1 Non-executive Director Pamela Klessig, P.Geo. Non-executive Director
Dawn Whittaker, LLB Non-executive Director Jeffrey Parr, CPA-CA, BA, MBA 1 Non-executive Director
Anthony Makuch Director
Anthony (Tony) Makuch President & Chief Executive Officer
Perry Ing, CPA-CA, CPA (Ill), CFA 3
Chief Financial Officer
Keyvan Salehi, P.Eng., MBA
VP Technical Services & Corporate Development
Meri Verli, CA, CPA
Sr. VP Finance and Treasurer
Pierre Rocque, P.Eng
VP Mining Engineering
Ray Yip,
VP Business Intelligence Systems
Doug Cater, P.Geo.
VP Exploration
Jennifer Wagner, LL.B
Corporate Legal Counsel
Kevin Fearn, BA, CHRP, CHRL
Director, Human Resources
Suzette N Ramcharan, CPIR
Director, Investor Relations
Board of Directors
Senior Management
Click to edit Master title style
• Click to edit Master
text styles
– Second level
• Third level
– Fourth level
» Fifth level
• Click to edit Master
text styles
– Second level
• Third level
– Fourth level
» Fifth level
TSX:KLG 17 klgold.com
Analyst Coverage
Firm Analyst
GMP Oliver Turner
Dundee Securities Ron Stewart
CIBC World Markets Cosmos Chiu
Macquarie Capital Markets Michael Siperco
BMO Capital Markets Brian Quast
M Partners Stuart McDougall
Mirabaud Securities Richard Morgan
Firm Analyst
Scotiabank Craig Johnston
PI Financial Philip Ker
National Bank Financial Raj Ray
Clarus Securities Jamie Spratt
Investec Bank Hunter Hillcoat
Pareto Securities John McClintock
KIRKLAND LAKE GOLD IS FOLLOWED BY THE ANALYSTS LISTED ABOVE. THIS LIST IS PROVIDED FOR INFORMATION PURPOSES ONLY AND IS SUBJECT TO CHANGE
AS COVERAGE IS ADDED OR DROPPED BY A FIRM.
OPINIONS, ESTIMATES OR FORECASTS REGARDING KIRKLAND LAKE GOLD'S PERFORMANCE THAT ARE MADE BY THESE ANALYSTS ARE THEIRS ALONE AND DO
NOT REPRESENT THE OPINIONS, ESTIMATES OR FORECASTS OF KIRKLAND LAKE GOLD OR ITS MANAGEMENT.
KIRKLAND LAKE GOLD DOES NOT IMPLY ITS ENDORSEMENT OF, OR CONCURRENCE WITH, SUCH INFORMATION, CONCLUSIONS OR RECOMMENDATIONS AND
TAKES NO RESPONSIBILITY FOR MONITORING, SUPPLEMENTING OR CORRECTING ANY INFORMATION OR FORECASTS PROVIDED BY THE ANALYSTS.

Click to edit Master title style
• Click to edit Master
text styles
– Second level
• Third level
– Fourth level
» Fifth level
• Click to edit Master
text styles
– Second level
• Third level
– Fourth level
» Fifth level
TSX:KLG 18 klgold.com
A High-Grade Corner Stone
Underground Mine
MACASSA MINE COMPLEX
Click to edit Master title style
• Click to edit Master
text styles
– Second level
• Third level
– Fourth level
» Fifth level
• Click to edit Master
text styles
– Second level
• Third level
– Fourth level
» Fifth level
TSX:KLG 19 klgold.com
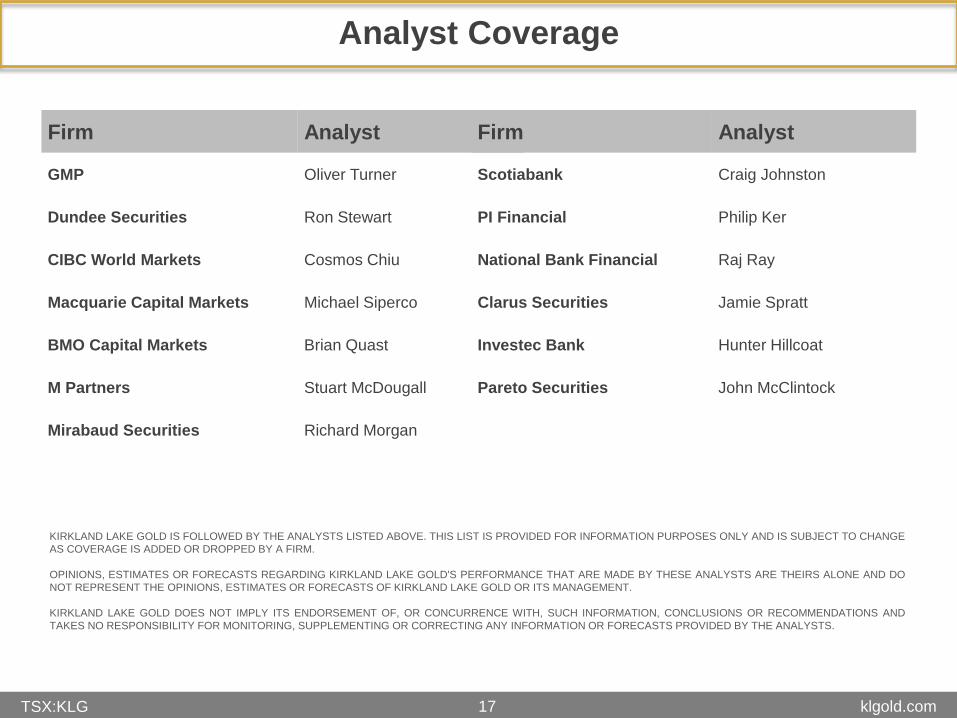
Macassa Mine Complex Overview
Reserves & Resources
Property Wide SMC
Mineral Reserves
(P&P) 1.5 Moz’s @ 19.2 g/t
2.4M tonnes
0.9 Moz’s @ 22.3 g/t 1.3M tonnes
Mineral Resources
(M&I) 2.0 Moz’s @ 16.8 g/t
3.8M tonnes
0.9 Moz’s @ 22.6 g/t 1.3M tonnes
Mineral Resources
(Inferred) 1.7 Moz’s @ 19.2 g/t
1.9M tonnes
0.9 Moz’s @ 22.3 g/t 1.2M tonnes
2016E H1/2016A
Gold Production (k Oz’s) 160 – 170 79.9
Head Grade (g/t Au) 15.1 13.6
See Appendix for more disclosure on MRMR statement which is as of December 31, 2014.
Macassa Mill – 2,000 tpd capacity
Production from the SMC and ’04/Main Break feed the mill at approximately 950 tpd
Note: During Q2/2016 the Company processed approximately 13,616 tonnes of ore from low grade surface stockpiles
grading 1.7 g/t.

Click to edit Master title style
• Click to edit Master
text styles
– Second level
• Third level
– Fourth level
» Fifth level
• Click to edit Master
text styles
– Second level
• Third level
– Fourth level
» Fifth level
TSX:KLG 20 klgold.com
5025 Level
P+P 28,000 Tons @ 0.48 oz/ton 14,000 Oz’s M+I 74,000 Tons @ 0.42 oz/ton 32,000 Oz’s
5300 Level
P+P 561,000 Tons @ 0.47 oz/ton 261,000 Oz’s M+I 245,0000 Tons @ 0.43 oz/ton 107,000 Oz’s
5400 Level
P+P 370,000 Tons @ 0.61 oz/ton 226,000 Oz’s M+I 174,000 Tons @ 0.42 oz/ton 72,000 Oz’s
5600 Level
P+P 239,000 Tons @ 0.77 oz/ton 183,000 Oz’s M+I 186,000 Tons @ 0.63 oz/ton 117,000 Oz’s
5700 Level
P+P 202,000 Tons @ 1.03 oz/ton 208,000 Oz’s M+I 164,000 Tons @ 0.91 oz/ton 96,000 Oz’s
South Mine Complex by Level
OPEN
*Drawing not to scale
NOTE: Example of a forward-looking statement
5800 to 6600 Level
P+P 50,000 Tons @ 0.83 oz/ton 41,000 Oz’s
M+I 551,000 Tons @ 0.91 oz/ton 499,000 Oz’s
OPEN
OPEN
Fully developed and
currently in production
6 stopes in production
Currently in development, while ramp
towards 5700 Level continues

Click to edit Master title style
• Click to edit Master
text styles
– Second level
• Third level
– Fourth level
» Fifth level
• Click to edit Master
text styles
– Second level
• Third level
– Fourth level
» Fifth level
TSX:KLG 21 klgold.com
HOLT MINE
COMPLEX Sustainable Production
HOLT MINE COMPLEX

Click to edit Master title style
• Click to edit Master
text styles
– Second level
• Third level
– Fourth level
» Fifth level
• Click to edit Master
text styles
– Second level
• Third level
– Fourth level
» Fifth level
TSX:KLG 22 klgold.com
PDFZ Properties
Holt, Holloway, Taylor HOLT MINE COMPLEX (Producing Assets)
Hislop Care & Maintenance
Ludgate, Aquarius Exploration Targets with existing resources
Garrison Creek Exploration Target
120km strike of contiguous land straddling the Porcupine-Destor Fault Zone
Blackfox Mine & Greyfox Deposit
(Primero Mining)
Aquarius
Hislop
Ludgate
Garrison
Creek
120km
N
Fenn-Gibb Deposit
(Tahoe Resources)

Click to edit Master title style
• Click to edit Master
text styles
– Second level
• Third level
– Fourth level
» Fifth level
• Click to edit Master
text styles
– Second level
• Third level
– Fourth level
» Fifth level
TSX:KLG 23 klgold.com
Holt Mine Complex Overview
Reserves & Resources*
Property Wide
Mineral Reserves
(P&P) 0.8 Moz’s @ 5.3 g/t
5.2M tonnes
Mineral Resources
(M&I) 1.7 Moz’s @ 4.2 g/t
12.9M tonnes
Mineral Resources
(Inferred) 2.2 Moz’s @ 4.5 g/t
14.9M tonnes
See Appendix for more disclosure on MRMR statement which is as of December 31, 2014.
HOLT MINE ~1,200tpd
(shaft access underground mine)
HOLLOWAY MINE ~500tpd
(shaft access underground mine
TAYLOR MINE ~500tpd
(ramp access underground mine)
*The property wide M&I and Inferred resources do not include Aquarius which currently has 0.9 Mozs (22.3M tonnes at 1.3 g/t Au) and inferred resources of 230 ounces (9,000 tonnes at
0.8 g/t Au).
Holt Mill – 3,000 tpd capacity
Holt-Holloway and Taylor mines feed
the mill at approximately 2,200 tpd
2016E H1/2016A
Gold Production (k Oz’s) 110 - 120 50.6
Head Grade (g/t Au) 4.8 5.0
Note: During Q2/2016 the Company processed approximately 4,566 tonnes of ore from low grade surface stockpiles at the
Taylor Mine grading 2.3 g/t.

Click to edit Master title style
• Click to edit Master
text styles
– Second level
• Third level
– Fourth level
» Fifth level
• Click to edit Master
text styles
– Second level
• Third level
– Fourth level
» Fifth level
TSX:KLG 24 klgold.com
Holt Mine – Long Section
All figures are rounded.
See Appendix for more disclosure on MRMR statement which is as of December 31, 2014.
P&P Reserves M&I Resources Inferred Resources
Holt Mine (All Zones) 591 koz
3.9Mt @ 4.8 g/t Au
957 koz
7.6Mt @ 3.9 g/t Au
1.2 Moz
7.9Mt @ 4.7 g/t Au
Zone 4
(includes Zone 4 East)
201 koz
1.5Mt @ 4.3 g/t Au
544 koz
4.4Mt @ 4.0 g/t Au
23 koz
0.2Mt @ 4.0 g/t Au
Zone 4 West Extension - - 861 koz
5,552,000 @4.82g/t Au
Zone 6 147 koz
0.8Mt @ 6.0 g/t Au
48 koz
0.2Mt @ 7.6 g/t Au
28 koz
0.1Mt @ 7.9 g/t Au
Ghost Zone 152 koz
1.0Mt @ 4.5 g/t Au
159 koz
1.4Mt @ 3.4 g/t Au
92 koz
0.8Mt @ 3.7 g.t Au
500 m
Surface
Shaft Bottom (1.2km)
Ghost Zone
Zone 6
Zone 4
Zone 4 West
Extension
• Current production is derived
from Zone 4 (~1,000tpd) and
Zone 6 (~250tpd)
• Ore is crushed underground and
skipped to surface for processing
at the Holt Mill
View looking north

Click to edit Master title style
• Click to edit Master
text styles
– Second level
• Third level
– Fourth level
» Fifth level
• Click to edit Master
text styles
– Second level
• Third level
– Fourth level
» Fifth level
TSX:KLG 25 klgold.com
Holloway Mine – Long Section
P&P Reserves M&I Resources Inferred Resources
Holloway Mine
(All Zones)
40 koz
0.2Mt @ 5.4 g/t Au
117 koz
0.8Mt @ 4.6 g/t Au
389 koz
0.2Mt @ 4.9 g/t Au
Smoke Deep Zone 24 koz
0.1Mt @ 5.3 g/t Au N/A N/A
Blacktop Zone 16 koz
89kt @ 5.5 g/t Au N/A N/A
Middle Zone - 24 koz
0.2Mt @ 4.2 g/t Au N/A
Deep Thunder/
Canamax - -
350 koz
2.2Mt @ 4.9 g/t Au
All figures are rounded.
See Appendix for more disclosure on MRMR statement which is as of December 31, 2014.
• Current production is derived predominantly from the Smoke Deep Zone, with a small contribution from the Blacktop Zone (~550tpd)
• Ore is crushed underground, skipped to surface, and trucked 1km to the Holt Mill for processing
Surface
500 m
Shaft Bottom (867m)
Smoke Deep Zone
Blacktop Zone
View looking north
Middle Zone
Lightning Zone
Click to edit Master title style
• Click to edit Master
text styles
– Second level
• Third level
– Fourth level
» Fifth level
• Click to edit Master
text styles
– Second level
• Third level
– Fourth level
» Fifth level
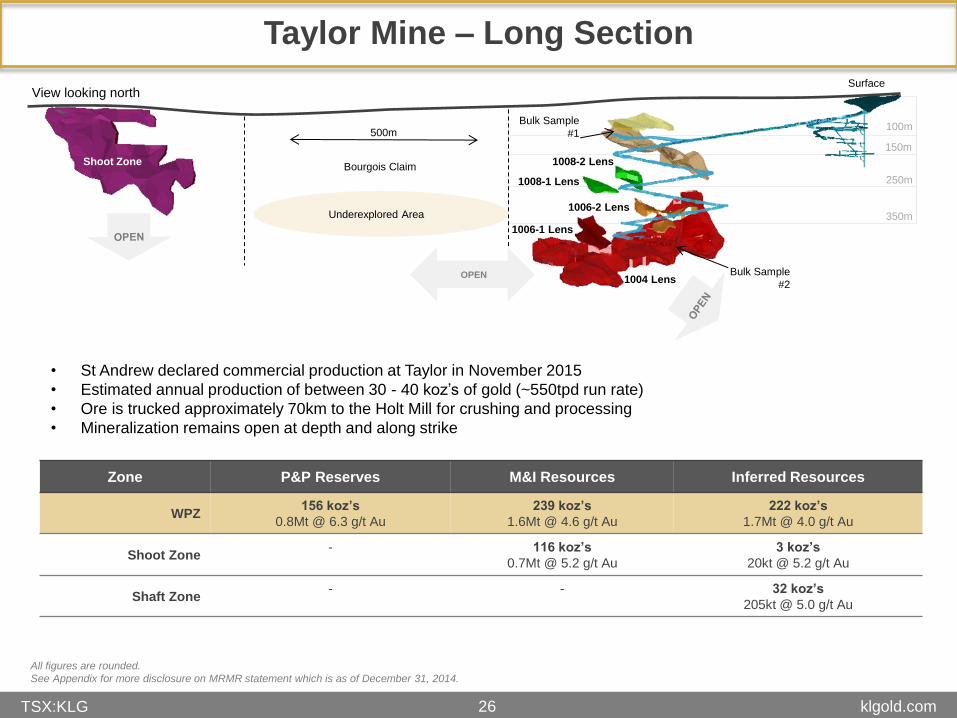
TSX:KLG 26 klgold.com
150m
Taylor Mine – Long Section
Zone P&P Reserves M&I Resources Inferred Resources
WPZ 156 koz’s
0.8Mt @ 6.3 g/t Au
239 koz’s
1.6Mt @ 4.6 g/t Au
222 koz’s
1.7Mt @ 4.0 g/t Au
Shoot Zone - 116 koz’s
0.7Mt @ 5.2 g/t Au
3 koz’s
20kt @ 5.2 g/t Au
Shaft Zone - - 32 koz’s
205kt @ 5.0 g/t Au
Surface
Bourgois Claim Shoot Zone
All figures are rounded.
See Appendix for more disclosure on MRMR statement which is as of December 31, 2014.
• St Andrew declared commercial production at Taylor in November 2015
• Estimated annual production of between 30 - 40 koz’s of gold (~550tpd run rate)
• Ore is trucked approximately 70km to the Holt Mill for crushing and processing
• Mineralization remains open at depth and along strike
Bulk Sample
#1
Bulk Sample
#2 1004 Lens
1006-1 Lens
1008-1 Lens
1008-2 Lens
100m
250m
350m 1006-2 Lens
500m
View looking north
OPEN
Underexplored Area

Click to edit Master title style
• Click to edit Master
text styles
– Second level
• Third level
– Fourth level
» Fifth level
• Click to edit Master
text styles
– Second level
• Third level
– Fourth level
» Fifth level
TSX:KLG 27 klgold.com
Hislop Project
100 m
100 m
200 m
300 m
Hislop Mine – Long Section looking northeast
• Located approximately 45km west of the
Holt Mill.
• St Andrew mined two pits (east and west pit)
from 2010 to 2014.
• Currently assessing plans and economics to
bring into production in 2017.
A A’

Click to edit Master title style
• Click to edit Master
text styles
– Second level
• Third level
– Fourth level
» Fifth level
• Click to edit Master
text styles
– Second level
• Third level
– Fourth level
» Fifth level
TSX:KLG 28 klgold.com
Organic Growth Opportunities
EXPLORATION PROGRAMS
Click to edit Master title style
• Click to edit Master
text styles
– Second level
• Third level
– Fourth level
» Fifth level
• Click to edit Master
text styles
– Second level
• Third level
– Fourth level
» Fifth level
TSX:KLG 29 klgold.com
Kirkland Lake Gold Camp
The Kirkland Lake gold
camp has been in
production for over 100
years
One of the highest grade
gold camps in the world
Almost 25 Moz’s has been
produced to date, from
seven mines
KLG owns five former
producing high grade
mines with historical
production of ~22 Moz’s of
gold
Average head grade of
15.1 g/t
Currently only mining and
exploration on one of these
past producers
Toburn

Click to edit Master title style
• Click to edit Master
text styles
– Second level
• Third level
– Fourth level
» Fifth level
• Click to edit Master
text styles
– Second level
• Third level
– Fourth level
» Fifth level
TSX:KLG 30 klgold.com
Regional Exploration Across a Prolific Trend
• Initial results from our regional program do not appear to be Main Break related (Phase 1)
• Geophysics anomalies identified and follow-up targeting exercise completed as part of Phase 1a
• Phase 1a program has 2 remaining holes in progress.
• Phase 2 will target the Main Break at depth and consist of infill drilling.
Kirkland
Minerals
See press release dated January 19, 2016, as filed on SEDAR

Click to edit Master title style
• Click to edit Master
text styles
– Second level
• Third level
– Fourth level
» Fifth level
• Click to edit Master
text styles
– Second level
• Third level
– Fourth level
» Fifth level
TSX:KLG 31 klgold.com
Plan View of SMC Drilling in Relation to Infrastructure

Click to edit Master title style
• Click to edit Master
text styles
– Second level
• Third level
– Fourth level
» Fifth level
• Click to edit Master
text styles
– Second level
• Third level
– Fourth level
» Fifth level
TSX:KLG 32 klgold.com
Underground Drilling Testing New Mineralization on the ‘04 Break

Click to edit Master title style
• Click to edit Master
text styles
– Second level
• Third level
– Fourth level
» Fifth level
• Click to edit Master
text styles
– Second level
• Third level
– Fourth level
» Fifth level
TSX:KLG 33 klgold.com
Regional Drilling – Section Looking East
SELECTED HIGHLIGHTS
AB-15-12
11.7 g/ 0.3 metres
0.34 opt/ 1.0 feet
AB-15-23 3,241.4 g/ 0.7 metres
94.54 opt/ 2.3 feet
11.7 g/ 0.3 metres
0.34 opt/ 1.0 feet
AB-15-53 12.3 g/ 0.5 metres
0.36 opt/ 1.7 feet
AB-15-91 646.3 g/ 0.9 metres
18.85 opt/ 2.8 feet
including 1,783.2 g/ 0.3 metres
52.01 opt/ 1.0 feet
And 89.5 g/ 0.3 metres
2.61 opt/ 1.0 feet
See press release dated November 3, 2015, as filed on SEDAR

Click to edit Master title style
• Click to edit Master
text styles
– Second level
• Third level
– Fourth level
» Fifth level
• Click to edit Master
text styles
– Second level
• Third level
– Fourth level
» Fifth level
TSX:KLG 34 klgold.com
Holt-Holloway Exploration Potential
Lightning
Smoke Deep Blacktop
Canamx
Deep Thunder
Ghost
Zone 4
Zone 6
Tousignant
Holt Property
Holloway Property Holloway West
(Harker) Lightval

Click to edit Master title style
• Click to edit Master
text styles
– Second level
• Third level
– Fourth level
» Fifth level
• Click to edit Master
text styles
– Second level
• Third level
– Fourth level
» Fifth level
TSX:KLG 35 klgold.com
Holt Exploration Targets
Tousignant Deposit
Zone 6
Zone 4
Mattawasaga Pits
Ghost Zone
Surface
2016 Exploration Targets
• Ongoing drilling from underground testing the westerly extension of Zone 4 from the 850m Level
• Once access and drill bay has been completed on the 435m Level, drilling will commence to test the westerly
extension of the Ghost Zone
• Surface drilling will commence in Q4 to test the Tousignant Deposit along strike to the west
1075m Level
925m Level
435m Level
Current drift
development
Long section view looking north
Zone 4 West Extension
500 m 1 km 0 2 km 3 km 1 km 1.5 km
TOUSIGNANT TARGET GHOST TARGET
ZONE 4 TARGET

Click to edit Master title style
• Click to edit Master
text styles
– Second level
• Third level
– Fourth level
» Fifth level
• Click to edit Master
text styles
– Second level
• Third level
– Fourth level
» Fifth level
TSX:KLG 36 klgold.com
Holloway Exploration Targets
Surface
Shaft Bottom
(867m)
Long section view looking north
SMOKE DEEP TARGET
(down plunge)
SMOKE DEEP (up-dip) &
BLACKTOP (west extension)
TARGET
HOLLOWAY NORTH
TARGET
500 m 1 km 3 km
2016 Exploration Targets
• Smoke Deep Targets are testing for the extension of the Smoke Deep Zone mineralization down plunge and
to the east, as well as the up-dip component above the 550m Level drift.
• Holloway North Target is testing for mineralization on the PDFZ higher-up in elevation
• Deep Thunder Target following up along strike of previous drilling, further to the east
DEEP THUNDER
TARGET
(along strike)
Click to edit Master title style
• Click to edit Master
text styles
– Second level
• Third level
– Fourth level
» Fifth level
• Click to edit Master
text styles
– Second level
• Third level
– Fourth level
» Fifth level
TSX:KLG 37 klgold.com
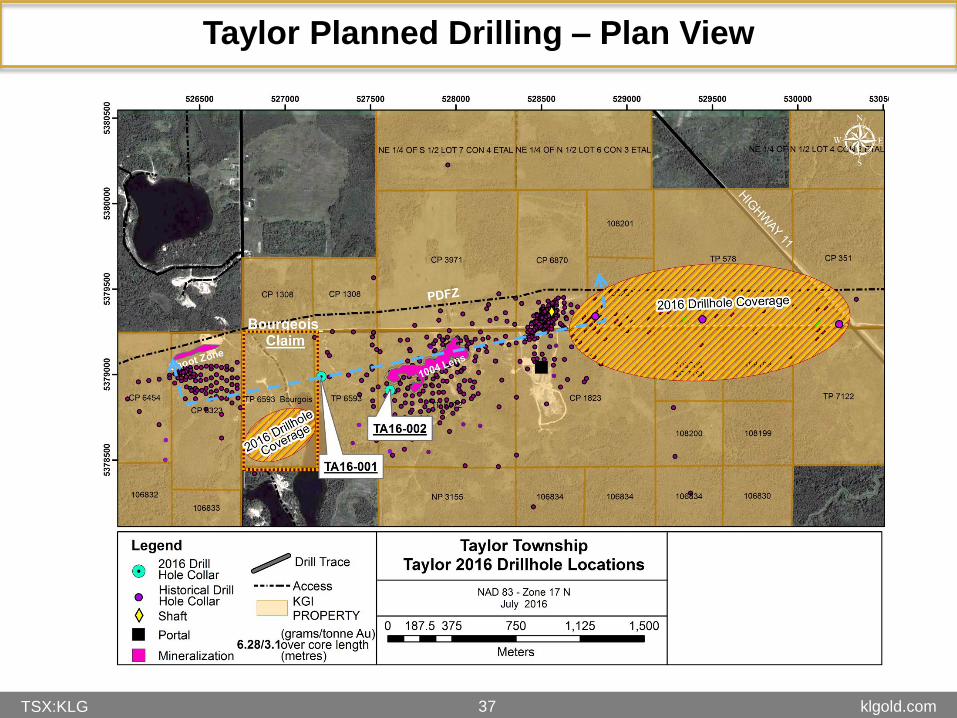
Taylor Planned Drilling – Plan View

Click to edit Master title style
• Click to edit Master
text styles
– Second level
• Third level
– Fourth level
» Fifth level
• Click to edit Master
text styles
– Second level
• Third level
– Fourth level
» Fifth level
TSX:KLG 38 klgold.com
Taylor Mine Exploration Targets – Long Section
Long Section Looking North
West Porphyry Zone (WPZ)
Indicated 248 koz
1.63M tonnes @ 4.7 g/t
Inferred 251 koz
1.86M tonnes @ 4.2 g/t
surface

Click to edit Master title style
• Click to edit Master
text styles
– Second level
• Third level
– Fourth level
» Fifth level
• Click to edit Master
text styles
– Second level
• Third level
– Fourth level
» Fifth level
TSX:KLG 39 klgold.com
Q2 2016 Financial Results
For the three and six months ended June 30, 2016
All amounts are in C$ unless otherwise stated. Q2 2016 H1 2016 C
OS
TS
Operating Cost (per tonne milled) 1 $208 $234
Operating Cost (per ounce sold) 1 US$667 2 US$641 2
All-In Sustaining Costs (per ounce sold) 1 US$990 2 US$925 2
SA
LES
an
d
PR
OFIT
S
Gold Sales (ounces) 72,144 141,453
Average Realized Sales Price 1 US$1,271 2 US$1,211 2
Revenue (millions) $118M $228M
Income Before Taxes (millions) $22.0M $41.9M
Earnings Per Share $0.12 $0.24
CA
SH
FLO
W
Free Cash Flow (millions) 1 $39.1M $57.3M
Cash and Cash Equivalents (millions) - $157.5M
1 AISC costs per ounce sold is a non-GAAP performance measures. While it is a common performance measures in the mining industry it does not have any
standardized meaning. The Company provides a reconciliation of its non-GAAP performance measures in its most recent Management Discussion & Analysis (“MD&A”),
for the period ended December 31, 2015. 2 Average USD:CAD exchange rate for each period

Click to edit Master title style
• Click to edit Master
text styles
– Second level
• Third level
– Fourth level
» Fifth level
• Click to edit Master
text styles
– Second level
• Third level
– Fourth level
» Fifth level
TSX:KLG 40 klgold.com
SMC Drilling on the South Claims

Click to edit Master title style
• Click to edit Master
text styles
– Second level
• Third level
– Fourth level
» Fifth level
• Click to edit Master
text styles
– Second level
• Third level
– Fourth level
» Fifth level
TSX:KLG 41 klgold.com
‘04 Break Drilling Results

Click to edit Master title style
• Click to edit Master
text styles
– Second level
• Third level
– Fourth level
» Fifth level
• Click to edit Master
text styles
– Second level
• Third level
– Fourth level
» Fifth level
TSX:KLG 42 klgold.com
Mineral Reserve Estimates
Resources are exclusive of Reserves
As at December 31, 2014
PROVEN PROBABLE PROVEN & PROBABLE
RESERVE AREA (Project/Mine) Tonnes Grade Ounces Tonnes Grade Ounces Tonnes Grade Ounces
000's g/t 000's 000's g/t 000's 000's g/t 000's
04 & Main Break
494 14.7 236 529 16.5 278 1,023 15.8 514
South Mine Complex (SMC)
314 17.5 177 1,016 23.7 773 1,330 22.3 949
MACASSA MINE COMPLEX
808 15.8 412 1,545 21.3 1,051 2,354 19.2 1,463
Property Wide Targets
-
-
-
-
-
-
-
- -
Kirkland Lake Properties 808 15.8 412 1,545 21.3 1,051 2,354 19.2 1,463
Holt Mine
1,452 4.3 199 2,414 5.1 392
3,866 4.8 591
Holloway Mine
-
-
- 233 5.4 40
233 5.4 40
Taylor Mine
-
-
- 774 6.3 156
774 6.3 156
HOLT MINE COMPLEX 1,452 4.3 199 3,421 5.4 588
4,873 5.1 787
Hislop Mine
-
-
- 280 5.2 46 280 5.2 46
PDFZ Properties 1,452 4.3 199 3,701 5.4 634 5,153 5.0 833
TOTAL RESERVES (Company Wide) 2,260 8.4 611 5,246 10.0 1,685 7,507 9.6 2,296

Click to edit Master title style
• Click to edit Master
text styles
– Second level
• Third level
– Fourth level
» Fifth level
• Click to edit Master
text styles
– Second level
• Third level
– Fourth level
» Fifth level
TSX:KLG 43 klgold.com
Mineral Resource Estimates
Resources are exclusive of Reserves
As at December 31, 2014
MEASURED INDICATED MEASURED & INDICATED INFERRED
RESOURCE AREA (Project) Tonnes Grade Ounces Tonnes Grade Ounces Tonnes Grade Ounces Tonnes Grade Ounces
000's g/t 000's
000's g/t 000's
000's g/t 000's
000's g/t 000's
04 & Main Break 964 13.7 430 1,042 14.4 483 2,006 14.1 913 440 14.1 201
South Mine Complex (SMC) 30 12.7 12 1,249 23.0 917 1,279 22.6 929 1,232 22.3 876
MACASSA MINE COMPLEX
994 13.7 442 2,290 18.9 1,400 3,285 17.4 1,842 1,671 20.2 1,077
Property Wide Targets
9 17.1 5 518 12.0 200 527 12.0 203 246 12.7 100
Kirkland Lake Properties
1,003 13.7 447 2,809 17.8 1,599 3,812 16.8 2,047 1,917 19.2 1,177
Holt 3,702 4.0 473 3,861 3.9 485 7,563 3.9 957 7,866 4.7 1,181
Holloway
310 4.7 47 482 4.5 70 792 4.6 117 2,479 4.9 389
Taylor - - - 2,323 4.8 356 2,323 4.8 356 1,951 4.1 257
HOLT MINE COMPLEX
4,012 4.1 520 6,666 4.3 911 10,678 4.1 1,430 12,296 4.6 1,827
Hislop
-
- - 983 4.0 127 983 4.0 127 690 4.2 92
Aquarius - - - 22,300 1.3 926 22,300 1.3 926 9 0.8 N/A
Ludgate - - - 522 4.1 68 522 4.1 68 1,396 3.6 162
Canamax - - - 240 5.1 39 240 5.1 39 170 4.3 23
Clavos (40%) - - - 503 4.8 78 503 4.8 78 318 4.5 48
PDFZ Properties
4,012 4.1 520 31,214 2.1 2,149 35,226 2.4 2,668 14,879 4.6 2,152
TOTAL RESERVES (Company Wide) 5,015 6.0 967 33,803 3.4 3,748 39,038 3.7 4,715 16,796 6.2 3,329
Click to edit Master title style
• Click to edit Master
text styles
– Second level
• Third level
– Fourth level
» Fifth level
• Click to edit Master
text styles
– Second level
• Third level
– Fourth level
» Fifth level
TSX:KLG 44 klgold.com
Notes and Disclosure for Mineral Reserves & Resources
Notes:
• Rows and columns may not add due to rounding
• Property Wide resources under Kirkland Lake Properties include the ’04 & Main Break, SMC, Near Surface Target, as well as
peripheral resources blocks (such as the Lakeshore Ramp).
• The reserve and resource estimates for the Kirkland Lake Properties have been audited and verified, and the technical disclosure in
the press release dated April 13, 2015, has been approved, by the Company’s independent reserve and resource engineer, Glenn
R. Clark, P. Eng., of Glenn R. Clark & Associates Limited. Mr. Clark is a ‘qualified person’ under National Instrument 43-101,
Standards of Disclosure for Mineral Projects, of the Canadian Securities Administrators. The report detailing the December 31,
2014, reserve and resource estimates is available on SEDAR (www.sedar.com). See ‘Notes for Reserves and Resources’ below for
key assumptions, parameters and methods used to estimate the foregoing reserves and resources, available on the Company
website at www.klgold.com..
• NI 43-101 Disclosure for the PDFZ Properties (formerly the St Andrew Goldfields Ltd., properties) is included in the Annual
Information Form dated March 27, 2015, available under the St Andrew Goldfields Ltd., profile on www.sedar.com, and references
the various technical reports for each project also available on www.sedar.com.
• The QP’s for the mineral reserves and resources outlined under the PDFZ Properties are Doug Cater P.Geo, and Keyvan Salehi
P.Eng., the VP Exploration and VP Corporate Development and Technical Services of St Andrew Goldfields Ltd., and not
considered independent under NI 43-101