
Click to edit Master - satcowealth.com
26
Transcript of Click to edit Master - satcowealth.com


Click to edit Master title style
Click to edit Master subtitle style

Click to edit Master title style
Click to edit Master subtitle style

24.45%Compounded
Annual Returns (CAGR)
630%Since Inception in 2012
Consistently outperformed Nifty 500 by an average of
1100 bps over the last 9 years
Rs.1 cr invested with the strategy on 1st Jan, 2012 would be worth Rs. 7.3 crs today (on a net fee basis)

Click to edit Master title style
Click to edit Master subtitle style

Click to edit Master title style
Click to edit Master subtitle style

Click to edit Master title style
Click to edit Master subtitle style
HIGH GROWTH HIGH RETURNS
Source: Accord Fintech; AQF Advisors

Click to edit Master title style
Click to edit Master subtitle style
Top-down approach focuses on macro economic trends & moves down to identifying sectors and companies.
In Bottom up the focus is on identifying a company on the basis of its growth prospects
and other individual indicators of performance over time.

MACROECONOMIC THEMES
The China factor
Rural Consumption
• Chinese employee cost, effluenttreatment cost & environmental taxhave risen substantially.
• Globally, companies are looking awayfrom China to derisk supply chains.Make in India a real possibility
• The current administration’s objective todouble farmer incomes
• Structural reforms (e.g. APMC openaccess, MSP) can unlock agri potential;
• Govt directed spending (MNREGA, DBT,Jan Dhan) & social welfare schemes.
• Good monsoon, high reservoir levels toresult in better purchasing capacity inhouseholds.
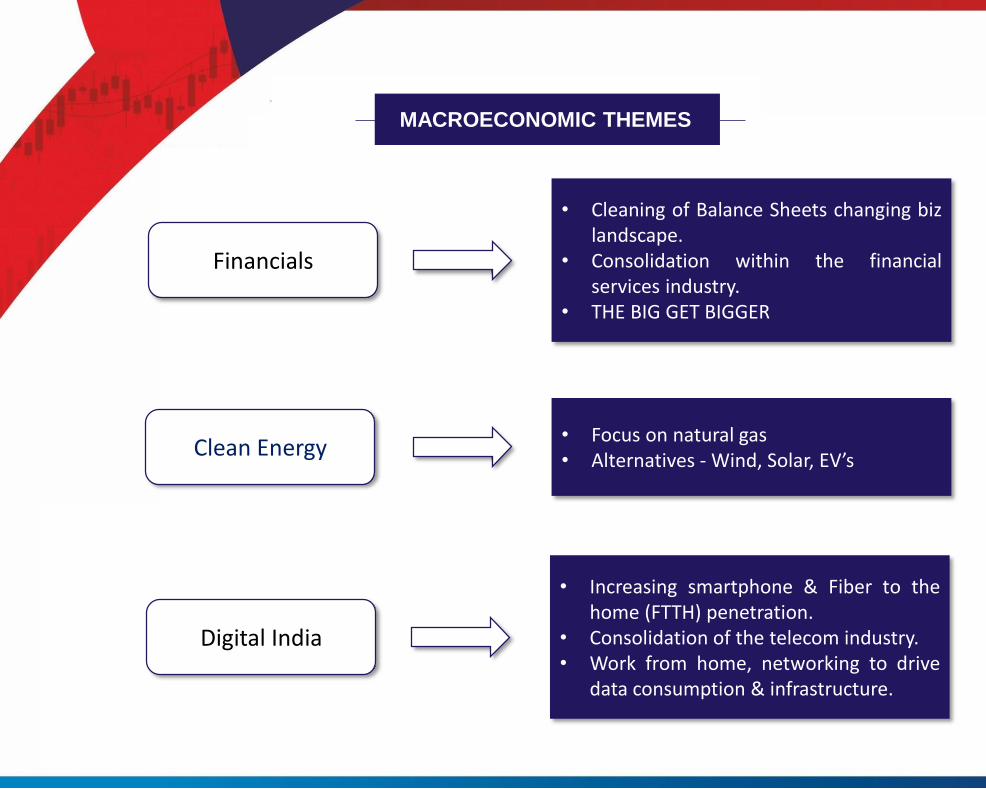
Financials
Clean Energy
• Cleaning of Balance Sheets changing bizlandscape.
• Consolidation within the financialservices industry.
• THE BIG GET BIGGER
• Focus on natural gas• Alternatives - Wind, Solar, EV’s
Digital India
• Increasing smartphone & Fiber to thehome (FTTH) penetration.
• Consolidation of the telecom industry.• Work from home, networking to drive
data consumption & infrastructure.
MACROECONOMIC THEMES

Click to edit Master title style
Click to edit Master subtitle style
High VisibilityPotential companies should
present high top line & bottom line growth visibility
Capital EfficiencyIncrementally improving ROCE
ValuationPEG, EV/EBITDA, P/BV
Profit GrowthCompanies which have exhibited more than 18% YoYprofit growth is the last quarter.
Quality of GrowthSequential improvement in margins & terms of trade(Working Capital less than 100 days)
Free CashFuture free cash visibility
CNX 500 is our benchmark. 90% of the portfolio companies would be from the CNX 500 universe.
STOCK SCREENING METHODOLOGY

Market
Capitalisation
No of
companiesPAT Growth
Marketcap
GrowthRatio
Large Cap 22 209% 226% 1.08
Mid Cap 35 223% 268% 1.20
Small Cap 41 192% 236% 1.23
We have considered those companies in the CNX500 for which the earnings have doubledover a 4 year period between CY15 and CY19, and the corresponding jump in marketcapitalisation.
Source:AQF Advisors Research, Accord Fintech
THE EARNINGS DOUBLING EFFECT

Click to edit Master title style
Click to edit Master subtitle style
Apollo Tricoat,Granules India
Vaibhav Global, SBI Life Insurance
Bajaj Finserv, HDFC Bank , Kotak Bank
Indraprastha Gas, Gujarat Gas,
Deepak Nitrate,
Vaibhav Global, Dhanuka Agritech-
Buyback

Click to edit Master title style
Click to edit Master subtitle style

STOCK EXIT TRIGGERS
Slowing profit growth
Worsening business and industry fundamentals
Corporate governance issues
25% stop loss is triggered
Euphoric valuations

Click to edit Master title style
Click to edit Master subtitle style
PERFORMANCE OF PORTFOLIO HOLDINGS IN THE LAST QUARTER (3Q FY21)
Dec-19 Dec-20 Dec-19 Dec-20 Dec-19 Dec-20
Company Name Net
Revenue
Net
Revenue
Growth Operating
Profit
Operating
Profit
Growth Consolidat
ed
Earnings
Consolidat
ed
Earnings
Growth
ABB Power Ltd* 1015.0 915.0 -9.9% 104.0 97.0 -6.7% 69.0 5.0 -92.8%
Abbott India Ltd. 1078.0 1095.0 1.6% 240.0 242.0 0.8% 187.0 177.0 -5.3%
APL Apollo Tubes Ltd. 2040.0 2500.0 22.5% 161.0 232.0 44.1% 74.0 132.0 78.4%
Bharti Airtel Ltd. 21344.0 26518.0 24.2% 8716.0 12053.0 38.3% -1035.0 854.0
Deepak Nitrite Ltd. 1120.0 1235.0 10.3% 258.0 335.0 29.8% 157.0 217.0 38.2%
Dhanuka Agritech Ltd. 271.0 296.0 9.2% 34.0 50.0 47.1% 28.0 40.0 42.9%
GMM Pfaudler Ltd. 156.0 202.0 29.5% 30.0 42.0 40.0% 21.0 23.0 9.5%
Granules India Ltd. 704.0 845.0 20.0% 163.0 212.0 30.1% 64.0 147.0 129.7%
Gujarat Gas Ltd. 2564.0 2886.0 12.6% 371.0 615.0 65.8% 197.0 392.0 99.0%
HCL Technologies Ltd. 18135.0 19302.0 6.4% 4629.0 5624.0 21.5% 2944.0 3969.0 34.8%
Indraprastha Gas Ltd. 1837.0 1595.0 -13.2% 392.0 501.0 27.8% 297.0 382.0 28.6%
IOL CP Ltd. 511.0 513.0 0.4% 160.0 157.0 -1.9% 98.0 115.0 17.3%
JB Chem Ltd. 429.0 548.0 27.7% 90.0 171.0 90.0% 66.0 154.0 133.3%
Kotak Mahindra Bank Ltd. 8332.0 8280.0 -0.6% -1848.0 -2426.0 31.3% 2349.0 2602.0 10.8%
Polycab India Ltd. 2507.0 2799.0 11.6% 339.0 376.0 10.9% 219.0 263.0 20.1%
Vaibhav Global Ltd. 563.0 725.0 28.8% 88.0 123.0 39.8% 66.0 92.0 39.4%
Average
performance 11.3% 31.8% 38.9%
*ABB Power Ltd performance is for 2QFY21; results not declared as of this presentation date

Click to edit Master title style
Click to edit Master subtitle style
Dec-19 Dec-20 Dec-19 Dec-20
Company Name Net Interest
Income/Net
Premium
Net Interest
Income/Net
Premium
Growth Consolidated
Earnings
Consolidated
Earnings
Growth
Bajaj Finserv Ltd. 14560.7 15960.7 9.6% 1125.6 1290.0 14.6%
Bandhan Bank Ltd. 1540.3 2071.7 34.5% 731.0 632.6 -13.5%
HDFC Bank Ltd. 14173.0 16318.0 15.1% 7416.0 8758.0 18.1%
HDFC Ltd. 11265.7 11707.0 3.9% 2908.0 3694.0 27.0%
ICICI Bank Ltd. 8545.0 9912.0 16.0% 4145.0 4940.0 19.2%
Kotak Mahindra Bank Ltd. 3430.0 4007.0 16.8% 1596.0 1853.0 16.1%
SBI Life Insurance Company Ltd. 11694.5 13766.5 17.7% 389.8 232.9 -40.3%
Average performance 16.2% 5.9%
*HDFC Ltd net revenue and earnings for 3QFY21 normalised to improve comparability on a yoy basis.
Performance of portfolio holdings in the last quarter (3Q FY21)-Banks/NBFCs

SATCO GROWTH & MOMENTUM
FUND STRATERGY
PMS Quarter Performance vis-a-vis Benchmark
Calendar Year Q1 Q2 Q3 Q4
2020PMS% -22.3% 24.9% 20.9% 21.3%
Benchmark % -29.1% 21.1% 10.2% 23.3%
2019PMS% 4.4% -0.4% -2.5% 10.2%
Benchmark % 5.4% -0.1% -3.3% 5.7%
2018PMS% -9.9% -0.1% -7.4% -1.6%
Benchmark % -6.1% 2.8% -0.5% 0.6%
2017PMS% 17.9% 8.8% 11.9% 9.8%
Benchmark % 14.5% 4.2% 3.2% 10.4%
2016PMS% -9.2% 16.9% 12.6% -2.4%
Benchmark % -4.1% 8.2% 5.9% -5.6%
2015PMS% 8.4% 1.2% 4.2% 10.3%
Benchmark % 3.0% -1.2% -3.6% 1.2%
2014PMS% 7.4% 34.1% 26.2% 13.7%
Benchmark % 6.3% 18.2% 3.9% 5.6%
2013PMS% -6.6% 3.5% 0.7% 34.2%
Benchmark % -6.4% 1.6% -2.6% 11.9%
2012PMS% 16.5% -1.1% 9.3% 7.3%
Benchmark % 17.3% -1.2% 8.0% 5.3%

Click to edit Master title style
Click to edit Master subtitle style
TOP 5 STOCKS FROM OUR PORTFOLIO
Scheme: Security Wt %
VAIBHAV GLOBAL LTD 6.0%
POLYCAB INDIA LIMITED 5.1%
BHARTI AIRTEL LTD. 4.7%
ICICI BANK LTD. 4.7%
GUJARAT GAS LIMITED 4.7%

(Jan 2021) ₹ 8723
603 %
Alt is one of the first domestic com
(Oct 2019) ₹298
₹177 (May 2019)
panies to use the Galvant process corrosive protection & longer life.providing a better product & earns
one of the largest domestic ERW pipe
tion to promote volume growth.
manufacture steel pipes; better anti
The company has positioned itself as higher margins than its peer.
Strong parentage-APL Apollo Tubes; manufacturing companies.Strong focus on branding & distribu
- Indraprastha Gas Ltd. (Present)
Indraprastha Gas Ltd. performance
326%
(28 Dec 2020) ₹451
Accord Fintech, NSE
68%
(Jan 2021) ₹ 516
352 %

Click to edit Master title style
Click to edit Master subtitle style
- IOL Chemicals &
Pharmaceuticals
Apollo Tricoat performance
Value Addition
(Jan 2021) ₹ 930
425%
Accord Fintech, NSE
₹177 (May 2019)
Alt is one of the first domestic companies to use the Galvant process manufacture steel pipes; better anti corrosive protection & longer life.
The company has positioned itself as providing a better product & earns higher margins than its peer.
Strong parentage-APL Apollo Tubes; one of the largest domestic ERW pipe manufacturing companies.Strong focus on branding & distribution to promote volume growth.
-SunteckRealty- ApolloTricoat (Present)
(Oct 2019) ₹8134
556%
Accord Fintech, NSE
₹233 (Mar 2020)
(Jan 2021) ₹ 677
191%
Accord Fintech, NSE
- IOL Chemicals &
Pharmaceuticals
IOL Chemicals & Pharmaceuticals performance
IOL CP is the largest manufacturer globally of Ibuprofen API (>30% market
share). The company is also among the lowest
cost producers, and most capital efficient among peers.
The company is fully backward integrated for key supply material
IBB; this ensures better control over gross margins and sourcing.
Consistent Excellence and Value Addition IOL Chemicals & Pharmaceuticals performance

- IOL Chemicals &
Pharmaceuticals
Gujarat Gas Ltd performance
Policy Momentum
(Jan 2021) ₹ 370
108%
Accord Fintech, NSE
₹178 (Aug 2019)
• Government initiative to replace coal gasifier powered energy with natural gas in industrial sectors-Morbi
• Price advantage when compared with alternate fuels-petrol, diesel, and industrial fuels
• GGL has been allotted 7 GAs in the previous 2 bidding rounds; visibility on volume growth
-SunteckRealty- Gujarat Gas Ltd (Present)
(Oct 2019) ₹8134
556%
Accord Fintech, NSE
₹104 (Sep 2018)
(Jan 2021) ₹ 337
223%
Accord Fintech, NSE
Consistent Excellence and Value Addition Granules India performance
- Granules India (Present)
• Granules India has been consistently improving operational efficiency in the core bulk drugs segment.
• The company has been moving up the value curve from an API manufacturer to formulations, where the profitability is higher. Revenue share from formulations has increased from 39% in FY18 to 52% in FY20.
• GIL generated Rs.264 crs free cash flow in FY20; FC was negative in the previous 2 financial years.

Click to edit Master title style
Click to edit Master subtitle style
-United Phosphorus
68%
- Deepak Nitrite (Present)
Deepak Nitrite performance
(Sep 2020) ₹387
239%
Vaibhav Global performance
ValueAddition
(Sep 2020) ₹595
236%
Accord Fintech, NSE
₹177 (May 2019)
Alt is one of the first domestic companies to use the Galvant process manufacture steel pipes; better anti corrosive protection & longer life.
The company has positioned itself as providing a better product & earns higher margins than its peer.
Strong parentage-APL Apollo Tubes; one of the largest domestic ERW pipe manufacturingcompanies.Strong focus on branding & distribution to promote volume growth.
-SunteckRealty- Vaibhav Global (Present)
Consistent Excellence and Value AdditionConsistent Excellence and Value Addition
(Jan 2021) ₹972
288%
Accord Fintech, NSE
₹250 (Apr 2019)
Deepak Nitrite is a leading bulk and specialty chemical manufacturer in India.
Growth in the business has been led by a change in in focus of the management to move from commodity chemicals to high value specialty chemicals.
Recently commissioned a new phenol & pharma grade acetone manufacturing unit and now focusing on downstream products like IPA, which is a pharma intermediate and also used in sanitizers.
The management is focused on import substitution and high value downstream products for its long term strategy.
Large market-low penetration
(Jan 2021) ₹2597
268%
Accord Fintech, NSE
₹706 (Dec 2019)
VGL is competitively placed in a large and growing sub $25 artificial jewellery market in the US & UK.
It is completely integrated from globally sourcing gems to selling under its own brand name in US & UK on its shopping channel on TV and streaming over the web.
Ventured onto e commerce marketplaces like Amazon.
Significant benefits of scale and operating leverage.
Ventured into new lifestyle products, sold through the existing platform to increase their wallet share of the customers.

OUR PAST WINNERS
Companies GenreWhen
Purchased
AvgPurchase
Price
AvgSelling Price
Returns
APL Apollo Tubes Climbing the Value Curve Jun-15 412 1979 380%
Granules India Climbing the Value Curve Jan-14 22 105 375%
PI Industries Consistent Excellence Jan-12 93 400 330%
Alembic Pharma Corporate Action May-12 52 290 458%
Symphony Large Market Low Penetration Feb-14 480 1950 306%
Bajaj Finance Consistent Excellence May-12 861 4000 365%
HCL Technologies Consistent Excellence Jan-12 495 1550 213%
Indo Count Industries Climbing the Value Curve Dec-14 276 1099 298%
Vaibhav Global Large Market Low Penetration Nov-12 112 650 480%
UPL Consistent Excellence Jul-13 98 453 362%

Click to edit Master title style
Click to edit Master subtitle style
50

Click to edit Master title style
Click to edit Master subtitle style