
Click here to add image Global Trends and Swing Factors ...
42
Click here to add image Click here to add image Global Trends and Swing Factors And their impact on the agricultural complex
Transcript of Click here to add image Global Trends and Swing Factors ...
Click here to add imageClick here to add image
Global Trends and Swing Factors
And their impact on the agricultural complex
Introduction
2
I'm speaking today and tomorrow in Iowa for the IA Farm Bureau and I followed Sterling Liddell who gave a long range outlook. Super presentation. He has all the flamboyant showmanship of an economist, but still strangely likable.
John PhippsAgricultural Columnist
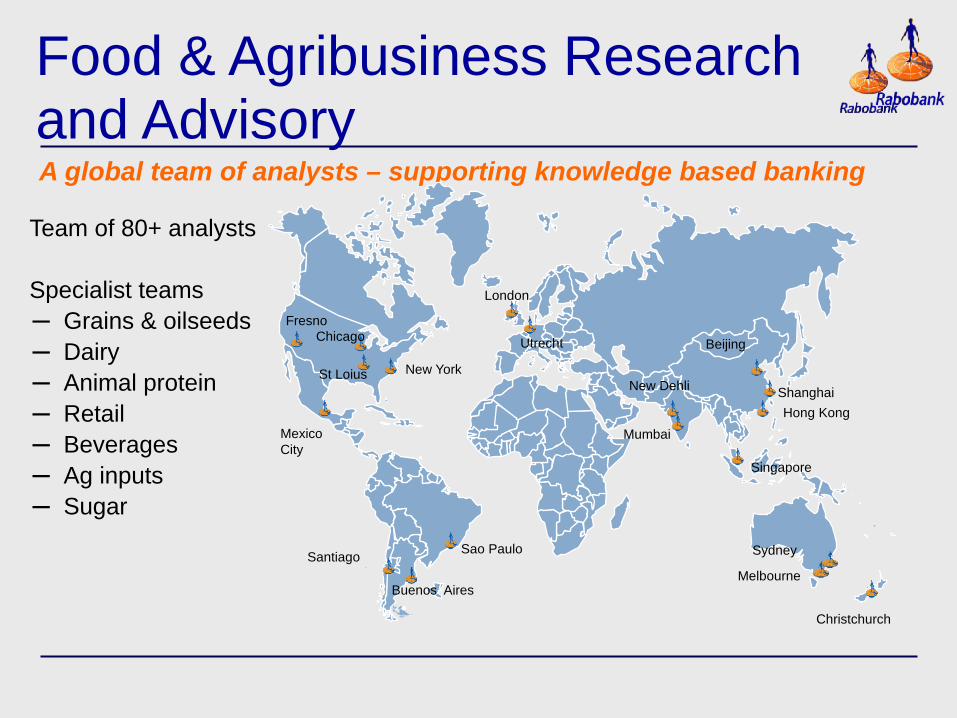
Food & Agribusiness Research and AdvisoryA global team of analysts – supporting knowledge based banking
Christchurch
Mexico City
New York
Sao Paulo
Mumbai
Melbourne
Utrecht
Shanghai
Buenos Aires
Fresno
Team of 80+ analysts
Specialist teams− Grains & oilseeds− Dairy− Animal protein− Retail− Beverages− Ag inputs− Sugar
London
Chicago
St Loius
Sydney
Singapore
Hong Kong
Beijing
Santiago
New Dehli

Click here to add image
Macro Conditions
Recipe for our Economic Perfect Storm: Lower Interest Rates
6Rabobank InternationalMarket Developments & Outlook
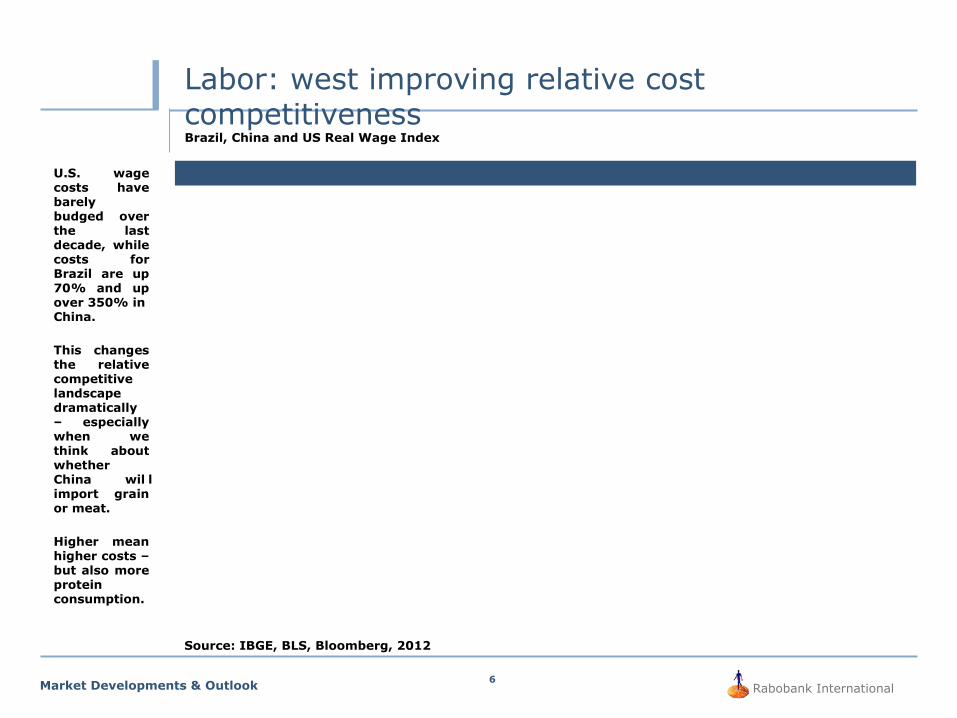
U.S. wage costs have barely budged over the last decade, while costs for Brazil are up 70% and up over 350% in China.
This changes the relative competitive landscape dramatically – especially when we think about whether China wil l import grain or meat.
Higher mean higher costs – but also more protein consumption.
Brazil, China and US Real Wage Index
Source: IBGE, BLS, Bloomberg, 2012
Labor: west improving relative cost competitiveness

7Rabobank InternationalMarket Developments & Outlook
Sovereign Debt Interest Rates - US and Brazil
Source: Bloomberg, 2012
Cost of capital: Big advantage vs. Brazil other developing economies
8
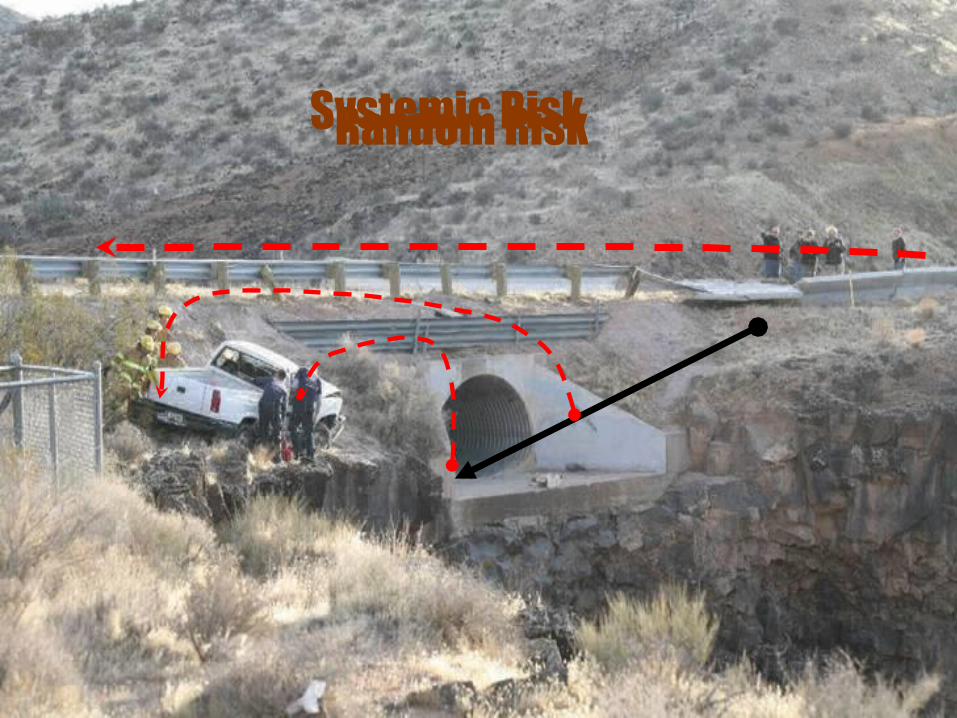
Systemic RiskRandom Risk

$0.00
$1.00
$2.00
$3.00
$4.00
$5.00
$6.001950 1952 1954 1956 1958 1960 1962 1964 1966 1968 1970 1972 1974 1976 1978 1980 1982 1984 1986 1988 1990 1992 1994 1996 1998 2000 2002 2004 2006 2008 2010
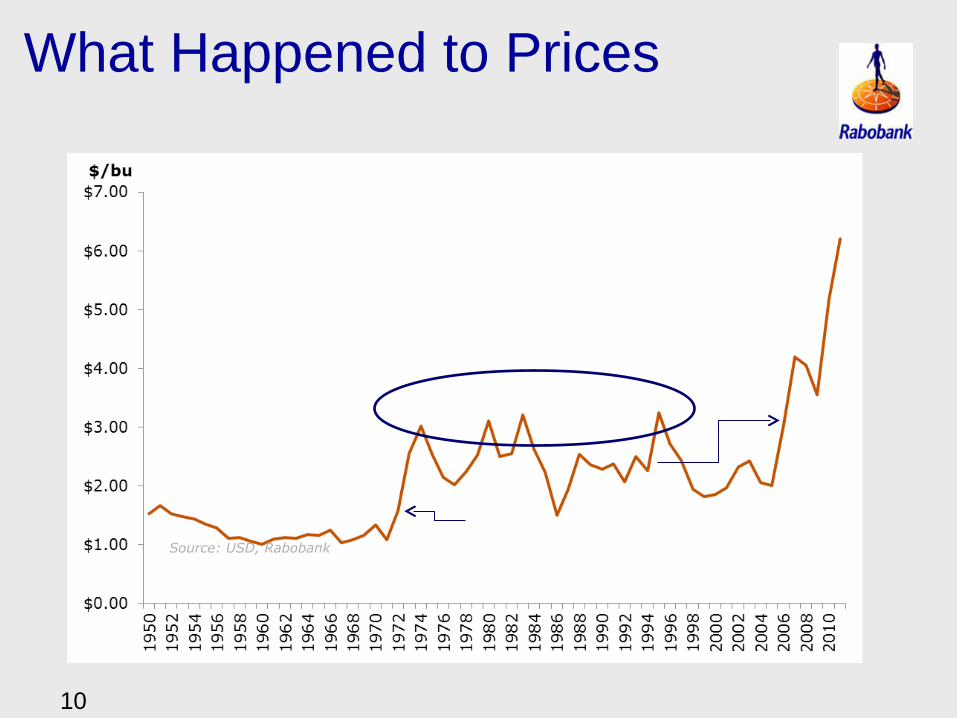
Dollars/Bushel
Corn Price per Unit Average Corn Price
What Happened to Prices
10
Source: USD, Rabobank
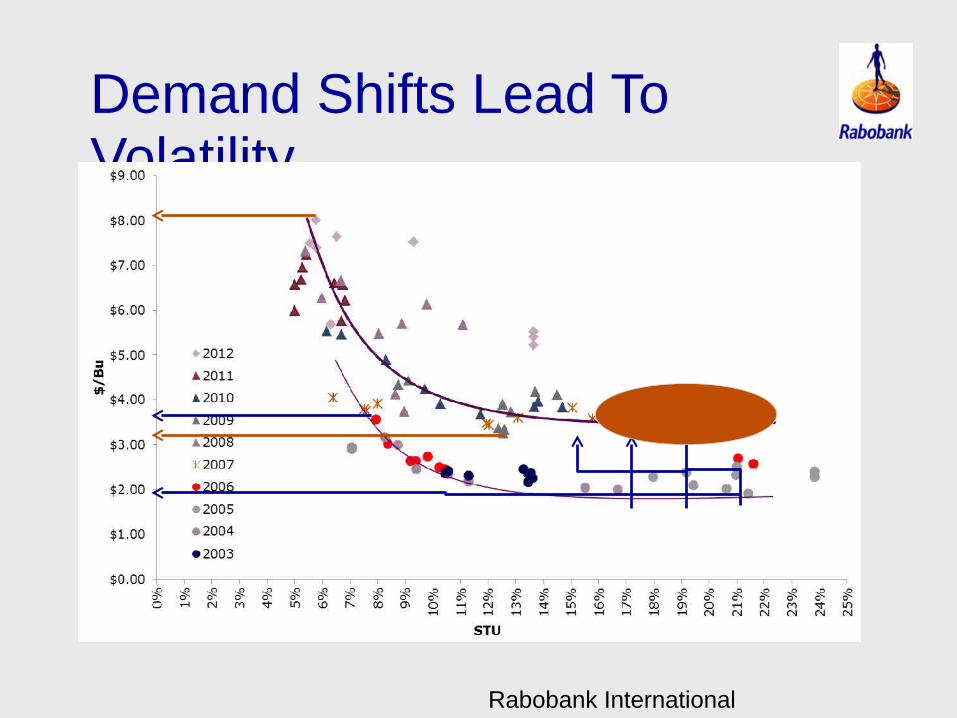
Demand Shifts Lead To Volatility
Rabobank International

Click here to add image
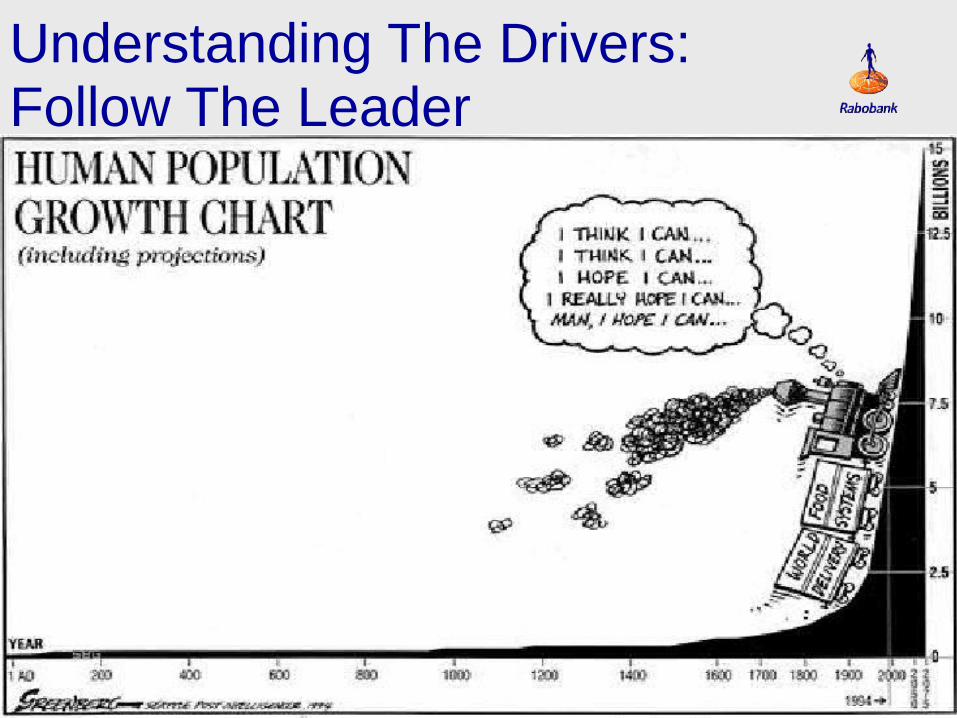
Understanding The Drivers:

Ethanol Reversing Grain FlowsUS corn used for ethanol has increased by roughly 100MMT since 2005, while world grain demand has risen by about 300MMT.
Biodiesel is a factor as well. World demand for vegetable oil is growing by about 5 million tons per year. About 2 of that, or 40%, has been going to feed biodiesel demand.
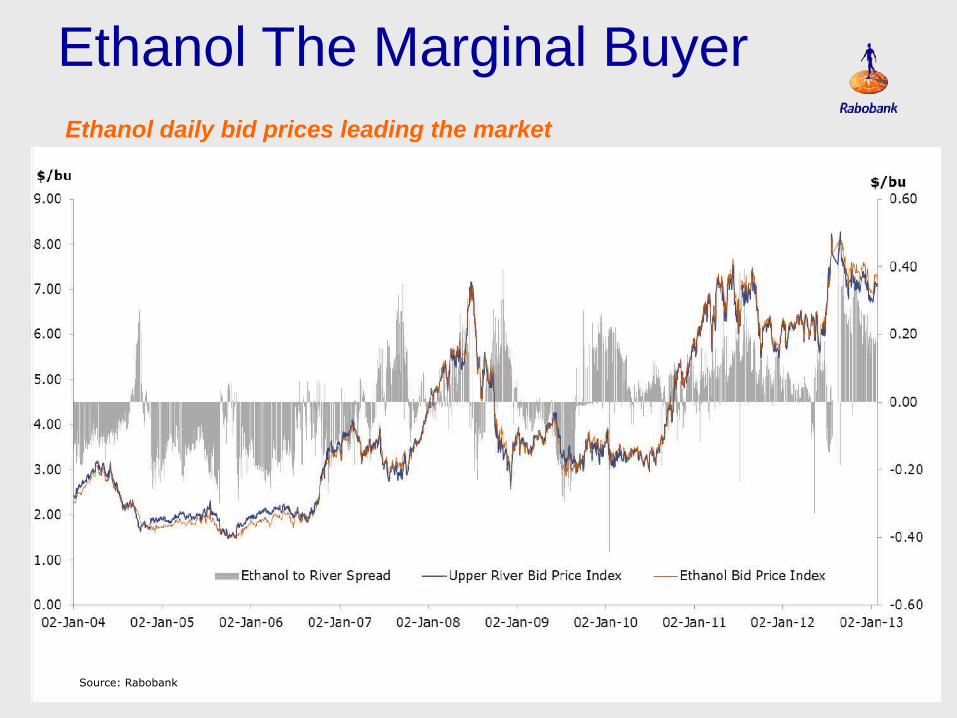
Ethanol daily bid prices leading the market
Ethanol The Marginal Buyer
Source: Rabobank
Click here to add image
Understanding The Drivers: Follow The Leader
16Rabobank InternationalMarket Developments & Outlook
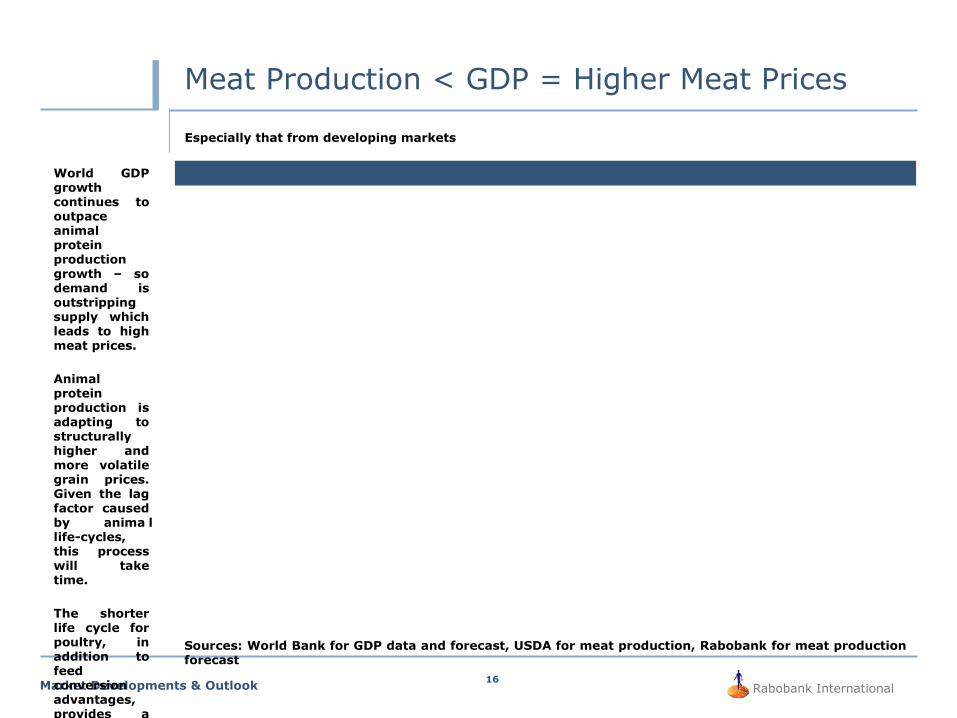
World GDP growth continues to outpace animal protein production growth – so demand is outstripping supply which leads to high meat prices.
Animal protein production is adapting to structurally higher and more volatile grain prices. Given the lag factor caused by anima l life-cycles, this process will take time.
The shorter life cycle for poultry, in addition to feed conversion advantages, provides a relative advantage to other proteins.
Especially that from developing markets
Sources: World Bank for GDP data and forecast, USDA for meat production, Rabobank for meat production forecast
Meat Production < GDP = Higher Meat Prices
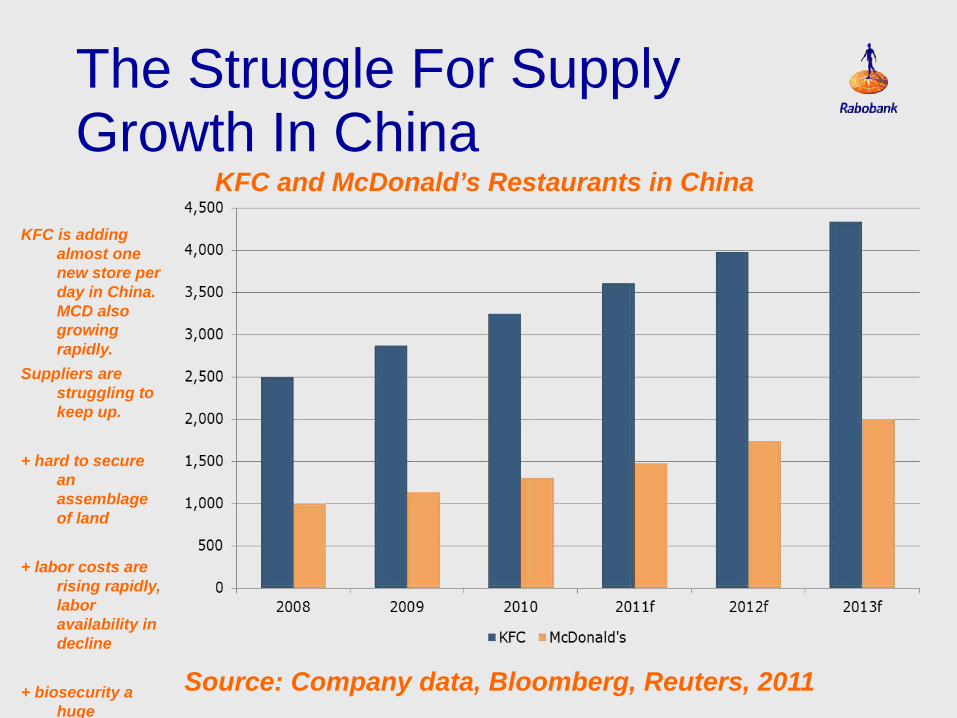
The Struggle For Supply Growth In China
KFC is adding almost one new store per day in China. MCD also growing rapidly.
Suppliers are struggling to keep up.
+ hard to secure an assemblage of land
+ labor costs are rising rapidly, labor availability in decline
+ biosecurity a huge challenge (disease, antibiotics)
+ these chains only use about 20% of the bird
KFC and McDonald’s Restaurants in China
Source: Company data, Bloomberg, Reuters, 2011
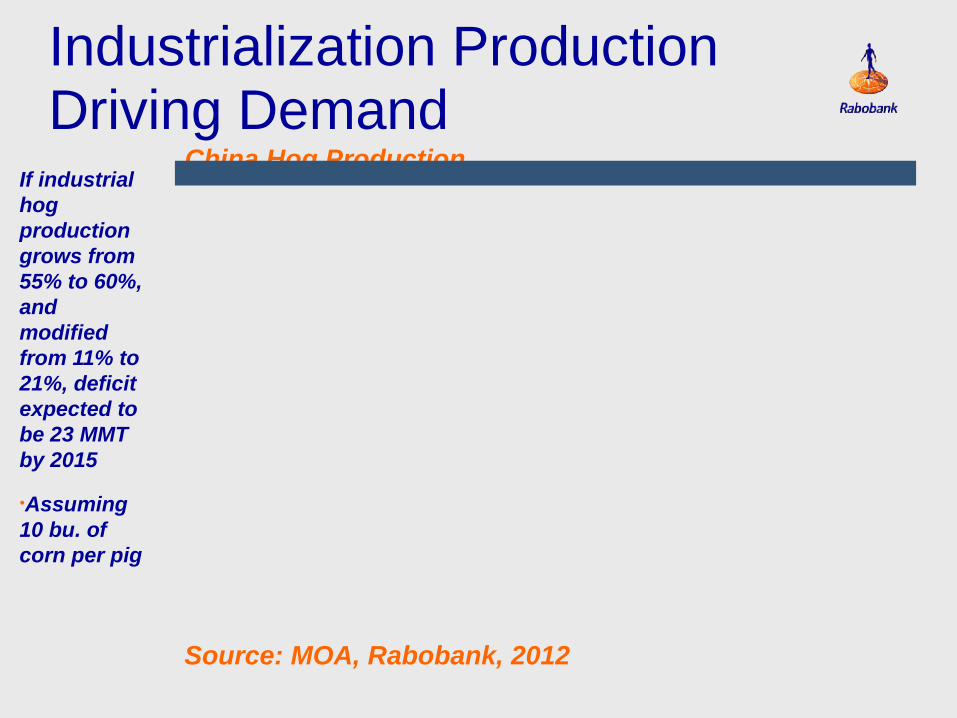
If industrial hog production grows from 55% to 60%, and modified from 11% to 21%, deficit expected to be 23 MMT by 2015
•Assuming 10 bu. of corn per pig
China Hog Production
Source: MOA, Rabobank, 2012
Industrialization Production Driving Demand
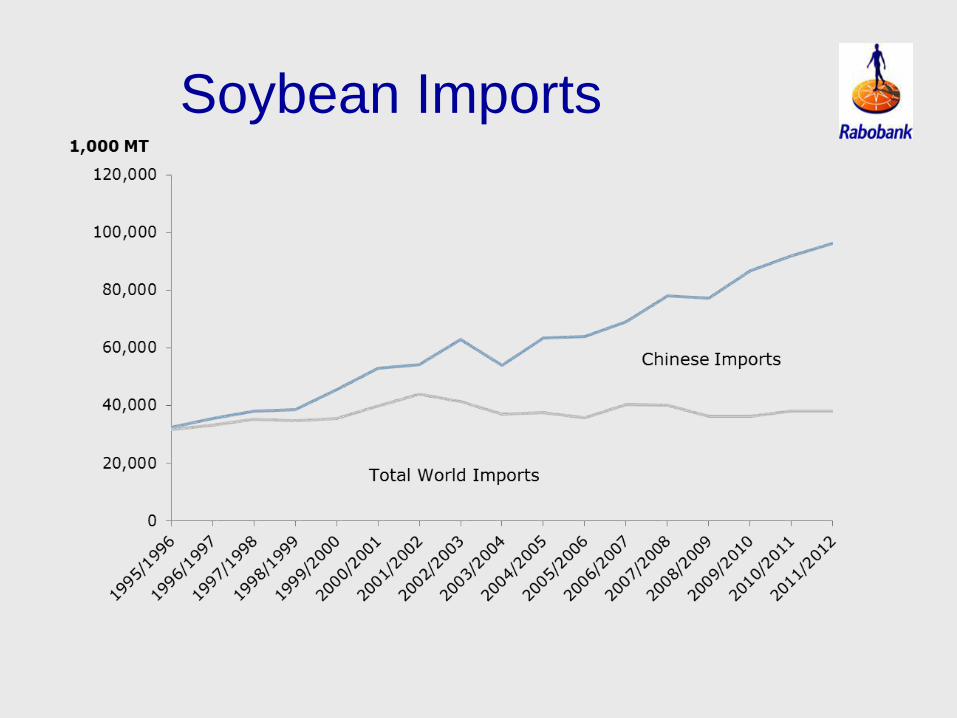
Soybean Imports

Despite a recovery of 60MMT of grain production from the FSU last year, the world grain still declined slightly.
Structurally, demand is growing faster than supply.
The world is still in a period of structural surplus to structural shortage.
World Grain Stocks to Use Ratio
Source: USDA, 2012
Grain Not Keeping Up With Structural Demand Growth

Click here to add image
Certainly We Have Tried To Over Produce
Click here to add image
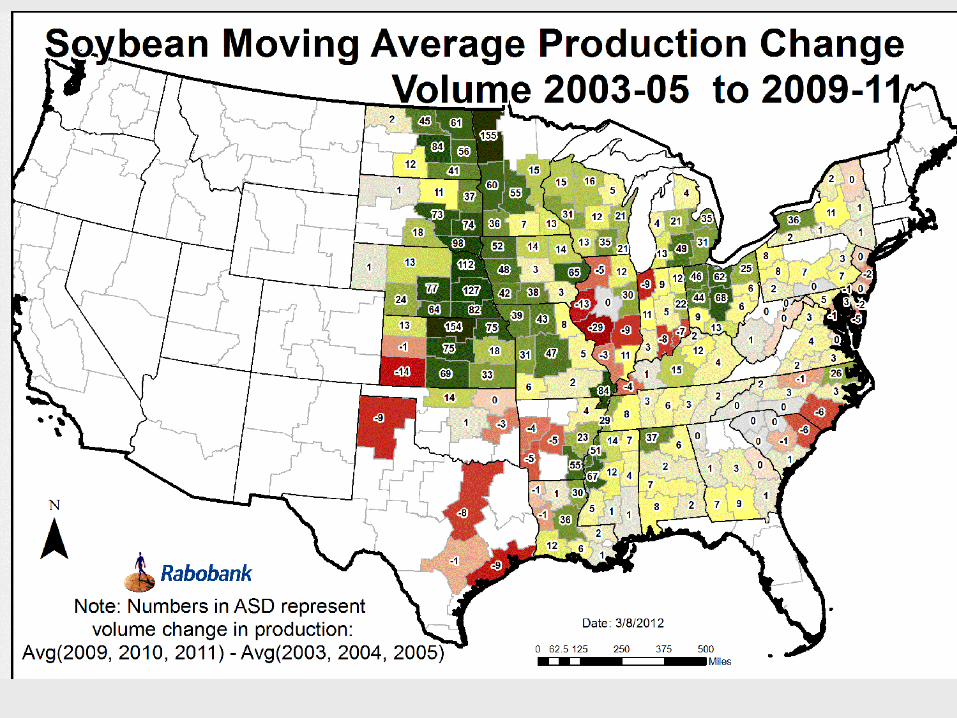
Understanding The Drivers: Changes In Supply Sources
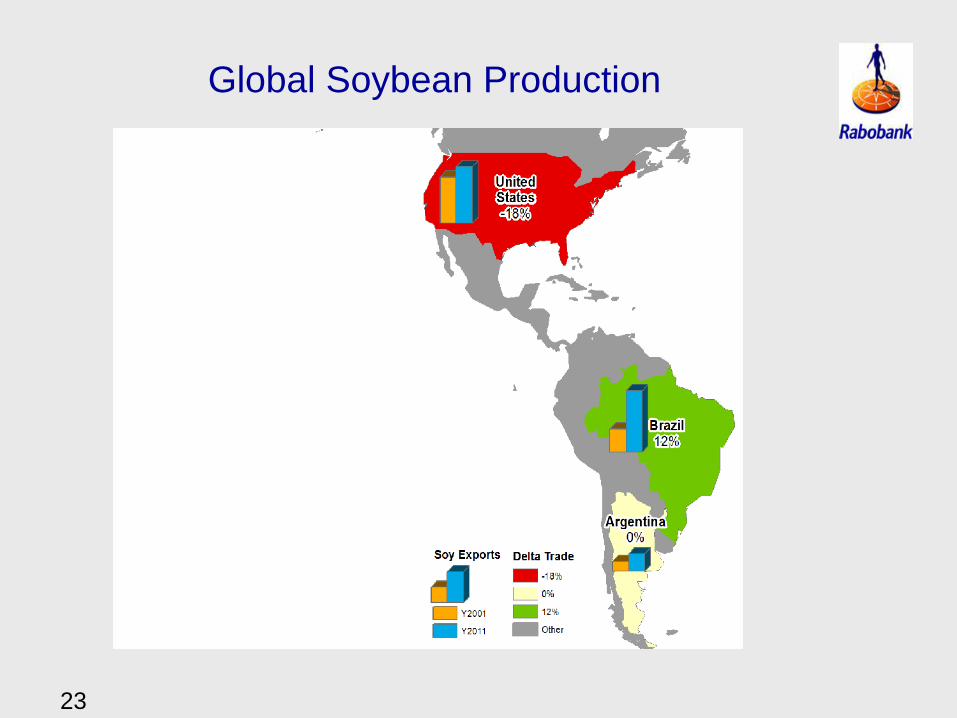
Global Soybean Production
23

Infrastructure Challenges

Investment in storage infrastructure has not matched the growth of corn and soybean production
19/03/13
19/03/1319/03/13
19/03/13
19
/0
3/
13
19
/0
3/
13
19/03/13
19
/0
3/
13
19/03/13
19
/0
3/
13
19/03/13
19
/0
3/
13
19/03/13
19/03/13
19
/0
3/
13
19/03/13
19
/0
3/
13
19/03/13
19/03/13
19
/0
3/
13
CAGR: 6%
19/03/13
19
/0
3/
13
19
/0
3/
13
19/03/13
19
/0
3/
13
19/03/13
19
/0
3/
13
19
/0
3/
13
19/03/1319/03/13
19/03/13
19/03/13
CAGR: 4%
[Million Metric Tons]
Source: Rabobank. Data from CONAB:2012.
154149
144
123
115119
123
101
155
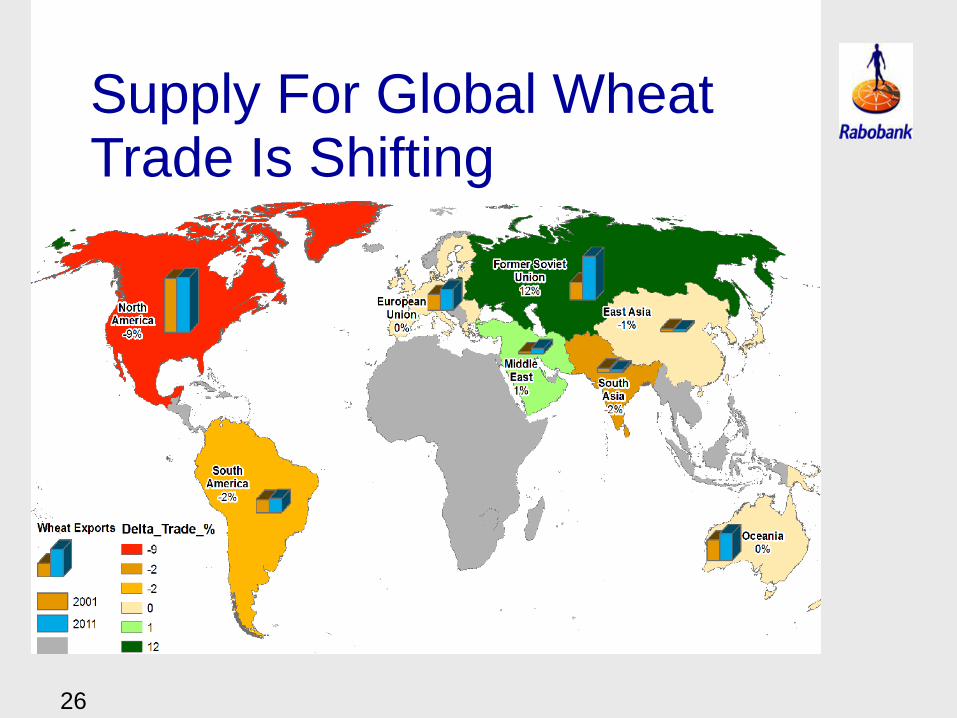
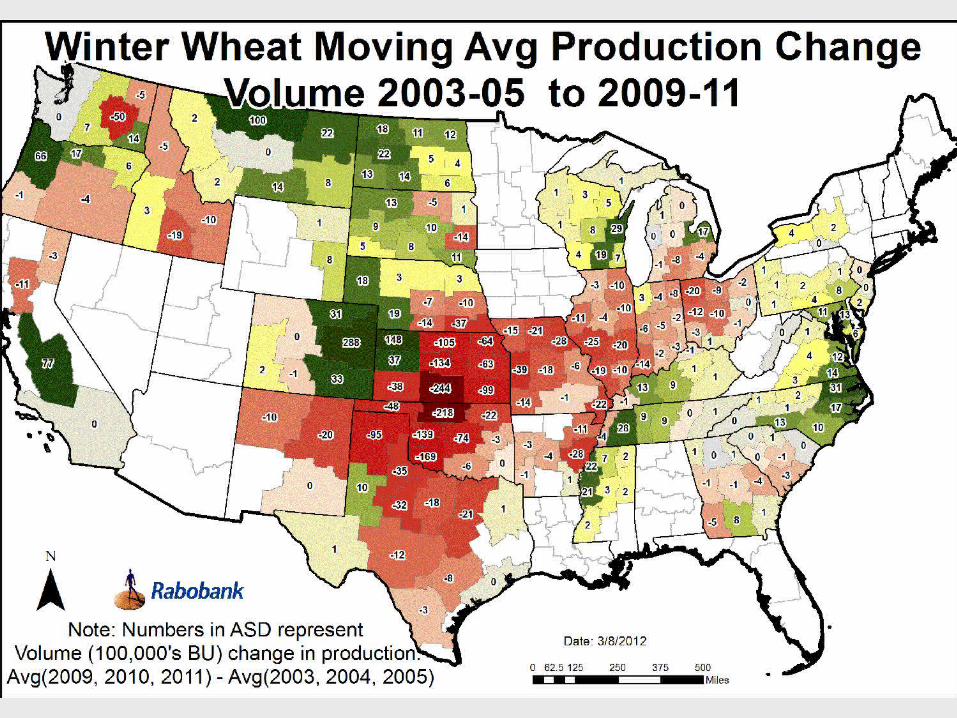
Supply For Global Wheat Trade Is Shifting
26
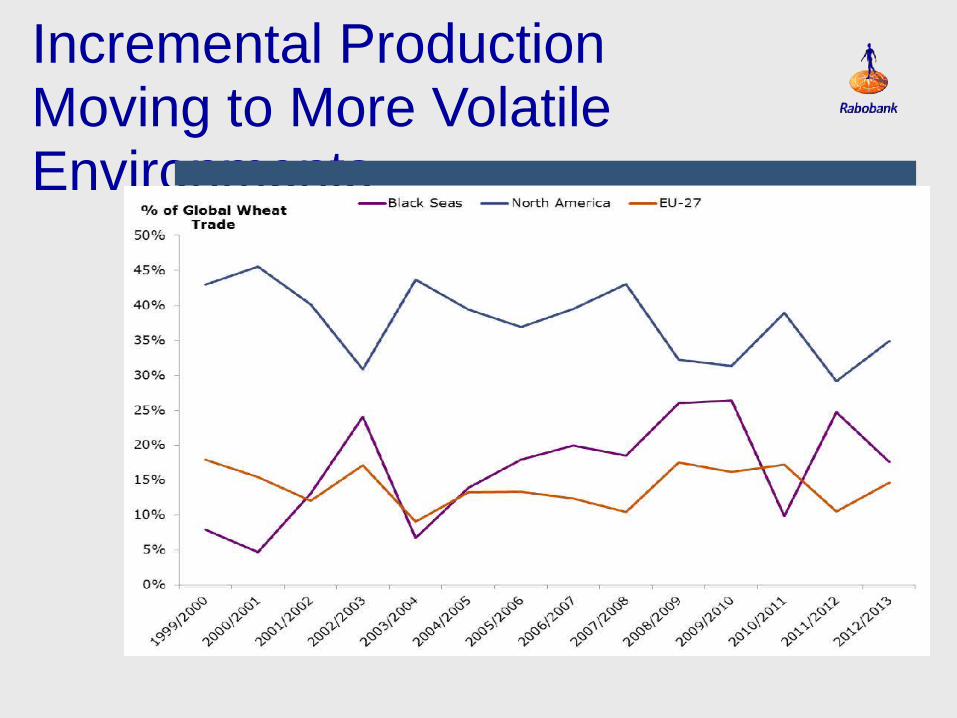
Incremental Production Moving to More Volatile Environments

What Does All of This Make Agriculture in 2013???
The Dog That Has Finally Caught the Car!
Outlook:
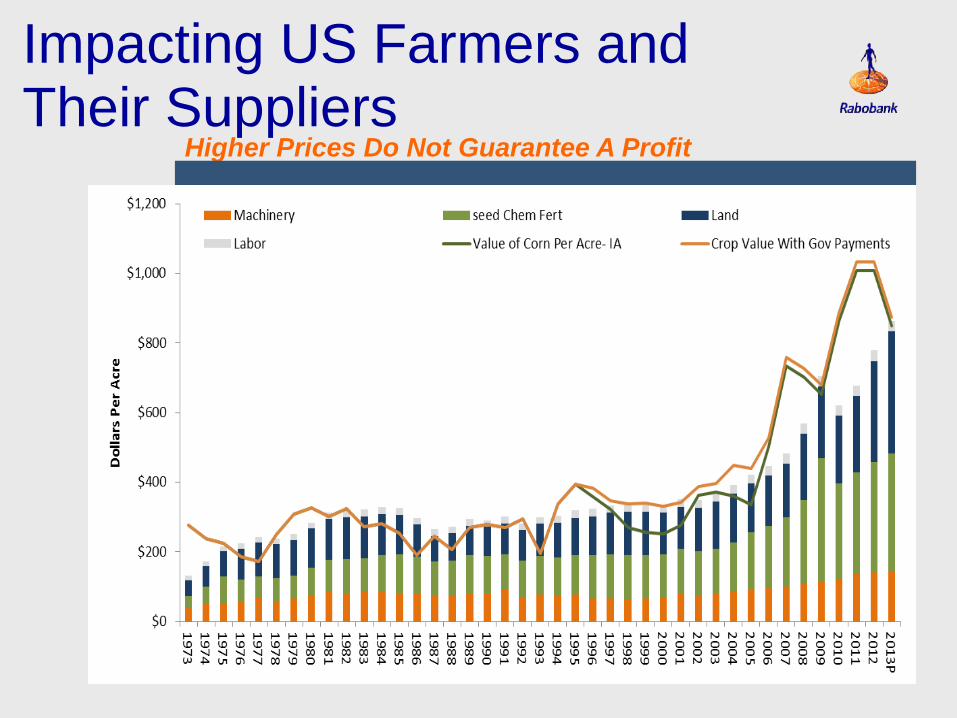
Higher Prices Do Not Guarantee A Profit
Impacting US Farmers and Their Suppliers
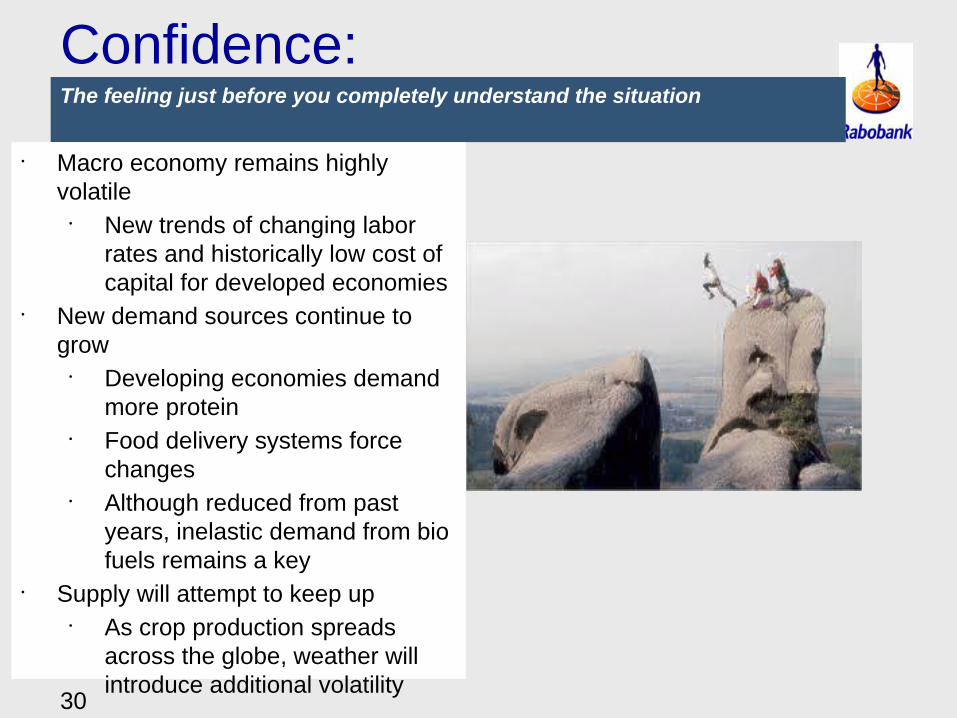
Confidence: The feeling just before you completely understand the situation
30
• Macro economy remains highly volatile• New trends of changing labor
rates and historically low cost of capital for developed economies
• New demand sources continue to grow• Developing economies demand
more protein• Food delivery systems force
changes• Although reduced from past
years, inelastic demand from bio fuels remains a key
• Supply will attempt to keep up• As crop production spreads
across the globe, weather will introduce additional volatility
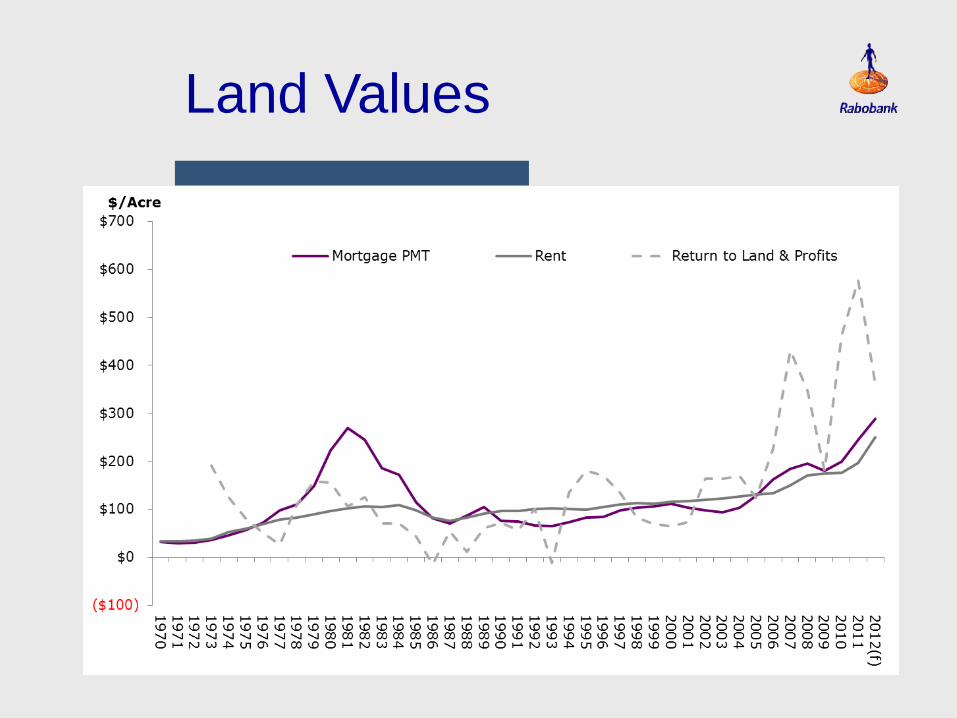
Land Values
32
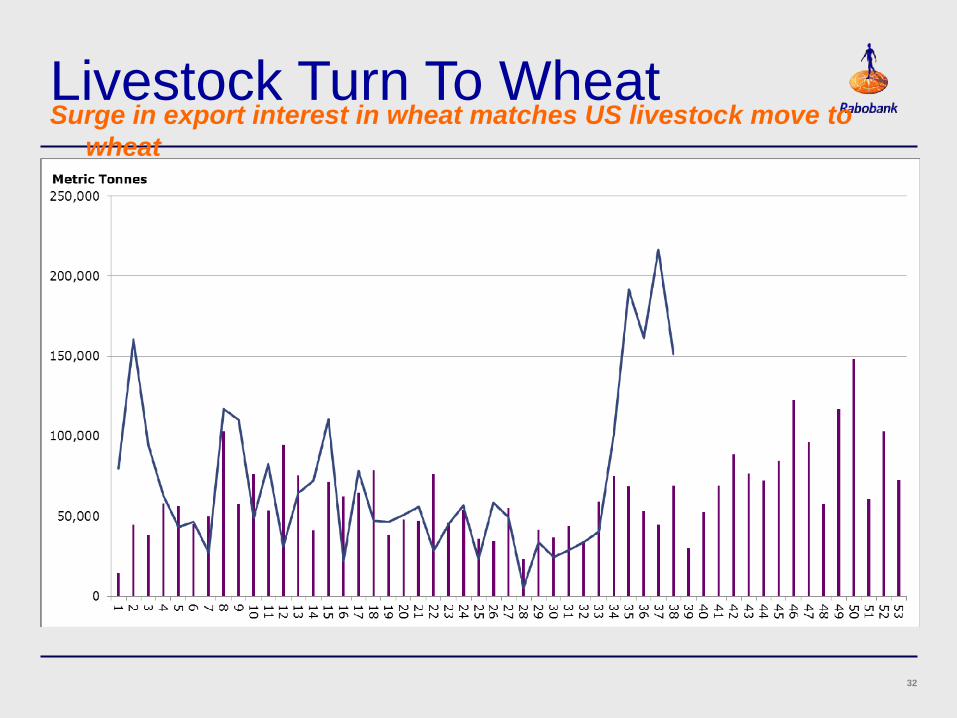
Livestock Turn To Wheat Surge in export interest in wheat matches US livestock move to
wheat
33
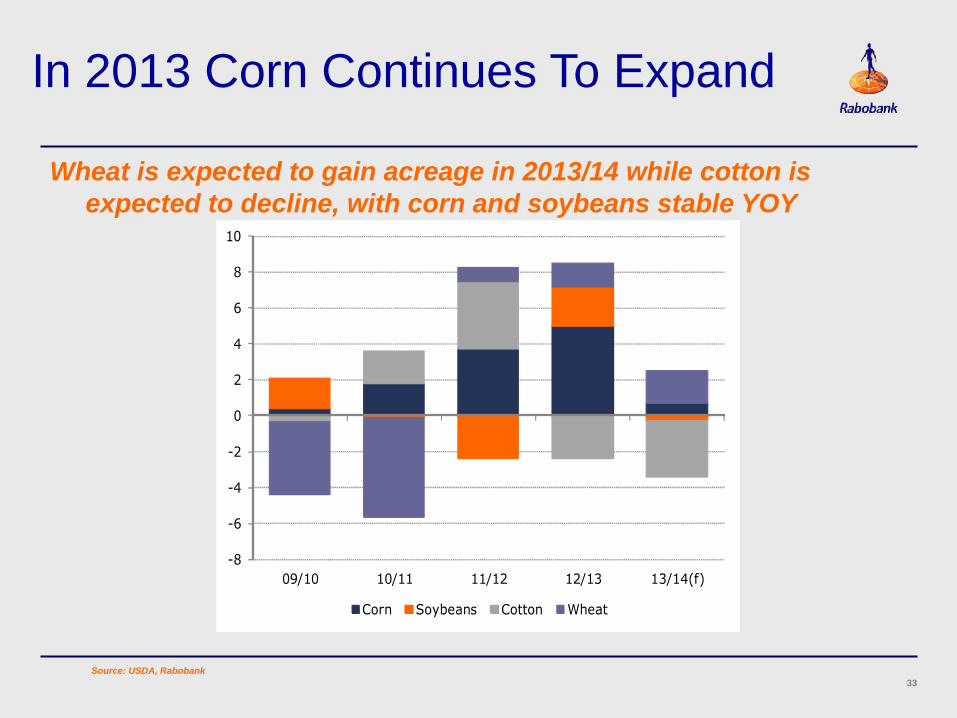
In 2013 Corn Continues To Expand
Wheat is expected to gain acreage in 2013/14 while cotton is expected to decline, with corn and soybeans stable YOY
Source: USDA, Rabobank
-8
-6
-4
-2
0
2
4
6
8
10
09/10 10/11 11/12 12/13 13/14(f)
Corn Soybeans Cotton Wheat
Click here to add imageClick here to add image
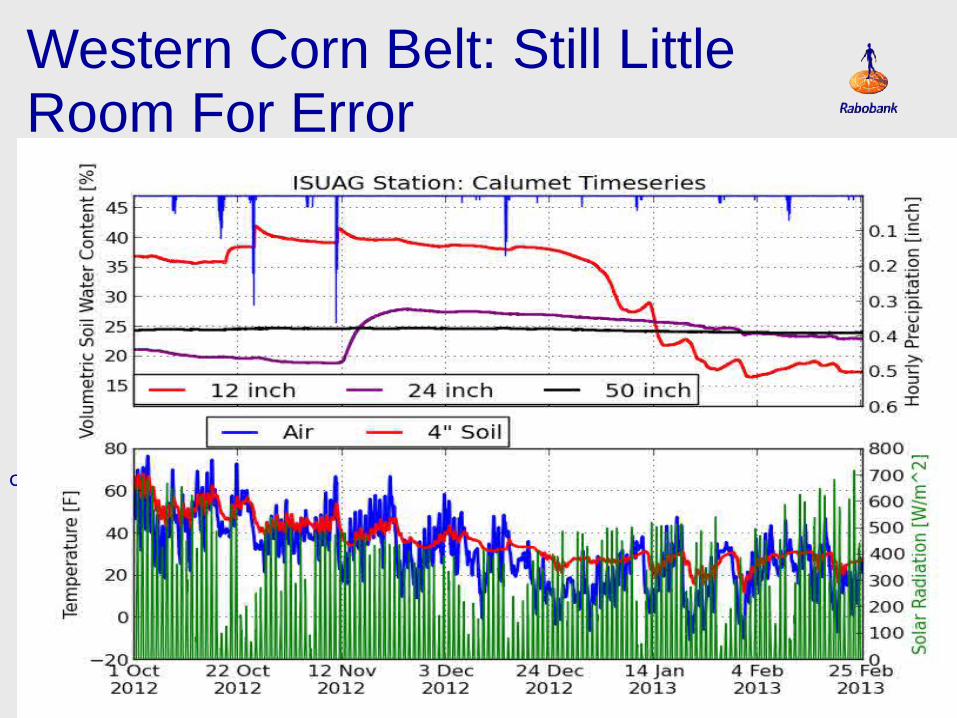
Western Corn Belt: Still Little Room For Error

Pivotal point in the future
Yield New Source of Uncertainty
50
70
90
110
130
150
170
190
10,000
15,000
20,000
25,000
30,000
35,000
1988 1989 1990 1991 1992 1993 1994 1995 1996 1997 1998 1999 2000 2001 2002 2003 2004 2005 2006 2007 2008 2009 2010 2011 2012 2013(f) 2014(f) 2015(f) 2016(f) 2017(f)
Yield/ AcrePopulation/ Acre
Weighted PlantPopulation/AcreActual Yield
Expected yied basedon PPAYield at 1988 10-yearave weight/plantMax Capacity
Linear (Actual Yield)
ConclusionsCurrent situation
Milk production in export regions is low but increasing
Supply side stocks have started to rise
International market prices continue to gradually move upwards
Steeper recovery so far prevented by softer demand growth/forward coverage
US drought induced price premiums have now been eradicated
Next 12 months
Prices will slowly be squeezed up by falling supply as margins turn negative
However, the pace and vigour of the move has now been tempered
US wholesale prices to move up in tandem with the international market
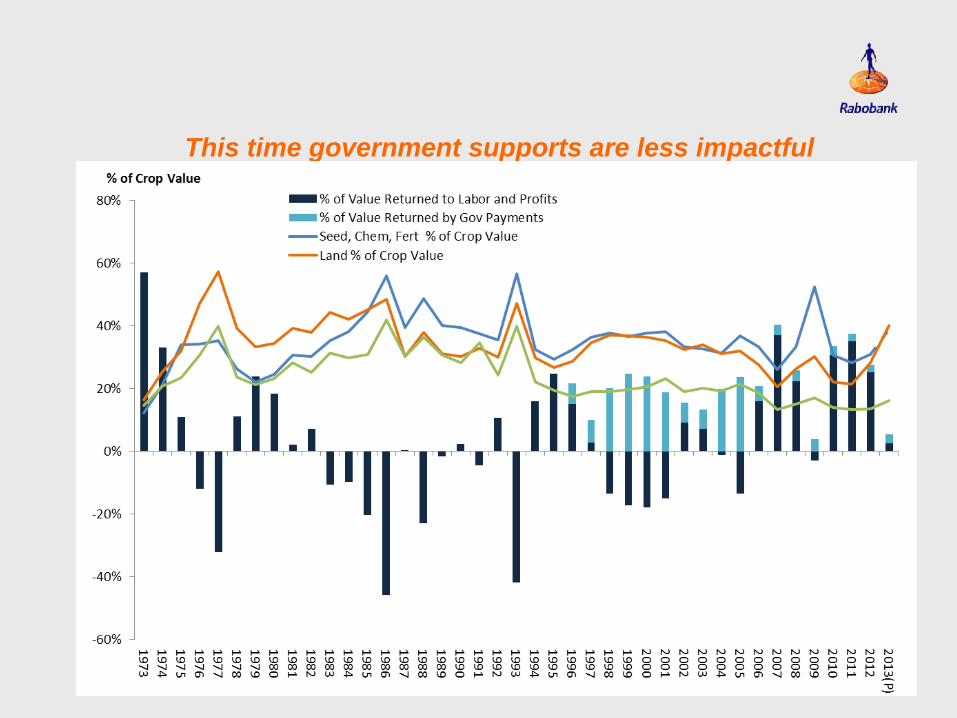
This time government supports are less impactful


All Wheat Accumulated Exports BY Week
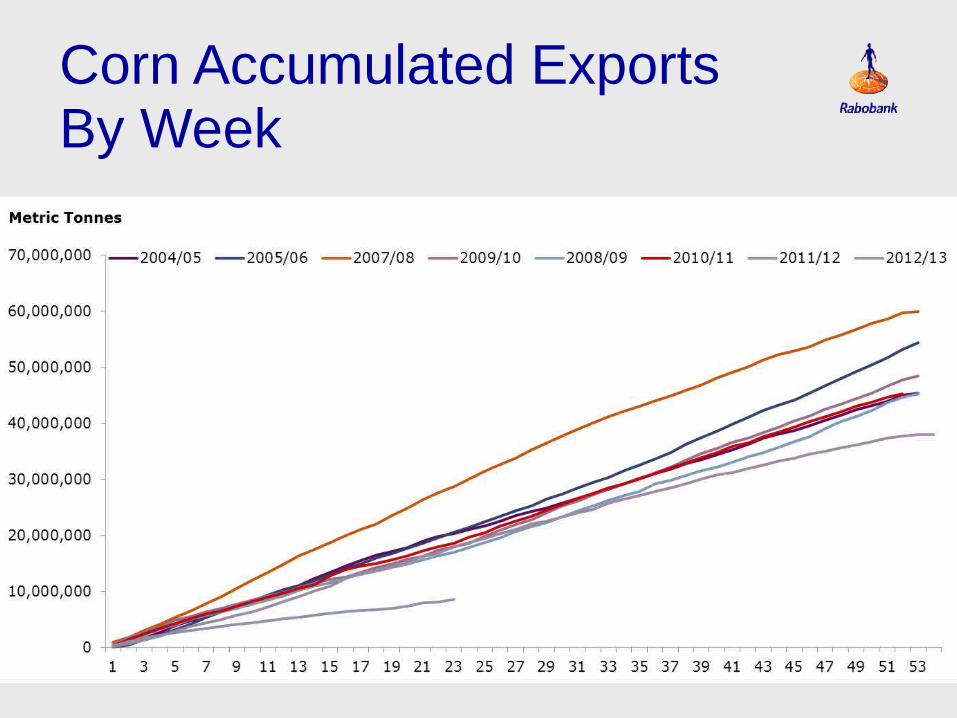
Corn Accumulated Exports By Week