
IP Addressing & Subnetting IP Addressing Subnetting VLSM CIDR.
Addressing equifinality and uncertainty in eutrophication models
George B. Arhonditsis,1 Gurbir Perhar,1 Weitao Zhang,1 Evangelia Massos,1 Molu Shi,1
and Argho Das1
Received 2 January 2007; revised 17 August 2007; accepted 19 September 2007; published 17 January 2008.
[1] Large simulation models of eutrophication processes are commonly used to aidscientific understanding and to guide management decisions. Confidence in models forthese purposes depends on uncertainty in model equations (structural uncertainty) andon effects of input uncertainties (model parameters, initial conditions, and forcingfunctions) on model outputs. Our objective herein is to illustrate two strategies, ageneralized likelihood uncertainty estimation (GLUE) approach combined with a simpleMonte Carlo sampling scheme and a Bayesian methodological framework along withMarkov Chain Monte Carlo (MCMC) simulations, for elucidating the propagation ofuncertainty in the high-dimensional parameter spaces of mechanistic eutrophicationmodels. We examine the ability of the two approaches to offer insights into the degreeof information about model inputs that the data contain, to quantify the correlationstructure among parameter estimates, and to obtain predictions along with uncertaintybounds for modeled output variables. Our analysis is based on a four-state-variable(phosphate-detritus-phytoplankton-zooplankton) model and the mesotrophic LakeWashington (Washington State, United States) as a case study. Scientific knowledge,expert judgment, and observational data were used to formulate prior probabilitydistributions and characterize the uncertainty pertaining to 14 model parameters. Despitethe conceptual differences for addressing model equifinality, that is, wide ranges ofparameter values subject to complex multivariate relationships that result in plausibleobserved behaviors and produce equivalently accurate predictions, we found that the twostrategies provided fairly consistent estimates of the posterior parameter correlationstructure and output uncertainty. Nonetheless, our analysis also shows that MCMC canmore efficiently quantify the joint probability distribution of model parameters and makeinference about this distribution. The latter finding can be explained by the basic ideaunderlying the MCMC methodology, that is, the configuration of a Markov process whosestationary distribution approximates the joint posterior distribution of all the stochasticmodel nodes; as a result, Monte Carlo samples are not drawn from the prior parameterspace, and problems of wide or highly correlated prior distributions can be overcome.Finally, our study stresses the lack of perfect simulators of natural system dynamics andintroduces two statistical formulations that can explicitly account for the discrepancybetween mathematical models and environmental systems.
Citation: Arhonditsis, G. B., G. Perhar, W. Zhang, E. Massos, M. Shi, and A. Das (2008), Addressing equifinality and uncertainty in
eutrophication models, Water Resour. Res., 44, W01420, doi:10.1029/2007WR005862.
If our science is to be meaningful, we should aim to communicate
the limitations of the predictions we make in ways that are useful to
the wider community. This, in itself, cannot be divorced from the
wider socio-political context. . .Pappenberger and Beven [2006, p. 6]
1. Introduction
[2] Mechanistic models are an attractive tool that can beparticularly useful for assisting water quality management.An appealing feature for their extensive use is their role as
‘‘information integrators’’ [Spear, 1997], that is, their abilityto synthesize among different types of information thatreflect our existing knowledge/best understanding of theecosystem functioning. Their main foundation consists ofcausal mechanisms, complex interrelationships, direct andindirect paths in ecological structures that are mathemati-cally depicted in the form of nonlinear differential equa-tions. Then, any scientific knowledge, expert judgment, andexperimental data can be used to assign realistic ranges anddetermine the relative likelihood of the different values ofecologically meaningful parameters (e.g., chemical processes,biological rates, and partition coefficients). Most impor-tantly, the model endpoints (state variables) usually coincidewith routinely monitored environmental variables, which inturn are considered reliable surrogates of the physics,chemistry and biology of the aquatic ecosystem under
1Department of Physical and Environmental Sciences, University ofToronto, Toronto, Ontario, Canada.
Copyright 2008 by the American Geophysical Union.0043-1397/08/2007WR005862$09.00
W01420
WATER RESOURCES RESEARCH, VOL. 44, W01420, doi:10.1029/2007WR005862, 2008ClickHere
for
FullArticle
1 of 19

investigation. The latter attribute also provides the theoreticalunderpinning for what is called ‘‘model calibration’’; theprocedure by which the modelers attempt to minimize thediscrepancy between model outputs and observed data byadjusting model parameters [Jorgensen and Bendoricchio,2001]. An implicit assumption for this practice is that if amathematical model fits well the observed data, then it canbe considered an accurate representation of the natural systemand can be effectively used for projecting future responsesunder alternative management schemes [Arhonditsis andBrett, 2005a].[3] Although the premise for ‘‘predictive capability
founded on mechanistic understanding’’ is tenable, it quicklybecame clear that there is high degree of model structureand input uncertainty (parameters, initial conditions, forcingfunctions) resulting in considerable controversy regardingtheir usefulness as management tools [Reckhow, 1994]. Thisuncertainty is not surprising because all models are simplisticrepresentations of the aquatic systems and even the mostwell studied ecological processes can be mathematicallydescribed by a variety of relationships that entail differentassumptions and complexity levels, for example, Monodand Variable-Internal Stores (VIS) models for modeling thephytoplankton uptake of nutrients from the water columnand their conversion into biomass [Grover, 1991]. Waterquality data are also scarce or highly variable, so individualequations that are approximately correct in ideal (controlledlaboratory) conditions may not collectively yield an accuratepicture of ecosystem behavior. Moreover, the ‘‘chimera’’ ofa reductionistic description of natural system dynamicsaccentuates the disparity between what ideally we want tolearn and what can realistically be observed, and thus it isoften impossible to impose quantitative (or even qualitative)constraints of what should be considered ‘‘behavioral’’simulation [Beck, 1987]. By acknowledging the uncertainty(error) underlying both model structures and data, weexplicitly recognize that the search for a single set ofparameter values (global optimum) that reproduces the realworld patterns is not a reasonable expectation [Reichert andOmlin, 1997]. Rather, the only defensible strategy is theassessment of the likelihood of different input factors(model structures/parameter sets) being acceptable simula-tors of the natural system, the so-called ‘‘model equifinal-ity’’ [Beven, 1993].[4] Uncertainty analysis of mechanistic models has
received considerable attention in the aquatic ecosystemresearch and there have been several attempts to rigorouslyaddress issues pertaining to structural and parametric error[Spear and Hornberger, 1980; Dilks et al., 1992; Omlin andReichert, 1999; Brun et al., 2001; Reichert et al., 2002].Nonetheless, a recent meta-analysis showed that the largemajority of the aquatic mechanistic biogeochemical modelspublished over the last decade did not properly assessprediction error; aquatic mechanistic modelers are stillreluctant to embrace uncertainty analysis techniques andassess the reliability of the critical planning informationgenerated by the models [Arhonditsis and Brett, 2004].Thorough quantification of model sensitivity to parameters,forcing functions and state variable submodels was onlyreported in 27.5% of the studies, while 45.1% of thepublished models did not report any results of uncertainty/sensitivity analysis. Ironically, the identifiability problem in
the context of eutrophication modeling and managementwas firstly discussed nearly three decades ago, when theHornberger and Spear [1981] study advocated the use ofregionalized estimation techniques that provide parameterdistributions instead of single values (point estimates) as anantidote to the lack of comprehensive data sets. Despite thecompelling arguments for considering uncertainty analysisas an integral part of the modeling endeavor, a recent paperby Pappenberger and Beven [2006] identified severalreasons why the modeling community is still oblivious ofits importance and also argued that none of these points issound. Furthermore, the same study discussed the issuesinvolved in developing a ‘‘Code of Practice’’ that aims tooffer guidance about how we should conduct uncertaintyanalysis in any modeling exercise, and the sixth issue of theproposed code, that is, choice of uncertainty estimationmethodology, provides the impetus of our study.[5] The main objective of this study is to illustrate two
strategies, a generalized likelihood uncertainty estimation(GLUE) approach combined with a simple Monte Carlosampling scheme and a Bayesian methodological frame-work along with Markov Chain Monte Carlo (MCMC)simulations, for assessing the propagation of uncertaintyin the high-dimensional parameter spaces of mechanisticeutrophication models. We examine the ability of the twostrategies to offer insights into the degree of information thedata contain about model inputs, quantify the dependencestructure among parameter estimates, and obtain predictionsalong with uncertainty bounds for modeled output variables.Our goal is to illuminate technical aspects of the twouncertainty analysis approaches that can be particularly usefulfor eutrophication management. Our illustration is based ona four-state-variable (phosphate-detritus-phytoplankton-zooplankton) model that provides a realistic platform fortesting the ability of the competing techniques to exploremultidimensional parameter spaces while conforming to theprinciple of parsimony.
2. Methods
2.1. Model Description
[6] The effectiveness of the two uncertainty analysisapproaches was examined using as a case study LakeWashington; the second largest natural lake in WashingtonState and one of the best documented cases of successfulrestoration by sewage diversion [Edmondson, 1994]. LakeWashington is a mesotrophic system with limnologicalprocesses strongly dominated by a recurrent diatom bloom,which occurs during March and April with epilimneticchlorophyll concentration peaks on average at 10 mg/L,which is 3.2 times higher than the summer concentrationswhen the system is phosphorus limited [Arhonditsis et al.,2003]. The data set used for model calibration was based ona recent (1994–2003), sampling program carried out byKing County/Metro (available at http://dnr.metrokc.gov/wlr/waterres/lakes/LakeWashington.htm). Detailed descriptionof the sampling network, the analytical methods used alongwith the data analysis is provided elsewhere [Arhonditsis etal., 2003; Arhonditsis and Brett, 2005b]. The basic concep-tual design of our model builds upon the results of a recentmodeling study [Arhonditsis and Brett, 2005a, 2005b], andconsiders the basic ecological processes underlying plank-
2 of 19
W01420 ARHONDITSIS ET AL.: UNCERTAINTY IN EUTROPHICATION MODELS W01420

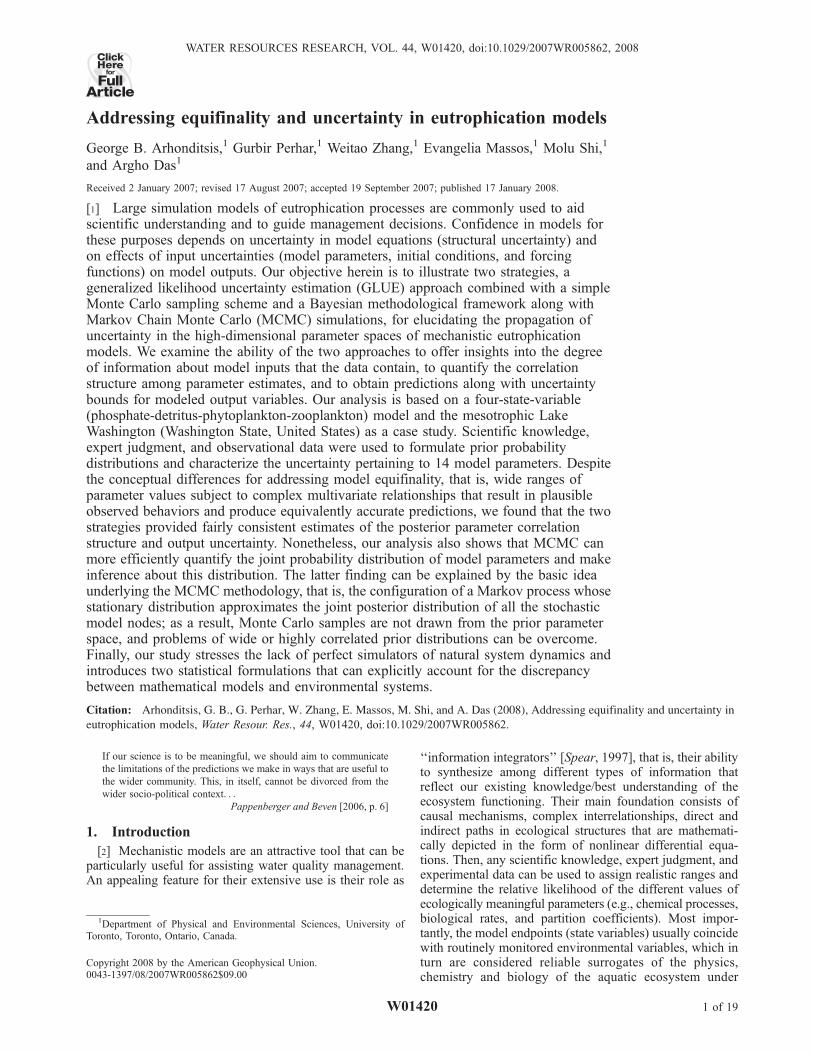
ton dynamics in the Lake Washington epilimnion. Wedeveloped a zero-dimensional (single compartment) modelthat considers the interplay between the four state variables:phosphate, phytoplankton, zooplankton, and detritus(Figure 1). The mathematical description of the eutrophica-tion model and the definition of the model parameters canbe found in Appendix A and Table 1, respectively. Thesimulation model was solved numerically using the fourth-order Runge-Kutta method with a time step of 1 d.2.1.1. Phytoplankton[7] The equation for phytoplankton biomass considers
phytoplankton production and losses due to basal metabo-lism, settling and herbivorous zooplankton grazing. Thecombined effects of the seasonal cycle of light and temper-
ature (i.e., average physical conditions over the studyperiod) on phytoplankton are described by a trigonometricfunction s(t). Phytoplankton sinks out of the epilimnion at aconstant rate, while phosphorus limitation on phytoplanktongrowth follows the Michaelis-Menten kinetics. The basalmetabolism includes all internal processes that decreasealgal biomass (respiration, excretion) as well as naturalmortality.2.1.2. Zooplankton[8] Zooplankton grazing and losses due to natural mortality/
consumption by higher predators are the main two terms inthe zooplankton biomass equation, while the specificparameterization used mainly represents Daphnia dynam-ics, that is, the dominant member of the Lake Washington
Figure 1. The phosphate (PO4)–detritus (DET)–phytoplankton (PHYT)–zooplankton (ZOOP) modelused for reproducing the Lake Washington dynamics. Arrows indicate flows of matter through thesystem. System equations and parameter definitions are provided in Appendix A and Table 1.
Table 1. Parameter Definitions of the Eutrophication Modela
Parameter Symbol Unit
Maximum phytoplankton (PHYT) growth rate a* d�1
Higher predation on zooplankton (ZOOP) d* d�1
Half-saturation constant for predation pred* mg C m�3
Half-saturation constant for PO4 uptake e* mg P m�3
Cross-thermocline exchange rate k* d�1
Phytoplankton respiration rate r* d�1
Phytoplankton sinking loss rate s* d�1
Phosphorus to carbon ratio for phytoplankton P/Cphyto 0.015 mg P (mg C)�1
Phosphorus to carbon ratio for zooplankton P/Czoop 0.029 mg P (mg C)�1
Shape parameter for the trigonometric functions s(t) and s(tz) e 0.9
Zooplankton growth efficiency a*Zooplankton excretion fraction b*Regeneration of zooplankton predation excretion g*Maximum zooplankton grazing rate l* d�1
Zooplankton grazing half-saturation coefficient m* mg P m�3
Relative zooplankton preference for detritus compared to phytoplankton w 1Detritus (DET) remineralization rate 8* d�1
Detritus sinking rate y* d�1
aThe asterisks indicate parameters used during the uncertainty analysis of the model.
W01420 ARHONDITSIS ET AL.: UNCERTAINTY IN EUTROPHICATION MODELS
3 of 19
W01420

zooplankton community [Arhonditsis and Brett, 2005a].Zooplankton has two alternative food sources (phytoplank-ton and detritus) of equal palatability. A fraction of zoo-plankton grazing is assimilated and fuels growth, while bothherbivory and detrivory were formulated using the HollingType III function. A sigmoid closure term was selected torepresent a ‘‘switchable’’ type of predator behavior con-trolled by a prey threshold concentration [see Edwards andYool, 2000]. The effects of temperature on zooplanktonmetabolic activities were modeled by a trigonometric func-tion similar to the one used for phytoplankton. The ob-served lagged Daphnia response (�30 d) during the springbloom was represented by a phase shift of �0.5 radians.2.1.3. Phosphate[9] The phosphate equation considers the phytoplankton
uptake, the proportion of the zooplankton excretion andmortality/predation that is returned back to the system asdissolved phosphorus. Epilimnetic phosphate levels are alsofuelled by the bacteria-mediated mineralization of detritus,and are subject to seasonally varying diffusive mixing withthe hypolimnion.2.1.4. Detritus[10] Detritus sinks out of the epilimnion at a constant rate
and is transformed to phosphate by the seasonally forcedmineralization processes. Phytoplankton respiration and afraction of the zooplankton growth that represents the fecalpellets also contribute to the detritus pool.2.1.5. Boundary Conditions[11] The dissolved phosphorus and detritus (mainly repre-
senting the inflows of particulate phosphorus) loadings fromthe watershed, the hypolimnetic phosphate concentrationsand the outflows to the Lake Union Ship Canal weredescribed by sinusoidal functions fitted to data from the localstreams [Brett et al., 2005], the King County/Metro samplingprogram and the H. H. Chittenden Locks [Arhonditsis andBrett, 2005a].
2.2. Generalized Likelihood Uncertainty Estimation
[12] The generalized likelihood uncertainty estimation isan extension of the binary ‘‘acceptance/rejection’’ system ofbehavioral/nonbehavioral simulations of the originalRegionalized Sensitivity Analysis [Hornberger and Spear,1981]. The GLUE methodology uses likelihood measures toassign different levels of confidence (weighting) to differentparameter sets, reflecting their ability to acceptably repro-duce ‘‘non-error-free’’ observations from the environmentalsystem [Beven and Binley, 1992; Zak and Beven, 1999;Page et al., 2004; Beven, 2006]. Unlike other uncertaintyanalysis techniques, the term likelihood has a very broadmeaning and is specified as any measure of goodness-of-fitthat can be used to compare observed responses with modelpredictions [Zak et al., 1997]. As a result, a wide variety oflikelihood functions can be found in the GLUE literature,for example, likelihood measures based on the sum ofsquared errors [Beven and Binley, 1992; Sorooshian andGupta, 1995; Freer et al., 1997], fuzzy measures [Franks etal., 1998; Page et al., 2004] or even qualitative measuresfor model evaluation [Beven, 2001]. The GLUE procedurerequires a large number of Monte Carlo model runs sampledfrom (usually) uniform distributions across a plausible rangeof each parameter. The behavioral runs are selected on thebasis of a subjectively chosen threshold of the likelihoodfunction and are rescaled so that their cumulative total is
1.0. The weighting assigned to the retained behavioral runsis propagated to the model output and forms a likelihood-weighted cumulative distribution of the predicted varia-ble(s), which are then used for estimating the predictionuncertainty ranges [Beven and Binley, 1992].[13] GLUE also has the ability to update likelihood
weights (and thus predictive uncertainty) by successiveapplication of the Bayes’ Theorem, as additional databecome available. The refinement of the predictive uncer-tainty can be assessed each time the likelihood function isupdated by the use of appropriate quantitative measures(e.g., the probabilistic Shannon Entropy measure and theU-uncertainty); see the relevant discussion by Beven andBinley [1992]. However, unless the combination of a‘‘likelihood’’ function with a threshold criterion correspondsto a well-defined probability distribution that directlyconnects the data with model input and output parameters,GLUE does not have a clear Bayesian interpretation[Engeland and Gottschalk, 2002; Hong et al., 2005]. Forexample, the 95% uncertainty bounds resulting from GLUEcan have different statistical interpretation than the 95%credible intervals [Lamb et al., 1998]. In addition, theGLUE procedure is mainly based on the parameter-setability to produce behavioral simulations, and therefore itis difficult to extract information regarding the individualparameter effects on the model response. We know, forexample, from past studies that the set of modal values ofthe marginal distributions may not be itself behavioral[Beven, 2006]. Even though the use of scattergrams (pro-jections of the sampled high-dimensional response surfaceonto single parameter dimensions) can give insights, theycannot fully reflect the complexity of the response surface[Page et al., 2004]. Finally, it should also be noted thatdepending on the likelihood measure and the behavioral/nonbehavioral threshold used, GLUE can be particularlyinefficient in sampling acceptable runs, for example, theMAGIC application by Page et al. [2004] classified asacceptable 7200 out of eleven million runs (0.066%).
2.3. Monte Carlo Sampling Specification ofLikelihood Weights
[14] For the GLUE illustration, the uncertainty associatedwith the initial conditions was accommodated by using thesame initial values (mean January concentrations over thestudy period) for all the Monte Carlo runs and a 10-asimulation period which was sufficient time to reach anequilibrium state (i.e., reproduce similar annual cycles) or tocollapse (zero, negative values or approach infinity). Tofurther retain the dimensions of the space examined to amanageable level, we did not consider the error underlyingthe input boundary conditions. Furthermore, since 4 param-eters out of 18 are already known from empirical data andliterature information, the total number of unknown param-eters is 14 (Table 1). To maximize the efficiency (accep-tance rates) of our Monte Carlo sampling, we implementeda modest pruning of the initial parameter space using 25,000random sets sampled from 14 uniform distributions. Theranges for this 14-dimensional hypercube were based on theidentified minimum and maximum parameter values fromthe pertinent literature [Arhonditsis and Brett, 2005a, andreferences therein]. This exploratory analysis resulted in a5–20% reduction of the ranges of the univariate marginaldistributions, although behavioral simulations were found
4 of 19
W01420 ARHONDITSIS ET AL.: UNCERTAINTY IN EUTROPHICATION MODELS W01420

over the entire allowable regions for some parameters. Thelatter finding has been repeatedly reported in the modelingliterature [e.g., Spear et al., 1994] and underscores the needfor caution when modelers attempt to truncate the parameterspace. In this study, our decisions were also guided fromexisting knowledge and past experience regarding themagnitudes of the various ecological processes in a meso-trophic environment and the parameter regions that increasethe likelihood to reproduce the observed Lake Washingtonpatterns [Arhonditsis and Brett, 2005b].[15] Using the same rationale, we also opted for infor-
mative parameter distributions for the GLUE analysis, andtheir characterization was based on the assignment ofnormal probability densities to the adjusted parameterranges (Table 2). The prior distribution of each model inputparameter was determined independently of other parame-ters for two reasons: (1) there was no consistent literatureinformation regarding correlations among model parameters[Di Toro and van Straten, 1979], and (2) the independenceassumption results in a multivariate prior distribution thattends to be more spread out than one that attempts toincorporate dependence explicitly. We used the latter featureto provide a type of prior robustness in the analysis thatcompensated for the compromises made during the trunca-tion of the initial parameter space; that is, instead of a widehypercube or a narrow hyperellipsoid, we focused on arelatively flat subregion where there was evidence (e.g.,scientific knowledge, expert judgment, and observationaldata) for more realistic representation of the system dynam-ics. Furthermore, the assumption of a priori independencedoes not imply independence a posteriori and some infor-mation on the parameter covariance in fitting the availableobservations will be unraveled in the posterior distributionof likelihood measures following the conditioning of theparameter sets within the GLUE procedure (see section 3).After the formation of the density function that describes thejoint probabilities of the 14 parameters, we generated anumber of 60,000 random sets, which then provided theinput for our eutrophication model.[16] As previously mentioned, the definition of the like-
lihood measure that assesses the goodness-of-fit of modeloutputs to the observed data is a critical step in the GLUE
framework and the uncertainty predictions can be stronglyinfluenced by that definition [Ratto et al., 2001]. In thisstudy, we employed the following likelihood measure:
Lj qk jYj� �
¼ 1
sk2j
; ð1Þ
where
sk2j ¼ 1
2n
Xni¼1
Yobs ijð Þ � Ykpred ijð Þ
� �2j 2 PO4; det; chla; zoopf g
ð2Þ
is the mean squared difference between predicted andobserved values for the j state variable from the kth MonteCarlo simulation, and n is the number of observations(twelve average monthly values). The four Lj values weremultiplied to give a combined likelihood measure for eachMonte Carlo run. After the selection of the behavioralsimulations (see section 3), the likelihood measures wererescaled from 0 to 1 and these rescaled weights were thenused to compute the posterior parameter (i.e., mean,variance, and correlation coefficients) and state variable(i.e., weighted mean predicted monthly values, weightedvariance, and selected percentiles from the cumulativelikelihood distributions) statistics. We also examined theconsistency of the results obtained from different likelihoodmeasures (behavioral runs, posterior parameter statistics,predictive uncertainty) by considering two additionalmeasures of fit, that is, the relative error [RE = Sj Observedvalues � Predicted valuesj/SObserved values] and themodeling efficiency [MEF = 1 � S(Predicted values �Observed values)2/S(Observed values � Observation aver-age)2] [Stow et al., 2003].
2.4. Bayesian Methodological Framework
[17] Our presentation examines three statistical formula-tions that aim to combine field observations and simulationmodel outputs to update the uncertainty of model parame-ters, determine their correlation structure, and then use thecalibrated model to give predictions (along with uncertaintybounds) of the natural system dynamics. The threeapproaches can be distinguished by the following assump-tions: (1) the eutrophication model is a perfect simulator ofthe environmental system (i.e., the difference betweenmodel and lake dynamics was assumed to be caused onlyby the observation error) (Model 1), (2) the eutrophicationmodel is an imperfect simulator of the environmentalsystem and the model discrepancy is invariant with theinput conditions (i.e., the difference between model and lakedynamics was assumed to be constant over the annual cyclefor each state variable) (Model 2), and (3) the eutrophicationmodel is an imperfect simulator of the environmentalsystem and the model discrepancy varies with the inputconditions (i.e., there is seasonally varying discrepancybetween model and lake dynamics for each state variable)(Model 3).2.4.1. Model 1[18] The first statistical formulation is based on the
assumption that our model perfectly describes the dynamicsof the environmental system and the observations y for thefour state variables is given by
yi ¼ f q; xi; y0ð Þ þ ei; i ¼ 1; 2; 3; . . . ::; n; ð3Þ
Table 2. Prior and GLUE Estimates of the Mean Values and
Standard Deviations of the Eutrophication Model Parametersa
Parameter
Prior GLUE
Mean SD Mean SD
a 1.297 0.221 1.071 0.161d 0.175 0.016 0.174 0.016pred 57.55 10.06 59.81 10.04e 15.03 4.500 18.59 3.549k 0.035 0.007 0.034 0.007r 0.095 0.025 0.098 0.025s 0.055 0.020 0.044 0.009a 0.401 0.090 0.425 0.077b 0.325 0.078 0.328 0.074g 0.325 0.078 0.332 0.080l 0.624 0.078 0.650 0.074m 7.016 1.350 6.353 1.2178 0.225 0.078 0.238 0.074y 0.080 0.032 0.044 0.024
aGLUE, generalized likelihood uncertainty estimation.
W01420 ARHONDITSIS ET AL.: UNCERTAINTY IN EUTROPHICATION MODELS
5 of 19
W01420

where f(q, xi, y0) denotes the eutrophication model, xi is avector of time-dependent control variables (e.g., boundaryconditions and forcing functions) describing the environ-mental conditions, the vector q is a time-independent set ofthe calibration model parameters (i.e., the 14 parameters inTable 1), y0 corresponds to the concentrations of the fourstate variables at the initial time point t0, and ei denotes theobservation (measurement) error that is usually assumed tobe independent and identically distributed following aGaussian distribution. The observed Lake Washingtonpatterns provide evidence of a multiplicative measurementerror [Arhonditsis et al., 2003, Figure 2], and thus weassumed the standard deviation to be proportional to theaverage monthly values for each state variable [Van Oijen etal., 2005].[19] On the basis of the previous assumptions, the like-
lihood function that evaluates how well the simulationmodel is able to reproduce the observed data y at eachvalue of q, is given by
p yjf q; x; y0ð Þð Þ ¼Ymj¼1
2pð Þ�n=2 Sej�� ���1=2
� exp�� 1
2yj � fj q; x; y0ð Þ T
� S�1ej yj � fj q; x; y0ð Þ �
; ð4Þ
where m and n correspond to the number of state variables(m = 4) and the number of observations in time used tocalibrate the model (n = 12 average monthly values),respectively; yj = [y1j , . . ., yn j]
T and fj (q, x, y0) = [fj (q, xi, y0),. . ., fj (q, xn, y0)]T correspond to the vectors of the fieldobservations and model predictions for the state variable j;andSej = In � (0.15)2 � yjT � yjwhere the factor 0.15 reflects ourassumption that the monthly standard deviations are 15% ofthe mean monthly values; a fraction that comprises bothanalytical error and interannual variability at the deeper(middle) sections of the lake. In the context of the Bayesianstatistical inference, the posterior density of the parameters qand the initial conditions of the four state variables y0 giventhe observed data y is defined as
p q; y0jyð Þ ¼ p yjf q; x; y0ð Þð Þp qð Þp y0ð ÞZZp yjf q; x; y0ð Þð Þp qð Þp y0ð Þdqdy0
/ p yjf q; x; y0ð Þð Þp qð Þp y0ð Þ; ð5Þ
where p(q) is the prior density of the model parameters q andp(y0) is the prior density of the initial conditions of the fourstate variables y0. In a similar way to the measurement errors,the characterization of the prior density p(y0) was based onthe assumption of a Gaussian distribution with a mean valuederived from the January monthly averages during the studyperiod and standard deviation that was 15% of themean valuefor each state variable j; a fraction that comprises bothanalytical error, interannual variability at the deeper (middle)sections of the lake, and difference between the starting date
of the simulation period (1 January) and the usual samplingdates of the King County/Metro sampling program. Thus theresulting posterior distribution for q and y0 is given by
p q; y0jyð Þ /Ymj¼1
2pð Þ�n=2 Sej�� ���1=2
� exp � 1
2
�yj � fj q; x; y0ð Þ TS�1
ej yj � fj q; x; y0ð Þ �
2pð Þ�l=2 Sqj j�1=2Ylk¼1
1
qk
� exp � 1
2log q� q0½ �TS�1
q log q� q0½ �� �
2pð Þ�m=2
� Sy0
�� ���1=2exp � 1
2y0 � y0m½ �TS�1
y0 y0 � y0m½ �� �
;
ð6Þ
where l is the number of the model parameters q used for themodel calibration (l = 14); q0 denotes the vector of the meanvalues of q (logarithmic scale);Sq = Il � sqT � sq and sq = [sq1,. . ., sql]
T corresponds to the vector of the shape parameters ofthe l lognormal distributions (standard deviation of log q); thevector y0m = [y11, . . ., y14]
T corresponds to the average valuesof the four state variables observed in January during thestudy period (1994–2003); and Sy0 = Im � (0.15)2 � y0mT � y0m.2.4.2. Model 2[20] An augmentation of the previous statistical formulation
explicitly recognizes that the model imperfectly represents thedynamics of the environmental system. In this case, anobservation i for the state variables j, yij, can be described as
yij ¼ f q; xi; y0ð Þ þ dj þ eij; i ¼ 1; 2; 3; . . . ::n and j ¼ 1; . . . ;m;
ð7Þ
where the stochastic term dj accounts for the discrepancybetween the model f(q, x, y0) and the natural system, whichis assumed to be invariant with the input conditions x (i.e.,the difference between model and lake dynamics wasassumed to be constant over the annual cycle for each statevariable).With this assumption, the likelihood function will be
p yjf q; x; y0ð Þð Þ ¼Ymj¼1
2pð Þ�n=2 STj
�� ���1=2
� exp � 1
2
�yj � fj q; x; y0ð Þ TS�1
Tj
� yj � fj q; x; y0ð Þ �
; ð8Þ
STj ¼ Sdj þ Sej; ð9Þ
where Sdj = In � sj2 corresponds to the additional stochastic
term of Model 2; and the prior densities p(sj2) were based on
uniformdistributions to overcome some problems caused from
6 of 19
W01420 ARHONDITSIS ET AL.: UNCERTAINTY IN EUTROPHICATION MODELS W01420

the conjugate inverse-gamma distribution [Gelman, 2005].Thus the resulting posterior distribution for q, y0, and s2 is
p q; y0;s2��y� �
/Ymj¼1
2pð Þ�n=2 STj
�� ���1=2
� exp � 1
2
�yj � fj q; x; y0ð Þ TS�1
Tj yj � fj q; x; y0ð Þ �
2pð Þ�l=2 Sqj j�1=2Ylk¼1
1
qk
� exp � 1
2log q� q0½ �TS�1
q log q� q0½ �� �
2pð Þ�m=2 Sy0
�� ���1=2
� exp � 1
2y0 � y0m½ �T
�S�1
y0 y0 � y0m½ ��
Ymj¼1
1
upj � loj; ð10Þ
where the location parameters lo and up correspond to thelower and upper limit of the range of the m uniformdistributions.2.4.3. Model 3[21] The third statistical formulation also explicitly rec-
ognizes that the model imperfectly represents the dynamicsof the environmental system but now the correspondingstochastic term varies with the input conditions x. In thiscase, an observation i for the state variables j, yij, can bedescribed as
yij ¼ f q; xi; y0ð Þ þ dij þ eij; i ¼ 1; 2; 3; . . . ::n and j ¼ 1; . . . ;m:
ð11Þ
The modeling for all the previous terms remains unchanged.We also specify a Gaussian first-order random walk modelfor the discrepancy term dij to reflect that these error termsare correlated [Shaddick and Wakefield, 2002]. Specifically,the vector dj = {d1j, . . ., d12j}, j = PO4, det, chla, zoop, canbe expressed as
p dijjd�ij;w2j
� ��
N diþ1j;w2j
� �for i ¼ 1;
Ndi�1j þ diþ1j
2;w2j
2
!for i ¼ 2; . . . ; 11
N di�1j;w2j
� �for i ¼ 12;
8>>>>>><>>>>>>:
;
ð12Þ
where d�ij denotes all elements of dj except the dij, w j2 is the
conditional variance and the prior densities p(wj2) were
based on conjugate inverse-gamma (0.01, 0.01) distribu-tions [Gelman et al., 1995]. Finally, it is interesting to notethat the third statistical formulation has conceptual simila-rities with the hierarchical dynamic linear modeling (DLM)[Pole et al., 1994] and the Kalman filter [Meinhold andSingpurwalla, 1983].[22] Assessment of the goodness-of-fit between the
model predictions and the observed data was based on theposterior predictive p value, that is, the Bayesian counter-part of the classical p value. In brief, the posterior predictivep value is defined as the probability that the replicated data
(the posterior predictive distribution) could be more extremethan the observed data. The null hypothesis H0 (i.e., thereare no systematic differences between the simulations andthe data) is rejected if the tail-area probability is close to 0.0or 1.0; whilst the model can be regarded as plausible if the pvalue is near to 0.5. The ‘‘discrepancy variable’’ chosen forcarrying out the posterior predictive model checks was the x2
test (see alsoGelman et al. [1996] for a detailed description ofthe posterior predictive p value). The comparison betweenthe two alternative models was based on the use of the Bayesfactor, that is, the posterior odds of one model over the other(assuming the prior probability on either model is 0.5). IfM1
andM2 denote the two alternative models, the Bayes factor is
B12 ¼pr yjM1ð Þpr yjM2ð Þ : ð13Þ
For model comparison purposes, the model likelihood(pr(yjMw); w = 1, 2) is obtained by integrating over theunknown element (initial conditions, model parameters, errorterms) space:
pr yjMwð Þ ¼Z
pr yjMw;Qwð Þp QwjMwð ÞdQw; ð14Þ
where Qw is the unknown element vector under model Mw
and p(QwjMw) is the prior density of Qw. Using the MCMCmethod, we can estimate pr(yjMw) from posterior samples ofQw. Letting Qw
(i) be samples from the posterior densitypr(QwjMw), the estimated pr(yjMw) is
pr yjMwð Þ ¼ 1
m
Xmi¼1
pr yjMw;Q ið Þk
� ��1
( )�1
; ð15Þ
the harmonic mean of the likelihood values [Kass andRaftery, 1995].2.4.4. Markov Chain Monte Carlo[23] Markov Chain Monte Carlo (MCMC) is a general
methodology that provides a convenient means for samplingmultidimensional distributions for the purpose of numericalintegration. The idea underlying the MCMC implementa-tion in Bayesian inference is to construct a random walk orMarkov process whose stationary distribution is p( f (q, x)jy)(i.e., the combination of the prior information with themodel likelihood under the observed data) and then run theprocess long enough so that we produce an accurateapproximation of the posterior model distribution [Gilks etal., 1998]. There are many methods (e.g., Gibbs sampler)for obtaining sequence of realizations from the posteriormodel distributions [Gelfand and Smith, 1990; Casella andGeorge, 1992], but all of them are special cases of thegeneral Metropolis-Hastings algorithm [Metropolis, 1953;Hastings, 1970].[24] To generate samples from a target posterior distribu-
tion p( f (q, x)jy), we need to know that distribution up to aproportional constant and the simplest form of theMetropolis-Hastings algorithm is summarized as follows:(1) select an initial value qt=0, for which p( f (qt=0, x)jy) > 0,from a prior distribution p(q), (2) generate q* from asymmetric distribution (i.e., the chance of generating q*given qt is the same as generating qt given q*) and u from
W01420 ARHONDITSIS ET AL.: UNCERTAINTY IN EUTROPHICATION MODELS
7 of 19
W01420

the uniform distribution U(0,1), (3) compute the ratio of thedensities,
r ¼ p q*jyð Þp qtjyð Þ
; ð16Þ
(4) compute the probability of move a as
a qt; q*ð Þ ¼ min r; 1½ �; ð17Þ
(5) if u � a, set qt+1 = q*; else set qt+1 = qt, and (6) repeatsteps 2–5, starting at qt+1.[25] This simple but general procedure has several advan-
tages that are particularly useful for environmental model-ing; that is, it can efficiently sample multidimensionalparameter spaces and can easily handle multivariate outputsas well as large numbers of nuisance parameters [Gelman etal., 1995].[26] In this study, we used the general normal-proposal
Metropolis algorithm as it is implemented in the WinBUGSsoftware (WinBUGS User Manual, version 1.4, D. Spiegel-halter et al., 2003, available at http://www.mrc-bsu.cam.ac.uk/bugs); this algorithm is based on a symmetric normalproposal distribution, whose standard deviation is adjustedover the first 4000 iterations such as the acceptance rateranges between 20% and 40%. We also used an orderedover-relaxation, which generates multiple samples per iter-ation and then selects one that is negatively correlated withthe current value of each stochastic node [Neal, 1998]. Thelatter option resulted in an increased time per iteration butreduced within-chain correlations. The posterior simulationswere based on multiple chains from starting pointsdispersed around the parameter space [Steinberg et al.,1996]. We found that some of the initial parameter vectorsresulted in unstable solutions that tended to infinity, whilethe presented results are based on two parallel chains withstarting points: (1) a vector that consists of the mean valuesof the prior parameter distributions and (2) a vector thatresulted from the optimization of the model with theFletcher-Reeves conjugate-gradient method [Chapra andCanale, 1998]. We used 30,000 iterations and convergencewas assessed with the modified Gelman–Rubin conver-gence statistic [Brooks and Gelman, 1998]. The accuracy ofthe posterior estimates was inspected by assuring that theMonte Carlo error (an estimate of the difference between themean of the sampled values and the true posterior mean; seethe WinBUGS User Manual, version 1.4, D. Spiegelhalter etal., 2003, available at http://www.mrc-bsu.cam.ac.uk/bugs)for all the parameters was less than 5% of the samplestandard deviation. Given the advantages of the MCMCmethodology, the characterization of the prior densityfunctions were somewhat more realistic (less constrained)relative to those used for the GLUE applications; that is, weassigned lognormal distributions that 95% of their valueswere lying within the identified ranges for each parameter[Steinberg et al., 1997].
3. Results
3.1. Generalized Likelihood Uncertainty Estimation
[27] The selection of the behavioral runs for the GLUEanalysis was based on the overall model likelihood(equation (1)), using as a threshold level the lowest L value
that resulted in less than 20% (10 out of 48) and noviolations of the bands defined by the monthly averages ±1and 2 standard deviations (0.15 monthly average),respectively. We found that 832 runs met this criterionand the corresponding likelihood measures were thenrescaled such that the sum of all the likelihood values wasequal to 1. The distribution of the rescaled likelihoodmeasures for six of the model parameters (a, e, s, a, m, andy) is shown in Figure 2. These scatterplots represent theprojection of the 14-dimensional parameter response surfaceonto single parameter axes, where it can be seen that goodsimulations were produced throughout the chosen parameterranges. Although we were able to locate some parametersubregions with more frequent occurrences of high modelperformance (L > 0.004), the general patterns suggest thatthe likelihood surface is very complex with many smallerpeaks, so that no single global optimum parameter set couldbe identified (see also section 4). Consequently, individualparameter values are not particularly important in theprediction of lake dynamics if taken outside the context ofthe values of the other parameters [Schulz et al., 1999]. Inthis regard, one of the advantages of the GLUE methodologyis that the parameters are treated as sets, and thus the effect ofsuch interactions are implicitly reflected in the likelihoodvalue associated with each set [Zak and Beven, 1999].[28] The likelihood-weighted mean values indicate that
the majority of the posterior parameter distributions werecharacterized by minor shifts of their central tendencyrelative to the prior assigned distributions (Table 2). Theonly exception was the detritus sinking rate (y) with a 45%decrease of the posterior mean (0.044 from 0.08), whichwas also accompanied by a 24% relative decrease of therespective standard deviation. On the other hand, themaximum phytoplankton growth rate (a), the half-saturationconstant for PO4 uptake (e), the phytoplankton sinking rate(s), the zooplankton assimilation efficiency (a), and thedetritus sinking rate (y) showed the most significant relativedecrease (14 to 55%) of their standard deviations, while theknowledge gained for the rest parameters was fairlyminimal (�10% relative reduction). The behavioral subsetcan also be used to determine the correlation structureamong the model parameters (Table 3), although it must benoted that the global correlation coefficients (derived fromall the behavioral samples) can be misleading because thelocal interaction between parameters are more important; forexample, there might be cases in which positive interactionsin one part of the space can produce a behavioral model,while elsewhere there might be a negative interaction.Despite the aforementioned caution regarding the globalcorrelation coefficient values, some of the manifestedrelationships have plausible physical explanation. Forexample, a high maximum phytoplankton growth rate canbe balanced by a high half-saturation constant for PO4
uptake (e) or phytoplankton sinking loss rate (s) to accuratelyrepresent the observed epilimnetic phytoplankton dynamics.There were also some relationships that seem counter-intuitive, such as the positive correlation between thedetritus mineralization (8) and sinking rates (y). Given thatboth parameters reflect detritus losses from the system, anegative relationship where the two terms cancel each otherout would have seemed more plausible. The positivecorrelation probably reflects the predominance of other
8 of 19
W01420 ARHONDITSIS ET AL.: UNCERTAINTY IN EUTROPHICATION MODELS W01420

ecological paths considered in our eutrophication model; forexample, higher detritus sinking rates require higher detritusmineralization rates to fuel phytoplankton growth andcompensate for the zooplankton food deficit, while thedetritus pool is fuelled by both the increased phytoplanktonrespiration and zooplankton grazing and thus the model canstill provide a reasonable fit to the observed data.
[29] The comparison between the observed data and themodel outputs shows that the majority of the phosphate,chlorophyll a and zooplankton biomass monthly valueswere included within the 2.5 and 97.5% uncertainty bounds(Figure 3). Nonetheless, the likelihood-weighted meanpredicted phytoplankton and zooplankton values underrep-resented the observed spring plankton dynamics andapproximately half of the modeled total phosphorus con-centrations were not bracketed by the respective confidence
Table 3. Correlation Matrix of the Eutrophication Model Parameters Based on GLUE Analysisa
a d Pred e k r s a b g l m 8 Y
�0.062 0.002 0.471 �0.008 0.072 0.362 �0.061 0.046 0.088 0.013 �0.131 �0.020 �0.168a 0.084 0.005 �0.018 0.042 �0.066 0.112 0.011 0.062 0.053 �0.053 0.023 �0.051d 0.025 0.018 �0.081 0.035 �0.085 0.011 0.000 �0.080 0.099 0.155 0.203Pred �0.040 �0.147 �0.242 0.027 0.001 �0.013 �0.077 0.038 0.017 0.140e 0.061 0.106 �0.040 0.043 �0.007 0.041 0.052 0.022 �0.045k �0.198 �0.055 0.051 �0.022 �0.042 0.091 �0.030 �0.266s �0.046 0.074 0.127 0.056 �0.177 0.103 �0.401a 0.023 0.086 �0.094 0.150 0.205 0.157b �0.044 0.029 0.002 �0.054 �0.046g 0.016 �0.029 0.021 0.080l 0.144 0.036 0.101m �0.107 �0.2608 0.420y
aBold numbers correspond to correlation coefficients with absolute value greater than 0.250.
Figure 2. Scatterplots of the likelihood measure 1/s2 versus the eutrophication model parameters a, e, s,a, m, and y .
W01420 ARHONDITSIS ET AL.: UNCERTAINTY IN EUTROPHICATION MODELS
9 of 19
W01420

limits. Interestingly, the optimization of the model (notpresented here) using Powell’s direct pattern search andFletcher-Reeves conjugate gradient method along with acost function that equally weights the four state variablesgave almost the same results and only slightly improved therepresentations of the mid/late spring plankton dynamics.Thus we hypothesized that the former result is probablyassociated with the model error structure, while the latterstems from the inaccuracy of the proxy used for therepresentation of the particulate phosphorus exogenousloadings. Whether the model lack of fit along with theminor shifts of the updated parameter distributions reflectinefficient sampling from misformulated prior parameterdistributions or model misspecification (e.g., inadequatemodel structure and/or inaccurate boundary conditions)was further examined with the MCMC sampling scheme.Finally, the use of alternative likelihood measures, that is,the relative error (threshold value � 40%) and the modelingefficiency (�0.4), provided relatively similar results regardingthe posterior parameter statistics and the predictive uncer-tainty bounds, although we found a 60–80% overlapamong the three subsets of behavioral runs derived fromthe different measures of fit.
3.2. Bayesian Formulations
[30] The two MCMC sequences of the three modelsconverged rapidly (�5000 iterations) and the statisticsreported in this study were based on the last 25,000 draws
by keeping every 10th iteration (thin = 10). The uncertaintyunderlying the values of the 14 model parameters after theMCMC sampling is depicted on the respective marginalposterior distributions (Table 4 and Figure 4). Generally, thestandard deviation of the posterior parameter distributionswere significantly reduced with the first statistical formula-tion (Model 1); characteristic examples were the half-saturation constant for predation (pred), the cross-thermo-cline exchange rate (k), the phytoplankton sinking loss rate(s), the detritus mineralization (8) and sinking rates (y) witha relative decrease higher than 80%. On the other hand, theinclusion of the seasonally invariant stochastic term thataccounts for the discrepancy between the model and the realsystem resulted in higher standard deviations for most of theparameters, and, in some cases, our knowledge did notimprove relative to what we knew prior to the calibration(e.g., higher predation on zooplankton (d), half-saturationconstant for predation (pred), and cross-thermoclineexchange rate (k)). The latter finding indicates thatthe discrepancy term in Model 2 mainly improves ourknowledge on the natural system dynamics (see thefollowing results) but gives little information regardingthe values of the calibration vector [Arhonditsis et al.,2007a]. The addition of a seasonally variant discrepancyterm (Model 3) was more informative for some parameters,for example, the detritus mineralization (8) and sinkingrates (y), the phytoplankton maximum growth (a) andsinking rates (s), and half-saturation constant for PO4 uptake
Figure 3. Observed monthly values versus the likelihood-weighted mean predicted values for totalphosphorus, phosphate, chlorophyll a (1 g carbon = 20 mg chlorophyll), and zooplankton biomass basedon the generalized likelihood uncertainty estimation (GLUE) analysis (black lines). Grey lines correspondto the posterior predictive monthly distributions from Model 1. Dashed lines correspond to the 2.5 and97.5% uncertainty bounds of the two models. Single dots and the respective black lines correspond to themonthly averages and standard deviations, reflecting the analytical error and the interannual variability inthe lake over the 10-a period, 1994–2003. (The modeled total phosphorus concentrations comprise threephosphorus pools, i.e., phosphate, detritus, and phosphorus sequestered in phytoplankton cells.)
10 of 19
W01420 ARHONDITSIS ET AL.: UNCERTAINTY IN EUTROPHICATION MODELS W01420

(e) (relative decrease >60%), while others remainedunaltered with respect to their standard deviations. Generally,our results are fairly similar to those reported in theHigdon etal. [2004] study (see their Figures 3 and 11), suggesting thatthe effects of the discrepancy term on the parameterposteriors can be quite variant depending on the prior modelspecification and the system being modeled.[31] In contrast with the GLUE analysis, it is interesting to
note that the central tendency of several updated distribu-tions, that is, phytoplankton respiration rate (r), detritusmineralization rate (8), zooplankton excretion fraction (b),and regeneration of zooplankton predation excretion (g)(Models 1, 2, and 3); zooplankton growth efficiency (a) andgrazing half-saturation coefficient (m) (Model 1), phyto-plankton sinking loss rate (s) (Models 2 and 3), detritussinking loss rate (y) and half-saturation constant for PO4
uptake (e) (Model 3) were shifted relative to the priorassigned values. We also used the MCMC posterior samplesfrom theModel 2 to determine the correlation structure of themodel parameters (Table 5). The comparison with the resultsderived from the GLUE analysis (Table 3) shows that therewas considerable consistency between the two correlationmatrices, although there were relationships with strongersignals (e.g., zooplankton growth efficiency (a) and phyto-plankton sinking loss rates (s)/maximum zooplanktongrazing rate (l)) and others that were not manifested underthe MCMC sampling (e.g., detritus sinking rates (y) anddetritusmineralization (8)/zooplankton grazing half-saturationcoefficient (m)). Furthermore, we found similar to theparameters patterns regarding the CV values of the priorand posterior distributions of the initial conditions; the firstmodel was more informative and resulted in reduced CVvalues (Figure 4 and Table 4).
[32] To gain insight into the third statistical formulation,we plotted the model estimates vis-a-vis the discrepancy(error) terms for the phosphate, detritus, phytoplankton, andzooplankton biomass concentrations (Figure 5). The modelestimates (i.e., the term f(q, xi, y0) in equation (16)) providedpatterns similar to those found from the GLUE analysis; themodel underestimated the observed spring phytoplankton(�300mg C/L or 6 mg chla/L) and zooplankton (�70 mg C/L)dynamics. As hypothesized in the previous section, theseresults probably stem from the model error structure alongwith the inaccuracy of the boundary conditions and arepartly accounted for by the discrepancy error terms (i.e., theterm dij in equation (16)); an indicator of how well themodel is matching reality. For example, the model’sinability to reproduce the Lake Washington spring planktondynamics can explain the higher April–May dphyt and dzoopvalues, while the relatively higher dApril,PO4 also reflects thelower contemporaneous phosphate (PO4m) concentrations.The posterior conditional variances (wj) of the seasonallyvariant discrepancies along with the four temporallyconstant error (sj) terms are shown in Figure 6. In thesecond statistical formulation, these error terms delineate aconstant zone around the model estimates for the four statevariables (i.e., the term f (q, xi, y0) in equation (12)) thataccounts for the discrepancy between the simulation modeland the natural system, and it is worth noting the relativelyhigh CV values of the detritus error term (sdet).[33] The three statistical formulations sampled with the
MCMC scheme were favorably supported by the data andwere accepted on the basis of their posterior predictive pvalues (0.103, 0.402 and 0.372 for Models 1, 2 and 3,respectively). The Bayes factor values B21 = 2.92, B31 =2.47, B23 = 1.15 did not provide strong evidence in supportof one of the three alternative models but did reflect a higherperformance of the Model 2 [Kass and Raftery, 1995,p. 777]. The comparison between the observed (monthlyaverages over the 10-a period, 1994–2003) and posteriorpredictive monthly distributions for the three statisticalformulations illustrates some features of the Bayesiancalibration. The Model 1 provides relatively similar patternsto those found from the GLUE analysis, although thesampled prior distributions were less constrained (Figure 3).For example, regarding the central tendency of thepredictive monthly distributions, we found that thepredicted median values were almost consistently lowerthan the observed mean total phosphorus levels and alsounderestimated the spring maximum phytoplankton andzooplankton biomass. As noted before, these results canpartly be attributed to the inaccurate representation of theboundary conditions (weather, exogenous loading, andvertical mixing) by simple periodic functions, while therelatively wide prediction bands for the spring planktondynamics also reflect the higher observation error used forthese months. The addition of the discrepancy terms in thesecond and third statistical formulation has significantlyimproved the results and now the model provides a good fitto the four state variables; all the observed monthly valueswere included within the 95% credible intervals (Figure 7).To more realistically account for the effects of the physicalconditions on the Lake Washington patterns, we alsoemployed a stochastic treatment of the forcing functionsof the model (i.e., the trigonometric functions provided the
Table 4. Markov Chain Monte Carlo Posterior Estimates of the
Mean Values and Standard Deviations of the Model Stochastic
Nodes
Parameter
Prior Model 1 Model 2 Model 3
Mean SD Mean SD Mean SD Mean SD
a 1.226 0.256 0.890 0.082 1.179 0.197 1.018 0.108d 0.172 0.018 0.160 0.014 0.171 0.016 0.175 0.016pred 54.11 11.54 36.37 1.367 48.76 9.883 46.84 9.016e 12.16 5.212 13.78 2.169 15.87 4.110 6.709 1.176k 0.032 0.008 0.021 0.001 0.032 0.007 0.037 0.007r 0.082 0.028 0.140 0.008 0.124 0.020 0.128 0.016s 0.038 0.024 0.031 0.004 0.055 0.014 0.078 0.010a 0.360 0.103 0.537 0.044 0.438 0.076 0.348 0.069b 0.287 0.090 0.380 0.051 0.377 0.054 0.414 0.055g 0.287 0.090 0.392 0.065 0.405 0.063 0.437 0.079l 0.606 0.090 0.638 0.063 0.550 0.061 0.542 0.061m 6.500 1.540 9.425 0.463 6.574 1.054 6.474 1.3068 0.163 0.093 0.055 0.004 0.076 0.020 0.057 0.006y 0.049 0.038 0.039 0.003 0.031 0.007 0.016 0.003sPO4 2.059 0.600schla 72.79 29.90szoop 25.44 8.631sdet 1.009 1.082wPO4 1.280 0.466wchla 92.90 45.48wzoop 18.80 6.845wdet 1.636 0.778PO4(0) 13.57 2.036 13.33 1.452 13.92 2.027 13.16 1.731PHYT(0) 61.94 9.291 85.23 13.23 68.35 12.68 63.63 12.23ZOOP(0) 15.97 2.396 16.73 1.437 18.74 3.174 19.97 6.368DET(0) 15.68 2.352 15.76 1.745 14.58 1.970 17.14 2.691
W01420 ARHONDITSIS ET AL.: UNCERTAINTY IN EUTROPHICATION MODELS
11 of 19
W01420

Figure
4.
Prior(thin
greylines)andposterior(M
odel
1,thickgreylines;Model
2,thin
black
lines;andModel
3,thickblack
lines)
distributionsoftheeutrophicationmodelparam
etersandtheinitialconditionsofthefourstatevariables.Theposteriorsdepictsm
oothed
kernel
density
estimates
based
on5000MarkovChainMonte
Carlo
(MCMC)samplesfrom
each
ofthethreemodels.
12 of 19
W01420 ARHONDITSIS ET AL.: UNCERTAINTY IN EUTROPHICATION MODELS W01420

mean of a Gaussian distribution with standard deviationassumed to be 10% of the mean values). The predictedmedian spring plankton biomass levels were relativelycloser to the lake seasonal dynamics but, not surprisingly,were also accompanied by wider prediction bands (notpresented here).
4. Discussion
[34] Elucidation of the equifinality and uncertainty pat-terns in the multidimensional parameter spaces of mathe-matical models involves two critical decisions: (1) selectionof the sampling scheme for generating input vectors, whichthen are evaluated with regards to the model performance,and (2) selection of the statistical problem description; thatis, which likelihood function should we use and why? Theformer decision addresses the sampling efficiency of theapproach (Random sampling, Latin hypercube, MCMC),while the latter one entails conceptual dilemmas (general-ized or purely probabilistic likelihood functions) that cansignificantly alter the results. In this study, we examined theefficiency of two uncertainty analysis strategies with verydistinct features, a generalized likelihood uncertainty esti-mation (GLUE) approach combined with a simple MonteCarlo sampling scheme and a Bayesian framework alongwith Markov Chain Monte Carlo (MCMC) simulations.Given the differences in the configuration of the twostrategies, our aim was not to directly compare alternativemodel likelihood functions (or sampling schemes), butrather to illustrate the suite of techniques available foraddressing equifinality and uncertainty in eutrophicationmodels. Nonetheless, some of the (dis)similarities in thepatterns of the posterior parameter distributions, correlationstructure and predictive uncertainty can have prescriptivevalue and/or dictate future directions of the modelingpractice.
4.1. Sampling Schemes
[35] Like other Bayesian-like algorithms, GLUE is typi-cally combined with Monte Carlo sampling schemes, whichdraw samples uniformly and independently from the plau-sible parameter ranges. As a result, the Monte Carlosamples can misrepresent (or insufficiently cover) regionsof high model likelihood; especially, when the joint priorparameter distribution is very wide or the parameters arehighly correlated [Qian et al., 2003]. In contrast with the
large majority of the published GLUE applications, weattempted to optimize the efficiency of our samplingstrategy by forming informative prior distributions fromexisting scientific knowledge, past experience and resultsfrom a preliminary exploratory analysis. With this config-uration of our Monte Carlo sampling strategy, our intentwas to focus on a subregion of the parameter space wherethere was evidence for higher likelihood of realisticreproduction of the system dynamics. Nonetheless, theresulting acceptance rate (�1.3%) was still not higher thanthose reported in other studies, while the predictive outputsof the ‘‘behavioral’’ subset were characterized by twosystematic errors; the misreproduction of the timing/magnitude of the spring plankton dynamics and theunderestimation of the total phosphorus levels throughoutthe annual cycle. Given that the degree of updating of themodel input parameters (i.e., reduction in the parameteruncertainty and shifts in the most likely value) wasrelatively limited, it was unclear whether these results weremainly driven by inefficient sampling of an ill-defined priorparameter space or by shortcomings of the eutrophicationmodel structure and forcing functions.[36] The latter issue was unequivocally clarified by the
use of less constrained prior distributions along with theimplementation of a MCMC sampling scheme; a methodspecifically designed to sample directly from the posteriordistribution and to converge to the most probable region[Gelman et al., 1995]. In particular, the statistical formula-tion that only considers the observation error (Model 1)provided relatively similar patterns and verified that thepredictive bias is actually associated with the prior modelspecification (e.g., inadequacy of the model structure and/orinaccuracy of the boundary conditions). Generally, theMCMC procedure provided a convenient means toefficiently sample the parameter space of our intermediatecomplexity eutrophication model; we found that 30,000samples with a fairly straightforward algorithm (i.e., generalnormal-proposal Metropolis) gave adequate summarystatistics of the posterior parameter distributions and thepredictive model outputs. Although more advanced proce-dures are available [Gilks et al., 1998], several modelingstudies from a variety of disciplines indicated that evensimpler MCMC schemes can overcome the lack ofanalytical expressions for the posterior probability distribu-tion [Van Oijen et al., 2005]; typical problem with the
Table 5. Correlation Matrix of the Eutrophication Model Parameters Based on MCMC Posterior Samples, Model 2a
a d Pred e k r s a b g l m 8 Y
�0.037 0.059 0.583 0.119 0.176 0.398 �0.003 0.120 0.005 �0.068 �0.021 �0.117 �0.286a 0.044 �0.097 �0.058 0.046 0.079 0.158 �0.008 0.038 0.051 �0.212 �0.036 0.008d 0.062 �0.134 0.011 �0.029 �0.155 0.037 �0.010 �0.095 0.302 0.006 �0.024Pred 0.007 �0.108 �0.351 �0.223 �0.083 �0.055 �0.005 0.013 �0.090 0.018e 0.017 0.177 0.039 0.125 �0.045 0.016 0.035 �0.093 0.030k �0.037 �0.045 0.063 �0.010 �0.111 0.087 �0.025 �0.067s 0.347 0.208 0.096 �0.065 �0.056 0.015 �0.397a �0.085 �0.032 �0.252 0.302 0.081 0.180b 0.031 �0.085 0.145 �0.123 0.057g �0.117 0.027 �0.080 �0.057l 0.195 0.081 0.228m �0.247 �0.0508 0.190y
aBold numbers correspond to correlation coefficients with absolute value greater than 0.250. MCMC, Markov Chain Monte Carlo.
W01420 ARHONDITSIS ET AL.: UNCERTAINTY IN EUTROPHICATION MODELS
13 of 19
W01420

nonlinear parameterizations used in eutrophication model-ing. Moreover, other model inputs (e.g., initial conditionsand boundary conditions) were also treated stochasticallywithout the need to generate significantly more MCMCruns, which indicates that as long as the number ofparameters that drive the model outputs does not changesignificantly, then the number of runs required to suffi-ciently approximate the posterior will be roughly the same[Jansen and Hagenaars, 2004]. In contrast, the simpleMonte Carlo sampling followed in the GLUE presentation
was less efficient; characteristic example was the unin-formative patterns of the univariate marginal parameterdistributions (see Figure 2), despite the use of 60,000samples (twice the number of the MCMC samples) fromrelatively truncated prior parameter distributions and thecompromises made regarding the way initial conditions andboundary conditions were handled. Although beyond thescope of the present paper, an interesting topic for futureresearch will be the combination of MCMC schemes withthe GLUE methodology [Vrugt et al., 2002].
Figure 5. Time series plots of the model estimates (the term f(q, xi, y0) in equation (16)) and the errorterms (the term dij in equation (16)), representing the discrepancy between the model and the naturalsystem, for the phosphate, detritus, phytoplankton, and zooplankton biomass concentrations (Model 3).
14 of 19
W01420 ARHONDITSIS ET AL.: UNCERTAINTY IN EUTROPHICATION MODELS W01420

4.2. Likelihood Functions
[37] GLUE is a conceptually straightforward methodologyin which a broad range of likelihood measures can be usedto define the model error structure and to delineate plausibleregions of parameter values [Beven, 2001]. Generally, it isbelieved that the GLUE methodology is perhaps concep-tually better suited to highly dimensional input spaces withsignificant equifinality problems, because model responsesurfaces are more complex than smooth, single-peakeddistributions (see discussion in the paper by Kennedy andO’Hagan [2001]). From a statistical inference viewpoint,however, the lack of formal representation of the modelerror has been criticized for providing biased parameterestimates when not taking into account the correct model
error structure and for resulting in likelihoods that do notcorrespond to the true probabilities of predicting an outputgiven the model [Thiemann et al., 2001]. Some of theeffects of the nonprobabilistic likelihood functions werealso manifested in our study. For example, the likelihoodfunction used for the presented results (equation (1))depends heavily on an expectation that good modelsolutions do not exist; thus, if a good parameter set isactually found then the assigned likelihood weight can bevery high relative to all other sets. This effect can already beseen in the best simulations of the scatter plots (Figure 2).Furthermore, the use of alternative likelihood measures (i.e.,the relative error and the modeling efficiency) resulted in a60–80% overlap among the three subsets of behavioral runsderived from the different measures of fit, despite the
Figure 6. Posterior distributions of the s (seasonally invariant discrepancy between the simulationmodel and the natural system) and w (conditional variance of the seasonally variant discrepancy) terms ofthe second and third statistical formulations, respectively.
W01420 ARHONDITSIS ET AL.: UNCERTAINTY IN EUTROPHICATION MODELS
15 of 19
W01420

relatively similar posterior parameter statistics and pre-dictive uncertainty bounds.[38] On the other hand, the appropriateness of the formal
(e.g., Gaussian) likelihoods for complex overparameterizedmechanistic models frequently used in eutrophication re-search has not been explored yet in the modeling literature.In this study, we started with a statistical formulation thatassumed a ‘‘perfect’’ model structure and additive (ormultiplicative) measurement errors. Combined with aMCMC scheme, this approach generates a series of modelrealizations each of which is evaluated, assuming that themodel is correct [Beven, 2006]. The stretching of the modellikelihood surface implied by these assumptions should leadto overconditioning of the parameter estimates owing to anoverestimation of the information content of the observa-tions/residuals given the potential for model error. The latterassertion can probably explain the narrow-shaped posteriorparameter distributions derived from the first statisticalformulation (Figure 4), which then may lead to nonbeha-vioral simulations when used under different conditions.[39] The introduction of two models that explicitly
acknowledge the lack of perfect simulators of naturalsystem dynamics is a conceptual advancement over the firststatistical formulation. In this study, we found that theinclusion of error terms that explicitly account for the(variant or invariant with the input conditions) discrepancybetween mathematical model and environmental systemimproved the model predictions and all the observedmonthly values were included within the 95% credibleintervals. However, it should be emphasized that despite
the promising results, this modeling framework will possiblyrequire substantial modifications to accommodate highlymultivariate outputs. Although, in a follow up study, wefound that the inclusion of several more state variablesdoes not have an effect on the consistency of the results[Arhonditsis et al., 2007b], the consideration of multipleerror sources often entails overparameterized formulations,for example, the third model in which 12 parameters perstate variable are used to describe the seasonal variability inthe error variance. In this direction, several interesting ideashave been proposed in the literature, such as dimensionreduction strategies, adaptive designs to overcome limitednumber of simulation runs, and replacement of thesimulators with statistical models that encompass keyfeatures of the modeled system [Craig et al., 2001; Wikleet al., 2001; Goldstein and Rougier, 2004; Higdon et al.,2004]. In the modeling practice, our experience is that onlya subset of the input parameters is influential on the modeloutputs [Arhonditsis and Brett, 2005a], and therefore aneffective calibration does not necessarily require statisticalformulations framed in a hyperdimensional context[Kennedy and O’Hagan, 2001]. An alternative strategywill resemble the modeling framework used in this study;intermediate complexity models that provide realistic plat-forms for reproducing real world dynamics while conform-ing to the parsimony principle.[40] In conclusion, we examined the efficiency of two
methodological frameworks, a generalized likelihood un-certainty estimation (GLUE) approach combined with asimple Monte Carlo sampling scheme and a Bayesian
Figure 7. Comparison between the observed and posterior predictive monthly distributions forphosphate, total phosphorus, chlorophyll a, and zooplankton biomass based on 5000 Markov ChainMonte Carlo posterior samples from Model 2 (black line) and Model 3 (grey line). Single dots and therespective black lines correspond to the monthly averages and standard deviations, reflecting theanalytical error and the interannual variability in the lake over the 10-a period, 1994–2003.
16 of 19
W01420 ARHONDITSIS ET AL.: UNCERTAINTY IN EUTROPHICATION MODELS W01420

methodological framework along with Markov Chain MonteCarlo (MCMC) simulations, to quantify the information thedata contain about model inputs, to offer insights into thecovariance structure among parameter estimates, and toobtain predictions along with uncertainty bounds for mod-eled output variables. GLUE has been criticized for itsstatistical correctness owing to the use of a variety ofgoodness-of-fit measures, but the same relaxation of thelikelihood functions usedmake this methodology appropriatefor a wide range of model complexity. On the other hand, theformal probabilistic models provide sound statistical infer-ence, but the stretching of the model response surfaces byinappropriate likelihoods can provide misleading results andundermine their credibility for predicting future conditions.The inclusion of multiple error sources (e.g., measurementerror, parametric error, and model structure imperfection)into the probabilistic likelihoods provides a promising frame-work for assessing predictive uncertainty, and future researchshould involve the examination of its suitability for morecomplex models extensively used in eutrophication manage-ment. Our study also highlights the efficiency of MCMCsampling schemes, specifically designed to sample directlyfrom the posterior distribution, to fully employ Bayesianinference techniques which then can be easily integratedwith, at least, intermediate complexity mechanistic models(�10 state variables). Given the substantial model forecastuncertainty in most water quality models, the arbitraryselection of higher, and often unattainable, threshold valuesfor environmental variables (quality goals/standards), riskymodel-based management decisions and unanticipated systemresponses are the norm in current management practice. Thedevelopment of novel methods that can accommodate rig-orous and complete error analysis is an imperative challengefor the future of environmental modeling [Pappenberger andBeven, 2006; Arhonditsis et al., 2006].
Appendix A: Specific Functional Forms of theEutrophication Model
[41] The specific functional forms of the eutrophicationmodel.
dPO4
dt¼ � PO4
eþ PO4
as tð ÞPHYT P=Cphyto
þbl PHYT � P=Cphyto
� �2þwDET2� �
m2 þ PHYT � P=Cphyto
� �2 þ wDET 2s tzð ÞZOOP P=Czoop
ðA1Þ
þgds tzð ÞZOOP3
pred2 þ ZOOP2P=Czoop þ fs tð ÞDET
þ k 1� s tð Þ� �
PO4 hypoð Þ � PO4
� �þ PO4exog ðA2Þ
�outflows � PO4 ðA3Þ
s tð Þ ¼1� e cos 2pt
365
� �� �1þ e
s tzð Þ ¼1� e cos 2pt
365� 0:5
� �� �1þ e
ðA4Þ
PO4 hypoð Þ ¼ 11þ 3 sin 2p t=365þ 0:3ð Þð Þ
PO4exog ¼ 0:047þ 0:02 sin 2p t=365þ 0:12ð Þð Þ
outflows ¼ 0:0028þ 0:0014 sin 2p t=365þ 0:12ð Þð Þ
ðA5Þ
dPHYT
dt¼ PO4
eþ PO4
as tð ÞPHYT � rs tð ÞPHYT
�l PHYT � P=Cphyto
� �2m2 þ PHYT � P=Cphyto
� �2 þ wDET 2s tzð ÞZOOP ðA6Þ
�sPHYT � outflows � PHYT ðA7Þ
dZOOP
dt¼
al PHYT � P=Cphyto
� �2þwDET 2� �
m2 þ PHYT � P=Cphyto
� �2 þ wDET 2s tzð ÞZOOP
� ds tzð ÞZOOP3
pred2 þ ZOOP2� outflows � ZOOP ðA8Þ
dDET
dt¼ rs tð ÞPHYT P=Cphyto
þ1� a� bð Þ PHYT � P=Cphyto
� �2� aþ bð ÞwDET 2h i
l
m2 þ PHYT � P=Cphyto
� �2 þ wDET2
� s tzð ÞZOOP P=Czoop ðA9Þ
�8s tð ÞDET � yDET þ DETexog � outflows � DET ðA10Þ
DETexog ¼ 0:2þ 0:12 sin 2p t=365þ 0:16ð Þð Þ ðA11Þ
[42] Acknowledgments. Funding for this study was provided by theNational Sciences and Engineering Research Council of Canada (NSERC,Discovery Grants), the Connaught Committee (University of Toronto,Matching Grants 2006–2007), and the Summer Career Placement Program(Human Resources Development Canada). Keith Beven and two anony-mous reviewers offered excellent comments on an earlier version of themanuscript. We also wish to thank Maria Kouzelli-Arhonditsi for interest-ing suggestions on the presentation of our results. All the material pertinentto this study is available upon request from the first author.
ReferencesArhonditsis, G. B., and M. T. Brett (2004), Evaluation of the current state ofmechanistic aquatic biogeochemical modeling, Mar. Ecol. Prog. Ser.,271, 13–26.
Arhonditsis, G. B., and M. T. Brett (2005a), Eutrophication model for LakeWashington (USA): part I, Model description and sensitivity analysis,Ecol. Modell., 187, 140–178.
Arhonditsis, G. B., and M. T. Brett (2005b), Eutrophication model for LakeWashington (USA): part II, Model calibration and system dynamics ana-lysis, Ecol. Modell., 187, 179–200.
Arhonditsis, G., M. T. Brett, and J. Frodge (2003), Environmental controland limnological impacts of a large recurrent spring bloom in LakeWashington, USA, Environ. Manage., 31, 603–618.
Arhonditsis, G. B., B. A. Adams-VanHarn, L. Nielsen, C. A. Stow, andK. H. Reckhow (2006), Evaluation of the current state of mechanisticaquatic biogeochemical modeling: citation analysis and future perspec-tives, Environ. Sci. Technol., 40, 6547–6554.
Arhonditsis, G. B., S. S. Qian, C. A. Stow, E. C. Lamon, and K. H.Reckhow (2007a), Eutrophication risk assessment using Bayesian cali-
W01420 ARHONDITSIS ET AL.: UNCERTAINTY IN EUTROPHICATION MODELS
17 of 19
W01420

bration of process-based models: Application to a mesotrophic lake,Ecol. Modell., 208, 215–229.
Arhonditsis, G. B., D. Papantou,W. Zhang, G. Perhar, E.Massos, andM. Shi(2007b), Bayesian calibration of mechanistic aquatic biogeochemicalmodels and benefits for environmental management, J. Mar. Syst., in press.
Beck, M. B. (1987), Water-quality modeling: A review of the analysis ofuncertainty, Water Resour. Res., 23, 1393–1442.
Beven, K. (1993), Prophecy, reality and uncertainty in distributed hydro-logical modeling, Adv. Water Resour., 16, 41–51.
Beven, K. J. (2001), Rainfall-Runoff Modeling: The Primer, 360 pp., JohnWiley, New York.
Beven, K. J. (2006), A manifesto for the equifinality thesis, J. Hydrol., 320,18–36.
Beven, K., and A. Binley (1992), The future of distributed models: Modelcalibration and uncertainty prediction, Hydrol. Processes, 6, 279–298.
Brett, M. T., S. E. Mueller, and G. B. Arhonditsis (2005), A daily timeseries analysis of stream water phosphorus concentrations along an urbanto forest gradient, Environ. Manage., 35, 56–71.
Brooks, S. P., and A. Gelman (1998), General methods for monitoringconvergence of iterative simulations, J. Comput. Graph Stat., 7, 434–455.
Brun, R., P. Reichert, and H. R. Kunsch (2001), Practical identifiabilityanalysis of large environmental simulation models, Water Resour. Res.,37, 1015–1030.
Casella, G., and E. I. George (1992), Explaining the Gibbs sampler, Am.Stat., 46, 167–174.
Chapra, S. C. and R. P. Canale (1998), Numerical Methods for Engineers,3rd ed., 924 pp., McGraw-Hill, New York.
Craig, P. S., M. Goldstein, J. C. Rougier, and A. H. Seheult (2001), Baye-sian forecasting for complex systems using computer simulators, J. Am.Stat. Assoc., 96, 717–729.
Dilks, D. W., R. P. Canale, and P. G. Meier (1992), Development of Baye-sian Monte-Carlo techniques for water-quality model uncertainty, Ecol.Modell., 62, 149–162.
Di Toro, D. M. and G. van Straten (1979), Uncertainty in the parametersand predictions of phytoplankton models, WP-79-27, Int. Inst. for Appl.Syst. Anal., Laxenburg, Austria.
Edmondson, W. T. (1994), Sixty years of Lake Washington: A curriculumvitae, Lake Reservoir Manage., 10, 75–84.
Edwards, A. M., and A. Yool (2000), The role of higher predation inplankton population models, J. Plankton Res., 22, 1085–1112.
Engeland, K., and L. Gottschalk (2002), Bayesian estimation of parametersin a regional hydrological model, Hydrol. Earth Syst. Sci., 6, 883–898.
Franks, S. W., P. Gineste, K. J. Beven, and P. Merot (1998), On constrainingthe predictions of a distributed models: The incorporation of fuzzy esti-mates of saturated areas into the calibration process, Water Resour. Res.,34, 787–797.
Freer, J., J. McDonnell, K. J. Beven, D. Brammer, D. Burns, R. P. Hooper,and C. Kendal (1997), Topographic controls on subsurface storm flow atthe hillslope scale for two hydrologically distinct small catchments,Hydrol. Processes, 11, 1347–1352.
Gelfand, A. E., and A. F. M. Smith (1990), Sampling based approaches tocalculating marginal densities, J. Am. Stat. Assoc., 85, 398–409.
Gelman, A. (2005), Prior distributions for variance parameters in hierarch-ical models, Bayesian Anal., 1, 1–19.
Gelman, A., J. B. Carlin, H. S. Stern, and D. B. Rubin (1995), BayesianData Analysis, 518 pp., Chapman and Hall, New York.
Gelman, A., X. L. Meng, and H. Stern (1996), Posterior predictive assess-ment of model fitness via realized discrepancies, Stat. Sin., 6, 733–807.
Gilks, W. R., S. Richardson, and D. J. Spiegelhalter (1998), Markov ChainMonte Carlo in Practice, 512 pp., CRC, Boca Raton, Fla.
Goldstein, M., and J. Rougier (2004), Probabilistic formulations for trans-ferring inferences from mathematical models to physical systems, SIAMJ. Sci. Comput., 26, 467–487.
Grover, J. P. (1991), Resource competition in a variable environment: Phy-toplankton growing according to the Variable-Internal-Stores model, Am.Nat., 138, 811–835.
Hastings, W. K. (1970), Monte-Carlo Sampling methods using MarkovChains and their applications, Biometrika, 57, 97–109.
Higdon, D., M. Kennedy, J. C. Cavendish, J. A. Cafeo, and R. D. Ryne(2004), Combining field data and computer simulations for calibrationand prediction, SIAM J. Sci. Comput., 26, 448–466.
Hong, B. G., R. L. Strawderman, D. P. Swaney, and D. A. Weinstein (2005),Bayesian estimation of input parameters of a nitrogen cycle model appliedto a forested reference watershed, Hubbard Brook Watershed Six, WaterResour. Res., 41, W03007, doi:10.1029/2004WR003551.
Hornberger, G. M., and R. C. Spear (1981), An approach to the preliminaryanalysis of environmental systems, J. Environ. Manage., 12, 7–18.
Jansen, M. J. W., and T. J. Hagenaars (2004), Calibration in a Bayesianmodeling framework, in Bayesian Statistics and Quality Modeling inthe Agro-Food Production Chain, edited by M. A. J. S. Van Boekel,A. Stein, and A. H. C. Van Bruggen, pp. 47–55, Springer, New York.
Jorgensen, S. E., and G. Bendoricchio (2001), Fundamentals of EcologicalModelling, 3rd ed., 530 pp., Elsevier, New York.
Kass, R. E., and A. E. Raftery (1995), Bayes factors, J. Am. Stat. Assoc., 90,773–795.
Kennedy, C. M., and A. O’Hagan (2001), Bayesian calibration of computermodels, J. R. Stat. Soc., Ser. B, 63, 425–464.
Lamb, R., K. Beven, and S. Myrabo (1998), Use of spatially distributedwater table observations to constrain uncertainty in a rainfall-runoffmodel,Adv. Water Resour., 22, 305–317.
Meinhold, R. J., and N. D. Singpurwalla (1983), Understanding the KalmanFilter, Am. Stat., 37, 123–127.
Metropolis, N. (1953), Equation of state calculations by fast computingmachines, J. Chem. Phys., 21, 1087–1092.
Neal, R. (1998), Suppressing random walks in Markov chain Monte Carlousing ordered over-relaxation, in Learning in Graphical Models, editedby M. I. Jordan, pp. 205–230, Springer, New York.
Omlin, M., and P. Reichert (1999), A comparison of techniques for theestimation of model prediction uncertainty, Ecol. Modell., 115, 45–59.
Page, T., K. J. Beven, and J. D. Whyatt (2004), Predictive capability inestimating changes in water quality: Long-term responses to atmosphericdeposition, Water Air Soil Pollut., 151, 215–244.
Pappenberger, F., and K. J. Beven (2006), Ignorance is bliss: Or sevenreasons not to use uncertainty analysis, Water Resour. Res., 42,W05302, doi:10.1029/2005WR004820.
Pole, A., M. West, and P. J. Harrison (1994), Applied Bayesian Forecastingand Time Series Analysis, 409 pp., Chapman and Hall, New York.
Qian, S. S., C. A. Stow, and M. E. Borsuk (2003), On Monte Carlo methodsfor Bayesian inference, Ecol. Modell., 159, 269–277.
Ratto, M., S. Tarantola, and A. Saltelli (2001), Sensitivity analysis in modelcalibration: GSA-GLUE approach, Comput. Phys. Commun., 136, 212–224.
Reckhow, K. H. (1994), Water-quality simulation modeling and uncertaintyanalysis for risk assessment and decisionmaking,Ecol.Modell., 72, 1–20.
Reichert, P., and M. Omlin (1997), On the usefulness of overparameterizedecological models, Ecol. Modell., 95, 289–299.
Reichert, P., M. Schervish, and M. J. Small (2002), An efficient samplingtechnique for Bayesian inference with computationally demanding mod-els, Technometrics, 44, 318–327.
Schulz, K., K. Beven, and B. Huwe (1999), Equifinality and the problem ofrobust calibration in nitrogen budget simulations, Soil Sci. Soc. Am. J.,63, 1934–1941.
Shaddick, G., and J. Wakefield (2002), Modelling daily multivariate pollu-tant data at multiple sites, J. R. Stat. Soc., Ser. C, 51, 351–372.
Sorooshian, S., and V. K. Gupta (1995), Model calibration, in ComputerModels of Watershed Hydrology, edited by V. P. Singh, pp. 23–68, WaterResources Publications, Highlands Ranch, Colo.
Spear, R. C. (1997), Large simulation models: Calibration, uniqueness andgoodness of fit, Environ. Modell. Software, 12, 219–228.
Spear, R. C., and G. M. Hornberger (1980), Eutrophication in Peen Inlet: 2.Identification of critical uncertainties via generalized sensitivity analysis,Water Res., 14, 43–49.
Spear, R. C., T. M. Grieb, and N. Shang (1994), Parameter uncertainty andinteraction in complex environmental-models, Water Resour. Res., 30,3159–3169.
Steinberg, L. J., K. H. Reckhow, and R. L. Wolpert (1996), Bayesian modelfor fate and transport of polychlorinated biphenyl in upper Hudson River,J. Environ. Eng., 122, 341–349.
Steinberg, L. J., K. H. Reckhow, and R. L. Wolpert (1997), Characterizationof parameters in mechanistic models: A case study of a PCB fate andtransport model, Ecol. Modell., 97, 35–46.
Stow, C. A., C. Roessler, M. E. Borsuk, J. D. Bowen, and K. H. Reckhow(2003), Comparison of estuarine water quality models for total maximumdaily load development in Neuse River Estuary, J. Water Resour. Plann.Manage., 129, 307–314.
Thiemann, M., M. Trosset, H. Gupta, and S. Sorooshian (2001), Bayesianrecursive parameter estimation for hydrologic models, Water Resour.Res., 37, 2521–2535.
Van Oijen, M., J. Rougier, and R. Smith (2005), Bayesian calibration ofprocess-based forest models: Bridging the gap between models and data,Tree Physiol., 25, 915–927.
18 of 19
W01420 ARHONDITSIS ET AL.: UNCERTAINTY IN EUTROPHICATION MODELS W01420

Vrugt, J. A., W. Bouten, H. V. Gupta, and S. Sorooshian (2002), Towardimproved identifiability of hydrologic model parameters: The informa-tion content of experimental data, Water Resour. Res., 38(12), 1312,doi:10.1029/2001WR001118.
Wikle, C. K., R. F. Milliff, D. Nychka, and L. M. Berliner (2001), Spatio-temporal hierarchical Bayesian modeling: Tropical ocean surface winds,J. Am. Stat. Assoc., 96, 382–397.
Zak, S. K., and K. J. Beven (1999), Equifinality, sensitivity and predictiveuncertainty in the estimation of critical loads, Sci. Total Environ., 236,191–214.
Zak, S. K., K. Beven, and B. Reynolds (1997), Uncertainty in the estima-tion of critical loads: A practical methodology, Water Air Soil Pollut., 98,297–316.
����������������������������G. B. Arhonditsis, A. Das, E. Massos, G. Perhar, M. Shi, and W. Zhang,
Department of Physical and Environmental Sciences, Universityof Toronto, 1265 Military Trail, Toronto, ON, Canada M1C 1A4.([email protected])
W01420 ARHONDITSIS ET AL.: UNCERTAINTY IN EUTROPHICATION MODELS
19 of 19
W01420


