Cleopatra Hospital Companyresources.inktankir.com/clho/Cleopatra-IRP-3Q2019.pdf · Cleopatra...
63
Cleopatra Hospital Company Investor Presentation 3Q19
Transcript of Cleopatra Hospital Companyresources.inktankir.com/clho/Cleopatra-IRP-3Q2019.pdf · Cleopatra...
Cleopatra Hospital Company Investor Presentation 3Q19
2Cleopatra Investor Presentation 3Q19
Disclaimer
This presentation contains forward-looking statements, including, but not limited to, statements concerning expectations, projections,objectives, targets, goals, strategies, future events, future revenues or performance, capital expenditures, financing needs, plans orintentions relating to acquisitions, competitive strengths and weaknesses, plans or goals relating to financial position and futureoperations and development. Although Cleopatra Hospitals Group believes that the expectations and opinions reflected in such forwardlooking statements are reasonable, no assurance can be given that such expectations and opinions will prove to have been correct. Bytheir nature, these forward-looking statements are subject to a number of known and unknown risks, uncertainties and contingencies,and actual results and events could differ materially from those currently being anticipated as reflected in such statements. Importantfactors that could cause actual results to differ materially from those expressed or implied in forward-looking statements, certain ofwhich are beyond our control, include, among other things: business integration risk; compliance risk; recruitment and retention ofskilled medical practitioners risk: clinical risk; concentration of revenue; currency and macroeconomic; information technology andoperational risk; regional tensions and political risk; and other key factors that we have indicated could adversely affect our business andfinancial performance, which are contained elsewhere in this document and in our past and future filings and reports. No part of theseresults constitutes, or shall be taken to constitute, an invitation or inducement to invest in Cleopatra Hospital Group or any other entityand must not be relied upon in any way in connection with any investment decision. Cleopatra Hospital Group undertakes no obligationto update any forward-looking statements, whether as a result of new information, future events or otherwise, except to the extentlegally required. Nothing in this document should be construed as a profit forecast
3Cleopatra Investor Presentation 3Q19
Table of Contents
1. Unique Investment Story
2. Recent Business Updates
3. Expansion Strategy
4. Governance & Shareholder Information
4Cleopatra Investor Presentation 3Q19
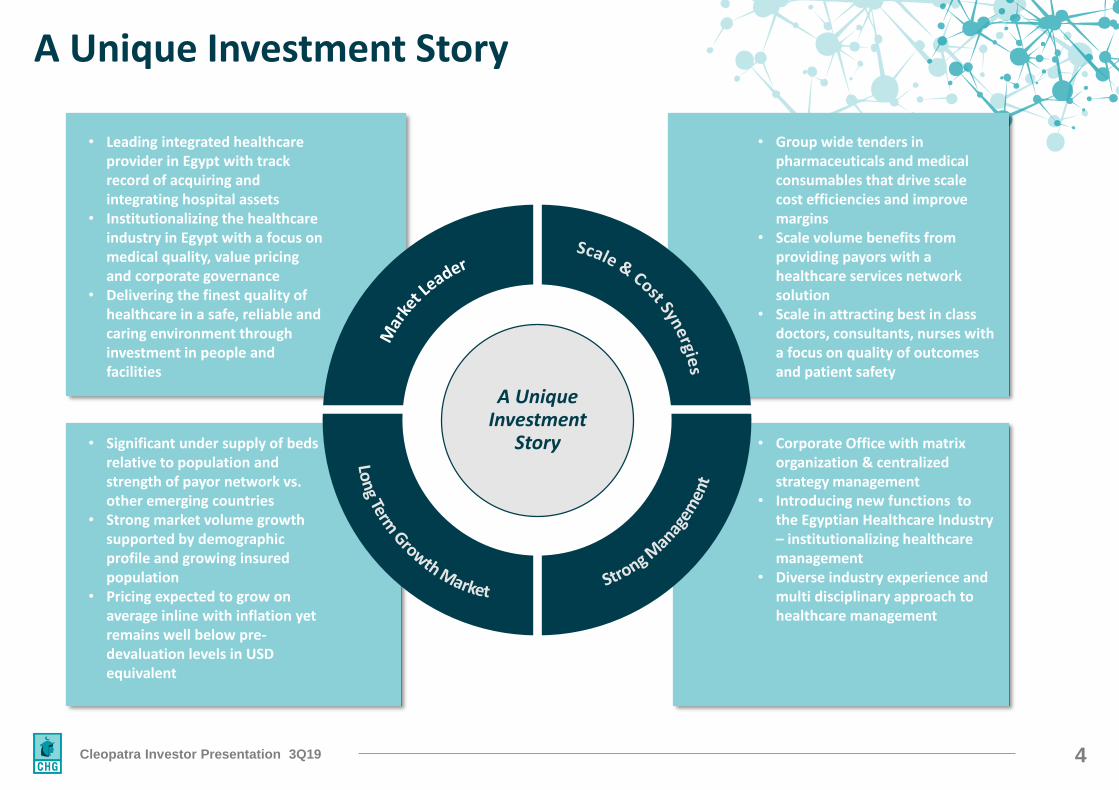
A Unique Investment
Story
• Group wide tenders in pharmaceuticals and medical consumables that drive scale cost efficiencies and improve margins
• Scale volume benefits from providing payors with a healthcare services network solution
• Scale in attracting best in class doctors, consultants, nurses with a focus on quality of outcomes and patient safety
• Corporate Office with matrix organization & centralized strategy management
• Introducing new functions to the Egyptian Healthcare Industry – institutionalizing healthcare management
• Diverse industry experience and multi disciplinary approach to healthcare management
A Unique Investment Story
• Leading integrated healthcare provider in Egypt with track record of acquiring and integrating hospital assets
• Institutionalizing the healthcare industry in Egypt with a focus on medical quality, value pricing and corporate governance
• Delivering the finest quality of healthcare in a safe, reliable and caring environment through investment in people and facilities
• Significant under supply of beds relative to population and strength of payor network vs. other emerging countries
• Strong market volume growth supported by demographic profile and growing insured population
• Pricing expected to grow on average inline with inflation yet remains well below pre-devaluation levels in USD equivalent
5Cleopatra Investor Presentation 3Q19
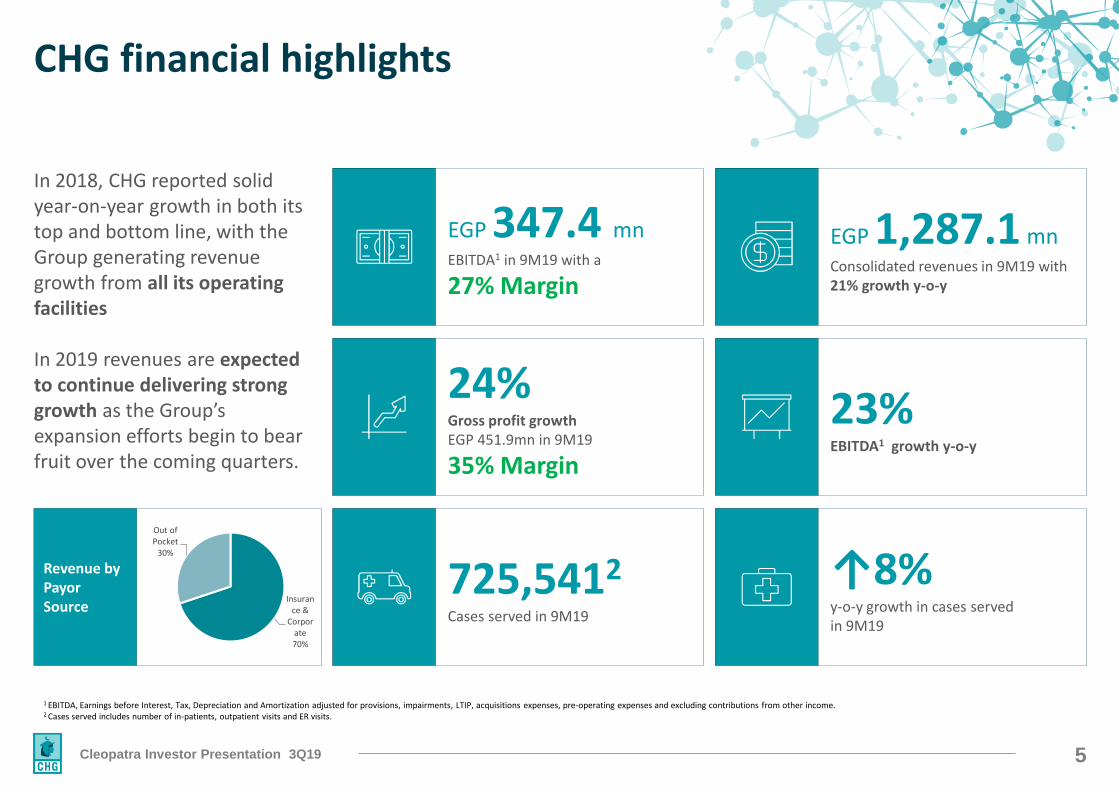
CHG financial highlights
↑8%y-o-y growth in cases served in 9M19
In 2018, CHG reported solid year-on-year growth in both its top and bottom line, with the Group generating revenue growth from all its operating facilities
In 2019 revenues are expected to continue delivering strong growth as the Group’s expansion efforts begin to bear fruit over the coming quarters.
EGP 347.4 mnEBITDA1 in 9M19 with a
27% Margin
EGP 1,287.1 mnConsolidated revenues in 9M19 with 21% growth y-o-y
24%Gross profit growthEGP 451.9mn in 9M19
35% Margin
23%EBITDA1 growth y-o-y
725,5412
Cases served in 9M19
1 EBITDA, Earnings before Interest, Tax, Depreciation and Amortization adjusted for provisions, impairments, LTIP, acquisitions expenses, pre-operating expenses and excluding contributions from other income. 2 Cases served includes number of in-patients, outpatient visits and ER visits.
Revenue by Payor Source
Insurance &
Corporate70%
Out of Pocket
30%
6Cleopatra Investor Presentation 3Q19
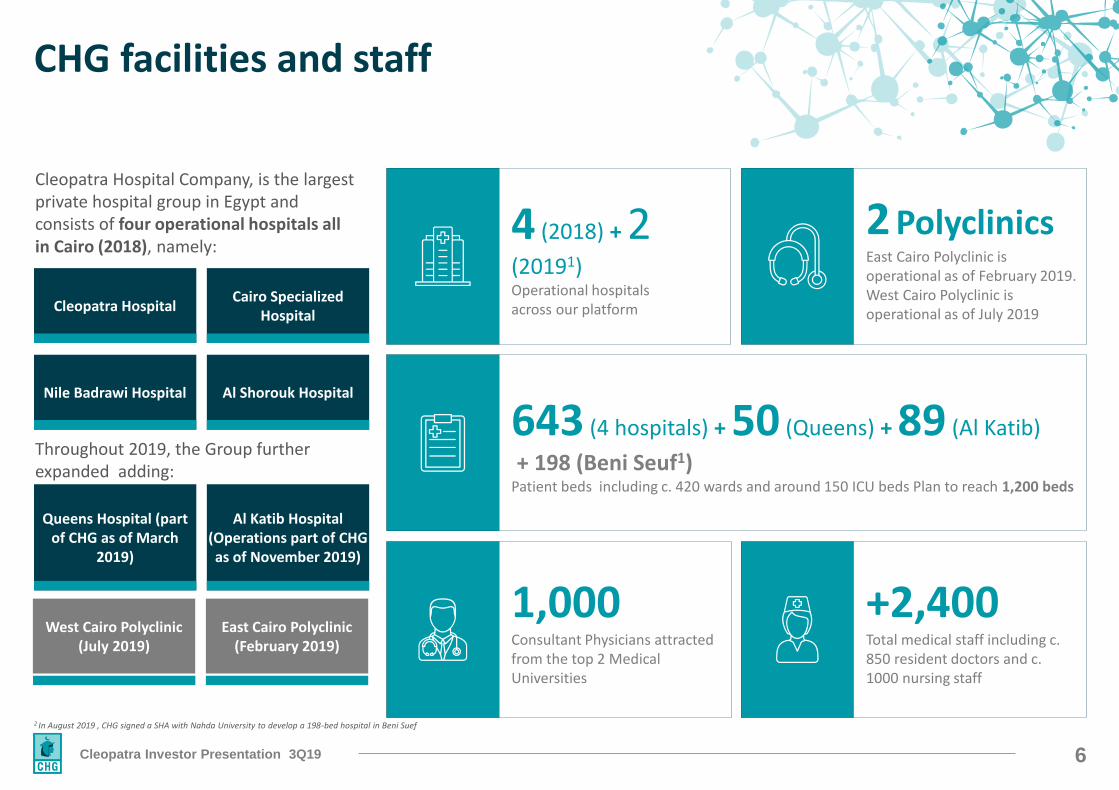
CHG facilities and staff
Cleopatra Hospital Company, is the largest private hospital group in Egypt and consists of four operational hospitals all in Cairo (2018), namely:
Cleopatra HospitalCairo Specialized
Hospital
Nile Badrawi Hospital Al Shorouk Hospital
Throughout 2019, the Group further expanded adding:
Queens Hospital (part of CHG as of March
2019)
Al Katib Hospital (Operations part of CHG as of November 2019)
2 In August 2019 , CHG signed a SHA with Nahda University to develop a 198-bed hospital in Beni Suef
4 (2018) + 2(20191) Operational hospitals across our platform
2 PolyclinicsEast Cairo Polyclinic is operational as of February 2019. West Cairo Polyclinic is operational as of July 2019
643 (4 hospitals) + 50 (Queens) + 89 (Al Katib)
+ 198 (Beni Seuf1) Patient beds including c. 420 wards and around 150 ICU beds Plan to reach 1,200 beds
1,000Consultant Physicians attracted from the top 2 Medical Universities
+2,400Total medical staff including c. 850 resident doctors and c. 1000 nursing staff
West Cairo Polyclinic(July 2019)
East Cairo Polyclinic(February 2019)
7Cleopatra Investor Presentation 3Q19
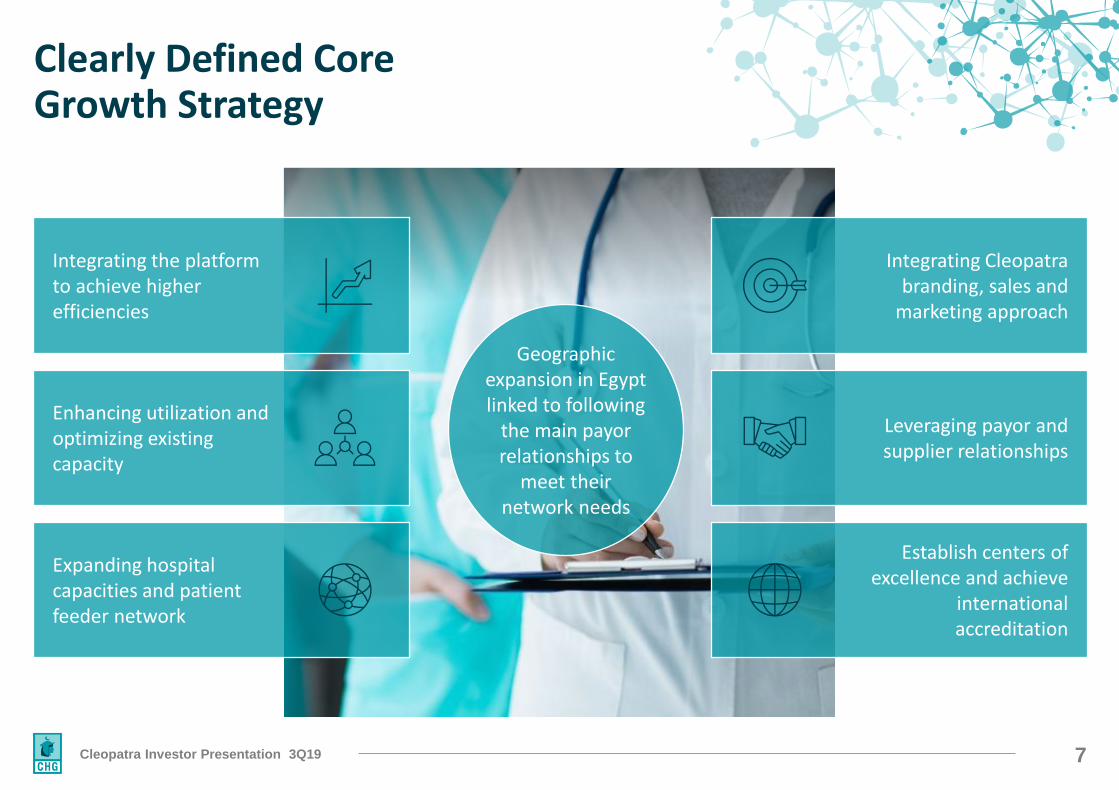
Clearly Defined Core Growth Strategy
Expanding hospital capacities and patient feeder network
Enhancing utilization and optimizing existing capacity
Integrating the platform to achieve higher efficiencies
Establish centers of excellence and achieve
international accreditation
Leveraging payor and supplier relationships
Integrating Cleopatra branding, sales and
marketing approach
Geographic expansion in Egypt linked to following
the main payor relationships to
meet their network needs
8Cleopatra Investor Presentation 3Q19
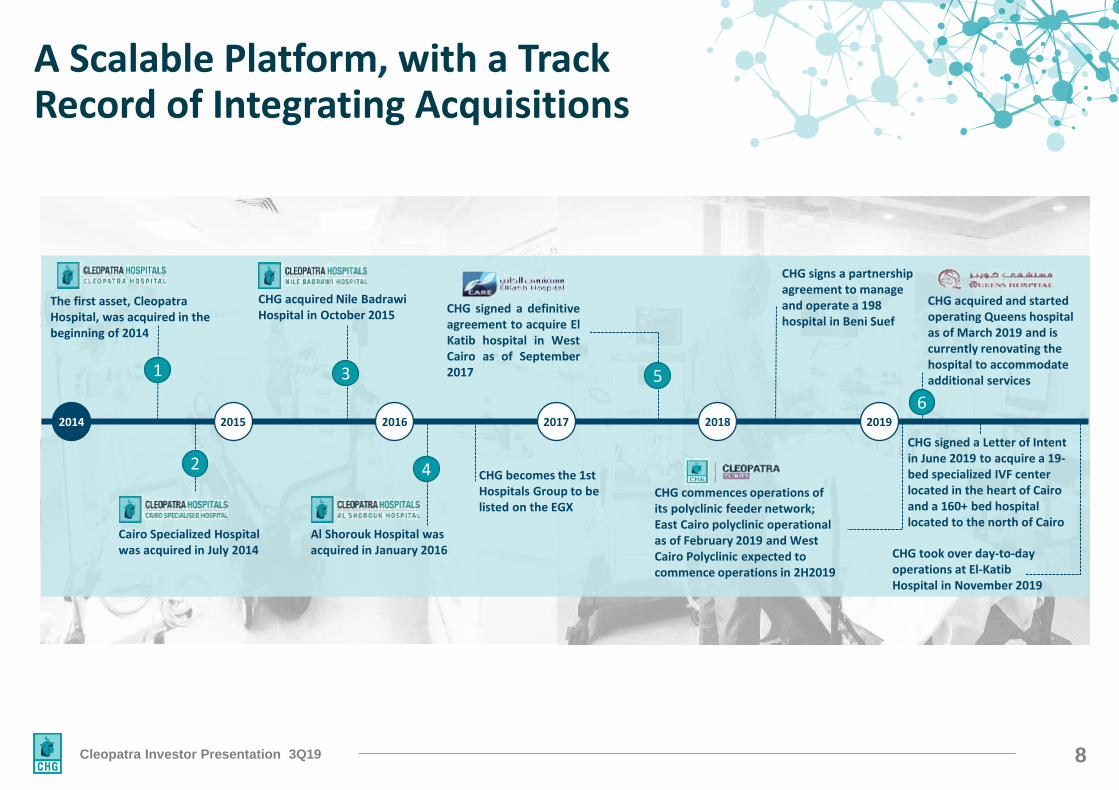
Cleopatra Hospitals, with a Track Record of Integrating AcquisitionsA Scalable Platform
CHG commences operations of its polyclinic feeder network; East Cairo polyclinic operational as of February 2019 and West Cairo Polyclinic expected to commence operations in 2H2019
CHG signed a definitiveagreement to acquire ElKatib hospital in WestCairo as of September2017
CHG acquired and started operating Queens hospital as of March 2019 and is currently renovating the hospital to accommodate additional services
CHG signed a Letter of Intent in June 2019 to acquire a 19-bed specialized IVF center located in the heart of Cairo and a 160+ bed hospital located to the north of Cairo
The first asset, Cleopatra Hospital, was acquired in the beginning of 2014
Cairo Specialized Hospital was acquired in July 2014
CHG acquired Nile Badrawi Hospital in October 2015
Al Shorouk Hospital was acquired in January 2016
2014 2016 2018 20192015 2017
CHG becomes the 1st Hospitals Group to be listed on the EGX
CHG signs a partnership agreement to manage and operate a 198 hospital in Beni Suef
CHG took over day-to-day operations at El-Katib Hospital in November 2019
1
2
3
4
5
6
9Cleopatra Investor Presentation 3Q19
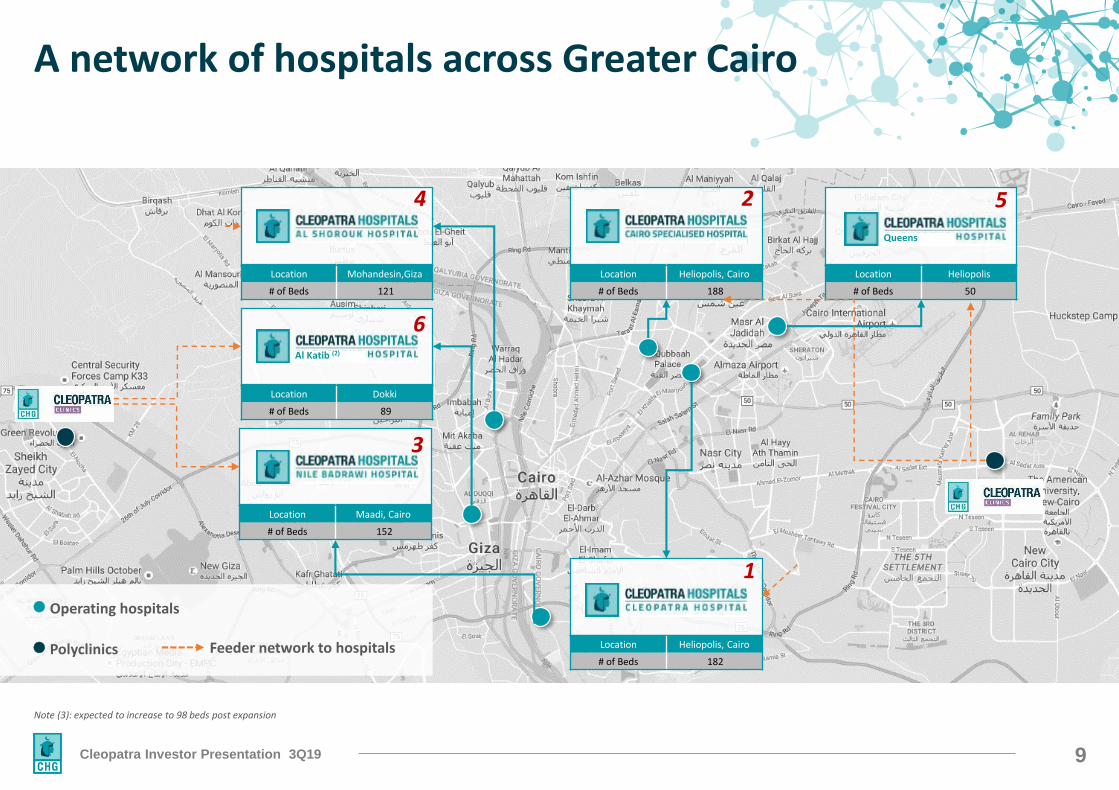
A network of hospitals across Greater Cairo
Note (3): expected to increase to 98 beds post expansion
⚫ Operating hospitals
⚫ Polyclinics Feeder network to hospitals
Location Mohandesin,Giza
# of Beds 121
Location Dokki
# of Beds 89
Location Maadi, Cairo
# of Beds 152
Location Heliopolis, Cairo
# of Beds 188
Location Heliopolis, Cairo
# of Beds 182
Location Heliopolis
# of Beds 50
Al Katib (2)
Queens
1
2
3
4 5
6
10Cleopatra Investor Presentation 3Q19
CHG Medical Council
JCI Roadmap Unified Sops &
Hospital Manuals Standardized Quality Kpis
Catering & Kitchen Upgrades
Specialty Club Meetings
Nurse & Medical Teams Training
Programs
Centralizing Non-core Functions
Unified Call Centre
Unified & Integrated
Ambulance & ER Protocols
Utilization Enhancement
Across All Segments
Medical Tourism OPD Slot
Management ICU Bed Additions
Corporate Governance
Centralized Corporate Office
Unified Authority Matrix
Expansion Strategy
Umbrella Brand Name for Each
Individual Group
Unified Pricing & Positioning
Strategy
Unified Financial Sops &
Reporting
Value Creation Plans
Standard Organizational Chart / Matrix
Org
Salary Scale Exercise
New Incentive Schemes
Health Insurance Schemes
Training & Development
Programs
Employee Satisfaction Surveying
Profit Share Schemes
Appraisal System
Group Wide Tenders
Item Unification Consumables
Unification Standard
Warehousing Medical Capex Across Group
Medication Tendering And Management
Material Planning
HIS/ERP System Roll
Out Pacs System Facelifts
COEs Equipping
OR Renovations
Electromechanical Upgrades
ICU Upgrades And Extensions
Diagnostics & Auxiliary Units
Upgrades New Cath-labs
One Stop Shop
COEsDrug
Formulary Cross Asset
Referrals
Doctor Engagement & Referrals
Unified Insurance & Corp Deals
Revenue Cycle Management
Surgical Packages
Enhancing Case Mix
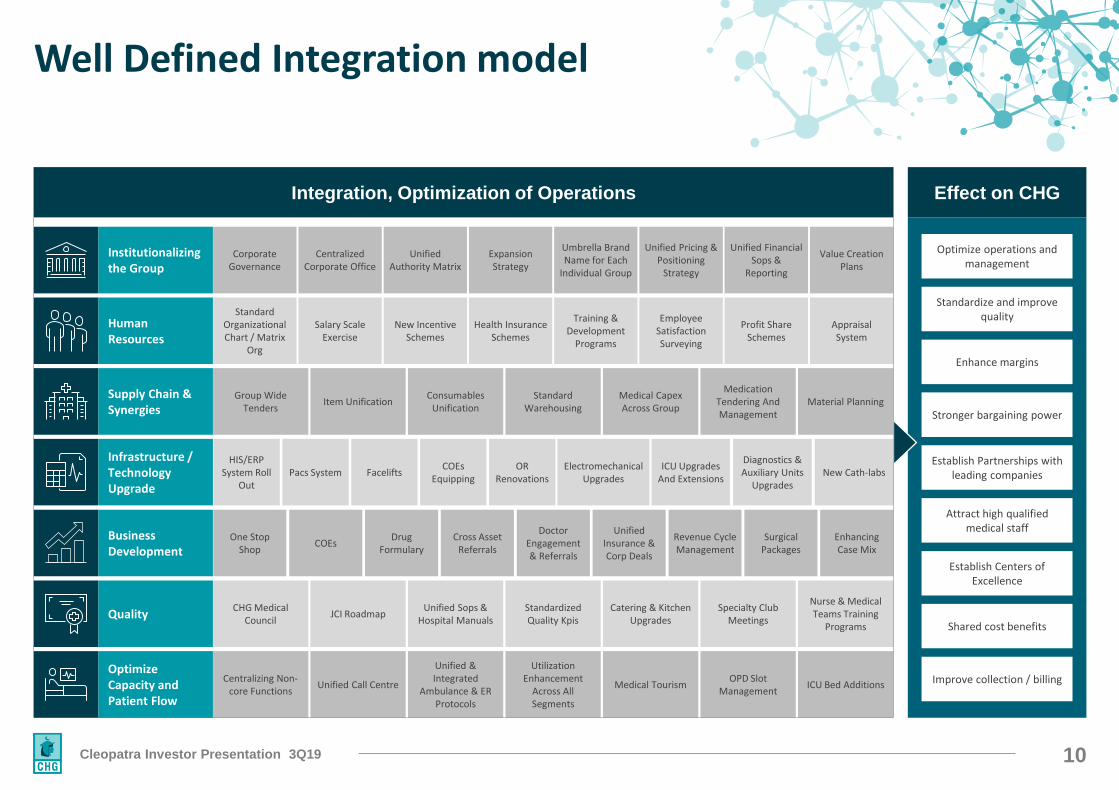
Well Defined Integration model
Integration, Optimization of Operations
Institutionalizing the Group
Human Resources
Supply Chain & Synergies
Infrastructure / Technology Upgrade
Business Development
Quality
Optimize Capacity and Patient Flow
Effect on CHG
Optimize operations and management
Standardize and improve quality
Enhance margins
Stronger bargaining power
Establish Partnerships with leading companies
Attract high qualified medical staff
Establish Centers of Excellence
Shared cost benefits
Improve collection / billing
11Cleopatra Investor Presentation 3Q19
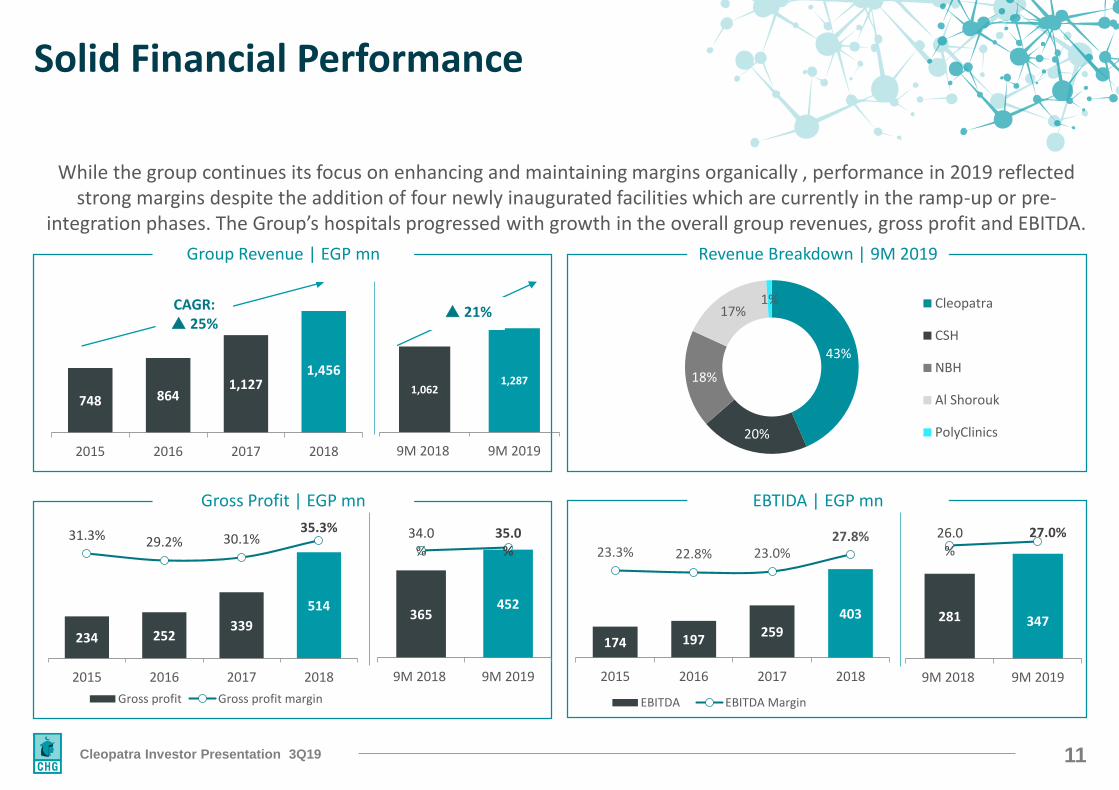
While the group continues its focus on enhancing and maintaining margins organically , performance in 2019 reflected strong margins despite the addition of four newly inaugurated facilities which are currently in the ramp-up or pre-
integration phases. The Group’s hospitals progressed with growth in the overall group revenues, gross profit and EBITDA.
Solid Financial Performance
Group Revenue | EGP mn
Gross Profit | EGP mn
Revenue Breakdown | 9M 2019
EBTIDA | EGP mn
748 8641,127
1,456
2015 2016 2017 2018
CAGR: 25%
43%
20%
18%
17%1% Cleopatra
CSH
NBH
Al Shorouk
PolyClinics
234 252339
514
31.3% 29.2% 30.1%35.3%
2015 2016 2017 2018
Gross profit Gross profit margin
174 197259
403
23.3% 22.8% 23.0%27.8%
2015 2016 2017 2018
EBITDA EBITDA Margin
1,0621,287
9M 2018 9M 2019
21%
365452
34.0%
35.0%
0
100
200
300
400
500
9M 2018 9M 2019
281 347
26.0%
27.0%
9M 2018 9M 2019
12Cleopatra Investor Presentation 3Q19
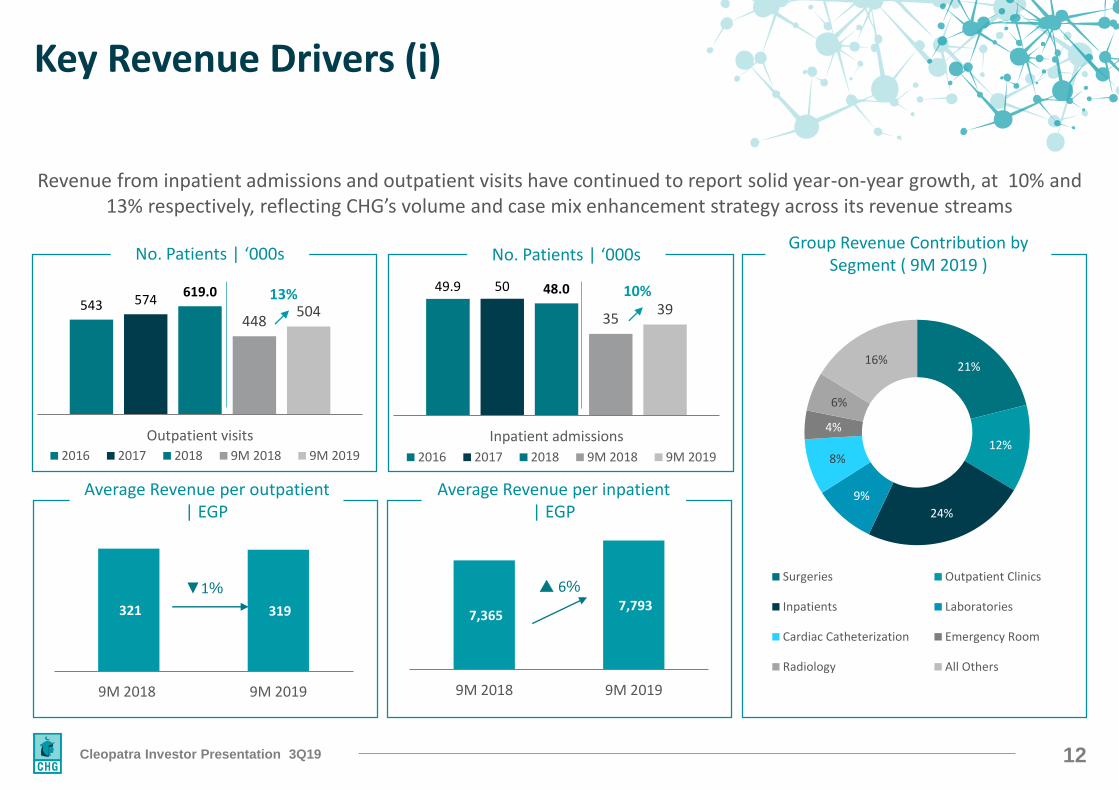
No. Patients | ‘000s
Average Revenue per outpatient | EGP
Average Revenue per inpatient | EGP
Group Revenue Contribution by Segment ( 9M 2019 )
Revenue from inpatient admissions and outpatient visits have continued to report solid year-on-year growth, at 10% and 13% respectively, reflecting CHG’s volume and case mix enhancement strategy across its revenue streams
543 574619.0
448504
Outpatient visits2016 2017 2018 9M 2018 9M 2019
321 319
9M 2018 9M 2019
▼1%
7,365 7,793
9M 2018 9M 2019
6%
21%
12%
24%
9%
8%
4%
6%
16%
Surgeries Outpatient Clinics
Inpatients Laboratories
Cardiac Catheterization Emergency Room
Radiology All Others
Key Revenue Drivers (i)
13%
No. Patients | ‘000s
49.9 50 48.0
3539
Inpatient admissions
2016 2017 2018 9M 2018 9M 2019
10%
13Cleopatra Investor Presentation 3Q19
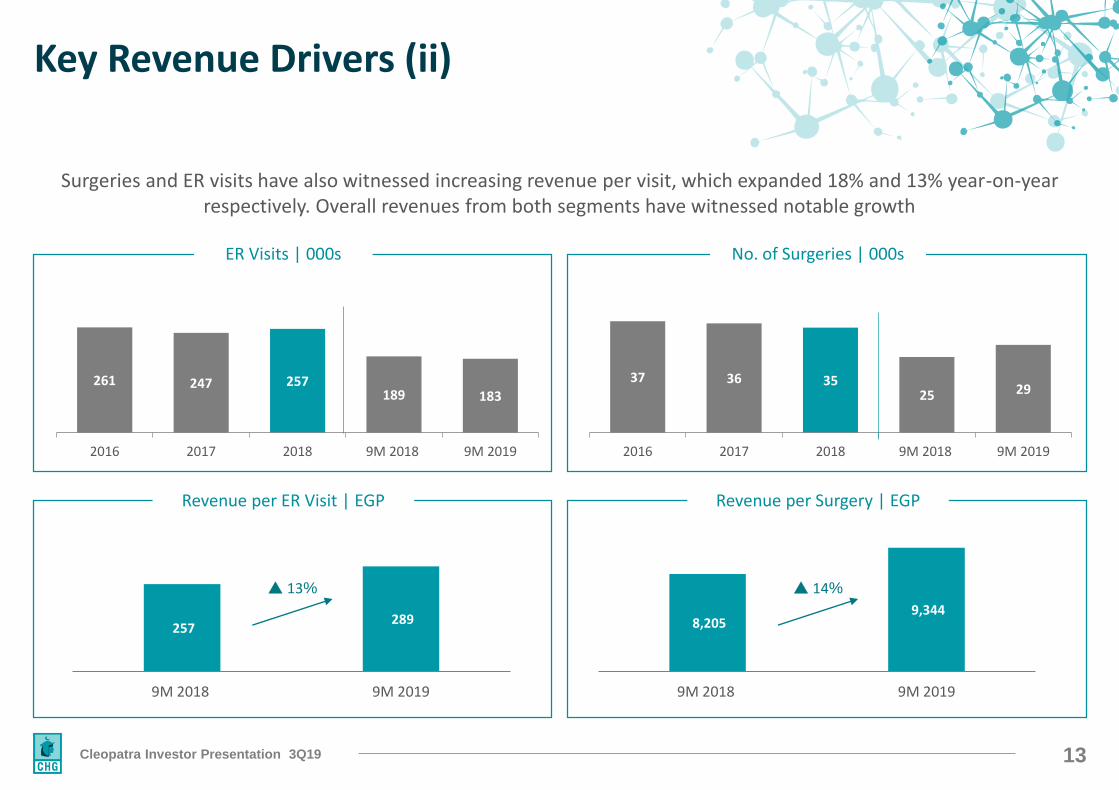
Surgeries and ER visits have also witnessed increasing revenue per visit, which expanded 18% and 13% year-on-year respectively. Overall revenues from both segments have witnessed notable growth
ER Visits | 000s
Revenue per ER Visit | EGP
No. of Surgeries | 000s
Revenue per Surgery | EGP
261 247 257189 183
2016 2017 2018 9M 2018 9M 2019
37 36 3525 29
2016 2017 2018 9M 2018 9M 2019
257 289
9M 2018 9M 2019
13%
8,205 9,344
9M 2018 9M 2019
14%
Key Revenue Drivers (ii)
14Cleopatra Investor Presentation 3Q19
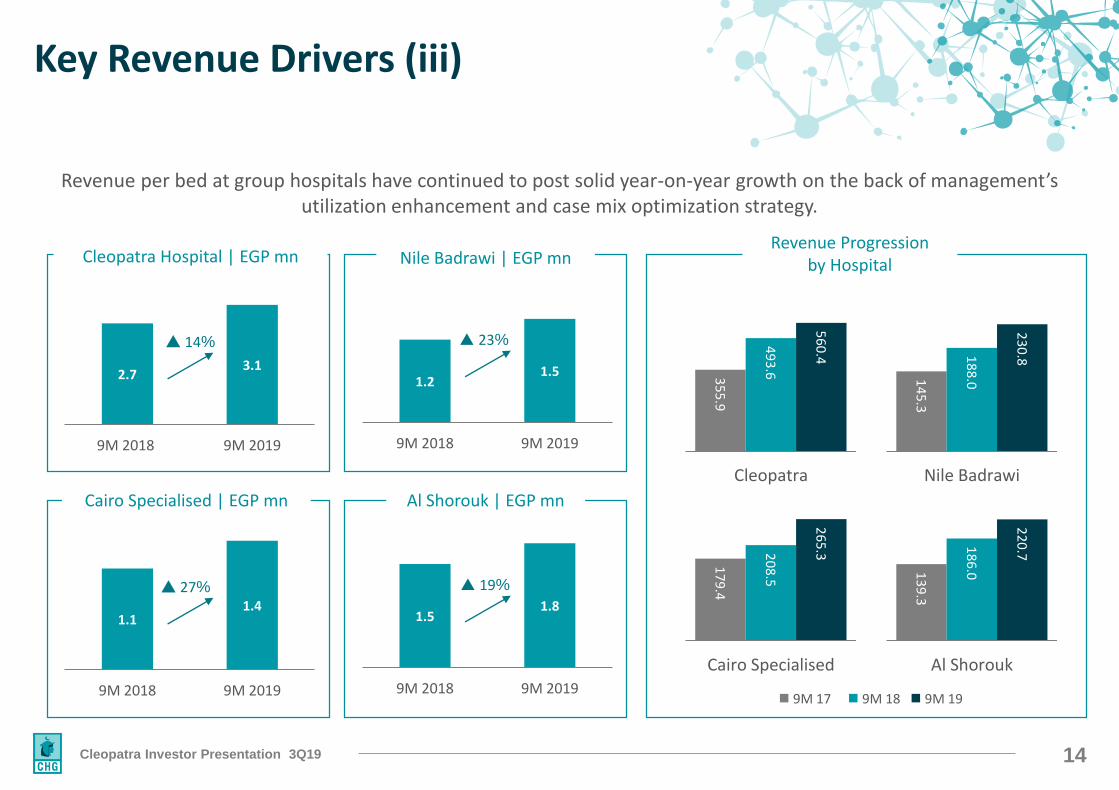
Cairo Specialised | EGP mn Al Shorouk | EGP mn
Revenue Progressionby Hospital
Revenue per bed at group hospitals have continued to post solid year-on-year growth on the back of management’s utilization enhancement and case mix optimization strategy.
Cleopatra Hospital | EGP mn Nile Badrawi | EGP mn
2.7 3.1
9M 2018 9M 2019
14%
1.2 1.5
9M 2018 9M 2019
23%
1.1 1.4
9M 2018 9M 2019
27%
1.5 1.8
9M 2018 9M 2019
19%
35
5.9
49
3.6
56
0.4
Cleopatra
◼ 9M 17 ◼ 9M 18 ◼ 9M 19
14
5.3
18
8.0
23
0.8
Nile Badrawi
17
9.4
20
8.5
26
5.3
Cairo Specialised
13
9.3
18
6.0
22
0.7
Al Shorouk
Key Revenue Drivers (iii)

15Cleopatra Investor Presentation 3Q19
Recent Business Updates

16Cleopatra Investor Presentation 3Q19
Recent Business Updates
Renovations & Upgrades
Nile Badrawy Hospital Renovations
• Façade facelift• Inpatient Wards Renovations
(2 floors) • Started Electromechanical
upgrades• Upgraded all medical
equipment • ICU/CCU Renovation &
Upgrade• Operating Rooms Renovations
& Upgrade • Outpatient Clinics Renovations
& Upgrade
10th & 11th
floor expansion (20 beds)
17Cleopatra Investor Presentation 3Q19
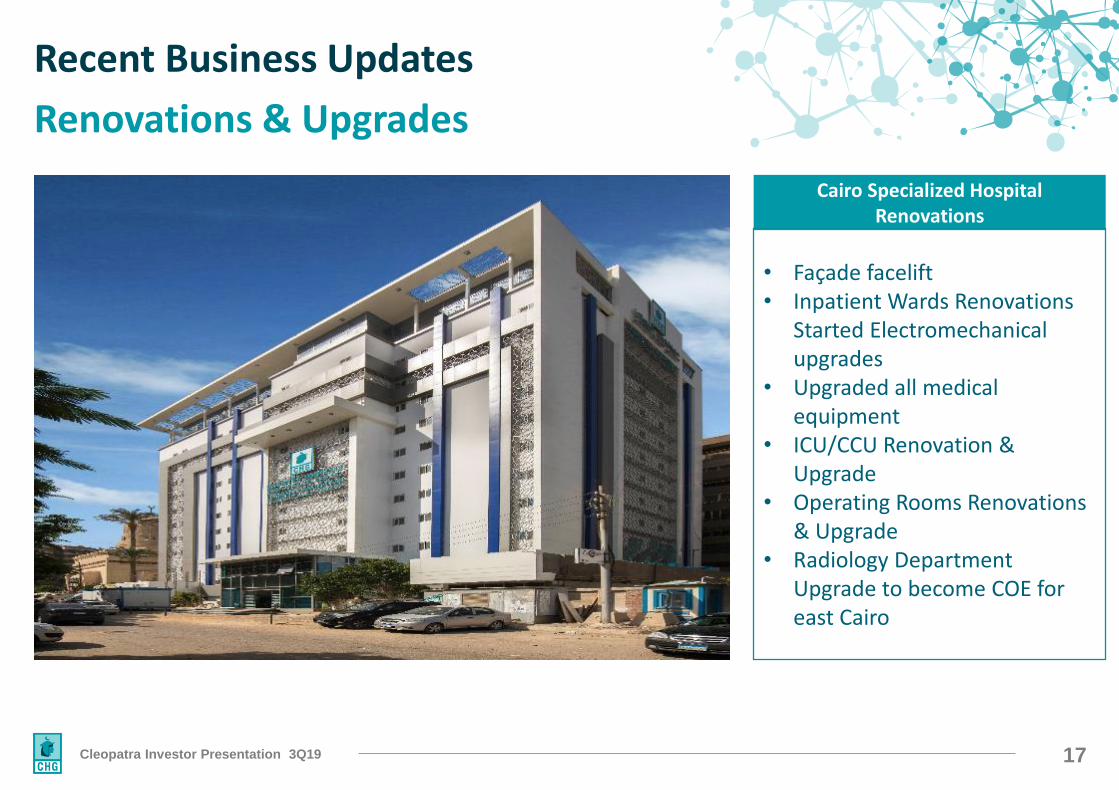
Recent Business Updates
Renovations & Upgrades
Cairo Specialized Hospital Renovations
• Façade facelift• Inpatient Wards Renovations
Started Electromechanical upgrades
• Upgraded all medical equipment
• ICU/CCU Renovation & Upgrade
• Operating Rooms Renovations & Upgrade
• Radiology Department Upgrade to become COE for east Cairo
18Cleopatra Investor Presentation 3Q19
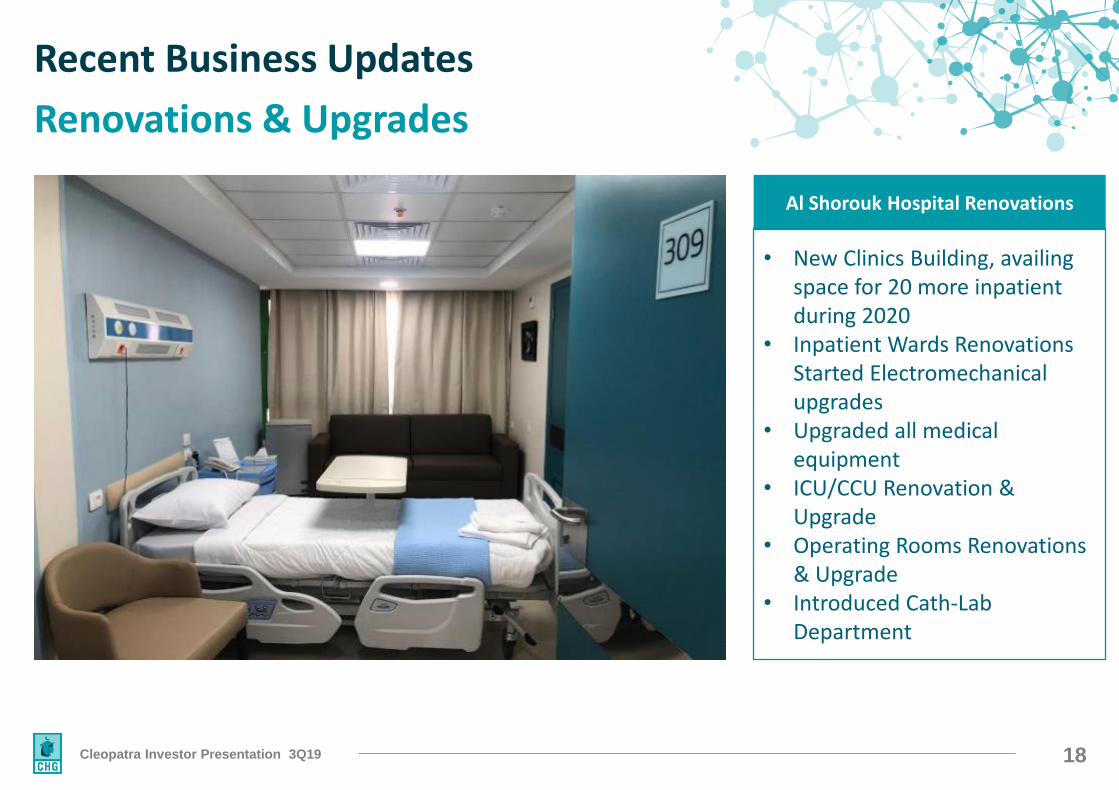
Recent Business Updates
Renovations & Upgrades
Al Shorouk Hospital Renovations
• New Clinics Building, availing space for 20 more inpatient during 2020
• Inpatient Wards Renovations Started Electromechanical upgrades
• Upgraded all medical equipment
• ICU/CCU Renovation & Upgrade
• Operating Rooms Renovations & Upgrade
• Introduced Cath-Lab Department
19Cleopatra Investor Presentation 3Q19
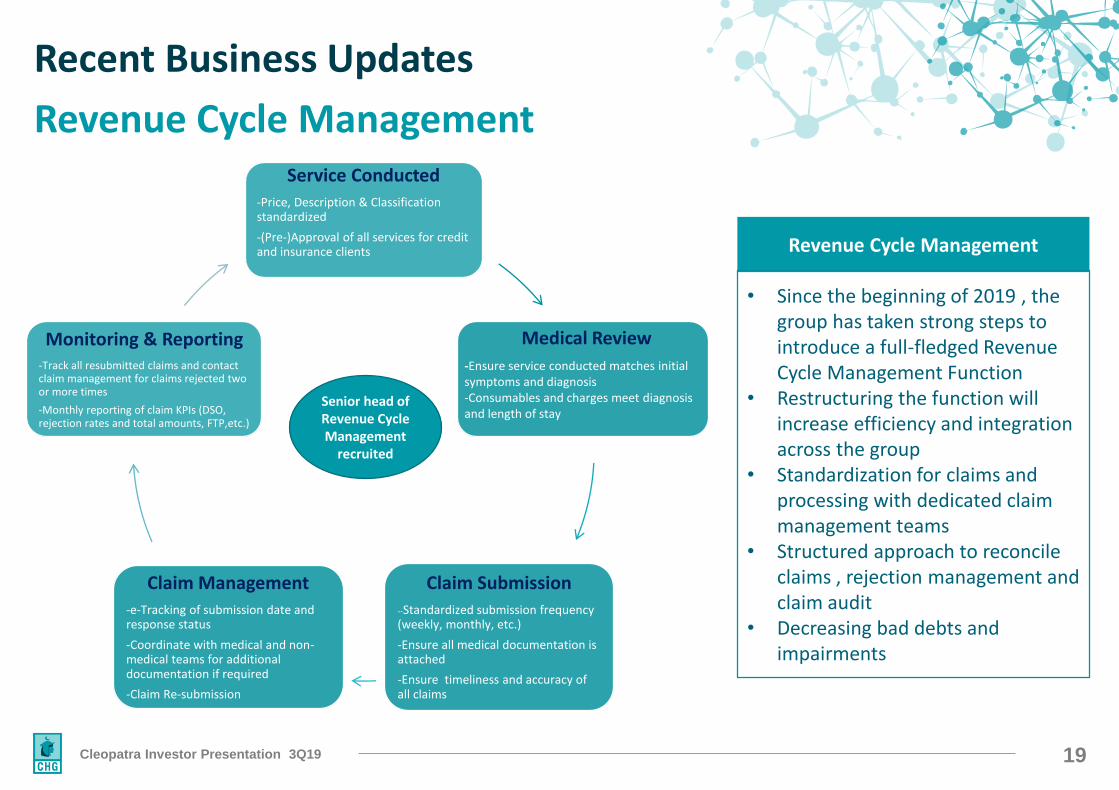
Recent Business Updates
Revenue Cycle Management Service Conducted
-Price, Description & Classification standardized
-(Pre-)Approval of all services for credit and insurance clients
Claim Submission--Standardized submission frequency (weekly, monthly, etc.)
-Ensure all medical documentation is attached
-Ensure timeliness and accuracy of all claims
Claim Management-e-Tracking of submission date and response status
-Coordinate with medical and non-medical teams for additional documentation if required
-Claim Re-submission
Monitoring & Reporting-Track all resubmitted claims and contact claim management for claims rejected two or more times
-Monthly reporting of claim KPIs (DSO, rejection rates and total amounts, FTP,etc.)
Medical Review
-Ensure service conducted matches initial symptoms and diagnosis-Consumables and charges meet diagnosis and length of stay
Revenue Cycle Management
• Since the beginning of 2019 , the group has taken strong steps to introduce a full-fledged Revenue Cycle Management Function
• Restructuring the function will increase efficiency and integration across the group
• Standardization for claims and processing with dedicated claim management teams
• Structured approach to reconcile claims , rejection management and claim audit
• Decreasing bad debts and impairments
Senior head of Revenue Cycle Management
recruited
20Cleopatra Investor Presentation 3Q19
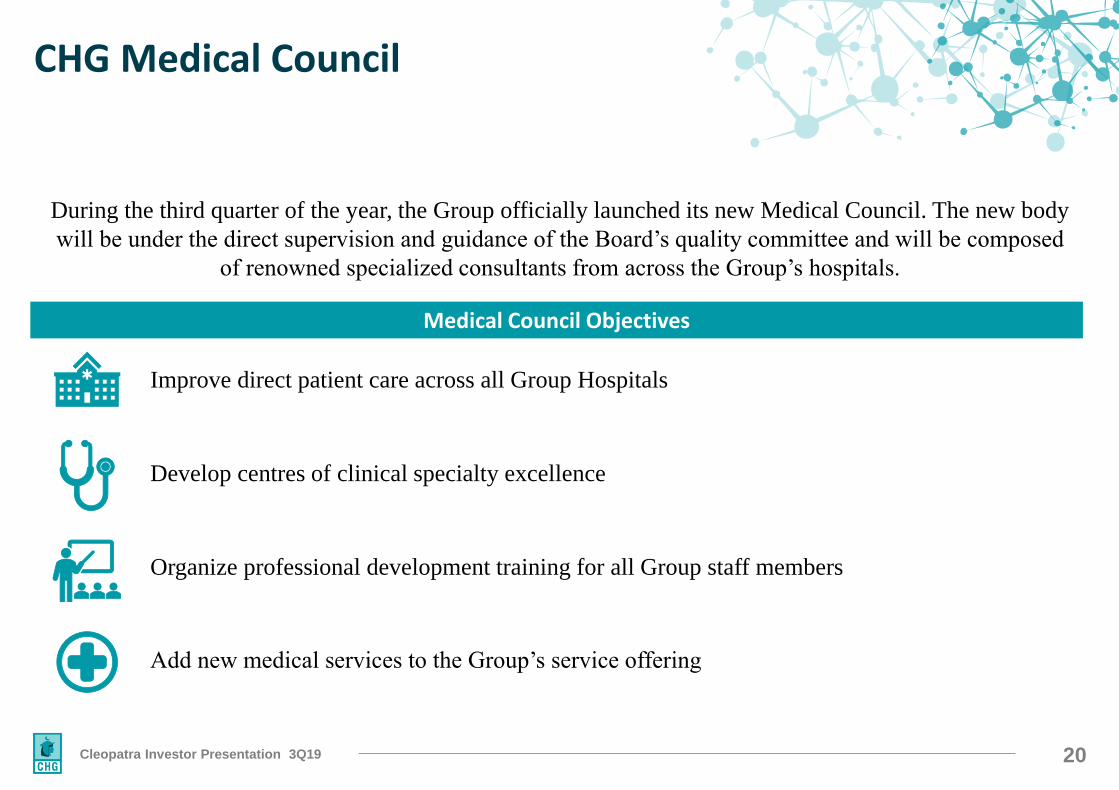
CHG Medical Council
During the third quarter of the year, the Group officially launched its new Medical Council. The new body
will be under the direct supervision and guidance of the Board’s quality committee and will be composed
of renowned specialized consultants from across the Group’s hospitals.
Medical Council Objectives
Improve direct patient care across all Group Hospitals
Add new medical services to the Group’s service offering
Develop centres of clinical specialty excellence
Organize professional development training for all Group staff members

21Cleopatra Investor Presentation 3Q19
Expansion Strategy
22Cleopatra Investor Presentation 3Q19
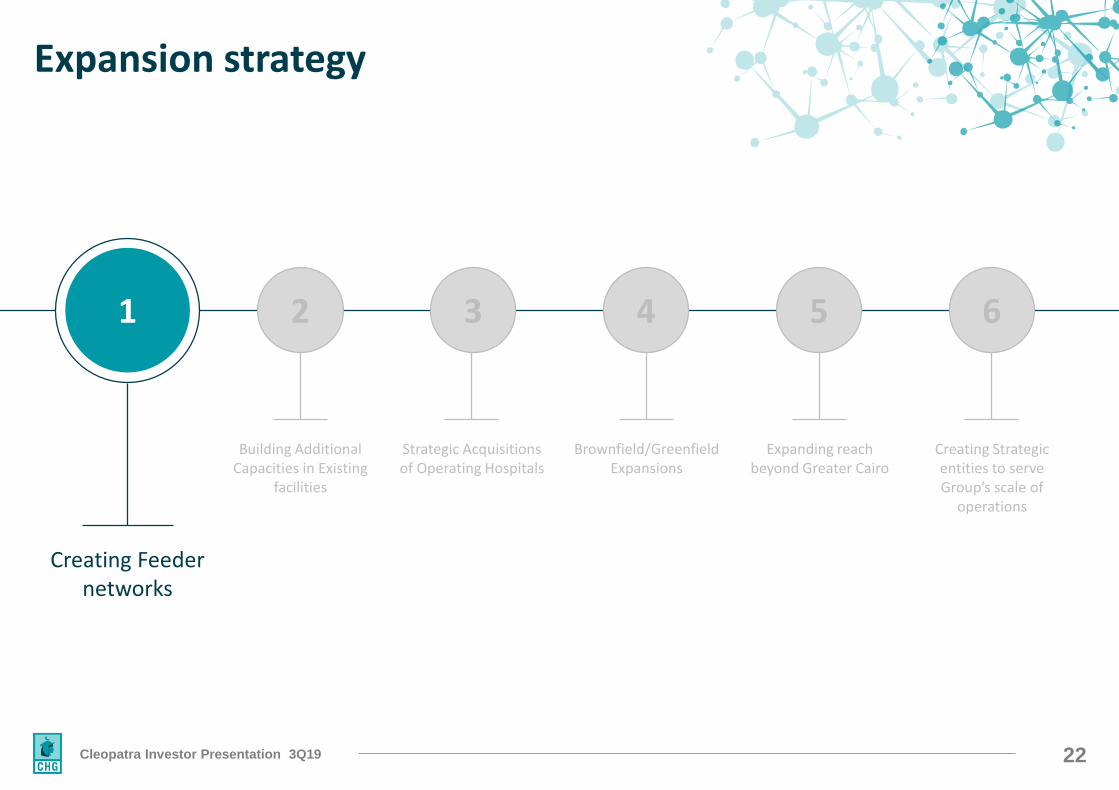
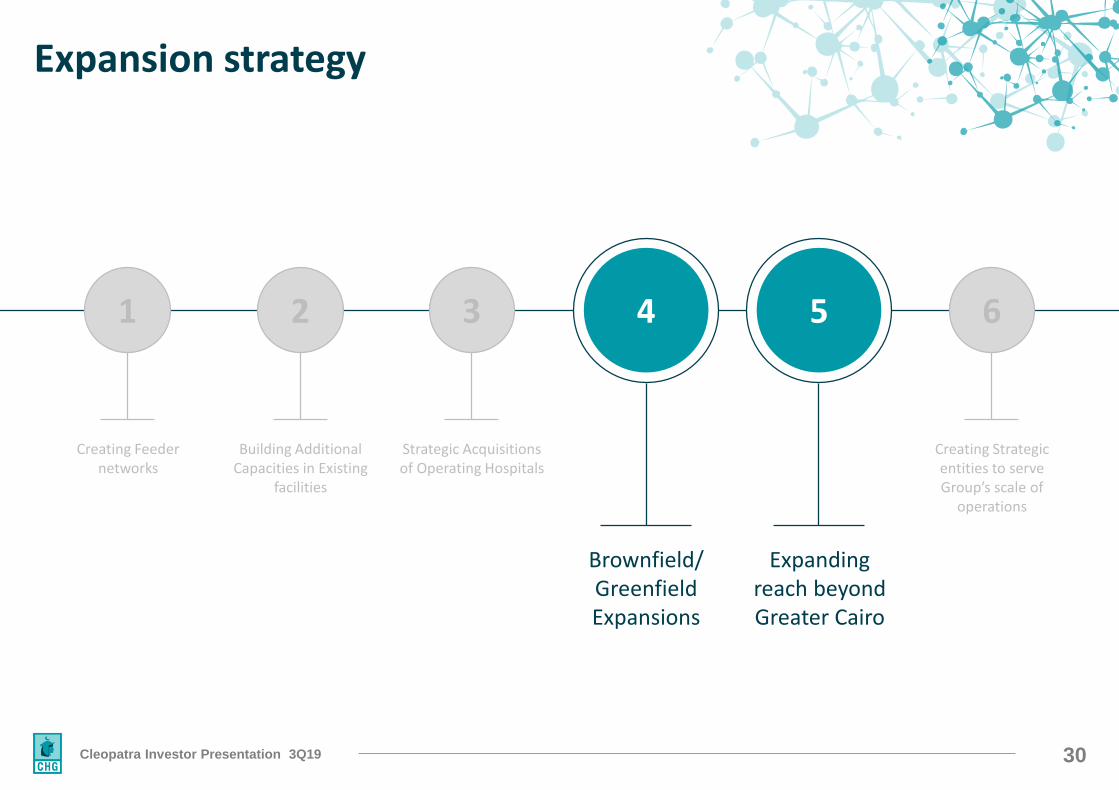
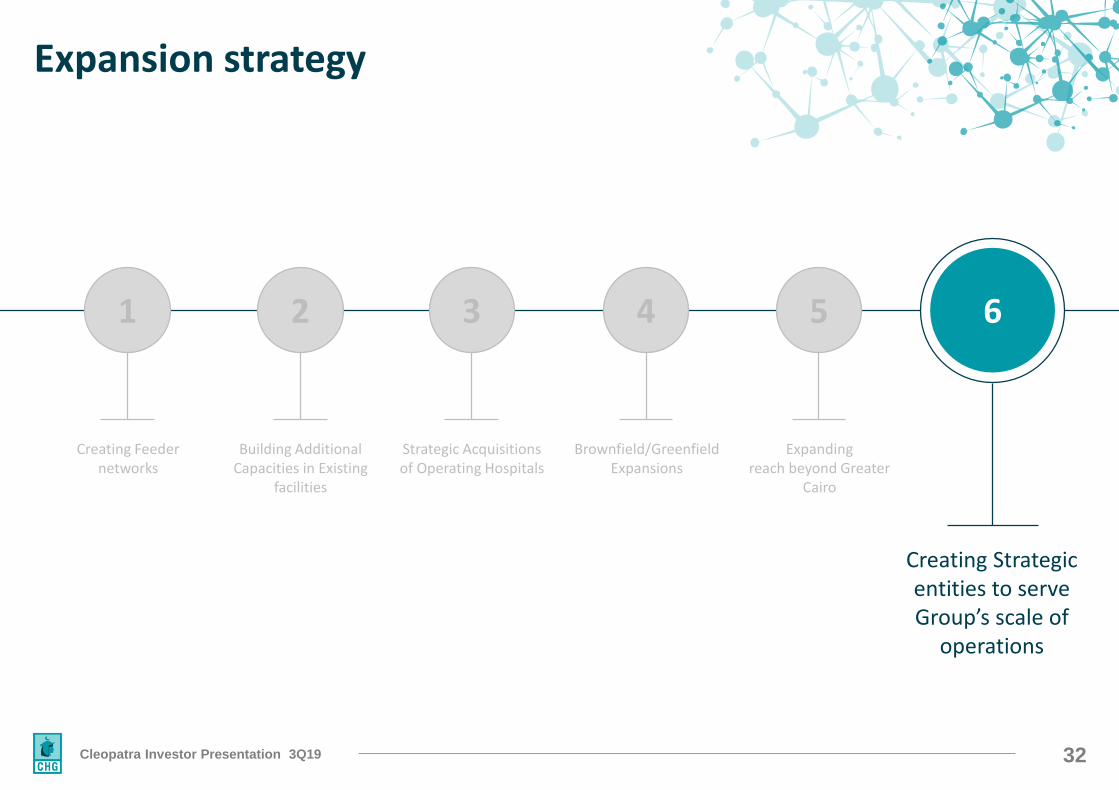
Expansion strategy
3 4 5 621
Creating Feeder networks
Building Additional Capacities in Existing
facilities
Strategic Acquisitions of Operating Hospitals
Brownfield/Greenfield Expansions
Expanding reach beyond Greater Cairo
Creating Strategic entities to serve Group’s scale of
operations
23Cleopatra Investor Presentation 3Q19
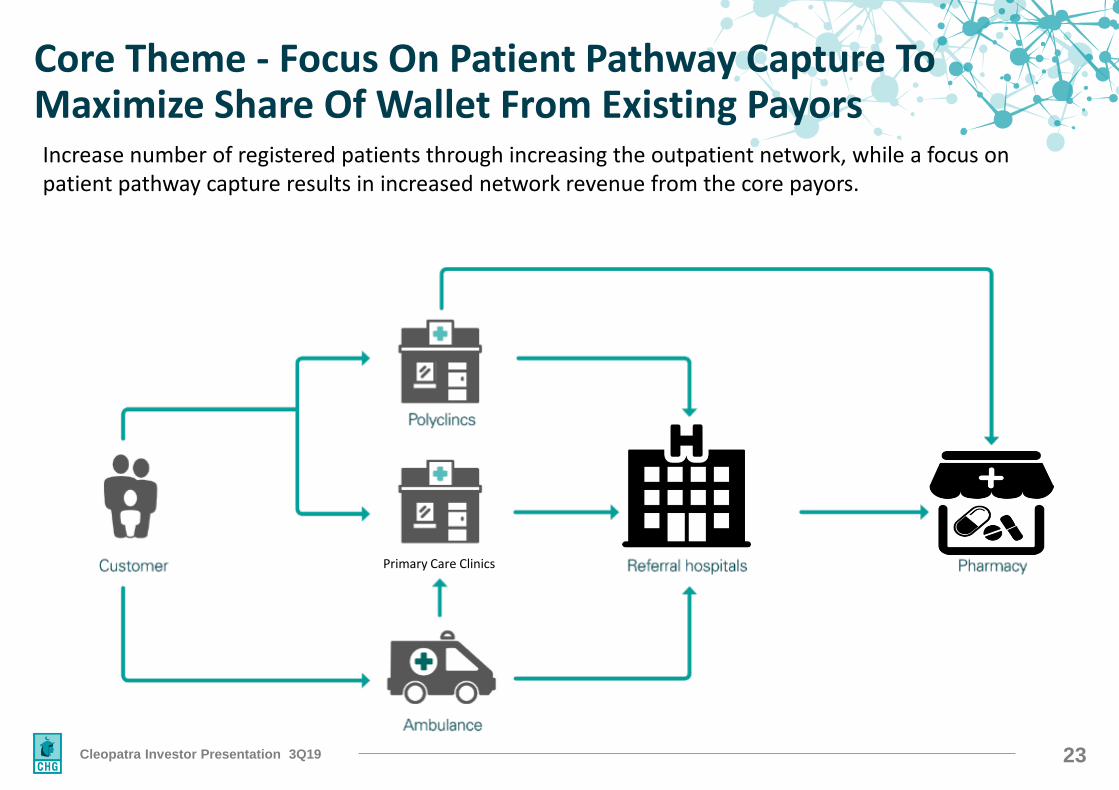
Core Theme - Focus On Patient Pathway Capture To Maximize Share Of Wallet From Existing Payors
Primary Care Clinics
Increase number of registered patients through increasing the outpatient network, while a focus on patient pathway capture results in increased network revenue from the core payors.
24Cleopatra Investor Presentation 3Q19
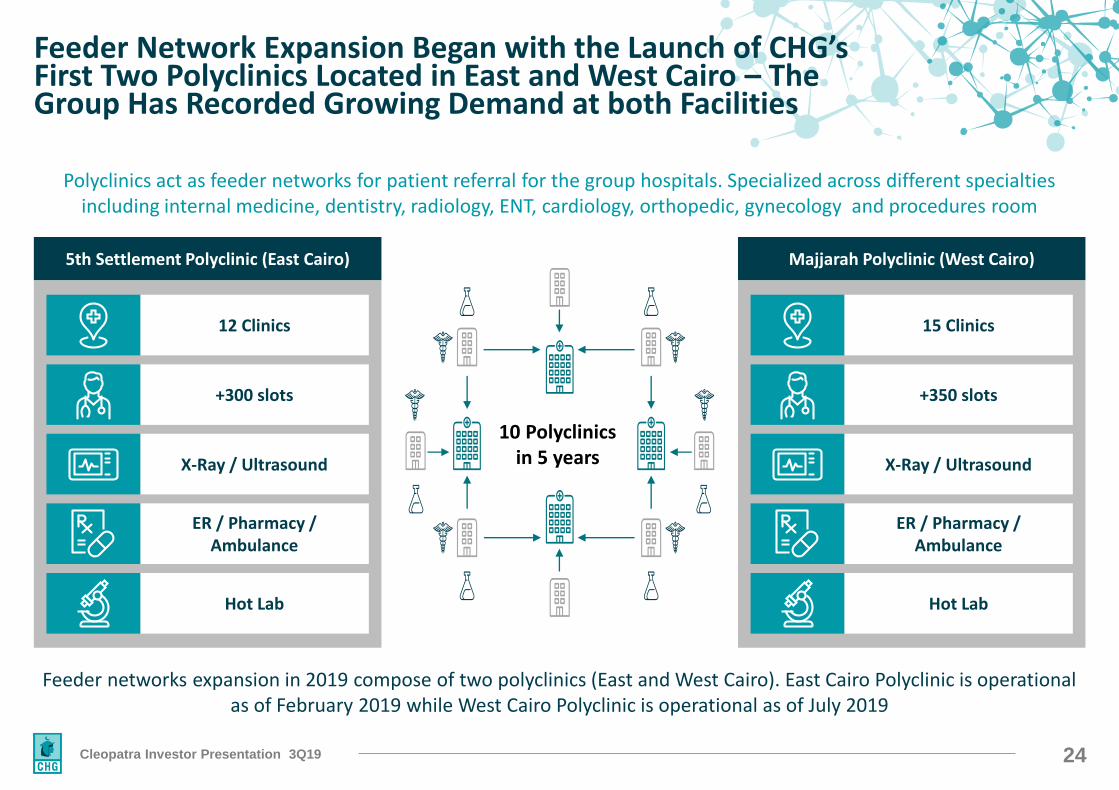
Feeder Network Expansion Began with the Launch of CHG’s First Two Polyclinics Located in East and West Cairo – The Group Has Recorded Growing Demand at both Facilities
Polyclinics act as feeder networks for patient referral for the group hospitals. Specialized across different specialties including internal medicine, dentistry, radiology, ENT, cardiology, orthopedic, gynecology and procedures room
Feeder networks expansion in 2019 compose of two polyclinics (East and West Cairo). East Cairo Polyclinic is operational as of February 2019 while West Cairo Polyclinic is operational as of July 2019
10 Polyclinics in 5 years
5th Settlement Polyclinic (East Cairo) Majjarah Polyclinic (West Cairo)
12 Clinics
+300 slots
X-Ray / Ultrasound
ER / Pharmacy / Ambulance
Hot Lab
15 Clinics
+350 slots
X-Ray / Ultrasound
ER / Pharmacy / Ambulance
Hot Lab
25Cleopatra Investor Presentation 3Q19
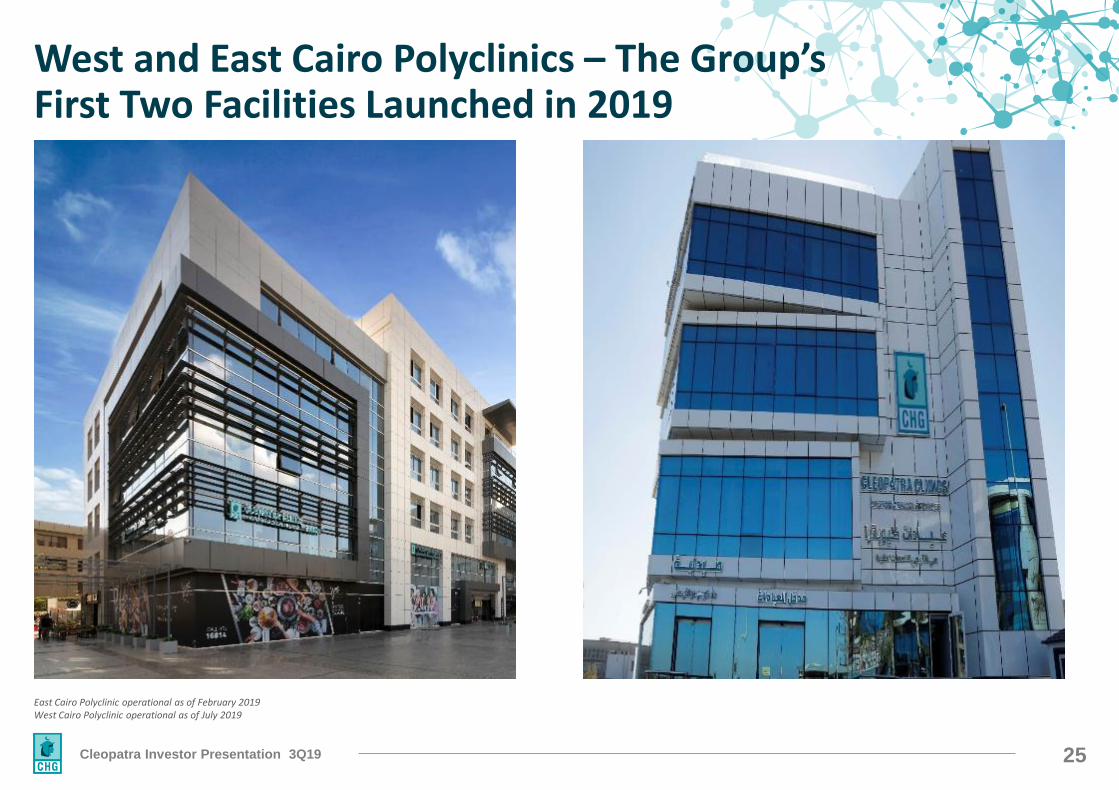
West and East Cairo Polyclinics – The Group’s First Two Facilities Launched in 2019
East Cairo Polyclinic operational as of February 2019West Cairo Polyclinic operational as of July 2019
26Cleopatra Investor Presentation 3Q19
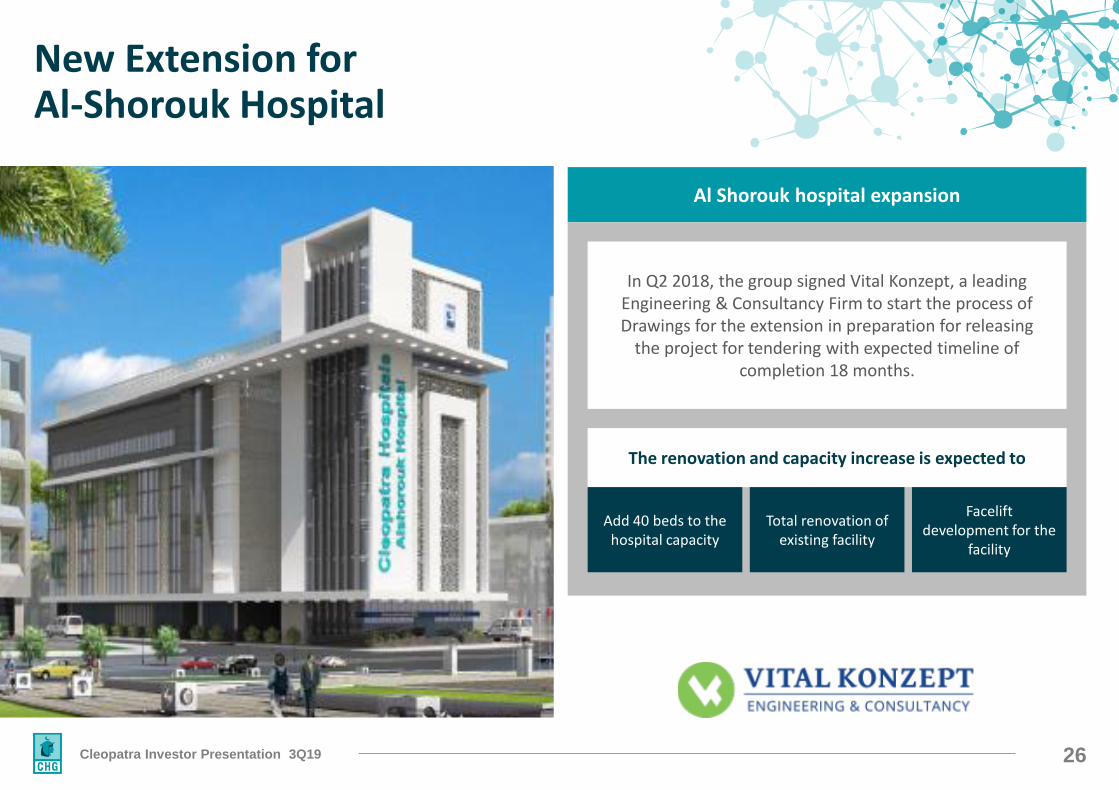
New Extension for Al-Shorouk Hospital
Al Shorouk hospital expansion
In Q2 2018, the group signed Vital Konzept, a leading Engineering & Consultancy Firm to start the process of Drawings for the extension in preparation for releasing
the project for tendering with expected timeline of completion 18 months.
The renovation and capacity increase is expected to
Add 40 beds to the hospital capacity
Total renovation of existing facility
Facelift development for the
facility
27Cleopatra Investor Presentation 3Q19
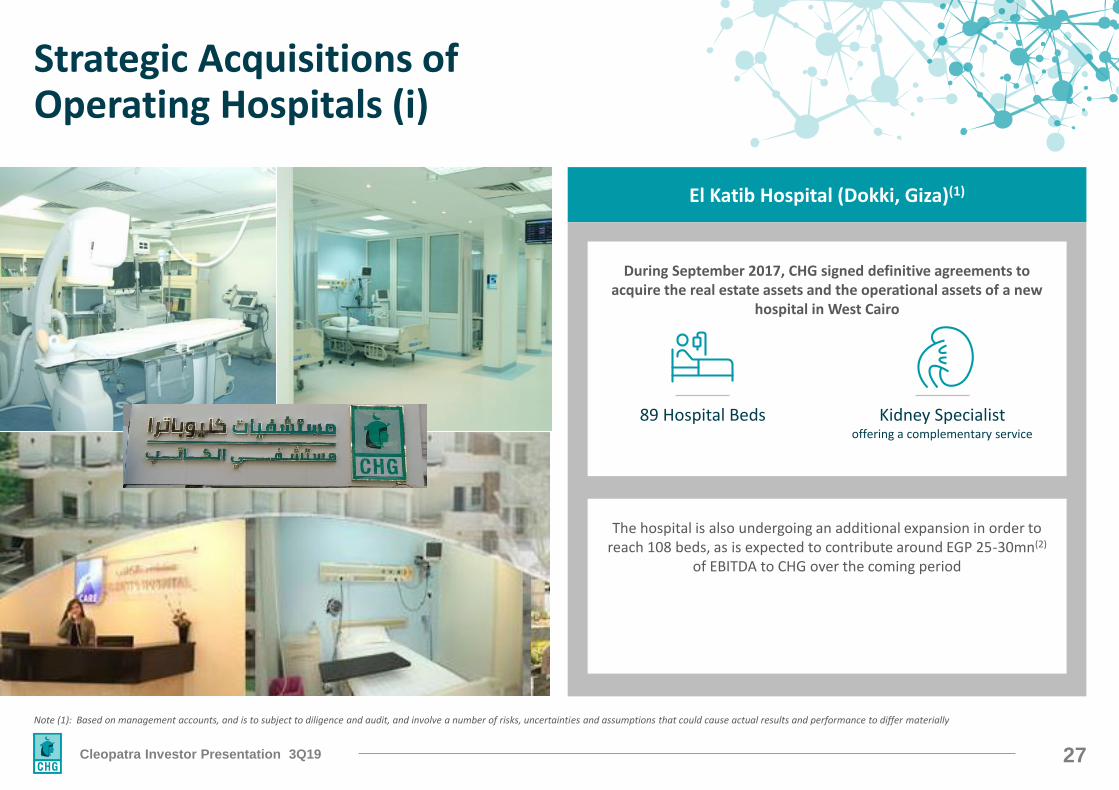
Strategic Acquisitions of Operating Hospitals (i)
Note (1): Based on management accounts, and is to subject to diligence and audit, and involve a number of risks, uncertainties and assumptions that could cause actual results and performance to differ materially
El Katib Hospital (Dokki, Giza)(1)
During September 2017, CHG signed definitive agreements to acquire the real estate assets and the operational assets of a new
hospital in West Cairo
The hospital is also undergoing an additional expansion in order to reach 108 beds, as is expected to contribute around EGP 25-30mn(2)
of EBITDA to CHG over the coming period
89 Hospital Beds Kidney Specialistoffering a complementary service
28Cleopatra Investor Presentation 3Q19
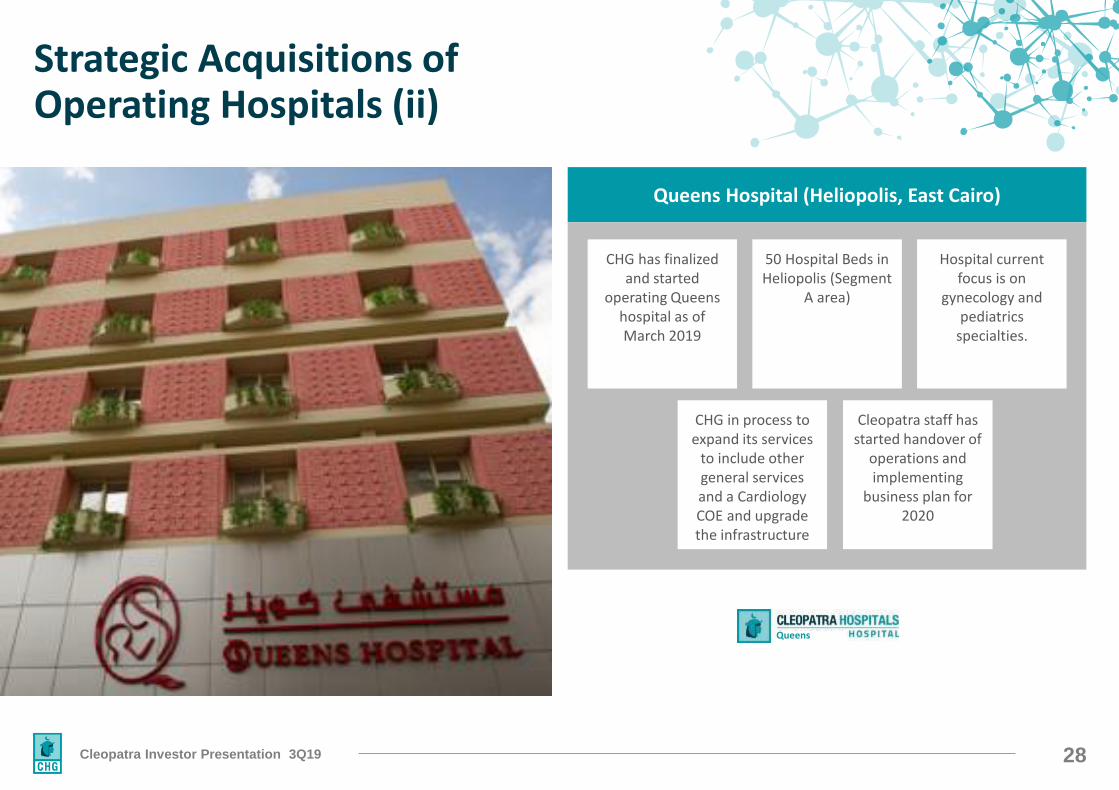
Strategic Acquisitions of Operating Hospitals (ii)
Queens Hospital (Heliopolis, East Cairo)
CHG has finalized and started
operating Queens hospital as of March 2019
50 Hospital Beds in Heliopolis (Segment
A area)
Hospital current focus is on
gynecology and pediatrics
specialties.
CHG in process to expand its services
to include other general services and a Cardiology COE and upgrade the infrastructure
Cleopatra staff has started handover of
operations and implementing
business plan for 2020
Queens
29Cleopatra Investor Presentation 3Q19
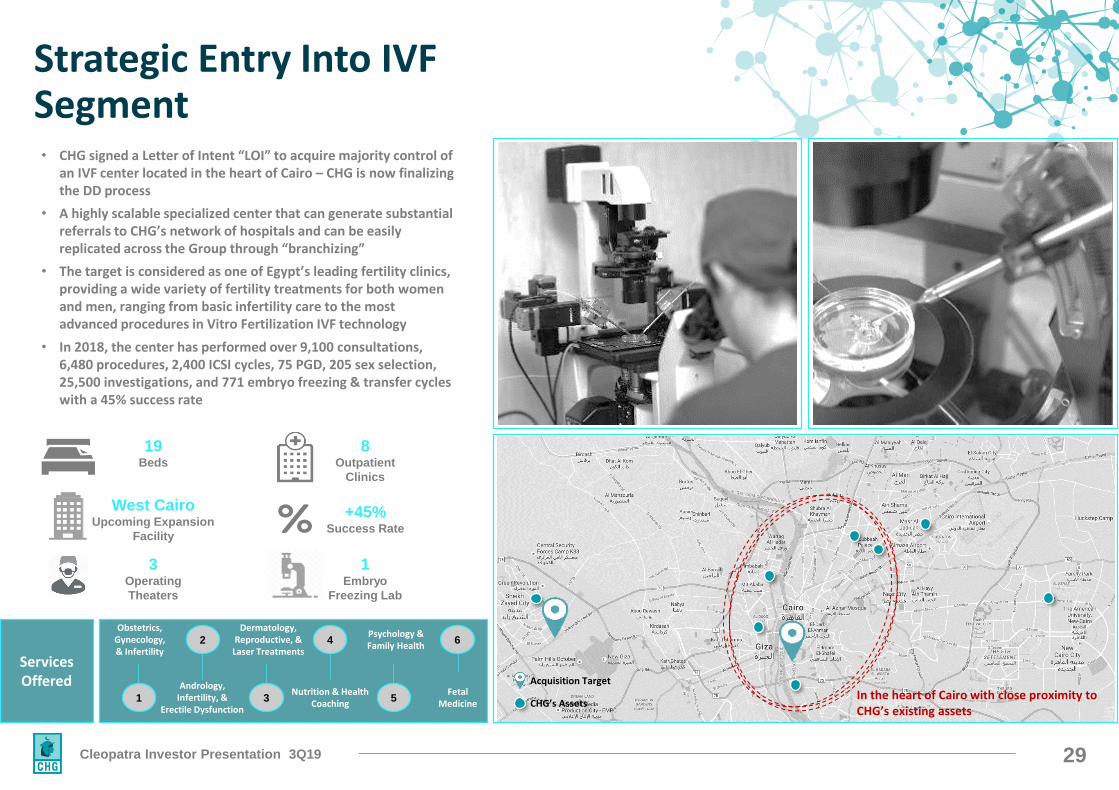
Strategic Entry Into IVF Segment
In the heart of Cairo with close proximity to CHG’s existing assets
Acquisition Target
CHG’s Assets
• CHG signed a Letter of Intent “LOI” to acquire majority control of an IVF center located in the heart of Cairo – CHG is now finalizing the DD process
• A highly scalable specialized center that can generate substantial referrals to CHG’s network of hospitals and can be easily replicated across the Group through “branchizing”
• The target is considered as one of Egypt’s leading fertility clinics, providing a wide variety of fertility treatments for both women and men, ranging from basic infertility care to the most advanced procedures in Vitro Fertilization IVF technology
• In 2018, the center has performed over 9,100 consultations, 6,480 procedures, 2,400 ICSI cycles, 75 PGD, 205 sex selection, 25,500 investigations, and 771 embryo freezing & transfer cycles with a 45% success rate
3 Operating
Theaters
1Embryo
Freezing Lab
19Beds
8 Outpatient
Clinics
+45%Success Rate
West Cairo Upcoming Expansion
Facility
Services Offered
1
2
3
4
5
6
Obstetrics, Gynecology,& Infertility
Andrology, Infertility, &
Erectile Dysfunction
Dermatology, Reproductive, &
Laser Treatments
Nutrition & Health Coaching
Fetal Medicine
Psychology & Family Health
30Cleopatra Investor Presentation 3Q19
Expansion strategy
6
Creating Feeder networks
Building Additional Capacities in Existing
facilities
Strategic Acquisitions of Operating Hospitals
Creating Strategic entities to serve Group’s scale of
operations
1 2 4 53
Brownfield/Greenfield Expansions
Expanding reach beyond Greater Cairo
31Cleopatra Investor Presentation 3Q19
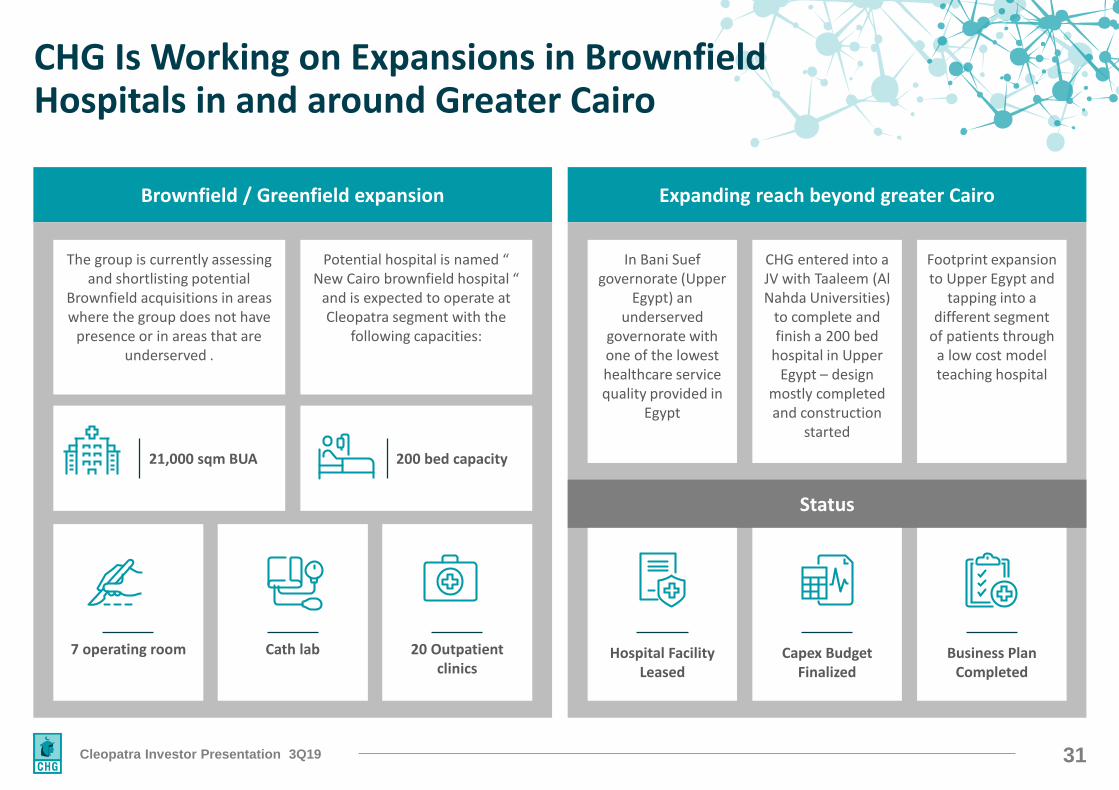
CHG Is Working on Expansions in Brownfield Hospitals in and around Greater Cairo
Expanding reach beyond greater CairoBrownfield / Greenfield expansion
In Bani Suef governorate (Upper
Egypt) an underserved
governorate with one of the lowest healthcare service quality provided in
Egypt
CHG entered into a JV with Taaleem (Al Nahda Universities)
to complete and finish a 200 bed
hospital in Upper Egypt – design
mostly completed and construction
started
Footprint expansion to Upper Egypt and
tapping into a different segment
of patients through a low cost model teaching hospital
Status
Hospital Facility Leased
Capex Budget Finalized
Business Plan Completed
The group is currently assessing and shortlisting potential
Brownfield acquisitions in areas where the group does not have
presence or in areas that are underserved .
Potential hospital is named “ New Cairo brownfield hospital “
and is expected to operate at Cleopatra segment with the
following capacities:
21,000 sqm BUA 200 bed capacity
7 operating room Cath lab 20 Outpatient clinics
32Cleopatra Investor Presentation 3Q19
Expansion strategy
Creating Feeder networks
Building Additional Capacities in Existing
facilities
Strategic Acquisitions of Operating Hospitals
1 2 3 5 6
Creating Strategic entities to serve Group’s scale of
operations
Expanding reach beyond Greater
Cairo
4
Brownfield/Greenfield Expansions
33Cleopatra Investor Presentation 3Q19
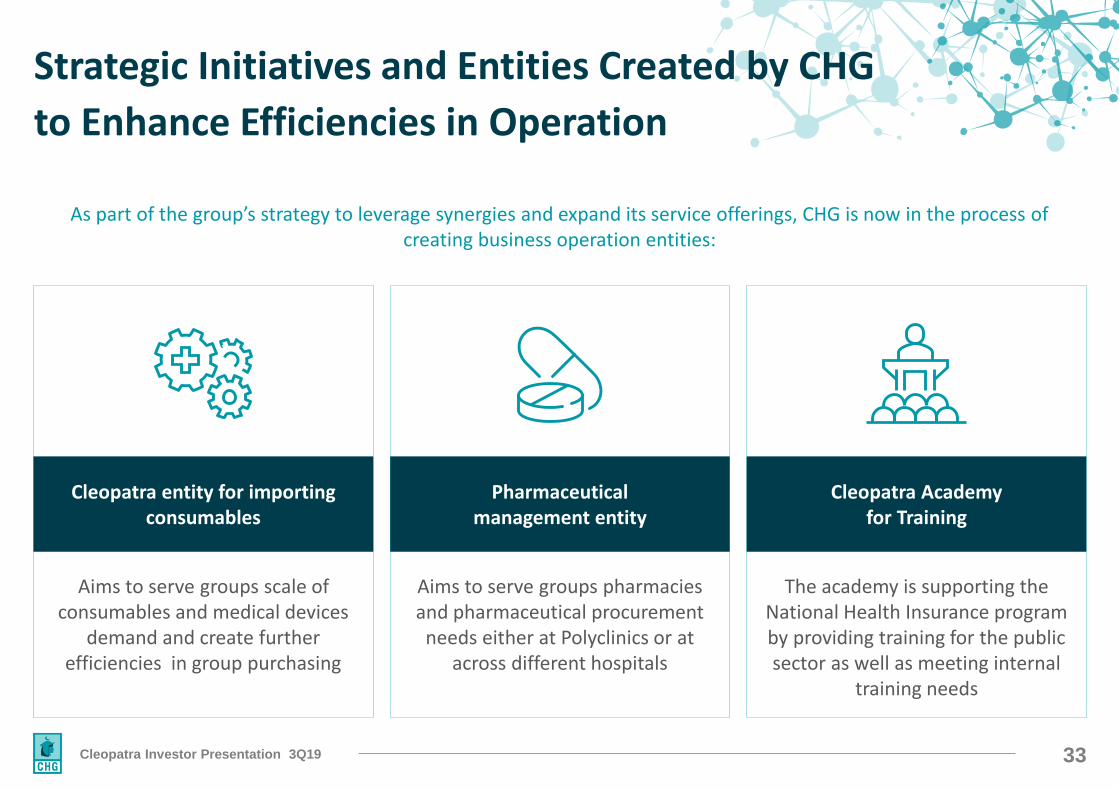
Cleopatra entity for importing consumables
Pharmaceutical management entity
Cleopatra Academy for Training
Aims to serve groups scale of consumables and medical devices
demand and create further efficiencies in group purchasing
Aims to serve groups pharmacies and pharmaceutical procurement
needs either at Polyclinics or at across different hospitals
The academy is supporting the National Health Insurance program by providing training for the public sector as well as meeting internal
training needs
Strategic Initiatives and Entities Created by CHG
to Enhance Efficiencies in Operation
As part of the group’s strategy to leverage synergies and expand its service offerings, CHG is now in the process of creating business operation entities:

34Cleopatra Investor Presentation 3Q19
Governance & Shareholder Information
35Cleopatra Investor Presentation 3Q19
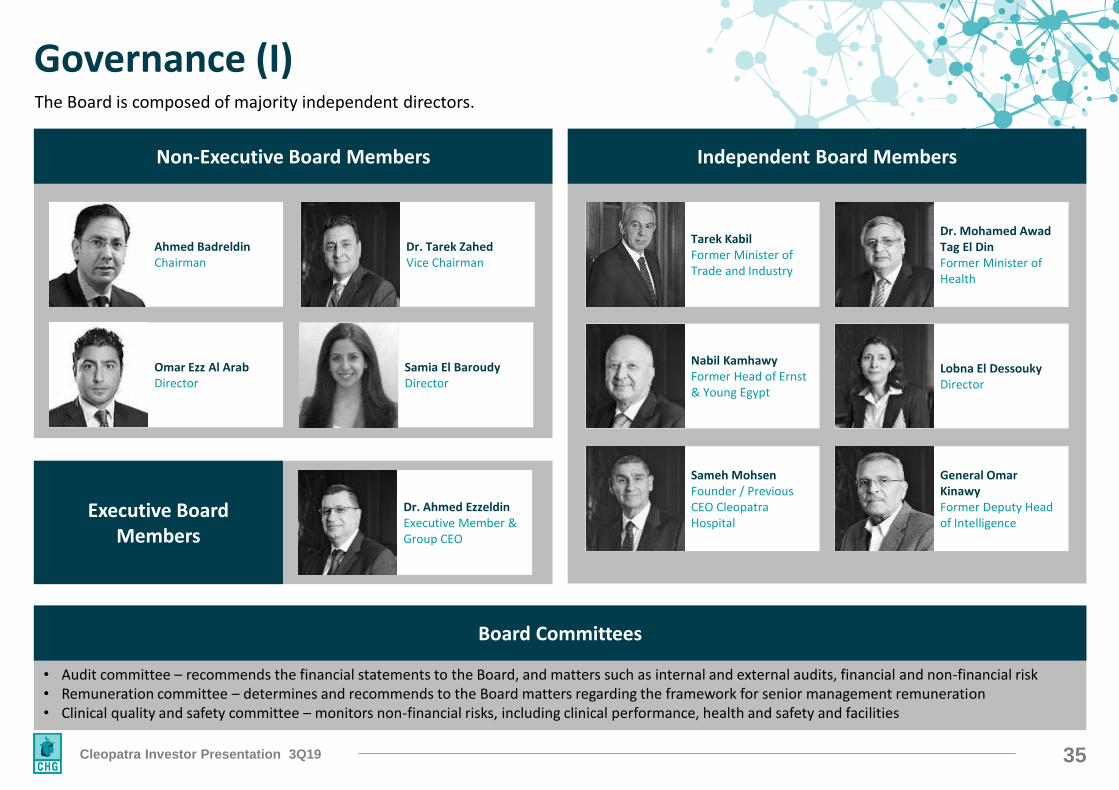
Governance (I)
Independent Board MembersNon-Executive Board Members
Tarek KabilFormer Minister of Trade and Industry
Omar Ezz Al ArabDirector
Nabil KamhawyFormer Head of Ernst & Young Egypt
Samia El BaroudyDirector
Lobna El DessoukyDirector
General Omar KinawyFormer Deputy Head of Intelligence
Image
ImageAhmed BadreldinChairman
Dr. Mohamed AwadTag El DinFormer Minister of Health
Dr. Ahmed EzzeldinExecutive Member & Group CEO
Dr. Tarek ZahedVice Chairman
Sameh MohsenFounder / Previous CEO Cleopatra Hospital
Executive Board Members
The Board is composed of majority independent directors.
• Audit committee – recommends the financial statements to the Board, and matters such as internal and external audits, financial and non-financial risk• Remuneration committee – determines and recommends to the Board matters regarding the framework for senior management remuneration• Clinical quality and safety committee – monitors non-financial risks, including clinical performance, health and safety and facilities
Board Committees
36Cleopatra Investor Presentation 3Q19
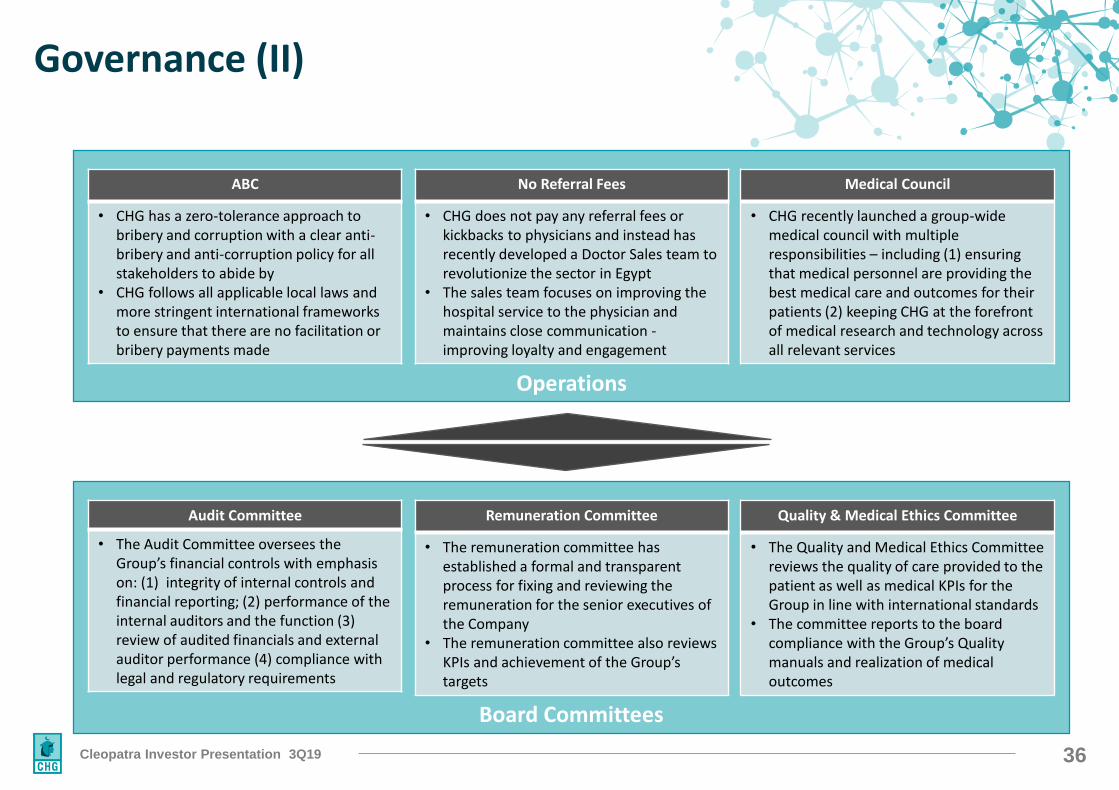
Governance (II)
Operations
Board Committees
ABC
• CHG has a zero-tolerance approach to bribery and corruption with a clear anti-bribery and anti-corruption policy for all stakeholders to abide by
• CHG follows all applicable local laws and more stringent international frameworks to ensure that there are no facilitation or bribery payments made
No Referral Fees
• CHG does not pay any referral fees or kickbacks to physicians and instead has recently developed a Doctor Sales team to revolutionize the sector in Egypt
• The sales team focuses on improving the hospital service to the physician and maintains close communication -improving loyalty and engagement
Medical Council
• CHG recently launched a group-wide medical council with multiple responsibilities – including (1) ensuring that medical personnel are providing the best medical care and outcomes for their patients (2) keeping CHG at the forefront of medical research and technology across all relevant services
Audit Committee
• The Audit Committee oversees the Group’s financial controls with emphasis on: (1) integrity of internal controls and financial reporting; (2) performance of the internal auditors and the function (3) review of audited financials and external auditor performance (4) compliance with legal and regulatory requirements
Remuneration Committee
• The remuneration committee has established a formal and transparent process for fixing and reviewing the remuneration for the senior executives of the Company
• The remuneration committee also reviews KPIs and achievement of the Group’s targets
Quality & Medical Ethics Committee
• The Quality and Medical Ethics Committee reviews the quality of care provided to the patient as well as medical KPIs for the Group in line with international standards
• The committee reports to the board compliance with the Group’s Quality manuals and realization of medical outcomes
37Cleopatra Investor Presentation 3Q19
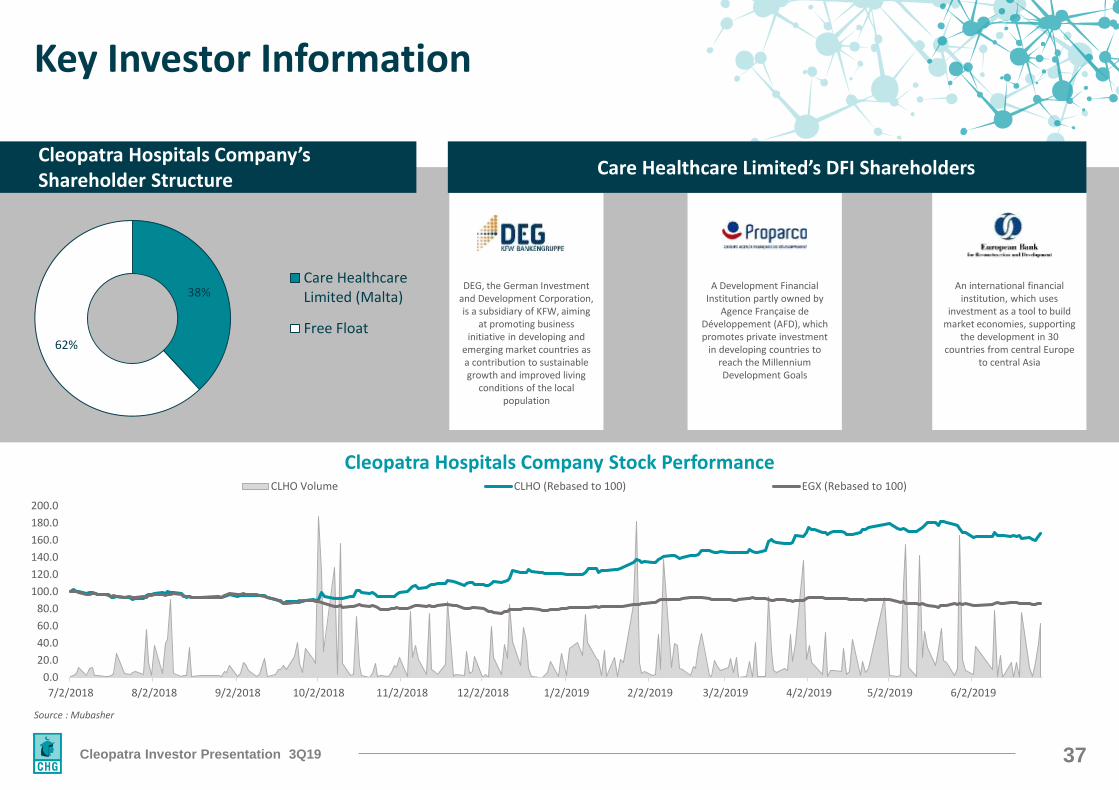
Key Investor Information
Cleopatra Hospitals Company Stock Performance
Source : Mubasher
38%
62%
Care HealthcareLimited (Malta)
Free Float
Cleopatra Hospitals Company’s Shareholder Structure
DEG, the German Investment and Development Corporation, is a subsidiary of KFW, aiming
at promoting business initiative in developing and
emerging market countries as a contribution to sustainable growth and improved living
conditions of the local population
A Development Financial Institution partly owned by
Agence Française de Développement (AFD), which promotes private investment
in developing countries to reach the Millennium Development Goals
An international financial institution, which uses
investment as a tool to build market economies, supporting
the development in 30 countries from central Europe
to central Asia
Care Healthcare Limited’s DFI Shareholders
0
2000000
4000000
6000000
8000000
10000000
12000000
0.0
20.0
40.0
60.0
80.0
100.0
120.0
140.0
160.0
180.0
200.0
7/2/2018 8/2/2018 9/2/2018 10/2/2018 11/2/2018 12/2/2018 1/2/2019 2/2/2019 3/2/2019 4/2/2019 5/2/2019 6/2/2019
CLHO Volume CLHO (Rebased to 100) EGX (Rebased to 100)

38Cleopatra Investor Presentation 3Q19
Appendix : Q3 2019 Additional Disclosure
39Cleopatra Investor Presentation 3Q19
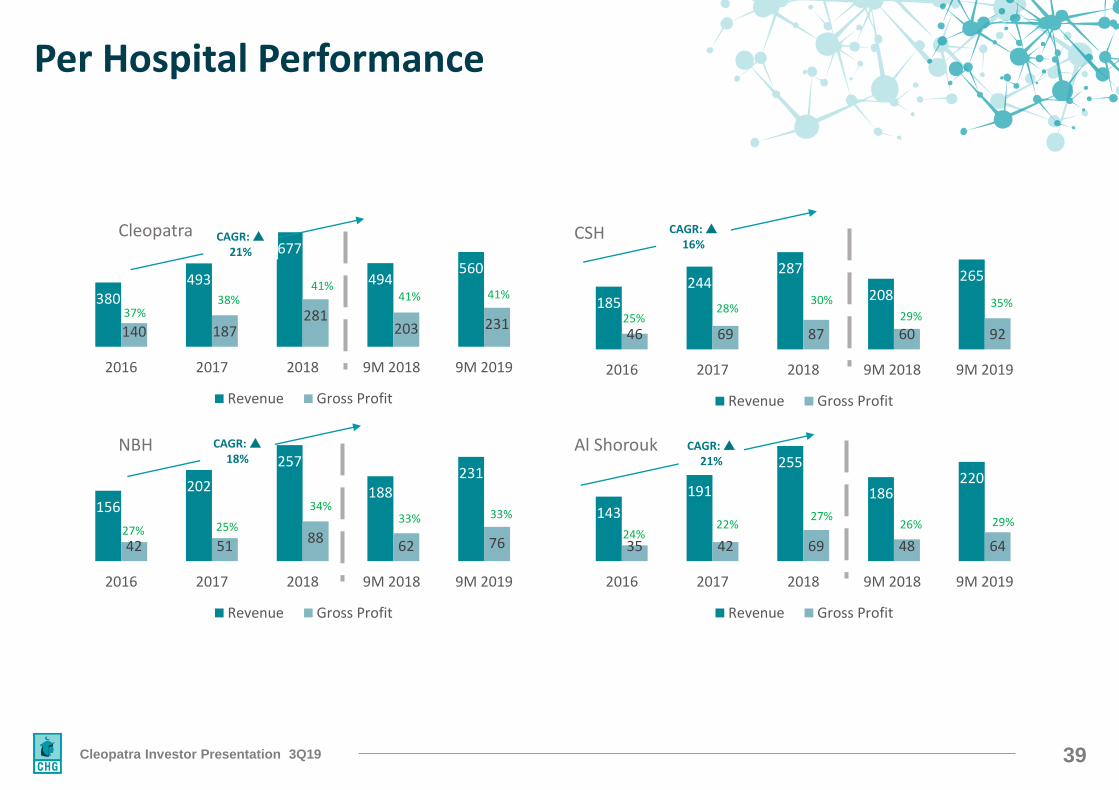
Per Hospital Performance
380493
677
494560
140 187281
203 231
2016 2017 2018 9M 2018 9M 2019
Revenue Gross Profit
185
244287
208265
46 69 87 60 92
2016 2017 2018 9M 2018 9M 2019
Revenue Gross Profit
Cleopatra CSH
156
202
257
188231
42 5188
62 76
2016 2017 2018 9M 2018 9M 2019
Revenue Gross Profit
NBH
143
191
255
186220
35 42 69 48 64
2016 2017 2018 9M 2018 9M 2019
Revenue Gross Profit
Al Shorouk
41%41%
38%37%
33%34%
25%27%
35%30%28%
25%
29%27%22%
24%
CAGR: 21%
CAGR: 18%
CAGR: 16%
CAGR: 21%
41%
26%33%
29%
40Cleopatra Investor Presentation 3Q19
Expansion KPIs
Polyclinics – East
5th Settlement Polyclinic (East Cairo)
12 General Clinics+ 3 Specialty Clinics
+300 slots
X-Ray / Ultrasound
ER / Pharmacy / Ambulance
Hot Lab
Volumes Ramp Up
2019 Utilization ;
• ~50%
• 200-300 patient per
day
2020-2023 Utilization ;
• ~60-100% utilization
• 500 patients per day
Performance Outlook
Revenues
• 2019 Monthly ramp
up reach EGP 3-3.5k
/Month
• 2020 Outlook ; EGP
40-45mn
Margins outlook
• GP positive in 2020 ;
~ 20-25%
• EBITDA Positive
after 1st year of
operations
Initial Investment
Real Estate ;
• 20 Year rental
contract (EGP 400k
per month
Capex ;
• Medical & Civil
Capex ; ~EGP 30mn
IRR & Payback Period
• IRR 20%
• Payback 4 Years Operational Date ; February 2019
41Cleopatra Investor Presentation 3Q19
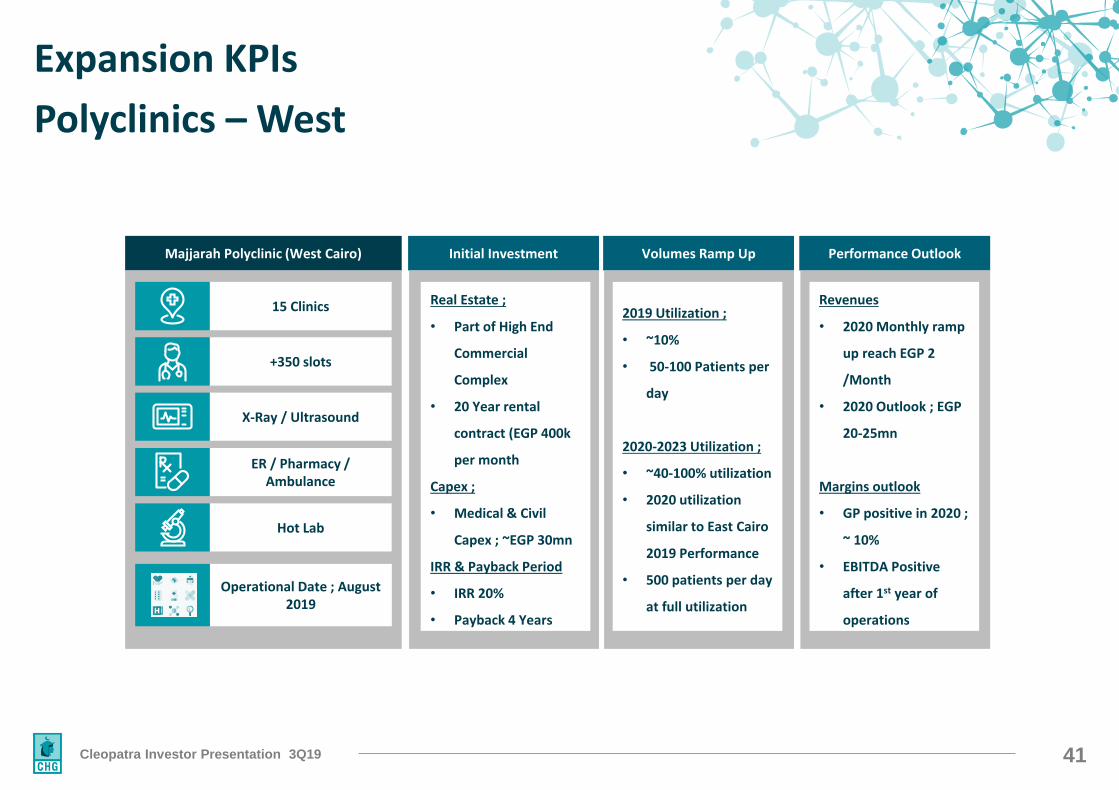
Expansion KPIs
Polyclinics – West
Volumes Ramp Up
2019 Utilization ;
• ~10%
• 50-100 Patients per
day
2020-2023 Utilization ;
• ~40-100% utilization
• 2020 utilization
similar to East Cairo
2019 Performance
• 500 patients per day
at full utilization
Performance Outlook
Revenues
• 2020 Monthly ramp
up reach EGP 2
/Month
• 2020 Outlook ; EGP
20-25mn
Margins outlook
• GP positive in 2020 ;
~ 10%
• EBITDA Positive
after 1st year of
operations
Initial Investment
Real Estate ;
• Part of High End
Commercial
Complex
• 20 Year rental
contract (EGP 400k
per month
Capex ;
• Medical & Civil
Capex ; ~EGP 30mn
IRR & Payback Period
• IRR 20%
• Payback 4 Years
Majjarah Polyclinic (West Cairo)
15 Clinics
+350 slots
X-Ray / Ultrasound
ER / Pharmacy / Ambulance
Hot Lab
Operational Date ; August 2019
42Cleopatra Investor Presentation 3Q19
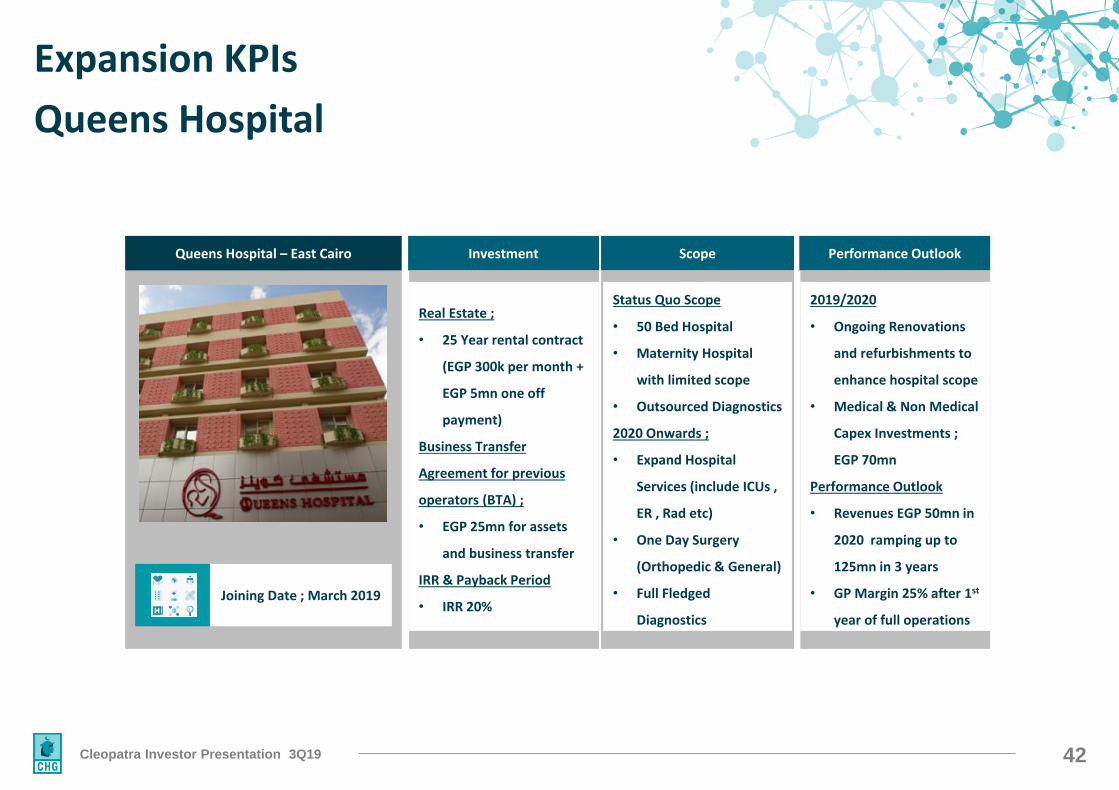
Expansion KPIs
Queens Hospital
Queens Hospital – East Cairo Scope
Status Quo Scope
• 50 Bed Hospital
• Maternity Hospital
with limited scope
• Outsourced Diagnostics
2020 Onwards ;
• Expand Hospital
Services (include ICUs ,
ER , Rad etc)
• One Day Surgery
(Orthopedic & General)
• Full Fledged
Diagnostics
Performance Outlook
2019/2020
• Ongoing Renovations
and refurbishments to
enhance hospital scope
• Medical & Non Medical
Capex Investments ;
EGP 70mn
Performance Outlook
• Revenues EGP 50mn in
2020 ramping up to
125mn in 3 years
• GP Margin 25% after 1st
year of full operations
Investment
Real Estate ;
• 25 Year rental contract
(EGP 300k per month +
EGP 5mn one off
payment)
Business Transfer
Agreement for previous
operators (BTA) ;
• EGP 25mn for assets
and business transfer
IRR & Payback Period
• IRR 20% Joining Date ; March 2019
43Cleopatra Investor Presentation 3Q19
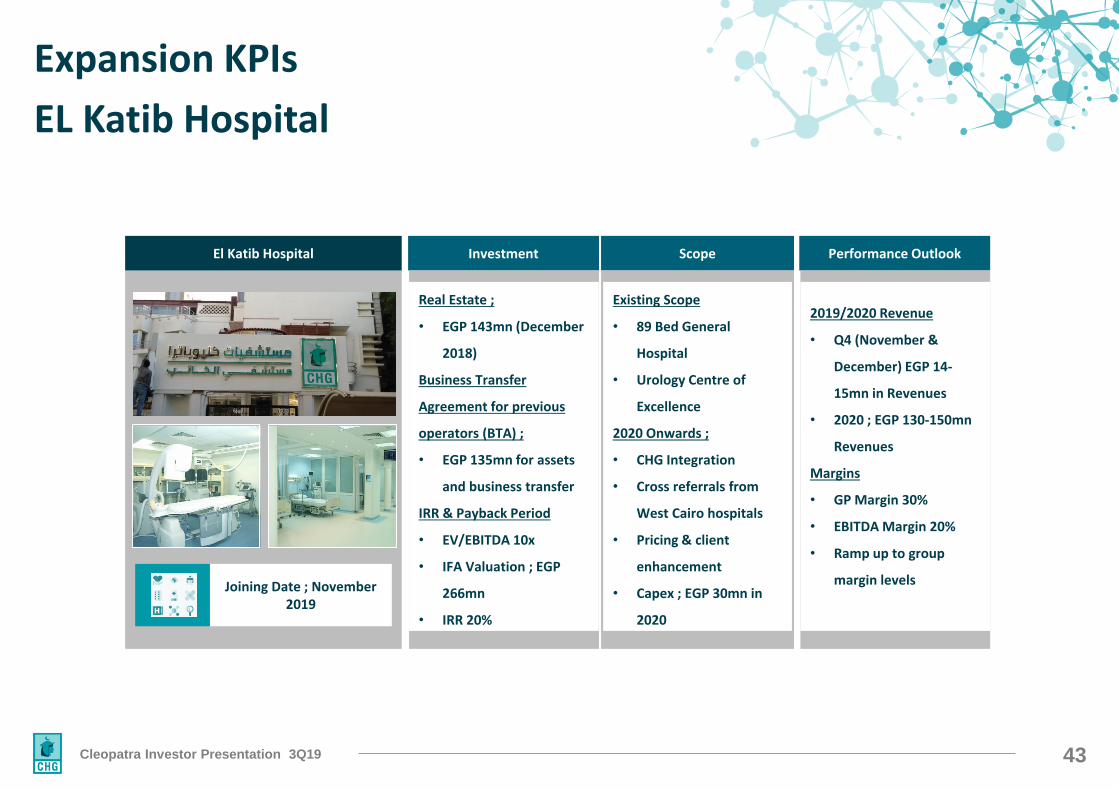
Expansion KPIs
EL Katib Hospital
El Katib Hospital Scope
Existing Scope
• 89 Bed General
Hospital
• Urology Centre of
Excellence
2020 Onwards ;
• CHG Integration
• Cross referrals from
West Cairo hospitals
• Pricing & client
enhancement
• Capex ; EGP 30mn in
2020
Performance Outlook
2019/2020 Revenue
• Q4 (November &
December) EGP 14-
15mn in Revenues
• 2020 ; EGP 130-150mn
Revenues
Margins
• GP Margin 30%
• EBITDA Margin 20%
• Ramp up to group
margin levels
Investment
Real Estate ;
• EGP 143mn (December
2018)
Business Transfer
Agreement for previous
operators (BTA) ;
• EGP 135mn for assets
and business transfer
IRR & Payback Period
• EV/EBITDA 10x
• IFA Valuation ; EGP
266mn
• IRR 20%
Joining Date ; November 2019
44Cleopatra Investor Presentation 3Q19
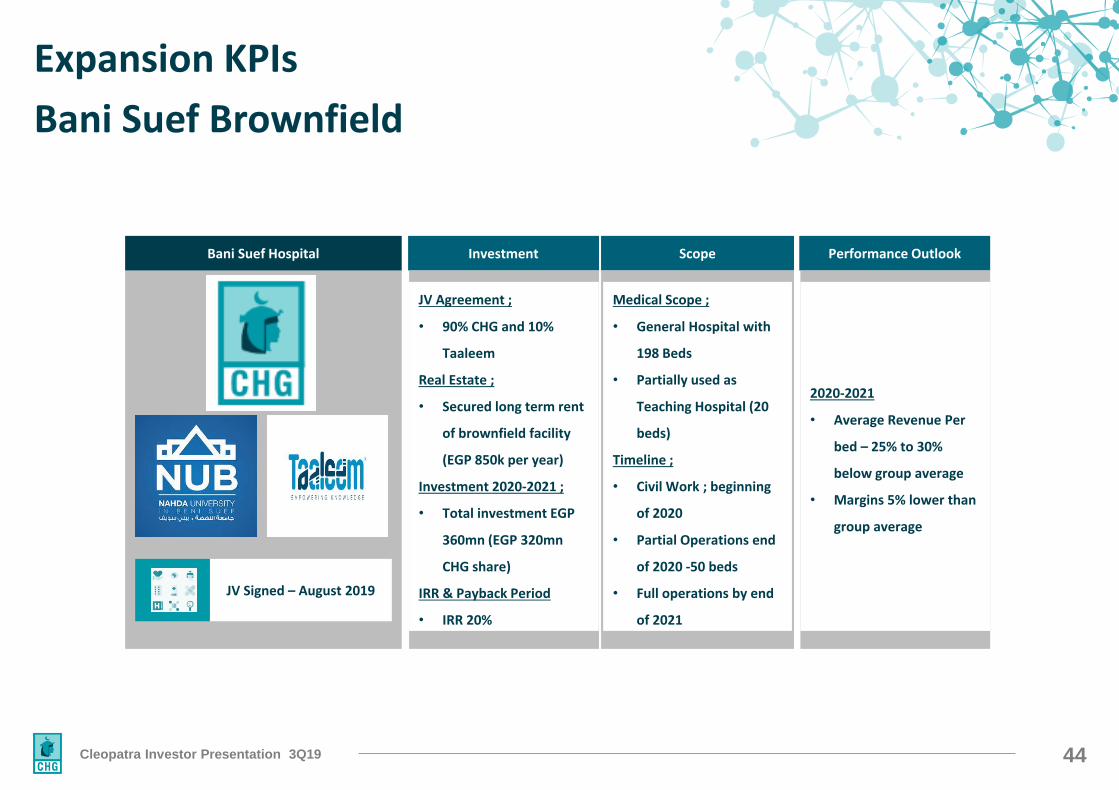
Expansion KPIs
Bani Suef Brownfield
Bani Suef Hospital Scope
Medical Scope ;
• General Hospital with
198 Beds
• Partially used as
Teaching Hospital (20
beds)
Timeline ;
• Civil Work ; beginning
of 2020
• Partial Operations end
of 2020 -50 beds
• Full operations by end
of 2021
Performance Outlook
2020-2021
• Average Revenue Per
bed – 25% to 30%
below group average
• Margins 5% lower than
group average
Investment
JV Agreement ;
• 90% CHG and 10%
Taaleem
Real Estate ;
• Secured long term rent
of brownfield facility
(EGP 850k per year)
Investment 2020-2021 ;
• Total investment EGP
360mn (EGP 320mn
CHG share)
IRR & Payback Period
• IRR 20%
JV Signed – August 2019
45Cleopatra Investor Presentation 3Q19
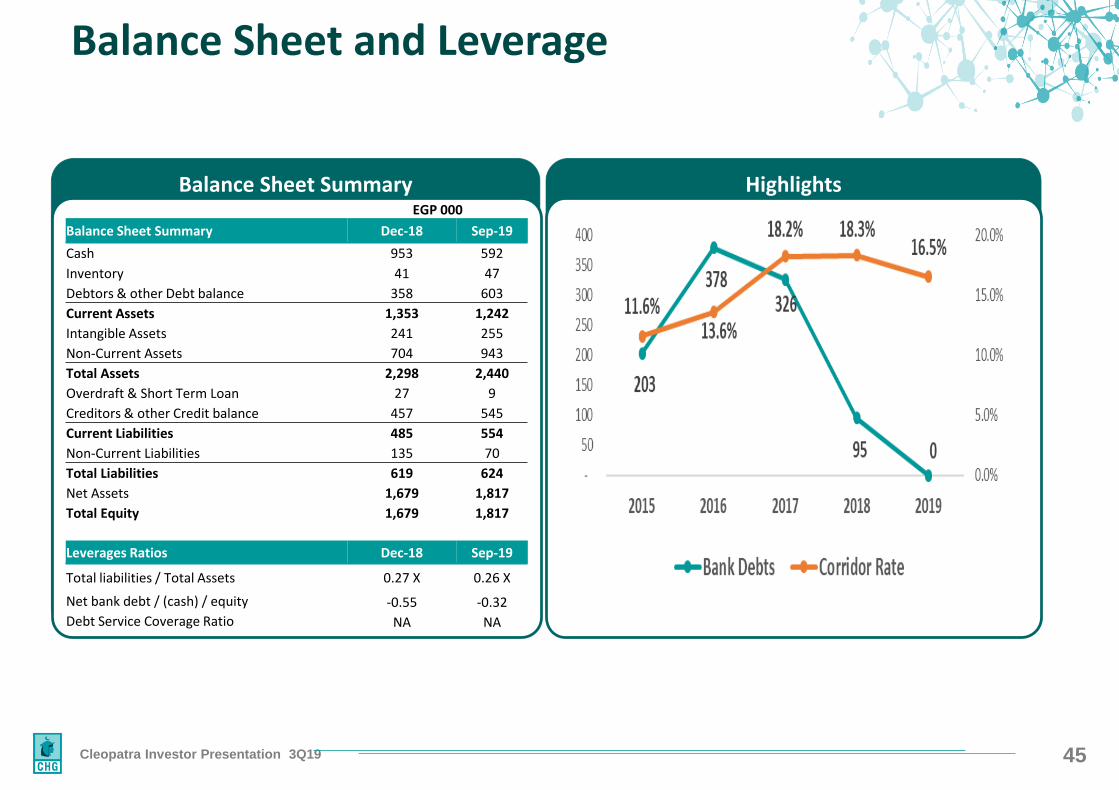
HighlightsBalance Sheet Summary
Balance Sheet and Leverage
EGP 000
Balance Sheet Summary Dec-18 Sep-19
Cash 953 592
Inventory 41 47
Debtors & other Debt balance 358 603
Current Assets 1,353 1,242
Intangible Assets 241 255
Non-Current Assets 704 943
Total Assets 2,298 2,440
Overdraft & Short Term Loan 27 9
Creditors & other Credit balance 457 545
Current Liabilities 485 554
Non-Current Liabilities 135 70
Total Liabilities 619 624
Net Assets 1,679 1,817
Total Equity 1,679 1,817
Leverages Ratios Dec-18 Sep-19
Total liabilities / Total Assets 0.27 X 0.26 X
Net bank debt / (cash) / equity -0.55 -0.32
Debt Service Coverage Ratio NA NA
46Cleopatra Investor Presentation 3Q19
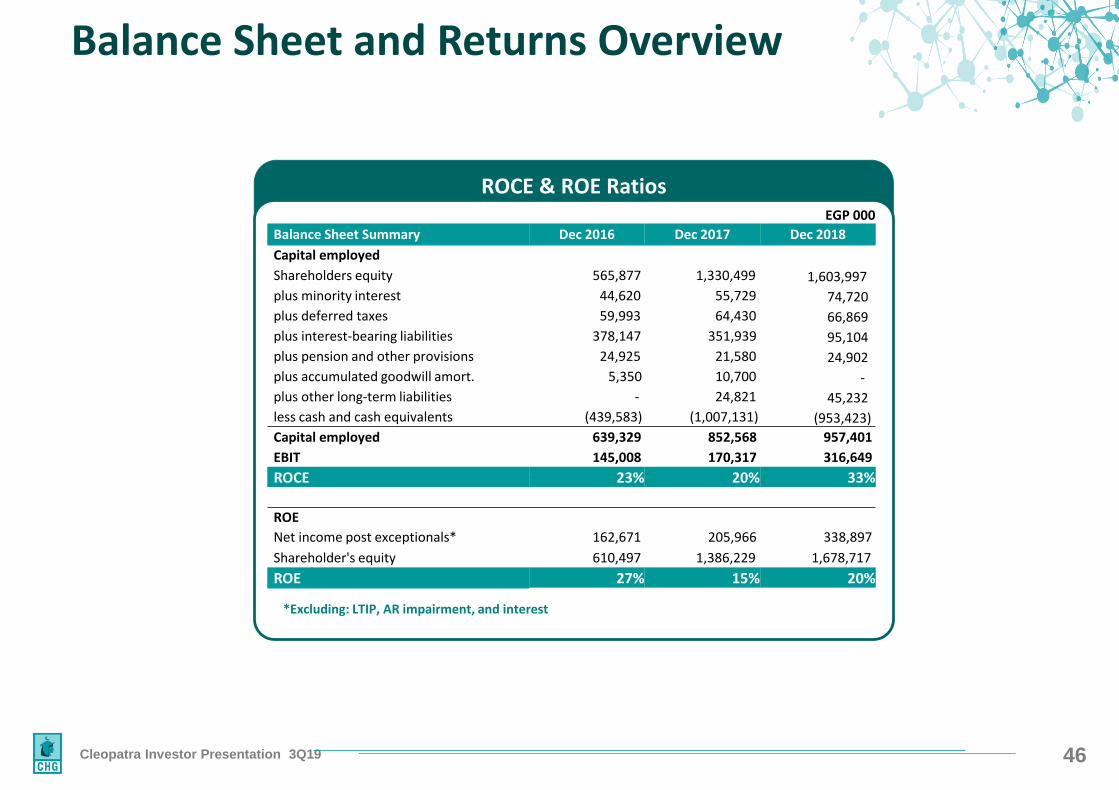
ROCE & ROE Ratios
Balance Sheet and Returns Overview
EGP 000
Balance Sheet Summary Dec 2016 Dec 2017 Dec 2018
Capital employed
Shareholders equity 565,877 1,330,499 1,603,997
plus minority interest 44,620 55,729 74,720
plus deferred taxes 59,993 64,430 66,869
plus interest-bearing liabilities 378,147 351,939 95,104
plus pension and other provisions 24,925 21,580 24,902
plus accumulated goodwill amort. 5,350 10,700 -
plus other long-term liabilities - 24,821 45,232
less cash and cash equivalents (439,583) (1,007,131) (953,423)
Capital employed 639,329 852,568 957,401
EBIT 145,008 170,317 316,649
ROCE 23% 20% 33%
ROE
Net income post exceptionals* 162,671 205,966 338,897
Shareholder's equity 610,497 1,386,229 1,678,717
ROE 27% 15% 20%
*Excluding: LTIP, AR impairment, and interest
47Cleopatra Investor Presentation 3Q19
Cash Conversion Cycle
DSODIO
Cash Conversion CycleDPO
48Cleopatra Investor Presentation 3Q19
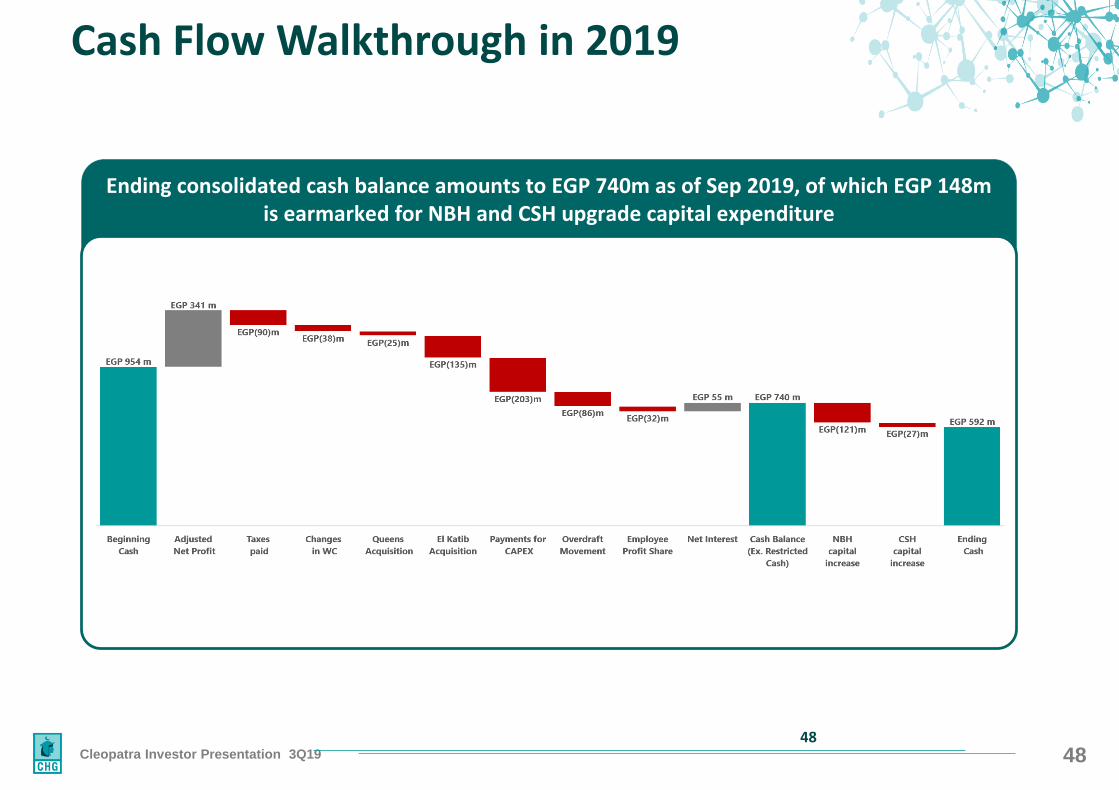
Ending consolidated cash balance amounts to EGP 740m as of Sep 2019, of which EGP 148m is earmarked for NBH and CSH upgrade capital expenditure
Cash Flow Walkthrough in 2019
48
49Cleopatra Investor Presentation 3Q19
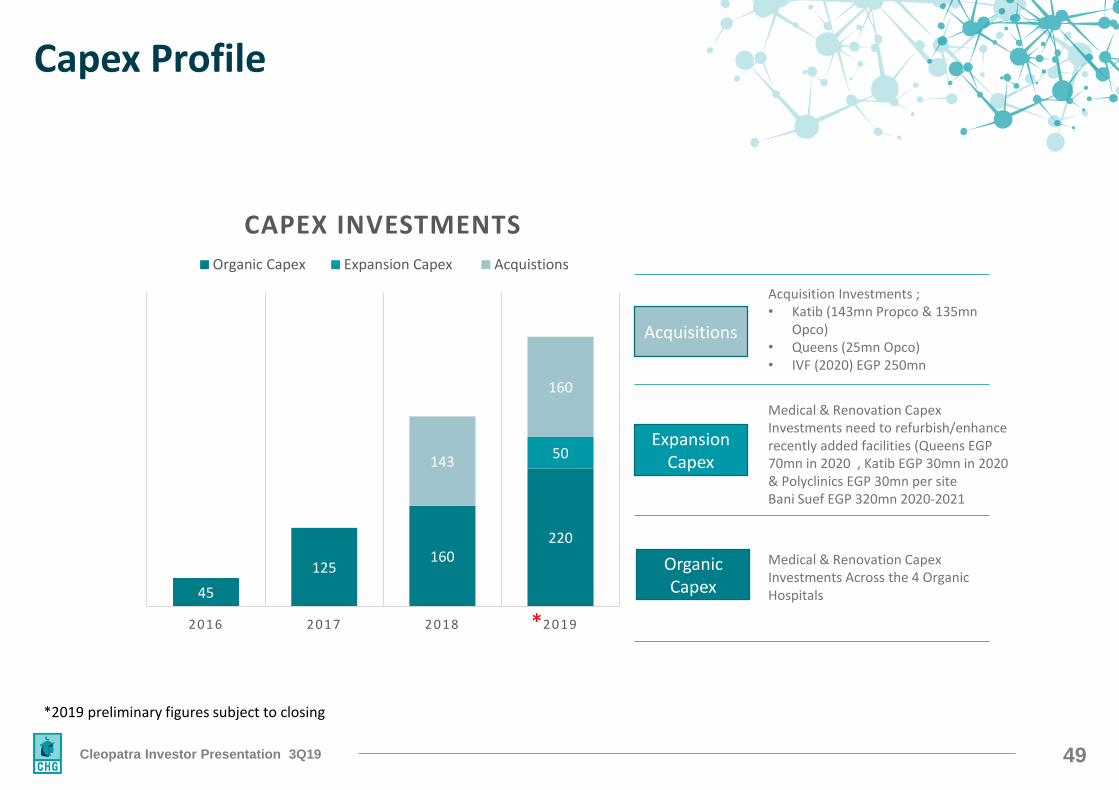
Capex Profile
45
125160
220
50143
160
2016 2017 2018 2019
CAPEX INVESTMENTS
Organic Capex Expansion Capex Acquistions
Organic Capex
Expansion Capex
Acquisitions
Medical & Renovation Capex Investments Across the 4 Organic Hospitals
Medical & Renovation Capex Investments need to refurbish/enhance recently added facilities (Queens EGP 70mn in 2020 , Katib EGP 30mn in 2020 & Polyclinics EGP 30mn per siteBani Suef EGP 320mn 2020-2021
Acquisition Investments ; • Katib (143mn Propco & 135mn
Opco) • Queens (25mn Opco) • IVF (2020) EGP 250mn
*
*2019 preliminary figures subject to closing

50Cleopatra Investor Presentation 3Q19
Appendix : Financial Statements
51Cleopatra Investor Presentation 3Q19
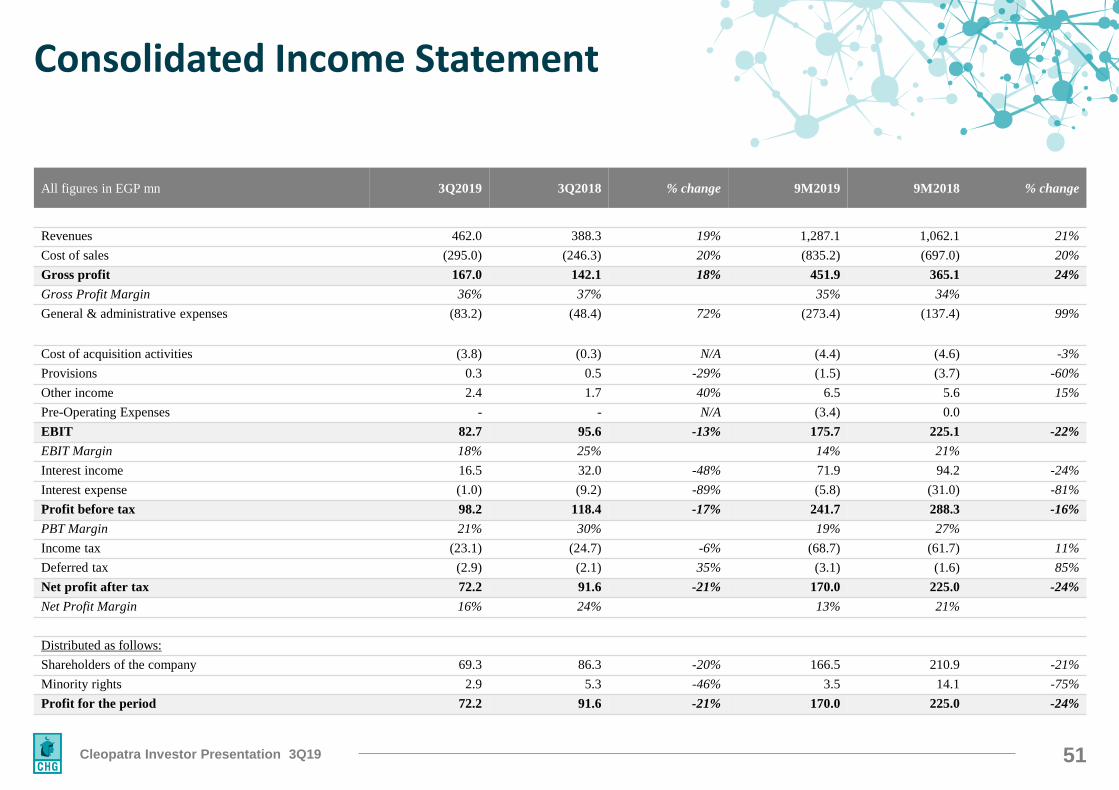
Consolidated Income Statement
All figures in EGP mn 3Q2019 3Q2018 % change 9M2019 9M2018 % change
Revenues 462.0 388.3 19% 1,287.1 1,062.1 21%
Cost of sales (295.0) (246.3) 20% (835.2) (697.0) 20%
Gross profit 167.0 142.1 18% 451.9 365.1 24%
Gross Profit Margin 36% 37% 35% 34%
General & administrative expenses (83.2) (48.4) 72% (273.4) (137.4) 99%
Cost of acquisition activities (3.8) (0.3) N/A (4.4) (4.6) -3%
Provisions 0.3 0.5 -29% (1.5) (3.7) -60%
Other income 2.4 1.7 40% 6.5 5.6 15%
Pre-Operating Expenses - - N/A (3.4) 0.0
EBIT 82.7 95.6 -13% 175.7 225.1 -22%
EBIT Margin 18% 25% 14% 21%
Interest income 16.5 32.0 -48% 71.9 94.2 -24%
Interest expense (1.0) (9.2) -89% (5.8) (31.0) -81%
Profit before tax 98.2 118.4 -17% 241.7 288.3 -16%
PBT Margin 21% 30% 19% 27%
Income tax (23.1) (24.7) -6% (68.7) (61.7) 11%
Deferred tax (2.9) (2.1) 35% (3.1) (1.6) 85%
Net profit after tax 72.2 91.6 -21% 170.0 225.0 -24%
Net Profit Margin 16% 24% 13% 21%
Distributed as follows:
Shareholders of the company 69.3 86.3 -20% 166.5 210.9 -21%
Minority rights 2.9 5.3 -46% 3.5 14.1 -75%
Profit for the period 72.2 91.6 -21% 170.0 225.0 -24%
52Cleopatra Investor Presentation 3Q19
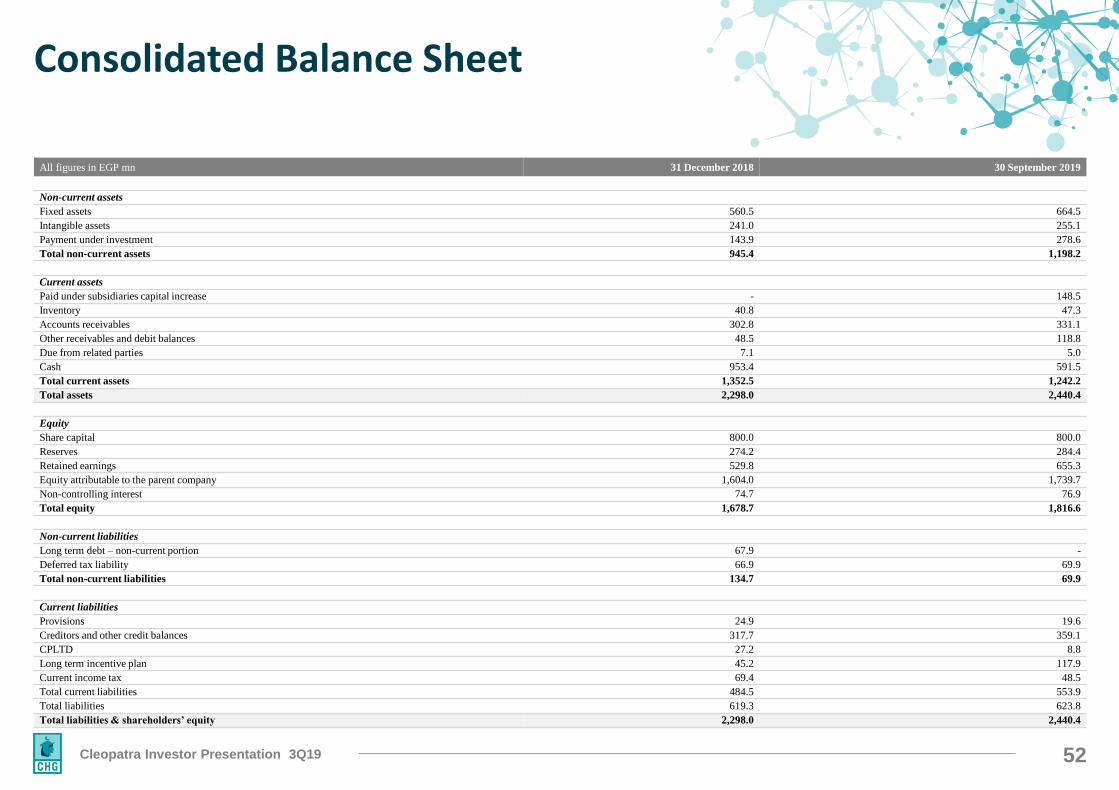
Consolidated Balance Sheet
All figures in EGP mn 31 December 2018 30 September 2019
Non-current assets
Fixed assets 560.5 664.5
Intangible assets 241.0 255.1
Payment under investment 143.9 278.6
Total non-current assets 945.4 1,198.2
Current assets
Paid under subsidiaries capital increase - 148.5
Inventory 40.8 47.3
Accounts receivables 302.8 331.1
Other receivables and debit balances 48.5 118.8
Due from related parties 7.1 5.0
Cash 953.4 591.5
Total current assets 1,352.5 1,242.2
Total assets 2,298.0 2,440.4
Equity
Share capital 800.0 800.0
Reserves 274.2 284.4
Retained earnings 529.8 655.3
Equity attributable to the parent company 1,604.0 1,739.7
Non-controlling interest 74.7 76.9
Total equity 1,678.7 1,816.6
Non-current liabilities
Long term debt – non-current portion 67.9 -
Deferred tax liability 66.9 69.9
Total non-current liabilities 134.7 69.9
Current liabilities
Provisions 24.9 19.6
Creditors and other credit balances 317.7 359.1
CPLTD 27.2 8.8
Long term incentive plan 45.2 117.9
Current income tax 69.4 48.5
Total current liabilities 484.5 553.9
Total liabilities 619.3 623.8
Total liabilities & shareholders’ equity 2,298.0 2,440.4
53Cleopatra Investor Presentation 3Q19
Consolidated Cash Flow Statement
All figures in EGP mn 30 September 2018 30 September 2019
Cash flow from operating activities:
Profit before tax 288.3 241.7
Adjustments for:
Depreciation 32.6 45.8
Allowance for impairment of current assets (3.6) 48.4
Provision (3.6) (5.3)
Capital gain/Loss (0.5) (0.3)
Credit / Debit Interest (63.2) (69.0)
Changes in current tax liability (26.3) (89.6)
Share-based payments financial liabilities 16.8 72.7 Operating profits before changes in assets and liabilities 240.4 244.2Changes in working capital:
Changes in Inventories (5.3) (5.2)
Change in trade receivables , debtors and other debit balances (114.6) (83.9)
Changes in Due from related parties (18.7) 2.1
Change in trade and other payables 66.6 56.0
Net cash flows generated from operating activities 168.5 213.2 Cash flow from investment activities:
Proceeds from sale of fixed assets 0.6 0.6
Payments for purchase of fixed assets (47.3) (52.9)
PUC purchased (29.6) (88.6)
Advanced payments for purchase of fixed assets (12.0) (62.6)
Payments for acquisition of a subsidiary, net cash acquired - (25.0)
Payments under investment - (135.1)
Credit interest collected 94.4 72.5
Time deposits with maturity more than 3 months 11.0 -
Paid under subsidiaries capital increase - (148.5)Net cash flow from investment activities 17.3 (439.5)Cash flow from financing activities:
Dividends paid (21.7) (31.9)Proceeds from borrowings - -Repayment of borrowings (130.9) (95.1)Cash proceed from overdraft 60.0 62.6 Cash paid to overdraft (80.6) (53.9)Interest paid (45.2) (17.9)Net cash flow from financing activities (218.3) (136.1)
Net change in cash & cash equivalents during the period (32.6) (362.5)
Cash & cash equivalents at the beginning of the period 996.1 953.4 Cash & Cash equivalent at in acquired subsidiaries at the beg. of the period - 0.6 Cash & cash equivalents at the end of the period 963.5 591.5

54Cleopatra Investor Presentation 3Q19
Appendix : Market Overview
55Cleopatra Investor Presentation 3Q19
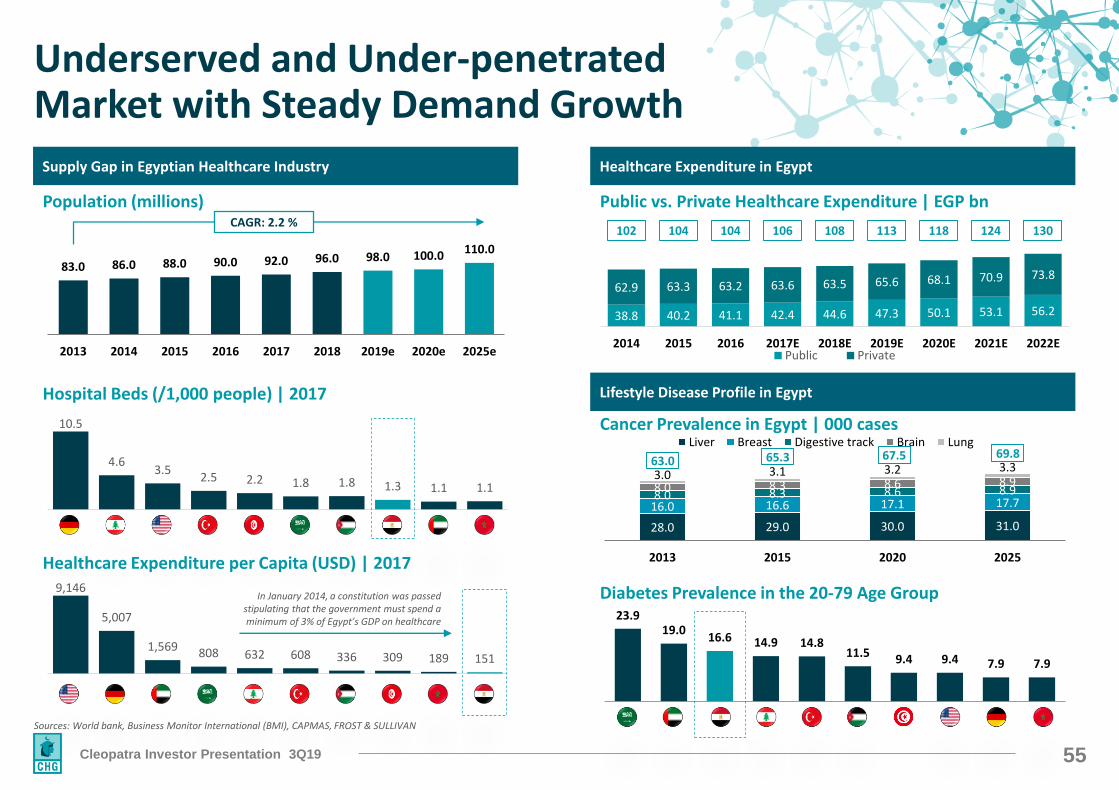
Underserved and Under-penetrated Market with Steady Demand Growth
Sources: World bank, Business Monitor International (BMI), CAPMAS, FROST & SULLIVAN
Hospital Beds (/1,000 people) | 2017
10.5
4.63.5
2.5 2.2 1.8 1.8 1.3 1.1 1.1
Healthcare Expenditure per Capita (USD) | 20179,146
5,007
1,569 808 632 608 336 309 189 151
In January 2014, a constitution was passed stipulating that the government must spend a minimum of 3% of Egypt’s GDP on healthcare
Population (millions)
83.0 86.0 88.0 90.0 92.0 96.0 98.0 100.0 110.0
2013 2014 2015 2016 2017 2018 2019e 2020e 2025e
CAGR: 2.2 %
Public vs. Private Healthcare Expenditure | EGP bn
38.8 40.2 41.1 42.4 44.6 47.3 50.1 53.1 56.2
62.9 63.3 63.2 63.6 63.5 65.6 68.1 70.9 73.8
2014 2015 2016 2017E 2018E 2019E 2020E 2021E 2022EPublic Private
102 104 104 106 108 113 118 124 130
Cancer Prevalence in Egypt | 000 cases
28.0 29.0 30.0 31.0
16.0 16.6 17.1 17.7 8.0 8.3 8.6 8.9 8.0 8.3 8.6 8.9 3.0 3.1 3.2 3.3 63.0 65.3 67.5 69.8
2013 2015 2020 2025
Liver Breast Digestive track Brain Lung
Diabetes Prevalence in the 20-79 Age Group 23.9
19.0 16.6 14.9 14.8
11.5 9.4 9.4 7.9 7.9
Supply Gap in Egyptian Healthcare Industry Healthcare Expenditure in Egypt
Lifestyle Disease Profile in Egypt
56Cleopatra Investor Presentation 3Q19
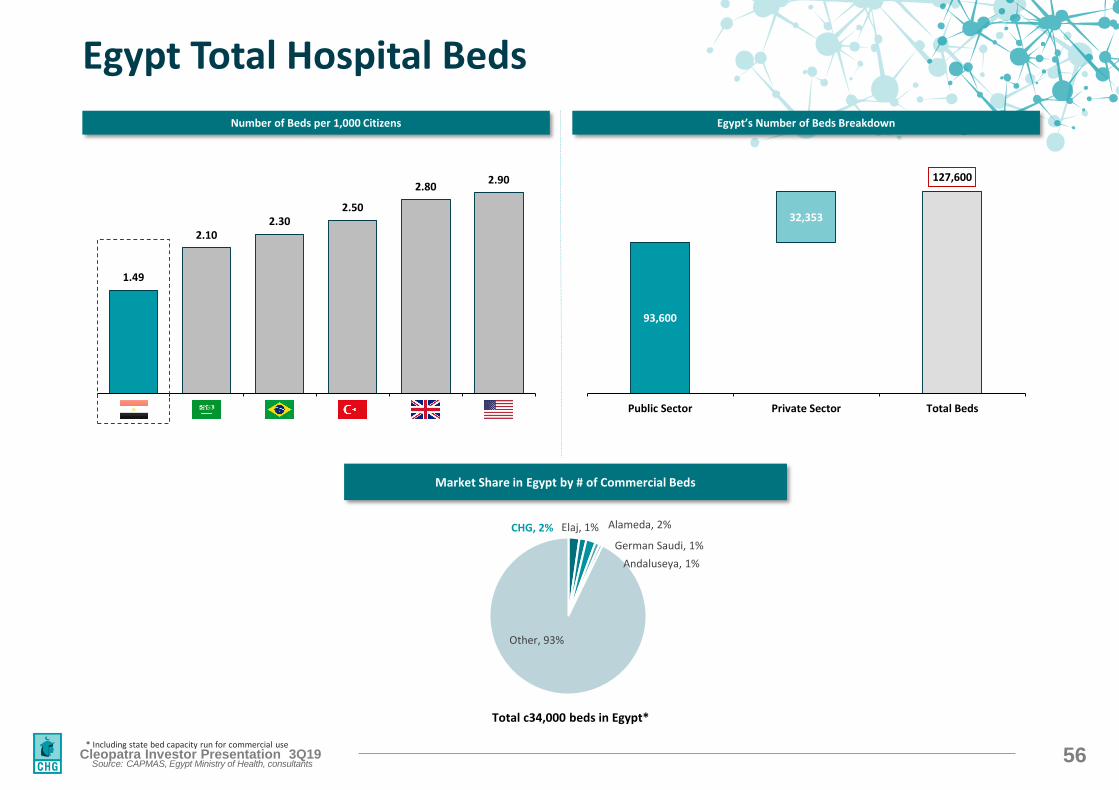
Egypt Total Hospital Beds
93,600
32,353
127,600
Public Sector Private Sector Total Beds
1.49
2.102.30
2.50
2.802.90
Egypt KSA Brazil Turkey Britain USA
Egypt’s Number of Beds BreakdownNumber of Beds per 1,000 Citizens
Market Share in Egypt by # of Commercial Beds
CHG, 2% Elaj, 1% Alameda, 2%
German Saudi, 1%
Andaluseya, 1%
Other, 93%
Total c34,000 beds in Egypt*
* Including state bed capacity run for commercial use
Source: CAPMAS, Egypt Ministry of Health, consultants
57Cleopatra Investor Presentation 3Q19
Egypt Total Hospital Beds (cont’d)
0%
20%
40%
60%
80%
100%
100% PublicPrivate Public
> 100 Beds
Others
Basic Healthcare Centers
General Hospitals
Teaching Institutes
Specialized Medical Centers
Armed Forces Facilities
No. of Hospital Beds in Egypt (K) Total = 133 Beds
35 98
Highly Fragmented Space
Source: CAPMAS, Egypt Ministry of Health, consultants
Includes Hospitals Owned & Operated by Public Insurance
C. 50 – 100+ Bed Hospitals only;
Primarily in Cairo, Giza & Alexandria
58Cleopatra Investor Presentation 3Q19
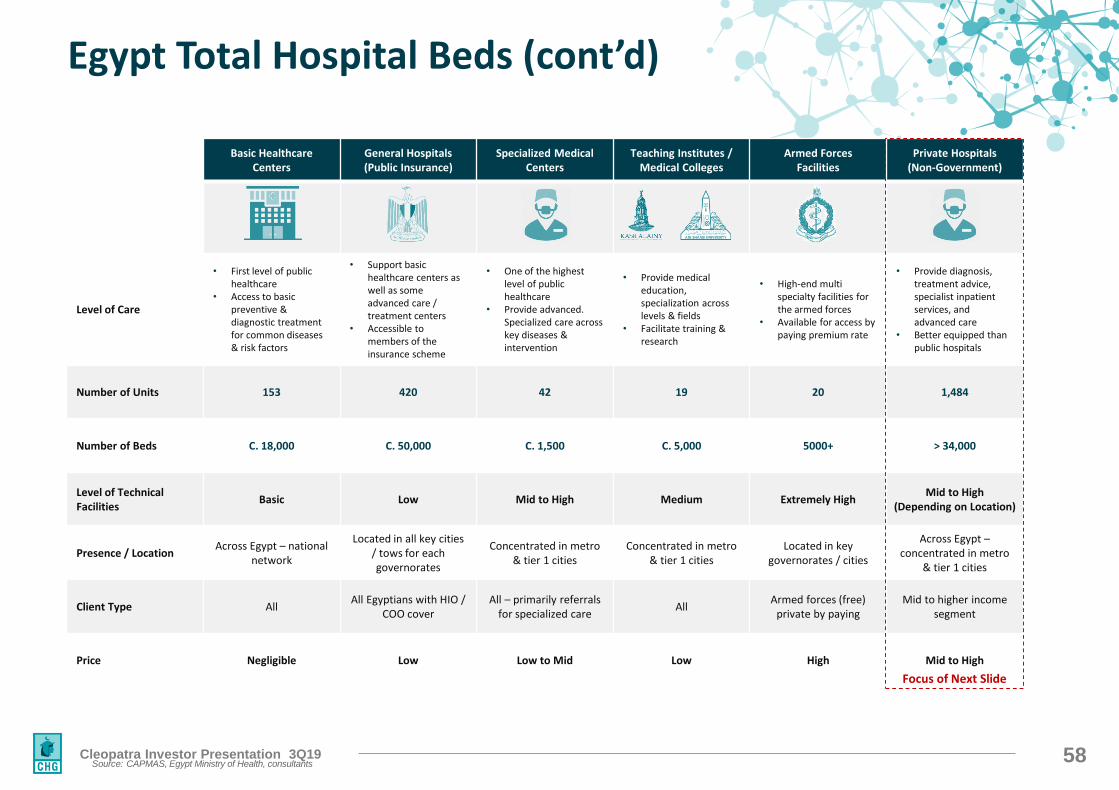
Egypt Total Hospital Beds (cont’d)
Basic HealthcareCenters
General Hospitals(Public Insurance)
Specialized Medical Centers
Teaching Institutes / Medical Colleges
Armed Forces Facilities
Private Hospitals (Non-Government)
Level of Care
• First level of public healthcare
• Access to basic preventive & diagnostic treatment for common diseases & risk factors
• Support basic healthcare centers as well as some advanced care / treatment centers
• Accessible to members of the insurance scheme
• One of the highestlevel of public healthcare
• Provide advanced. Specialized care across key diseases & intervention
• Provide medical education,specialization across levels & fields
• Facilitate training & research
• High-end multi specialty facilities for the armed forces
• Available for access by paying premium rate
• Provide diagnosis,treatment advice, specialist inpatient services, and advanced care
• Better equipped than public hospitals
Number of Units 153 420 42 19 20 1,484
Number of Beds C. 18,000 C. 50,000 C. 1,500 C. 5,000 5000+ > 34,000
Level of TechnicalFacilities
Basic Low Mid to High Medium Extremely HighMid to High
(Depending on Location)
Presence / LocationAcross Egypt – national
network
Located in all key cities / tows for each governorates
Concentrated in metro& tier 1 cities
Concentrated in metro& tier 1 cities
Located in key governorates / cities
Across Egypt –concentrated in metro
& tier 1 cities
Client Type AllAll Egyptians with HIO /
COO coverAll – primarily referrals
for specialized careAll
Armed forces (free) private by paying
Mid to higher incomesegment
Price Negligible Low Low to Mid Low High Mid to High
Focus of Next Slide
Source: CAPMAS, Egypt Ministry of Health, consultants
59Cleopatra Investor Presentation 3Q19
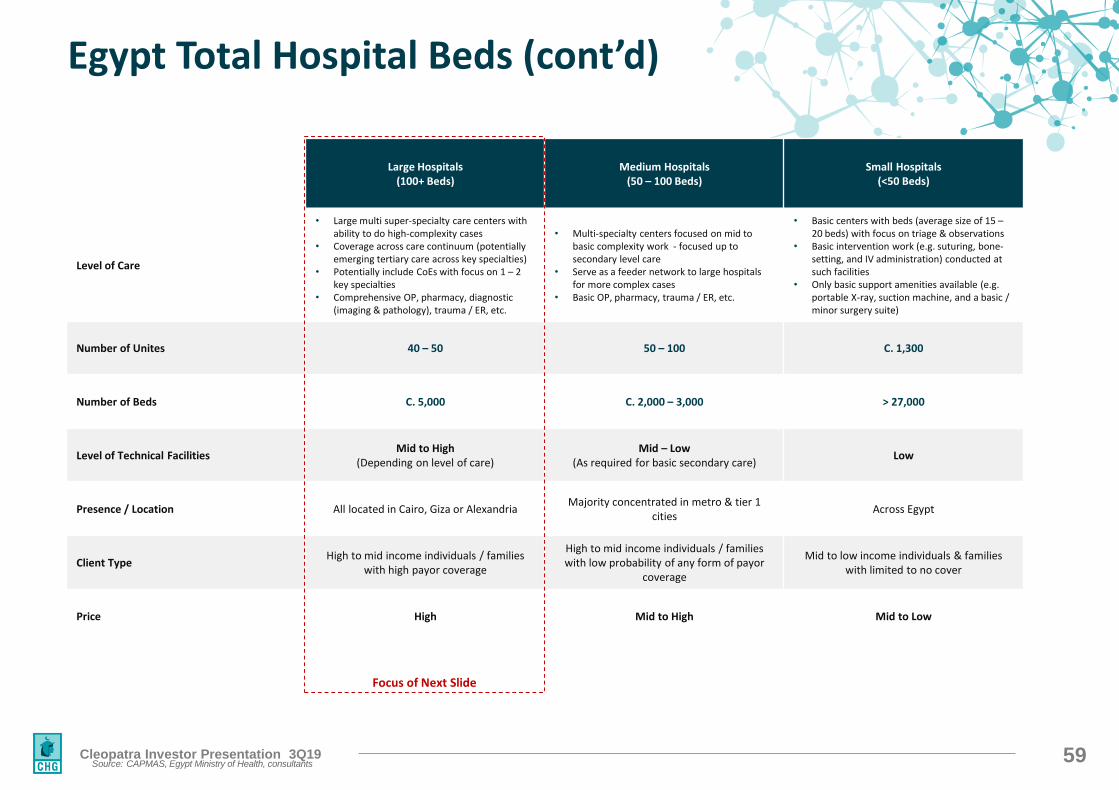
Egypt Total Hospital Beds (cont’d)
Large Hospitals(100+ Beds)
Medium Hospitals(50 – 100 Beds)
Small Hospitals(<50 Beds)
Level of Care
• Large multi super-specialty care centers with ability to do high-complexity cases
• Coverage across care continuum (potentially emerging tertiary care across key specialties)
• Potentially include CoEs with focus on 1 – 2 key specialties
• Comprehensive OP, pharmacy, diagnostic (imaging & pathology), trauma / ER, etc.
• Multi-specialty centers focused on mid to basic complexity work - focused up to secondary level care
• Serve as a feeder network to large hospitals for more complex cases
• Basic OP, pharmacy, trauma / ER, etc.
• Basic centers with beds (average size of 15 –20 beds) with focus on triage & observations
• Basic intervention work (e.g. suturing, bone-setting, and IV administration) conducted at such facilities
• Only basic support amenities available (e.g. portable X-ray, suction machine, and a basic / minor surgery suite)
Number of Unites 40 – 50 50 – 100 C. 1,300
Number of Beds C. 5,000 C. 2,000 – 3,000 > 27,000
Level of Technical FacilitiesMid to High
(Depending on level of care)Mid – Low
(As required for basic secondary care)Low
Presence / Location All located in Cairo, Giza or AlexandriaMajority concentrated in metro & tier 1
citiesAcross Egypt
Client TypeHigh to mid income individuals / families
with high payor coverage
High to mid income individuals / families with low probability of any form of payor
coverage
Mid to low income individuals & families with limited to no cover
Price High Mid to High Mid to Low
Focus of Next Slide
Source: CAPMAS, Egypt Ministry of Health, consultants
60Cleopatra Investor Presentation 3Q19
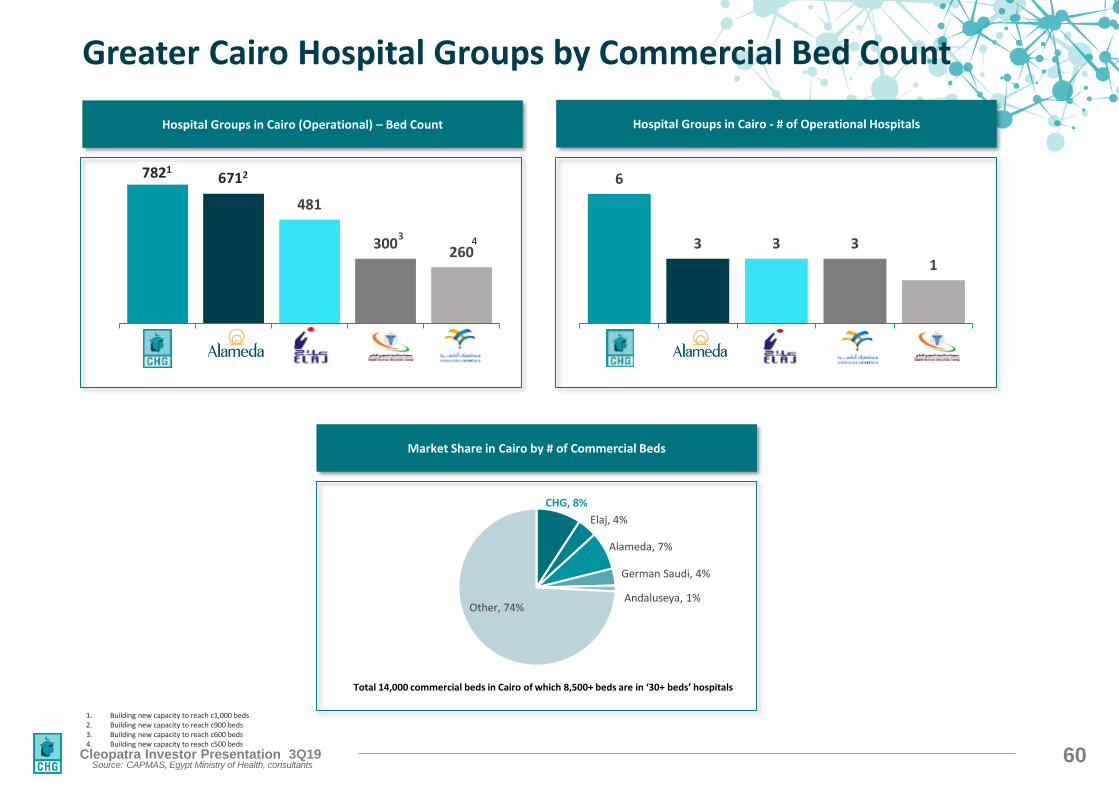
Greater Cairo Hospital Groups by Commercial Bed Count
643601
481
300260
6
3 3 3
1
Hospital Groups in Cairo - # of Operational Hospitals Hospital Groups in Cairo (Operational) – Bed Count
Market Share in Cairo by # of Commercial Beds
CHG, 8%
Elaj, 4%
Alameda, 7%
German Saudi, 4%
Andaluseya, 1%Other, 74%
Total 14,000 commercial beds in Cairo of which 8,500+ beds are in ‘30+ beds’ hospitals
78216712
1. Building new capacity to reach c1,000 beds 2. Building new capacity to reach c900 beds 3. Building new capacity to reach c600 beds 4. Building new capacity to reach c500 beds
3 4
Source: CAPMAS, Egypt Ministry of Health, consultants
61Cleopatra Investor Presentation 3Q19
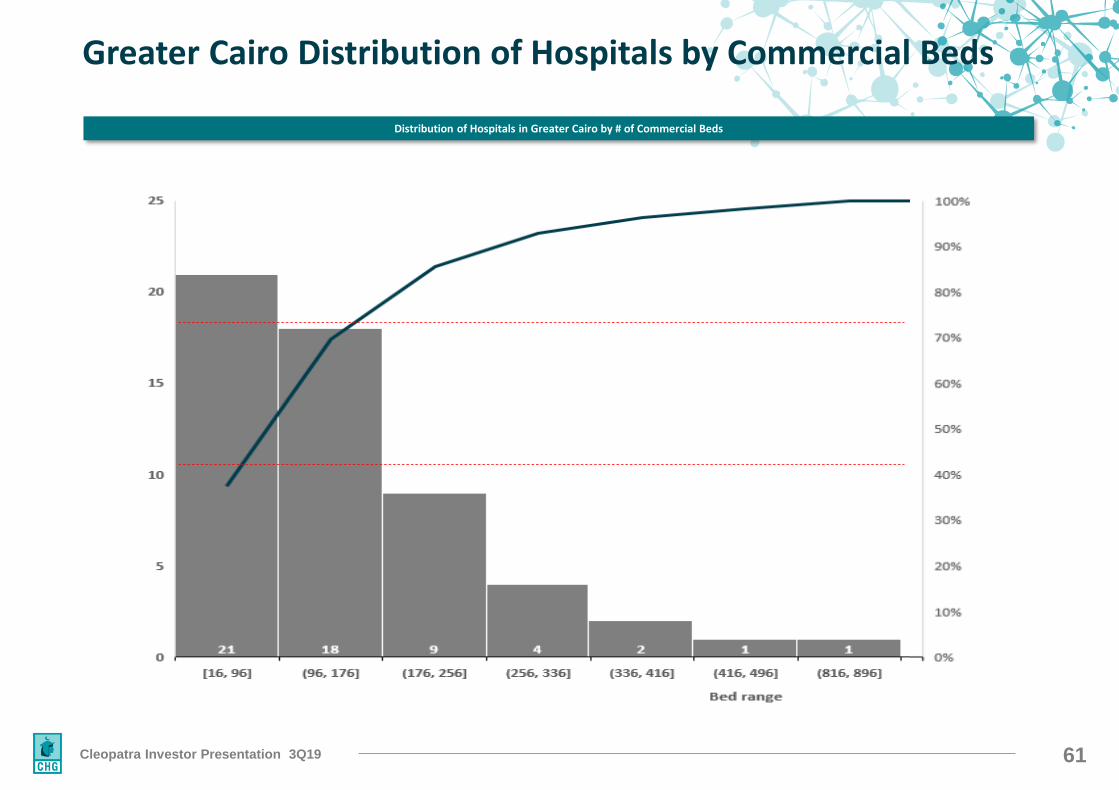
Greater Cairo Distribution of Hospitals by Commercial Beds
Distribution of Hospitals in Greater Cairo by # of Commercial Beds
62Cleopatra Investor Presentation 3Q19
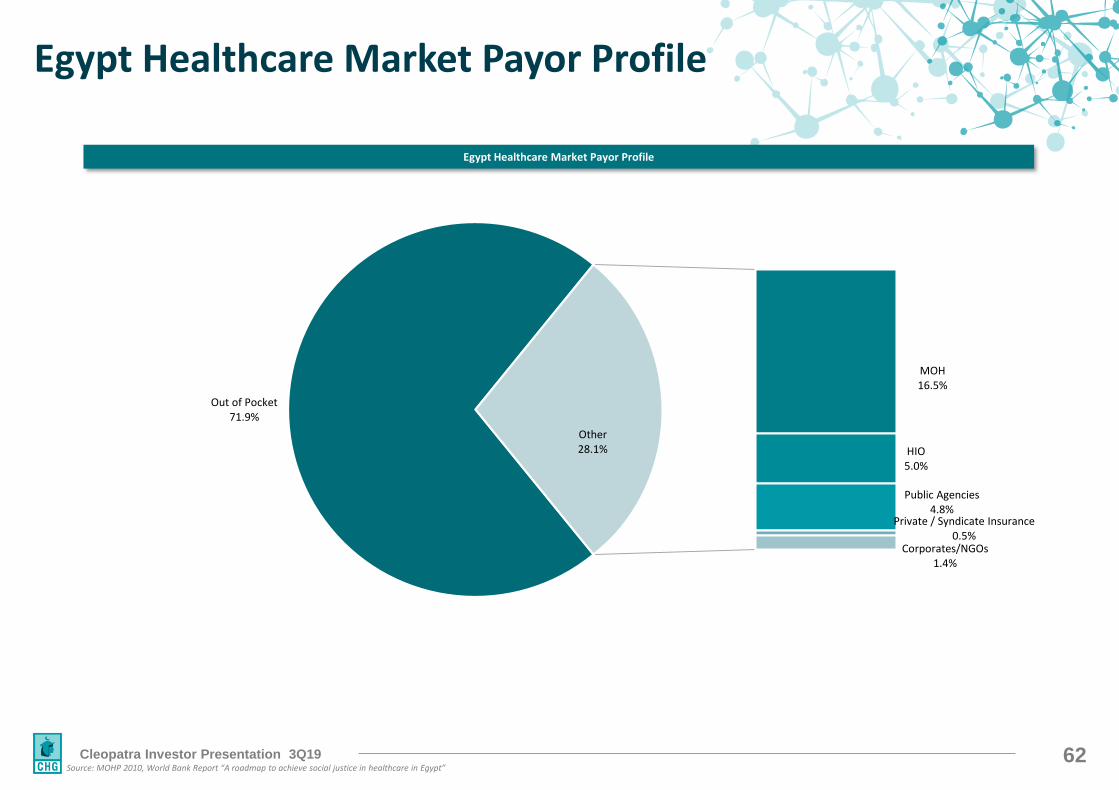
Egypt Healthcare Market Payor Profile
Out of Pocket71.9%
MOH16.5%
HIO5.0%
Public Agencies4.8%
Private / Syndicate Insurance0.5%
Corporates/NGOs1.4%
Other28.1%
Source: MOHP 2010, World Bank Report “A roadmap to achieve social justice in healthcare in Egypt”
Egypt Healthcare Market Payor Profile
63C leopatra Inves tor P res entation 3Q19
Thank you
INVESTOR RELATIONS C ONTAC TS
Telephone: +2 02 23103771E-mail: [email protected]
SHAREHOLDER INFORMATION
EGX: CLHO.CAListed: June 2016Shares Outstanding: 1.6 billion