Nicole (CoCo) Toves Villaluz Hidatsa/Assiniboine/Chamorro ClearWay Minnesota SM

Clearway Energy, Inc.Second Quarter 2021 Results Presentation August 3, 2021

2
Safe HarborThis presentation contains forward-looking statements within the meaning of Section 27A of the Securities Act of 1933 and Section 21E of the Securities Exchange Act of 1934. Forward-looking statements are subject to certain risks, uncertainties and assumptions and typically can be identified by the use of words such as “expect,” “estimate,” “should,” “anticipate,” “forecast,” “plan,” “guidance,” “outlook,” “believe” and similar terms. Such forward-looking statements include, but are not limited to, statements regarding the estimated impact of recent weather events on the Company, its operations, its facilities and its financial results, any potential disposition of the Company’s Thermal platform, impacts related to COVID-19 or any other pandemic, the benefits of the relationship with Global Infrastructure Partners III (GIP) and GIP’s expertise, the Company’s future relationship and arrangements with GIP and Clearway Energy Group, as well as the Company's dividend expectations, Net Income, Adjusted EBITDA, Cash from Operating Activities, Cash Available for Distribution, the Company’s future revenues, income, indebtedness, capital structure, strategy, plans, expectations, objectives, projected financial performance and/or business results and other future events, and views of economic and market conditions.
Although the Company believes that the expectations are reasonable, the Company can give no assurance that these expectations will prove to be correct, and actual results may vary materially. Factors that could cause actual results to differ materially from those contemplated above include, among others, impacts related to COVID-19 or any other pandemic, general economic conditions, hazards customary in the power industry, weather conditions, including wind and solar performance, competition in wholesale power markets, the volatility of energy and fuel prices, failure of customers to perform under contracts, changes in the wholesale power markets, changes in government regulations, the condition of capital markets generally, the Company’s ability to access capital markets, cyber terrorism and inadequate cybersecurity, the Company’s ability to engage in successful acquisitions activity, unanticipated outages at the Company’s generation facilities, adverse results in current and future litigation, failure to identify, execute or successfully implement acquisitions (including receipt of third party consents and regulatory approvals), the Company’s ability to enter into new contracts as existing contracts expire, risks relating to the Company’s relationships with GIP and Clearway Energy Group, the Company’s ability to acquire assets from GIP, Clearway Energy Group or third parties, the Company’s ability to close drop down transactions, and the Company’s ability to maintain and grow its quarterly dividends.
The Company undertakes no obligation to update or revise any forward-looking statements, whether as a result of new information,future events or otherwise, except as required by law. The adjusted EBITDA and cash available for distribution guidance are estimates as of August 3, 2021. These estimates are based on assumptions believed to be reasonable as of that date. The Company disclaims anycurrent intention to update such guidance, except as required by law. Adjusted EBITDA and cash available for distribution are non-GAAP financial measures and are explained in greater detail in the Appendix. The foregoing review of factors that could cause the Company’s actual results to differ materially from those contemplated in the forward-looking statements included in this presentation should be considered in connection with information regarding risks and uncertainties that may affect the Company 's future results included in the Company's filings with the Securities and Exchange Commission at www.sec.gov.
3
Agenda
Business Update Christopher Sotos, Chief Executive Officer
Financial Summary Chad Plotkin, Chief Financial Officer
Closing Remarks and Q&A Christopher Sotos, Chief Executive Officer

4
Business Update
Financial Summary– CAFD Results: $155 MM in 2Q21 and $140 MM through 1H21. Results within seasonality expectations– Maintaining full year CAFD guidance of $325 MM. Includes impact from the Texas winter weather event in 1Q21– Announcing dividend increase of 1.7% to $0.3345/share in 3Q21; on track to achieve upper end of 5-8% growth target for 2021
Advancing Renewable Energy Growth in Partnership with Clearway Group (CEG)– Working with CEG on advancing a new ~1.1 GW partnership co-investment, while also gaining line of sight on 452 MW of new
Texas solar projects and a 133 MW portfolio of distributed solar projects. These drop-down opportunities would target financial closing between 2H22-2024
– CEG has positioned itself to now drive over 2 GW per year in development with an increase in its pipeline to over 16 GW
Focusing on Commercialization and Value Optimization of the California Natural Gas Portfolio and Thermal Platform– In active discussions around new contracts for the California gas assets. Expect further progress during the 3rd quarter– Evaluating the potential disposition of the Thermal platform
Maintaining Pro Forma CAFD per Share Outlook of ~$1.85/share; Continues to Support DPS Growth Visibility Through 2023– Does not factor in uncommitted/new growth or the effects of potential capital recycling related to asset sales
Clearway Continues to Execute on its Plan to Deliver Long Term Dividend Growth
5
2021 CAFD Guidance Pro Forma CAFD Outlook
Pro Forma CAFD Outlook Provides Visible GrowthWith Further Upside From Future Drop-Downs
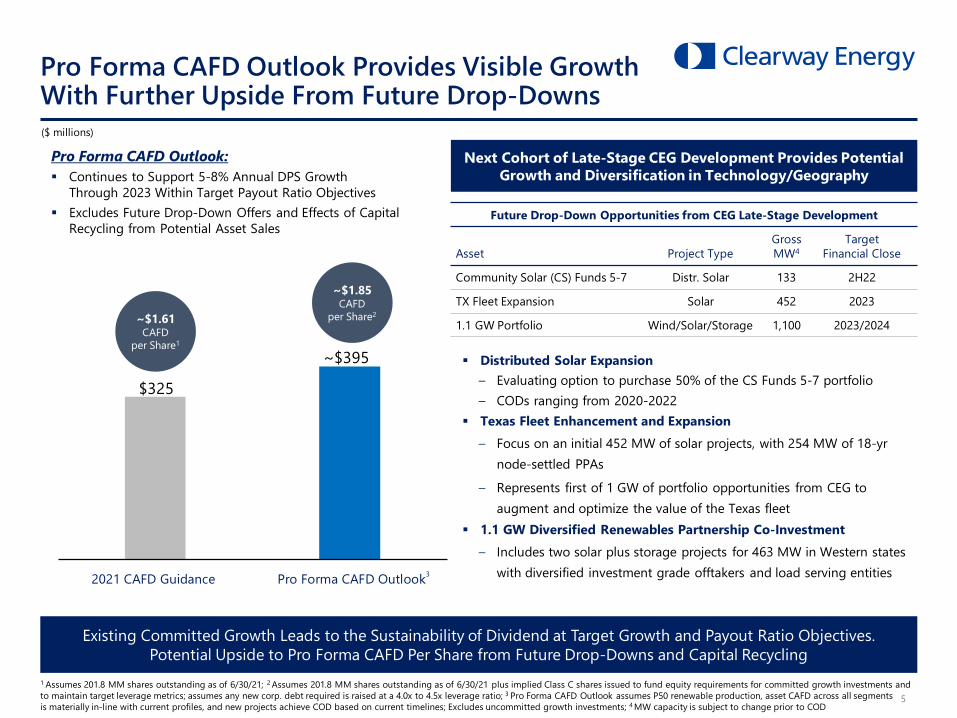
1 Assumes 201.8 MM shares outstanding as of 6/30/21; 2 Assumes 201.8 MM shares outstanding as of 6/30/21 plus implied Class C shares issued to fund equity requirements for committed growth investments and to maintain target leverage metrics; assumes any new corp. debt required is raised at a 4.0x to 4.5x leverage ratio; 3 Pro Forma CAFD Outlook assumes P50 renewable production, asset CAFD across all segments is materially in-line with current profiles, and new projects achieve COD based on current timelines; Excludes uncommitted growth investments; 4 MW capacity is subject to change prior to COD
Existing Committed Growth Leads to the Sustainability of Dividend at Target Growth and Payout Ratio Objectives.Potential Upside to Pro Forma CAFD Per Share from Future Drop-Downs and Capital Recycling
($ millions)
$325
~$395
~$1.61CAFD
per Share1
~$1.85CAFD
per Share2
Future Drop-Down Opportunities from CEG Late-Stage Development
Asset Project TypeGrossMW4
Target Financial Close
Community Solar (CS) Funds 5-7 Distr. Solar 133 2H22
TX Fleet Expansion Solar 452 2023
1.1 GW Portfolio Wind/Solar/Storage 1,100 2023/2024
Next Cohort of Late-Stage CEG Development Provides Potential Growth and Diversification in Technology/Geography
Pro Forma CAFD Outlook: Continues to Support 5-8% Annual DPS Growth
Through 2023 Within Target Payout Ratio Objectives Excludes Future Drop-Down Offers and Effects of Capital
Recycling from Potential Asset Sales
Distributed Solar Expansion– Evaluating option to purchase 50% of the CS Funds 5-7 portfolio– CODs ranging from 2020-2022
Texas Fleet Enhancement and Expansion – Focus on an initial 452 MW of solar projects, with 254 MW of 18-yr
node-settled PPAs
– Represents first of 1 GW of portfolio opportunities from CEG to augment and optimize the value of the Texas fleet
1.1 GW Diversified Renewables Partnership Co-Investment– Includes two solar plus storage projects for 463 MW in Western states
with diversified investment grade offtakers and load serving entities3
Financial Summary
7
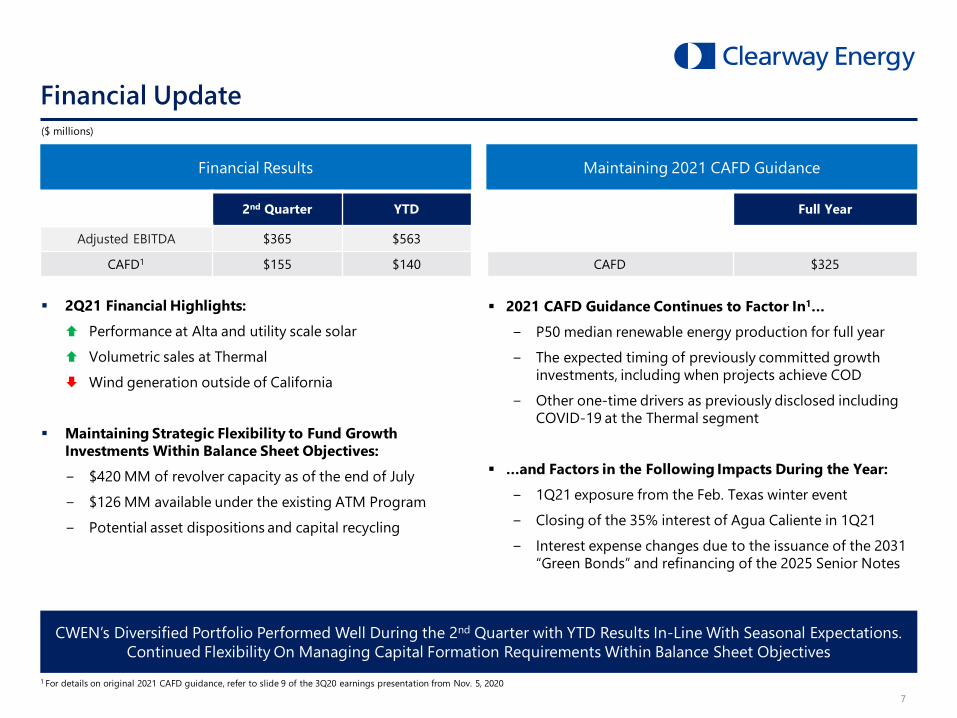
2Q21 Financial Highlights: Performance at Alta and utility scale solar Volumetric sales at Thermal Wind generation outside of California
Maintaining Strategic Flexibility to Fund Growth Investments Within Balance Sheet Objectives:− $420 MM of revolver capacity as of the end of July− $126 MM available under the existing ATM Program− Potential asset dispositions and capital recycling
Financial Update
CWEN’s Diversified Portfolio Performed Well During the 2nd Quarter with YTD Results In-Line With Seasonal Expectations. Continued Flexibility On Managing Capital Formation Requirements Within Balance Sheet Objectives
2021 CAFD Guidance Continues to Factor In1…− P50 median renewable energy production for full year− The expected timing of previously committed growth
investments, including when projects achieve COD− Other one-time drivers as previously disclosed including
COVID-19 at the Thermal segment
…and Factors in the Following Impacts During the Year:− 1Q21 exposure from the Feb. Texas winter event− Closing of the 35% interest of Agua Caliente in 1Q21− Interest expense changes due to the issuance of the 2031
“Green Bonds” and refinancing of the 2025 Senior Notes
Financial Results Maintaining 2021 CAFD Guidance
($ millions)
1 For details on original 2021 CAFD guidance, refer to slide 9 of the 3Q20 earnings presentation from Nov. 5, 2020
Full Year
CAFD $325
2nd Quarter YTD
Adjusted EBITDA $365 $563
CAFD1 $155 $140

Closing Remarks and Q&A
Closing Remarks and Q&A
9
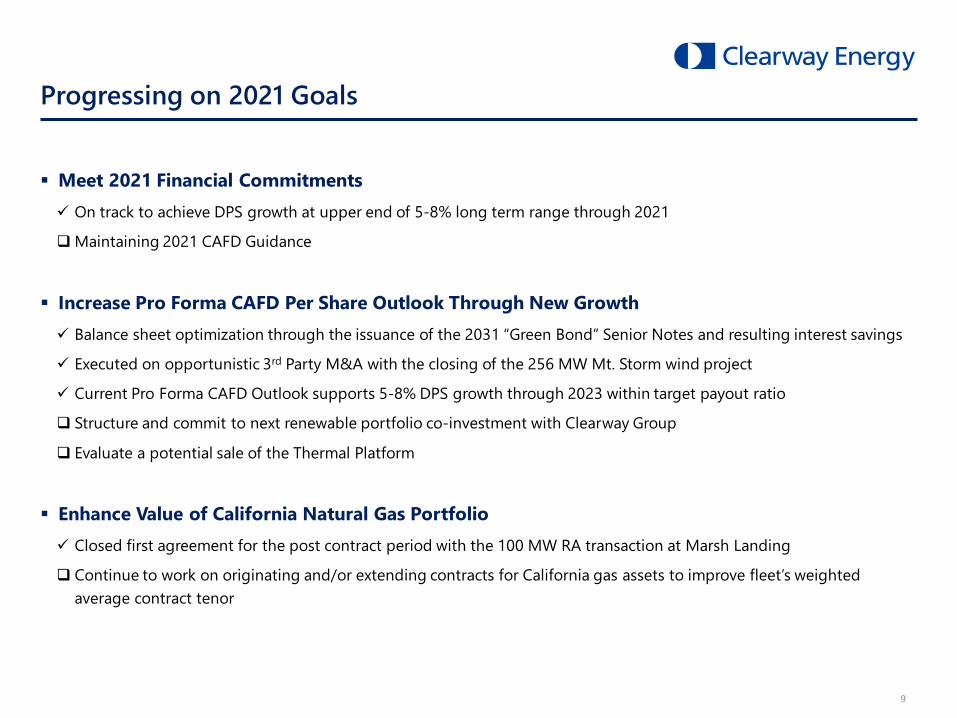
Progressing on 2021 Goals
Meet 2021 Financial Commitments On track to achieve DPS growth at upper end of 5-8% long term range through 2021
Maintaining 2021 CAFD Guidance
Increase Pro Forma CAFD Per Share Outlook Through New Growth Balance sheet optimization through the issuance of the 2031 “Green Bond” Senior Notes and resulting interest savings
Executed on opportunistic 3rd Party M&A with the closing of the 256 MW Mt. Storm wind project
Current Pro Forma CAFD Outlook supports 5-8% DPS growth through 2023 within target payout ratio
Structure and commit to next renewable portfolio co-investment with Clearway Group
Evaluate a potential sale of the Thermal Platform
Enhance Value of California Natural Gas Portfolio Closed first agreement for the post contract period with the 100 MW RA transaction at Marsh Landing
Continue to work on originating and/or extending contracts for California gas assets to improve fleet’s weighted average contract tenor
Appendix
Appendix
11
Draft –Confidential and Proprietary
0600
1,2001,8002,4003,0003,6004,2004,8005,4006,0006,600
2021 2022 2023 2024 2025
Achieved Operations / SaleNew Construction WindRepower WindUtility SolarStorageDistributed SolarCommitted (Other)CWEN ROFO/Committed Investments
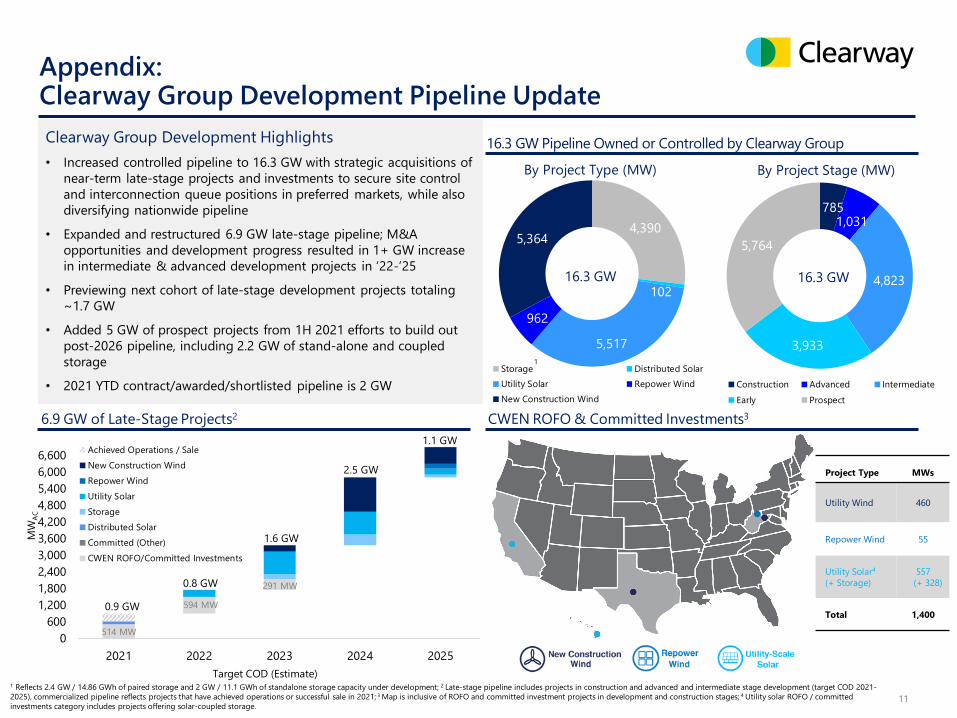
4,390
102
5,517
962
5,364
Storage Distributed SolarUtility Solar Repower WindNew Construction Wind
785 1,031
4,823
3,933
5,764
Construction Advanced IntermediateEarly Prospect
16.3 GW Pipeline Owned or Controlled by Clearway Group
6.9 GW of Late-Stage Projects2
16.3 GW
By Project Type (MW)
16.3 GW
By Project Stage (MW)
0.9 GW
1.6 GWMW
AC
2.5 GW
1
Appendix:Clearway Group Development Pipeline Update
CWEN ROFO & Committed Investments3
1 Reflects 2.4 GW / 14.86 GWh of paired storage and 2 GW / 11.1 GWh of standalone storage capacity under development; 2 Late-stage pipeline includes projects in construction and advanced and intermediate stage development (target COD 2021-2025), commercialized pipeline reflects projects that have achieved operations or successful sale in 2021; 3 Map is inclusive of ROFO and committed investment projects in development and construction stages; 4 Utility solar ROFO / committed investments category includes projects offering solar-coupled storage.
514 MW
291 MW
Target COD (Estimate)
Project Type MWs
Utility Wind 460
Repower Wind 55
Utility Solar4
(+ Storage)557(+ 328)
Total 1,400
0.8 GW
594 MW
Clearway Group Development Highlights• Increased controlled pipeline to 16.3 GW with strategic acquisitions of
near-term late-stage projects and investments to secure site control and interconnection queue positions in preferred markets, while also diversifying nationwide pipeline
• Expanded and restructured 6.9 GW late-stage pipeline; M&A opportunities and development progress resulted in 1+ GW increase in intermediate & advanced development projects in ‘22-’25
• Previewing next cohort of late-stage development projects totaling ~1.7 GW
• Added 5 GW of prospect projects from 1H 2021 efforts to build out post-2026 pipeline, including 2.2 GW of stand-alone and coupled storage
• 2021 YTD contract/awarded/shortlisted pipeline is 2 GW
1.1 GW
12
Appendix:Clearway Energy ROFO and Committed Renewable Investments
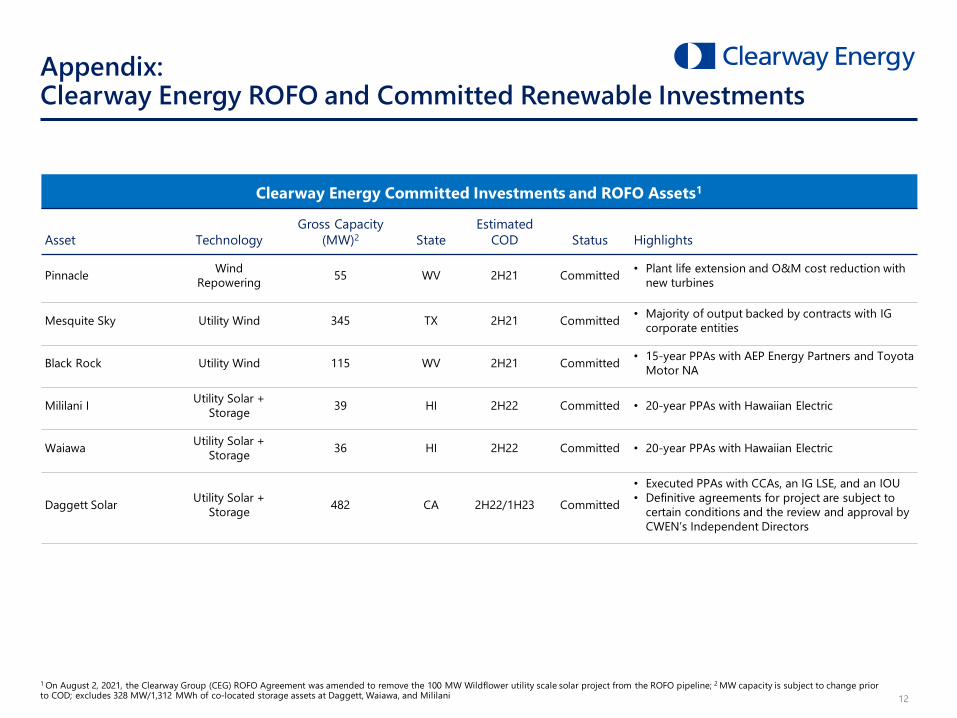
1 On August 2, 2021, the Clearway Group (CEG) ROFO Agreement was amended to remove the 100 MW Wildflower utility scale solar project from the ROFO pipeline; 2 MW capacity is subject to change prior to COD; excludes 328 MW/1,312 MWh of co-located storage assets at Daggett, Waiawa, and Mililani
Clearway Energy Committed Investments and ROFO Assets1
Asset TechnologyGross Capacity
(MW)2 StateEstimated
COD Status Highlights
Pinnacle Wind Repowering 55 WV 2H21 Committed • Plant life extension and O&M cost reduction with
new turbines
Mesquite Sky Utility Wind 345 TX 2H21 Committed • Majority of output backed by contracts with IG corporate entities
Black Rock Utility Wind 115 WV 2H21 Committed • 15-year PPAs with AEP Energy Partners and Toyota Motor NA
Mililani I Utility Solar + Storage 39 HI 2H22 Committed • 20-year PPAs with Hawaiian Electric
Waiawa Utility Solar + Storage 36 HI 2H22 Committed • 20-year PPAs with Hawaiian Electric
Daggett Solar Utility Solar + Storage 482 CA 2H22/1H23 Committed
• Executed PPAs with CCAs, an IG LSE, and an IOU• Definitive agreements for project are subject to
certain conditions and the review and approval by CWEN’s Independent Directors
13
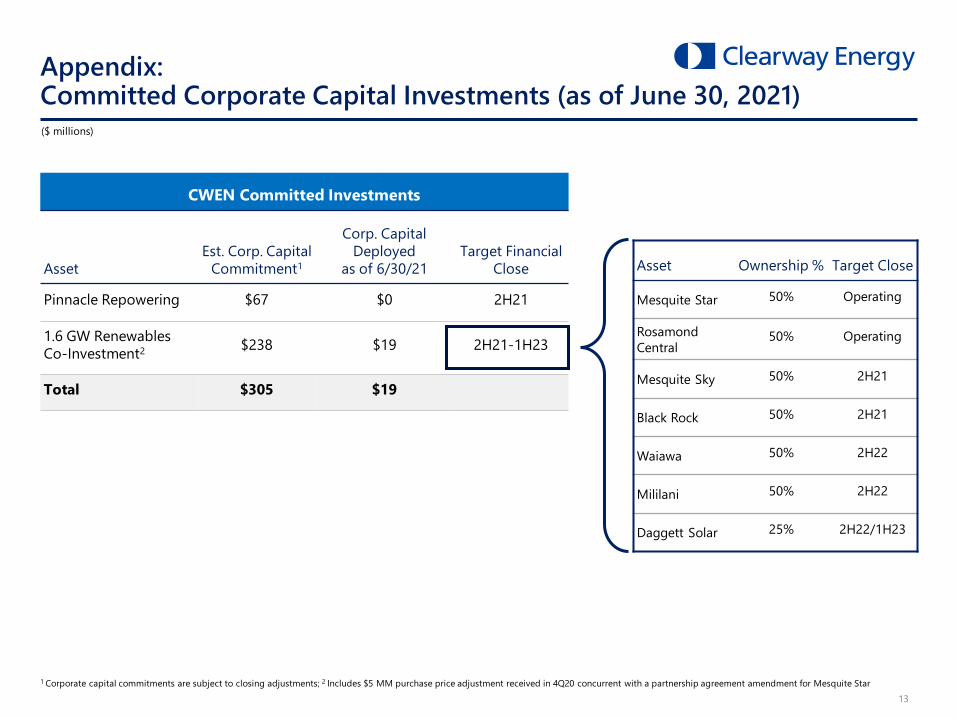
Appendix:Committed Corporate Capital Investments (as of June 30, 2021)
CWEN Committed Investments
AssetEst. Corp. Capital
Commitment1
Corp. Capital Deployed
as of 6/30/21Target Financial
Close
Pinnacle Repowering $67 $0 2H21
1.6 GW Renewables Co-Investment2 $238 $19 2H21-1H23
Total $305 $19
($ millions)
1 Corporate capital commitments are subject to closing adjustments; 2 Includes $5 MM purchase price adjustment received in 4Q20 concurrent with a partnership agreement amendment for Mesquite Star
Asset Ownership % Target Close
Mesquite Star 50% Operating
Rosamond Central
50% Operating
Mesquite Sky 50% 2H21
Black Rock 50% 2H21
Waiawa 50% 2H22
Mililani 50% 2H22
Daggett Solar 25% 2H22/1H23

14
Represents a measure of the actual production and reimbursable curtailment for the stated period relative to internal median expectations
MW capacity and Production Index :
- includes assets beginning the first quarter after the acquisition date
- excludes assets with less than one year of operating history
- excludes equity method investments (Avenal, Desert Sunlight, Four Brothers, Iron Springs, Granite Mountain, San Juan Mesa, and Elkhorn Ridge)
Wind availability represents equivalent availability factor, or availability associated with the wind turbine and balance of plant. Utility solar availability represents energy produced as a percentage of available energy
Appendix: Renewable Portfolio Performance in 2021
Production Index Availability2021 2021
Q1 2nd Quarter Q2 YTD YTDWind Portfolio MW Apr May Jun
California 947 134% 125% 107% 79% 102% 112% 97%Other West 73 85% 94% 83% 80% 86% 85% 94%Texas 534 85% 89% 87% 101% 92% 89% 94%Midwest 380 89% 97% 86% 71% 86% 87% 93%East 67 90% 108% 82% 73% 91% 90% 97%
Total 2,001 100% 106% 96% 83% 95% 98% 96%
Utility Scale Solar Portfolio
Total 834 100% 100% 102% 100% 101% 101% 99%
15
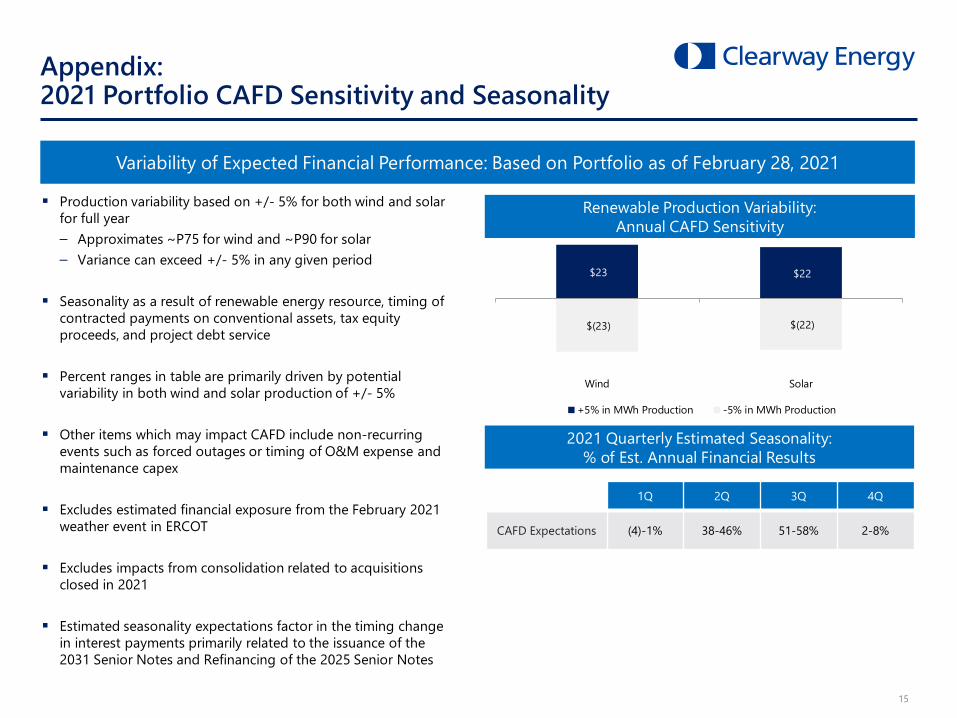
Appendix: 2021 Portfolio CAFD Sensitivity and Seasonality
Variability of Expected Financial Performance: Based on Portfolio as of February 28, 2021
1Q 2Q 3Q 4Q
CAFD Expectations (4)-1% 38-46% 51-58% 2-8%
Renewable Production Variability:Annual CAFD Sensitivity
$23 $22
$(23) $(22)
Wind Solar
+5% in MWh Production -5% in MWh Production
2021 Quarterly Estimated Seasonality: % of Est. Annual Financial Results
Production variability based on +/- 5% for both wind and solar for full year– Approximates ~P75 for wind and ~P90 for solar– Variance can exceed +/- 5% in any given period
Seasonality as a result of renewable energy resource, timing of contracted payments on conventional assets, tax equity proceeds, and project debt service
Percent ranges in table are primarily driven by potential variability in both wind and solar production of +/- 5%
Other items which may impact CAFD include non-recurring events such as forced outages or timing of O&M expense and maintenance capex
Excludes estimated financial exposure from the February 2021 weather event in ERCOT
Excludes impacts from consolidation related to acquisitions closed in 2021
Estimated seasonality expectations factor in the timing change in interest payments primarily related to the issuance of the 2031 Senior Notes and Refinancing of the 2025 Senior Notes
16
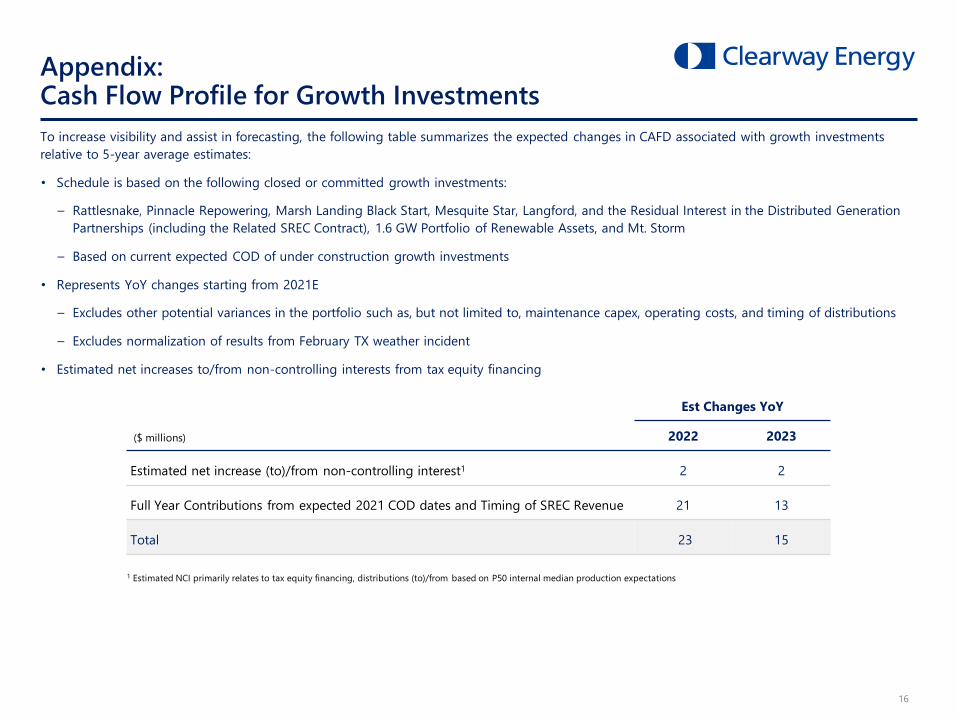
To increase visibility and assist in forecasting, the following table summarizes the expected changes in CAFD associated with growth investments relative to 5-year average estimates:
• Schedule is based on the following closed or committed growth investments:
⎯ Rattlesnake, Pinnacle Repowering, Marsh Landing Black Start, Mesquite Star, Langford, and the Residual Interest in the Distributed Generation Partnerships (including the Related SREC Contract), 1.6 GW Portfolio of Renewable Assets, and Mt. Storm
⎯ Based on current expected COD of under construction growth investments
• Represents YoY changes starting from 2021E
⎯ Excludes other potential variances in the portfolio such as, but not limited to, maintenance capex, operating costs, and timing of distributions
⎯ Excludes normalization of results from February TX weather incident
• Estimated net increases to/from non-controlling interests from tax equity financing
1 Estimated NCI primarily relates to tax equity financing, distributions (to)/from based on P50 internal median production expectations
Appendix: Cash Flow Profile for Growth Investments
Est Changes YoY
($ millions) 2022 2023
Estimated net increase (to)/from non-controlling interest1 2 2
Full Year Contributions from expected 2021 COD dates and Timing of SREC Revenue 21 13
Total 23 15
17
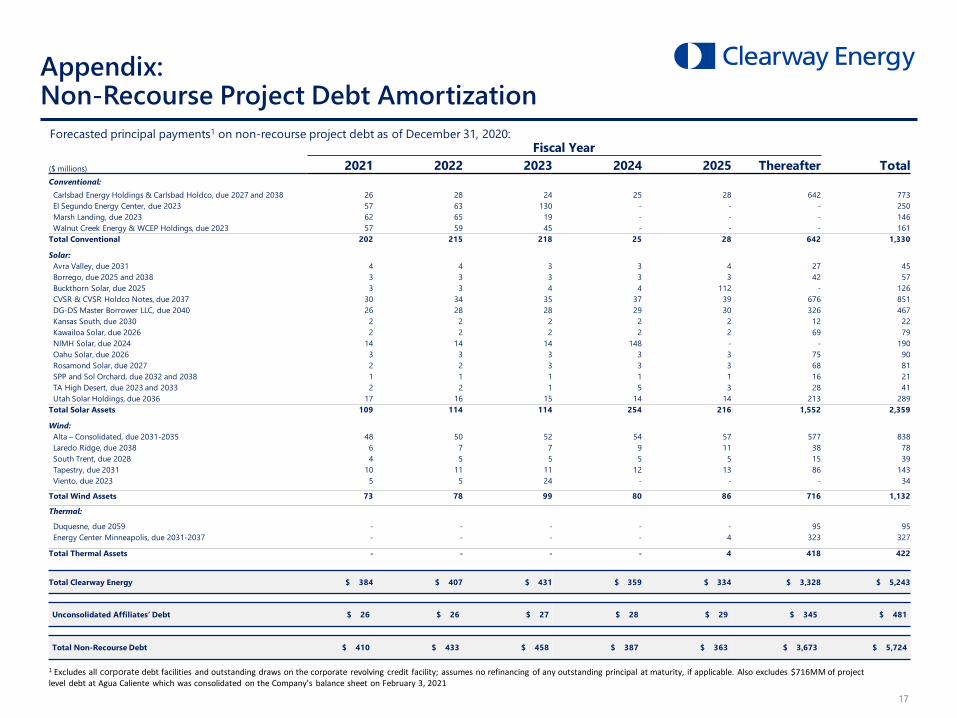
Appendix:Non-Recourse Project Debt Amortization
1 Excludes all corporate debt facilities and outstanding draws on the corporate revolving credit facility; assumes no refinancing of any outstanding principal at maturity, if applicable. Also excludes $716MM of project level debt at Agua Caliente which was consolidated on the Company’s balance sheet on February 3, 2021
Forecasted principal payments1 on non-recourse project debt as of December 31, 2020:Fiscal Year
($ millions) 2021 2022 2023 2024 2025 Thereafter TotalConventional:
Carlsbad Energy Holdings & Carlsbad Holdco, due 2027 and 2038 26 28 24 25 28 642 773 El Segundo Energy Center, due 2023 57 63 130 - - - 250 Marsh Landing, due 2023 62 65 19 - - - 146 Walnut Creek Energy & WCEP Holdings, due 2023 57 59 45 - - - 161
Total Conventional 202 215 218 25 28 642 1,330
Solar:Avra Valley, due 2031 4 4 3 3 4 27 45 Borrego, due 2025 and 2038 3 3 3 3 3 42 57 Buckthorn Solar, due 2025 3 3 4 4 112 - 126CVSR & CVSR Holdco Notes, due 2037 30 34 35 37 39 676 851 DG-DS Master Borrower LLC, due 2040 26 28 28 29 30 326 467 Kansas South, due 2030 2 2 2 2 2 12 22 Kawailoa Solar, due 2026 2 2 2 2 2 69 79 NIMH Solar, due 2024 14 14 14 148 - - 190 Oahu Solar, due 2026 3 3 3 3 3 75 90 Rosamond Solar, due 2027 2 2 3 3 3 68 81 SPP and Sol Orchard, due 2032 and 2038 1 1 1 1 1 16 21 TA High Desert, due 2023 and 2033 2 2 1 5 3 28 41 Utah Solar Holdings, due 2036 17 16 15 14 14 213 289
Total Solar Assets 109 114 114 254 216 1,552 2,359
Wind:Alta – Consolidated, due 2031-2035 48 50 52 54 57 577 838 Laredo Ridge, due 2038 6 7 7 9 11 38 78 South Trent, due 2028 4 5 5 5 5 15 39 Tapestry, due 2031 10 11 11 12 13 86 143 Viento, due 2023 5 5 24 - - - 34
Total Wind Assets 73 78 99 80 86 716 1,132
Thermal:
Duquesne, due 2059 - - - - - 95 95 Energy Center Minneapolis, due 2031-2037 - - - - 4 323 327
Total Thermal Assets - - - - 4 418 422
Total Clearway Energy $ 384 $ 407 $ 431 $ 359 $ 334 $ 3,328 $ 5,243
Unconsolidated Affiliates’ Debt $ 26 $ 26 $ 27 $ 28 $ 29 $ 345 $ 481
Total Non-Recourse Debt $ 410 $ 433 $ 458 $ 387 $ 363 $ 3,673 $ 5,724
18
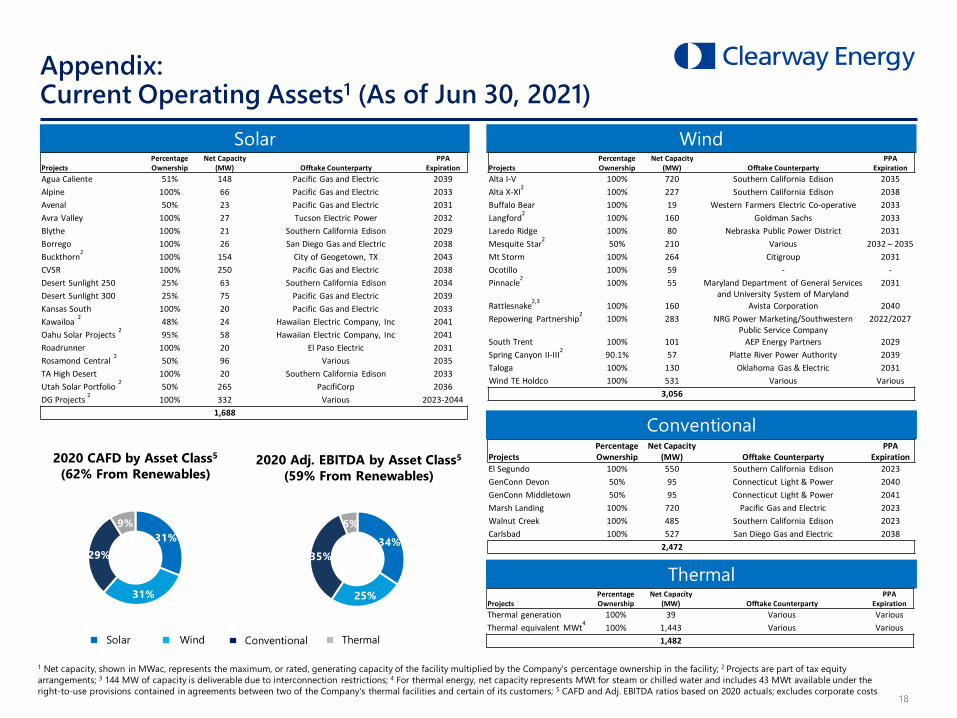
Appendix:Current Operating Assets1 (As of Jun 30, 2021)
Solar
Conventional
Wind
Thermal
ProjectsPercentageOwnership
Net Capacity (MW) Offtake Counterparty
PPA Expiration
El Segundo 100% 550 Southern California Edison 2023GenConn Devon 50% 95 Connecticut Light & Power 2040GenConn Middletown 50% 95 Connecticut Light & Power 2041Marsh Landing 100% 720 Pacific Gas and Electric 2023Walnut Creek 100% 485 Southern California Edison 2023Carlsbad 100% 527 San Diego Gas and Electric 2038
2,472
2020 Adj. EBITDA by Asset Class5
(59% From Renewables)2020 CAFD by Asset Class5
(62% From Renewables)
ConventionalSolar Wind Thermal
31%
31%
29%
9%
34%
25%
35%
6%
ProjectsPercentageOwnership
Net Capacity (MW) Offtake Counterparty
PPA Expiration
Agua Caliente 51% 148 Pacific Gas and Electric 2039Alpine 100% 66 Pacific Gas and Electric 2033Avenal 50% 23 Pacific Gas and Electric 2031Avra Valley 100% 27 Tucson Electric Power 2032Blythe 100% 21 Southern California Edison 2029Borrego 100% 26 San Diego Gas and Electric 2038Buckthorn2 100% 154 City of Geogetown, TX 2043CVSR 100% 250 Pacific Gas and Electric 2038Desert Sunlight 250 25% 63 Southern California Edison 2034Desert Sunlight 300 25% 75 Pacific Gas and Electric 2039Kansas South 100% 20 Pacific Gas and Electric 2033Kawailoa 2 48% 24 Hawaiian Electric Company, Inc 2041Oahu Solar Projects 2 95% 58 Hawaiian Electric Company, Inc 2041Roadrunner 100% 20 El Paso Electric 2031Rosamond Central 2 50% 96 Various 2035TA High Desert 100% 20 Southern California Edison 2033Utah Solar Portfolio 2 50% 265 PacifiCorp 2036DG Projects 2 100% 332 Various 2023-2044
1,688
ProjectsPercentageOwnership
Net Capacity (MW) Offtake Counterparty
PPA Expiration
Alta I-V 100% 720 Southern California Edison 2035Alta X-XI2 100% 227 Southern California Edison 2038Buffalo Bear 100% 19 Western Farmers Electric Co-operative 2033Langford2 100% 160 Goldman Sachs 2033Laredo Ridge 100% 80 Nebraska Public Power District 2031Mesquite Star2 50% 210 Various 2032 – 2035Mt Storm 100% 264 Citigroup 2031Ocotillo 100% 59 - -Pinnacle2 100% 55 Maryland Department of General Services
and University System of Maryland2031
Rattlesnake2,3 100% 160 Avista Corporation 2040Repowering Partnership2 100% 283 NRG Power Marketing/Southwestern
Public Service Company2022/2027
South Trent 100% 101 AEP Energy Partners 2029Spring Canyon II-III2 90.1% 57 Platte River Power Authority 2039Taloga 100% 130 Oklahoma Gas & Electric 2031Wind TE Holdco 100% 531 Various Various
3,056
ProjectsPercentageOwnership
Net Capacity (MW) Offtake Counterparty
PPA Expiration
Thermal generation 100% 39 Various VariousThermal equivalent MWt4 100% 1,443 Various Various
1,482
1 Net capacity, shown in MWac, represents the maximum, or rated, generating capacity of the facility multiplied by the Company's percentage ownership in the facility; 2 Projects are part of tax equity arrangements; 3 144 MW of capacity is deliverable due to interconnection restrictions; 4 For thermal energy, net capacity represents MWt for steam or chilled water and includes 43 MWt available under the right-to-use provisions contained in agreements between two of the Company's thermal facilities and certain of its customers; 5 CAFD and Adj. EBITDA ratios based on 2020 actuals; excludes corporate costs

Appendix
Reg. G Schedules
20
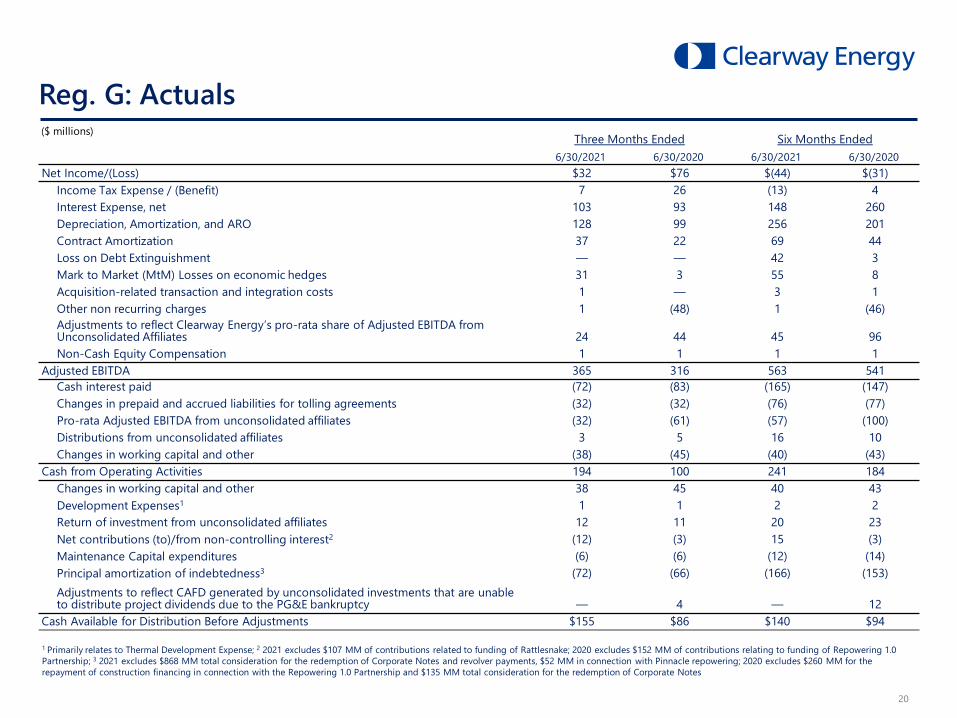
Reg. G: Actuals($ millions)
1 Primarily relates to Thermal Development Expense; 2 2021 excludes $107 MM of contributions related to funding of Rattlesnake; 2020 excludes $152 MM of contributions relating to funding of Repowering 1.0 Partnership; 3 2021 excludes $868 MM total consideration for the redemption of Corporate Notes and revolver payments, $52 MM in connection with Pinnacle repowering; 2020 excludes $260 MM for the repayment of construction financing in connection with the Repowering 1.0 Partnership and $135 MM total consideration for the redemption of Corporate Notes
Three Months Ended Six Months Ended6/30/2021 6/30/2020 6/30/2021 6/30/2020
Net Income/(Loss) $32 $76 $(44) $(31)Income Tax Expense / (Benefit) 7 26 (13) 4Interest Expense, net 103 93 148 260Depreciation, Amortization, and ARO 128 99 256 201Contract Amortization 37 22 69 44Loss on Debt Extinguishment — — 42 3Mark to Market (MtM) Losses on economic hedges 31 3 55 8Acquisition-related transaction and integration costs 1 — 3 1Other non recurring charges 1 (48) 1 (46)Adjustments to reflect Clearway Energy’s pro-rata share of Adjusted EBITDA from Unconsolidated Affiliates 24 44 45 96Non-Cash Equity Compensation 1 1 1 1
Adjusted EBITDA 365 316 563 541Cash interest paid (72) (83) (165) (147)Changes in prepaid and accrued liabilities for tolling agreements (32) (32) (76) (77)Pro-rata Adjusted EBITDA from unconsolidated affiliates (32) (61) (57) (100)Distributions from unconsolidated affiliates 3 5 16 10Changes in working capital and other (38) (45) (40) (43)
Cash from Operating Activities 194 100 241 184Changes in working capital and other 38 45 40 43Development Expenses1 1 1 2 2Return of investment from unconsolidated affiliates 12 11 20 23Net contributions (to)/from non-controlling interest2 (12) (3) 15 (3)Maintenance Capital expenditures (6) (6) (12) (14)Principal amortization of indebtedness3 (72) (66) (166) (153)Adjustments to reflect CAFD generated by unconsolidated investments that are unable to distribute project dividends due to the PG&E bankruptcy — 4 — 12
Cash Available for Distribution Before Adjustments $155 $86 $140 $94
21
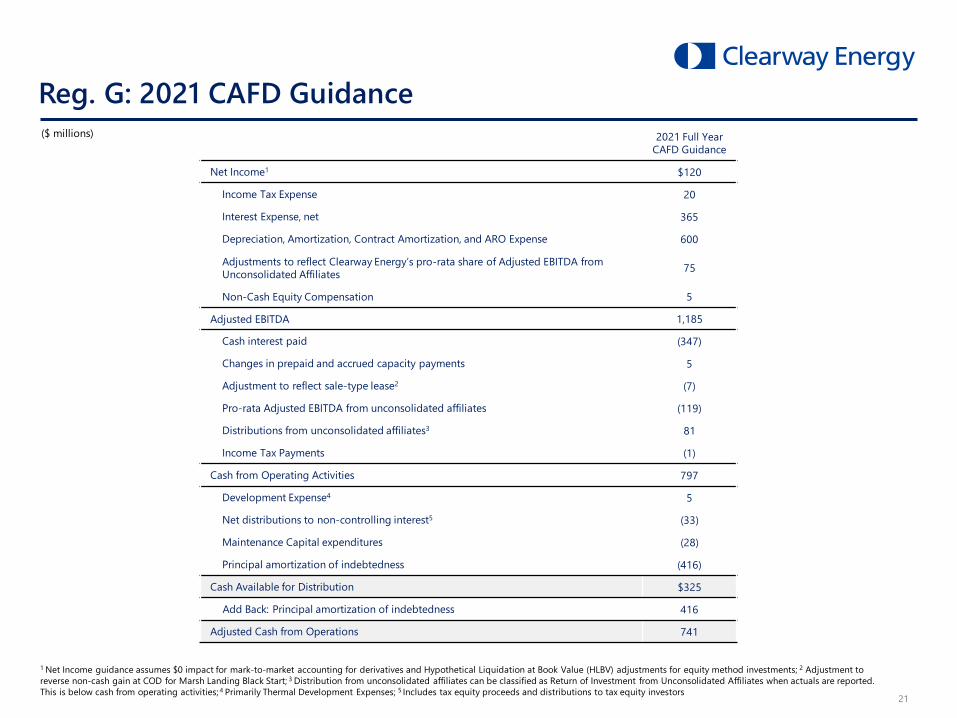
Reg. G: 2021 CAFD Guidance2021 Full Year
CAFD Guidance
Net Income1 $120
Income Tax Expense 20
Interest Expense, net 365
Depreciation, Amortization, Contract Amortization, and ARO Expense 600
Adjustments to reflect Clearway Energy’s pro-rata share of Adjusted EBITDA from Unconsolidated Affiliates 75
Non-Cash Equity Compensation 5
Adjusted EBITDA 1,185
Cash interest paid (347)
Changes in prepaid and accrued capacity payments 5
Adjustment to reflect sale-type lease2 (7)
Pro-rata Adjusted EBITDA from unconsolidated affiliates (119)
Distributions from unconsolidated affiliates3 81
Income Tax Payments (1)
Cash from Operating Activities 797
Development Expense4 5
Net distributions to non-controlling interest5 (33)
Maintenance Capital expenditures (28)
Principal amortization of indebtedness (416)
Cash Available for Distribution $325
Add Back: Principal amortization of indebtedness 416
Adjusted Cash from Operations 741
($ millions)
1 Net Income guidance assumes $0 impact for mark-to-market accounting for derivatives and Hypothetical Liquidation at Book Value (HLBV) adjustments for equity method investments; 2 Adjustment to reverse non-cash gain at COD for Marsh Landing Black Start; 3 Distribution from unconsolidated affiliates can be classified as Return of Investment from Unconsolidated Affiliates when actuals are reported. This is below cash from operating activities; 4 Primarily Thermal Development Expenses; 5 Includes tax equity proceeds and distributions to tax equity investors
22
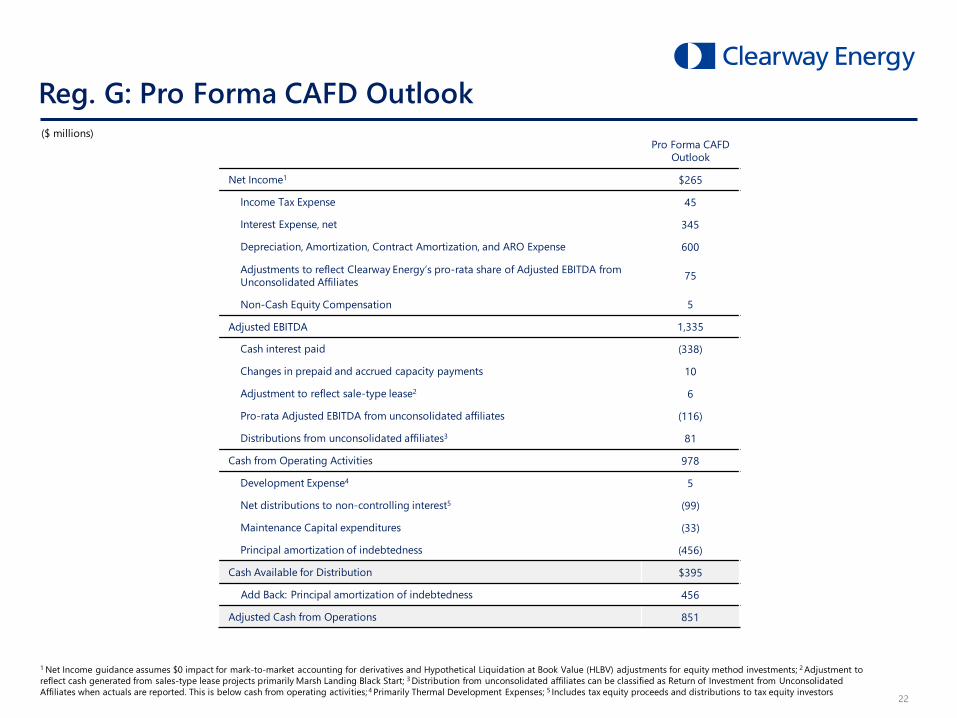
Reg. G: Pro Forma CAFD Outlook
1 Net Income guidance assumes $0 impact for mark-to-market accounting for derivatives and Hypothetical Liquidation at Book Value (HLBV) adjustments for equity method investments; 2 Adjustment to reflect cash generated from sales-type lease projects primarily Marsh Landing Black Start; 3 Distribution from unconsolidated affiliates can be classified as Return of Investment from Unconsolidated Affiliates when actuals are reported. This is below cash from operating activities; 4 Primarily Thermal Development Expenses; 5 Includes tax equity proceeds and distributions to tax equity investors
($ millions)Pro Forma CAFD
Outlook
Net Income1 $265
Income Tax Expense 45
Interest Expense, net 345
Depreciation, Amortization, Contract Amortization, and ARO Expense 600
Adjustments to reflect Clearway Energy’s pro-rata share of Adjusted EBITDA from Unconsolidated Affiliates 75
Non-Cash Equity Compensation 5
Adjusted EBITDA 1,335
Cash interest paid (338)
Changes in prepaid and accrued capacity payments 10
Adjustment to reflect sale-type lease2 6
Pro-rata Adjusted EBITDA from unconsolidated affiliates (116)
Distributions from unconsolidated affiliates3 81
Cash from Operating Activities 978
Development Expense4 5
Net distributions to non-controlling interest5 (99)
Maintenance Capital expenditures (33)
Principal amortization of indebtedness (456)
Cash Available for Distribution $395
Add Back: Principal amortization of indebtedness 456
Adjusted Cash from Operations 851
23
Non-GAAP Financial Information
EBITDA and Adjusted EBITDA: EBITDA and Adjusted EBITDA are non-GAAP financial measures. These measurements are not recognized in accordance with GAAP and should not be viewed as an alternative to GAAP measures of performance. The presentation of Adjusted EBITDA should not be construed as an inference that Clearway Energy’s future results will be unaffected by unusual or non-recurring items.
• EBITDA represents net income before interest (including loss on debt extinguishment), taxes, depreciation and amortization. EBITDA is presented because Clearway Energy considers it an important supplemental measure of its performance and believes debt and equity holders frequently use EBITDA to analyze operating performance and debt service capacity. EBITDA has limitations as an analytical tool, and you should not consider it in isolation, or as a substitute for analysis of our operating results as reported under GAAP. Some of these limitations are:
• EBITDA does not reflect cash expenditures, or future requirements for capital expenditures, or contractual commitments;• EBITDA does not reflect changes in, or cash requirements for, working capital needs;• EBITDA does not reflect the significant interest expense, or the cash requirements necessary to service interest or principal payments, on debt or cash income tax payments;• Although depreciation and amortization are non-cash charges, the assets being depreciated and amortized will often have to be replaced in the future, and EBITDA does not reflect any cash requirements
for such replacements; and• Other companies in this industry may calculate EBITDA differently than Clearway Energy does, limiting its usefulness as a comparative measure.
Because of these limitations, EBITDA should not be considered as a measure of discretionary cash available to use to invest in the growth of Clearway Energy’s business. Clearway Energy compensates for these limitations by relying primarily on our GAAP results and using EBITDA and Adjusted EBITDA only supplementally.
Adjusted EBITDA is presented as a further supplemental measure of operating performance. Adjusted EBITDA represents EBITDA adjusted for mark-to-market gains or losses, non cash equity compensation expense, asset write offs and impairments; and factors which we do not consider indicative of future operating performance such as transition and integration related costs. The reader is encouraged to evaluate each adjustment and the reasons Clearway Energy considers it appropriate for supplemental analysis. As an analytical tool, Adjusted EBITDA is subject to all of the limitations applicable to EBITDA. In addition, in evaluating Adjusted EBITDA, the reader should be aware that in the future Clearway Energy may incur expenses similar to the adjustments in this news release.
Management believes Adjusted EBITDA is useful to investors and other users of our financial statements in evaluating our operating performance because it provides them with an additional tool to compare business performance across companies and across periods. This measure is widely used by investors to measure a company’s operating performance without regard to items such as interest expense, taxes, depreciation and amortization, which can vary substantially from company to company depending upon accounting methods and book value of assets, capital structure and the method by which assets were acquired.
Additionally, management believes that investors commonly adjust EBITDA information to eliminate the effect of restructuring and other expenses, which vary widely from company to company and impair comparability. As we define it, Adjusted EBITDA represents EBITDA adjusted for the effects of impairment losses, gains or losses on sales, non cash equity compensation expense, dispositions or retirements of assets, any mark-to-market gains or losses from accounting for derivatives, adjustments to exclude gains or losses on the repurchase, modification or extinguishment of debt, and any extraordinary, unusual or non-recurring items plus adjustments to reflect the Adjusted EBITDA from our unconsolidated investments. We adjust for these items in our Adjusted EBITDA as our management believes that these items would distort their ability to efficiently view and assess our core operating trends.
In summary, our management uses Adjusted EBITDA as a measure of operating performance to assist in comparing performance from period to period on a consistent basis and to readily view operating trends, as a measure for planning and forecasting overall expectations and for evaluating actual results against such expectations, and in communications with our Board of Directors, shareholders, creditors, analysts and investors concerning our financial performance.
Cash Available for Distribution: A non-GAAP measure, Cash Available for Distribution is defined as of March 31, 2021 as Adjusted EBITDA plus cash distributions/return of investment from unconsolidated affiliates, adjustments to reflect CAFD generated by unconsolidated investments that were not able to distribute project dividends prior to PG&E's emergence from bankruptcy on July 1, 2020 and subsequent release post-bankruptcy, cash receipts from notes receivable, cash distributions from noncontrolling interests, adjustments to reflect sales-type lease cash payments, less cash distributions to noncontrolling interests, maintenance capital expenditures, pro-rata Adjusted EBITDA from unconsolidated affiliates, cash interest paid, income taxes paid, principal amortization of indebtedness, changes in prepaid and accrued capacity payments, and adjusted for development expenses. Management believes CAFD is a relevant supplemental measure of the Company’s ability to earn and distribute cash returns to investors. We believe CAFD is useful to investors in evaluating our operating performance because securities analysts and other interested parties use such calculations as a measure of our ability to make quarterly distributions. In addition, CAFD is used by our management team for determining future acquisitions and managing our growth. The GAAP measure most directly comparable to CAFD is cash provided by operating activities.
However, CAFD has limitations as an analytical tool because it does not include changes in operating assets and liabilities and excludes the effect of certain other cash flow items, all of which could have a material effect on our financial condition and results from operations. CAFD is a non-GAAP measure and should not be considered an alternative to cash provided by operating activities or any other performance or liquidity measure determined in accordance with GAAP, nor is it indicative of funds available to fund our cash needs. In addition, our calculations of CAFD are not necessarily comparable to CAFD as calculated by other companies. Investors should not rely on these measures as a substitute for any GAAP measure, including cash provided by operating activities.
Reg. G