
CLEANING OF TOOTHPASTE FROM PROCESS EQUIPMENT BY …etheses.bham.ac.uk/4128/1/Cole13EngD.pdf ·...
242
CLEANING OF TOOTHPASTE FROM PROCESS EQUIPMENT BY FLUID FLOW AT LABORATORY AND PILOT SCALES. BY PAMELA ANNE COLE A thesis submitted to the University of Birmingham for the degree of Engineering Doctorate School of Chemical Engineering College of Engineering and Physical Sciences University of Birmingham September 2011
Transcript of CLEANING OF TOOTHPASTE FROM PROCESS EQUIPMENT BY …etheses.bham.ac.uk/4128/1/Cole13EngD.pdf ·...

CLEANING OF TOOTHPASTE FROM PROCESS EQUIPMENT BY
FLUID FLOW AT LABORATORY AND PILOT SCALES.
BY
PAMELA ANNE COLE
A thesis submitted to the
University of Birmingham
for the degree of
Engineering Doctorate
School of Chemical Engineering
College of Engineering and Physical Sciences
University of Birmingham
September 2011

Abstract
i
ABSTRACT
Cleaning studies were performed to remove toothpaste by fluid flow at different temperatures
and velocities to mimic CIP (Cleaning-In-Place) processes on toothpaste coated coupons at
laboratory scale and fully filled pipeline at pilot scale (different lengths and diameters). The
cleaning time was reduced by increasing the velocity and temperature of the water, however
no further time benefit was seen above 40°C.
The adhesive force for different pastes calculated from micromanipulation data followed the
same trend as cleaning times on the laboratory cleaning rig. This cleaning data for the
different paste formulations had a logarithmic relationship with the viscosity term from the
Herschel-Bulkley rheological model.
Removal of toothpaste from pipes occurred by the core of the paste being removed from the
centre of the pipe to leave a thin coating on the pipe wall, which was then eroded by flow.
Pipes of lengths between 0.3 m and 2 m (47.7 mm diameter pipe) showed no difference in
cleaning time. The rate limiting process was removal of the thin wall coating and therefore
not a function of length. An inverse wall shear stress relationship with cleaning time was
found to represent all the data, at all scales and under all conditions.
Dedications and Acknowledgements
ii
DEDICATIONS AND
ACKNOWLEDGEMENTS
I gratefully acknowledge financial support from GSK and the EPSRC.
Thank you for the support and guidance of my supervisors: Prof. Peter Fryer, Dr. Phil
Robbins, Nigel Armitage, Natalie Salmon and Eddie Owen.
I really appreciate the professional support and friendship of those at the University of
Birmingham Chemical Engineering Department, and GlaxoSmithKline Maidenhead &
Weybridge sites and all the ZEAL Consortium members who helped me to gain experience
and develop professionally, as well as sharing some great nights out. In particular I would like
to thank Kylee, Konstantia, Kathleen, Eddie and Phil for helpful discussions and camaraderie
during toothpaste related adventures and also to Bunmi, Tim and Ishara for their assistance in
the Pilot Plant.
I am so grateful to ALL my friends and family for your patience and support, in particular my
family: Mum, Dad, Rowena, Davina, Matthew, Louise, Taylor & Grandma, and Sam &
Lynda, for providing endless cups of tea, encouragement and genuine understanding. I
promise that I will never again turn up at your houses and events with my thesis in an
unwritten state.

Contents
iii
CONTENTS
ABSTRACT ............................................................................................................................................ I
DEDICATIONS AND ACKNOWLEDGEMENTS .......................................................................... II
CONTENTS ......................................................................................................................................... III
TABLE OF FIGURES ...................................................................................................................... VII
ABBREVIATIONS ............................................................................................................................ XX
CHAPTER 1: INDUSTRIAL CLEANING ........................................................................................ 1
1.1. Thesis Aims ....................................................................................................................... 1
1.2. Introduction to ZEAL ........................................................................................................ 3
1.3. The cleaning map .............................................................................................................. 4
1.4. Toothpaste ........................................................................................................................ 6
1.5. Costs and consequences of failure to clean ....................................................................... 7
1.6. Plant design ....................................................................................................................... 8
1.7. The methods of industrial cleaning ................................................................................... 8
1.8. Establishing a CIP regime ............................................................................................... 10
1.9. Cleaning regime stages .................................................................................................... 11
1.10. CIP unit ...................................................................................................................... 12
1.11. Benchmarking cleaning ................................................................................................... 14
1.12. Optimising industrial cleaning ........................................................................................ 15
1.13. Levels of cleanliness and cleaning monitoring ................................................................ 16
1.14. CIP without detergent ...................................................................................................... 17
1.15. CIP sequencing ................................................................................................................ 17
1.16. Factory CIP Layout ......................................................................................................... 18
1.17. Thesis structure ................................................................................................................ 20
CHAPTER 2: FACTORS AFFECTING FOULING & CLEANING OF A DEPOSIT
REMOVED BY FLUID MECHANICS ............................................................................................ 22
2.1. Infrared spectroscopy ...................................................................................................... 25
2.2. Micromanipulation .......................................................................................................... 26
2.3. Rheology……………...................................................................................................... 29
2.3.1. Yield stress ...................................................................................................................... 30
Contents
iv
2.3.2. Rheological models .......................................................................................................... 30
2.3.3. Viscoelastic properties of toothpaste ................................................................................ 31
2.4. Laboratory scale cleaning studies - flat plate flow cell (Coupon rig) .............................. 32
2.5. Fluid cleaning .................................................................................................................. 34
2.6. Soaking and hydration studies ......................................................................................... 35
2.7. Jetting …………………………………………………………………………… 35
2.8. Pipe flow…………… ...................................................................................................... 36
2.8.1. Wall shear stress .............................................................................................................. 37
2.9. Recirculation zones ......................................................................................................... 38
2.10. Non uniform flow ............................................................................................................ 38
2.11. Other fluid cleaning methods .......................................................................................... 38
2.12. Chemical cleaning ........................................................................................................... 39
2.13. Temperature ..................................................................................................................... 41
2.14. Cleaning studies .............................................................................................................. 41
2.15. Pilot – scale studies ......................................................................................................... 43
2.16. Pilot scale – measurements .............................................................................................. 44
2.17. Summary……….............................................................................................................. 45
CHAPTER 3: MATERIALS AND METHODS .............................................................. 47
3.1. Material characterisation - toothpaste ............................................................................... 49
3.2. Structural characterisation - infrared spectroscopy .......................................................... 49
3.3. Structural characterisation - rheology ............................................................................... 53
3.4. Structural characterisation - Micromanipulation .............................................................. 58
3.5. Cleaning equipment .......................................................................................................... 60
3.5.1. Ab Aziz PIV Rig ............................................................................................................... 60
3.5.2. Coupon Rig ....................................................................................................................... 61
3.6. Pilot scale cleaning rigs .................................................................................................... 65
3.6.1. Pipe rig at GSK ................................................................................................................. 65
3.6.2. ZEAL pilot plant .............................................................................................................. 69
3.6.3. Other systems ................................................................................................................... 72
3.7. Contaminant identification ............................................................................................... 73
3.8. Summary ........................................................................................................................... 74
CHAPTER 4: LABORATORY SCALE STUDIES ......................................................... 75
4.1. Toothpaste removal behaviour ......................................................................................... 76
4.2. Coupon rig measurement profiles ..................................................................................... 79
4.3. Effect of process parameters ............................................................................................. 84

Contents
v
4.4. Dimensionless Analysis .................................................................................................... 87
4.5. Comparison with other deposit types ............................................................................... 89
4.6. Effect of different surfaces and surface finishes ............................................................... 92
4.7. Investigating different pastes ............................................................................................ 94
4.8. Micromanipulation ........................................................................................................... 95
4.9. Coupon Rig comparison with Micromanipulation for different pastes ............................ 98
4.10. Coupon Rig cleaning results compared to rheological studies for different pastes .......... 99
4.11. Summary ......................................................................................................................... 103
CHAPTER 5: PILOT SCALE CLEANING STUDIES ................................................ 106
5.1. Removal Mechanisms: Images of removal ................................................................... 107
5.2. Cleaning Profiles, on-line measurements ...................................................................... 111
5.2.1. Conductivity Measurements .......................................................................................... 111
5.2.2. Turbidity Measurements ................................................................................................. 114
5.3. End-point Detection....................................................................................................... 116
5.4. Repeatability of measurement. ...................................................................................... 118
5.5. Off line measurements, verification and validation ....................................................... 119
5.6. Process Parameters – Effect of temperature .................................................................. 120
5.7. Process parameters – Effect of Velocity........................................................................ 122
5.7.1. The effect of low flow velocities: Pipe Rig. .................................................................. 122
5.7.2. Industrially relevant velocities ...................................................................................... 124
5.7.3. Comparing different pastes at different velocities ......................................................... 127
5.8. Scale parameters - length ............................................................................................... 128
5.9. Effect of fluid Reynolds number. .................................................................................. 134
5.10. Process parameters - diameter ....................................................................................... 138
5.11. Chapter 5 Summary ....................................................................................................... 142
CHAPTER 6: SCALE UP COMPARISONS ................................................................. 146
6.1. Flat Plate systems ........................................................................................................... 146
6.2. Coated surface vs. pipe-line at industrial velocities........................................................ 150
6.3. Correlation of cleaning data at laboratory and pilot scale .............................................. 154
6.4. Comparing pipe-line diameters ....................................................................................... 158
6.5. Water usage .................................................................................................................... 160
6.6. Energy usage ................................................................................................................... 162
6.7. Optimal conditions ........................................................................................................ 164
6.8. Summary …………………………………………………………………………… 164
CHAPTER 7: CONCLUSIONS AND FUTURE WORK ............................................. 167

Contents
vi
7.1. Thesis conclusions ......................................................................................................... 167
7.2. Toothpaste characterisation ........................................................................................... 168
7.3. Laboratory-scale cleaning studies ................................................................................. 168
7.4. Pilot scale cleaning studies ............................................................................................ 170
7.5. Scale-up from laboratory to pilot scale.......................................................................... 172
7.6. Environmental effects .................................................................................................... 173
7.7. Approaches to consider when optimising industrial CIP systems ................................. 174
7.7.1. Capital Costs ................................................................................................................... 174
7.7.2. CIP system validation ..................................................................................................... 175
7.7.3. Reducing the cost of cleaning ......................................................................................... 175
7.7.4. Measurement .................................................................................................................. 178
7.8. Future work ................................................................................................................... 178
7.8.1. Different pipe configurations .......................................................................................... 179
7.8.2. Fouling loop .................................................................................................................... 180
7.8.3. Protruding conductivity probe ........................................................................................ 182
7.8.4. Single Seat Valve ............................................................................................................ 185
7.8.5. Different geometry summary .......................................................................................... 187
7.8.6. Other further work ................................................................................................................ 189
REFERENCES .................................................................................................................................. 190
APPENDIX 1: PAPER...................................................................................................................... 200
APPENDIX 2: WAVELENGTHS OF SPECIES ASSOCIATED WITH INVESTIGATED
TOOTHPASTE INGREDIENTS, MID IR ..................................................................................... 201
APPENDIX 3: OPERATIONAL PROCEDURE FOR MICROMANIPULATION RIG .......... 207
APPENDIX 4: EXPERIMENTAL PROTOCOL COUPON RIG ................................................ 211
APPENDIX 5: PIPE RIG HAZOP .................................................................................................. 212
APPENDIX 6: PIPE RIG SOP ........................................................................................................ 215
APPENDIX 7: PILOT PLANT SOP ............................................................................................... 217
APPENDIX 8: PILOT PLANT ROUTES....................................................................................... 220
APPENDIX 9: GSK KEY CONFIDENTIAL ................................................................................. 221
APPENDIX 10: GSK BENCHMARKING CONFIDENTIAL ....................................................... 222

Table of Figures
vii
TABLE OF FIGURES
Figure 1. 1: The cleaning map - concept showing soil complexity as a function of the severity of the cleaning
conditions required to clean it [Fryer and Asteriadou (2009)]. 5
Figure 1.2: Schematic of a CIP unit, containing a rinse or water tank, a detergent rank which feeds cleaning
chemical into the ring-main. Fluid is pumped from the ring-main to the processing equipment, going through a
strainer, or filter to remove any foreign bodies, and through measurement devices. The fluid is passed through a
heat exchanger to heat the fluid and the CIP fluid is fed to the equipment requiring cleaning and is then returned
either to the tanks for storage or to the drain. Kaya (2011) 13
Figure 2.1: Schematic of the micromanipulation rig, based at the University of Birmingham [Liu et al (2002)]. 27
Figure 2.2: Typical force curve vs. sampling time on the micromanipulation rig for baked tomato paste removal
[Liu et al (2003)] 28
Figure 2. 3: Schematic diagram of the flat plate flow cell involved in the heat transfer during cleaning of the
fouled disk (Christian, 2003), Tc- thermocouples 33
Figure 2. 4: Trax 3-D simulation program for Toftejorg machines showing the spray profile from spray devices
in a tank (Alfa Laval, 2011) 36
Figure 2. 5: Mechanism of removal reaction, 5 step process, defined by [Morison and Thorpe (2002), step 1 is
mass transfer of solvent, step 2 interfacial process through the deposit, step 3 is an interfacial process in the un-
reacted deposit, step 4 is dependent on the solution, step 5 is mass transfer through the boundary layer 40
Figure 3.1: Mid IR spectra for neat Paste N product and water, showing that water has peaks which occur in the
toothpaste, but that toothpaste has additional peaks in the wavenumber range 1500 cm-1
to 800 cm-1
. 51

Table of Figures
viii
Figure 3. 2 Mid IR Sensodyne Surface spectra: Red line - Stainless steel 316L; Toothpaste dilutions: Blue Line -
10 ppm; Orange Line 100 ppm; green line - 1000 ppm; dark blue line - 1 x 10⁶ ppm ; black line – neat
toothpaste. 52
Figure 3.3: Rheology study: Shear rate is ramped between 100 and 0 s-1
and the viscosity and shear stress
response recorded for Paste T. 54
Figure 3. 4: Toothpaste (Paste T) samples between 100% (neat toothpaste) to 5% toothpaste in water. Most of
the dilutions were observed to be toothpaste like in structure, until the experiment when the toothpaste was
diluted to 5% and the structure was observed to be more water like. 55
Figure 3.5: Rheology (Paste T) Temperature ramp with a constant shear rate of 4 s-1
between 5°C and 50°C. . 56
Figure 3.6: Rheological Strain sweep on Paste T to identify the Linear viscoelastic region (LVR), G‟ (shear
elastic modulus or storage modulus) G‟‟ (viscous or loss modulus). The Oscillatory stress was selected as
2.141 Pa for the frequency sweep. 57
Figure 3.7: Rheology - Elastic and Viscous Modulus (Pa) of Paste T, determined by a frequency sweep (0.1 Hz
to 100Hz) in the LVR region. 57
Figure 3.8: Removal of toothpaste soil from a stainless steel substrate using the micromanipulation rig, images
from Liu (unpublished works). 59
Figure 3.9: Image of Ab Aziz (2007) cleaning rig, fouled coupon is positioned in circular opening in the centre
of the horizontal pipe, on top of a heat flux block described in Section 2.4. Cleaning fluid is then passed through
the system to clean the fouled coupon. 60
Figure 3.10: Schematic of the new cleaning rig, known as the Coupon Rig in this work (diagram from Goode et
al., (2010)), a coupon with foulant on is secured into the base of a horizontal duct in a glass section which allows
observation from above and side, the coupon is positioned above a heat flux sensor allowing the removal of the

Table of Figures
ix
foulant from the coupon to be monitored. The duct is attached to a heat exchanger reservoir and pump and these
are used to supply cleaning fluid to the cleaning rig. 62
Figure 3.11: Contact angles for different surface types as reported in Akhtar (2010) for both sorbitol (a key
toothpaste ingredient) and water. 65
Figure 3.12: Pipe Cleaning Rig (Pilot Scale) containing both a fouling and cleaning loop. – IBC is the waste
container. 66
Figure 3.13: Diagram of the ZEAL Pilot Plant. Water or cleaning chemical from the tanks is pumped through
heat exchangers and online instrumentation and into the „test section‟ area (in this work this has mainly
comprised of pipe line). The system then reaches some outlet instrumentation and is either sent to drain or
recirculated back into the tank. 69
Figure 3.14: Infrared spectra for on-line measurements, where the plant had not had deodorant fully cleaned out
before toothpaste experiments were performed, unpublished work by Elaine Martin and Gary Montague
(Newcastle University, 2011). 73
Figure 4.1: Coupon Rig, a) Cleaning of 1.3 g of Paste T from square coupons 25 mm x 25 mm, (deposition mass
0.002 g mm-2
) by water at temperature 20°C, and mean velocity 0.25 m s-1
, from left to right, row 1 then row 2,
in sequence 140 s, 2180 s, 2940 s, 3600 s, 3880 s, 4580 s, 5320 s, 5420 s. b) Cleaning of 2.3 g of Paste T from a
large coupon 35 mm square, (deposition mass 0.002 g mm2) by water of temperature 20°C, and mean velocity
0.25 m s-1
, Re = 1000, Formation of wave phenomena observed on the square coupons, the toothpaste wave can
be seen moving across the deposit from right to left and then breaking off. The wave took 152 s to travel across
the length of deposit and break off. Time intervals: i) 2122 s, ii) 2158 s, iii) 2170 s, iv) 2174 s. Total
experimental time in excess of 5 h. 77
Figure 4.2: Paste N, circular coupon cleaning rig, flow conditions 50°C, 0.2 m s-1
, total time to clean 1320 s.
flow direction, right to left. The images occur in sequence from left to right – at intervals of 60 s, 240 s, 360 s
and 540 s. 78

Table of Figures
x
Figure 4. 3: Response from a cleaning experiment on the Coupon Rig, cleaning conditions: 50°C, 0.25 m s-1
a)
Total area of toothpaste on coated sample as determined by image analysis calculated from the number of pixels
containing toothpaste over time, b) Heat transfer coefficient profile over time calculated as per Section 2.4. 80
Figure 4. 4:a) Removal of Paste N, by fluid of 0.37 m s-1
, 50°C. on the Ab Aziz (2007) PIV rig using circular
coupons on the cleaning rig. Turbulent flow - curling and ripping of toothpaste due to eddies. Time intervals: iii)
350 s, v) 640 s, vii) 736 s, viii) 738 s, ix) 743 s. Total cleaning time 780 s. Flow direction right to left. b)
Experiments conducted on the square coupon on Paste R, at fluid conditions of 40°C, 0.37 m s-1
: 800 s into a
1200 s experiment the paste is seen to curl and rip away. Stills every 10 s. flow direction right to left, 82
Figure 4.5 Heat transfer coefficient from the same experiment shown in Figure 4.4b, where a curl of paste is torn
away from the stainless steel surface between 800 s and 860 s, which is captured in the heat transfer coefficient
data by an increase at the corresponding time. Clean at 1800 s. 83
Figure 4. 6: Cleaning time as a function of temperature and velocity for Paste T, on the Coupon Rig using square
coupons, the equipment was described in Section 3.5.2. The error bars show the spread of data from 3
experiments from a visually 100% clean surface based on images taken every 10 s. 85
Figure 4.7: Coupon Rig experiments, heat transfer coefficient traces for repeats of the 40°C, 0.25 m s-1
condition
show pronounced variability in the heat transfer coefficient trace gradients. The black squares show the visually
clean result based on images taken every 10 s for the experiments. 86
Figure 4.8: Coupon Rig experiments, Fouling resistance (Rf) (defined in equation 4.1) versus velocity for
Coupon Rig experiments where the coupon was coated with 1.3 g of toothpaste, where the fouling resistance is
calculated using the fouled U at t = 100 s for each of the experiments. 87
Figure 4.9: Coupon cleaning time vs. Reynolds at 20°C, 40°C and 50°C, for flow rates between 0.25 – 0.5 m s-1
,
corresponding to Re ~ 5000 to 20,000. Plotted showing lines of best fit according to linear and power law
behaviour. 88
Table of Figures
xi
Figure 4. 10: Comparison of cleaning of different deposit types conducted on circular coupon cleaning rigs at
30°C including toothpaste as part of this study, baked toothpaste paste, Egg Albumin Gel (EAG) and whey
protein. 91
Figure 4.11: Coupon Rig experiments using Paste D, which has a noticeably different toothpaste structure to the
silica based products. Cleaning conditions: 40°C, 0.37 m s-1
., flow direction is right to left, the images are in
sequence from i – x. Paste D removal is dominated by the appearance of holes in the paste and thinning of the
paste over time with continued fluid flow. The contrast of the images has been altered to improve the clarity of
the image. 94
Figure 4. 12: Cleaning times for different pastes studied on the Coupon Rig at cleaning conditions of 40°C and
0.37 m s-1
. The cleaning time is based on a visually clean image. Images are taken every 10 s. The error bars
based on the variations from three experimental repeats. 95
Figure 4.13: Micromanipulation studies for paste D, where the pulling energy is given at different cut heights
above the surface, where the initial height was 2mm, and the height set to the cut height on the x axes.
Experiments performed at ambient temperature. Each experiment was conducted at least 3 times and the error
bars show the spread – 0.6mm cut height had only one experiment. At the lowest cut height, all the paste was
removed from the surface for Paste D. 96
Figure 4. 14: Micromanipulation Rig: Hydration studies for Paste N after different soak times, temperature is
30°C. Initial sample 2 mm height, cut to 1 mm (cohesive) and 0.1 mm (adhesive) heights. Error bar shows the
spread of data from 3 experiments. 97
Figure 4. 15: The pulling energy calculated from micromanipulation studies for a range of pastes, presented in
order of the cleaning time it took for the pastes on the Coupon Rig. With the left hand side representing the
longest to clean as presented in Figure 4.11. Cohesive (2 mm sample cut at 1 mm) and Adhesive (2 mm sample
cut at 0.1 mm) forces are presented for the range of pastes. 98
Figure 4.16: Rheology flow sweeps for all the pastes investigated in this work, plot of viscosity vs. shear rate. 99

Table of Figures
xii
Figure 4. 17: Rheology: Herchel-Bulkley viscosity term from the pastes model fit versus cleaning time from the
cleaning experiments for Coupon Rig for experiments conducted at 40°C and 0.37 m s-1
, a number of pastes
were investigated, each paste formulation is defined by a letter. 101
Figure 4.18: Viscoelastic rheology studies for different pastes, showing both the viscous and elastic modulus.
102
Figure 4.19: Viscoelastic rheology experiment for Paste D, showing that G‟ and G‟‟ cross, and so this has
viscoelastic behaviour. 103
Figure 5. 1: Pipe Rig, Experimental features of a low flow velocity cleaning experiment (0.5 m s-1
based on clean
tube measurement), ambient temperature ~ 15°C. Images taken at the end of a 47.7 mm ID pipe, 2 m pipe length.
Images taken at i) 2 mins, ii) 10 mins, iv) 42 mins, vi) 72 mins, vii) 108 mins and viii) 211 mins. The total
experimental time was 6 hours at which point the pipeline was still unclean. 107
Figure 5. 2: ZEAL Pilot Plant, Images for a cleaning experiment for a pipe of 0.5 m length and 47.7 mm ID
diameter filled with toothpaste, cleaned at 50°C and 1.1 m s-1
(0.002 m3s
-1) based on empty pipe velocity. The
experiment was stopped at various time intervals and the pipe opened to reveal the contents of the pipe. The
images correspond to cleaning times: i) 0 s, before the experiment - fully filled with toothpaste, ii) after 1 s,
Optek turbidity reading saturated (≥50 ppm), iii) after 15 s, Optek turbidity reading saturated (≥50 ppm), iv)
after 200 s, Optek turbidity reading 22 ppm, v) after 5420 s, Optek target turbidity of 4ppm, some small islands
of toothpaste are still visible. 110
Figure 5. 3: ZEAL Pilot Plant, Inductive conductivity response. Probe responses for inlet and outlet
measurements for a toothpaste filled 47.7 mm ID diameter, length 1 m pipe, Cleaning conditions: velocity based
on a clean tube: 1.7 m s-1
(0.003 m3 s
-1), temperature: 20°C. Data collected at conductivity setting 2. 112
Figure 5. 4: ZEAL Pilot Plan, Conductivity profiles for a filled pipe of 47.7 mm diameter, 1 m length, for
cleaning conditions of 1.7 m s-1
(0.003 m3 s
-1) based on a clean tube, and 20°C. This plot compares the output for

Table of Figures
xiii
the inductive conductivity readings presented in Figure 5.3 and the conductivity surface sensors. Not visual clean
at ~715 s. 113
Figure 5.5: ZEAL Pilot Plant, Turbidity data for a two tank experiment run conducted on a diameter 47.7 mm,
1 m length system at cleaning conditions of 40°C and 1.5 m s-1
(0.003 m3 s
-1) based on a clean tube. The Kentrak
turbidity unit response (FTU) is given on the right hand axes and shows values over the entire experiment as it is
calibrated to measure over the range 0 – 500 FTU. The Optek turbidity unit response (nominal ppm) is on the left
hand axes and is calibrated to be more sensitive at the low values and so gives a saturated reading above 50 ppm,
but has increased sensitivity at the end of the cleaning experiment. 115
Figure 5.6: ZEAL Pilot Plant, The system set-up for the experiment was 47.7 mm ID pipe diameter of length 2 m.
The cleaning conditions are 20°C and velocity based on clean tube of 1.7 m s-1
(0.003 m3s
-1). Measurement
profiles for one experiment collected over the experiment time. These comprised of i) inductive conductivity
difference (mS cm-1
) corrected for residence time, ii) conductive response (mS cm-1
), iii) turbidity response
(FTU) from the Fembrax turbidity meter, iv) turbidity response (nominal ppm) from the Optek turbidity meter.
117
Figure 5. 7: ZEAL Pilot Plant, System: 47.7 mm ID diameter, 1 m length. Cleaning condition: temperature 40°C,
velocity 1.5 m s-1
based on clean tube (0.003 m3s
-1). Repeatability test for Optek turbidity for three experiments:
i) the turbidity range between 0 – 50 ppm, ii) the scale shown is 0 – 5 ppm. The cleaning criteria is 4 nominal
ppm, for these experiments the cleaning time is 184 ± 2 s. 118
Figure 5.8: ZEAL Pilot Plant: Comparative measurement responses for turbidity (FTU) (Kentrak machine),
turbidity (ppm) Optek machine and Ion Chromatography solution measurements (µg ml-1
). 119
Figure 5. 9: ZEAL Pilot Plant: The system which has been investigated is pipe length 1 m and diameter
47.7 mm ID. The cleaning fluid conditions, velocity 1.7 m s-1
(0.003 m3 s
-1) based on a clean tube. Cleaning time
as a function of temperature for temperatures of 20°C, 30°C, 40°C, 50°C and 70°C. All conducted on Paste T,
The error bars are based on three experiments with the exception of 70°C which is one experiment. 120

Table of Figures
xiv
Figure 5.10: ZEAL Pilot Plant, system is 47.7 mm diameter, 1 m length, cleaning condition is 1.7 m s-1
(0.003 m3 s
-1) based on a clean tube, temperature comparison for Paste T vs. Paste D 40°C, The error bars are
based on 3 repeats for Paste T, 1 experiment for 70°C, and based on 2 experiments for Paste D. 121
Figure 5.11: Pipe Rig: System: diameter 47.7 mm ID, The cleaning velocities are based on a clean tube, the flow
rate ranges from 0.0004 m3 s
-1 – 0.002 m
3 s
-1. The cleaning times are based on the system being visually clean
and having an inherent error of ± 30 s at a variety of temperatures. 123
Figure 5.12: Zeal Pilot Plant, Cleaning system: 47.7 mm diameter, 1 m length. Optek turbidity profiles for
toothpaste cleaning experiments at 40°C for velocities of 1.3 m s-1
(0.002 m3 s
-1), 1.5 m s
-1 (0.003 m
3 s
-1),
1.7 m s-1
and 2.3 m s-1
(0.004 m3 s
-1) based on a clean tube. 125
Figure 5. 13: ZEAL Pilot Plant: System: pipe of length 1 m and diameter 47.7 mm ID: Cleaning conditions:
Effect of varying velocity, 1.0 – 2.9 m s-1
(0.002 – 0.004 m3 s
-1) based on clean tube and of varying temperature
(20°C - 70°C) of the cleaning water on cleaning time. The error is based on 3 experimental repeats; the error
bars are smaller than the data point on the graph in some instances. Power law fits are shown for the 20°C (bold
black line) and 40°C (thin black line) data. 126
Figure 5.14: Zeal Pilot Plant, The system to be cleaned is diameter 47.7 mm, length 1 m, cleaning conditions at
20°C and 40°C across a range of velocities between 1 m s-1
& 3 m s-1
with the velocities based on a clean tube.
Paste T and Paste D. Errors based on 3 repeated experiments, some errors are smaller than the data point. 127
Figure 5.15: ZEAL Pilot Plant: System to be cleaned, 47.7 mm diameter. Cleaning conditions 1.7 m s-1
based on
clean tube and 40°C i) Optek turbidity profiles for different length scales, ii) Kentrak turbidity profiles for
different length scales 129
Figure 5. 16: ZEAL Pilot plant data: System: 47.7 mm diameter, cleaning conditions for water at 40°C and
1.7 m s-1
, velocity based on a clean tube. Cleaning times for test section pipes of length 0.3 m, 1 m and 2 m,
errors based on three repeats of the experiment. 130

Table of Figures
xv
Figure 5.17: ZEAL Pilot Plant, System is 47.7 mm ID diameter, 2 m length. Cleaning conditions at 40°C, for
1.7 m s-1
based on a clean tube velocity. Pictures taken on the pilot plant after 1 s and 200 s, experiment showing
the amount of paste coating the pipe wall at different positions through the test section. 131
Figure 5.18: ZEAL Pilot Plant: System: 47.7 mm ID diameter pipe and 0.3 m and 1 m pipe lengths. Cleaning
conditions: i) 20°C, ii) 40°C and iii) 50°C, 133
Figure 5.19: ZEAL Pilot Plant: System: 47.7 mm diameter. Variety of lengths. Cleaning time as a function of
flow rate for toothpaste removal at 20°C, 40°C and 50°C, varying test section length at fluid velocities of 1 m s-1
,
1.3 m s-1
, 1.5 m s-1
, 1.7 m s-1
, 2.3 m s-1
and 2.9 m s-1
, based on clean tube velocities, 134
Figure 5.20: ZEAL Pilot Plant, Reynolds plot based on cleaning fluid of all the cleaning experiments, the
velocities calculated based on a clean tube. At all lengths, temperatures and flow rates for the 47.7 mm diameter
vs. Cleaning Time. 135
Figure 5.21: ZEAL Pilot Plant: System: 47.7 mm diameter, pipe lengths of 0.3 m, 1 m, and 2 m.. Cleaning
conditions: All temperatures and velocities captured in the Reynolds number, with the temperature of the
cleaning fluid captured by the physical properties of the water, and the velocity calculated based on a clean tube.
Reynolds plotted against cleaning time / residence time. 136
Figure 5.22: ZEAL Pilot Plant: System: 47.7 mm diameter, all lengths, Cleaning conditions: all temperatures and
velocities. Re vs. nominal shear stress (v t D-1
) 137
Figure 5.23: Coupon Rig (0.5 m s-1
) and ZEAL Pilot Plant: System: 23.9 mm diameter, 1 m, cleaning conditions:
20°C and 40°C, velocities based on a clean tube. Plot showing the effect of velocity on cleaning time for
23.9 mm diameter fully filled pipe. 138
Figure 5.24: ZEAL Pilot Plant: System: Length = 1 m, various diameters; 23.9 mm, 47.7 mm, 73.2 mm,
101.6 mm. Cleaning condition: various velocities based on a clean tube velocity. Velocity vs. Cleaning time for
different diameter pipes of 1 m length, using water to clean at i) 20°C, ii) 40°C. 139

Table of Figures
xvi
Figure 5.25: ZEAL Pilot Plant: System: Variety of diameters, 1 m, Cleaning conditions: 20°C and 40°C ,
Reynolds based on the physical parameters of the cleaning water, and the velocity is based on a clean tube.
Reynolds number vs. cleaning time for different diameters. 141
Figure 5.26: ZEAL Pilot Plant: System: various diameters at 1 m length. Nominal Shear (v.t.D-1) vs. Reynolds
number for cleaning water at 20°C, 40°C and across diameters. The Reynolds number is based on the physical
parameters of the cleaning water and the velocity on the clean tube. 142
Figure 6. 1: ZEAL Pilot Plant, System: Flow direction left to right. Flat Plate of a measurement port placed
horizontally at the base of the ZEAL Pilot Plant. Cleaning water conditions: 20°C, 1 m s-1
, images taken at
intervals through the cleaning run: a) 1676 s, b) 1696 s, c)1708 s, d)1726 s, e)1752 s, f)1767 147
Figure 6. 2: ZEAL Pilot Plant: System: 60 mm flat plate surface of a measurement port, Cleaning conditions:
temperatures of 20°C and 40°C, velocity based on clean tube of 60 mm, 0.64 m s-1
(0.002 m3 s
-1), 0.95 m s
-1
(0.003 m3 s
-1), 1.27 m s
-1 (0.004 m
3 s
-1). The time taken for the measurement plate to become visually clean as a
function of velocity and temperature for Paste T and some representative experiments for Paste D. 148
Figure 6.3: Coupon Rig vs. coated measurement port flat plate placed in the ZEAL Pilot Plant, for cleaning water
at different temperatures and velocities: 60 mm flat plate of a measurement port coated with paste, and placed so
that the sample is horizontally in line. Cleaning conditions: 20°C, 40°C, velocities calculated based on a clean
tube, Paste T, coupon rig and flat plate cleaning times established by the first completely clean image of the
surface. 149
Figure 6.4: ZEAL Pilot plant: Coated flat plate of a measurement port vs. pipe-line experiments, for diameters of
23.9 mm and 47.7 mm. Cleaning conditions: 20°C and 40°C, velocities calculated based on a clean tube for the
pipe experiments, and on a 60 mm diameter port for the coated surface. The lines group the coated surface
experimental data. 151
Figure 6.5: ZEAL Pilot Plant: System: coated plate of a measurement port and pipeline systems of 1 m length,
and diameters 23.9 mm and 47.7 mm. Cleaning Conditions, 20°C and 40°C, Paste T, velocities based on a clean

Table of Figures
xvii
tube for the pipeline velocities, and 60 mm diameter for the coated flat plate (Plate). Cleaning time as a function
of Reynolds number for the industrial scale coated surface system and pipeline cleaning in a 23.9 mm system
and 47.7 mm system. The coated surface (Plate) data is shown with lines. 152
Figure 6.6: Coupon Rig and coated measurement port plate on the ZEAL Pilot Plant, and a 47.7 mm, 1 m
diameter pipe on the ZEAL Pilot Plant. Cleaning conditions: All temperatures and velocities based on a clean
system captured in the Reynolds number via the physical properties of water. Dimensionless cleaning time (Θc =
utc/d) vs. Reynolds number for the Coupon Rig, Flat Plate system and the Pilot Plant 47.7 mm diameter pipes.
153
Figure 6.7: Coupon, coated surface (Plate) and ZEAL Pilot Plant pipes of 47.7 mm diameter. Cleaning
conditions: temperature captured by the physical properties of water in the Reynolds number, and velocity
effects for the clean tube incorporated in the Reynolds number. Cleaning time vs. wall shear stress for the
coupon rig data (squares), the flat plate system (stars) and the pilot plant data (0.3 m = diamonds, 1 m = circles,
2 m = triangles), at 20°C are shown. The black line is best exponential fit and dashed line is fit to 3500 τww -1
.
155
Figure 6.8: This shows cleaning time vs. wall shear stress for the coupon rig data (squares), the Flat Plate system
(stars) and the pilot plant data (0.3 m = diamonds, 1 m = circles, 2 m = triangles), at a range of temperatures
(20°C = black data points, higher temperatures in grey (40°C) or white(50°C). The lines are for the 20°C data,
dashed grey line is power-law fit, bold black line dashed line is fit to 2700 τww -1
, black line is power law for the
40°C and above. 157
Figure 6.9: Wall shear stress (τ, Pa) vs. Time (s) for experiments conducted at 20°C and 40°C on the Coupon
Rig, the Flat Plate system and the ZEAL Pilot Plant for 1 m length test sections and diameters of 23.9 mm,
47.7 mm, 73.2 mm and 101.6 mm. The bold black line corresponds to a power law line of best fit through the
20°C data. The dashed line corresponds to a power law line of best fit through the 40°C data. 159
Figure 6.10: ZEAL Pilot Plant: System: 47.7 mm diameter, 1 m length, Cleaning conditions: Various
temperatures, and various velocities calculated based on a clean tube. Water usage to clean a pipe. 161

Table of Figures
xviii
Figure 6.11: ZEAL Pilot Plant: System: 47.7 mm diameter, 1 m length. Energy usage to clean a pipe of diameter
47.7 mm, length 1 m under different cleaning conditions. All cleaning conditions included, with the velocity for
experiments based on a clean tube. 163
Figure 7.1: ZEAL Pilot Plant, system: 47.7 mm diameter, 0.5 m pipeline, acrylic and stainless steel surfaces.
Cleaning conditions: 20°C, 1.7 m s-1
based on a clean tube velocity, error from three experiments. Different pipe
surface comparison, and toothpaste fully filled vs. toothpaste core removed pipe-line. 179
Figure 7.2: ZEAL Pilot Plant: System: 47.7 mm diameter pipe, different lengths including a fouled test loop
incorporating t-pieces and bends. Cleaning conditions: 40°C, 1.7 m s-1
based on a clean tube velocity.
Comparing filled straight pipe with 3 m filled fouling loop including t-pieces and bends. 181
Figure 7.3: Pipe Rig: System: 47.7 mm ID diameter, 1 m length of pipe, Conductivity difference (normalised) vs.
time with water at ambient temperature (15°C) and different velocities (based on a clean tube) i) typical
conductivity profile for velocities < 0.21 m s-1
, ii) typical conductivity profile for velocity ~ 0.30 m s-1
, iii)
typical conductivity profile for velocities 0.40 – 0.6 m s-1
. 183
Figure 7.4: Pipe Rig data, visual cleaning time (±30 s) as a function of velocity (based on a clean tube) for
different diameter pipes at a range of temperatures. 184
Figure 7.5: ZEAL Pilot Plant: Single seat valve cleaning experiment – using the glass valve especially made for
cleaning studies by Bo Jenson. The flow comes from the bottom of the valve and exits from the pipe of the right
hand side of the images. Images were taken every second (cleaning condition 20°C, 1 m s-1
based on a clean
system inlet of 23.9 mm). Image sequence order, Left to Right, Top to bottom. 186
Table 1. 1: Toothpaste ingredients – from Sensodyne toothpaste label (2008) 7
Table 2.1: Mid IR wavenumbers found in the literature for some key toothpaste ingredients 26
Table 3. 1: Surface roughness measurements for coupons used in cleaning studies on the Coupon Rig. Surface
measurements performed by Alan Saywell (University of Birmingham) using a Talysurf machine. 64

Table of Figures
xix
Table 3. 2: Velocity comparisons at different diameters for GSK Pipe Rig 68
Table 4. 1: Calculated Coupon Rig parameters of wall shear stress and Reynolds number based on clean tube at
different velocities and temperatures. 84
Table 4. 2 : Circular coupon laboratory scale cleaning rig parameters given for the Christian (2003) and Ab Aziz
(2007) rigs where a selection of deposits have been investigated by being coated on to a coupon and placed in a
horizontal duct to be removed by cleaning fluid. The Reynolds numbers are different as the internal diameter is
different. 89
Table 4.3: Coupon Rig experiments on toothpaste cleaning with different levels of surface finish of stainless
steel and different surface types (stainless steel (316L), polypropylene, PFTE, acrylic and glass). The coupons
were coated with Paste T, and experiments performed at cleaning conditions: 40°C, 0.25 m s-1
. Re = 9500. The
time to reach a visually clean image is presented as a function of the surface. All of the experiments were
repeated 3 times, and the spread of data was captured in the errors. 93
Table 4.4: Herschel Bulkley parameters from the TA rheometers model fit function, for different pastes. 100

Abbreviations
xx
ABBREVIATIONS
AFM Atomic force microscopy
an Annum
CFD Computational Fluid Dynamics
CIP Cleaning In Place
COP Cleaning Out of Place
D Diameter
DIP Drying In Place
DTI Department of Trade and Industry
EAG Egg Albumin Gum
EHEDG European Hygienic Engineering and Design Group
FDA Foods & Drugs Administration (Regulatory Body)
Flexicell Maidenhead manufacturing facility
FMCG Fast Moving Consumer Good(s)
FTU Formazine Turbidity Units
G‟ Shear Elastic Modulus
G‟‟ Shear Viscous Modulus
GSK GlaxoSmithKline
IBC Waste vessel
IC Ion Chromatography
ID Internal diameter
IR Infrared
L Length
LC FT IR Liquid Chromatography Fourier Transform Infrared
LVR Linear Viscoelastic Region
MHFS Microfoil Heat Flux Sensor
MIR Mid – Infrared
mm Milli meter
Abbreviations
xxi
MPV Mix Proof Valves
OCM Maidenhead manufacturing facility
OD Outer diameter
P.A.T Process Analytical Technology
PHE Plate Heat exchanger
PIV Partical Imaging Velocimetry
PPM Parts Per Million
PPV Portable Pressure Vessel
PTFE Poly Tetra fluoro ethylene (Teflon)flon
R2 Coefficient of determination, ranging from 0 to 1, where 1 is a perfect fit
to a trendline.
Ra
Roughness (arithmetic average)
Re Reynolds number
RMSECV Root Mean Squared Error Coefficient of Variance
SAOS Small Amplitude applied Oscillatory Shear
SCM Sweet Condensed Milk
SIP Sterilisation In Place
SOP Standard Operating Procedure
TSB Technology Strategy Board
U Overall heat transfer coefficient
Unilever HPC Unilever Health and Personal Care
UPO Unit Process Operation
WIP Washing In Place
ZEAL Zero Emissions through Advanced cLeaning – Consortium of 11 partners
investigating cleaning problems

Chapter 1: Industrial Cleaning
1
CHAPTER 1: INDUSTRIAL CLEANING
Fast Moving Consumer Goods (FMCG) industries include food, beverage, consumer
healthcare and household goods manufacturers. These markets are highly competitive as new
products are launched frequently and consumer loyalty fluctuates. To achieve success, these
businesses must be efficient and flexible to enable them to have the capability to diversify and
the ability to expand product ranges and above all produce safe products. After production it
is necessary to clean the inside of process equipment so that the equipment can be used again
to make the next batch of product. The cleaning process is particularly important in the food
industry, where it is essential to clean production surfaces frequently and successfully to
ensure that all product manufactured is safe for use, and not at microbial or contaminant risk.
The process which is crucial to support these goals, and is common to these differing
industries, is the cleaning of the process equipment.
Successful cleaning involves removal of product residue, and other foulants and microbes
from process equipment and it is essential to:
• maintain product safety, through managing microbial risk;
• allow product change-over without contamination, and hence increase the flexibility of
the facility by permitting different product streams to be made;
• ensure product quality, by removing cross contamination from other foreign objects
and residual product;
• deliver process efficiency, for example, heat exchanger equipment works better and
the pressure drop through the plant is lower when the equipment is clean;
• provide a safe working environment for all personnel. [LeBlanc, 2000]
1.1. Thesis Aims
Most cleaning research has studied foods, in which the deposit forms a subset of the process
fluid. In most cosmetics and personal care processing, however, the fouled material is the
product itself, and the cleaning fluid is water. In this thesis, cleaning studies will be reported
which have been performed on the cosmetic/personal healthcare product, - toothpaste.
Chapter 1: Industrial Cleaning
2
Toothpaste is a Herschel-Bulkley type material, which means that is it shear thinning, and
requires a minimum amount of force to be applied to the product before it can flow.
Toothpaste was chosen as a representative material for many materials found in the FMCG
industries such as mayonnaise. Fryer and Asteriadou (2009) identified toothpaste as a
„Type 1‟ model deposit on a prototype cleaning map. The cleaning map groups products
according to their required cleaning method and deposit behaviour. Toothpaste was defined as
a viscoelastic or viscous product which could be removed by fluid flow alone. The results of
the work reported in this thesis will be used to inform the further development of the cleaning
map.
In this chapter, the context of cleaning in industry is presented. This chapter focuses primarily
on the techniques and strategies used for industrial cleaning and the costs associated with it.
This thesis, explores the behaviour of toothpaste as a fouling deposit and characterises this
material using known techniques and developed theories, these are summarised in Chapter 2.
Chapter 2 also contains a review on techniques which have been used in previous cleaning
studies, along with an assessment of fluid effects used for industrial cleaning. The equipment
which is used in this thesis is described in Chapter 3, the materials and methods chapter. In
Chapter 3 the toothpaste properties are characterised.
Cleaning studies have been conducted at both laboratory and pilot scale. This approach has
not been adopted previously in other works for a cosmetic product and provides the
opportunity to investigate the cleaning behaviour of a fluid mechanically removed deposit
across the scales and evaluate the ability of the cleaning behaviour to be predicted at greater
scale.
The results of rheological studies and experiments conducted on the micromanipulation rig on
a range of toothpastes are compared with the results of laboratory scale cleaning experiments
in Chapter 4. The impact on cleaning mechanisms and cleaning times was assessed through
various measurement techniques. The results reported in Chapter 4 for laboratory scale
cleaning operations were monitored through changes in heat flux and through image analysis.

Chapter 1: Industrial Cleaning
3
Many experiments were conducted on a specially developed pilot plant and the impact of
process parameters on different scale pipes is reported in Chapter 5. The process conditions,
velocity and temperature have been varied. The cleaning process was monitored for filled
pipe at pilot scale by flow, temperature conductivity and turbidity measurements.
Comparisons are made between the laboratory and pilot scale cleaning studies in Chapter 6,
using a „scale-up set-up‟ on the laboratory scale equipment based on the pilot plant facility.
Furthermore the results of the cleaning studies at all scales are compared. The effects on water
and energy usage for cleaning at pilot scale are evaluated in Chapter 6.
The conclusions for all the work presented in this thesis are given in Chapter 7, along with
recommendations for future study in this subject area.
1.2. Introduction to ZEAL
This doctorate formed part of a wider consortium project known as ZEAL (Zero Emissions
through Advanced cLeaning). ZEAL operated between October 2006 and December 2010.
The project received funding of ~ £3.5 million achieved by in-kind contributions from the
participating companies and co-funded by the Technology Strategy Board (TSB – previously
the DTI). ZEAL was comprised of three different business groups; there were four
manufacturing companies, mostly focussed on a product area of interest:
GlaxoSmithKline (GSK) - toothpaste
Cadbury – Sweet Condensed Milk (SCM), caramel
Heineken UK – yeast fermented foulants
Unilever HPC – mostly measurement focussed
There were four supplier companies:
GEA – processing equipment solutions
Alfa Laval – processing equipment, particularly spray balls
Ecolab – cleaning chemical suppliers
Brűker – instrumentation

Chapter 1: Industrial Cleaning
4
There were three universities:
University of Birmingham – experimentation
Imperial College – Computational Fluid Dynamic (CFD) modelling
Newcastle University - control modelling
The aims of the ZEAL programme were to investigate the different cleaning problems seen in
the respective manufacturing companies through measurement, modelling and control and to
reduce environmental inefficiencies in the form of water and energy usage and thus reduce the
carbon footprint related to cleaning. The overarching goal was to raise awareness of the
opportunities for economic and environmental savings in industry:
by monitoring cleaning
to progress scientific understanding of cleaning problems, previously cleaning
solutions have been largely developed based on experience and established through
trial and error
to produce scientific data for cleaning studies, which are supported by measurement
understanding, computational simulations and control algorithms
to develop the foundations of more refined CIP programs.
This platform gave the opportunity for companies to share their knowledge, experience and
the project findings to meet the common goals of gaining further understanding of the
cleaning issues and develop possible resolutions.
1.3. The cleaning map
The ZEAL consortium used their knowledge of cleaning to develop the cleaning map, reported
in Fryer and Asteriadou (2009). They conceptualised the cleaning problems from industry as a
function of soil complexity versus cleaning difficulty as seen in Figure 1.1.

Chapter 1: Industrial Cleaning
5
Figure 1. 1: The cleaning map - concept showing soil complexity as a function of the severity of the cleaning
conditions required to clean it [Fryer and Asteriadou (2009)].
The cleaning map places a range of foulant types alongside their expected cleaning solution.
Three types of fouling problem were identified. The descriptions below are reported in Fryer
and Asteriadou (2009).
“Type 1: cleaning of highly viscous or viscoelastic or viscoplastic fluids by water. In
personal products, the fouling film (such as toothpaste, shampoo, and creams) is the
same as the process fluid, and so forms by solidification. Similar problems are found
with viscous foods such as starch-based sauces and confectionery fluids. These
materials can however be removed by the action of flowing water alone.
Type 2: cleaning and killing of biofilms. Although it is possible to remove some
biofilms with water alone, normal practice is to use biocide to kill adhered organisms.
This changes the removal characteristics of the soil.
Type 3: cleaning of solid deposits by chemical action. Here solid deposits are formed
as a result of one or more fouling mechanisms. These cannot be removed by water
alone: cleaning chemicals are needed to transfer the deposit into a form either to
dissolve the deposit or to transform it into a form that can be removed. The nature of
Chapter 1: Industrial Cleaning
6
the deposit will determine the type of cleaning chemical used; such as sodium
hydroxide to remove organic films and acids to remove mineral scales.”
The ZEAL project identified foulants or deposits from the companies involved in this
consortium which provide model deposits to study a range of cleaning problems. This work
forms part of the output for the ZEAL project where three types of model soil were
investigated.
The Type 1 situation represents fluid removable soils, the model soil is toothpaste and
is reported here and in Cole et al (2010).
Type 2 represents products which are partially cleaned by fluid removal but need
detergent chemical for full removal, the selected model soil was yeast based bio-foul
see Goode et al (2010).
Type 3, represents burnt on soils and the selected model soil was burnt on sweet
condensed milk see Othman et al (2010).
The ZEAL project sought to gain scientific understanding of the processes and parameters
associated with cleaning for the specific model soils and for an overview of cleaning where
the differing deposit types can aid in the creation of a „cleaning map‟ as discussed in Fryer et
al (2011). This could be used to assist with developing and optimising well understood
cleaning regimes.
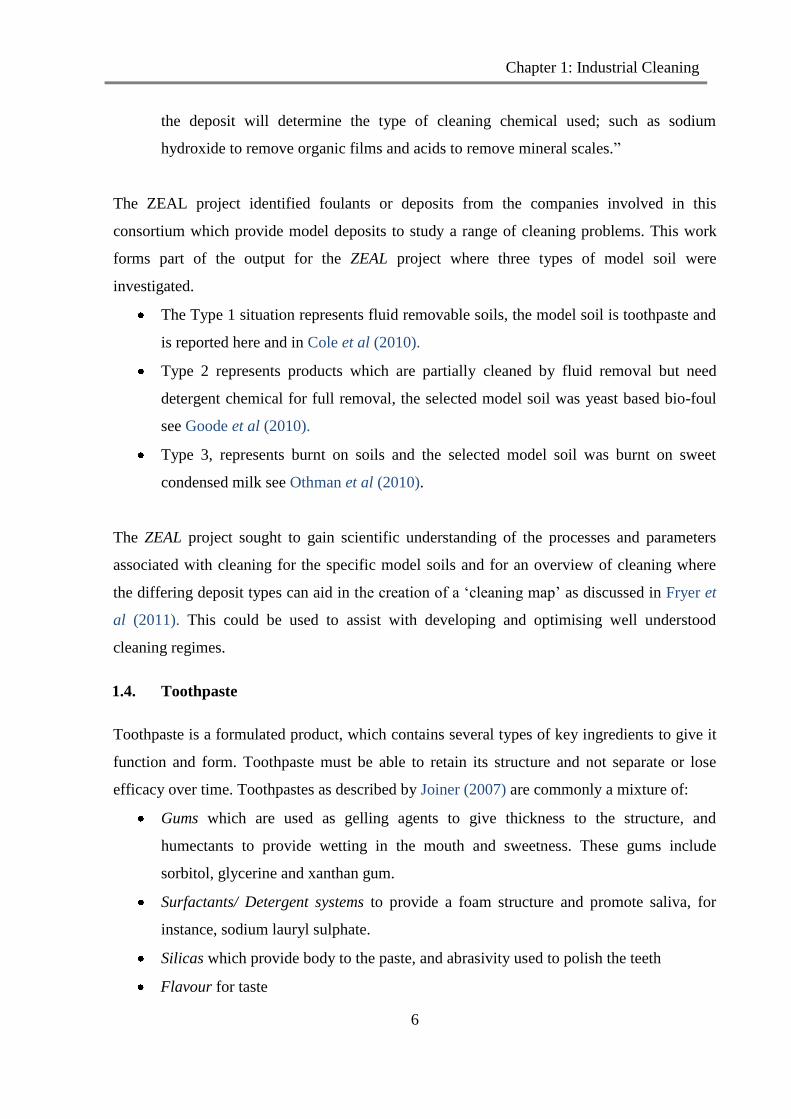
1.4. Toothpaste
Toothpaste is a formulated product, which contains several types of key ingredients to give it
function and form. Toothpaste must be able to retain its structure and not separate or lose
efficacy over time. Toothpastes as described by Joiner (2007) are commonly a mixture of:
Gums which are used as gelling agents to give thickness to the structure, and
humectants to provide wetting in the mouth and sweetness. These gums include
sorbitol, glycerine and xanthan gum.
Surfactants/ Detergent systems to provide a foam structure and promote saliva, for
instance, sodium lauryl sulphate.
Silicas which provide body to the paste, and abrasivity used to polish the teeth
Flavour for taste
Chapter 1: Industrial Cleaning
7
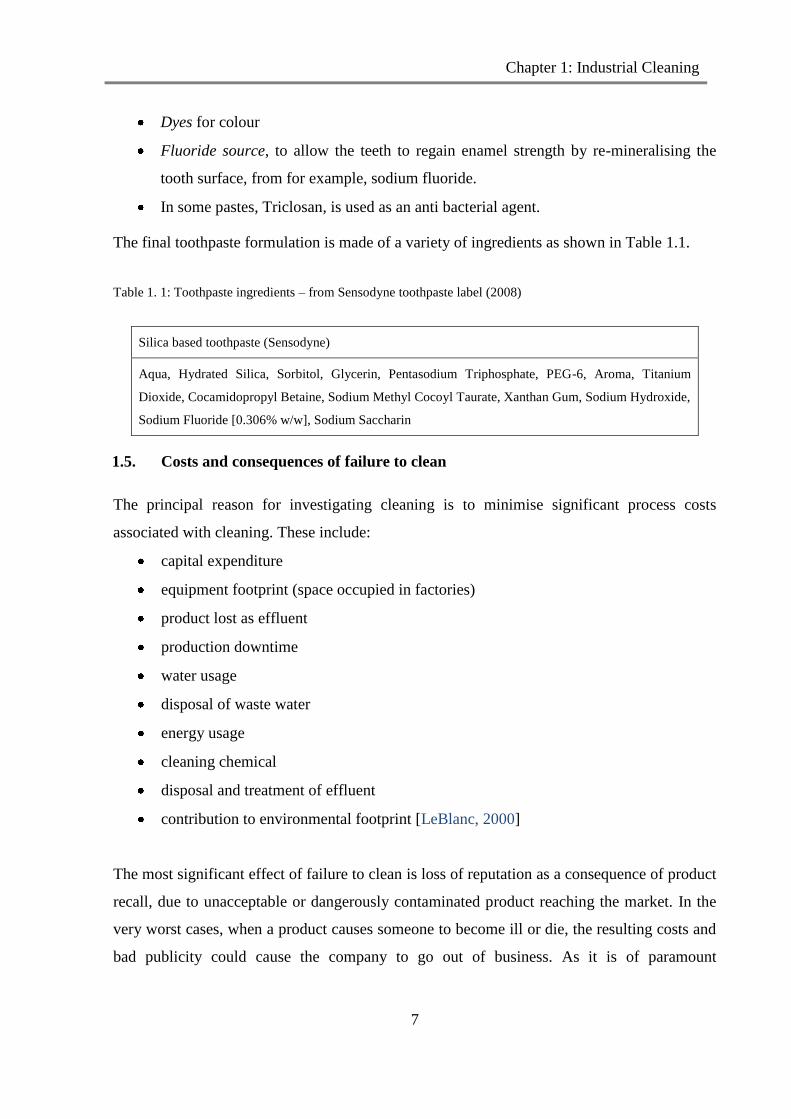
Dyes for colour
Fluoride source, to allow the teeth to regain enamel strength by re-mineralising the
tooth surface, from for example, sodium fluoride.
In some pastes, Triclosan, is used as an anti bacterial agent.
The final toothpaste formulation is made of a variety of ingredients as shown in Table 1.1.
Table 1. 1: Toothpaste ingredients – from Sensodyne toothpaste label (2008)
Silica based toothpaste (Sensodyne)
Aqua, Hydrated Silica, Sorbitol, Glycerin, Pentasodium Triphosphate, PEG-6, Aroma, Titanium
Dioxide, Cocamidopropyl Betaine, Sodium Methyl Cocoyl Taurate, Xanthan Gum, Sodium Hydroxide,
Sodium Fluoride [0.306% w/w], Sodium Saccharin
1.5. Costs and consequences of failure to clean
The principal reason for investigating cleaning is to minimise significant process costs
associated with cleaning. These include:
capital expenditure
equipment footprint (space occupied in factories)
product lost as effluent
production downtime
water usage
disposal of waste water
energy usage
cleaning chemical
disposal and treatment of effluent
contribution to environmental footprint [LeBlanc, 2000]
The most significant effect of failure to clean is loss of reputation as a consequence of product
recall, due to unacceptable or dangerously contaminated product reaching the market. In the
very worst cases, when a product causes someone to become ill or die, the resulting costs and
bad publicity could cause the company to go out of business. As it is of paramount

Chapter 1: Industrial Cleaning
8
importance that good quality product is produced, it is essential that robust cleaning
procedures are in place.
1.6. Plant design
When assessing cleaning within a factory environment, the most important pre-requisite is the
hygienic design of the equipment. Effective design should ensure that all areas are capable of
being contacted by cleaning solution and that no uncontactable areas of the equipment or
areas where bacteria can grow exist as you can‟t clean the uncleanable. Hasting (2005)
discussed the importance of hygienic equipment design particularly in heat exchangers where
product residence time can be increased by poor design with over processing of the product
occurring. If equipment is not hygienically designed then it will never clean, regardless of
how effective the cleaning solution is or how long the CIP process is run. Surfaces should be
smooth and seals tight. If there are areas where bacterial growth could occur these must either
be systematically checked to ensure growth has not taken place and manually cleaned or the
design modified. A consequence of this is that equipment should be easily accessible to aid
monitoring the effectiveness of cleaning and allow for good maintenance.
Good plant design can promote cleaning, for example certain designs of equipment are
capable of generating and maintaining turbulent flow during cleaning, consequently
increasing the ease of cleaning. The EHEDG, (the European Hygienic Engineering Design
Group), have developed guidelines on how to hygienically design equipment and perform
equipment tests, these guidelines include all areas of process equipment, and cover what
materials are safe to use (EHEDG, Doc 8) (2004) and what criteria should be adhered to
ensure that the equipment is hygienic, such as it must have no dead zones, and be easily
drainable (EHEDG, Doc 14 (2004)). A hygienically designed plant should be able to self-
drain so that the accumulation of water which could encourage bacterial growth is avoided.
1.7. The methods of industrial cleaning
Industrial cleaning can occur by several processes, the most fundamental cleaning of
production equipment, occurs by;
i) Manual cleaning, i.e. performed by an operator with a hose, cloth or brush.
dry cleaning -scrubbing, brushing, wiping, dusting

Chapter 1: Industrial Cleaning
9
wet cleaning -soaking, mopping, jetting
ii) COP (Cleaning out of Place), is the process of removal and disassembly of the
production equipment to allow the constituent parts to be cleaned individually, i.e., in
chemical baths, by jets etc. [LeBlanc, 2000]
The effectiveness of cleaning which results from manual cleaning and COP is dependent on
the skill of the operator and is not necessarily reliable or repeatable.
It is desirable to have an automated, fully repeatable cleaning program which is designed to
be part of the production process and considered as a Unit Process Operation (UPO) in the
production sequence. This is necessary as equipment becomes more complex, and industries
more heavily regulated. There exists a range of hygienic methodologies which are known as
„In Place‟, because they happen in situ to the fouled production equipment. These include:
cleaning in place (CIP),
sterilising in place (SIP),
drying in place (DIP).
In industry, CIP is the most commonly used process. The CIP process should give consistent,
measurable, repeatable cleaning of plant equipment, enabling reliable batch segregation with
minimal equipment downtime.
CIP involves circulation of hot cleaning fluids through closed systems of pipes, tanks, and
heat exchangers. The level of automation in these processes varies; hence different systems
can be described as;
• Semi-automatic Cleaning In Place, i.e., using a portable CIP unit which is connected
to the equipment and whose parameters are manually set-up for the CIP procedure.
• Fully-automatic Cleaning In Place, i.e., a CIP unit which is permanently connected to
the equipment to be cleaned which can be remotely controlled using factory
simulation screens

Chapter 1: Industrial Cleaning
10
1.8. Establishing a CIP regime
Cleaning procedures are generally recommended by either the CIP equipment supplier on
installation, or/and by the cleaning chemical suppliers. If commissioning a CIP program is
part of the contract to supply cleaning chemicals and equipment then a conservative approach
is typical, as the consequences of cleaning failures are high for the contractor. FMCG
manufacturers are often reluctant to change and optimise cleaning processes for several
reasons:
Existing methods have been proven to produce safe product
Lack of in-house expertise
Loss of production time to trial new methods
The true costs of inefficient cleaning are not fully appreciated
Cleaning procedures are generally based on programmes that are known to be effective on
similar equipment or foulant types. The CIP regime is likely to be based on combinations of
set water temperatures, flow rates, chemical concentrations and fixed time steps. Typically
cleaning trials are run during commissioning and the system opened and visually and
analytically examined to assess cleanliness. If at this stage an area is unclean then longer
times are likely to be set, or higher cleaning chemical concentrations used until several
successive clean results are achieved during commissioning. A typical cleaning regime is a
multiple step process such as that described in Section 1.9.
There are often multiples of similar equipment used in parallel to increase production
capacity, i.e. 2 mixing vessels. To limit the number of cleaning procedures which need to be
established, a worst case approach is often investigated and one cleaning regime established
for the process step, i.e. a cleaning regime used for two different mixing vessels which even if
they have the same specification will be in different locations, with different pipe-work. The
worst case in this example is likely to be the vessel with the most pipe-work or the trickier
pipe-work layout.
In the situation where there is a problem identified with the cleaning process, the first
response is likely to be to make the cleaning process operate with more aggressive conditions,
Chapter 1: Industrial Cleaning
11
for example, by increasing flow rates, temperatures, and the chemical concentrations in the
cleaning programme and also increasing cleaning times. This is done intuitively, as the natural
assumption is that more aggressive conditions will produce a more effective clean result or
allow production to continue more quickly compared with the original set-up. However, this
response can be counter-productive for instance; a product may bake on at a higher
temperature.
Pharmaceutical validation is the process of establishing a controlled and repeatable process
where every stage of the process is documented and performed in the same way each time.
Cleaning validation has been discussed by LeBlanc (2000) and adheres to these principles;
each clean is carried out in the same way, using the same steps, step times, and the same
chemical quantities, and water temperatures. The validation process is typically undertaken by
testing the cleaning of the worse case product in the portfolio, in at least three separate trials
and then visually and analytically testing all of the equipment to ensure that the equipment is
fully clean. A process is then established which must be used every time the cleaning process
is undertaken and includes a system of checks to prove that all the steps were followed in
every case. The process is then made a validated process, which must not be deviated from,
and is submitted to a regulatory body such as the FDA (Food and Drug Administration) who
may audit the process at frequent intervals. The validation process does not allow new product
to be introduced into a system without the process needing to be reassessed. It also ensures
that new materials or ingredients do not come into contact with the process equipment once
the procedure has been established, unless a proven method, which is introduced in a process
called a „change control‟ has been followed. The change control process involves a validated
method for ensuring the removal of any new materials. This gives assurance that the process
is repeatable and reproducible, and minimises the risk of producing material in an unclean
plant. The validated cleaning process does not necessarily account for any variation in the
incoming material. However, in the event of the measurement response being assured, then
the plant will always be clean.
1.9. Cleaning regime stages
In food manufacture, a typical CIP sequence contains a number of stages, i.e.
pre-rinse: to remove the bulk product

Chapter 1: Industrial Cleaning
12
hot detergent cycle: to break down difficult to remove soils. The detergent will be
selected to match the deposit type. In the dairy industry for instance, separate alkali
and acid washes are used as fats and minerals require different cleaning agents to
disrupt them
post-detergent rinse: to remove any traces of the detergent or its break-down products
sterilant cycle: to sterilise the equipment
final rinse: depending on the sterilising method used, a post-sterilant rinse may be
required to remove any traces of the sterilant,
quality approval, i.e,visual inspection, chemical and microbial swabs
It is possible to use continually refreshed water in cleaning, which comes directly from the
CIP inlet and is flushed through the equipment once and sent to drain. Continuous supply of
water requires a sizable water feed, together with methods for heating and adding accurate
amounts of chemical to the system. Due to the large volumes of water required to use
continually refreshed water, recirculation is explored during certain steps of the cleaning
process. Extended contact with the product reside on the equipment walls is required for the
hot water, cleaning chemical and sterilant steps to be effective. Cleaning fluid is generally
recirculated or recycled when performing the cleaning steps to allow a more efficient use of
resource. Typically, a straight to drain approach is used in the rinse stages, to remove bulk
product, and product or cleaning chemical residue. This is to prevent product residue being
left in the production vessel when the chemical rinse is undertaken, causing the effectiveness
of the chemical step to be reduced.
1.10. CIP unit
The purpose of the CIP unit is to deliver cleaning fluid, with the correct concentration of
cleaning chemical or sterilant to the equipment at the correct temperature and flow rate. The
CIP feeds cleaning fluid into the dirtied equipment, and then the effluent is returned to the
CIP unit. CIP is an automated process designed to have minimal operator contact. Ideally a
CIP system should be started, and then allowed to progress through a pre-determined
sequence which leaves the facility clean and ready for future manufacture, with minimal
checks required. It should be successful enough that the process of running the CIP gives
confidence that the plant is safe for on-going production.
Chapter 1: Industrial Cleaning
13
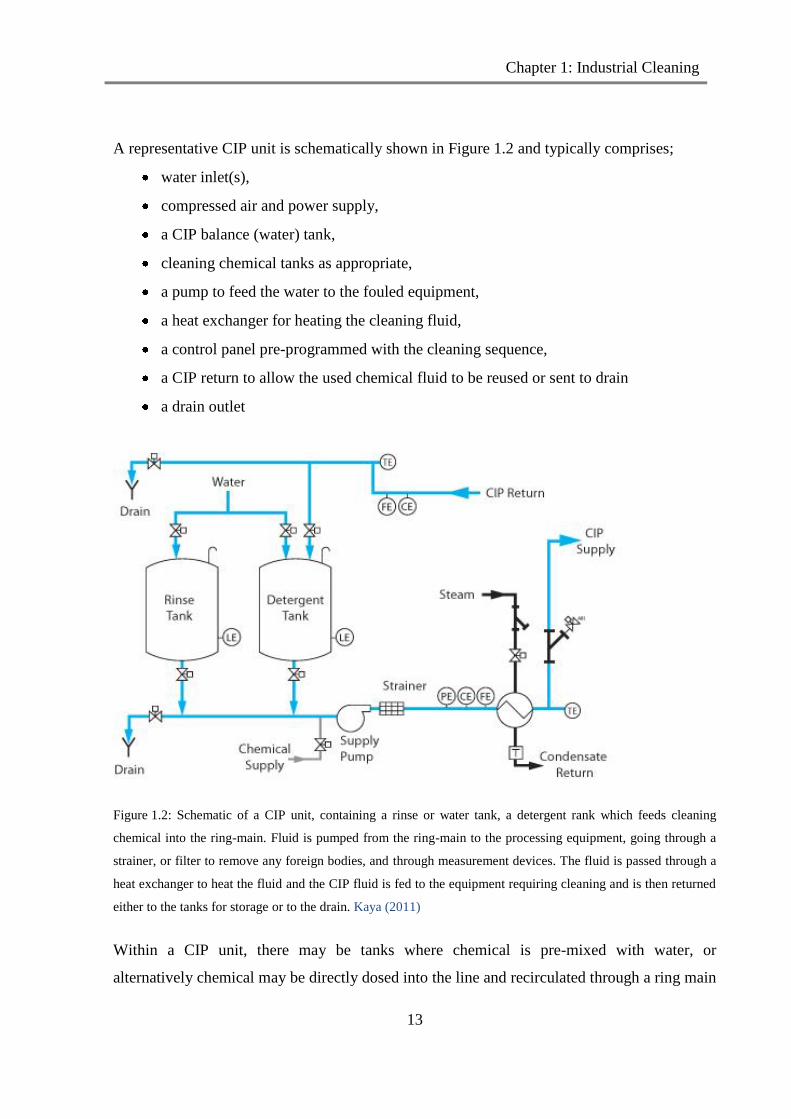
A representative CIP unit is schematically shown in Figure 1.2 and typically comprises;
water inlet(s),
compressed air and power supply,
a CIP balance (water) tank,
cleaning chemical tanks as appropriate,
a pump to feed the water to the fouled equipment,
a heat exchanger for heating the cleaning fluid,
a control panel pre-programmed with the cleaning sequence,
a CIP return to allow the used chemical fluid to be reused or sent to drain
a drain outlet
Figure 1.2: Schematic of a CIP unit, containing a rinse or water tank, a detergent rank which feeds cleaning
chemical into the ring-main. Fluid is pumped from the ring-main to the processing equipment, going through a
strainer, or filter to remove any foreign bodies, and through measurement devices. The fluid is passed through a
heat exchanger to heat the fluid and the CIP fluid is fed to the equipment requiring cleaning and is then returned
either to the tanks for storage or to the drain. Kaya (2011)
Within a CIP unit, there may be tanks where chemical is pre-mixed with water, or
alternatively chemical may be directly dosed into the line and recirculated through a ring main

Chapter 1: Industrial Cleaning
14
until either a set volume or mass of cleaning chemical has been dosed in, or a certain
electrical conductivity measure reached. The CIP process fluid will be used to clean the
equipment of interest and then the cleaning effluent will be returned to the CIP unit. Waste
goes straight to the drain or to an effluent disposal facility. In some cases, there is
infrastructure to support the cleaning fluid from certain cleaning stages being stored and
recycled in future cleaning operations or used as „grey‟ water. This is the term which is used
to refer to water which may be used throughout the factory which is not used for product or
human contact, i.e., water for toilets.
A CIP system often contains spray devices which are contained in the vessel and are used in
vessel cleaning. A variety of spray devices exist on the market, as different spray devices are
designed to clean different geometries or vessel sizes. The spray device is designed so that a
jet or spray of water rotates and contacts the vessel wall causing cleaning to occur according
to the geometric pattern of the water dispensed from the spray device. These devices are
normally designed to be self-cleaning. A method of monitoring the impact of spray balls is to
employ a spray jet counter, which is positioned on the vessel wall surface and used to record
the number of impacts made on the counter. The number of impacts on the sensor indicates
the number of spray circuits that have been completed in the vessel. It can also be used to
monitor the temperature of the drain water, because if it is similar to the inlet water
temperature then the foulant inside the tank is not acting as an insulator and so implies that
the foulant has been removed. More discussion about the flow pattern achieved with spray
devices is included in Section 2.7.
1.11. Benchmarking cleaning
Cleaning was investigated at the Maidenhead factory using a benchmarking tool, developed
and refined by the ZEAL consortium through this work program. It was found that over 2000
cleans were undertaken in 2007, and that cleaning accounted for ~ 0.8% of the manufacturing
costs considering energy, water, chemical and disposal of waste.
Collating this information involved:
analysing log-books for cleaning duration
assessing the number of cleans performed per year.

Chapter 1: Industrial Cleaning
15
Monitoring individual cleans
Assessing utility usage records.
Monitoring individual cleans was done to assess:
water usage
energy usage,
assessing whether these batches were made heal on heal
the amount of paste left in the vessel at the end of production,
At this stage the cleaning duration to reduce downtime, was the most significant area for
investigation, to gain benefit from an industrial perspective with the yield loss being a major
contributor which would involve redesign of the mixers.
1.12. Optimising industrial cleaning
The cleaning process produces the need for expenditure, in a number of ways:
capital expenditure for the CIP unit(s)
space – CIP units have an associated footprint related to all the CIP equipment
required
Cleaning spares – to compensate for downtime, often processes have to be designed
around the cleaning, i.e., having a separate cleaning shift; or having spares to allow
equipment to be alternated and components replaced if necessary.
lost production time - if a plant is production limited, then any extra cleaning time is
lost production time
analytical testing – to verify that the facility is adequately clean
Cleaning also consumes substantial resources:
high water usage experienced throughout the process,
cleaning chemical - detergent and sterilant
energy – to heat and pump the water, operation of the equipment during the process
the resulting carbon emissions, as a consequence of the cleaning process and from the
production of the cleaning chemical and water and energy usage
Chapter 1: Industrial Cleaning
16
The best way to reduce these wastes would be to eliminate the need to clean. However,
cleaning remains essential, and so when it is necessary to clean, any potential to refine the
process provides significant benefit to the business.
An efficient cleaning process has a balance of:
optimal time
minimal operator interaction
minimal water usage
minimal energy usage
minimal cleaning chemical usage
and hence has a smaller environmental footprint, although the waste that is removed in an
optimal process may end up being more concentrated and the impact of this would depend on
the product being produced. An optimal cleaning process also reduces the need for minimal
capital outlay due to efficient sizing of CIP equipment.
A step-change in cleaning efficiency could come from revisiting cleaning procedures which
have been established by trial and error and making them well understood optimal systems.
This step-change requires research to generate quantitative understanding on cleaning
mechanisms and efficacy across different product types and scales. The work described in this
thesis will investigate the cleaning of toothpaste on two scales using laboratory and pilot scale
cleaning rigs and assess the effect of varying process parameters on cleaning, to enable the
cleaning process to become well understood. Optimising CIP systems and investigating the
reuse and recirculation of certain washes could reduce effluent production, and the time and
energy costs associated with cleaning.
1.13. Levels of cleanliness and cleaning monitoring
A step change in industrial cleaning performance would be achieved if there was a way of
determining when the plant needed to be cleaned, and to determine the actual end-point of the
cleaning process. Furthermore to understand how clean is clean enough, for this, it is critical
to monitor the extent of fouling and the success of the cleaning program.

Chapter 1: Industrial Cleaning
17
Typically, a facility will be cleaned to the highest standard possible, although this may be
unnecessary with respect to the product needs. For example, in the case of food there are
times when the equipment is sterilised early in the process, but in terms of the food quality,
the food itself is sterilised later and so the early stage sterilisation was unnecessary for the
food quality. Different classifications for the extent of cleaning are possible, as discussed by
Christian (2003), these are:
Atomically – clean on a nano-scale
Physically – no physical measurement of the deposit is possible and none can be
optically detected.
Chemically – absence of substrates that may interfere with product processing
Biologically – (or sterile): free of micro-organisms.
This monitoring is generally not currently undertaken in sufficient detail to determine when a
plant needs to be cleaned.
1.14. CIP without detergent
Time, chemical concentration, temperature and mechanical effects are all contributory factors
in cleaning operations and should all be considered in an effective approach to cleaning. It is
desirable to clean where possible without detergent. This eliminates the need for one of the
traditional two validation steps,
1) to validate that the foulant has been removed
2) to validate that the cleaning detergent has been removed
1.15. CIP sequencing
Management of how frequently cleaning is implemented and at what interval can provide the
opportunity to deliver substantial savings. There are a variety of approaches to CIP
sequencing and layout. If cleaning is required to allow change-over between products,
efficient scheduling can provide significant benefits. For example, if two batches of the same
product can be manufactured on the same equipment, it may be possible to run these two
batches in series without a cleaning step in between. This may mean that some non harmful
product residue can be left on the equipment, for instance, due to the non-harmful nature of
toothpaste when similar active ingredients and dyes are used, batches can be made with
product residue in the mixer, limiting the frequency of cleaning requirements. It is also

Chapter 1: Industrial Cleaning
18
possible that if there are minimal differences between product ingredients a lesser cleaning
step, for instance, only a water rinse step could be run instead of a full clean. To do this,
analysis must be performed to assess cross over limits of active ingredients, dyes and
flavours. If it is permissible to have some carry over between batches then the frequency of
cleaning can be reduced if scheduling allows the same product to be produced using the same
equipment. This can continue until there is a microbiological or maximum carry over risk at
which point the equipment must be cleaned. This is of particular importance in the
pharmaceutical industry as carry over between batches could mean the presence of trace
amounts of a drug being transferred to the next batch. A method for determining acceptable
carry over limits was established by the pharmaceutical company, Eli Lilly and is detailed in
LeBlanc (2000). The criteria are:
that equipment is visually clean,
the active ingredient from one batch is present at less than 10 ppm in the following
batch
the active agent is present at a maximum level of a thousandth of the maximum daily
dose of the active, in a maximum dose of the subsequent product.
Grouping products according to ease of cleaning, active ingredients, dye colour etc. can allow
a smaller number of CIP regimes to be identified. This could lead to different levels of
cleaning programs, for example, a clean for easy to remove products and a second program
for products that are more difficult to remove.
1.16. Factory CIP Layout
When manufacturing a product, a number of process stages are generally needed, known as
unit process operations (UPO). It is likely that different process operations in the production
of a product will have different cleaning needs, this results in the need for different CIP
recipes to satisfy the varying cleaning needs across the process,. For instance in a dairy plant a
cleaning regime is required for heat exchangers used for pasteurisation which foul heavily due
to protein denatuaration at around 60 - 65°C and require alkaline detergents.
Factories are laid out in a multitude of configurations meaning that they require different
approaches to cleaning. Where only a single product is run through the production plant, the
facilities may be arranged to have dedicated lines. The need to clean is then driven by
Chapter 1: Industrial Cleaning
19
ensuring that the microbial load is acceptably low and to drive process efficiency rather than
because of change-over demands. Conversely, a plant may produce a wide variety of products
so that in addition to ensuring product safety requirements, the need is to ensure no cross-
contamination of one product by another. In general, the quicker the cleaning operation at
change-over the more flexible the facility, to allow maximum flexibility, the cleaning needs
will be dominated by change-over requirements.
In some situations, there are multiples of equipment items so that manufacture can continue,
whilst the back-up is cleaned. These different approaches give rise to different CIP set-ups.
CIP systems may be centralised at one point in the factory and supply all the unit processes.
The advantage here is that only one set of utilities and chemical supply is required. However,
this can result in:
i) cleaning fluid being pumped for long distances around the factory
ii) a limit on the number of items that can be cleaned at a time
iii) problems if the CIP set requires maintenance.
CIP can be performed on individual pieces of equipment after batch manufacture and this can
lead to the CIP sets being smaller but localised, so that they are positioned next to the
equipment that is being cleaned. The advantage of this is that the CIP fluid has less distance to
travel, so less fluid is required to fill and clean the connecting pipework and the CIP set will
have a smaller footprint. If the CIP set is adjacent to the process equipment it is designed to
clean it is more likely that the CIP operation can be modified if required as the process
evolves, as it is not hidden away in another part of the factory.
CIP procedures can be run as a campaign using „once through‟ cleaning where equipment is
filled up at one end of the process with cleaning fluid, which is sent around all the equipment
in the process in sequence and then the effluent sent to drain or recyclable storage. This
approach is used when removing an entire product stream and cleaning the production
equipment from the start to the end of the process. This requires the whole product line to be
stopped.

Chapter 1: Industrial Cleaning
20
1.17. Thesis structure
The aims of the thesis have been presented in this chapter, and the industrial problem which
governs its need, have been defined. The importance of cleaning was discussed and the
considerations of industrial cleaning methodologies, particularly CIP (Cleaning-In-Place)
were evaluated, along with some of the strategies which can be used by industry to minimise
cleaning requirements.
Chapter 2 contains a review of prior work in the area, a summary of foulant classifications,
and the techniques for determining bulk material characteristics. In Chapter 2, the existing
approaches to cleaning used in previous works are described. Physical cleaning
methodologies by fluid flow including cleaning removal mechanisms are then reviewed.
Chapter 3, the materials and methods chapter describes the equipment used and its set-up,
used in the experimental work presented in this thesis. Toothpaste has been used as a deposit
in this work across both laboratory and pilot scale cleaning equipment. Techniques which
characterise the product behaviour are also reported.
In Chapter 4, the influence of varying process parameters for water at different flow rates and
temperatures, in experiments on a bench-top „coupon‟ cleaning rig is reported. The output of
the deposit characterisations for different pastes is compared to the cleaning times for the
same pastes at laboratory scale. A comparison of cleaning times for toothpaste from a
selection of different surfaces is presented.
Chapter 5 examines cleaning of fully filled pipelines at pilot-scale for toothpaste. This focuses
on the toothpaste removal understanding and measurement profiles, impacted by the effect of
changing the cleaning water process parameters; including flow rate and temperature. The
effect of varying geometric scale; length and diameter in pipe lines is also evaluated.
Chapter 6 evaluates potential for scale-up between laboratory and pilot scale, using a set-up
on the ZEAL Pilot Plant which has a similar removal to that seen on the laboratory scale. Also
by examining the scale-up through chemical engineering principles

Chapter 1: Industrial Cleaning
21
Chapter 7 concludes the thesis, highlighting the achievements of this work and suggesting
avenues for future research.

Chapter 2: Factors affecting fouling & cleaning of a deposit removed by fluid mechanics
22
CHAPTER 2: FACTORS AFFECTING
FOULING & CLEANING OF A DEPOSIT
REMOVED BY FLUID MECHANICS
Chapter 1 described the necessity and economic importance of cleaning for FMCG industries
and introduced the common method used in most closed systems, CIP. To create effective and
efficient cleaning regimes, it is also important to consider the material to be cleaned, also
known as the foulant, fouling material, deposit or soil. The cleaning requirements are strongly
dependant on what the foulant is. Significant effort has focused on understanding the nature,
severity and formation mechanism of the foulant to establish effective controls and where
possible methods of prevention; see for instance Watkinson and Wilson (1997) on chemical
reaction fouling. Some fouling mechanisms were grouped and classified by Bott (1995) as;
Crystallisation or precipitation fouling – due to the deposition or formation of crystals
on the surface;
Particulate fouling – accumulation of solid particles from the fluid stream on to the
surface;
Biological fouling – deposition and growth of micro-organisms (or macro-organisms)
originating in the process stream on the surface;
Chemical reaction fouling – where the deposit is the result of one or more chemical
reaction(s) between reactants contained in the flowing fluid;
Corrosion fouling – effects of corrosion on the heat exchanger surface itself;
Freezing or solidification fouling – fouling due to the freezing of the process fluid
itself on the surface.
Fouling is typically a combination of more than one fouling mechanisms.

Chapter 2: Factors affecting fouling & cleaning of a deposit removed by fluid mechanics
23
In the personal care and toiletry industry, the largest „fouling problem‟ is often the removal of
bulk product or product residue remaining on process equipment when change-overs are
required to provide increased flexibility in the facility. It is clear that fouling and cleaning go
hand in hand in the production industry. This thesis focuses on the removal of toothpaste from
process equipment using Cleaning-In-Place (CIP) techniques.
Process cleaning in the personal healthcare industry is required to remove:
product residue from a previous batch;
foulant material, i.e. denatured product such as burnt on material in a heat exchanger;
microbial build-up or any material that might support microbial growth.
Hall et al (1998) found that the mechanical action and cleaning agent were both contributory
factors to ensure a complete removal of a biofilm of Pseudomonas fragi. The critical
parameters associated with understanding a cleaning problem are:
the equipment design (geometry), including the presence or absence of dead zones. A
dead zone is an area which is known not to clean as the fluid cannot contact it, for
instance at the bottom of an isolated T-section
the behaviour of the material to be cleaned, - the soil, foulant or deposit
mechanical action – the shear effects of fluid flow or manual cleaning
chemical action – chemical breakdown of deposit-deposit bonds or deposit-surface
bonds which loosens or dissolves deposit
temperature – increased energy supplied to the system
cleaning time
Hasting (2005) discussed the need for balance between these factors. All the factors combined
deliver a clean solution, however the cleaning contribution from each will vary. The removal
of toothpaste by CIP can occur by fluid mechanical action alone, and although chemical
action can make the cleaning quicker, it is not essential. The mechanical force is provided by
the fluid flow. However, if the cleaning chemical was present, then the other factors required
to produce a clean system may be reduced, for instance, less mechanical action from the fluid
may be required to allow cleaning to happen in the same time, or the time to clean may be
Chapter 2: Factors affecting fouling & cleaning of a deposit removed by fluid mechanics
24
reduced if the cleaning contribution from the other factors remains constant. These factors
were taken into account when designing the experiments to be undertaken in this thesis.
The equipment used to conduct experiments as part of this thesis will mostly be of a simple
design i.e. a coupon coated with a layer of material which protrudes into the flow stream, or
pipelines fully clogged with material, to avoid dead zones or un-cleanable areas. Cleaning will
be carried out by rinsing with water which will generate a mechanical effect on the equipment
surface. The effect of different flow rates on the cleaning time will be assessed, and the
cleaning fluid will be heated to different temperatures to assess the effect of temperature on
the cleaning time.
Several methods have been used to develop understanding of the toothpaste deposit studied in
this work, which are described in this chapter:
Infrared (IR) spectroscopy has been used to gain understanding on the chemical
structure of the toothpaste, the results are reported in Section 3.2. The sensitivity of
the IR measurement response at the end-point of cleaning as a Process Analytical
Technique (P.A.T) instrument is also assessed.
Micromanipulation, has been used to gain understanding about the cohesive forces
within the material and the adhesive forces between the material and the surface. The
technique is discussed in Section 2.2, and the results reported in Section 4.8.
Rheology, has been used to gain understanding about the flow properties of the
materials. The theory is presented in Section 2.3 and the results are reported in
Section 3.3 and compared for different pastes in Section 4.10.
This thesis concentrates on removal of toothpaste by fluid mechanical processes at laboratory
and pilot scale. Cleaning studies are reviewed in this chapter, focusing on factors associated
with fluid dominated removal of deposits. One of the techniques used in this thesis to study
cleaning effects is based on the flat plate flow cell technique which has been previously used
at the University of Birmingham described in Ab Aziz (2007). The principles of which, are
described in Section 2.4. Following this, the different fluid effects which are used to enable
industrial cleaning are discussed in Section 2.5 – Section 2.11. It is difficult to entirely
separate physical and chemical cleaning methods, as they are often complementary and so an

Chapter 2: Factors affecting fouling & cleaning of a deposit removed by fluid mechanics
25
overview of cleaning mechanisms including those based on chemical cleaning is presented in
Section 2.12. The effect of temperature is very important in water or chemical cleaning and
this is referred to in Section 2.13. Previous cleaning studies on different cleaning deposits are
reviewed in Section 2.14. The focus is on pilot scale cleaning in Section 2.15 and pilot scale
measurements in Section 2.16 as the impact of measurements to progressing cleaning studies
is very important.
2.1. Infrared spectroscopy
Shriver and Atkins (2001) detail how IR Spectroscopy is used to determine the energy
differences between vibrational modes in a molecule. The spectra gives information on the
symmetry within a molecule, - infrared spectrometry provides structural information on
molecules which have a change in dipole moment. Hence, the vibration in the molecule is
asymmetric. In an IR absorption process a photon of infrared radiation, frequency (v) is
absorbed and the molecule is promoted to a higher vibrational state. A Raman transition can
occur when the polarisation of a molecule changes during vibration. In Raman Spectroscopy,
a photon of frequency vo is scattered inelastically, giving up part of its energy and emerging
from the sample with a lower frequency v0-v1 where v1 is the vibrational frequency of the
molecule. The Raman effect is relatively feeble as only one photon every 1012
incident
photons is scattered inelastically. However, Raman spectroscopy has been used successfully
used to characterise compounds in the pharmaceutical industry [Vankeirsbilck et al (2002)].
Studies looking at toothpaste compounds by Raman spectroscopy were performed, but were
unsuccessful in operating in dilute conditions, as the water molecules resulted in the signal
being saturated.
Toothpaste is a composite material which has more complex and overlapping spectra than
those of the individual ingredients it contains. Work has been done on identifying the
triclosan concentration in toothpaste by LC-FT-IR (Liquid Chromatography – Fourier
Transform – Infrared spectroscopy) [Jordan et al (1996)]. Triclosan is an anti-bacterial agent
used in toothpaste but otherwise there is limited literature directly relating to toothpaste or its
ingredients and IR Spectroscopy. Toothpaste has been investigated by IR, to give insight into
any dominant structural features of the paste and the results are reported in Section 3.2. All

Chapter 2: Factors affecting fouling & cleaning of a deposit removed by fluid mechanics
26
pastes investigated in this thesis are silica based pastes with a similar base formulation unless
expressly stated.
Some of the constituents used in the toothpastes studied have been the subject of infrared
investigation in other works and the associated wavelengths are tabulated in Appendix 2. It is
expected that water (aqua) and silica will dominate the spectrum as these ingredients are
present in the largest quantities; some of the more significant absorptions are given in
Table 2.1.
Table 2.1: Mid IR wavenumbers found in the literature for some key toothpaste ingredients
Reference Species Wavenumber (cm-1
)
Almeida et al (1990) Si-O-Si bridges in gels (weak gel)
Strong shoulder observed in gels
1200
Water, H-O-H, bending and stretching 3331, 1636, 582
Calcium carbonate 1397, 1348
Casarin et al (2005) SiO2 – symmetric CH stretch 2927
Coates (2006) Si-O-Si linkage (organic siloxane/Silicon) 1078, 1042, 1036
The results of infrared studies with toothpaste are reported in Section 3.2.
2.2. Micromanipulation
Micromanipulation techniques have been used to understand the microstructural forces within
a sample (cohesive forces) and between a sample and a surface (adhesive forces) [Liu et al
(2002)]. The micromanipulation technique developed by Liu et al (2002) was comprised of a
T-shaped stainless steel probe (30 x 6 x 1 mm) attached to a transducer probe which measured
voltage output, which sensed movement (model BG-1000, Kulite semi-conductor, Leonia, NJ,
USA) . This was mounted on a micromanipulator (MicroInstruments, Oxon, UK). A surface
coated with foulant was placed perpendicularly under the probe. The probe was lowered to a
set height in the order of tens of microns (fine-tuned with digital level indicator, model 10-
CP12MS) so that it was adjacent to the substance to be investigated. The software was
activated so that the T-shaped probe was used to „pull‟ at a constant speed over the foulant
and the force that resisted the probe was measured at 100 Hz by a PC 30-D (data acquisition
board, Amplicon Liveline, Brighton, UK). The transducer measured the voltage used to move
the probe against time over a set distance (2.6 mm) which covered the coupon diameter, this

Chapter 2: Factors affecting fouling & cleaning of a deposit removed by fluid mechanics
27
was then converted to force from voltage by integrating the area under the curve and
multiplying by a conversion factor. The standard operating procedure and calibration for the
micromanipulator are given in Appendix 3.
The transducer and micromanipulator rig were connected to two microscopes and monitors so
that the removal of a substrate was observed from the side and from above. The sideways
monitor was used to determine the height of the probe relative to the surface and the plan
view was used to observe the level of difficulty in removing the substance, or the method in
which removal occurred. The disc containing the fouling sample was placed on the
microscope stage held by a second micromanipulator. Circular discs were used to enable
comparison with previous studies. Stainless steel discs of 26 mm diameter were used. A
schematic of this rig is shown in Figure 2.1.
Figure 2. 1: Schematic of the micromanipulation rig, based at the University of Birmingham [Liu et al (2002)].
The force measured depended on the cut height of the probe through the sample, i.e. the
height above the sample. When the sample was not completely removed from the surface, the
force measured was the cohesive force between elements in the sample. When the sample was
removed from the surface then the force measured was the adhesive force between the surface
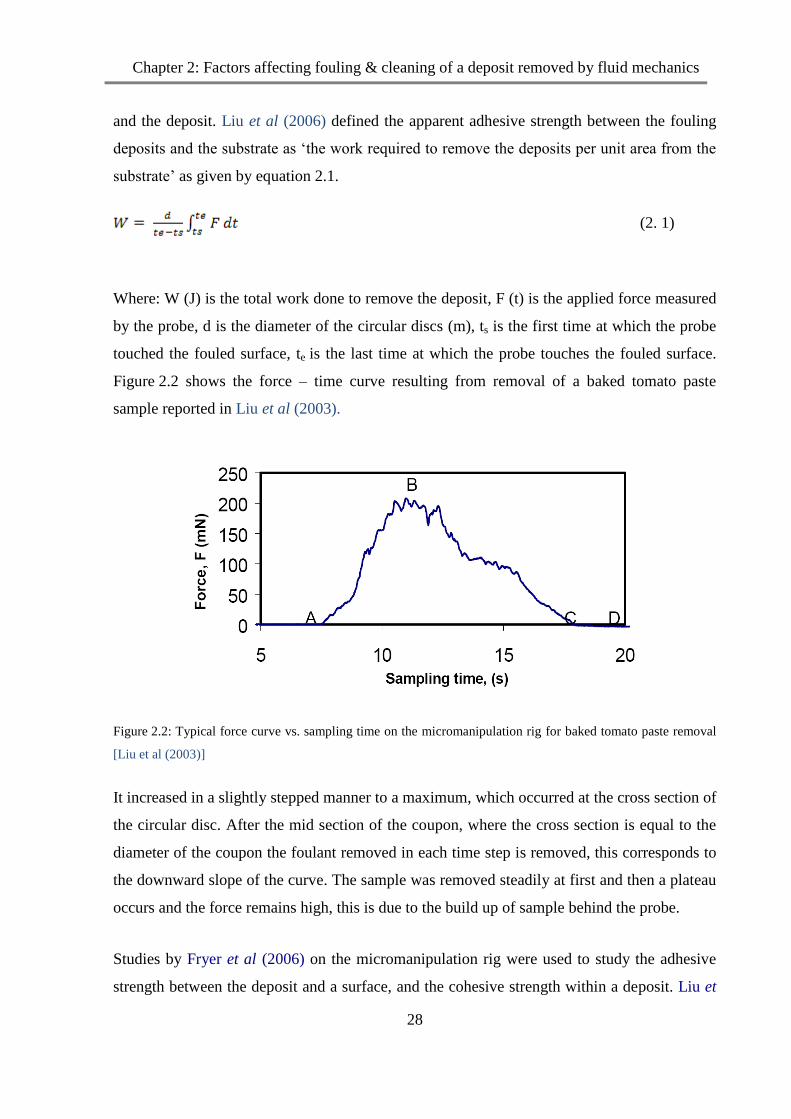
Chapter 2: Factors affecting fouling & cleaning of a deposit removed by fluid mechanics
28
and the deposit. Liu et al (2006) defined the apparent adhesive strength between the fouling
deposits and the substrate as „the work required to remove the deposits per unit area from the
substrate‟ as given by equation 2.1.
(2. 1)
Where: W (J) is the total work done to remove the deposit, F (t) is the applied force measured
by the probe, d is the diameter of the circular discs (m), ts is the first time at which the probe
touched the fouled surface, te is the last time at which the probe touches the fouled surface.
Figure 2.2 shows the force – time curve resulting from removal of a baked tomato paste
sample reported in Liu et al (2003).
Figure 2.2: Typical force curve vs. sampling time on the micromanipulation rig for baked tomato paste removal
[Liu et al (2003)]
It increased in a slightly stepped manner to a maximum, which occurred at the cross section of
the circular disc. After the mid section of the coupon, where the cross section is equal to the
diameter of the coupon the foulant removed in each time step is removed, this corresponds to
the downward slope of the curve. The sample was removed steadily at first and then a plateau
occurs and the force remains high, this is due to the build up of sample behind the probe.
Studies by Fryer et al (2006) on the micromanipulation rig were used to study the adhesive
strength between the deposit and a surface, and the cohesive strength within a deposit. Liu et

Chapter 2: Factors affecting fouling & cleaning of a deposit removed by fluid mechanics
29
al (2006) used tomato paste as a model soil. This was found to have strong deposit-deposit
bonds. This work was complemented by studies on the laboratory scale cleaning rig -the flat
plate flow cell. It was found that tomato paste removal was dominated by removal in chunks
from the surface, which aligned with the strong cohesive strength vs. adhesive strength found
on the micromanipulation rig.
The term „pulling energy‟ (equation 2.2) was coined by Liu et al (2006) and is used to
represent the force required to remove the sample, irrespective of whether this represents an
adhesive or cohesive force:
A
W
(2. 2)
Where: σ = force (J m-2
), W (J) is the total work done to remove the deposit, α = fraction
covered by the sample, A = disc surface area (m2)
The behaviour of toothpaste will be investigated using this technique in Section 4.8.
2.3. Rheology
In this thesis, the interest is on the behaviour of the bulk paste and how it behaves under
different conditions. Rheology is the primary characterisation technique for examining the
flow properties of bulk material. As the key removal technique is fluid flow, it is useful to
understand the flow properties of the toothpaste and examine what influence this has on the
cleaning behaviour of the toothpaste(s). Rheology is used to gain understanding on the
internal structure of a material and to study how the material responds to stress and shear rate
as discussed by Steffe (1996). In oscillatory rheometry, the substance to be tested is sheared
between two surfaces. The resistance to movement is measured and is analogous to any
deformation in the fluid. There are a number of parameters which describe characteristics of
the bulk behaviour of the paste(s) including yield stress, rheological models and the
viscoelastic properties of the paste(s).

Chapter 2: Factors affecting fouling & cleaning of a deposit removed by fluid mechanics
30
2.3.1. Yield stress
Toothpaste is classically described as having a yield stress [Steffe (1996)] as toothpaste does
not simply flow out of the toothpaste tube when turned upside down. A force (squeezing) is
required to enable the toothpaste to flow, this property is known as the yield stress. Yield
stress is the amount of stress which is applied to a sample before it is seen to flow, typically
yield stress fluids do not start flowing slowly. It is impossible to define yield stress
unambiguously as given enough time or accurate enough measuring equipment any material
could be seen to flow [Steff (1996)]. Pan et al (2004) defines yield stress as an empirical
constant which depends on the experimental conditions and material and that it is an
„apparent‟ instead of a „true‟ property of a fluid. The yield stress is a function of the
microstructure of the fluid that resists large rearrangements. A minimum shear is applied to
the fluid after the resistance to shear has been overcome, and then the material can flow. Yield
stress is a controversial topic and has been discussed in a letter by Coussot (2002). Coussot
(2002) states that when a material is submitted to flow the microstructure is partially
destroyed, Coussot (2002) found that for most systems at rest the structure reforms or evolves
spontaneously and the system is said to age. The yield stress property is captured in a number
of rheological models.
2.3.2. Rheological models
Gunasekaran & Mehmet Ak (2000) discussed how an ideal solid material responds to an
applied load by deforming finitely and recovering that deformation upon removal of the load.
This is described as elastic behaviour. Material will not recover from its deformation when the
load is removed and there is complete loss of energy as all the energy supplied during
deformation is dissipated as heat and obeys Newtons law. However, real materials have
characteristics which are in between the extremes and rheology can be used to characterise the
extent to which this is the case. Some of the most common materials, for example foods, are
shear thinning materials. Shear thinning materials become less viscous as the shear stress is
applied, hence it loses some of its structural order.

Chapter 2: Factors affecting fouling & cleaning of a deposit removed by fluid mechanics
31
The toothpaste is expected to be shear thinning and have an apparent yield stress, the
Herschel-Bulkley model fits these behaviours, (TA Model Note (2007)) as given in equation
2.3:
nky (2. 3)
where σy = yield stress, σ = stress, k = constant, γ = shear rate, n = rate index.
Cross and Williamson models as given in equation 2.4 and equation 2.5 respectively, also
have shear thinning and apparent yield stress behaviour. They contain more parameters than
the Herschel-Bulkley model.
Cross Model:
m
dt
dK0
(2. 4)
Williamson Model:
1
10
n
dt
dK
(2. 5)
where η= viscosity (Pa.s), K=Consistency factor, γ=shear rate (1/s), t=time (s), m=rate index,
n=rate index.
These models are a useful tool in describing the behaviour of toothpaste mathematically. The
better a model can predict the toothpaste behaviour, the better the interparticle forces can be
understood.
2.3.3. Viscoelastic properties of toothpaste
A sample can be further interrogated through oscillatory shear experiments where the sample
is subjected to different frequencies and the response measured in terms of its elastic and
viscous modulus. Gunasekaran & Mehmet Ak (2000) describe the dynamic tests required to
characterise a viscoelastic material, the first stage of this is to determine the Linear
Viscoelastic Region (LVR) using a SAOS (Small Amplitude applied Oscillatory Shear) test
using very small stresses or strains to identify whether (and in what shear range) the material
response is linear so that the stress is proportional to the applied strain. The linear region is

Chapter 2: Factors affecting fouling & cleaning of a deposit removed by fluid mechanics
32
the region which has the maximum stress that can be applied to the structure without the
structure being destroyed.
The shear elastic modulus (G‟) and the shear viscous modulus (G‟‟) are the frequency
dependant functions. The elastic modulus is a measure of stored energy (storage modulus)
which describes the molecular events of an elastic nature. The viscous modulus is a measure
of the energy dissipated as heat per cycle of deformation per unit volume (loss modulus) and
describes the molecular events of viscous nature. Gunasekaran & Mehmet Ak (2000) show
that the stress measured is a combination of the elastic and viscous components, see equation
2.6.
)cos()('')sin()(')( 00 tGtGt (2. 6)
Elasticity in toothpaste has been observed by Prencipe et al (1995) who stated that “highly
elastic structures are less subject to phase separation during the aging process” and that the
toothpaste “recover(s) more quickly after a stress is imposed on the toothpaste”. This is a
desirable property which means that the toothpaste „stands up‟ on the brush and doesn‟t flow
off it.
Gunasekaran & Mehmet Ak (2000) refer to weak gels where the elastic modulus is greater
than the viscous modulus (G‟>G‟‟), where both the storage and loss modulus are largely
independent of frequency and the linear viscoelatic strain limit is small, with a shear rate of
less than 0.05. These weak gels are described by Gunasekaran & Mehmet Ak (2000) as
having an entangled network system. Toothpaste is known to exist as a three-phase system;
the continuous phase; the dispersed phase and the solid phase. The continuous phase suspends
the solid phase in a gel using binders present in the dispersed phase [Prencipe et al (1995)]
and so an entangled network would correlate with the known properties of toothpaste.
2.4. Laboratory scale cleaning studies - flat plate flow cell (Coupon rig)
Cleaning studies have been conducted on a range of different equipment. The flat plate flow
cell has been used by Christian (2003) and Ab Aziz (2007) to study cleaning, and the same

Chapter 2: Factors affecting fouling & cleaning of a deposit removed by fluid mechanics
33
principles will be used in this work on a slightly modified equipment which will be referred to
in this thesis as the Coupon Rig and is described in Section 3.5.2
The flat plate flow cell was described in Christian (2003) and comprised of a horizontal
rectangular duct where a coupon coated with fouled deposit was secured such that the surface
of the coupon and the duct were flush, and the fouling deposit protruded into the fluid stream.
The deposit was removed with flowing water at set flow rate and temperature. The flat plate
flow cell was designed so that the area reduction of the fouling deposit over time was
monitored via image analysis. Photographs were taken at regular time intervals of the deposit
from directly above the duct. The cleaning process was also monitored by heat transfer. The
stainless steel coupon was secured above a heat flux sensor as shown in Figure 2.3.
Figure 2. 3: Schematic diagram of the flat plate flow cell involved in the heat transfer during cleaning of the
fouled disk (Christian, 2003), Tc- thermocouples
The heat flux sensor unit was composed of a copper disk with a Microfoil Heat Flux Sensor
(MHFS) attached. The parameters associated with the MHFS are given in equation 2.9 and
equation 2.10. The MHFS was placed in a cooled block which was kept in an ice bath to give
the maximum temperature difference between the heat flux sensor and the cleaning fluid. The

Chapter 2: Factors affecting fouling & cleaning of a deposit removed by fluid mechanics
34
temperature of the cleaning fluid was monitored by thermocouples at either side of the
cleaning pipe. The temperature from the flowing cleaning fluid reached the heat flux sensor
insulated by the deposit and the stainless steel coupon as the deposit was removed from the
coupon positioned directly above the MHFS the heat transfer increased. This change in heat
flux was monitored for the duration of the cleaning experiments and could be used to
calculate an overall heat transfer coefficient (U) given in equation 2.7.
)( HBL TT
qU
(2. 7)
where: U (kW m-2
K-1
) is the overall heat transfer coefficient, q (kW m-2
) is flux across the
sensor, TL (K) is the average temperature of the cleaning liquid, and THB (K) is the
temperature at the base of the heat sensor The heat flux [q, (kW m-2
)] through the sensor is
given by equation 2.8:
VTxs
sq B ).(.
(2. 8)
Where: λs/xs (kW/m2μV) relates heat flux to the voltage across the MHFS sensor, xs (m) is the
thickness of the sensor, υ (K/ μV) is a constant, κ(TB) is a temperature factor defined by the
manufacturer, V (μV) is the voltage reading from the MHFS, which can be calculated using
parameters defined by the sensor suppliers (Rhopoint Components) given in equation 2.9 and
equation 2.10:
VmkWxs
s 2/000288.0 (2. 9)
0207.10008.0)( HBB TT (2. 10)
2.5. Fluid cleaning
Friis and Jenson (2002) discussed different hydrodynamic parameters that affect cleaning.
These include the wall shear stress; the nature of the flow such as the level of turbulence and
the nature of any recirculation zones which can produce swirl, transient behaviour and steady
recirculation or effects include jetting where a large volume of fluid is forced through a small
area to create a rapid jet that impacts on the surface used, this methodology is commonly used
in vessel cleaning. Another effect that can be utilised is soaking which is thought to hydrate
Chapter 2: Factors affecting fouling & cleaning of a deposit removed by fluid mechanics
35
the layer between the surface and the deposit making its removal easier. Removal by rinsing
is a combination of mechanical effects from the fluid flow and hydration at the surface from
soaking as the fluid remains on the surface.
2.6. Soaking and hydration studies
It is well known that soaking a fouled material eases its removal. The force of adhesion
between a surface and a foulant was less when the sample was soaked before measurement on
the micromanipulation rig (Liu et al, 2002) and in cleaning studies performed by Fryer et al,
(2006), hydration of the deposit-surface interface was found to be a key deposit removal
mechanism.
2.7. Jetting
A number of cleaning equipment providers, including Alfa Laval (2011), produce spray
devices which are spherical bodies with holes in, through which water is forced to produce
jets which hit the vessel walls and aid with cleaning. Jetting is one of the key methods used to
increase the mechanical impact on vessel walls as the jet has a high impact force. Spray balls
have no moving parts, whereas rotary spray balls are able to spin. This allows the jets of water
to rotate and hit the wall surfaces as the spray ball spins. The constant rotation is driven by the
flow rate. The use of spray balls in a CIP set produces very repeatable results as the impact
pattern on the vessel wall is governed by a known spray pattern which is known to be the
same every time if there is sufficient water passing through the device to enable it to function
as demonstrated in Figure 2.4.

Chapter 2: Factors affecting fouling & cleaning of a deposit removed by fluid mechanics
36
Figure 2. 4: Trax 3-D simulation program for Toftejorg machines showing the spray profile from spray devices
in a tank (Alfa Laval, 2011)
Impact counters allow the count of the number of spray impacts to be compared to the
expected value to demonstrate that the expected number of cycles has occurred.
2.8. Pipe flow
The cleaning of process equipment typically uses fluid flow defined by its flow rate or fluid
velocity. Fluid flow can be laminar, transitional or turbulent. These definitions correspond to
a Reynolds number range, which considers the ratio of inertial forces, to viscous forces as
given in equation 2.11:
duRe
(2. 11)
where: d = diameter; u = mean velocity; ρ = density; µ = viscosity of the fluid.
Laminar flow describes layered parabolic flow, this occurs in a pipe when Re < 1500, this is
where the velocity at the centre of a pipe is at a maximum. For Reynolds number
1500 < Re < 4000 the flow is transitional and has a flow pattern somewhere between laminar
and turbulent flow. When the flow rate is increased to Re > 4000, the flow is classified as
turbulent, in which there is turbulent mixing between the layers. This mixing contributes to
Chapter 2: Factors affecting fouling & cleaning of a deposit removed by fluid mechanics
37
cleaning as the flow is less ordered and more likely to create small boundary layers and hence
the deposit is more likely to protrude into the turbulent flow and be removed.
In manufacturing facilities, for cleaning to take place in a sensible timeframe the fluid must be
turbulent. Over time, rules of thumb have developed for minimum cleaning velocities.
Grasshoff (1994) stated that the standard minimum flow rate for cleaning milk plants is 5 ft s-1
or 1.52 m s-1
through each pipe or fitting. Alfa Laval (2007) specifies that flow rates between
1.5 and 3.0 m s-1
should give a good scouring effect on the surface of the equipment. Friis and
Jensen (2002) used the EHEDG (European Hygienic Engineering and Design Group)
guidelines of 1.5 m s-1
fluid flow for their experiments on T-pieces.
2.8.1. Wall shear stress
Fluid flow induces a shear stress on the wall surface of a pipe. Mean shear stress (τw) can be
defined in terms of equation 2.12:
L
dPDw
.
4 (2. 12)
For a pipe of diameter - D (m), dP is pressure drop (Pa) and L(length (m)).
APV (1995) specified that Re > 6800 or a shear stress value of > 0.8 Pa should ensure
efficient deposit removal. The shear stress to physically wipe a milk deposit from a surface
was however reported as 1250 Pa by Grasshoff (1994) which is much greater than the shear
stress at the surface of a Plate Heat Exchanger (PHE) of 1 - 20 Pa.
Grasshoff (1994) believed that the wall shear stress was the key factor to detach bacteria.
Lelièvre et al (2002b) found that the mean wall shear stress value could be considered as a
sufficient criterion for explaining spore removal in simple geometries such as in pipes.
Lelièvre et al (2002) found that removal kinetics seemed to depend on wall shear stress
values. It was observed by Das et al (1995) that after 5 mins only 9% of the initial
contamination of Bacillus cereus spores remained on the surface when cleaning was
performed at a shear stress of 65.95 Pa while 47% of the initial contamination remained when
cleaning was performed at 17.45 Pa.
Chapter 2: Factors affecting fouling & cleaning of a deposit removed by fluid mechanics
38
2.9. Recirculation zones
Jenson et al. (2001) results showed that the wall shear stress was one of but not the sole
parameter involved in the cleaning process of closed process equipment. The nature of the
fluid flow was an important factor in determining the cleaning efficiencies. Their results
showed that complex geometries are not necessarily difficult to clean. Hygienic design does
not prohibit complex geometries, in fact studies by Jenson et al. (2001) on mix proof valves
(MPV) with spherical valve houses show that complex geometries can produce flow which
can induce better cleaning than expected even in parts where the wall shear stress is very low.
MPV swirl begins at the valve housing entrance and increases in magnitude along the main
flow direction, then after the stem gradually decreased in size towards the housing outlet.
2.10. Non uniform flow
Non uniform flow has been investigated in the cleaning of milk soils. Hankinson and Carver
(1968) found that a water hammer gave little improvement for dried milk deposits.
Reinemann (1996) found that two-phase flow of air and water reduced the amount of water
required for circulation and increased the flow velocities and thus enhanced the mechanical
cleaning action. Mott et al (1995) investigated the pulsing of fluid flow at low temperatures
and high amplitude which enhanced heat and mass transfer. Farries and Patel (1993) found
that low frequency/large amplitude waves generated by a solenoid valve arrangement enhance
the removal of whey protein deposits. Gillham et al (2000) investigated pulsing produced by
bellow rig which was observed to have negligible effect on the initial swelling phase of whey
proteins but observed to have significant effect on both the subsequent phases of cleaning.
2.11. Other fluid cleaning methods
Tragardh (1981) investigated the effects of entrained air in fluid flow and found that it gave
limited improvements in deposit removal. Hanjalic and Smajevic (1994) found that
compression waves increased removal of brittle boiler scales. Guzel-Seydim et al (2000)
investigated the use of ozonated cold water (10°C) prior to cleaning of a dairy soil from
Stainless Steel plates. It was found that ozonated pre-treatment removed a third more deposit
than pre-treatment with warm water at 40°C. Pigging is the process of sending a rubber bung
down a pipe, and can be used to induce shear on a pipe wall. There are other known methods

Chapter 2: Factors affecting fouling & cleaning of a deposit removed by fluid mechanics
39
for pigging; ice pigging has been reported by Quarini (2002) in which a plug of ice was used
to empty pipes; this methodology, if commercially viable would be able to separate and
recover products and use less water than traditional water cleaning methods. The difficulty of
this technique as reported by Quarini (2002) is the capability of the pig to deal with complex
topologies.
2.12. Chemical cleaning
Effective cleaning regimes often use both chemical action and mechanical action supplied by
fluid impact to achieve a clean surface. Fouling deposit forms a thin film on the surface of the
process plant formed by deposition of a reacted or precipitated component, such as proteins
and minerals from milk [Fryer et al, 2006; Changani et al (1997)]. For every system the
balance between chemical and mechanical cleaning must be assessed. If a deposit requires
chemical breakdown to allow removal then the chemical must be applied and given some time
to act on a deposit.
Work performed by Gallot-Lavallée (1984) investigated the cleaning kinetics of a tubular heat
exchanger fouled by milk at a pilot plant scale and developed a two stage model, it was found
that a zero order equation was indicative of the chemical action of the milk soil and a first
order equation for the flow mechanical action. Visser (1995) suggested that removal of colloid
particles was controlled by the wall shear stress, but the presence of a detergent ensured a
decrease in the adhesion force and consequently improved the removal of these particles.
Therefore the importance of the twinned approach must be considered and optimised
according to the deposit.
Several authors have published complementary classifications of cleaning processes.
According to Bird and Fryer (1991) there are three main processes found in cleaning
mechanisms: mass transfer, diffusion and reaction processes.
Mass transfer is the most significant removal mechanism in materials which can be
removed by fluid dynamics;
Diffusion is important in materials which are removed through a soaking process. Plett
(1985) describes a process of transport to the deposit surface of the cleaning chemical
and into the deposit structure.
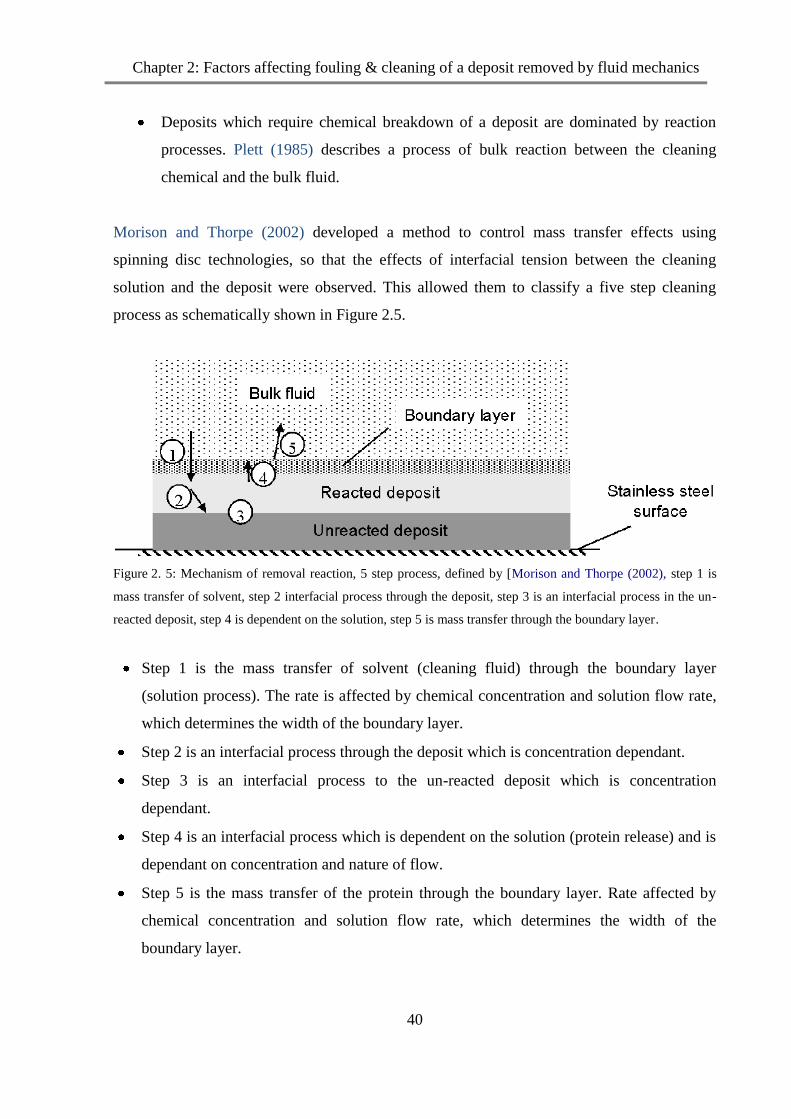
Chapter 2: Factors affecting fouling & cleaning of a deposit removed by fluid mechanics
40
Deposits which require chemical breakdown of a deposit are dominated by reaction
processes. Plett (1985) describes a process of bulk reaction between the cleaning
chemical and the bulk fluid.
Morison and Thorpe (2002) developed a method to control mass transfer effects using
spinning disc technologies, so that the effects of interfacial tension between the cleaning
solution and the deposit were observed. This allowed them to classify a five step cleaning
process as schematically shown in Figure 2.5.
Figure 2. 5: Mechanism of removal reaction, 5 step process, defined by [Morison and Thorpe (2002), step 1 is
mass transfer of solvent, step 2 interfacial process through the deposit, step 3 is an interfacial process in the un-
reacted deposit, step 4 is dependent on the solution, step 5 is mass transfer through the boundary layer.
Step 1 is the mass transfer of solvent (cleaning fluid) through the boundary layer
(solution process). The rate is affected by chemical concentration and solution flow rate,
which determines the width of the boundary layer.
Step 2 is an interfacial process through the deposit which is concentration dependant.
Step 3 is an interfacial process to the un-reacted deposit which is concentration
dependant.
Step 4 is an interfacial process which is dependent on the solution (protein release) and is
dependant on concentration and nature of flow.
Step 5 is the mass transfer of the protein through the boundary layer. Rate affected by
chemical concentration and solution flow rate, which determines the width of the
boundary layer.
Chapter 2: Factors affecting fouling & cleaning of a deposit removed by fluid mechanics
41
Cleaning studies have been performed on a number of different deposits, most notably dairy
products as a dairy processing plant is significantly affected by cleaning downtime. Much
work has been done with dairy products where visualisation has shown a non-uniform nature
of removal. The stages are:
Swelling
erosion – uniform removal of deposit by shear stress forces and diffusion
decay – swollen deposit is thick and no longer uniform so that removal of isolated
islands occurs by shear stress and mass transport. Ab Aziz (2007).
2.13. Temperature
Temperature has a key impact on the speed and ease of cleaning. Increasing temperature
increases the energy in a system so that the action of the fluid increases and becomes more
effective and cleaning reactions will be faster. Gillham et al (1999) found that the chemical
removal of whey protein deposits from stainless steel pipes was strongly dependent on
temperature. However, if the deposit chemically alters with heat treatment, heating the fouled
surface could increase fouling known as burn-on.
2.14. Cleaning studies
Cleaning behaviour has been studied at the University of Cambridge [Chew et al (2004)]
using Fluid Dynamic Gauging. This measures the thickness of soft solid layers on a surface.
The coated surface was immersed in water and a nozzle was brought close to the surface. A
suction pressure differential was applied so that liquid was drawn into the nozzle. The
position of the nozzle was known to micron accuracy so measurement of the flow rate yields
the location of the surface. The technique determined the strength and deformation behaviour
of soft-solid fouling layers on hard surfaces immersed in liquid [Hooper et al (2006)]. The
results of this technique were compared to the results from the micromanipulation rig
discussed in Section 2.2 developed by Liu et al (2002). The two techniques showed a
significant and quantifiable effect of baking time and hydration time on removal behaviour for
the paste. Hooper et al (2006) reported that tomato paste deposit was baked for 60 min and
that the deposit strength decreased with hydration time, rapidly over the first 30 min period
and then slowly thereafter and was observed in both techniques. Liu et al (2006) found tomato
Chapter 2: Factors affecting fouling & cleaning of a deposit removed by fluid mechanics
42
paste had strong deposit-deposit bonds and so removal was more likely to occur in chunks as
surface-deposit adhesion failed.
Studies reported by Fryer et al (2006) on the micromanipulation rig were complementary to
that of the flat plate flow rig described in Section 2.4. This was a horizontal duct where a
coupon coated with foulant was placed flush with the surface of the duct and the foulant
material protrudes into the flow stream. Cleaning fluid of known velocity and temperature
were passed over the foulant until the deposit was removed. The deposits which have been
investigated on the flat plate flow rig are tomato paste [Liu et al (2002)], whey protein [Liu et
al (2006)] and egg albumin [Liu et al (2007)]. The removal method is highly dependent on
the type of deposit. Fryer et al (2006) reported that the removal method of different soils from
a laboratory cleaning rig occurred via several mechanisms:
removal of tomato paste all at once, when hydrated
removal in chunks where the strength of deposit-deposit bonds or deposit-surface
bonds was important.
Liu et al (2006) studied the effect of chemical and flow on whey proteins and found that the
chemical diffusion into the deposit was rate determining but that increasing the fluid flow
once the deposit was saturated with chemical increased the likelihood of removal of the
deposit through mechanical action.
Mechanical studies by Bird and Fryer (1991) showed that the different phases in a deposits
removal can be affected differently by flow rates. Some removal phases increase with
increasing flow rate, others are unaffected. It has been found that an increase in flow rate and
hence the Reynolds number led to quicker removal of most deposits. Timperley and
Smeulders (1988) observed that the cleaning time of a plate heat exchanger (PHE) decreased
with increased flow rate from 0.2 m s-1
to 1.5 m s-1
. Christian (2003) stated that increased
flow rates produce greater shear stress on the deposit. The boundary layer reduced as the flow
speed increased, and hence at higher speed, De Goederen et al (1989) found that more deposit
was left protruding into the turbulent flow, thus the deposit was removed with greater ease.

Chapter 2: Factors affecting fouling & cleaning of a deposit removed by fluid mechanics
43
Once a surface was exposed to fluid flow the mechanical effects of the flow can assist in
further deposit removal. Klavenes et al (2002) have used a radial flow cell, which measured a
range of shear stresses that were used to measure adhesion. Removal of a deposit from a
surface was also effected by the surface condition. Surface hydration and steric hinderance
prevented the close approach of particles and surface and acted to reduce adhesion
investigated by Visser (1995) and studies have been conducted on the effects of surface-
foulant interactions. Bott (1995) reported that the principle forces that cause adhesion between
surface and foulant are Van der Waals forces, electrostatic forces, hydrogen-bonding and
hydrophobic bonding. Liu et al (2002) found that reducing the adhesive force strength,
between a surface and a deposit aids cleaning. Akhtar et al (2010) compared toothpaste,
Sweet Condensed Milk (SCM), caramel and turkish delight removal from glass, stainless steel
and PTFE substrate using Atomic Force Microscopy (AFM). It was found that toothpaste had
the smallest adhesive forces, being less than 0.005 N m-1
, compared with the caramel which
had adhesive forces with glass of 0.4 N m-1
.
2.15. Pilot – scale studies
In many plants, tanks hold tonnes of material and pipes will be much larger than the 10 -
25 mm generally found in lab scale equipment. As such, it is important to study the cleaning
of realistic size plant items. As discussed by Akhtar et al (2010) many experiments on
cleaning use low flow rates and scale-up calculations are challenging. Work has been done at
pilot scale by Lelièvre et al, (2002) who used a 46 mm Internal Diameter (ID) pipe system to
study the removal of bacteria. The rig was divided into two parts – a soiling circuit and a CIP
line. There were two flow conditions used to generate fouling;
Static fouling – pipes were vertically filled with the soiling suspension;
Turbulent fouling – contaminated milk was re-circulated at 1.8 m s-1
, Re = 12,900.
To allow effective cleaning at this scale, flow-rates must be increased from their laboratory
counter-parts. A specially developed pilot plant was produced by the ZEAL consortium and is
used in this work and presented in Section 3.6.2. This enables the removal mechanisms of
viscous material to be assessed on production scale equipment.
Chapter 2: Factors affecting fouling & cleaning of a deposit removed by fluid mechanics
44
2.16. Pilot scale – measurements
CIP is used in closed production equipment as discussed in Chapter 1. Cleaning regimes are
often automated and so the cleaning process is established when the plant is commissioned
and then may receive limited attention after this time. These regimes are seldom optimal.
Without understanding the evidence from measurement, they are difficult to alter. In cleaning
processes it would be very beneficial to have an effective and accurate end–point detection
measurement which is representative of the whole system. This would enable cleaning of a
system to happen in an optimal way, removing under or over cleaning due to following a set
recipe which ignores day to day variation in the foulant. Currently, there is not a suitable
clean/not clean measurement as discussed in Section 1.13.
In process measurements one of the recurring issues is solution versus surface measurement.
Solution measurements such as conductivity and turbidity give a good understanding of what
is going on in the bulk of the material, but may not be representative of product fouling which
is caught in dead zones, or adhered to equipment walls. In a fouled heat exchanger, the foulant
material may be present in high quantities on the surface wall and as such would not be
monitored by solution measurements. However, it would still pose a significant cross
contamination risk. Surface measurements give insight into what is happening at equipment
walls, and can give dedicated information on worse case areas. However, they can only give
reliable information on the specific area where they are located. On-line probes and sensors
need to be robust and economical to stand up to the rigours of a manufacturing environment.
Sensors and probes by their inclusion disturb and alter the environment which they are
monitoring. The instrumentation must be appropriately calibrated and maintained and this
may require removal from the system for maintenance, which must be practical. In a food
environment hygienic fittings must be used which are proven to be cleanable. However,
disturbances will still arise. Also, the sensors may have different properties from the system it
is measuring, for instance, in solids manufacturing unit an instrument may cause electrostatic
build up of powders on the instrument
Measurement instrumentation must be appropriately sensitive to be able to track small
changes in the material on short time scales. In FMCG manufacture, a material may only

Chapter 2: Factors affecting fouling & cleaning of a deposit removed by fluid mechanics
45
undergo a particular process for seconds or minutes and so to gain meaningful information,
data capture must be possible on this time frame.
Van Asselt et al (2002) discussed CIP inefficiencies due to insufficient monitoring and
studied dairy cleaning processes with conductivity, turbidity, flow and temperature and
off-line product analysis methods. Conventionally CIP systems are set to fixed values of time,
flow, temperature and conductivity rather than employing feedback control. Appropriate
instrumentation can give assurance that the clean occurred successfully and as planned.
Typically, a CIP process will be monitored by:
Flow-meters, to ensure that the defined amount of water reaches the system
Thermocouples, to ensure that the defined temperature of chemical or cleaning fluid is
reached
Time, to ensure that each stage occurs for the defined amount of time
Conductivity probes, to track the chemical concentration and potentially the material
to be removed
Off-line analysis, i.e., microbial swabs and in the case of toothpaste, ion
chromatography swabs to test for remaining fluoride.
The advantage of a well understood cleaning process is that it is possible to increase its
efficiency to use the least time, water and/or energy and have confidence that the plant is
clean.
2.17. Summary
Fouling and cleaning should be considered together. In this work, toothpaste will be used as
the model deposit, and the material properties examined. Its cleaning behaviour will then be
studied, and used as a model soil for fluid mechanical removal. The toothpaste will be cleaned
using CIP techniques which were discussed in Chapter 1.
The methods used in this work for gaining understanding about the toothpaste deposit are
introduced in this chapter. These include infrared spectroscopy, which is used to gain insight
into the inter-structural forces. The results of the IR spectroscopy study are reported in
Section 3.2. Micromanipulation will be used to measure the adhesive forces between a surface
and the deposit. The lower the adhesion force, the easier it is to remove the deposit from the

Chapter 2: Factors affecting fouling & cleaning of a deposit removed by fluid mechanics
46
surface. Micromanipulation is also used to measure the cohesive forces within the deposit
structure. If the deposit-deposit cohesive force is high then the deposit is strongly bound to
itself. The ratio of these forces gives some insight into how the deposit might be removed.
The cohesive force in baked tomato paste is high and it removes in chunks. Rheology was
introduced as the technique used most often to examine flow behaviour in bulk materials.
Toothpaste is known to have an apparent yield stress, which means that a certain amount of
force must be overcome before the material can flow. Toothpaste is also known to be shear
thinning which means that its structure breaks down with shear. These properties can be fitted
to established rheological models, if these model fits are good then the toothpaste behaviour is
more predictable. The results of micromanipulation and rheological studies are reported in
Chapter 4, and the results compared with cleaning studies.
The factors associated with cleaning are discussed in this chapter. Initially the flat plate
cleaning rig was introduced; the principles of this rig have been developed and detailed in
Section 2.4. The adapted version used in this work is referred to as the Coupon Rig as
described in Section 3.5.2. This work focuses on fluid mechanical cleaning and so the fluid
effects which can be used to aid cleaning were discussed in this chapter. Chemical and
mechanical cleaning are generally both used to produce efficient cleaning and many studies
have been undertaken to establish cleaning mechanisms as reported in Section 2.12.
Temperature is known to have an impact on cleaning as reported in Section 2.13, and is
altered in the cleaning studies reported in Chapter 4 and Chapter 5. Cleaning studies have
been undertaken on a variety of deposits at laboratory scale and these will be compared to the
toothpaste results in Chapter 4. In Chapter 5, the focus will be on pilot-scale studies and
online measurements as discussed in Section 2.15 and Section 2.16. The specific details of the
equipment and instrumentation set-up are presented in Chapter 3. In Chapter 6, comparison
between the laboratory scale work and the pilot scale work will be presented.

Chapter 3: Materials and Methods
47
CHAPTER 3: MATERIALS AND
METHODS
As discussed in the previous chapters, the aim of this work is to study the removal of
toothpaste from cleaning rigs in order to develop understanding of cleaning behaviour and
develop improved cleaning methods that reduce waste. It is important to understand the
properties of the fouling deposit and relate this to the cleaning behaviour. The bulk properties
of toothpaste have been evaluated by several methods:
Infrared (IR) spectroscopy has been used to gain knowledge about the chemical
components of the toothpaste material, and to understand some of the dominant
chemical bonds which may be significant in the fouling behaviour to help. The results
are discussed in Section 3.2.
Rheology studies have been done to assess the behaviour of toothpaste at various
dilutions, which is likely to be significant in the cleaning experiments; the results are
reported in Section 3.3 and Section 4.10. The ability of the toothpaste to reform its
structure is explored. This is useful so it is possible to understand whether the
material will be significantly different due to applied shear from fluid flow or whether
the toothpaste will reform and maintain its structure, if this property is significant this
will influence the removal profile. A series of rheological experiments have been
conducted:
o Flow sweep experiments:
To assess the effects on the toothpaste viscosity due to applied shear
rate.
To assess the apparent yield stress of the toothpaste.
To allow rheological models to be fitted to the toothpaste behaviour.
To assess the reformation characteristics of the paste.
To examine the effect of different dilutions on the paste behaviour.

Chapter 3: Materials and Methods
48
o Temperature ramp experiments have been conducted to find out how the
toothpaste behaves at different temperatures.
o Strain sweep and frequency sweep experiments have been conducted to
determine the viscoelastic properties of the materials.
Micromanipulation studies have been performed and the force of cohesion between
the toothpaste at different cut heights through the toothpaste deposit relative to the
surface has been measured. The force of adhesion between the paste and the surface
has been evaluated by removing the toothpaste from the surface at a point as close to
the surface as possible without damaging the equipment. The purpose of these
experiments was to understand the cohesive and adhesive nature of the deposit
material and then compare these to cleaning studies to evaluate if these forces
influence removal behaviour. This comparison is reported in Section 4.8.
At laboratory scale, the cleaning of toothpaste has been performed on coupons coated with an
even layer of toothpaste positioned inside a horizontal duct such that the toothpaste protrudes
into the fluid flow. Measurement of the cleaning process has been undertaken by observation
and image analysis and using a heat flux sensor to monitor the change in local heat transfer
coefficient as the insulating deposit layer was removed. The equipment, set-up and
experimental procedures for all the techniques used in this thesis will be reported in this
chapter, with the results of these studies presented in the subsequent chapters.
A study was undertaken using circular coupons on the flat plate flow cell described in Ab
Aziz (2007), the set-up is described in Section 3.5.1, to allow comparison with previous
works, the results reported in Section 4.5. A modified cleaning rig, described in Section 3.5.2
has been used for the laboratory scale studies reported in this thesis in Chapter 4.
The pilot scale studies were performed both on the Pipe Rig (based at GSK) and on the ZEAL
Pilot Plant (based at University of Birmingham). The Pipe Rig was used to investigate low
flow cleaning regimes and the set-up is described in Section 3.6.1 and some of the results of
these studies are presented in Section 5.7.1. The ZEAL Pilot Plant was specially developed by
the ZEAL consortium to investigate cleaning under industrially comparable conditions,

Chapter 3: Materials and Methods
49
presented in Section 3.6.2 with velocities between 1 m s-1
and 3 m s-1
achievable for a
diameter 47.7 mm system. In addition, experimentation on pipe lengths up to 5 m and
diameters up to 101.6 mm is possible. A full investigation on pipe-line of varying lengths and
diameters using toothpaste selected as the model paste, have been performed and the results
are reported in Chapter 5.
3.1. Material characterisation - toothpaste
Toothpaste was supplied by GSK (Brentford, UK), a model toothpaste was selected for the
majority of the experiments reported in this thesis, termed Paste T. This contained the base
ingredients used in most of the GSK toothpastes and so the findings have the largest scope for
application. The GSK pastes are typically based on a silica system, as discussed in
Section 1.4. In addition, other toothpastes were investigated, these are termed Paste T, Paste
D, Paste N, Paste A, Paste R, Paste C, Paste F, Paste I, Paste S and Paste U in this thesis to
maintain confidentiality, more detail is given in the confidential Appendix 9. These pastes
were investigated at laboratory scale, by rheology, micromanipulation and on the cleaning rig
and the results are reported in Section 4.7. Paste D was compared with Paste T at pilot scale;
this is reported in Section 5.7.3.
3.2. Structural characterisation - infrared spectroscopy
IR measurement theory was presented in Section 2.1. Solution samples and surfaces coated
with diluted toothpaste solution were tested by mid-IR and near-IR spectroscopy.
Sample preparation for infrared solutions: Toothpaste (10 g) was diluted to make up a 100 ml
solution with water and agitated. Serial dilution occurred using a 10% solution (10 ml) which
was diluted with water (90 ml) and the method repeated to make up the more dilute solutions
until the final dilution of 10 ppm was produced. Efforts to minimise errors associated with
this technique were made. As the toothpaste is a particulate suspension and does not fully
dissolve, the solutions were agitated and measurement taken promptly after placing the
sample on the instruments.
Sample preparation for infrared surface measurements: Circular surfaces of 316L stainless
steel (diameter 22 mm) were weighed. They were then placed in a convection oven

Chapter 3: Materials and Methods
50
(temperature 80-85°C) and the diluted solutions of toothpaste (~1 ml) slowly added by pipette
so that the liquid covered the surface but did not overspill. The discs were then dried in the
oven (1-2 hours). After drying, the discs were left to cool and reweighed. Due to the
restrictions of the technique it was assumed that an even surface coverage resulted.
Infrared spectrometers: Samples were tested using:
Bruker Golden Gate (MIR) operating in the wavenumber region 500-1400 cm-1
.
Background measurements for solution and surface measurements were taken in air.
o a few drops of solution were applied so that the diamond mounted surface was
covered
o the surface was positioned sample side down onto the diamond sensor and
secured
Matrix F Duplex (NIR) operating in the region 1000 – 4000 cm-1
o sufficient solution was transferred by pipette onto the 25 mm2 area to ensure
full coverage, and the sensor arm moved around to block out light.
o the prepared surface was positioned on top of the sensor
The IR experiments were performed and data collected and subsequently analysed using the
OPUS 5.5 software. A background measurement of air was taken before collecting spectra
and prior work done to achieve the best gain settings and the most appropriate time intervals
between data points.
Mid- infrared spectroscopy: Figure 3.1 shows mid-infrared spectra for „pure‟ toothpaste
(Paste N), and deionised water. The water spectrum has a smooth curve with characteristic
water peaks occurring at: 3305 cm-1
, 2121 cm-1
, 1636 cm-1
, 560 cm-1
.

Chapter 3: Materials and Methods
51
Figure 3.1: Mid IR spectra for neat Paste N product and water, showing that water has peaks which occur in the
toothpaste, but that toothpaste has additional peaks in the wavenumber range 1500 cm-1
to 800 cm-1
.
Peaks are observed in the toothpaste spectra and are attributed to water [3331, 1636,
582 cm-1
], the calcium carbonate shift [1397, 1348 cm-1
], carbon dioxide [2360, 2341 cm-1
]
and the silicon components. The literature related to IR peaks of toothpaste ingredients is
reported in Appendix 2. The peak at 2927 cm-1
is attributed to the SiO2 – symmetric CH
stretch. The Si-O-Si linkage present in organic siloxane or silicon [1078, 1042, 1036 cm-1
] is
discussed by Casarin et al (2005) and Coates (2006). There is the presence of Si-O-Si bridges
[1206 cm-1
] and the Si-O-Si bridge indicates the presence of a weak gel, the criteria for which
is discussed in Almeida et al (1990).
Mid infrared spectra – surfaces: Figure 3.2 shows the mid-IR spectra for clean stainless steel
surfaces and surfaces coated with neat toothpaste and toothpaste dilutions.
33
31
.26
33
05
.09
29
27
.73
23
60
.37
23
41
.16
21
21
.03
16
36
.54
13
97
.32
13
48
.37
12
06
.62
10
78
.03
10
42
.40
10
36
.16
58
2.5
65
60
.58
100015002000250030003500
Wavenumber cm-1
0.0
0.2
0.4
0.6
0.8
1.0
1.2
1.4
Ab
so
rba
nce
Un
its
C:\Documents and Settings\pac50632\My Documents\Bruker Analysis\Toothpaste\Sensodyne\SEnsodyne mid atr\PC_SENSODYNE_100%.006/09/2007 10:23:07
Page 1 of 1
Water
Toothpaste
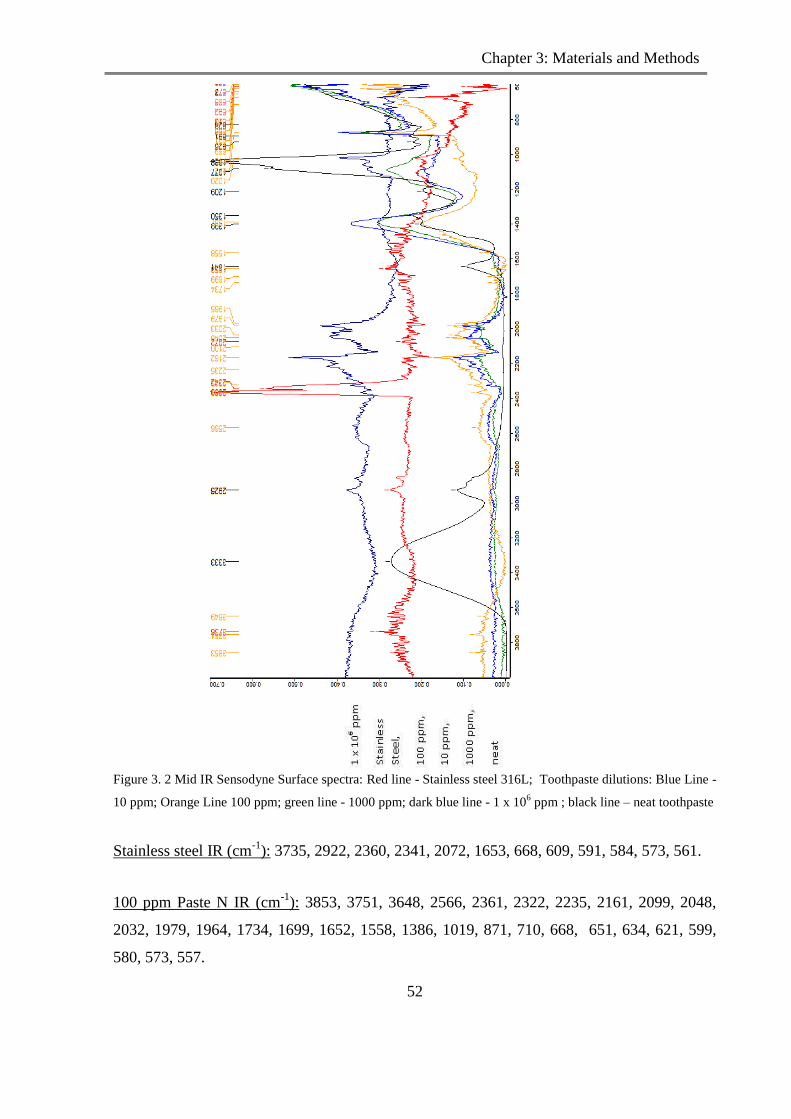
Chapter 3: Materials and Methods
52
Figure 3. 2 Mid IR Sensodyne Surface spectra: Red line - Stainless steel 316L; Toothpaste dilutions: Blue Line -
10 ppm; Orange Line 100 ppm; green line - 1000 ppm; dark blue line - 1 x 10⁶ ppm ; black line – neat toothpaste
Stainless steel IR (cm-1
): 3735, 2922, 2360, 2341, 2072, 1653, 668, 609, 591, 584, 573, 561.
100 ppm Paste N IR (cm-1
): 3853, 3751, 3648, 2566, 2361, 2322, 2235, 2161, 2099, 2048,
2032, 1979, 1964, 1734, 1699, 1652, 1558, 1386, 1019, 871, 710, 668, 651, 634, 621, 599,
580, 573, 557.

Chapter 3: Materials and Methods
53
neat Paste N IR (cm-1
): 3333, 2925, 1641, 1399, 1350, 1208, 1076, 1038, 926, 891, 828, 577,
566.
Figure 3.2 compares surfaces coated with different dilutions of toothpaste deposit. The neat
toothpaste spectrum retains the features observed in the solution experiments. This is due to
the IR beam not penetrating through the thick toothpaste sample (2 mm) to the stainless steel.
The surface results show differences in the spectral response between the stainless steel and
the highly diluted toothpaste species, demonstrating that under ideal laboratory conditions, the
measurement is capable of distinguishing a clean surface and a surface with low levels of
toothpaste residue 100 ppm. A peak in the 2566 cm-1
region, is only observed in the surfaces
measurements prepared with toothpaste residue and is not present in the pure toothpaste
sample or stainless steel sample. This response is attributed to a bond formed between the
toothpaste and the surface.
3.3. Structural characterisation - rheology
Rheology studies with toothpaste were performed on the TA AR-100 parallel plate oscillatory
rheometer. Parallel plate (40 mm diameter steel plate) geometry was used due to the presence
of particles of 0.5 m diameter in the pastes, which could have got caught under the tip of the
cone in a cone–and-plate system. Toothpaste was placed on the static plate after mapping the
geometry and setting the zero gap. Stainless steel plates were used to allow comparison with
the cleaning rigs, additionally they are robust and compatible with all the samples at all the
temperatures of interest. The geometry was lowered using the computer controls such that the
toothpaste squeezed out slightly but not so much that it rose up onto the upper plate.
Shear stress versus shear rate experiments: Flow ramp experiments were performed on
toothpaste by decreasing the shear rate from 100 s-1
to 0 s-1
.

Chapter 3: Materials and Methods
54
Figure 3.3: Rheology study: Shear rate is ramped between 100 and 0 s-1
and the viscosity and shear stress
response recorded for Paste T.
Figure 3.3 shows the response of a shear rate ramp from 100 s-1
to 0 s-1
as a function of shear
stress and viscosity. The toothpaste rheology shows an inherent shear stress at the zero shear
condition of ~ 1200 Pa s. This indicates „an apparent yield stress‟ behaviour as discussed in
Section 2.3.1. The viscosity decreases with applied shear, demonstrating that the sample is
shear thinning.
Dilutions: This flow sweep process was repeated with varying paste dilutions, the results are
shown in Figure 3.4. Through the process of cleaning, water will come into contact with the
paste and any resulting dilution effect can be assessed.
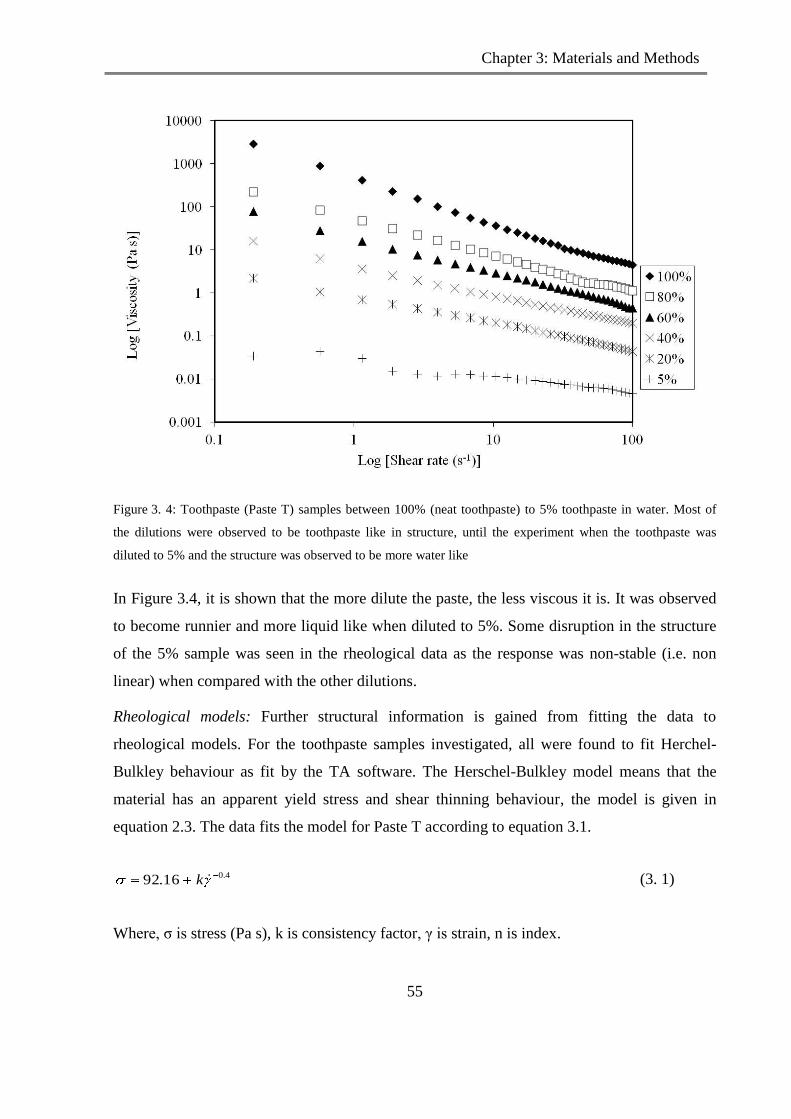
Chapter 3: Materials and Methods
55
Figure 3. 4: Toothpaste (Paste T) samples between 100% (neat toothpaste) to 5% toothpaste in water. Most of
the dilutions were observed to be toothpaste like in structure, until the experiment when the toothpaste was
diluted to 5% and the structure was observed to be more water like
In Figure 3.4, it is shown that the more dilute the paste, the less viscous it is. It was observed
to become runnier and more liquid like when diluted to 5%. Some disruption in the structure
of the 5% sample was seen in the rheological data as the response was non-stable (i.e. non
linear) when compared with the other dilutions.
Rheological models: Further structural information is gained from fitting the data to
rheological models. For the toothpaste samples investigated, all were found to fit Herchel-
Bulkley behaviour as fit by the TA software. The Herschel-Bulkley model means that the
material has an apparent yield stress and shear thinning behaviour, the model is given in
equation 2.3. The data fits the model for Paste T according to equation 3.1.
4.016.92 k (3. 1)
Where, σ is stress (Pa s), k is consistency factor, γ is strain, n is index.
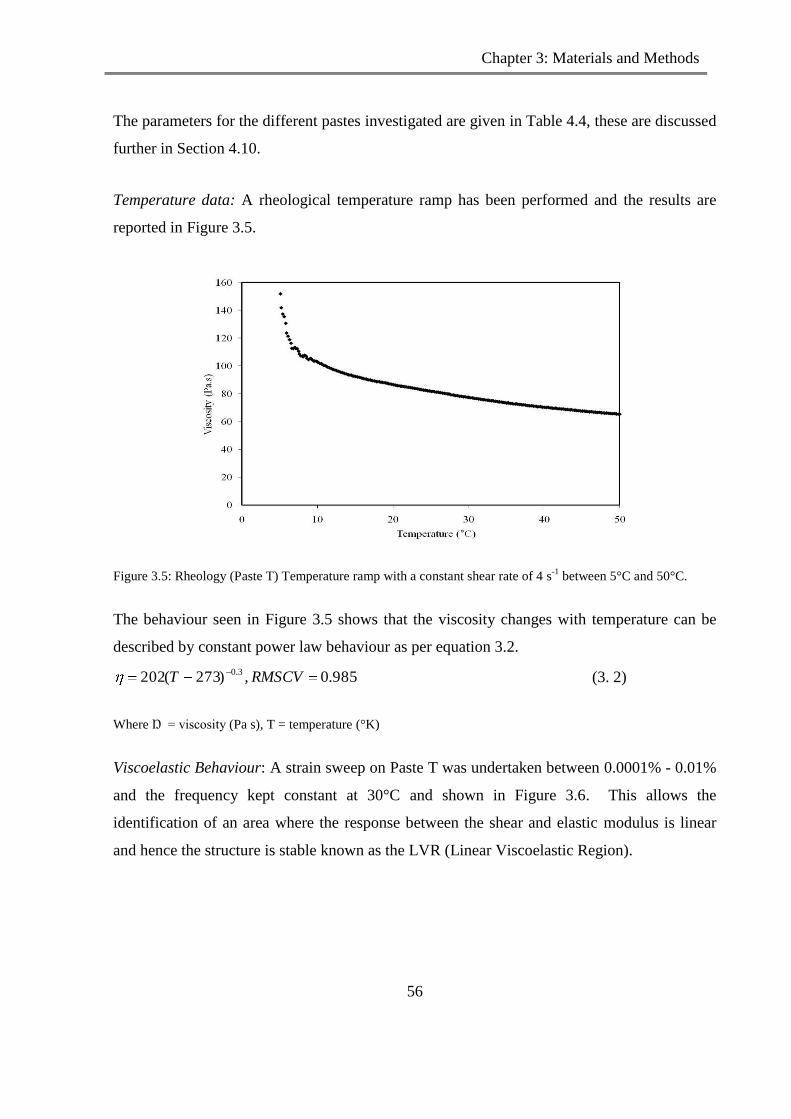
Chapter 3: Materials and Methods
56
The parameters for the different pastes investigated are given in Table 4.4, these are discussed
further in Section 4.10.
Temperature data: A rheological temperature ramp has been performed and the results are
reported in Figure 3.5.
Figure 3.5: Rheology (Paste T) Temperature ramp with a constant shear rate of 4 s-1
between 5°C and 50°C.
The behaviour seen in Figure 3.5 shows that the viscosity changes with temperature can be
described by constant power law behaviour as per equation 3.2.
985.0,)273(202 3.0 RMSCVT (3. 2)
Where Ŋ = viscosity (Pa s), T = temperature (°K)
Viscoelastic Behaviour: A strain sweep on Paste T was undertaken between 0.0001% - 0.01%
and the frequency kept constant at 30°C and shown in Figure 3.6. This allows the
identification of an area where the response between the shear and elastic modulus is linear
and hence the structure is stable known as the LVR (Linear Viscoelastic Region).

Chapter 3: Materials and Methods
57
Figure 3.6: Rheological Strain sweep on Paste T to identify the Linear viscoelastic region (LVR), G‟ (shear
elastic modulus or storage modulus) G‟‟ (viscous or loss modulus). The Oscillatory stress was selected as
2.141 Pa for the frequency sweep.
A frequency sweep was performed between 0.1 – 100Hz on the toothpaste, in the region
identified as the LVR, results given in Figure 3.7.
Figure 3.7: Rheology - Elastic and Viscous Modulus (Pa) of Paste T, determined by a frequency sweep (0.1 Hz
to 100Hz) in the LVR region.
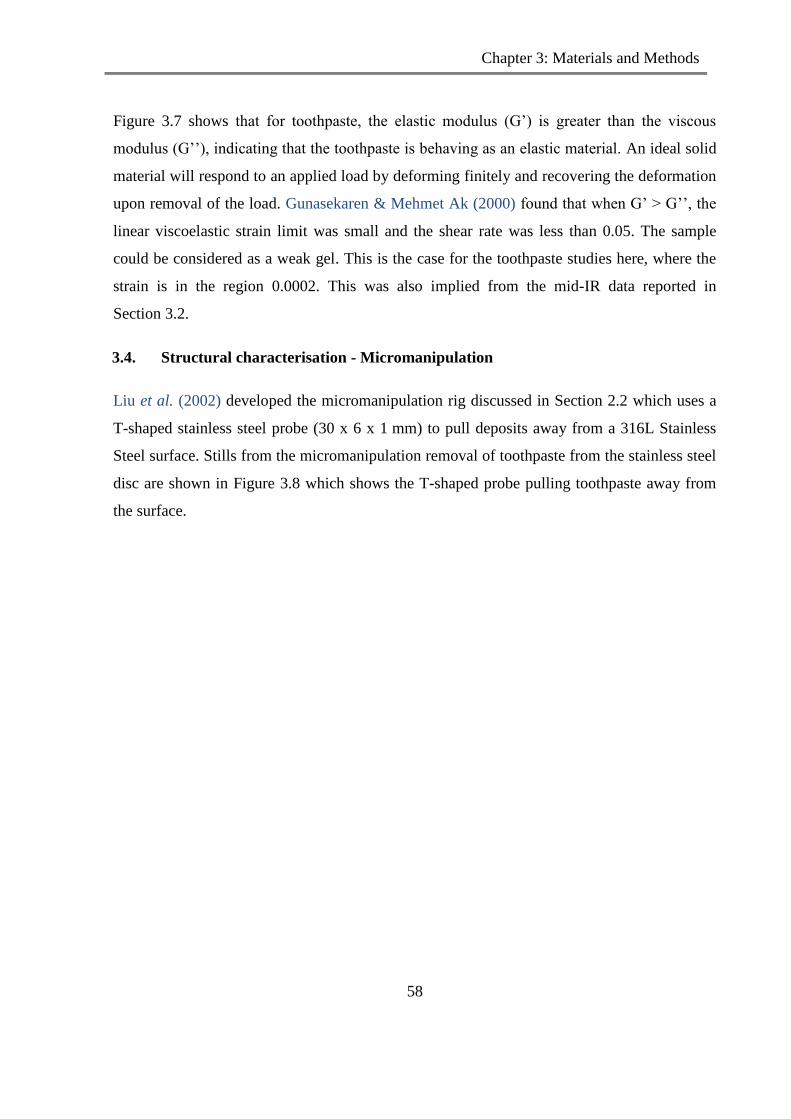
Chapter 3: Materials and Methods
58
Figure 3.7 shows that for toothpaste, the elastic modulus (G‟) is greater than the viscous
modulus (G‟‟), indicating that the toothpaste is behaving as an elastic material. An ideal solid
material will respond to an applied load by deforming finitely and recovering the deformation
upon removal of the load. Gunasekaren & Mehmet Ak (2000) found that when G‟ > G‟‟, the
linear viscoelastic strain limit was small and the shear rate was less than 0.05. The sample
could be considered as a weak gel. This is the case for the toothpaste studies here, where the
strain is in the region 0.0002. This was also implied from the mid-IR data reported in
Section 3.2.
3.4. Structural characterisation - Micromanipulation
Liu et al. (2002) developed the micromanipulation rig discussed in Section 2.2 which uses a
T-shaped stainless steel probe (30 x 6 x 1 mm) to pull deposits away from a 316L Stainless
Steel surface. Stills from the micromanipulation removal of toothpaste from the stainless steel
disc are shown in Figure 3.8 which shows the T-shaped probe pulling toothpaste away from
the surface.

Chapter 3: Materials and Methods
59
a) Initially soiled substrate b) Soil removal – interim stage
c) Soil removal – final stage d) Fully cleaned substrate.
Figure 3. 8: Removal of toothpaste soil from a stainless steel substrate using the micromanipulation rig, images
from Liu (unpublished works).
The measured voltage from the force transducer for a typical micromanipulation experiment
is converted to force via load cell calibration (see Appendix 3).
Experimental procedure: Studies were performed at different cut-heights with different pastes
to assess the cohesive and adhesive properties of the pastes. Samples were prepared by
coating the surface with toothpaste, then using the micromanipulator to cut the toothpaste
height to 2 mm above the surface level. The sample was then weighed. The samples were
tested by pulling the probe across the paste surface at cut heights of 1 mm, 0.8 mm, 0.6 mm,
0.4 mm, 0.2 mm and 0.1 mm and re-weighed. The experiments were repeated at each
condition at least three times and the results reported in Section 4.8. Some limited work has
been done on hydrated samples which were placed on a cloth and lowered into water of
different temperatures and for different durations and then removed from the water and placed
on the micromanipulation for testing. The resulting force time curve is measured.
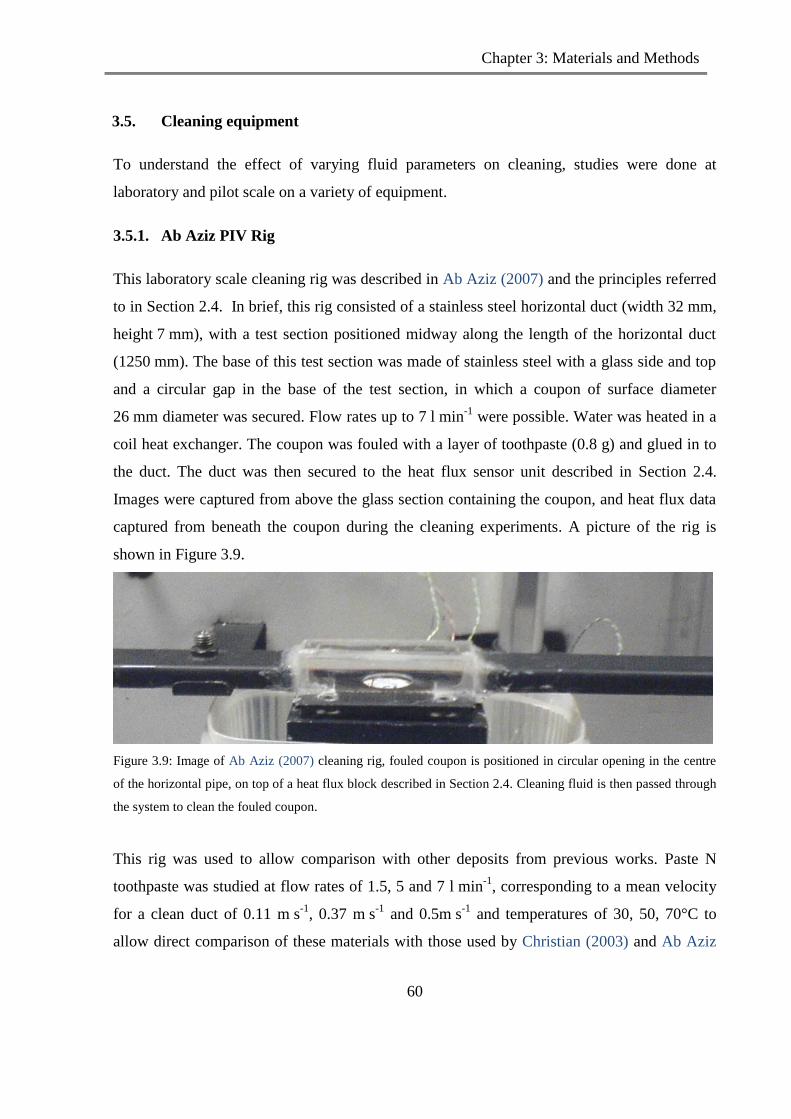
Chapter 3: Materials and Methods
60
3.5. Cleaning equipment
To understand the effect of varying fluid parameters on cleaning, studies were done at
laboratory and pilot scale on a variety of equipment.
3.5.1. Ab Aziz PIV Rig
This laboratory scale cleaning rig was described in Ab Aziz (2007) and the principles referred
to in Section 2.4. In brief, this rig consisted of a stainless steel horizontal duct (width 32 mm,
height 7 mm), with a test section positioned midway along the length of the horizontal duct
(1250 mm). The base of this test section was made of stainless steel with a glass side and top
and a circular gap in the base of the test section, in which a coupon of surface diameter
26 mm diameter was secured. Flow rates up to 7 l min-1
were possible. Water was heated in a
coil heat exchanger. The coupon was fouled with a layer of toothpaste (0.8 g) and glued in to
the duct. The duct was then secured to the heat flux sensor unit described in Section 2.4.
Images were captured from above the glass section containing the coupon, and heat flux data
captured from beneath the coupon during the cleaning experiments. A picture of the rig is
shown in Figure 3.9.
Figure 3.9: Image of Ab Aziz (2007) cleaning rig, fouled coupon is positioned in circular opening in the centre
of the horizontal pipe, on top of a heat flux block described in Section 2.4. Cleaning fluid is then passed through
the system to clean the fouled coupon.
This rig was used to allow comparison with other deposits from previous works. Paste N
toothpaste was studied at flow rates of 1.5, 5 and 7 l min-1
, corresponding to a mean velocity
for a clean duct of 0.11 m s-1
, 0.37 m s-1
and 0.5m s-1
and temperatures of 30, 50, 70°C to
allow direct comparison of these materials with those used by Christian (2003) and Ab Aziz

Chapter 3: Materials and Methods
61
(2007), and allow the study of different cleaning mechanisms from circular vs. square
coupons to be captured.
3.5.2. Coupon Rig
This set-up is referred to as the Coupon Rig in this thesis. This rig is based on the principle of
the previous horizontal ducts used in cleaning studies at the University of Birmingham [Ab
Aziz (2007), Christian (2003)]. The horizontal duct (15 mm x 35 mm z 140 mm) has a
hydraulic diameter as defined in equation 3.3.
dh = 4 A / p , dh = 0.021 m (3.3)
where dh = hydraulic diameter (m), A = area section of the duct (0.000525 m2), p = wetted perimeter of the duct (0.1 m)
This equipment was however designed to be more flexible than the previous rigs, enabling
different size square or rectangular base coupons (normal size coupons 0.025 m, large
different surface coupons, 0.035 m) to be used. The base is removable to enable ease of
cleaning for the glass section and avoid the need to invert the equipment to glue in the
coupons. This redeveloped rig allowed side imaging. The schematic of this rig is shown in
Figure 3.10.

Chapter 3: Materials and Methods
62
DrainV7
Chemical
solution
tank
Water
tank
Temperature
controller
Pump
V1V3
Test section with fouled
coupon in place.
Tc4Tc5
Tc6
C
Signal conditioning unit
PC,
Labview
V2V4
V5
V6
Flow
meter
Heating tank with three
3kW heaters
Mixer
1
Tc1
Camera
Tc2 Tc3
MHFS
Copper stub with Tc2,
Tc3 and MHFS in place
Figure 3. 10: Schematic of the new cleaning rig, known as the Coupon Rig in this work (diagram from Goode et
al., (2010)), a coupon with foulant on is secured into the base of a horizontal duct in a glass section which allows
observation from above and side, the coupon is positioned above a heat flux sensor allowing the removal of the
foulant from the coupon to be monitored. The duct is attached to a heat exchanger reservoir and pump and these
are used to supply cleaning fluid to the cleaning rig.
The rig was developed by Dr. Konstantia Asteriadou, University of Birmingham, with
workshop assistance from Unilever HPC and the workshop at the University of Birmingham.
The coupon rig comprised of a heating tank, a centrifugal pump, a flow transmitter PD 340,
rectangular flow channel with test section, a conductivity and temperature meter at the return
(LMIT08), thermocouples and data logger system. The test section held the fouled stainless
steel coupon, (1.3 g toothpaste) which sat upon the heat flux sensor unit. It was surrounded
by a clear quartz type glass to allow observation of cleaning from both top and side view.
Readings from thermocouples and MHFS (Micro Heat Foil Sensor) are collected by a signal
conditional unit (SC-2345) and fed into Labview (NI 4.4.1) software on a standard P.C.
Chapter 3: Materials and Methods
63
Cleaning progress is characterised by the increase in heat transfer coefficient (U) as the
insulating deposit layer is removed, until the value is similar to that of a clean surface. The
calculations for heat transfer coefficient are given in Section 2.4 and presented by Christian
(2003). The camera used was a Canon EOS 30D, which was manually focussed, with the
flash turned off, and positioned on a tripod stand. The time intervals were set with a timer
unit. The experimental protocol is given in Appendix 4. The cleaning rig experiments were
monitored by sequential images which were then analysed using the software Image J. This
translated to a measurement profile which had a high initial value corresponding to a fully
fouled surface, which then reduced over time until a clean surface is achieved. A typical
profile is presented in Section 4. 2.
Experimental program (Coupon Rigs):
Square coupon system using Paste T, (surface L, 1.30 g ± 0.06 g) at temperatures
(20°C, 40°C and 50°C) and velocities (0.25 m s-1
, 0.37 m s-1
, 0.5 m s-1
), velocities
based on a clean duct
Different pastes were investigated using surface L, at temperature 40°C, and velocity
0.37 m s-1
based on a clean system, where the coupon was coated with 1.30 g ± 0.06 g
of paste, which was placed on the coupon as evenly as possible. This was to allow
comparison between pastes.
Different surfaces: stainless steel, glass, acrylic and PTFE, (0.025 m and 0.035 m
square) as well as different levels of surface finish for the stainless steel (coupon size),
have been investigated at cleaning conditions of 40°C, and 0.25 m s-1
(based on the
velocity of a clean tube).
Additionally the Coupon Rig was adapted to fit a 1 m section of 23.9 mm diameter
pipe. This was connected by triclamps in the place where the normal horizontal duct
section was fitted. The line was converted for the Kemtrac turbidity meter by
including expanders and reducers to the pipe line to allow the 47.7 mm diameter meter
to be added via some flexible tubing and triclamp fittings. This was to allow a „scale-
up‟ set-up with the laboratory equipment parameters which could be compared with
results on the pilot plant.

Chapter 3: Materials and Methods
64
Surface properties for Coupon Rig study:
For the small surface study conducted on the Coupon Rig. The stainless steel coupons, A-E,
were all the same size (25 mm square) and coated with 1.30 g ± 0.06 g of Paste T, for the
different types of surfaces, the surfaces were 35mm square with a surface coating of 2.3 g ±
0.06 g. This resulted in the same surface covering per area for both coupon sizes (deposition
mass 0.002 g mm2)). The surfaces have been characterised by surface roughness
measurements and indicative values of contact angles gained from work by Ahktar (2010).
The surface roughness measurements were performed by Alan Saywell (University of
Birmingham) using a Talysurf machine, and the results reported in Table 3.1. The
measurements are sensitive to 0.00015 μm. The laser beam resolution is 10 nm on
measurements up to 6 mm.
Table 3. 1: Surface roughness measurements for coupons used in cleaning studies on the Coupon Rig. Surface
measurements performed by Alan Saywell (University of Birmingham) using a Talysurf machine .
Surface Types Surface Finish (Ra µm) ± 0.15 µm
Stainless steel 1.05
Polypropylene 0.77
PTFE 1.36
Glass 0.01
Acrylic 0.01
Stainless steel (A) 0.50
Stainless steel (B) 0.85
Stainless steel (C) 1.23
Stainless steel (D) 1.65
Stainless steel (E) – mirrored 0.05
Stainless steel (L) 0.17
Indicative values for contact angles for the different surface types have been gained from
work done by Akhtar (2010) for sorbitol (a key toothpaste ingredient) and water as presented
in Figure 3.11.
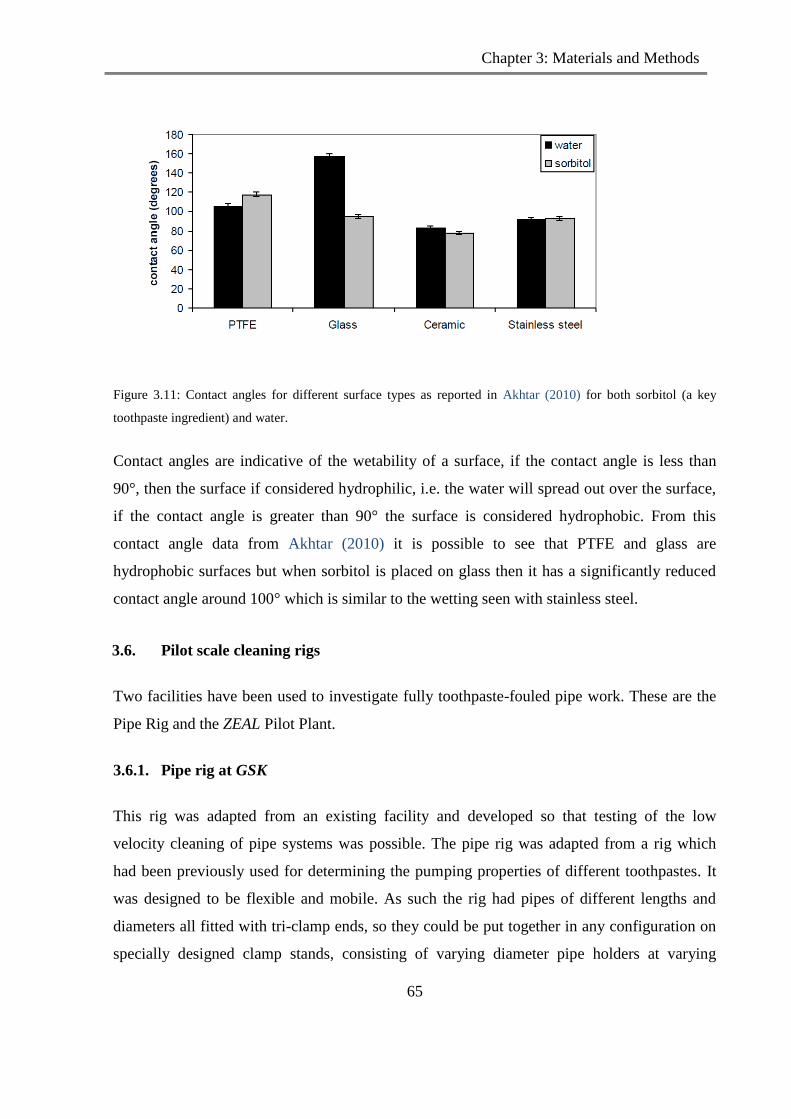
Chapter 3: Materials and Methods
65
Figure 3.11: Contact angles for different surface types as reported in Akhtar (2010) for both sorbitol (a key
toothpaste ingredient) and water.
Contact angles are indicative of the wetability of a surface, if the contact angle is less than
90°, then the surface if considered hydrophilic, i.e. the water will spread out over the surface,
if the contact angle is greater than 90° the surface is considered hydrophobic. From this
contact angle data from Akhtar (2010) it is possible to see that PTFE and glass are
hydrophobic surfaces but when sorbitol is placed on glass then it has a significantly reduced
contact angle around 100° which is similar to the wetting seen with stainless steel.
3.6. Pilot scale cleaning rigs
Two facilities have been used to investigate fully toothpaste-fouled pipe work. These are the
Pipe Rig and the ZEAL Pilot Plant.
3.6.1. Pipe rig at GSK
This rig was adapted from an existing facility and developed so that testing of the low
velocity cleaning of pipe systems was possible. The pipe rig was adapted from a rig which
had been previously used for determining the pumping properties of different toothpastes. It
was designed to be flexible and mobile. As such the rig had pipes of different lengths and
diameters all fitted with tri-clamp ends, so they could be put together in any configuration on
specially designed clamp stands, consisting of varying diameter pipe holders at varying
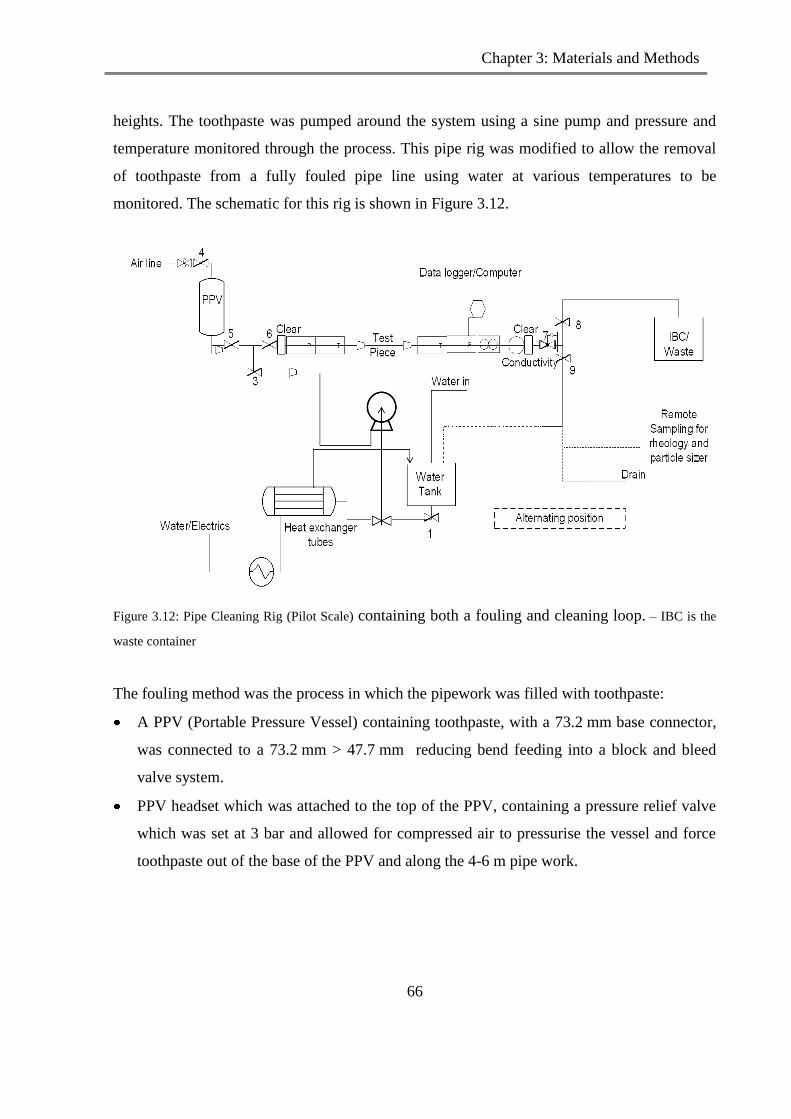
Chapter 3: Materials and Methods
66
heights. The toothpaste was pumped around the system using a sine pump and pressure and
temperature monitored through the process. This pipe rig was modified to allow the removal
of toothpaste from a fully fouled pipe line using water at various temperatures to be
monitored. The schematic for this rig is shown in Figure 3.12.
Figure 3.12: Pipe Cleaning Rig (Pilot Scale) containing both a fouling and cleaning loop. – IBC is the
waste container
The fouling method was the process in which the pipework was filled with toothpaste:
A PPV (Portable Pressure Vessel) containing toothpaste, with a 73.2 mm base connector,
was connected to a 73.2 mm > 47.7 mm reducing bend feeding into a block and bleed
valve system.
PPV headset which was attached to the top of the PPV, containing a pressure relief valve
which was set at 3 bar and allowed for compressed air to pressurise the vessel and force
toothpaste out of the base of the PPV and along the 4-6 m pipe work.

Chapter 3: Materials and Methods
67
The cleaning system comprised:
Water filter to extract any physical contaminants from the process water supply which was
attached to the process water supply
A centrifugal pump, supplied by INNOXPA, at the inlet to the system capable of 50 -
140 l min-1
flow rate with 1” connectors and a 240 V power supply
Inverter: operating the pump at frequency between 0-50 Hz with a linear relationship
A chiller unit with heating capability supplied by RossoBlu, Eurochiller, which was
positioned after the pump and before the inlet to the test section. It has ½ inch connections
and 3 phase power supply. Temperature range = -10-90°C
A 300 l tank to act as a buffer tank with 3” base connection
12 mm hosing to connect the water filter to the heat exchanger/pump
47.7 mm piping from the outlet of the pipework to the drain and from the pipeline rig to
the waste container (IBC)
Block and Bleed systems separating the inlet streams of water and toothpaste and the
outlet streams of toothpaste and waste water
o comprised of stainless steel tee pieces with 47.7 mm butterfly valves on each
outlet all connected by triclamp valves and seals
Test rig comprising of:
o Variable position butterfly valves
o 2 clear plastic sections with triclamp ends
o 2 x 47.7 mm, 0.5 m stainless steel pipe with 60 mm screw threaded ports
containing pressure gauge (furthest extremes- to allow largest pressure drop) and
temperature probes (closest to test pieces)
o Test pieces: 1 m, 1.5 m, 2 m lengths of 47.7 mm, etc stainless steel pipes
combined where necessary with triclamps and seals
o Endress and Hauser Pressure Gauges
o Endress and Hauser Temperature probes
o Endress and Hauser Flowmeter 23.3 mm ends,
o Endress and Hauser conductivity meter placed at the end of the test section and
after the flowmeter to limit flow disturbances
o Images where recorded, recorded with a digital camera

Chapter 3: Materials and Methods
68
The HAZOP for this Pipe Rig is included in Appendix 5, and the SOP for the Pipe Rig (for
cleaning) is included in Appendix 6.
The pipe rig experiments involved the surrounding pipe-work, i.e. valves, t-pieces,
measurement ports etc. and allowed the study of removal from pipe-work at lower flow
velocities.
Experimental Protocol:
Ensure the data logger operational and recording data.
Set pump inverter to frequency which corresponds to a known velocity inside a clean
system.
Fill tank with water of correct temperature.
Fill pipeline with paste using pressurised vessel. Leave to stand for ~ 5 mins.
Begin pump to start water flow.
Visually monitor cleanliness of clear pipe sections and conductivity readout.
At routine intervals stop water, open pipe-work to image the inside of the pipe and
assess cleanliness.
Cleaning End-Point: The experiment was stopped when visual observation of the pipe work
showed it was clean and the conductivity readings indicated the probe was clean. The
cleaning experiment was stopped after 5 hours if the system remained unclean.
Experimental Program: Studies were undertaken on 47.7 mm, 73,2 mm, 101.6 mm diameter
systems, at lengths of 1 m, 1.5 m and 2 m. At temperatures between 15°C and 65°C, and flow
velocities between 0.1 – 1.3 m s-1
depending on the diameter as given in Table 3.2. Some
results from the experiments on this equipment are reported in Section 5.7.1.
Table 3. 2: Velocity comparisons at different diameters for GSK Pipe Rig
Flow-rate (l min-1
) 50 95 140
Velocity (m s-1
) (47.7 mm diameter) 0.46 0.88 1.28
Velocity (m s-1
) (73.2 mm diameter) 0.20 0.37 0.55
Velocity (m s-1
) (101.6 mm diameter) 0.10 0.20 0.28

Chapter 3: Materials and Methods
69
3.6.2. ZEAL pilot plant
The second pilot scale facility is a custom designed facility by the ZEAL consortium and
based at the University of Birmingham. The work on this equipment makes up the majority of
the pilot-scale work discussed in Chapter 5, focussing on pipes of different lengths and
diameters, with experiments performed at different flow velocities and temperatures. A
diagram of the pilot plant system is shown in Figure 3.13.
Figure 3.13: Diagram of the ZEAL Pilot Plant. Water or cleaning chemical from the tanks is pumped through
heat exchangers and online instrumentation and into the „test section‟ area (in this work this has mainly
comprised of pipe line). The system then reaches some outlet instrumentation and is either sent to drain or
recirculated back into the tank.
Experimental Protocol: The full SOP is included in Appendix 7. Appendix 8 has the details of
the routes which were programmed into the Matlab / Labview control system. Water from a
tank was transferred around the system by a centrifugal pump capable of delivering up to
20 m3
h-1
(2 m s-1
through a 47.7 mm ID system) containing a steam heated plate heat
exchanger. The plant was designed to be flexible and allow the study of different geometry
plant items, which could be arranged as required into different test sections. In this instance
the test section was manually filled with toothpaste prior to the experiment and the
surrounding pipe work filled with water.
The plant had automated control using Labview and Matlab, where pre-programmed routes
were selected to govern the path of the cleaning fluid around the plant, and temperature and
flow conditions input. Measurement instrumentation included inlet and outlet flow meters and
conductivity meters and turbidity meters positioned after the test piece. Data from the pilot
Chapter 3: Materials and Methods
70
plant was collected through a 4-20 mA return line and exported to a spreadsheet after use.
Data from additional measurements was collected into separate data files that were then
combined. Data was collected from the on-line measurements at frequent intervals during the
experimental run (typically every second). Ion chromatography swabs were collected when
the interior of the process plant was visually clean, as verification that the clean was
successful and analysed with assistance from Dr. Brian Lumley (GSK).
There were two turbidity meters on the plant. The Kentrak turbidity (ftu) meter measured the
0-500 ftu range, which monitored change across the entire experiment. The Optek turbidity
(ppm) meter measured between 0-50 ppm and was calibrated to provide greater detail at the
end of the cleaning experiment. This is critical to gain realistic insight into cleaning end-point.
Consequently the Kentrak turbidity measurement is not sensitive at the start of the cleaning
experiment, when the turbidity due to the toothpaste is significant. It is saturated and gives a
flat-line reading at higher turbidities early in the experiment.
The experiments in this section of work were all run straight to drain, meaning that
continually refreshed water was used throughout the experiment. Within one experiment there
are multiple runs, as there is a limited amount of water in the tank (0.5 m3). Each run uses the
same quantity of water. At the end of each run the tank was refilled and a further run could
then take place if the system was not clean.
Experimental Program:
The experiments have been conducted with the same toothpaste which was Paste T,
with the exception of some comparative studies done with Paste D reported in
Section 5.7.3.
The „Test section‟ refers to the pipe section of specific length and diameter which was
filled with paste and clamped into the ZEAL pilot plant. The surrounding pipe-work
was filled with water. Where possible flow was allowed to develop for at least 10 pipe
diameters before reaching the test section, this is referred to as the „start-up length‟.
The filled pipe was placed in a horizontal position.

Chapter 3: Materials and Methods
71
All experiments were performed „straight-to-drain‟ i.e. without recirculation. This was
done to allow a continual measurement response every 1 s when measured by online
conductivity and turbidity. As such, multiple tanks of cleaning water were used in
many of the experiments, resulting in a corresponding number of data sets, these are
referred to as „experimental runs‟ or „runs‟. These data have been collated to form
each individual experiment; hence one experiment may be formed of 3 runs from 3
tanks of cleaning water.
The stop and start in the experiment caused by changing the tank often produced a
peak in the measurement response as the new tank was started. It took several seconds
to reach the desired velocity. The velocity was accurate to ± 0.06 m s-1
, in the standard
47.7 mm ID diameter system.
The cleaning water was heated to the designated value prior to the water being run
through the system, with the exception of the ambient water which was ~20°C.
The standard „cleaning end-point‟ referred to a measurement of < 4 ppm on the Optek
turbidity meter; the reasoning for this will be discussed further in Section 5.3.
Experimental Procedure:
Sample Storage: Toothpaste was provided by GSK in lidded drums containing ~50 kg of
material. These drums were double lined with plastic, so that one layer of plastic could be
used to cover the paste and avoid it drying out.
Fouling Procedure 1 (3 m fouling loop): A standard procedure was adopted where the
toothpaste was pumped round the system (3 m fouling loop) from barrels of paste. The valve
arrangement was then adjusted to the cleaning run position.
Fouling Procedure 2 (0.3 m, 0.5 m, 1 m, 2 m test section fouled only): The base of the pipe
was capped, toothpaste was transferred to a funnel positioned above the pipe and the
toothpaste pipe tapped against a piece of wood to allow any air gaps to be filled, any gaps
were filled with paste by hand. The filled pipe was then tri-clamped into the test section area.
The surrounding pipework was filled with water.

Chapter 3: Materials and Methods
72
Cleaning procedure: Water was passed at the desired temperature and flow-rate through the
test piece for a set time (dependant on flow rate) correlated to a certain volume of water. The
water passes were repeated until the turbidity meters read > 0.6 ppm and 0 FTU. At this stage
the pipe work was drained and Ion Chromatography swabs were taken at the end of the test
piece pipeline. Experiments were run until the pipeline was visually clean and the turbidity
readings were low. The Kemtrac turbidity meter must have data downloaded after 8000 data
points (or 2.2hrs at 1 reading per second).
Experimental parameters:
The process parameters for cleaning fluid were flow rates of 6 – 20 m3 h
-1, and temperatures
of 20°C to 70°C for a pipeline system of 0.3 – 2 m lengths and pipe diameters of 23.9 mm,
47.7 mm ID, 73.2 mm and 101.6 mm. The majority of experiments used the key paste (Paste
T), some limited work has been performed with Paste D at this scale. Furthermore, an acrylic
pipe has been used in some of the experiments.
3.6.3. Other systems
A flat plate of a measurement port was coated with paste and placed horizontally into the
ZEAL Pilot Plant set-up to allow direct comparison of the cleaning behaviour between the
Coupon Rig experiments and those at more industrially relevant velocities, A measurement
body comprising of two flattened sides which are fitted with circular plates 60 mm in
diameter was placed in the ZEAL Pilot Plant such that the flat surface was horizontal. A glass
disc was placed in the other flattened side directly above this stainless steel surface. The
stainless steel surface was coated with ~ 10 g of paste, and a the camera used in the Coupon
Rig (described in Section 3.5.2) was set-up so that it could record from above the coated
surface, the removal from this disc as a function of time. This coated disc was placed in the
ZEAL Pilot Plant such that cleaning could occur in a method similar to that seen on the
Coupon Rig, but using the ZEAL Pilot Plant SOP.
The ZEAL Pilot Plant is flexible and has the potential to be used to investigate other plant
items; some limited work using toothpaste is presented in Section 7.8 as an indicator to future
work leading on from this study.
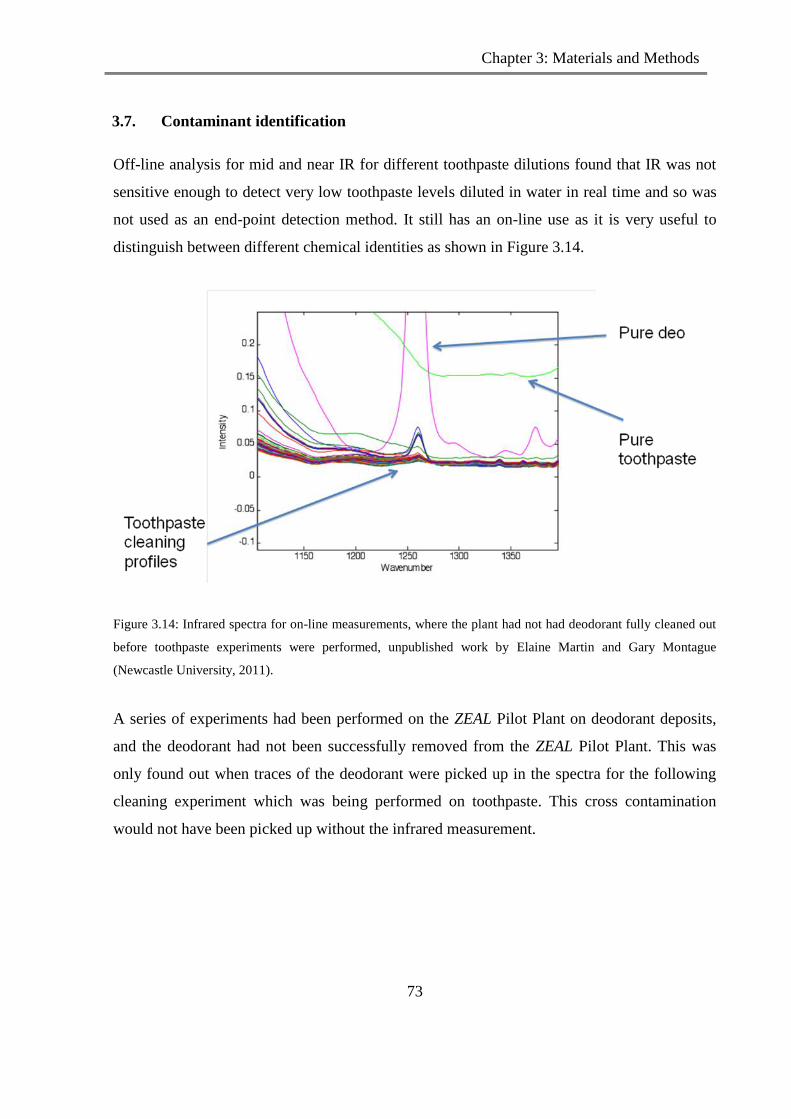
Chapter 3: Materials and Methods
73
3.7. Contaminant identification
Off-line analysis for mid and near IR for different toothpaste dilutions found that IR was not
sensitive enough to detect very low toothpaste levels diluted in water in real time and so was
not used as an end-point detection method. It still has an on-line use as it is very useful to
distinguish between different chemical identities as shown in Figure 3.14.
Figure 3.14: Infrared spectra for on-line measurements, where the plant had not had deodorant fully cleaned out
before toothpaste experiments were performed, unpublished work by Elaine Martin and Gary Montague
(Newcastle University, 2011).
A series of experiments had been performed on the ZEAL Pilot Plant on deodorant deposits,
and the deodorant had not been successfully removed from the ZEAL Pilot Plant. This was
only found out when traces of the deodorant were picked up in the spectra for the following
cleaning experiment which was being performed on toothpaste. This cross contamination
would not have been picked up without the infrared measurement.

Chapter 3: Materials and Methods
74
3.8. Summary
Mid IR spectroscopy is dominated by water and hydrated silica responses. Some of the
spectral features indicate a Si-O-Si linkage, which other authors (Casarin et al., (2005) and
Coates (2006)) have attributed to a weak gel structure.
In rheological studies, it was found that toothpaste acts as an elastic material. It was also
found that as the elastic modulus is greater than the viscous modulus, that the toothpaste
studied could be described as a weak gel having an entanglement network system. Toothpaste
was found to be shear thinning with the viscosity decreasing with dilution, making it suitable
for cleaning by water flow. The material can be modelled as a Herschel-Bulkley material,
where the toothpaste had an apparent yield stress and was shear thinning. The viscoelastic
properties of the paste have been examined and found to exhibit elastic behaviour and meets
criteria discussed by Gunasekaren & Mehmet Ak (2000) for behaving as a weak gel. Weak
gel behaviour has been inferred in both the mid-IR and rheology data.
Cohesive and adhesive forces of a bulk paste can be measured using the micromanipulation
rig discussed in Liu et al. and will be examined further in Chapter 4.

Chapter 4: Laboratory scale
75
CHAPTER 4: LABORATORY SCALE
STUDIES
Cleaning studies on toothpaste have been conducted at laboratory scale, on equipment which
is similar to the „flat plate flow cell‟ used by Christian (2003) and Ab Aziz (2007) and which
was described in Section 2.4, this equipment is referred to as the Coupon Rig in this thesis
and was described in Section 3.5.2. This chapter evaluates the cleaning studies performed on
the Coupon Rig focusing on the removal behaviour of toothpaste. This is evaluated by:
the removal behaviour of toothpaste from coupons on the Coupon (cleaning) Rig
the change in heat transfer coefficient through the cleaning experiment, which was
captured via a heat flux sensor under the base of the coated coupon
the reduction in the fouling deposit as a function of time during the cleaning
experiment, this was done by image analysis of photographs taken at routine time
internals during the experiment
the effect on varying the cleaning water process parameters, - specifically temperature
and velocity on the cleaning time
the impact on cleaning time of different surface types and different surface finishes
the impact on cleaning time as a function of different pastes, based on a similar base
set of ingredients.
In addition, work has been performed on the micromanipulation equipment introduced in
Section 2.2. The pulling energy has been evaluated at different cut heights relative to the
coupon to enable the cohesive and adhesive forces to be calculated as discussed in Section
2.2. This has also been done using the different pastes assessed on the Coupon Rig, to assess
whether any comparability in the results is found in the techniques. Rheological studies have
also been performed on these pastes. These techniques could prove a useful comparative tool
Chapter 4: Laboratory scale
76
to assess the difficulty of cleaning in terms of cleaning time, with respect to the measured
product attributes. This could facilitate grouping products according to the amount of time
which it takes then to clean. If correlation is found to exist then this could provide a useful
method of grouping the toothpaste in terms of difficulty to clean and could give a predictive
method for assessing new toothpaste products.
4.1. Toothpaste removal behaviour
The Coupon Rig is described in Section 3.5.2; the set-up of the cleaning experiment is such
that the toothpaste sample protrudes into the flow stream and is then removed by the flowing
water. This happens through several mechanisms.
Continual removal - erosion by fluid flow: The toothpaste was removed by continued
exposure to the flow stream, this led to erosion of the paste from the leading fluid edge into
the fluid flow such that the toothpaste sample was gradually reduced in size, as shown in
Figure 4.1.

Chapter 4: Laboratory scale
77
a)
b)
Figure 4.1: Coupon Rig, a) Cleaning of 1.3 g of Paste T from square coupons 25 mm x 25 mm, (deposition mass
0.002 g mm-2
) by water at temperature 20°C, and mean velocity 0.25 m s-1
, from left to right, row 1 then row 2,
in sequence 140 s, 2180 s, 2940 s, 3600 s, 3880 s, 4580 s, 5320 s, 5420 s. b) Cleaning of 2.3 g of Paste T from a
large coupon 35 mm square, (deposition mass 0.002 g mm2) by water of temperature 20°C, and mean velocity
0.25 m s-1
, Re = 1000, Formation of wave phenomena observed on the square coupons, the toothpaste wave can
be seen moving across the deposit from right to left and then breaking off. The wave took 152 s to travel across
the length of deposit and break off. Time intervals: i) 2122 s, ii) 2158 s, iii) 2170 s, iv) 2174 s. Total
experimental time in excess of 5 h.
Wave evolution and particulate entrainment: Experimental activities on square coupons were
conducted to allow comparison with Computational Fluid Dynamics (CFD) modelling

Chapter 4: Laboratory scale
78
undertaken by Dr Prashant Valluri from Imperial College as part of the ZEAL consortium.
The square Coupon Rig has the facility for side imagery as shown in Figure 4.1b. The models
find similar behaviour to that observed in the experiment profiles, with entrainment into the
fluid flow. The side imaging shows the evolution of a wave. These waves in the paste sample
move across the deposit in the flow direction and are then are removed into the fluid flow. It
is also possible to see the removal of particulate matter on the left hand side of the figure.
Sahu et al. (2007) have modelled the removal of a highly viscous material with yield stress,
by a Newtonian fluid in a horizontal duct. It was found that the variations in density ratio
increase the likelihood of waves, which result in removal of the Herschal-Bulkley material
(toothpaste) into the Newtonian fluid (water).
Edge effects: Previous cleaning rigs such as Christian (2003) have used circular coupons for
the cleaning experiments. Some experiments on toothpaste were carried out where the
toothpaste was coated on a circular coupon and placed in the Ab Aziz (2007) cleaning rig to
enable comparison of the removal mechanisms for toothpaste on both the circular (Figure
4.1a) and square coupons (Figure 4.2).
Figure 4.2: Paste N, circular coupon cleaning rig, flow conditions 50°C, 0.2 m s-1
, total time to clean 1320 s.
flow direction, right to left. The images occur in sequence from left to right – at intervals of 60 s, 240 s, 360 s
and 540 s.
Toothpaste is always seen to erode from the leading fluid edge whether the coated coupons
are circular or square.

Chapter 4: Laboratory scale
79
4.2. Coupon rig measurement profiles
Cleaning experiments were monitored visually, by image analysis and by change in the heat
transfer coefficient during the cleaning experiment.
Image analysis: The experiments were imaged from above the toothpaste sample at regular
time intervals. As the toothpaste was removed, the darker colour of the coupon was revealed.
Images were converted into binary images, so that a measurement of the number of white
pixels (toothpaste) could be made and this was then converted into the area of paste removed
over time. This allowed removal trends across the entire experiment duration to be identified
as shown in Figure 4.3a.
Heat transfer coefficient: The cleaning experiments on the Coupon Rig were monitored
through a heat flux sensor positioned under the toothpaste coated coupon during the cleaning
experiment and were analysed in terms of the heat transfer coefficient, as described in
Section 2.4 based on work by Ab Aziz (2007) and Christian (2003) and presented over the
course of the experiment as Figure 4.3b.

Chapter 4: Laboratory scale
80
a)
b)
Figure 4. 3: Response from a cleaning experiment on the Coupon Rig, cleaning conditions: 50°C, 0.25 m s-1
a)
Total area of toothpaste on coated sample as determined by image analysis calculated from the number of pixels
containing toothpaste over time, b) Heat transfer coefficient profile over time calculated as per Section 2.4.
In Figure 4.3 the deposit area and the heat transfer coefficient are plotted as a function of
time. A steady decline in the area of paste coating the coupon is observed in Figure 4.3a
which mirrors the increase in heat transfer coefficient seen in Figure 4.3b. After
approximately ~ 3000 s the measurements plateau. This corresponds to a clean surface.
The area was calculated by converting the images to binary measurements. It is then possible
to analyse the images by calculating the number of pixels corresponding to the white
toothpaste against the darker coupon background. Variation in the data occurs if images
capture a bubble in the flow cell or if the contrast between the silver stainless steel and the

Chapter 4: Laboratory scale
81
white toothpaste was difficult to establish. The general trend for the experiment as seen in the
image analysis profile is:
limited removal between 0 and 1000 s,
followed by a steady reduction in the area covered by toothpaste between 1000 s and
3000 s,
finishing with very slight removal between 3000 s and 4000 s as limited paste was left
on the surface,
A plateau at ~ 3000 s corresponding to the visually clean surface.
The key features of the heat transfer coefficient measurement are:
A sharp increase in heat transfer coefficient over the initial ~ 100 s, as the cleaning
water filled the flow channel, and the channel walls equilibrated to the temperature of
the water,
A steady progressive increase in heat transfer coefficient over the experiment time as
the layer of toothpaste which insulated the sensor from the temperature of the water
was removed by fluid flow,
The starting heat transfer coefficient (U) was typically 0.3 kW m-2
K-1
, with a change
of 0.7 kW m-2
K-1
across the experiment time, resulting in the final heat transfer
coefficient for the clean surface being around 1 kW m-2
K-1
,
The experiment was seen to be visually clean at ~ 3000 s, the heat transfer coefficient
plateaus around this point

Chapter 4: Laboratory scale
82
Turbulent flow -, curling, fluttering, peeling and ripping: At higher flow rates, corresponding
to turbulent flow, the removal of the toothpaste occurs faster, and evidence of the deposit
being removed by the eddies present in turbulent flow was seen, as shown in Figure 4.4(a) for
circular coupons and Figure 4.4(b) for square coupons
a)
b)
Figure 4. 4:a) Removal of Paste N, by fluid of 0.37 m s-1
, 50°C. on the Ab Aziz (2007) PIV rig using circular
coupons on the cleaning rig. Turbulent flow - curling and ripping of toothpaste due to eddies. Time intervals: iii)
350 s, v) 640 s, vii) 736 s, viii) 738 s, ix) 743 s. Total cleaning time 780 s. Flow direction right to left. b)
Experiments conducted on the square coupon on Paste R, at fluid conditions of 40°C, 0.37 m s-1
: 800 s into a
1200 s experiment the paste is seen to curl and rip away. Stills every 10 s. flow direction right to left,

Chapter 4: Laboratory scale
83
Curling of the paste away from the surface in the flow stream was seen in Figure 4.4, this curl
of paste was still attached to the paste on the coupon. This was then seen to flutter in the fluid
stream. The paste then peeled away from the coupon. Eventually this curl of paste present in
the fluid stream was seen to tear away from the body of the paste on the coupons and be
removed into the fluid stream, this was seen for both circular (a) and square (b) coupons in
Figure 4.4.
Figure 4.5 Heat transfer coefficient from the same experiment shown in Figure 4.4b, where a curl of paste is torn
away from the stainless steel surface between 800 s and 860 s, which is captured in the heat transfer coefficient
data by an increase at the corresponding time. Clean at 1800 s.
The curling and ripping seen in Figure 4.4b was tracked by the heat flux sensor, the resulting
heat transfer coefficient profile was seen in Figure 4.5. There was a dramatic increase in heat
transfer coefficient which corresponded to the peeling away of most of the sample in the
turbulent flow between 800 s and 860 s. The heat transfer coefficient measurement then
reached a plateau as the surface reached a clean state. This demonstrates that the heat transfer
coefficient track can major events in the cleaning experiment.
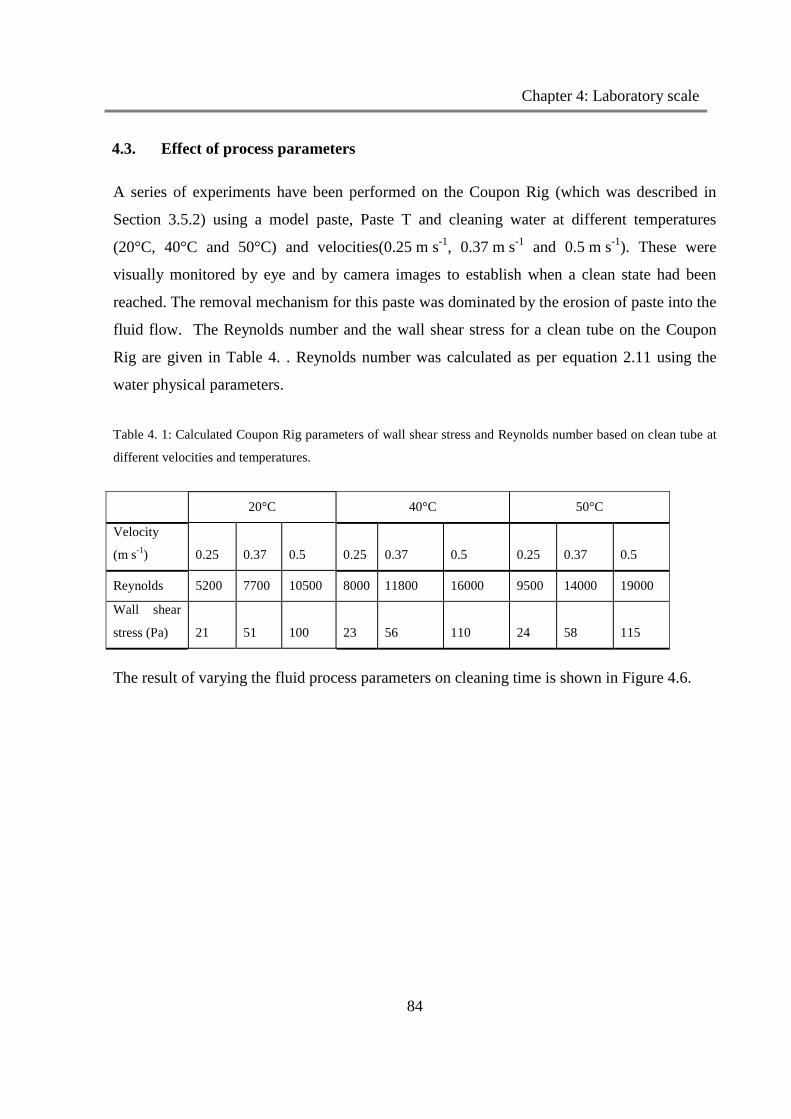
Chapter 4: Laboratory scale
84
4.3. Effect of process parameters
A series of experiments have been performed on the Coupon Rig (which was described in
Section 3.5.2) using a model paste, Paste T and cleaning water at different temperatures
(20°C, 40°C and 50°C) and velocities(0.25 m s-1
, 0.37 m s-1
and 0.5 m s-1
). These were
visually monitored by eye and by camera images to establish when a clean state had been
reached. The removal mechanism for this paste was dominated by the erosion of paste into the
fluid flow. The Reynolds number and the wall shear stress for a clean tube on the Coupon
Rig are given in Table 4. . Reynolds number was calculated as per equation 2.11 using the
water physical parameters.
Table 4. 1: Calculated Coupon Rig parameters of wall shear stress and Reynolds number based on clean tube at
different velocities and temperatures.
20°C 40°C 50°C
Velocity
(m s-1
) 0.25 0.37 0.5 0.25 0.37 0.5 0.25 0.37 0.5
Reynolds 5200 7700 10500 8000 11800 16000 9500 14000 19000
Wall shear
stress (Pa) 21 51 100 23 56 110 24 58 115
The result of varying the fluid process parameters on cleaning time is shown in Figure 4.6.

Chapter 4: Laboratory scale
85
Figure 4. 6: Cleaning time as a function of temperature and velocity for Paste T, on the Coupon Rig using square
coupons, the equipment was described in Section 3.5.2. The error bars show the spread of data from 3
experiments from a visually 100% clean surface based on images taken every 10 s.
Figure 4.6 shows the results of varying the process parameters of the cleaning water on
cleaning time. A difference between the average of the 20°C data and the average of the
heated 50°C data was observed. However, at this scale there seems to be limited benefit in
furthering the temperature increase in terms of reducing cleaning time.
A slight decrease in cleaning time has been observed as the velocity was increased, however
this decrease was limited and subject to large variability. This large variability is due to the
large variability in cleaning rates found for the same conditions. The results of the three
experiments performed under the same conditions (40°C, 0.25 m s-1
) are given in Figure 4.7.
These were found to have different gradients on the heat transfer coefficient measurements
related to different cleaning rates. The fouled coupon had a heat transfer coefficient of

Chapter 4: Laboratory scale
86
typically ~ 0.3 kW m-2
K-1
, and when the insulating toothpaste deposit was removed the heat
transfer coefficient was typically ~ 1 kW m-2
K-1
. However, some anomalies occur in some
cases such as the green line shown in Figure 4.7, where it is suggested that the sensor is not
fully in contact with the fouled coupon or the water around the sensor is not freezing which
result in a different final heat transfer coefficient being measured.
Figure 4.7: Coupon Rig experiments, heat transfer coefficient traces for repeats of the 40°C, 0.25 m s-1
condition
show pronounced variability in the heat transfer coefficient trace gradients. The black squares show the visually
clean result based on images taken every 10 s for the experiments.
The removal of toothpaste by fluid flow was driven by the mass transfer of the paste away
from the wall into the cleaning fluid. At low flow rates, seen on the Coupon Rig, the variation
in paste behaviour between flowrates is as significant as the variation due to minimal velocity
changes between 0.25 – 0.5 m s-1
. As such strong trends in cleaning behaviour are not noted
for toothpaste removal on the Coupon Rig.

Chapter 4: Laboratory scale
87
The heat transfer coefficient data can be used to calculate the Fouling resistance (Rf) from
equation 4.1:
0
11
UURf
(4. 1)
Figure 4.8: Coupon Rig experiments, Fouling resistance (Rf) (defined in equation 4.1) versus velocity for
Coupon Rig experiments where the coupon was coated with 1.3 g of toothpaste, where the fouling resistance is
calculated using the fouled U at t = 100 s for each of the experiments.
Figure 4.8 shows the fouling resistances defined in equation 4.1 for toothpaste cleaning on the
Coupon Rig with the fouled surface U defined at t = 100 s, and U0 based on a clean surface.
The Rf occurs at ~ 1.5 kW m2 K
-1 for 20°C and between ~ 2 kW m
2 K
-1 and 2.5 kW m
2 K
-1
for the 40°C and 50°C data. The fouling resistance does not form a strong relationship with
cleaning time.
4.4. Dimensionless Analysis
Reynolds number has been calculated using the density and apparent viscosity terms related to
the temperature of the cleaning water as described in Section 2.8. Figure 4.9 shows Reynolds

Chapter 4: Laboratory scale
88
number versus Coupon Rig cleaning times for toothpaste as determined from a visually clean
image.
Figure 4.9: Coupon cleaning time vs. Reynolds at 20°C, 40°C and 50°C, for flow rates between 0.25 – 0.5 m s-1
,
corresponding to Re ~ 5000 to 20,000. Plotted showing lines of best fit according to linear and power law
behaviour.
Reynolds number is expected to be a good descriptor as both the velocity and temperature
effects are captured. Unlike reaction fouling / cleaning, temperature effects are due to the
changes in fluid properties. It is noted from Figure 4.9 that a trend exists between Reynolds
number and cleaning time, but due to the large variation in the Coupon Rig data, it is difficult
to determine the best way of modelling this, equation 4.2 and equation 4.3 show the power
law and linear fits shown in Figure 4.9.
Power law: Time (s) = 2 x 10⁶ (Re)
-0.7, R
2 = 0.901 (4. 2)
Linear: Time (s) = -0.2(Re) + 5480, R2 = 0.778 (4. 3)

Chapter 4: Laboratory scale
89
This relationship with Reynolds number shows that the fluid mechanical removal dominates
according to standard fluid flow principles.
4.5. Comparison with other deposit types
Similar laboratory scale cleaning rigs and protocols have been used by other researchers. In
Table 4.2 the conditions investigated in those works are given to allow comparison of the
various conditions investigated in different cleaning experiments, along with their respective
Reynolds numbers calculated as Section 2.8 based on a clean tube and the physical properties
of the cleaning water.
Table 4. 3 : Circular coupon laboratory scale cleaning rig parameters given for the Christian (2003) and Ab Aziz
(2007) rigs where a selection of deposits have been investigated by being coated on to a coupon and placed in a
horizontal duct to be removed by cleaning fluid. The Reynolds numbers are different as the internal diameter is
different.
Christian (2003) & Ab Aziz (2007)
Baked Tomato Paste, Whey Protein
Chemical
m s-1
0.05 0.1 0.15
Re (30°C) 750 1600 2450
Ab Aziz PIV (2007),
Baked Tomato Paste & EAG
m s-1
0.05 0.12 0.18 0.33
Re (30°C) 990 2130 3250 6000
(Ab Aziz PIV Rig)
This work, toothpaste (0.8 g)
m s-1
0.11 0.37 0.50
Re (30°C) 2080 6960 9360
The first work was reported by Christian (2003) who developed the flow cell with support
from the Chemical Engineering department at the University of Birmingham. This had a
narrow channel and a low flow range described in Section 2.4. Ab Aziz (2007) furthered the

Chapter 4: Laboratory scale
90
technology by extending the flow cell length, and increasing the possible velocities and
increasing the viewing window to allow flow fields to be captured during Particle Imaging
Velocimetry (PIV) experiments. PIV is a technique which is used to image velocity gradients
by using tracer particles in fluid flow by laser doppler anemometry [Buchhave (1992)].
Toothpaste cleaning experiments have been undertaken in this work on the PIV enabled rig to
allow some comparison with previous works. Unfortunately PIV proved to be of limited
success with the toothpaste sample as toothpaste is of a highly particulate nature which
interferes with the tracer particles used in PIV experiments. Cleaning times from these
different systems have been captured for the different deposits examined on circular coupons
on the cleaning rigs and are collated graphically in Figure 4.10.

Chapter 4: Laboratory scale
91
Figure 4. 10: Comparison of cleaning of different deposit types conducted on circular coupon cleaning rigs at
30°C including toothpaste as part of this study, baked toothpaste paste, Egg Albumin Gel (EAG) and whey
protein.
Both Christian (2003) and Ab Aziz (2007) investigated baked tomato paste. This was
removed by water cleaning alone, and so has a similar removal method to the toothpaste
examined in this work. This behaviour has been used to classify these deposits as Type 1
deposits [Fryer and Asteriadou (2009)]. The similarity extends to a similar cleaning time
range between the two deposits. Both of these deposits are found to have cleaning times less
than ~2500 s at a velocity of ~0.1 m s-1.
The cleaning time was reduced at the increased
velocity ~ 0.3 m s-1
to between 1000 s and 2000 s for both the baked tomato paste and the
toothpaste.
Christian (2003) reported removal of baked tomato paste by water had a continuous removal
mechanism which may be comparable to that observed here for toothpaste. However heat
transfer coefficient data of the tomato paste removal in Christian (2003) showed small

Chapter 4: Laboratory scale
92
stepwise removal rather than a smooth increase as seen here. It is suggested by Christian
(2003) that small chunks of tomato deposit were hydrated and then removed into the fluid
flow rather than the gradual erosion of a particulate material which has been identified in
Section 4.1 for toothpaste. This demonstrates that there are still differences between deposits
which require the same conditions for removal, in this case the cleaning for toothpaste is
dominated by mass removal, and baked on tomato paste is a carbohydrate deposit where
hydration of the sample is required between the surface and the deposit before removal
occurs.
The other deposits studied in previous works, whey proteins and EAG have required chemical
as well as physical removal at 30°C. The whey protein deposit reported by Christian (2003)
can be removed at 30°C with the assistance of just 0.1% caustic, and so it is still dominated by
the physical removal; however this takes extended cleaning time. This has the characteristics
of a Type 2 deposit as defined by Fryer and Asteriadou (2009) needing both physical and
chemical cleaning. The egg albumin deposit investigated by Ab Aziz (2007) required more
forcing cleaning conditions of both raised temperature and increased chemical concentration,
to achieve a clean surface. The least aggressive condition used to successfully clean the EAG
was 50°C and 0.5% caustic solution. This deposit requires chemical removal and so has the
characteristics of a Type 3 deposit according to the Fryer and Asteriadou (2009) definition.
4.6. Effect of different surfaces and surface finishes
The main area of investigation is this thesis is how different fluid flow conditions effect the
cleaning time for bulk toothpaste. A very small study has been undertaken to investigate if
there is any difference in cleaning time that could be attributed to different surface types.
Experiments have been performed on the Coupon Rig to compare cleaning times for
toothpaste from different surface types. These surfaces include glass, plastic, and PTFE and
stainless steel. The surfaces investigated have been characterised with respect to their surface
roughness which were tabulated in Section 3.5.2. The wetability of surfaces can be measured
using contact angles, and data from Ahktar (2010) for PTFE, Glass and Stainless steel with
both water and sorbitol (a key toothpaste ingredient) were included in Figure 3. 11.

Chapter 4: Laboratory scale
93
Table 4.3: Coupon Rig experiments on toothpaste cleaning with different levels of surface finish of stainless
steel and different surface types (stainless steel (316L), polypropylene, PFTE, acrylic and glass). The coupons
were coated with Paste T, and experiments performed at cleaning conditions: 40°C, 0.25 m s-1
. Re = 9500. The
time to reach a visually clean image is presented as a function of the surface. All of the experiments were
repeated 3 times, and the spread of data was captured in the errors.
Average time (min) Error (min)
Different surface type coupons (large)
Glass 53 4
Acrylic 47 9
PTFE 64 5
Polypropylene 62 8
SS. Ra = 1.05 µm 64 3
Stainless Steel Coupons(25mm x 5mm) - Ra
0.5 µm 64 2
0.85 µm 53 5
1.24 µm 59 4
1.65 µm 55 6
0.05 µm 57 5
Different surfaces give rise to different removal behaviours, the cleaning times for cleaning
experiments with toothpaste on the Coupon Rig are given in Table 4.3. There is a slightly
lower average cleaning time for the glass and acrylic compared with the PTFE, Polypropylene
and stainless steel and this could be due to these surfaces having increased hydrophobicity,
although this is unlikely as this is not seen with the PTFE. It could be due to the reduced
surface roughness at 0.01 µm for acrylic and glass vs. 1.05 µm for stainless steel and 1.36 µm
for PTFE. This tendency is very slight and further work would be required to see if any
conclusive effects are seen.
It is shown that there is no impact on cleaning time for toothpaste coated coupons which have
different levels of stainless steel surface finish. Often a high quality of surface finish is
requested for processing equipment as it is thought to improve the ability of the machine to be
cleaned quickly. Achieving different surface roughness can be significantly expensive and so
if these results are indicative of full scale complex geometries, large savings could be made
by using a lower specification of surface finish on the processing equipment.
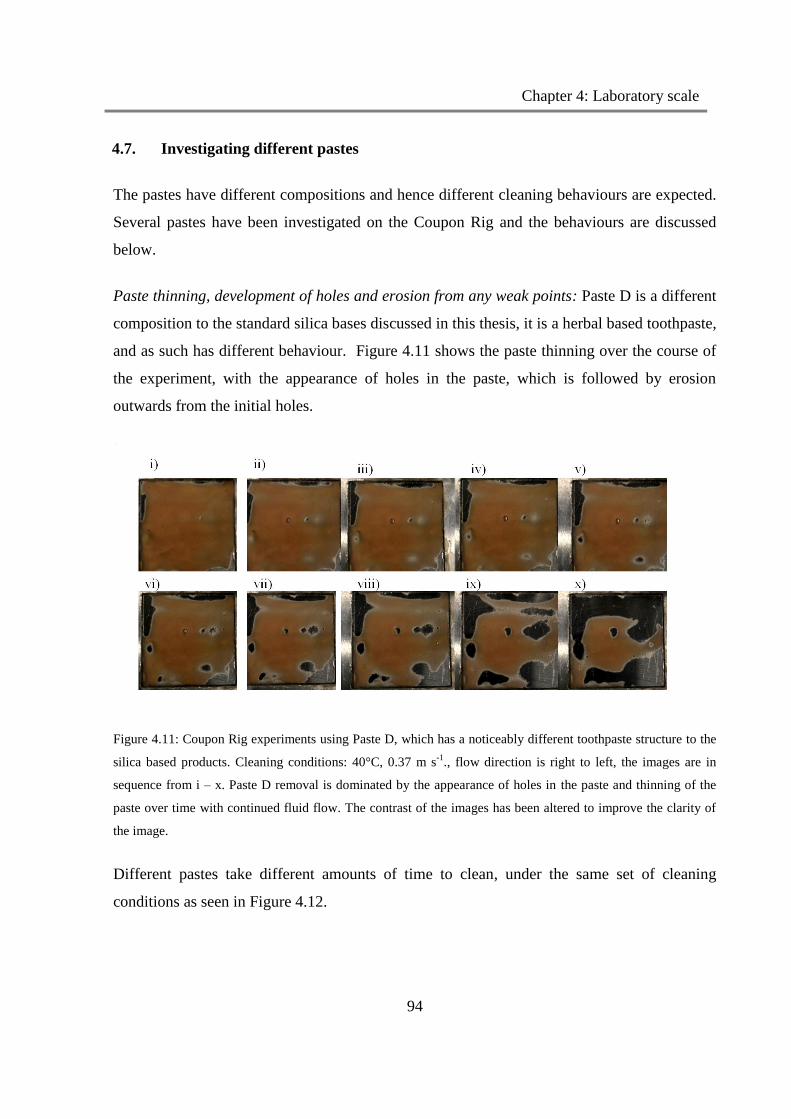
Chapter 4: Laboratory scale
94
4.7. Investigating different pastes
The pastes have different compositions and hence different cleaning behaviours are expected.
Several pastes have been investigated on the Coupon Rig and the behaviours are discussed
below.
Paste thinning, development of holes and erosion from any weak points: Paste D is a different
composition to the standard silica bases discussed in this thesis, it is a herbal based toothpaste,
and as such has different behaviour. Figure 4.11 shows the paste thinning over the course of
the experiment, with the appearance of holes in the paste, which is followed by erosion
outwards from the initial holes.
Figure 4.11: Coupon Rig experiments using Paste D, which has a noticeably different toothpaste structure to the
silica based products. Cleaning conditions: 40°C, 0.37 m s-1
., flow direction is right to left, the images are in
sequence from i – x. Paste D removal is dominated by the appearance of holes in the paste and thinning of the
paste over time with continued fluid flow. The contrast of the images has been altered to improve the clarity of
the image.
Different pastes take different amounts of time to clean, under the same set of cleaning
conditions as seen in Figure 4.12.

Chapter 4: Laboratory scale
95
Figure 4. 12: Cleaning times for different pastes studied on the Coupon Rig at cleaning conditions of 40°C and
0.37 m s-1
. The cleaning time is based on a visually clean image. Images are taken every 10 s. The error bars
based on the variations from three experimental repeats.
A large variation in the cleaning times was seen when using different pastes, ranging from
~ 60 minutes for Paste T, the paste which is used as our model paste, and was chosen as it was
known to be one of the most difficult to clean, to ~ 5 minutes for Paste U. These different
pastes are based on similar silica base systems, with the exception of paste D which has a
distinctly different base. The different cleaning behaviour will be investigated in terms of the
other techniques in this chapter: Section 4.9 for Micromanipulation, and Section 4.10 for
Rheology.
4.8. Micromanipulation
Section 2.2 discussed the use of micromanipulation as a tool to evaluate the forces of
cohesion and adhesion between a material and the surface it contacts. Figure 4. 13 shows the
pulling energy as defined in equation 2.2, which is required to remove toothpaste from the
coupon at different cut heights. The cut height is the distance from the surface as discussed in
Section 2.2. Pulling energy was used by Liu et al. (2006) to allow adhesive and cohesive
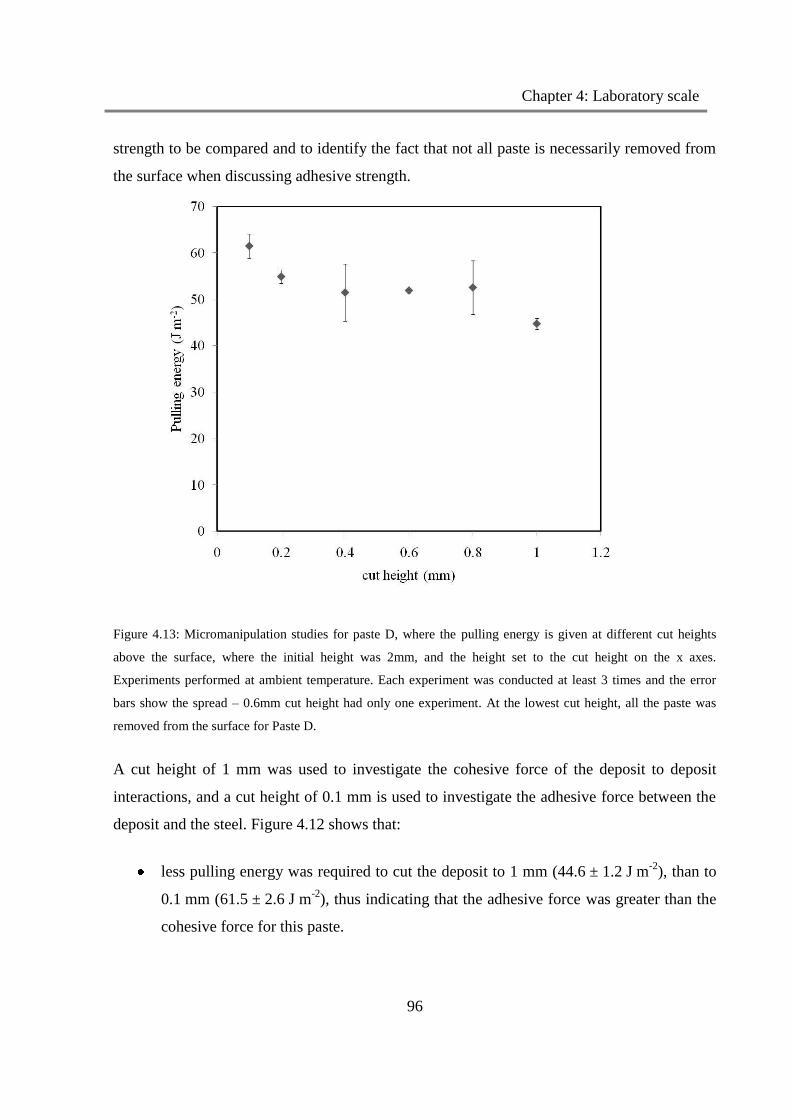
Chapter 4: Laboratory scale
96
strength to be compared and to identify the fact that not all paste is necessarily removed from
the surface when discussing adhesive strength.
Figure 4.13: Micromanipulation studies for paste D, where the pulling energy is given at different cut heights
above the surface, where the initial height was 2mm, and the height set to the cut height on the x axes.
Experiments performed at ambient temperature. Each experiment was conducted at least 3 times and the error
bars show the spread – 0.6mm cut height had only one experiment. At the lowest cut height, all the paste was
removed from the surface for Paste D.
A cut height of 1 mm was used to investigate the cohesive force of the deposit to deposit
interactions, and a cut height of 0.1 mm is used to investigate the adhesive force between the
deposit and the steel. Figure 4.12 shows that:
less pulling energy was required to cut the deposit to 1 mm (44.6 ± 1.2 J m-2
), than to
0.1 mm (61.5 ± 2.6 J m-2
), thus indicating that the adhesive force was greater than the
cohesive force for this paste.

Chapter 4: Laboratory scale
97
When the cut height was between 0.8 mm and 0.4 mm, corresponding to the amount
of force required to break the cohesive paste-paste bonds. The pulling energy was
virtually constant (51 – 54 J m-2
), This pulling energy remained consistent despite a
slightly greater mass of toothpaste being removed as the cut height moves closer to the
surface, confirming that this energy is required to break bonds rather than remove
mass. A small quantity of paste was left remaining on the surface.
Hydration Studies: Soaking time
Hydrating a deposit is expected to reduce the time required for cleaning. To assess if a
reduction in pulling energy is seen through soaking, samples were soaked in 30°C water at
different time intervals. The results are seen in Figure 4.14.
Figure 4. 14: Micromanipulation Rig: Hydration studies for Paste N after different soak times, temperature is
30°C. Initial sample 2 mm height, cut to 1 mm (cohesive) and 0.1 mm (adhesive) heights. Error bar shows the
spread of data from 3 experiments.
A reduction in the pulling energy was observed as the hydration time was increased, with the
effect becoming less pronounced after the initial 60 s for the cohesive sample. The pulling
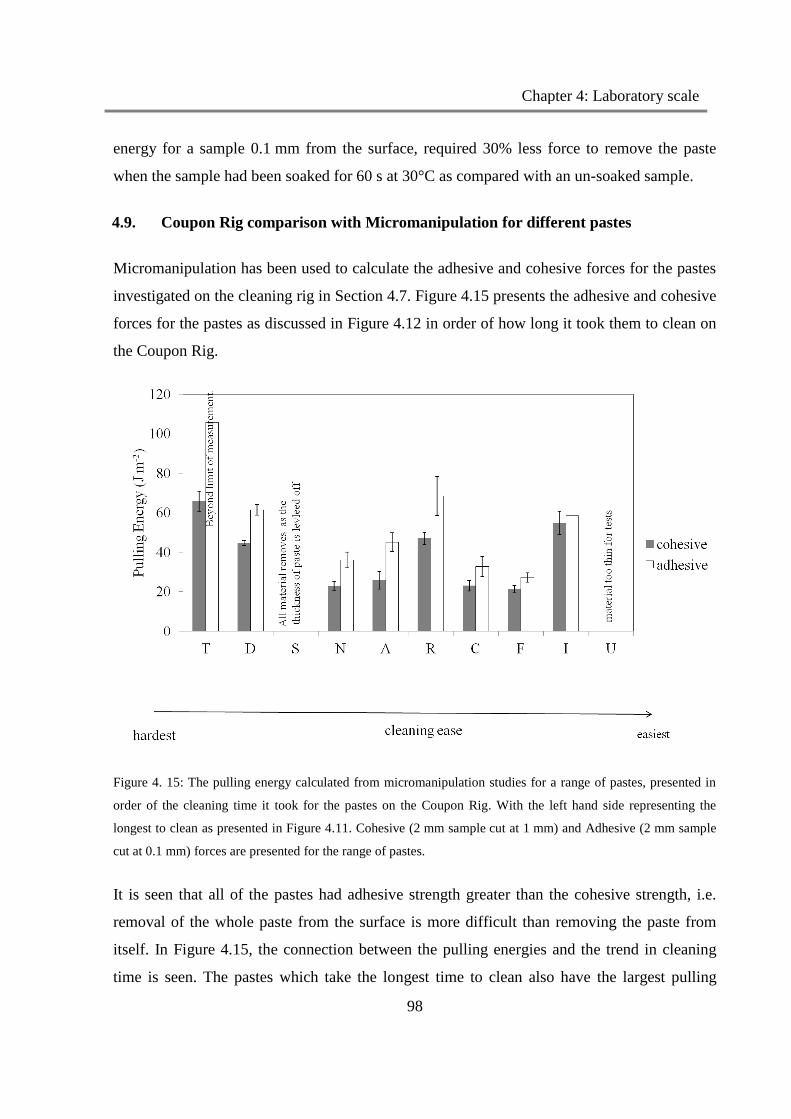
Chapter 4: Laboratory scale
98
energy for a sample 0.1 mm from the surface, required 30% less force to remove the paste
when the sample had been soaked for 60 s at 30°C as compared with an un-soaked sample.
4.9. Coupon Rig comparison with Micromanipulation for different pastes
Micromanipulation has been used to calculate the adhesive and cohesive forces for the pastes
investigated on the cleaning rig in Section 4.7. Figure 4.15 presents the adhesive and cohesive
forces for the pastes as discussed in Figure 4.12 in order of how long it took them to clean on
the Coupon Rig.
Figure 4. 15: The pulling energy calculated from micromanipulation studies for a range of pastes, presented in
order of the cleaning time it took for the pastes on the Coupon Rig. With the left hand side representing the
longest to clean as presented in Figure 4.11. Cohesive (2 mm sample cut at 1 mm) and Adhesive (2 mm sample
cut at 0.1 mm) forces are presented for the range of pastes.
It is seen that all of the pastes had adhesive strength greater than the cohesive strength, i.e.
removal of the whole paste from the surface is more difficult than removing the paste from
itself. In Figure 4.15, the connection between the pulling energies and the trend in cleaning
time is seen. The pastes which take the longest time to clean also have the largest pulling

Chapter 4: Laboratory scale
99
energies and the pastes which take the least time to clean have the smallest pulling energies.
All of the studied pastes follow this general trend with the exception of Paste R, which is the
third quickest to clean but has high cohesive and adhesive forces. The adhesive or cohesive
strength has been plotted directly against the cleaning time, but no strong relationship was
seen. Although a predictive relationship between the pulling forces and the cleaning time is
not seen, this trend in behaviour may be of use when grouping products with regard to using
similar cleaning conditions. This could enable the current portfolio of products and their
cleaning regimes to be compared with new products, and a starting point for a cleaning
program established.
4.10. Coupon Rig cleaning results compared to rheological studies for different pastes
All of the pastes were studied by rheology to gain an understanding of their bulk properties.
The flow sweeps described in Section 3.3 have been repeated for all of the pastes and the
results are shown in Figure 4.16.
Figure 4.16: Rheology flow sweeps for all the pastes investigated in this work, plot of viscosity vs. shear rate.

Chapter 4: Laboratory scale
100
The behaviour of most of the pastes is seen to be very similar with the viscosity reducing with
the increase in shear rate. There are two exceptions to this, Paste T has a different gradient to
the other pastes and is a lot more viscous. This explains why this paste is thought of as the
most difficult to clean, when the removal behaviour is dominated by mass transfer of the paste
due to fluid flow. Paste U, is a much less viscous material, and has been seen in Section 4.7 to
clean much quicker than the other pastes. The toothpastes follow Herschel-Bulkley behaviour,
and all the pastes have been model fit using the TA rheometer software and the results are gas
shown in Table 4.4, with the Herschel Bulkley parameters as per equation 4.4.
σ= σy + K σn (4.4)
Table 4.4: Herschel Bulkley parameters from the TA rheometers model fit function, for different pastes
Paste
HB model fit –
a yield stress – σy b, viscosity, K c, rate index, n
standard
error
T 368500 368700 0.0000629
D 43.91 284.8 0.1729 13.44
S 132.9 340.9 0.09462 26.2
N 132.8 614.3
A 55.89 80.47 0.5413 9.6
R 61110 61.28 0.0003005 21.3
C 35.82 79.66 0.3092 14.8
F 82020 13.42 0.7856 64.3
I 122.6 14.29 1.035 26.7
U 0.2086 13.42 0.7856 0.4
These parameters have been compared to the cleaning time for experiments on the Coupon
Rig, the results for the viscosity term of the Herschel-Bulkley model are shown in
Figure 4.17.

Chapter 4: Laboratory scale
101
Figure 4. 17: Rheology: Herchel-Bulkley viscosity term from the pastes model fit versus cleaning time from the
cleaning experiments for Coupon Rig for experiments conducted at 40°C and 0.37 m s-1
, a number of pastes
were investigated, each paste formulation is defined by a letter.
Figure 4.17 presents a logarithmic relationship between the fitted viscosity Herschel-Bulkley
parameter and cleaning time for all the pastes investigated (excluding Paste D) as given by
equation 4.5:
Time (s) = 303 ln (ViscosityHB) -139 (4. 5)
Paste D did not follow the same trend as the other pastes, having a quicker cleaning time than
its viscosity would suggest when compared with the other pastes. It has a significantly
different composition from the other pastes and so the bulk properties of the pastes have been
explored further to understand the viscoelastic properties and the data reported in Figure 4.18.

Chapter 4: Laboratory scale
102
Figure 4.18: Viscoelastic rheology studies for different pastes, showing both the viscous and elastic modulus.
Figure 4.18 shows the viscous and elastic modulus for the pastes investigated, the pastes have
similar profiles, with the exception of paste D which has a different behaviour, and hence
does not follow the same rheological characteristics as the other pastes. This is explored
further in Figure 4.19.

Chapter 4: Laboratory scale
103
Figure 4.19: Viscoelastic rheology experiment for Paste D, showing that G‟ and G‟‟ cross, and so this has
viscoelastic behaviour.
Figure 4.19 shows that Paste D has a different behaviour from the other pastes, which is why
it doesn‟t fit the Herschel-Bulkley viscosity term relationship with cleaning time on the
Coupon Rig, which the other pastes follow. This viscosity Herschel-Bulkley relationship with
Coupon Rig is a potentially significant finding in terms of predicting cleaning behaviour for
similar toothpaste products and being able to group them into appropriate cleaning regimes. It
would be interesting in future work to identify other Herschel-Bulkley materials and see if
this predictive cleaning time model could be extended to other materials.
4.11. Summary
The cleaning of toothpaste has been investigated on the PIV enabled (circular) coupon rig
developed by Ab Aziz (2007) and on a rig developed further based on these principles
referred to as the Coupon Rig. This has square coupons and is capable of higher flow rates
than the previous equipment. Toothpaste was placed on a coupon in a flow channel so that the
toothpaste protruded into the flow stream and was removed by the fluid flow. Removal at all
studied flow rates (0.25 m s-1
- 0.5 m s-1
) and temperatures (20 – 50°C) was dominated by
erosion of the toothpaste into the flow stream. This paste was removed first from the leading
fluid edge. Magnified images of the side profile of the toothpaste sample show that a wave
was formed at the side of the sample contacting the leading fluid edge, and the wave was seen

Chapter 4: Laboratory scale
104
to „flow‟ across the surface of the paste, until it reached the other side of the paste and the part
of the paste involved in the wave was then eventually removed into the flow stream. These
interactions were computationally modelled by Sahu et al (2007). This wave effect was
attributed to density differences in the paste.
As the flow rate was increased into the turbulent range, another removal mechanism was
sometimes observed, where the paste curled away from the paste surface, but remained
attached to the rest of the toothpaste sample coating the surface. This flap of paste then
fluttered and curled in the flow stream, and gradually worked itself away from the coupon
surface, until eventually the paste was torn away from the rest of the paste attached to the
surface and was removed into the flow steam.
The measurement of the cleaning experiments at laboratory scale was performed by image
analysis of the paste removal over time, which was used to calculate the change in foulant
area over time and also monitored by calculating heat transfer coefficients. The „clean‟ image
was used to calculate a cleaning time for each individual experiment.
Comparison of cleaning times from cleaning experiments where the cleaning water was at
different temperatures and velocities, showed a slight decrease in average cleaning time as the
velocity was increased and as the temperature was increased from ambient (20°C) to heated
temperatures (40°C and 50°C), although very little difference was noted between the heated
conditions. A trend with Reynolds number and cleaning time was observed, where the
Reynolds number captured both the temperature and velocity effects.
The toothpaste has been compared with other deposit types investigated by previous authors
using similar equipment. Both toothpaste and baked tomato paste are capable of being
removed by fluid flow and have been found to have similar cleaning times. These types of
materials have been classified as Type 1 materials by the Fryer and Asteriadou (2009)
definition. It was found that whey protein deposit takes significantly longer to clean than the
Type 1 deposits at its mildest cleaning conditions, which is a very low amount of chemical in
the cleaning fluid stream, removal happens through extensive physical cleaning. This sort of
cleaning where some removal can happen through physical removal, but chemical action was
Chapter 4: Laboratory scale
105
required before full removal can happen was Type 2 behaviour according to the Fryer and
Asteriadou (2009) definition. Finally Egg Albumin deposit was investigated and removal was
found to happen only with chemical action and so was a Type 3 deposit according to the Fryer
and Asteriadou (2009) definition.
Several pastes have been investigated under the same conditions on the Coupon Rig and have
been compared according to cleaning time. The different pastes behave in different ways and
this can impact the cleaning times. Micromanipulation studies have taken place on all the
pastes. The cohesive forces of the pastes are measured at a variety of cut heights, and it is
found that the cohesive forces are similar (51 – 54 J m-2
) across the cut heights 0.8 mm and
0.4 mm. The adhesive force is stronger than the cohesive force in all pastes. This is the force
between the coupon surface and the paste calculated from a cut height of 0.1 mm. Some work
has been performed hydrating the paste samples, it was found that this reduced the pulling
energy and so increased cleaning ease is expected.
Significant similarities are found between the cleaning trends in the micromanipulation
studies and the cleaning ease for different pastes found from the cleaning rig data. These
similarities allow products to be grouped and different intensity cleaning regimes to be
developed, which would reduce over-cleaning of the easier to remove pastes. This could be
used in the early stages of product development to enable future down-time to be reduced.
Pastes have been modelled with the viscosity term of the Herchel-Bulkley rheological model,
compared to the cleaning times found from the cleaning rig. This produced a logarithmic
relationship and shows that potential exists to find predictive cleaning algorithms based on
rheology.

Chapter 5: Pilot scale cleaning studies
106
CHAPTER 5: PILOT SCALE CLEANING
STUDIES
Cleaning studies were performed on two pilot scale systems and the results are reported in
this chapter. The facilities used were:
Pipe Rig: Work is reported in this chapter from experiments on the Pipe Rig presented
in Section 3.6.1. These experiments were conducted at low flow rates and the whole
pipeline system was filled with paste. The cleaning time was based on the time taken
to reach a visually clean state, and was monitored first by the time taken to clean the
plastic clear sections of the equipment and then the internal pipe cleanliness was
assessed by opening the pipe at strategic points and visually checking the pipe with a
torch. As the experiment time was so long, the error associated with the cleaning time
end point was proportionally low (± 30 s, for experiments taking from 10 mins to 6
hours).
ZEAL Pilot plant: The main body of this experimental work has been undertaken on
the ZEAL Pilot Plant. The details of the experimental set-up are included in Section
3.6. This rig has measurement equipment that can be used to detect cleaning end-point
and will be discussed further in Sections 5.2 – 5.5.
This Chapter presents cleaning experiments for toothpaste from pipe-line by water cleaning.
Firstly, the removal mechanisms for toothpaste will be studied, visually and by a variety of
on-line measurements discussed in Sections 5.2 and 5.3. The cleaning experiments have been
monitored by on-line measurement techniques which are examined and evaluated to
determine a cleaning end-point in Section 5.3. Cleaning experiments have been conducted at a
range of velocities and temperatures and the impact on cleaning time is presented in
Sections 5.6 and 5.7.

Chapter 5: Pilot scale cleaning studies
107
Scale-up studies have been conducted at different pipe lengths and diameters and where
possible, appropriately scaled flow velocities and temperatures to see if scale-up rules can be
developed for pipelines which have the same geometry.
5.1. Removal Mechanisms: Images of removal
Low Flow Rates – Pipe Rig: Experiments were conducted at low flow velocities of 0.5 m s-1
to 1.3 m s-1
. The set-up of the Pipe Rig was described in Section 3.6.1. The cleaning
experiment protocol was to fill the equipment with toothpaste, including the inlet and outlet
pipe-work to the test section (the pipe-line of interest). Once filled, the paste was left for ~ 5
mins to allow it to reform and then was removed with pre-heated water. Velocity was set by
adjusting the inverter frequency such that in an empty pipe the velocity was known.
Figure 5. 1: Pipe Rig, Experimental features of a low flow velocity cleaning experiment (0.5 m s-1
based on clean
tube measurement), ambient temperature ~ 15°C. Images taken at the end of a 47.7 mm ID pipe, 2 m pipe length.
Images taken at i) 2 mins, ii) 10 mins, iv) 42 mins, vi) 72 mins, vii) 108 mins and viii) 211 mins. The total
experimental time was 6 hours at which point the pipeline was still unclean.
Figure 5.1 shows images taken from the end of a pipe length of 2 m, 47.7 mm ID diameter, at
various time intervals during the experiment where the cleaning water was at ambient
i) ii) iii) iv)
v) vi) vii) viii)

Chapter 5: Pilot scale cleaning studies
108
temperature and a very low flow rate condition, 0.5 m s-1
in a clean pipe, corresponding to
clean pipe Reynolds number ~ 23,000. The images show that the water breaks through the
toothpaste filled pipe within the first 2 minutes, the core that is removed accounts for the
upper third of the pipe, and the paste fills the bottom section of the pipe. Transparent pipe
sections were positioned at the start and end of the pipe on the Pipe Rig. The toothpaste was
observed to remove in very similar ways to that seen in the coupon rig experiments reported
in Section 4.1 where small sections of paste were seen to lift away slightly from the clear
plastic wall surface and flutter in the fluid motion. As time progressed, these small sections of
fluttering paste increased in size by rolling more of the connecting paste away from the
surface. The paste flap then tore away from the attached paste and so experienced cohesive
failure at a weakened point in the paste structure. It was then removed in a large chunk which
passed through the system intact. Observation of sudden „flushes‟ of white colour related to
upstream toothpaste removal were observed in the second clear pipe section.
The bulk paste was removed in approximately 42 minutes, and a layer of paste was left
coating the pipe wall. This long process occurred as the water ran over the top of the paste
layer rather than breaking into the remaining paste and removing it. The paste was a viscous
material, which had structural integrity and it was able to resist the force applied to it by the
fluid at this low flow rate. Samples of the toothpaste were taken and measured rheologically
and the toothpaste found to have a viscosity similar to that of a sample of toothpaste which
had been diluted in water to make up an 80% toothpaste suspension (data such as Figure 3.4.).
It is likely that the reduction in viscosity was due to the toothpaste sample having water
present which was then mixed into the toothpaste sample used for rheological testing. It
seems that toothpaste maintains its structure, and that dilution is not a dominant process in the
breakdown of the toothpaste structure. It took some hours to remove the thick layer of paste
which was left coating the wall; the wall coating was at the wall surface where the velocity
tends to zero. The paste layer had evidence of ripples on the surface of the paste observed in
Figure 5.1 (iv). There was also evidence of waves, suggested from the mathematical
modelling by Sahu et al. (2009). Sahu et al. (2009) found that waves occurred due to the
presence of weaknesses in the material structure, where there were tiny density differences in
the paste which gave rise to the wave effect.

Chapter 5: Pilot scale cleaning studies
109
In numerical and theoretical modelling studies by Sahu et al. (2009) two distinct regimes in
the cleaning behaviour were identified. The first, characterised as a 'core removal', showed a
linear drop in soil volume with time at a rate corresponding to the volumetric flow-rate. The
second cleaning behaviour identified was a 'film removal' regime which depicted a non-linear
removal of soil with time. This modelling work was concerned with miscible soils being
removed by cleaning fluids at low flow-rates (Re < 1000). However, the principles seem to be
relevant here. The images shown in Figure 5.1, support the theoretically identified
mechanisms reported by Sahu et al. (2009) and show initially that a „core‟ was removed from
the centre of the pipeline, and a coating was left on the walls. However, the duration of the
experiment was such that cleaning of this sort would be unacceptably long in any commercial
system.
Turbulent Flow - ZEAL Pilot Plant: The ZEAL Pilot Plant allows access to industrial scale
turbulent flow regimes for pipe-line cleaning. Figure 5.2 illustrates the impact in terms of
toothpaste removal in pipeline experiments at higher and more industrially interesting
velocities than that seen in Figure 5.1.

Chapter 5: Pilot scale cleaning studies
110
i) ii) iii)
iv) v)
Figure 5. 2: ZEAL Pilot Plant, Images for a cleaning experiment for a pipe of 0.5 m length and 47.7 mm ID
diameter filled with toothpaste, cleaned at 50°C and 1.1 m s-1
(0.002 m3s
-1) based on empty pipe velocity. The
experiment was stopped at various time intervals and the pipe opened to reveal the contents of the pipe. The
images correspond to cleaning times: i) 0 s, before the experiment - fully filled with toothpaste, ii) after 1 s,
Optek turbidity reading saturated (≥50 ppm), iii) after 15 s, Optek turbidity reading saturated (≥50 ppm), iv)
after 200 s, Optek turbidity reading 22 ppm, v) after 5420 s, Optek target turbidity of 4ppm, some small islands
of toothpaste are still visible.
As seen previously in the low flow rate case, there are several stages in the cleaning of
toothpaste as illustrated in Figure 5.2:
(i) In the first stage, core removal, a core of toothpaste was displaced from the pipe;
(ii) After a short time (just greater than tr = V/Q, i.e. the mean residence time(tr) of the
water, flow rate (Q m3 s
-1) through volume (V m
3) water breaks through to the end of
the pipe, leaving a thick layer on the wall;
(iii) Thin film removal then occurred, as the layer of material on the wall was sheared away
by fluid action;

Chapter 5: Pilot scale cleaning studies
111
(iv) In the final stage, patches of deposit were seen on the surface and these were gradually
removed into the fluid flow;
(v) The selected near clean condition associated with an outlet turbidity reading of 4 ppm
is shown in Figure 5.2 (v). This value was close to cleanliness but above some
variance in the data attributed to noise; this is discussed in more detail in Section 5.4.
As the experiment progressed the coating slowly thinned and coated less of the circumference
of the pipe; leaving a thin layer at the base of the pipe. Slow removal of the paste from the
pipe wall was expected. This thin coating layer was present at the wall, in the boundary layer
of the pipe where the flow tends to zero. Thin film layer removal has been found to be the rate
limiting step in toothpaste removal by fluid flow in a pipe. As the experiment progressed, the
patches of paste which remained on the wall surface were gradually eroded by continued fluid
flow as observed in Figure 5.2.
5.2. Cleaning Profiles, on-line measurements
Progress of the cleaning experiments on the ZEAL Pilot Plant was monitored by on-line
measurements, - principally turbidity and conductivity which were identified as measurements
which could successfully track the cleaning to an appropriate end-point. The measurements
provide supporting evidence for the cleaning mechanism visually monitored and reported in
Section 5.2.
5.2.1. Conductivity Measurements
Inductive Conductivity: Inductive conductivity is the measure of the bulk fluid conductivity in
this process, its positioning and use on the ZEAL Pilot plant was discussed in Section 3.6.2
Measurements were taken at the inlet and outlet of the test section on the ZEAL Pilot Plant,
representative data are shown in Figure 5.3.

Chapter 5: Pilot scale cleaning studies
112
Figure 5. 3: ZEAL Pilot Plant, Inductive conductivity response. Probe responses for inlet and outlet
measurements for a toothpaste filled 47.7 mm ID diameter, length 1 m pipe, Cleaning conditions: velocity based
on a clean tube: 1.7 m s-1
(0.003 m3 s
-1), temperature: 20°C. Data collected at conductivity setting 2.
Figure 5.3 presents the conductivity difference profile; where the measurement includes the
inlet conductivity reading related to the underlying water conductivity of ~0.11 mS cm-1
.
Results show:
At t = 0 the pump was started. The outlet conductivity meter was positioned 11 m
from the inlet conductivity meter. At a flow velocity of 1.7 m s-1
, toothpaste took ca.
6 s to reach the conductivity meter from the start of the experiment. A conductivity of
~0.11 mS cm-1
was seen, relating to a difference of zero, was seen between 0 and 6
seconds as water in the system was pushed out.
At t = 6 s, the conductivity reading rapidly peaked as the main toothpaste plug
travelled past the probe and started to reduce after t = 12 s.
After this point, the conductivity reading decreased as less toothpaste was detected;
this corresponded to the thin film cleaning stage. As the equipment was cleaned, the
conductivity difference reading started to tend towards ~0.11 mS cm-1
(clean water) at
t = 300 s.

Chapter 5: Pilot scale cleaning studies
113
The outlet conductivity trend dominated the conductivity difference plot shown in Figure 5.3.
By considering the underlying water conductivity it was possible to identify a point at which
the reading tended to the same as the clean system, and hence this was the limit of
conductivity detection for the toothpaste removal experiment. This occurred at t = 300 s, the
pipe-line was visually still not clean at ~ 715 s. The inductive conductivity has limited value
for estimating the cleaning end-point of the toothpaste experiments.
Conductive measurements: The conductive measurement instrument present in the ZEAL Pilot
Plant were described in Section 3.6.2 and comprised of sensors situated on a flat surface
positioned so that the sensors were flush to the pipeline directly after the filled pipe section.
The measurement response for the conductive instrument through the course of a cleaning
experiment is given in Figure 5.4.
Figure 5. 4: ZEAL Pilot Plan, Conductivity profiles for a filled pipe of 47.7 mm diameter, 1 m length, for
cleaning conditions of 1.7 m s-1
(0.003 m3 s
-1) based on a clean tube, and 20°C. This plot compares the output for
the inductive conductivity readings presented in Figure 5.3 and the conductivity surface sensors. Not visual clean
at ~715 s.
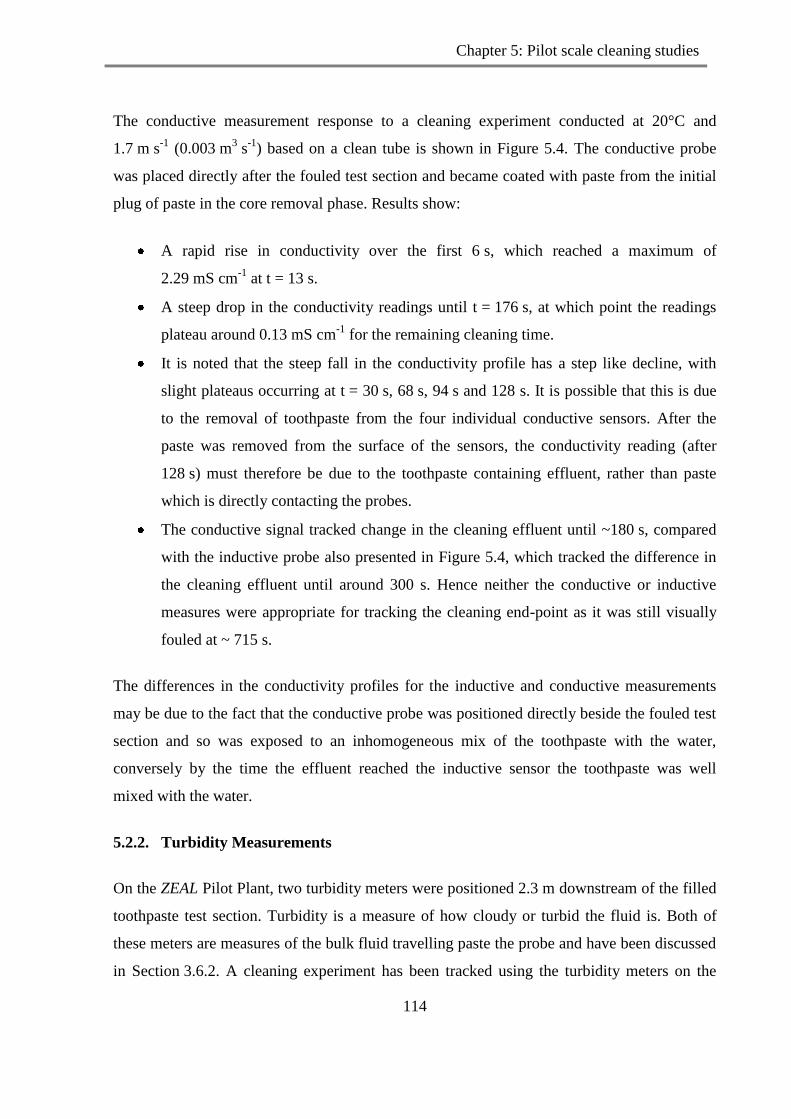
Chapter 5: Pilot scale cleaning studies
114
The conductive measurement response to a cleaning experiment conducted at 20°C and
1.7 m s-1
(0.003 m3 s
-1) based on a clean tube is shown in Figure 5.4. The conductive probe
was placed directly after the fouled test section and became coated with paste from the initial
plug of paste in the core removal phase. Results show:
A rapid rise in conductivity over the first 6 s, which reached a maximum of
2.29 mS cm-1
at t = 13 s.
A steep drop in the conductivity readings until t = 176 s, at which point the readings
plateau around 0.13 mS cm-1
for the remaining cleaning time.
It is noted that the steep fall in the conductivity profile has a step like decline, with
slight plateaus occurring at t = 30 s, 68 s, 94 s and 128 s. It is possible that this is due
to the removal of toothpaste from the four individual conductive sensors. After the
paste was removed from the surface of the sensors, the conductivity reading (after
128 s) must therefore be due to the toothpaste containing effluent, rather than paste
which is directly contacting the probes.
The conductive signal tracked change in the cleaning effluent until ~180 s, compared
with the inductive probe also presented in Figure 5.4, which tracked the difference in
the cleaning effluent until around 300 s. Hence neither the conductive or inductive
measures were appropriate for tracking the cleaning end-point as it was still visually
fouled at ~ 715 s.
The differences in the conductivity profiles for the inductive and conductive measurements
may be due to the fact that the conductive probe was positioned directly beside the fouled test
section and so was exposed to an inhomogeneous mix of the toothpaste with the water,
conversely by the time the effluent reached the inductive sensor the toothpaste was well
mixed with the water.
5.2.2. Turbidity Measurements
On the ZEAL Pilot Plant, two turbidity meters were positioned 2.3 m downstream of the filled
toothpaste test section. Turbidity is a measure of how cloudy or turbid the fluid is. Both of
these meters are measures of the bulk fluid travelling paste the probe and have been discussed
in Section 3.6.2. A cleaning experiment has been tracked using the turbidity meters on the

Chapter 5: Pilot scale cleaning studies
115
ZEAL Pilot Plant, where the cleaning conditions are 40°C and 1.5 m s-1
(0.003 m3 s
-1) based
on a clean tube. The resulting turbidity profiles are presented in Figure 5.5.
Figure 5.5: ZEAL Pilot Plant, Turbidity data for a two tank experiment run conducted on a diameter 47.7 mm,
1 m length system at cleaning conditions of 40°C and 1.5 m s-1
(0.003 m3 s
-1) based on a clean tube. The Kentrak
turbidity unit response (FTU) is given on the right hand axes and shows values over the entire experiment as it is
calibrated to measure over the range 0 – 500 FTU. The Optek turbidity unit response (nominal ppm) is on the left
hand axes and is calibrated to be more sensitive at the low values and so gives a saturated reading above 50 ppm,
but has increased sensitivity at the end of the cleaning experiment.
The turbidity profiles from the two different sensors for a toothpaste cleaning experiment
conducted at cleaning conditions of 40°C and 1.5 m s-1
(0.003 m3 s
-1) based on a clean tube is
presented in Figure 5.5. The Kentrak turbidity (FTU) meter measured over a 0-500 FTU
range, and the Optec meter from 0-50 ppm (nominal).
the first 3.5 s (to point A) of low turbidity readings on the FTU meter were related to
the removal of water within the pipe-work, the turbidity then rose rapidly at t = 3.5 s
as the removed toothpaste travelled past the turbidity meters. At about t = 6.5 s (point
Chapter 5: Pilot scale cleaning studies
116
B) the saturated reading of the Optec meter was reached. This correlated with the
residence time for water from the pump to reach the turbidity meter.
after the core removal there was a drop (point B to C) in turbidity (on the Kentrak
(FTU) meter, whilst the Optec (ppm) meter stayed saturated);
as thin film cleaning commenced, a rise (point C to D) in turbidity was again seen as
toothpaste was transferred from the wall coating into the bulk effluent. This was
followed by a gradual reduction (after point D) as less toothpaste was left to remove;
at some stage the concentration in the outlet region was such that the second meter
became un-saturated; the final stages of cleaning were followed more effectively using
the Optek turbidity (ppm) meter,
the two turbidity readings reached a low value comparable to water at the end of the
experiment (0 FTU, >0.5 ppm).
The turbidity meters were able to track the cleaning of the toothpaste from the pipe well, over
the duration of the experiments, and the Optek turbidity meter is sensitive at the end of the
experiment.
5.3. End-point Detection
An assessment is now required to identify which measurement(s) give the most accurate and
repeatable evaluation of the cleaning time. The data from the on-line measurement
instruments was, at a certain level indistinguishable from the noise in the system and
therefore, beyond the sensitivity of the equipment. To assess limits of detection, the
measurements were assessed in relation to each other for a particular experiment, and the
plots are shown in Figure 5.6.

Chapter 5: Pilot scale cleaning studies
117
i) ii)
iii) iv)
Figure 5.6: ZEAL Pilot Plant, The system set-up for the experiment was 47.7 mm ID pipe diameter of length 2 m.
The cleaning conditions are 20°C and velocity based on clean tube of 1.7 m s-1
(0.003 m3s
-1). Measurement
profiles for one experiment collected over the experiment time. These comprised of i) inductive conductivity
difference (mS cm-1
) corrected for residence time, ii) conductive response (mS cm-1
), iii) turbidity response
(FTU) from the Fembrax turbidity meter, iv) turbidity response (nominal ppm) from the Optek turbidity meter.
From a comparison of the data plotted in Figure 5.6, it is observed that the inductive measure
is an asymptote, tending to zero at t ~ 200 s. The conductive response is asymptotic, tending
to zero ~ 250 s. At this point the pipe line was not clean. The turbidity data from the Kentrak
turbidity meter showed significantly more definition than either of the conductivity measures
and tended to zero ~ 450 s. The final measurement shown in Figure 5.6, for the Optex
turbidity meter, which measured a response until ~ 800 s. In this experiment, the pipeline was
cracked open at ~ 715 s and a few patches of paste were visually observed, the equipment was
reassembled and cleaning continued. At ~ 900 s the experiment was stopped and the
equipment was visually clean and the equipment swabbed. The swab reading was 4.55 µg of
fluoride per swab, which is within the acceptable threshold. The measurement trends given in
this example are typical of all the toothpaste experimental data. The Optek turbidity meter
was found to be the most sensitive online measure for monitoring the toothpaste cleaning on

Chapter 5: Pilot scale cleaning studies
118
the ZEAL Pilot Plant. The toothpaste could still be visually observed in low quantities at the
low end of the measurement spectrum.
A numerical reading of 4ppm from the Optek turbidity meter was chosen to define the
end-point for this work. It is at the low end of the scale for this measurement and outside the
area where electrical noise affects the signal (-2 to +2 ppm) as seen in Figure 5.6. The pipe is
>99% clean by image analysis at this value, with 0.2% of the starting weight remaining.
5.4. Repeatability of measurement.
The error for the cleaning end-point was gained by repeating experiments with the same
experimental conditions. The turbidity measurement responses for three comparable
experiments are shown in Figure 5.7. They are all found to follow similar trajectories, with
the meter becoming de-saturated at the same time, and the tail of the experiments having very
similar profiles.
i) ii)
ii)
Figure 5. 7: ZEAL Pilot Plant, System: 47.7 mm ID diameter, 1 m length. Cleaning condition: temperature 40°C,
velocity 1.5 m s-1
based on clean tube (0.003 m3s
-1). Repeatability test for Optek turbidity for three experiments:
i) the turbidity range between 0 – 50 ppm, ii) the scale shown is 0 – 5 ppm. The cleaning criteria is 4 nominal
ppm, for these experiments the cleaning time is 184 ± 2 s.
This plot shows that the experiments are repeatable and that the chosen end-point value gives
reliable results, with the three experiments reaching a value of 4 ppm at 184 ± 2 s, giving a
very minimal variation.
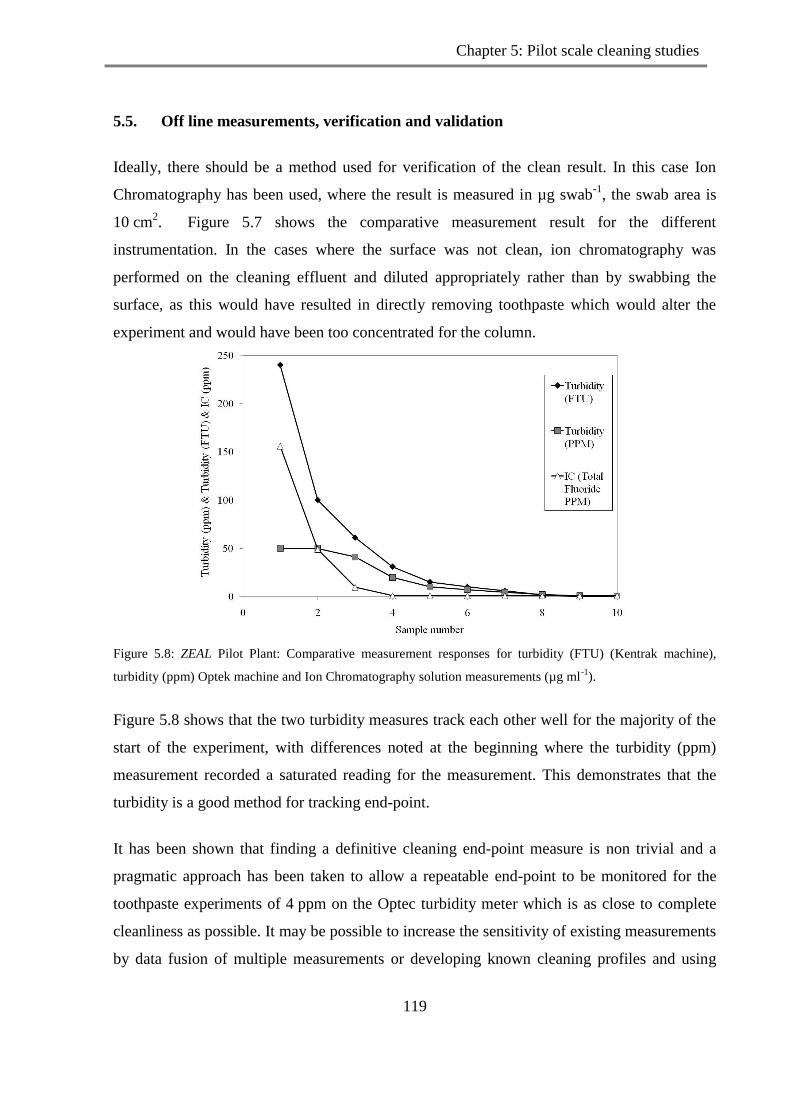
Chapter 5: Pilot scale cleaning studies
119
5.5. Off line measurements, verification and validation
Ideally, there should be a method used for verification of the clean result. In this case Ion
Chromatography has been used, where the result is measured in µg swab-1
, the swab area is
10 cm2. Figure 5.7 shows the comparative measurement result for the different
instrumentation. In the cases where the surface was not clean, ion chromatography was
performed on the cleaning effluent and diluted appropriately rather than by swabbing the
surface, as this would have resulted in directly removing toothpaste which would alter the
experiment and would have been too concentrated for the column.
Figure 5.8: ZEAL Pilot Plant: Comparative measurement responses for turbidity (FTU) (Kentrak machine),
turbidity (ppm) Optek machine and Ion Chromatography solution measurements (µg ml-1
).
Figure 5.8 shows that the two turbidity measures track each other well for the majority of the
start of the experiment, with differences noted at the beginning where the turbidity (ppm)
measurement recorded a saturated reading for the measurement. This demonstrates that the
turbidity is a good method for tracking end-point.
It has been shown that finding a definitive cleaning end-point measure is non trivial and a
pragmatic approach has been taken to allow a repeatable end-point to be monitored for the
toothpaste experiments of 4 ppm on the Optec turbidity meter which is as close to complete
cleanliness as possible. It may be possible to increase the sensitivity of existing measurements
by data fusion of multiple measurements or developing known cleaning profiles and using

Chapter 5: Pilot scale cleaning studies
120
these to build more sophisticated control algorithms based on historic data. Work in these data
combination approaches has been done by Newcastle University in work associated with the
ZEAL Program. Now that a cleaning end point has been established (nominal 4 ppm Optec
turbidity meter). This end-point can be used to compare the impact of cleaning time due to
adjusting the process parameters in the cleaning conditions as reported in Section 5.6 and 5.7.
Also scale-up comparisons can be made between different pipe geometries; this will be
presented in Sections 5.8 and 5.10.
5.6. Process Parameters – Effect of temperature
In this section, the effects of varying the temperature of the cleaning water are assessed and
any differences or trends identified. Ultimately this kind of knowledge allows processes to be
optimised and enables decisions to be made based on the business need, i.e. for reduced down
time or decreased energy cost. The temperature of the cleaning fluid will affect the cleaning
rate, by increasing the turbulence in the fluid, and potentially making diffusion of the cleaning
water into the paste more significant. In this section, experiments have been performed under
otherwise similar conditions with the cleaning water heated to different temperatures. The
effect of temperature on cleaning time at constant velocity is given in Figure 5.9.
Figure 5. 9: ZEAL Pilot Plant: The system which has been investigated is pipe length 1 m and diameter
47.7 mm ID. The cleaning fluid conditions, velocity 1.7 m s-1
(0.003 m3 s
-1) based on a clean tube. Cleaning time
as a function of temperature for temperatures of 20°C, 30°C, 40°C, 50°C and 70°C. All conducted on Paste T,
The error bars are based on three experiments with the exception of 70°C which is one experiment.
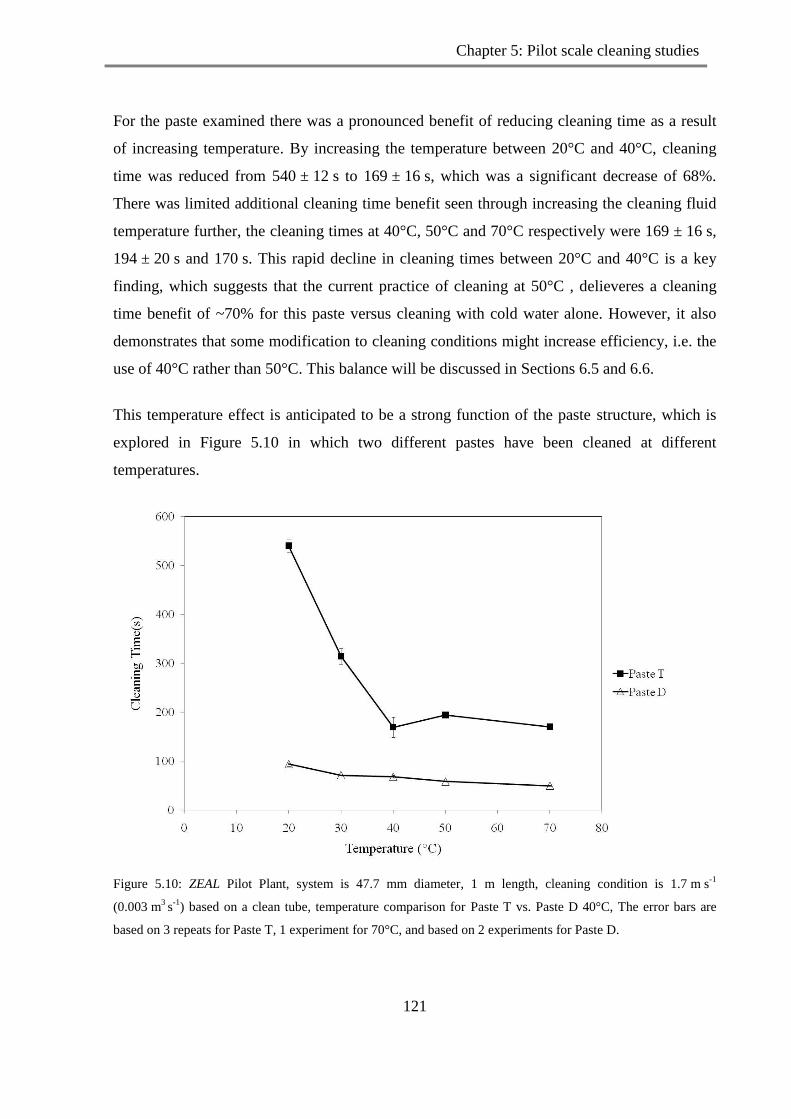
Chapter 5: Pilot scale cleaning studies
121
For the paste examined there was a pronounced benefit of reducing cleaning time as a result
of increasing temperature. By increasing the temperature between 20°C and 40°C, cleaning
time was reduced from 540 ± 12 s to 169 ± 16 s, which was a significant decrease of 68%.
There was limited additional cleaning time benefit seen through increasing the cleaning fluid
temperature further, the cleaning times at 40°C, 50°C and 70°C respectively were 169 ± 16 s,
194 ± 20 s and 170 s. This rapid decline in cleaning times between 20°C and 40°C is a key
finding, which suggests that the current practice of cleaning at 50°C , delieveres a cleaning
time benefit of ~70% for this paste versus cleaning with cold water alone. However, it also
demonstrates that some modification to cleaning conditions might increase efficiency, i.e. the
use of 40°C rather than 50°C. This balance will be discussed in Sections 6.5 and 6.6.
This temperature effect is anticipated to be a strong function of the paste structure, which is
explored in Figure 5.10 in which two different pastes have been cleaned at different
temperatures.
Figure 5.10: ZEAL Pilot Plant, system is 47.7 mm diameter, 1 m length, cleaning condition is 1.7 m s-1
(0.003 m3 s
-1) based on a clean tube, temperature comparison for Paste T vs. Paste D 40°C, The error bars are
based on 3 repeats for Paste T, 1 experiment for 70°C, and based on 2 experiments for Paste D.

Chapter 5: Pilot scale cleaning studies
122
The effect of varying cleaning water temperature on the cleaning time for the two pastes is
seen in Figure 5.10.
The different pastes were found to have different responses to temperature.
The conditions are otherwise the same, so this difference is due to material structure
and rheology as previously discussed in Section 4.10.
Paste D has a different behaviour from Paste T, with a slight and steady decline across
all temperatures, rather than a significant drop as seen for Paste T
Paste T takes longer than Paste D under all conditions. At 40°C, Paste T took 200 s, to
clean compared with Paste D at ~ 50 s.
It is important to note that similar products can be substantially different in their behaviour.
C.I.P programs could be designed to accommodate different levels of cleaning severity
according to the properties of different pastes, many benefits could be realised from using the
least severe conditions when the paste is not the „worse case‟ paste. This will be explored
further in Chapter 6.
5.7. Process parameters – Effect of Velocity
5.7.1. The effect of low flow velocities: Pipe Rig.
Toothpaste has been studied as a model soil for materials which can be removed by fluid
mechanics alone, as a part of the broader aims of project ZEAL introduced in Section 1.2. A
limited number of experiments were conducted at low flow rates on the Pipe Rig which was
described in Section 3.6.1. The resulting effect of low velocity versus cleaning time is
presented in Figure 5.11. The cleaning time has been determined visually but the experiments
take so long that the variation due to the cleaning end-point identification is small (± 30 s)
compared with the experiment time.

Chapter 5: Pilot scale cleaning studies
123
Figure 5.11: Pipe Rig: System: diameter 47.7 mm ID, The cleaning velocities are based on a clean tube, the flow
rate ranges from 0.0004 m3 s
-1 – 0.002 m
3 s
-1. The cleaning times are based on the system being visually clean
and having an inherent error of ± 30 s at a variety of temperatures.
In Figure 5.2 (v), the condition of a pipe corresponding to the end-point measurement for the
ZEAL Pilot Plant is shown and it is possible to still see some small islands of paste, this shows
that visual assessment is an accurate measurement for tracking toothpaste cleaning. Some
error (± 30 s) is inherent due to the time that it is determined that the equipment is clean, but
this is small relative to the total cleaning time. The values plotted in Figure 5.11, are still
representative of a cleaning end-point. The inherent error in determining the cleaning time by
visual analysis will be proportionally greater at the higher flow rates, as the cleaning time is
shorter. The error is proportionally lower at the very long cleaning times.
Cleaning is possible under these very low flow rate conditions, 0.4 m s-1
(0.0008 m3 s
-1) and
Reynolds (water, 20°C) of 22000 based on clean tube conditions. Cleaning occurs even at
temperatures at the low end of those studied here (20°C), but takes several hours (350 mins, ~
6 hours) to reach a clean state, as seen in the cleaning times presented in Figure 5.11. This
demonstrates that fluid dynamics is the dominating removal mechanism for the cleaning of

Chapter 5: Pilot scale cleaning studies
124
the paste, as no other cleaning contributing factor, i.e. the presence of chemical, was required.
At velocities of less than 0.3 m s-1
, the time to clean the pipe was exhaustively long. At a
point between 0.3 m s-1
and 0.4 m s-1
, the cleaning time reduced by a substantial amount
dropping from ~300 mins to clean, to ~ 50 mins to clean, - a reduction of 6 times. A similar
magnitude reduction is not observed for a similar flowrate difference at higher flow rates. All
velocities are calculated based on a clean tube.
This clearly shows that there is a critical minimum velocity below which cleaning is
unacceptably long. When assessing images in Figure 5.1 and Figure 5.2, related to the low
and high flow rate removal mechanisms, it is noted that a much greater volume of paste
remains in the pipe during the low flow experiments compared with the high flow
experiments. A certain velocity was required to remove the core of the paste from the pipe,
and for velocities below this critical minimum, the flow finds the route of minimal resistance
to pass through the paste filled pipe, usually tending towards the upper surface. Under these
conditions the water flows over the top of the remaining paste until toothpaste is either
gradually picked up by the flow, or is dissolved into the flow. It is postulated that at these
very low conditions, dissolution may play a more significant role and the flow rate is so low
that the mass transfer due to fluid flow is minimal. Then as the velocity increases the removal
of paste is dominated by mass transfer from the pipe wall due to fluid flow.
5.7.2. Industrially relevant velocities
As a consequence of the very long cleaning times seen at low velocity it is apparent that
industrial cleaning must happen more quickly, and increased velocity is an obvious
suggestion to bring about reduced cleaning time in fluid dominated removal processes.
Industrial cleaning velocities have been determined using the custom made ZEAL Pilot Plant
designed to replicate and examine C.I.P. processes. Velocity have been calculated for
toothpaste cleaning experiments at a selection of velocities (all based on a clean tube) focused
around the classically recommended 1.5 m s-1
„rule of thumb‟ as discussed in Chapter 2.
Figure 5.12 shows the turbidity profiles for cleaning experiments at different velocities. The
experiments have different run lengths (each tank change is punctuated by a spike in the
turbidity measurement) as the different flow rates took differing amounts of time to empty the
water tank.
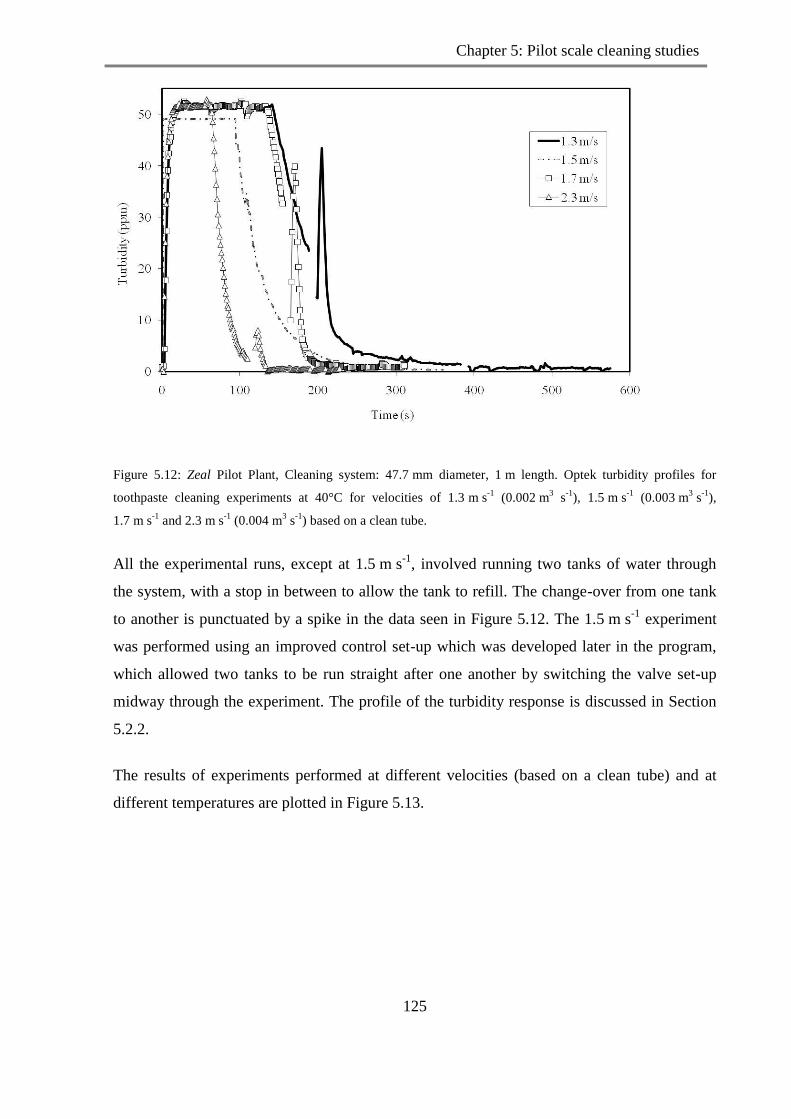
Chapter 5: Pilot scale cleaning studies
125
Figure 5.12: Zeal Pilot Plant, Cleaning system: 47.7 mm diameter, 1 m length. Optek turbidity profiles for
toothpaste cleaning experiments at 40°C for velocities of 1.3 m s-1
(0.002 m3 s
-1), 1.5 m s
-1 (0.003 m
3 s
-1),
1.7 m s-1
and 2.3 m s-1
(0.004 m3 s
-1) based on a clean tube.
All the experimental runs, except at 1.5 m s-1
, involved running two tanks of water through
the system, with a stop in between to allow the tank to refill. The change-over from one tank
to another is punctuated by a spike in the data seen in Figure 5.12. The 1.5 m s-1
experiment
was performed using an improved control set-up which was developed later in the program,
which allowed two tanks to be run straight after one another by switching the valve set-up
midway through the experiment. The profile of the turbidity response is discussed in Section
5.2.2.
The results of experiments performed at different velocities (based on a clean tube) and at
different temperatures are plotted in Figure 5.13.

Chapter 5: Pilot scale cleaning studies
126
Figure 5. 13: ZEAL Pilot Plant: System: pipe of length 1 m and diameter 47.7 mm ID: Cleaning conditions:
Effect of varying velocity, 1.0 – 2.9 m s-1
(0.002 – 0.004 m3 s
-1) based on clean tube and of varying temperature
(20°C - 70°C) of the cleaning water on cleaning time. The error is based on 3 experimental repeats; the error
bars are smaller than the data point on the graph in some instances. Power law fits are shown for the 20°C (bold
black line) and 40°C (thin black line) data.
Process parameters are not varied in isolation, and the impact of changing velocity of cleaning
water between 1 – 2.9 m s-1
and changing the temperature between 20°C and 70°C has been
studied for a 1 m length, 47.7 mm ID diameter pipe filled with toothpaste shown in Figure
5.13. A significant decrease in cleaning time was seen as the flow was increased from
1.3 m s-1
to 1.7 m s-1
and then to 2.3 m s-1
, corresponding to a reduction in cleaning time of
29% between 1.7 m s-1
and 1.3 m s-1
and 31% between 2.3 m s-1
and 1.7 m s-1
. This shows a
significant reduction in cleaning time and therefore increasing velocity is a successful method
of decreasing cleaning time, as theoretically expected.
There remains a pronounced difference between 20°C and the other temperatures, as also
noted in Section 5.6. The temperatures are clustered at the temperatures higher than 40°C.

Chapter 5: Pilot scale cleaning studies
127
Figure 5.13 shows power-law model fits plotted for the 20°C and 40°C data which give good
fits as given in equations 5.1 and 5.2.
20°C: Time = 1875 (velocity)-2.7
, R2 = 0.98 (5.1)
40°C: Time = 718 (velocity)-2.2
, R2 = 0.90 (5.2)
5.7.3. Comparing different pastes at different velocities
Two pastes were studied at different velocities and temperatures on the ZEAL Pilot Plant, so
that the different pastes could be compared. The results of this study are presented graphically
in Figure 5.14.
Figure 5.14: Zeal Pilot Plant, The system to be cleaned is diameter 47.7 mm, length 1 m, cleaning conditions at
20°C and 40°C across a range of velocities between 1 m s-1
& 3 m s-1
with the velocities based on a clean tube.
Paste T and Paste D. Errors based on 3 repeated experiments, some errors are smaller than the data point.
A clear difference was once again observed between the two pastes at different temperatures
as seen in Section 4.7 at the laboratory scale. A substantial difference was also seen in the
Chapter 5: Pilot scale cleaning studies
128
behaviour as a consequence of changing velocity. Paste D experienced a reduction in cleaning
time due to increasing the velocity, and this effect has a different profile from that seen for
Paste T. At 20°C a decrease in cleaning time is seen only between 2 m s-1
and 2.9 m s-1
, and at
40°C a decrease in cleaning time is seen between 1.5 m s-1
and 2.9 m s-1
. A much less
vigorous cleaning regime could be put in place for Paste D, as compared with Paste T.
Paste D‟s cleaning regime could operate at reasonably low flow rates (i.e. 1 m s-1
) and at
lower temperatures, as there is only a very small difference between the conditions studied.
Modelling of these processes has been carried out in the ZEAL project by Imperial College
(see for example, Sahu et al, 2007). Naraigh and Spelt (2010) discussed the interfacial
behaviour of two fluids of different viscosity and show that there is an effect of yield stress.
5.8. Scale parameters - length
It is important to develop understanding about how different scale factors affect cleaning and
to assess whether the effects observed due to varying process parameters evaluated earlier in
Sections 5.6 and 5.7, remain relevant. The effect of varying pipe length scale is assessed in
this section. The length of the filled test section was varied between 0.3 m and 2 m for a
47.7 mm ID diameter pipe. The resulting turbidity profiles are given in Figure 5.15.

Chapter 5: Pilot scale cleaning studies
129
i)
ii)
Figure 5.15: ZEAL Pilot Plant: System to be cleaned, 47.7 mm diameter. Cleaning conditions 1.7 m s-1
based on
clean tube and 40°C i) Optek turbidity profiles for different length scales, ii) Kentrak turbidity profiles for
different length scales
Figure 5.15 shows the cleaning profiles from experiments conducted at a velocity of 1.7 m s-1
based on a clean tube velocity and a temperature of 40oC in a 47.7 mm ID pipe diameter
system for various lengths. At all length scales the turbidity (FTU) profiles follow similar
trends:
at t = 0 s until t = 6 s, zero readings were recorded as water in the pipework was
passed through the system.

Chapter 5: Pilot scale cleaning studies
130
At t ~ 6 s, the turbidity rapidly rose to a peak, as the initial core was displaced.
The turbidity dropped to a primary minimum, at t ~ 25 s
This was followed by an increase at t ~ 80 s as the thin film cleaning progressed.
A decline in turbidity measurement until an end-point was then seen.
The turbidity (ppm) measurement recorded a saturated reading at all length scales until
~ 200 s, when the readings rapidly dropped. The cleaning end-point for experimental set-up
for lengths of 0.3, 1 m and 2 m was 211 ± 26 s, 169 ± 16 s and 213 ± 29 s respectively as seen
in Figure 5.16.
Figure 5. 16: ZEAL Pilot plant data: System: 47.7 mm diameter, cleaning conditions for water at 40°C and
1.7 m s-1
, velocity based on a clean tube. Cleaning times for test section pipes of length 0.3 m, 1 m and 2 m,
errors based on three repeats of the experiment.
There is no significant difference in cleaning times for pipes of lengths between 0.3 m and 2m
pipe filled with toothpaste. Initial impressions may suggest that this is counter intuitive, as
more than six times the volume of paste must be removed when comparing the 0.3 m and 2 m
systems. However, on further analysis, this result is strongly supported by the removal

Chapter 5: Pilot scale cleaning studies
131
mechanism identified in Section 5.1, where two distinct removal phases are observed, namely
a core cleaning phase followed by the thin film removal from the pipe wall.
The core removal phase is proportional to the fluid residence time, which is a function of pipe
length. The residence time difference is 0.3 s to 2 s in a 1 m s-1
process, or less at higher flow
rates, this is a very small fraction of the whole cleaning time. The total cleaning time is
therefore dominated by the thin film removal, which takes > 50 times the core removal phase,
and is not a strong function of pipe length in the range investigated here. To demonstrate that
it is the thin film removal stage that is rate limiting an experiment with a pipe of length 2 m
was conducted, where the test section comprised of two 1 m sections. At t = 1 s and towards
the end of the experiment at t = 200 s, the experiment was stopped and the pipe opened to
compare the thickness of the paste along the length of the pipeline. Results are shown in
Figure 5.17.
Figure 5.17: ZEAL Pilot Plant, System is 47.7 mm ID diameter, 2 m length. Cleaning conditions at 40°C, for
1.7 m s-1
based on a clean tube velocity. Pictures taken on the pilot plant after 1 s and 200 s, experiment showing
the amount of paste coating the pipe wall at different positions through the test section.
The thickness of paste coating the pipe wall after the core removal (1 s) was not significantly
different along the length of the pipe as seen in the first row of Figure 5.17. After core
removal, the subsequent cleaning was much slower. After 200 s there were small patches left
Chapter 5: Pilot scale cleaning studies
132
along the length on the pipe wall in all cases, i.e. removal appears to happen uniformly along
the length of the pipe rather than preferentially from one end. The cleaning time is thus
controlled by the time to remove the thin surface layer.
To investigate if the measurement responses can distinguish between different volumes of
paste, the integral of the turbidity measurement for the experiments has been calculated.
dtmeadingsturbidityr
dtreadingsturbidityIntegral
1 (5.3)
The ratio for the Optek turbidity experiments was 0.83: 1: 1.56 for pipe lengths of 0.3 m:
1 m, 2 m and for the Kentrak turbidity meter for the same lengths the ratio was 0.5: 1: 1.4.
Although an exact match with respect to number of total turbidity units is not achieved the
trend is still evident. In the case of the Optek meter, the reading was saturated at turbidity >
50ppm and so the initial part of the experiment in all cases gave the same reading, as the
saturation of the readings masked a more meaningful value of the integral.
The length of the pipe had limited impact on the cleaning times. The results from the
experiments at different velocities and at lengths of 0.3 m and 1 m are shown in Figure 5.18
for different temperatures.

Chapter 5: Pilot scale cleaning studies
133
i)
ii)
iii)
Figure 5.18: ZEAL Pilot Plant: System: 47.7 mm ID diameter pipe and 0.3 m and 1 m pipe lengths. Cleaning
conditions: i) 20°C, ii) 40°C and iii) 50°C,

Chapter 5: Pilot scale cleaning studies
134
In all instances there was no difference observed between the 0.3 m and 1 m data within
experimental error, as compiled in Figure 5.19.
Figure 5.19: ZEAL Pilot Plant: System: 47.7 mm diameter. Variety of lengths. Cleaning time as a function of
flow rate for toothpaste removal at 20°C, 40°C and 50°C, varying test section length at fluid velocities of 1 m s-1
,
1.3 m s-1
, 1.5 m s-1
, 1.7 m s-1
, 2.3 m s-1
and 2.9 m s-1
, based on clean tube velocities,
Figure 5.19 shows data for all flows and velocities, i.e all the results reported earlier in the
Chapter. The behaviours at each temperature are consistent across all length scales between
0.3 m and 2 m, at the temperatures and velocities studied.
5.9. Effect of fluid Reynolds number.
The compilation of all the temperature, velocity and length work into one plot in Figure 5.19
shows that strong trends exist across the range of experiments. Ideally all the behaviour could
be plotted in an even simpler form. It has been shown that length is of limited significance in
these pipe experiments, and that the important factors are temperature and velocity of the
cleaning fluid. These characteristics are captured by the Reynolds number of the cleaning
fluid through the density and apparent viscosity parameters of the cleaning water. The

Chapter 5: Pilot scale cleaning studies
135
cleaning time as a function of the cleaning water Reynolds number is plotted in Figure 5.20,
in which the data of Figure 20 is replotted.
Figure 5.20: ZEAL Pilot Plant, Reynolds plot based on cleaning fluid of all the cleaning experiments, the
velocities calculated based on a clean tube. At all lengths, temperatures and flow rates for the 47.7 mm diameter
vs. Cleaning Time.
In Figure 5.20 a strong power-law correlation between the cleaning time for toothpaste
removal from pipeline and the Reynolds number of the cleaning fluid exists.
Time = 9 x 10¹¹
(Re)-1.9
, R2 = 0.92 (5.4)
This strong simple correlation clearly demonstrates that toothpaste removal is a function of
fluid effects and can be modelled simply where the pipe diameter remains the same. However,
Reynolds number is not the only descriptor. At Re = 109 K, similar cleaning times are found
for the cleaning conditions 1.5 m s-1
,40°C (195 ± 30 s), and 2.3 m s-1
, 20°C (192 ± 39 s).
However, at Re = 197-199K, for the cleaning conditions 1.7 m s-1
,70°C and 2.3 m s-1
, 50°C,
the cleaning times differ at 170 s and 104 ± 16 s respectively.
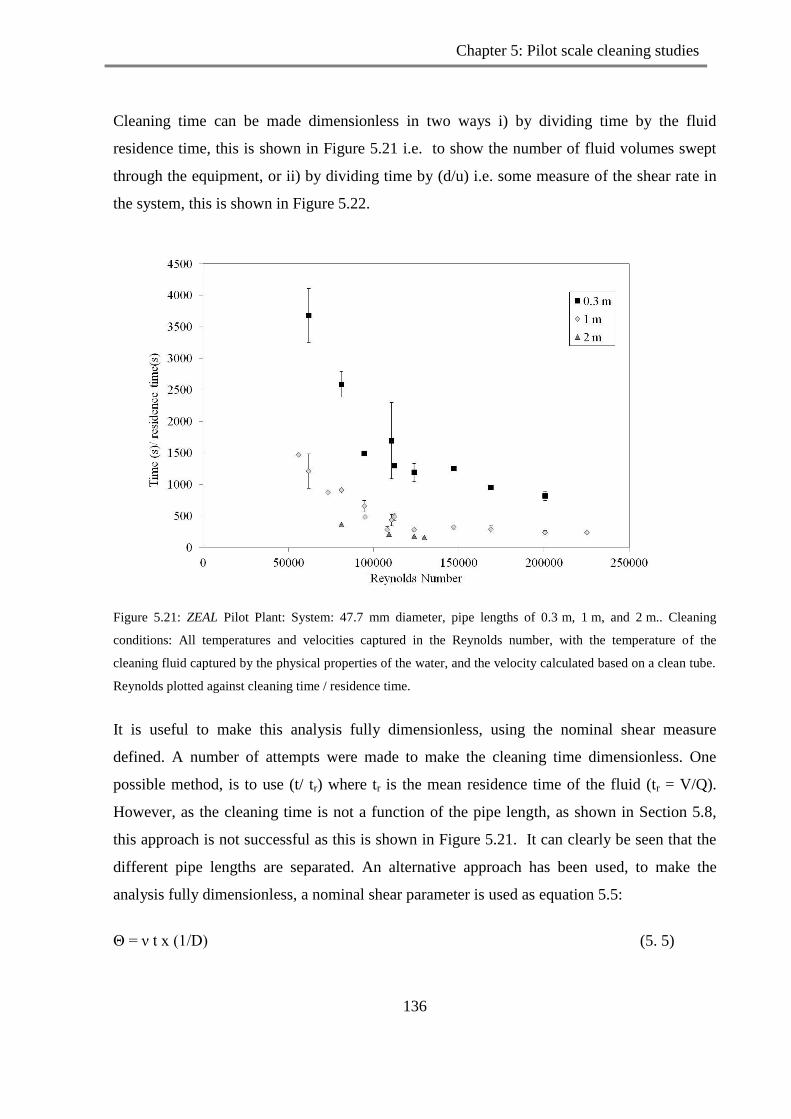
Chapter 5: Pilot scale cleaning studies
136
Cleaning time can be made dimensionless in two ways i) by dividing time by the fluid
residence time, this is shown in Figure 5.21 i.e. to show the number of fluid volumes swept
through the equipment, or ii) by dividing time by (d/u) i.e. some measure of the shear rate in
the system, this is shown in Figure 5.22.
Figure 5.21: ZEAL Pilot Plant: System: 47.7 mm diameter, pipe lengths of 0.3 m, 1 m, and 2 m.. Cleaning
conditions: All temperatures and velocities captured in the Reynolds number, with the temperature of the
cleaning fluid captured by the physical properties of the water, and the velocity calculated based on a clean tube.
Reynolds plotted against cleaning time / residence time.
It is useful to make this analysis fully dimensionless, using the nominal shear measure
defined. A number of attempts were made to make the cleaning time dimensionless. One
possible method, is to use (t/ tr) where tr is the mean residence time of the fluid (tr = V/Q).
However, as the cleaning time is not a function of the pipe length, as shown in Section 5.8,
this approach is not successful as this is shown in Figure 5.21. It can clearly be seen that the
different pipe lengths are separated. An alternative approach has been used, to make the
analysis fully dimensionless, a nominal shear parameter is used as equation 5.5:
Θ = ν t x (1/D) (5. 5)
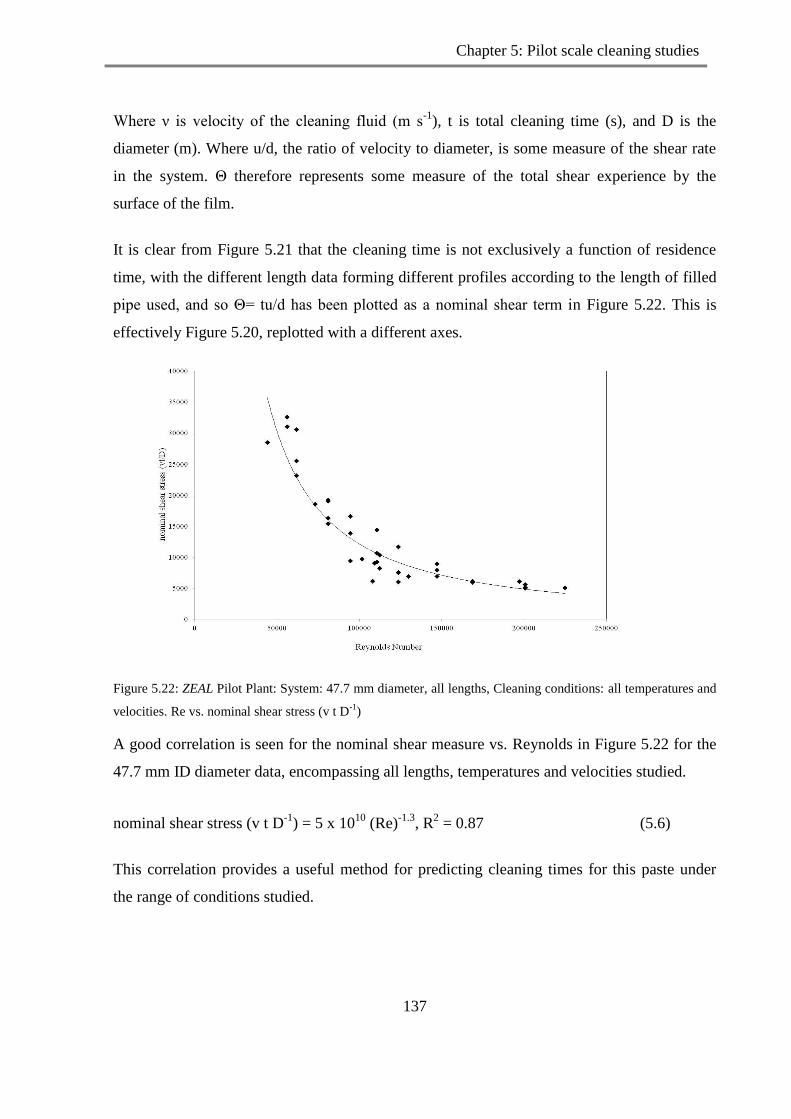
Chapter 5: Pilot scale cleaning studies
137
Where ν is velocity of the cleaning fluid (m s-1
), t is total cleaning time (s), and D is the
diameter (m). Where u/d, the ratio of velocity to diameter, is some measure of the shear rate
in the system. Θ therefore represents some measure of the total shear experience by the
surface of the film.
It is clear from Figure 5.21 that the cleaning time is not exclusively a function of residence
time, with the different length data forming different profiles according to the length of filled
pipe used, and so Θ= tu/d has been plotted as a nominal shear term in Figure 5.22. This is
effectively Figure 5.20, replotted with a different axes.
Figure 5.22: ZEAL Pilot Plant: System: 47.7 mm diameter, all lengths, Cleaning conditions: all temperatures and
velocities. Re vs. nominal shear stress (v t D-1
)
A good correlation is seen for the nominal shear measure vs. Reynolds in Figure 5.22 for the
47.7 mm ID diameter data, encompassing all lengths, temperatures and velocities studied.
nominal shear stress (v t D-1
) = 5 x 10¹⁰
(Re)-1.3
, R2 = 0.87 (5.6)
This correlation provides a useful method for predicting cleaning times for this paste under
the range of conditions studied.

Chapter 5: Pilot scale cleaning studies
138
5.10. Process parameters - diameter
The cleaning studies on pipeline have so far concentrated on a diameter of 47.7 mm, to
understand if the rules which have been established so far can be scaled to other diameters,
cleaning studies have taken place on the ZEAL Pilot Plant on diameters of 23.9 mm ID
(1 inch), 47.7 mm ID (2 inch), 73.2mm ID (3 inch) and 101.6 mm ID (4 inch). The flow
volume available on the ZEAL Pilot Plant was between 0.002 m3 s
-1 - 0.005 m
3 s
-1. Due to the
different diameters, direct comparison across all diameters at the same flow velocities is not
possible. The 23.9 mm system can achieve velocities of 4 m s-1
, 8 m s-1
and greater on the
ZEAL Pilot Plant, this is significantly different than for the other diameters. The 23.9 mm
filled pipeline was placed in the Coupon Rig set-up and monitored by the Kentrak turbidity
meter; this allowed a velocity of 0.5 m s-1
to be studied. All of these results are plotted in
Figure 5.23.
Figure 5.23: Coupon Rig (0.5 m s-1
) and ZEAL Pilot Plant: System: 23.9 mm diameter, 1 m, cleaning conditions:
20°C and 40°C, velocities based on a clean tube. Plot showing the effect of velocity on cleaning time for
23.9 mm diameter fully filled pipe.
The behaviour across the velocity range is divided into the 20°C data and the 40°C, as shown
by the two lines in Figure 5.23.
20°C data: time = 2117 exp -0.6 (ν)
, R2 = 0.976 (5.7)
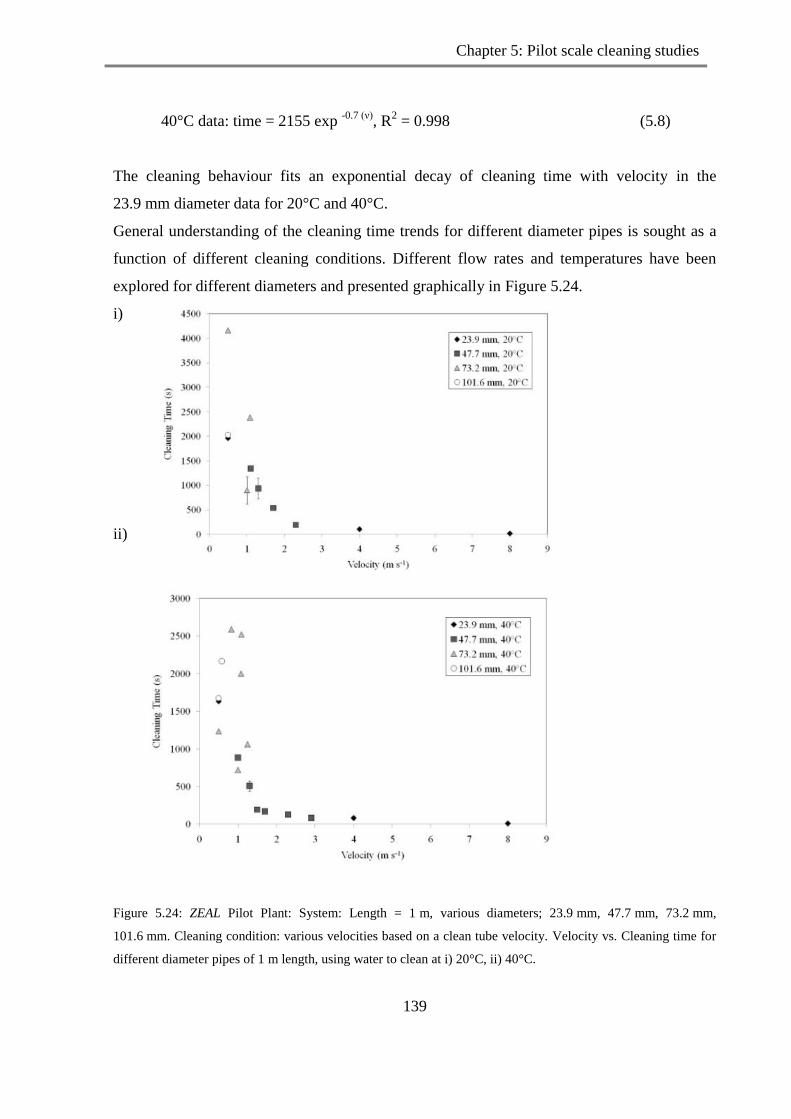
Chapter 5: Pilot scale cleaning studies
139
40°C data: time = 2155 exp -0.7 (ν)
, R2 = 0.998 (5.8)
The cleaning behaviour fits an exponential decay of cleaning time with velocity in the
23.9 mm diameter data for 20°C and 40°C.
General understanding of the cleaning time trends for different diameter pipes is sought as a
function of different cleaning conditions. Different flow rates and temperatures have been
explored for different diameters and presented graphically in Figure 5.24.
i)
ii)
Figure 5.24: ZEAL Pilot Plant: System: Length = 1 m, various diameters; 23.9 mm, 47.7 mm, 73.2 mm,
101.6 mm. Cleaning condition: various velocities based on a clean tube velocity. Velocity vs. Cleaning time for
different diameter pipes of 1 m length, using water to clean at i) 20°C, ii) 40°C.

Chapter 5: Pilot scale cleaning studies
140
Similar empty tube velocities can be compared in Figure 5.24 at 20°C for 47.7 mm and
73.2 mm diameters at ~ 1 m s-1
and these were seen to take similar times ~ 1000 s. However
other data for 73.2 mm diameter at 1.1 m s-1
took around 2500 s. This spread of data for the
73.2 mm diameter below 1 m s-1
, makes meaningful direct comparison difficult. This spread
of data may result from the equipment which was used for this work. The ZEAL pilot plant is
based on a 47.7 mm ID system, and conversions to the appropriate diameters were achieved
by reducers and expanders. Reducers and expanders disturb the flow and in the case of
expanders there is a likelihood that the flow will remain centralised in the centre of the pipe at
the same diameter as the inlet to the expansion and a dead zone will be created in the initially
expanded diameter pipe. In an effort to minimise this effect, an initial „start-up‟ length of the
appropriate pipe diameter was in place prior to the filled test section and was 10 diameters of
length.
To explore if the cleaning of the fully filled toothpaste pipes is still dominated by fluid
dynamics at different diameters (as shown to be the case for different length pipes in Section
5.8), Reynolds is plotted against cleaning time for all diameter data in Figure 5.25.
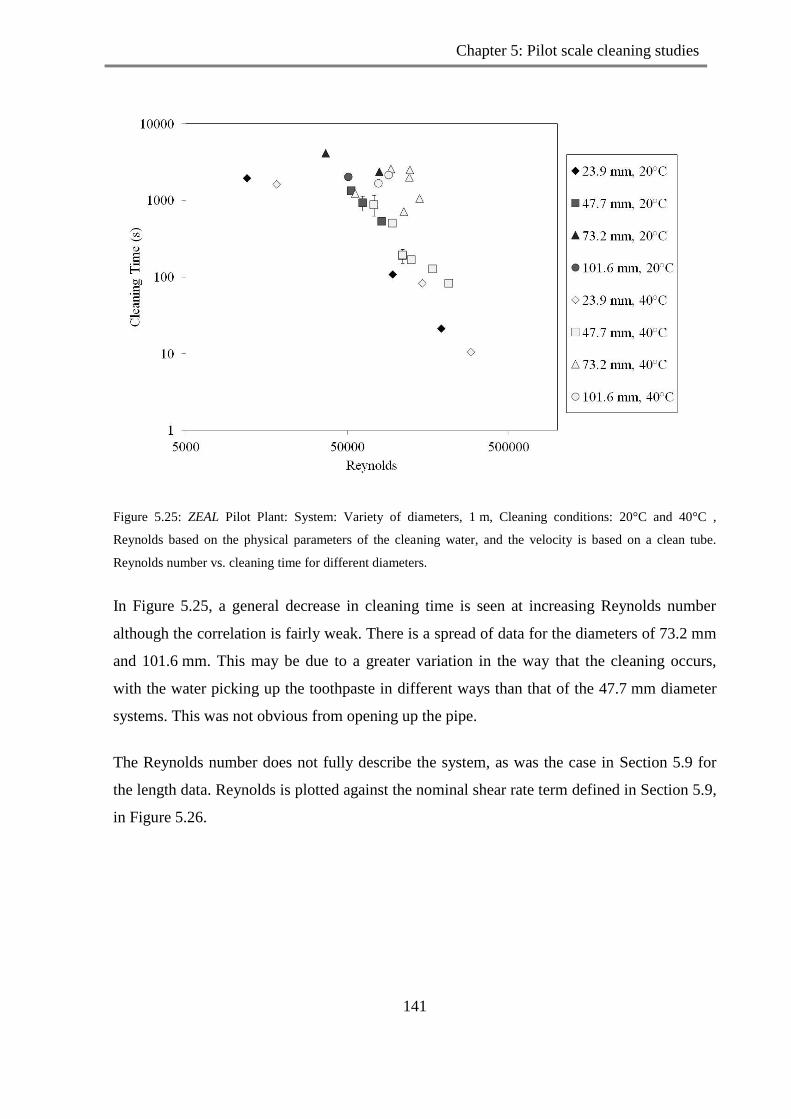
Chapter 5: Pilot scale cleaning studies
141
Figure 5.25: ZEAL Pilot Plant: System: Variety of diameters, 1 m, Cleaning conditions: 20°C and 40°C ,
Reynolds based on the physical parameters of the cleaning water, and the velocity is based on a clean tube.
Reynolds number vs. cleaning time for different diameters.
In Figure 5.25, a general decrease in cleaning time is seen at increasing Reynolds number
although the correlation is fairly weak. There is a spread of data for the diameters of 73.2 mm
and 101.6 mm. This may be due to a greater variation in the way that the cleaning occurs,
with the water picking up the toothpaste in different ways than that of the 47.7 mm diameter
systems. This was not obvious from opening up the pipe.
The Reynolds number does not fully describe the system, as was the case in Section 5.9 for
the length data. Reynolds is plotted against the nominal shear rate term defined in Section 5.9,
in Figure 5.26.
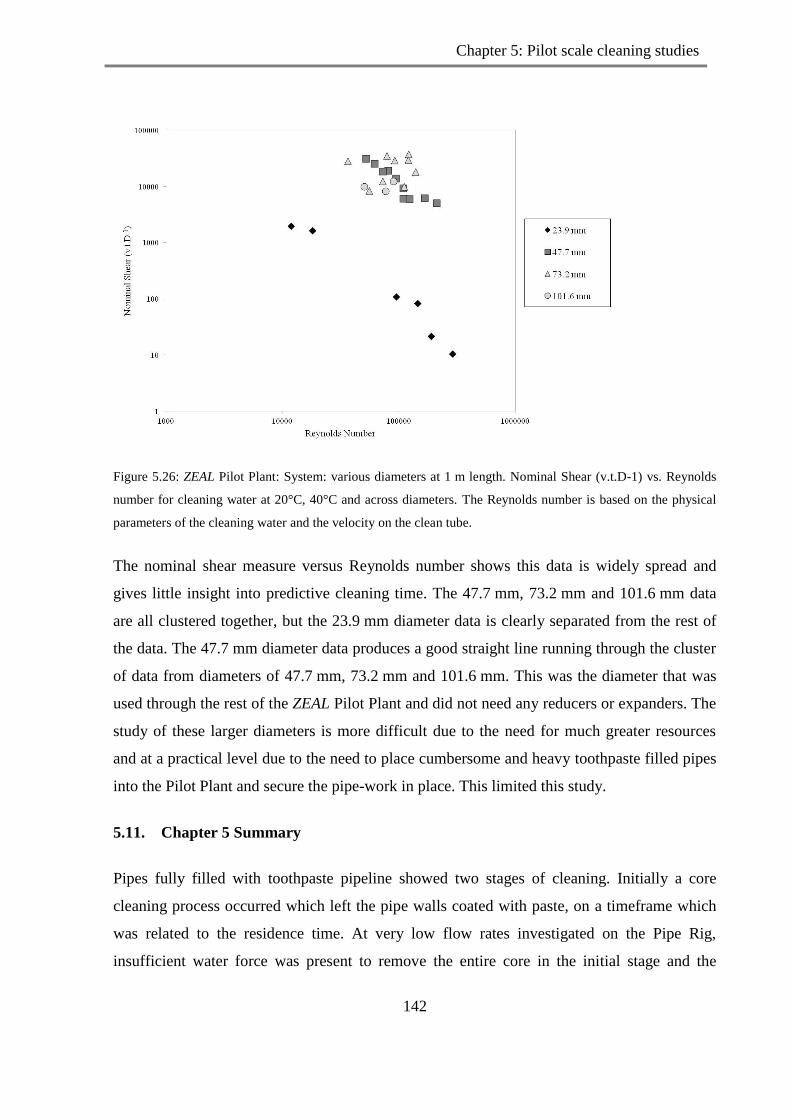
Chapter 5: Pilot scale cleaning studies
142
Figure 5.26: ZEAL Pilot Plant: System: various diameters at 1 m length. Nominal Shear (v.t.D-1) vs. Reynolds
number for cleaning water at 20°C, 40°C and across diameters. The Reynolds number is based on the physical
parameters of the cleaning water and the velocity on the clean tube.
The nominal shear measure versus Reynolds number shows this data is widely spread and
gives little insight into predictive cleaning time. The 47.7 mm, 73.2 mm and 101.6 mm data
are all clustered together, but the 23.9 mm diameter data is clearly separated from the rest of
the data. The 47.7 mm diameter data produces a good straight line running through the cluster
of data from diameters of 47.7 mm, 73.2 mm and 101.6 mm. This was the diameter that was
used through the rest of the ZEAL Pilot Plant and did not need any reducers or expanders. The
study of these larger diameters is more difficult due to the need for much greater resources
and at a practical level due to the need to place cumbersome and heavy toothpaste filled pipes
into the Pilot Plant and secure the pipe-work in place. This limited this study.
5.11. Chapter 5 Summary
Pipes fully filled with toothpaste pipeline showed two stages of cleaning. Initially a core
cleaning process occurred which left the pipe walls coated with paste, on a timeframe which
was related to the residence time. At very low flow rates investigated on the Pipe Rig,
insufficient water force was present to remove the entire core in the initial stage and the
Chapter 5: Pilot scale cleaning studies
143
removal was skewed to the upper section of the pipe, producing excessively long cleaning
times. At higher velocities the whole of the core section was removed and the paste was left
coating the wall uniformly. The coating on the wall was then removed during continued flow,
termed the „thin film removal‟ process, eventually resulting in small patches being left on the
surface and gradually being eroded away due to the fluid flow.
The main body of experiments were conducted on the ZEAL Pilot Plant and tracked through
online measurements. Inductive and conductive conductivity sensors were used and were
found to track the initial part of the experiment well during the stage where the core of paste
was removed and also to be successful at monitoring when there was lots of toothpaste in the
bulk cleaning fluid. After the initial purge of paste the conductivity response diminished
quickly and reached a minimum before the equipment was visually cleaned.
The experiments were also tracked by two turbidity sensors, the Kentrak unit was calibrated
so that it tracked the whole of the experiment, over the range 0 – 500 FTUs and the Optek unit
was calibrated so that it was saturated at the higher turbidities, but was more sensitive at the
lower turbidities. This twinned approach allowed the whole experiment to be monitored and
the end-point to be determined more precisely.
The cleaning end-point was determined by the Optek turbidity unit as it was able to
differentiate at the end of the cleaning experiment. The cleaning end-point was defined at
4 ppm as this was when ~ 99 % of the toothpaste mass had been removed by weight and gave
a repeatable response across different experiments. If a higher point was used the end-point of
the cleaning experiment would not be tracked, but could be used to monitor a set point in the
experiment. These measures were analysed with respect to the off-line verification technique -
ion chromatography.
The cleaning of the paste using water of different temperatures saw a significant reduction in
cleaning time between 20°C and 40°C. It was found to reach a cleaning minimum at 40°C and
no additional cleaning benefit was seen above this temperature. A second paste (Paste D) was
investigated on the ZEAL Pilot Plant, and was found to have different behaviour to the main
paste (Paste T) used. It proved easier to remove and the effect due to temperature was a slight
overall decline with increased temperature at increasing temperature, but no significant

Chapter 5: Pilot scale cleaning studies
144
minimum was seen to exist between 20°C and 70°C. When comparing the rheology of these
two pastes, significant differences are seen which may go some way to explaining the
different behaviour.
Low velocity cleaning experiments were studied on the Pipe Rig and the end-point
determined by visual analysis. At very low velocity < 0.5 m s-1
, the cleaning time took 5 – 6
hours, which is prohibitively long for processing industries. However, cleaning can still occur
at these low flow rates which demonstrates that the cleaning of toothpaste occurs by fluid
mechanical methods. When the velocity was over 0.5 m s-1
, the cleaning time was less than
20 minutes and so a minimum critical velocity is seen to exist, above which the cleaning time
reduces significantly.
Industrial scale velocities were investigated on the ZEAL Pilot Plant. It was found that the
increase of velocity led to a decrease in cleaning time following power-law behaviour. There
is clearly a point where diminished returns on actual time exist, and a balance must be found
between reducing cleaning time and the set-up of the equipment, this will be discussed further
in the next chapter. At increasing velocity a decrease in cleaning time was seen at 20°C and
40°C for the main paste, Paste T, but was less significant compared to Paste D as the time
taken was an order of magnitude less.
Several length systems of 47.7 mm diameter were investigated, in particular 0.3 m, 1 m, and
2 m. The turbidity profiles for the different lengths were very similar, with the reading
becoming unsaturated at ~ 200 s for all lengths for a 47.7 mm pipe diameter of 1 m length,
water temperature of 40°C and velocity of 1.7 m s-1
. Furthermore, the pipe length was cracked
open at various intervals and locations in the experiment set-up and no difference in the
amount of paste removed from the wall surface was seen between the shortest and longest
length investigated. Hence, the wall coating was uniform, irrespective of pipe length.
Experiments were conducted at all flow rates and temperatures for at least two pipe lengths
and no difference was observed between the two data sets. When all the results are plotted
together, strong correlation was seen between the results, with the 20°C data all displaying the
same dependence on flowrate and the 40°C and higher temperature data all clustering together
to give a slightly different trajectory. Length was seen to have no influence on cleaning time.
This result may be counterintuitive as a 1 m pipe is shown to take the same amount of time as

Chapter 5: Pilot scale cleaning studies
145
a 2 m length pipe. However when this is explored further, the core removal phase is
dependant on length but removal of the thin wall coating is rate determining. The core
cleaning time due to length difference is short, for instance 0.3 s compared with 2 s for a
0.3 m pipe length vs. a 2 m pipe length with a fluid velocity of 1 m s-1
, this is negligible when
compared with the whole experiment time which is in excess of 200 s.
The combination of data from experiments of different lengths, and cleaning water of
different temperatures and velocities, were analysed as a function of the cleaning water
Reynolds number which captured the effects of the different physical properties of the
cleaning water through the apparent viscosity and the density of the water. Reynolds vs.
cleaning time showed a strong power-law correlation - a potentially useful prediction tool for
cleaning time for this paste covered by the conditions covered in the experimental range.
However, it was noted that Reynolds number is not an exclusive predictor with similar
Reynolds numbers derived from differing conditions having different cleaning times. To
make this fully dimensionless, a nominal shear term is plotted which is a function of the
velocity (m s-1
) multiplied by the cleaning time (s) per the pipe diameter (m-1
), this also gives
a strong correlation when compared with the Reynolds number.
The effect of diameter has been assessed by studying removal from pipes of 23.9 mm,
47.7 mm, 73.2 mm and 101.6 mm diameters on the ZEAL Pilot Plant – it is not possible to
directly compare velocity for all the diameters. The flow rate on the plant is between
0.001 m3 s
-1 and 0.005 m
3 s
-1. The 23.9 mm diameter is found to behave significantly
differently from the other diameters, this may be due to small boundary layers at the velocities
studied. The 47.7 mm, 73.2 mm and 101.6 mm diameter data tend to cluster when examined
by Reynolds number and nominal shear rate analysis, but a clear relationship across the
different diameters is not seen. This may be due to differences in the cleaning mechanisms.
The next Chapter, Chapter 6, will explore the cleaning rigs available and optimise with
respect to the time, energy and water usage for changing the process variables. It will also
focus on some studies on the cleaning of different geometry items. Finally, there will be a
comparison of the cleaning processes observed at the laboratory scale as reported in Chapter
4, with those reported at the pilots scale in this chapter, Chapter 5.

Chapter 6: Scale-up
146
CHAPTER 6: SCALE UP COMPARISONS
The results of cleaning studies investigating the removal of toothpaste at laboratory scale were
reported in Chapter 4, and at pilot scale in Chapter 5. At both scales, the cleaning was
investigated at a variety of flow rates and temperatures. There is no directly comparable
condition between the coupon rig and the ZEAL Pilot Plant. A flat surface of a measurement
port, referred to as the Flat Plate, was coated with paste and set-up to mimic the coupon rig
process, on the ZEAL Pilot Plant, the set-up was described in Section 3.6.2. This system
allowed flow rates between the two scales to be directly compared.
A comparison has been made between the Coupon Rig results and the ZEAL Pilot Plant
results to establish the comparability between the different scales. It would be very useful to
be able to predict cleaning behaviour at full scale from laboratory scale results. This would
require fewer resources to be used, in terms of experimental time and material as well as
requiring less water and energy to conduct the cleaning experiments. Work on the Coupon
Rig investigated the cleaning of a thin layer of material that protruded into the fluid flow. This
is thought to mimic the circumstance after the core of the paste is removed from a pipe and
the rate determining process of removing the thin coating of toothpaste from the surface of the
pipe wall is undertaken. The work in this chapter seeks to understand if a relationship can be
found between these different scale processes.
Finally the impact on the water and energy usage for the different flow and temperature
cleaning conditions are evaluated.
6.1. Flat Plate systems
The flat surface of a measurement port described in Section 3.6.3 was coated with a thin layer
(~ 3 mm) of paste and placed horizontally in the ZEAL Pilot Plant. The set-up echoed that of
the Coupon Rig system described in Section 3.5.2, where the paste coated section at the base

Chapter 6: Scale-up
147
of the horizontal pipe, protruding into the flow. The results from the Coupon Rig laboratory
scale work were reported in Chapter 4. This Flat Plate system operated at the conditions used
for the ZEAL Pilot Plant pilot-scale, the set-up described in Section 3.6.3.
Figure 6. 2: ZEAL Pilot Plant, System: Flow direction left to right. Flat Plate of a measurement port placed
horizontally at the base of the ZEAL Pilot Plant. Cleaning water conditions: 20°C, 1 m s-1
, images taken at
intervals through the cleaning run: a) 1676 s, b) 1696 s, c)1708 s, d)1726 s, e)1752 s, f)1767

Chapter 6: Scale-up
148
Removal of toothpaste was visually observed and imaged from above the flat plate coated
surface of the measurement port. These images are shown in Figure 6.1. Like the Coupon Rig
experiments, an erosion of paste was observed from the direction of the leading fluid edge,
see Section 4.1. There was also some slight curling of the paste noted in the bottom right of
Figure 6.1 (c) which rolled up and was then removed by being torn away from the bulk paste,
similar behaviour was observed previously in experiments on the Coupon Rig, see Section
4.1. The time taken for the measurement port flat plate to become visual clean by fluid flow at
different temperatures and velocities has been presented in Figure 6.2 for two pastes. The
clean time is defined as the first image which shows a fully clean surface.
Figure 6. 2: ZEAL Pilot Plant: System: 60 mm flat plate surface of a measurement port, Cleaning conditions:
temperatures of 20°C and 40°C, velocity based on clean tube of 60 mm, 0.64 m s-1
(0.002 m3 s
-1), 0.95 m s
-1
(0.003 m3 s
-1), 1.27 m s
-1 (0.004 m
3 s
-1). The time taken for the measurement plate to become visually clean as a
function of velocity and temperature for Paste T and some representative experiments for Paste D.
A clear effect of temperature on the cleaning time was observed in Figure 6.2, with the higher
temperature experiments (40°C) taking less time to clean, than for those experiments at 20°C.
This is the case for both Paste T and Paste D. A relationship between reduced cleaning time
and higher velocity is noted for both pastes, this effect has been seen in the pipe rig

Chapter 6: Scale-up
149
experiments in Section 5.7.1. Paste D is found to take less time than Paste T to clean under all
conditions, this was also seen on laboratory scale experiments in Section 4.7, and for pipe line
experiments in Section 5.7.3.
It is interesting to compare the Coupon Rig, laboratory scale data and the data from the coated
flat plate of the measurement port on one plot. The set-up for these two systems is similar as
both systems have a flat plate which is placed horizontally in a cleaning rig, and the flat
surface is coated with a thin layer of paste which protrudes into the fluid flow, and is
removed. These data sets are compared in Figure 6.3.
Figure 6.3: Coupon Rig vs. coated measurement port flat plate placed in the ZEAL Pilot Plant, for cleaning water
at different temperatures and velocities: 60 mm flat plate of a measurement port coated with paste, and placed so
that the sample is horizontally in line. Cleaning conditions: 20°C, 40°C, velocities calculated based on a clean
tube, Paste T, coupon rig and flat plate cleaning times established by the first completely clean image of the
surface.
Chapter 6: Scale-up
150
A clear difference is seen in Figure 6.3, between the 20°C and 40°C data, across both scales
of cleaning rig. The Coupon Rig cleaning studies occurred at 0.25 – 0.5 m s-1
, with a coated
coupon of dimensions: 25 mm x 25mm. The coated flat plate of the measurement port
positioned in the ZEAL Pilot plant has been studied across velocities based on clean tube
measurements of 0.63 – 1.27 m s-1
, with a 60 mm diameter coated circular plate. The trend
across both sets of cleaning rig data followed a strong exponential decay in cleaning time as a
function of velocity with a noted off set at different temperatures illustrated in Figure 6.3. The
solid black line (equation 6.1) represents the 20°C data:
Time = 1007 exp -2.2 ν
, with R2 = 0.987 (6. 1)
The dashed line (equation 6.2) represents the 40°C data:
Time = 6517 exp -2.1 ν
, with R2 = 0.935 (6. 2)
In both equations, ν = velocity (m s-1
) based on a clean tube.
It is apparent that when a similar set-up was scaled up, a strong relationship for the cleaning
of a coated surface existed between the laboratory and the industrial scale. The cleaning time
was found to decrease exponentially over the velocity range studied (0.25 m s-1
- 1.3 m s-1
)
across the two scales, with a different seen between the two temperatures, 20°C and 40°C.
6.2. Coated surface vs. pipe-line at industrial velocities
As the experiments on the coated flat plate of a measurement port reported in Section 6.1,
were conducted at pilot-scale flow rates, it is also possible to directly compare the results with
the pilot scale pipe-line results reported in Section 5.7.2. Figure 6.4 directly compares the
cleaning results of the coated plate of a measurement port and the pipe-line systems where the
velocities considered are in the same range.

Chapter 6: Scale-up
151
Figure 6.4: ZEAL Pilot plant: Coated flat plate of a measurement port vs. pipe-line experiments, for diameters of
23.9 mm and 47.7 mm. Cleaning conditions: 20°C and 40°C, velocities calculated based on a clean tube for the
pipe experiments, and on a 60 mm diameter port for the coated surface. The lines group the coated surface
experimental data.
In Figure 6.4, it is seen that the cleaning of the coated surface system and the pipeline systems
both respond to increased velocity with a decreased cleaning time. This was clearly not a
function of the mass of the toothpaste, with the coated surface (Plate) containing ~ 10 g of
toothpaste, and the pipe ~ 1 kg of paste for the 47.7 mm diameter, 1 m pipe. A similar
thickness of paste was present on the wall surface in both systems (~ 3 mm). Reynolds
number has been shown previously see Section 5.9, to show a good relationship with cleaning
time for pipes. Reynolds number is plotted in Figure 6.5 for the coated surface and the
pipeline data.

Chapter 6: Scale-up
152
Figure 6.5: ZEAL Pilot Plant: System: coated plate of a measurement port and pipeline systems of 1 m length,
and diameters 23.9 mm and 47.7 mm. Cleaning Conditions, 20°C and 40°C, Paste T, velocities based on a clean
tube for the pipeline velocities, and 60 mm diameter for the coated flat plate (Plate). Cleaning time as a function
of Reynolds number for the industrial scale coated surface system and pipeline cleaning in a 23.9 mm system
and 47.7 mm system. The coated surface (Plate) data is shown with lines.
The coated flat plate data aligns well with the pipe line data for diameter 47.7 mm at 20°C
(the coated flat plate data series is connected by lines). The 40°C coated plate trend was seen
to take slightly longer than the corresponding 40°C 47.7 mm diameter pipe data. Cleaning
conditions corresponding to a Reynolds ~ 90200 for the coated Plate data took 812 s to clean,
and for diameter 47.7 mm pipe, Re ~ 94400 took 509 s to clean.
The approach which was previously used to establish a non-dimensional relationship for pipe
lines in Section 5.9 has been repeated here using the nominal shear parameter.

Chapter 6: Scale-up
153
Figure 6.6: Coupon Rig and coated measurement port plate on the ZEAL Pilot Plant, and a 47.7 mm, 1 m
diameter pipe on the ZEAL Pilot Plant. Cleaning conditions: All temperatures and velocities based on a clean
system captured in the Reynolds number via the physical properties of water. Dimensionless cleaning time (Θc =
utc/d) vs. Reynolds number for the Coupon Rig, Flat Plate system and the Pilot Plant 47.7 mm diameter pipes.
The data sets plotted in Figure 6.6 show:
on the coupon rig, the highest cleaning times were seen, but the data was scattered.
on the flat plate data, the data lay in the range between the coupon rig and the Pilot
Plant data
on the pilot scale pipe data layed on a relatively good straight line;
for all the data considered together, the fit can either be considered as an exponential
decay or power law fit.
These correlations show that the laboratory scale coupon rig, the flat plate system and the
pipeline work, are all comparable, and that scale-up from one system to the other is possible.

Chapter 6: Scale-up
154
The power law fit across all the data shown in Figure 6.6, for dimensionless cleaning time vs.
Reynolds number (Θc = utc/d) for the pilot plant data and the coupon rig data gives equation
6.3:
Θc = 9 x 10⁷ (Re)
-0.8 , R
2 = 0.843 (6. 3)
Pilot plant data alone gives equation 6.4:
Θc = 5 x 10¹⁰
Re-1.3
, R2 = 0.872 (6. 4)
This shows that although there is comparability between the systems, the whole process has
not yet been fully described.
6.3. Correlation of cleaning data at laboratory and pilot scale
Ultimately it would be useful to conduct less resource intensive experiments at laboratory
scale and be able to use these to predict the behaviour in industrial scale equipment. For this
work, comparison is made between the Coupon Rig experiments reported in Chapter 4, and
the pipeline experiments performed on the ZEAL Pilot Plant and reported in Chapter 5. The
effect of varying the cleaning conditions of temperature and velocity resulted in similar trends
on the Coupon Rig and on the ZEAL Pilot Plant pipe systems. It is important to represent the
data sets systematically. Two comparisons have been studied namely the variation of cleaning
time with Reynolds number and with shear stress.
The wall shear has been estimated using the Blasius equation (equation 6.5) with the cf value
calculated as per equation 6.6:
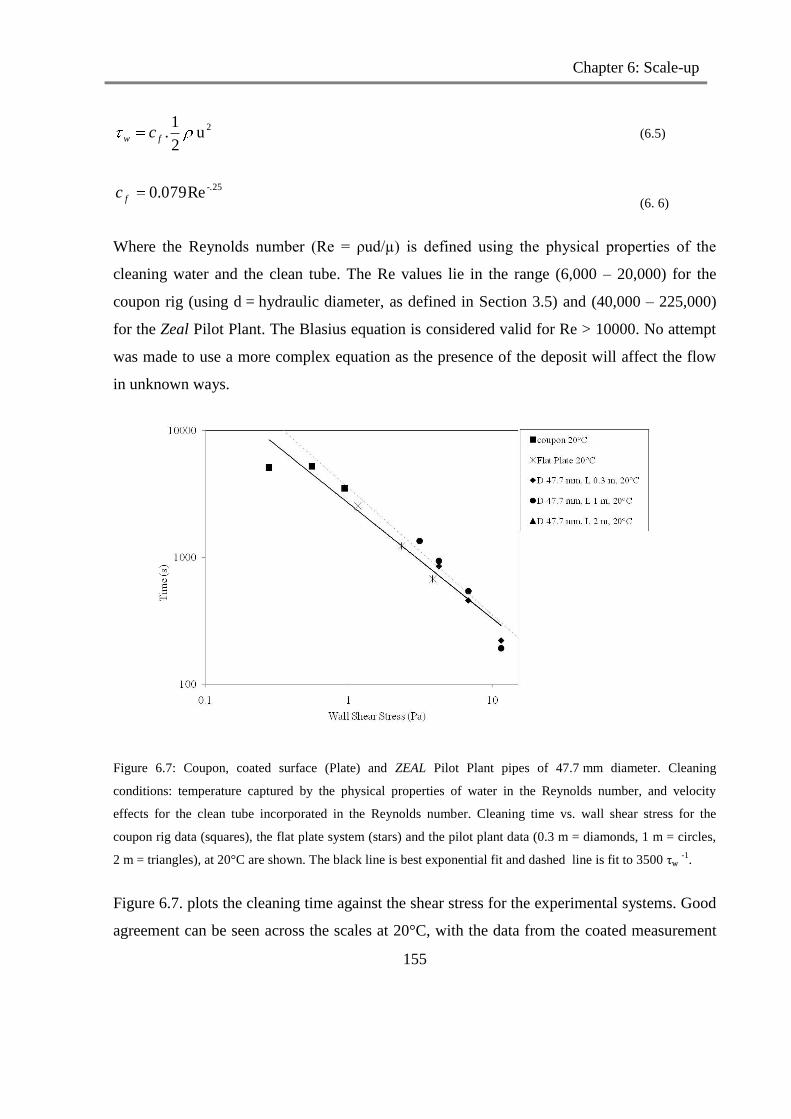
Chapter 6: Scale-up
155
2u 2
1.fw c (6.5)
-.25Re079.0fc (6. 6)
Where the Reynolds number (Re = ρud/µ) is defined using the physical properties of the
cleaning water and the clean tube. The Re values lie in the range (6,000 – 20,000) for the
coupon rig (using d = hydraulic diameter, as defined in Section 3.5) and (40,000 – 225,000)
for the Zeal Pilot Plant. The Blasius equation is considered valid for Re > 10000. No attempt
was made to use a more complex equation as the presence of the deposit will affect the flow
in unknown ways.
Figure 6.7: Coupon, coated surface (Plate) and ZEAL Pilot Plant pipes of 47.7 mm diameter. Cleaning
conditions: temperature captured by the physical properties of water in the Reynolds number, and velocity
effects for the clean tube incorporated in the Reynolds number. Cleaning time vs. wall shear stress for the
coupon rig data (squares), the flat plate system (stars) and the pilot plant data (0.3 m = diamonds, 1 m = circles,
2 m = triangles), at 20°C are shown. The black line is best exponential fit and dashed line is fit to 3500 τww -1
.
Figure 6.7. plots the cleaning time against the shear stress for the experimental systems. Good
agreement can be seen across the scales at 20°C, with the data from the coated measurement
Chapter 6: Scale-up
156
Plate system providing overlap between the two different equipment scales and demonstrating
that the trends across the different scales are comparable.
In this case, the 20°C data across all the equipment can be described by a power-law model
(thick black line on Figure 6.7, equation 6.7).
Tc = 2650 (τw)-0.907
, R2 = 0.941, (6. 7)
But the data can be fitted nearly by; (dashed line on Figure 6.7, equation 6.8)
At 20 C; tc= 3500/τw (6. 8)
which suggests that there is a very simple relationship between cleaning time and shear stress.
Many authors have studied the effect of shear stress on cleaning, such as Jensen and Friis
(2004) and authors such as Bergman and Trägårdh (1990) and Lelièvre et al., (2002). They
have found that cleaning scales with shear stress, and this also seems to be true in this case.
A noticeable difference in behaviour between the 20°C data and that of higher temperatures
has been observed for this paste in Chapter 5 at pilot scale and for the Flat Plate, Figure 6.8
shows all the data from all the systems investigated in this thesis as a function of wall shear
stress vs. cleaning time.
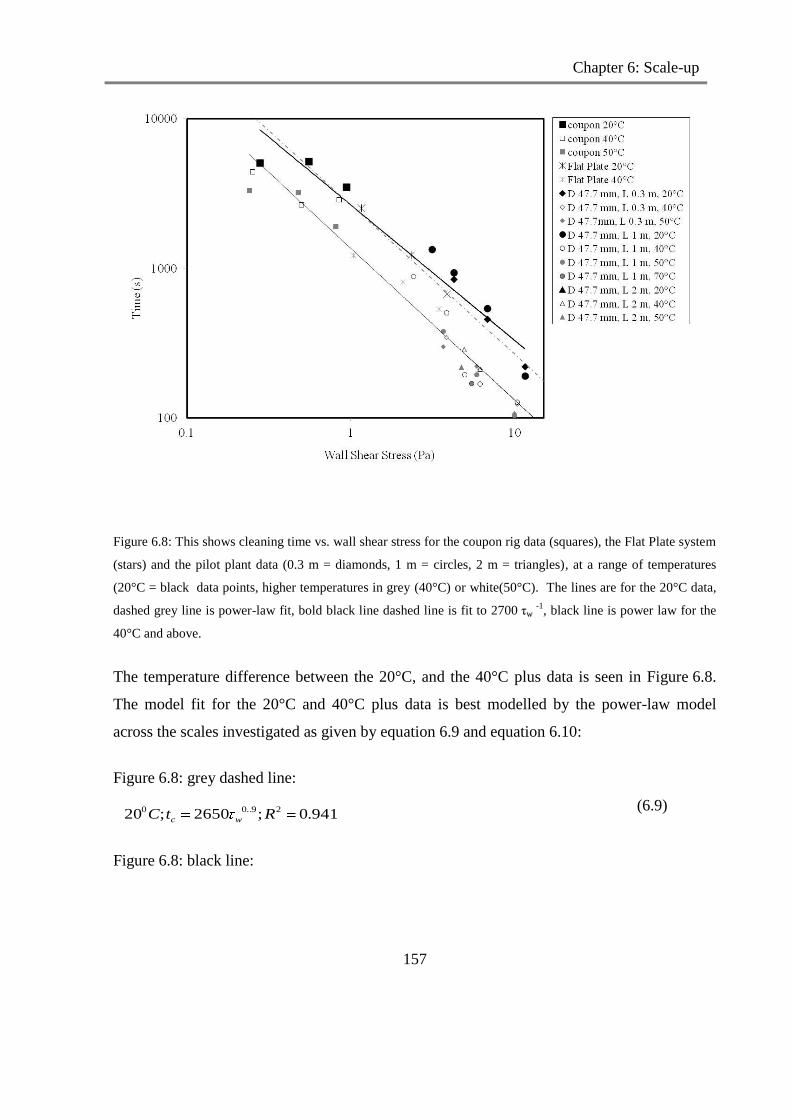
Chapter 6: Scale-up
157
Figure 6.8: This shows cleaning time vs. wall shear stress for the coupon rig data (squares), the Flat Plate system
(stars) and the pilot plant data (0.3 m = diamonds, 1 m = circles, 2 m = triangles), at a range of temperatures
(20°C = black data points, higher temperatures in grey (40°C) or white(50°C). The lines are for the 20°C data,
dashed grey line is power-law fit, bold black line dashed line is fit to 2700 τww -1
, black line is power law for the
40°C and above.
The temperature difference between the 20°C, and the 40°C plus data is seen in Figure 6.8.
The model fit for the 20°C and 40°C plus data is best modelled by the power-law model
across the scales investigated as given by equation 6.9 and equation 6.10:
Figure 6.8: grey dashed line:
(6.9)
Figure 6.8: black line:
941.0;2650;20 29..00 RtC wc
Chapter 6: Scale-up
158
(6.10)
The data show that cleaning time can be approximated by an inverse relationship with wall
shear stress, as the two best fit lines are equation 6.11 and equation 6.12:
Figure 6.8 (Bold black line): At 20 C; tc= 2700/τw (6.11)
Figure 6.8 (black line (as per power law)) At 40 C plus; tc= 1360/τw (6.12)
This relationship aligns with previous work discussed in Section 2.8.1, some previous work
also suggests this approach. A similar form of equation was derived using an approximate
procedure by Michaily and Middleman (1993), who assumed a uniform Newtonian soil
without waves on the surface. An approximately linear relationship between the removal rate
constant and shear stress was also identified by Lelièvre et al., (2002).
6.4. Comparing pipe-line diameters
Cleaning of different diameter pipe-lines was investigated in Section 5.10, and a clear
relationship was not established with Reynolds number or nominal shear rate, although a clear
curve was seen with velocity. The controlling factor in cleaning is the interaction between the
fluid and the deposit, which will be a function of the rheology of the deposit and the rate of
removal due to fluid flow. The data suggests surface shear may be a better correlation
parameter than the Reynolds number.
950.0;1360;40 21.0 RtplusC wc

Chapter 6: Scale-up
159
Figure 6.9: Wall shear stress (τ, Pa) vs. Time (s) for experiments conducted at 20°C and 40°C on the Coupon
Rig, the Flat Plate system and the ZEAL Pilot Plant for 1 m length test sections and diameters of 23.9 mm,
47.7 mm, 73.2 mm and 101.6 mm. The bold black line corresponds to a power law line of best fit through the
20°C data. The dashed line corresponds to a power law line of best fit through the 40°C data.
The data shown in Figure 6.9 demonstrate that the cleaning time is a strong function of wall
shear stress under all conditions studied, including at multiple scales, diameters and
temperatures as represented by the strong model fits for the 20°C (equation 6.13) and 40°C
(equation 6.14) data:
Tc = 2445 (τw)-0.8
, R2 = 0.924 (bold black line, Figure 6.9) (6.13)
Tc = 1728 (τw)-0.92
, R2 = 0.855 (dashed line, Figure 6.9) (6.14)
This cleaning relationship across multiple scales is significant, it potentially enables systems
to be studied on the laboratory scale and the lessons on the cleaning behaviour gained and
scaled up to larger geometries, in this case, the process has been scaled up from a coated
coupon of 25 mm x 25 mm square to fully filled pipe-lines with diameter of 101.6 mm.

Chapter 6: Scale-up
160
This scale-up rule for cleaning may be able to be used as a comparison for other viscous
materials which are cleaned by fluid mechanics. Hence, a material could be studied at the
laboratory or small pilot scale and its cleaning behaviour extrapolated to larger scales.
Further work will be required to evaluate if these cleaning rules for toothpaste are true at
industrial scale, and for other materials of similar rheology.
6.5. Water usage
For most of this work, the impact of cleaning has been assessed with relation to cleaning time.
This is however, not the only resource which needs to be considered in cleaning studies. This
section focuses on the water use required to achieve a clean state, which has been assessed for
a pipe of diameter 47.7 mm and length 1 m according to equation 6.15:
Water usage (m3) = flow-rate (m
3 s
-1) x cleaning time (s) (6.15)
The water usage has been calculated for cleaning experiments undertaken at different
temperatures and velocities, the velocities are based on a clean tube.

Chapter 6: Scale-up
161
Figure 6.10: ZEAL Pilot Plant: System: 47.7 mm diameter, 1 m length, Cleaning conditions: Various
temperatures, and various velocities calculated based on a clean tube. Water usage to clean a pipe.
Figure 6.10 shows the water usage for different cleaning conditions for a system of 47.7 mm
diameter and 1 m length. The data once again is divided into two groups, the 20°C data and
the 40°C and above data sets. The 20°C data show a distinct reduction in water usage for
cleaning of the pipe as the velocity increases in a reasonably linear fashion with increasing
velocity (based on a clean tube). This is because the water usage is directly correlated with the
cleaning results reported in Section 5.7.2.
For the 40°C and above data, there is a reasonably linear decline in water usage from 1 m s-1
to 1.5 m s-1
, between 1.5 m s-1
to 3 m s-1
the water usage is consistent ~ 0.5 m3, as the cleaning
time plateaus ~ 1.5 m s-1
as such no significant benefit is seen in terms of reducing water use.

Chapter 6: Scale-up
162
6.6. Energy usage
In the current climate, sustainability is increasingly important and one of the major areas
where optimisation is sought is in energy usage. If the facility being cleaned is not production
limited it would be ideal to perform cleaning in the most energy efficient manner.
There are two major contributors to energy use on the ZEAL Pilot Plant;
the pumping energy required to pump the water around the system,
the heating energy, the energy required to heat the volume of water required to the
desired temperature.
The pump used to supply the pumping energy was a 5.5 kW h-1
pump. As this was used to
supply a variety of flow rates, the full pump power was not used at all flow conditions, 33%
of the power is required to run the pump at its minimum level which corresponding to flow of
6.5 m3 h
-1. Hence, using the pump required a minimum energy of 0.33 x 5.5 kW h
-1, for all the
time it was used. The percentage of the power was then assumed to ramp up linearly with
velocity, as per equation 6.16 between 6.5 and 20 m3 h
-1. In reality at increased velocity there
would be a higher pressure drop for the pump to overcome, however as the pumping energy
contribution is negligible this has not been considered.
The total energy for pumping is:
(6.16.)
The more energy intensive process is related to heating of the water, as such, significant
cleaning time reductions would need to be seen for the experiments at higher temperatures to
be less energy intensive than the cooler temperature experiments.
The heating energy is calculated by:

Chapter 6: Scale-up
163
(6.17)
where Q is the amount of heat transfer in the system in kJ , m is the mass of the water in k g,
dT is Ttarget – Tstart, the change in temperature from the starting temperature (assumed to be
20°C). The total energy used is the sum of the pumping energy and the heating energy for
each experimental condition, the results of this analysis are shown in Figure 6.11.
Figure 6.11: ZEAL Pilot Plant: System: 47.7 mm diameter, 1 m length. Energy usage to clean a pipe of diameter
47.7 mm, length 1 m under different cleaning conditions. All cleaning conditions included, with the velocity for
experiments based on a clean tube.
The energy to clean is substantially higher when using heated water, as seen in Figure 6.11.
Cleaning at ambient temperature (20°C) is less energy intensive than at the higher
temperatures. At 2.3 m s-1
velocity based on a clean tube, the energy for the experiment at
70°C is 109 k J, at 50°C is 74 k J, at 40°C is 43 k J and at 20°C is 0.47 k J. This demonstrates
what a substantial energy difference can be gained by cleaning at lower temperatures.

Chapter 6: Scale-up
164
6.7. Optimal conditions
For the different responses considered: cleaning time, water usage and energy usage, there are
different conditions which give the optimal response.
For cleaning time, as presented in Section 5.7.2, the optimal cleaning condition is
40°C and 1.5 m s-1
, based on a clean tube.
For water usage, as presented in Section 6.5, the optimal cleaning conditions are 40°C
and 1.5 m s-1
, based on a clean tube.
For energy usage, as presented in Section 6.6, the optimal cleaning conditions are
20°C and 2.9 m s-1
.
The overall balance for these factors will be based on the business needs. However, a cleaning
condition of 40°C and 1.5 m s-1
, is optimal for cleaning time, and water usage, and is the most
efficient in terms of energy usage for a heated system.
6.8. Summary
The Coupon Rig and ZEAL Pilot Plant have no directly comparable velocity condition, and so
to allow some comparison between the systems, a surface of a measurement port was coated
with toothpaste and placed in a horizontal duct so that the paste protruded into the fluid flow
to mimic the Coupon Rig. The coated surface was placed into the ZEAL Pilot Plant so that it
could achieve the industrial scale flows used for cleaning the pipes, as per the results given in
Chapter 5. The removal behaviour with fluid flow was found to be similar to that on the
Coupon Rig with the paste eroding away from the surface and the paste curling away from the
surface and then fluttering in the flow until the paste section ripped away due to the continued
flow working the fluttering paste away from the bulk paste adhered to the surface.
The effect of velocity and temperature on the cleaning times for the coated plate of the
measurement port was similar to those seen for the Zeal Pilot Plant, with a decrease in
cleaning time seen at higher velocities and temperatures above 20°C. This was less clearly
observed on the Coupon Rig. Comparison was made between the Coupon Rig and the coated

Chapter 6: Scale-up
165
surface measurement port plate system. Across the range from 0.25 – 0.5 m s-1
for the 25 mm
x 25 mm square coupon on the Coupon Rig, to the 0.6 – 1.3 m s-1
velocity range for the
60 mm diameter circular measurement port flat plate. It was found that the two systems
showed a strong exponential decay for cleaning time as a function of velocity.
The flat plate measurement port system was compared to the filled pipe experiments, diameter
47.7 mm, reported in Chapter 5. It was found to have similar cleaning time range with respect
to velocity based on a clean tube, particularly at 40°C. However, the data was not particularly
well aligned. Further comparison was done using Reynolds number and cleaning time; the
data was again in a similar range but not well aligned.
When all the data across all the equipment scales; coupon at laboratory scale, flat plate system
and filled pipe systems at pilot scale on the ZEAL Pilot Plant at diameters of 23.9 mm, 47.7
mm, 73.2 mm 101.6 mm were evaluated as a function of the wall shear stress, a strong inverse
wall shear stress relationship was found across all scales. This simple relationship is an easy
rule of thumb which could be applied to the cleaning of toothpaste by water removal and
could potentially be extended to other similar rheology materials.
Water usage has been evaluated in the filled pipe system for diameter 47.7 mm. This has been
based on using continually refreshed water to clean the system. Water usage has been
evaluated for cleans of different velocities and temperatures. It has been found that water
usage is higher at 20°C, as opposed to at hotter temperatures as the cleaning times are
significantly longer at low temperatures. It has also been found that at higher temperatures,
40°C and higher the water usage is approximately the same at 1.5 m s-1
and above. At
velocities less than 1.5 m s-1
, the water usage is higher. The optimal cleaning condition in
terms of water usage for the diameter 47.7 mm pipe system is 40°C and 1.5 m s-1
.
At 20°C, the energy usage is less than at temperatures of 40°C and above. The energy usage is
higher at higher temperatures due to the extra energy associated with heating the water and
the fact that there is no significant reduction in cleaning time from going to temperatures
above 40°C. The energy for cleaning at the lowest velocities, 1 m s-1
is higher at the same

Chapter 6: Scale-up
166
temperatures due to longer cleaning times, at 1.5 m s-1
and higher velocities the energy usage
is very similar at similar temperatures. The optimal cleaning condition for energy usage is
20°C and 2.9 m s-1
.
A good option for the optimal condition across all factors considered with respect to the
cleaning experiments seems to be 40°C and 1.5 m s-1,
based on a clean tube velocity. These
conditions deliver the optimum condition for cleaning time and water usage, and the least
energy intensive condition when considering a heated condition.

Chapter 7: Conclusions and future work
167
CHAPTER 7: CONCLUSIONS AND
FUTURE WORK
7.1. Thesis conclusions
Cleaning of process equipment is essential to ensure that the product produced in it, is safe for
consumers and that cross contamination between batches of different products is avoided. The
work in this thesis contributed to the output from project ZEAL, a collaborative project,
introduced in Section 1.2, working with 11 partners from industry and academia seeking to
understand the relationship between deposit type and cleaning methodology. A classification
was made grouping different deposit types with the level of cleaning severity required to
remove them by cleaning from process equipment. This work was represented by the
Cleaning Map that was developed by the ZEAL consortium and discussed by Fryer and
Asteriadou (2009). Three deposits types were chosen for further investigation:
Type 1: Toothpaste, removal by fluid flow, which has been reported in this thesis and
some of the work contained within was published in Cole et al (2010). Toothpaste has
been chosen as a model soil, as it is a product which represents a Herschel-Bulkley
material which can be removed from process equipment by fluid flow.
Type 2: yeast based product, removal by chemical and fluid flow, results are reported
by Goode et al (2011).
Type 3: Burnt on Sweet Condensed Milk, removal by chemical, results are reported by
Othman et al (2010).
Understanding the removal behaviour of the material and the impact on cleaning time as a
consequence of fluid parameters, temperature and velocity gives the opportunity to create
optimal cleaning processes. Cleaning processes are rarely optimal at set-up as a conservative

Chapter 7: Conclusions and future work
168
approach is usually taken whilst confidence that the process will be effective and robust is
developed.
7.2. Toothpaste characterisation
It is important to understand the deposit which is the subject of the cleaning studies. In the
case of toothpaste, the product to be removed was the toothpaste itself. Toothpaste was
examined by infrared spectroscopy and the key attributes in the spectrum were attributed to
bonds corresponding with water and the presence of a Si-O-Si bridge, which Almeida et al
(1990), reported as indicative of a weak gel structure. Further evidence of a weak gel structure
came from the Rheology of the toothpaste as elastic modulus is greater than the viscous
modulus as discussed by Gunasekaren and Mehmet Ak (2000). The paste was found to be a
Herschel-Bulkley type material as it had an apparent yield stress and was shear thinning. As
the paste was diluted it became less viscous and by the time the material was 10% dilute had
lost its structure.
The cohesive strength of the paste was calculated from micromanipulation data, with a sample
of height 2 mm from the surface being cut at 1 mm to give a pulling energy of ~ 45 J m-2
. The
adhesive strength calculated from micromanipulation data to remove the toothpaste from a
stainless steel surface was found to be higher than the cohesive strength, it is therefore
expected that the cleaning behaviour will be dominated by the adhesive failure of the paste
from the surface. The adhesive strength of the pastes was measureable up to 60 J m-2
. In
infrared studies, a bond was found to form at 2566 cm-1
between the stainless steel surface
and the toothpaste, this bond was not present in either the neat toothpaste spectra or the
stainless steel coupon spectra.
7.3. Laboratory-scale cleaning studies
The Coupon Rig was used at laboratory scale, this was based on the „flat plate cleaning rig‟
used by Christian (2003) and Ab Aziz (2007). A coupon was coated with paste and placed in
a horizontal duct, the toothpaste was then removed by fluid flow. The cleaning was observed
and images were taken from above the toothpaste coated coupon at systematic intervals which

Chapter 7: Conclusions and future work
169
were then analysed. The process was also monitored by a heat flux sensor positioned under
the coupon, which enabled the heat transfer coefficient to be monitored as a function of time.
Toothpaste removal happened due to erosion of the paste from the fluid flow leading edge. In
more turbulent cases, the paste curled away from the surface into the fluid flow stream,
fluttering in the flow and then ripping away from the bulk paste. The cleaning process was
also monitored from the side, and some evidence of wave behaviour was observed, with a
wave seen to start at the edge of the paste sample, and move along the toothpaste sample until
it reached the far edge of the paste and was removed into the flow. This wave evolution was
predicted from computational model studies performed by Sahu et al (2007), and attributed to
small density differences in the material.
A range of velocities, 0.25 – 0.5 m s-1
, and a range of temperatures, 20°C - 50°C were
monitored. A limited decrease in cleaning time was seen due to increase in the velocity, and a
limited decrease in cleaning time was seen changing temperature from 20°C to 40°C.
However the data at this level was subject to large variation as the toothpaste did not behave
reproducibly.
Toothpaste studies were compared to the previous studies undertaken on the flat plate flow
cell by Christian (2003) and Ab Aziz (2007) using circular coated coupons. Toothpaste was
found to have similar cleaning times under similar conditions to baked tomato paste studied
by both of these authors. This is interesting as this would also be described as a Type 1
deposit according to the Fryer and Asteriadou (2009) definition, as it is a viscous product
capable of removal by fluid mechanics. Hence, some comparability is seen between similar
types of deposits.
Different toothpastes were examined on the Coupon Rig, and substantial differences were
evident between them, with the cleaning time for experiments conducted at 40°C and
0.37 m s-1
ranging from ~ 10 mins to ~ 60 mins. Most of the pastes investigated were silicon
based pastes, and these were observed to have similar removal methods. The exception was
Paste D (a herbal formulation) which showed substantially different removal behaviour to that

Chapter 7: Conclusions and future work
170
seen on the other pastes, with the paste thinning and showing evidence of holes appearing in
the paste structure.
The trend in cleaning time found in Coupon Rig experiments was echoed in the order of the
adhesive and cohesive forces calculated from the micromanipulation experiments. This may
in future be useful for assessing how easy or difficult a new paste is to clean in comparison to
the existing portfolio, however no definitive relationship between the two techniques was
observed.
All of the pastes studied were fit to the Herschel-Bulkley model, and the viscosity term of the
model was plotted against the cleaning time from the Coupon Rig experiments, a logarithmic
relationship was found to exist between the pastes and the cleaning time. A link between
rheology and cleaning time is logical for fluid mechanically removed deposits. This result is
potentially significant for predicting the cleaning of future toothpastes in the portfolio if they
have similar structural properties to those studied here or other similar rheological behaviour
materials. The exception was the herbal formulation (Paste D) which was notably different in
composition to the other pastes and had different viscoelastic properties as shown in
Section 4.9.
7.4. Pilot scale cleaning studies
The coated plate of a measurement port was used to mimic the set-up of the Coupon Rig on
the ZEAL Pilot Plant, with a coating of paste applied to a flat surface and placed horizontally
in the ZEAL Pilot Plant such that the paste protruded into the flow. The removal behaviour
was similar to that seen on the Coupon Rig, with erosion of the paste into the fluid flow, and
in some instances the paste was seen to curl, flutter and rip away from the bulk paste into the
flow. The coated plate experiments were conducted in the velocity range 0.6 – 1.3 m s-1
. It
was found this data formed an exponential trend with the Coupon Rig data with respect to
cleaning time and velocity.
The ZEAL Pilot Plant cleaning experiments used continually refreshed water to allow the
removal of toothpaste from the pipe to be continually tracked by conductivity and turbidity, as

Chapter 7: Conclusions and future work
171
well as using feedback control for temperature and flow. Turbidity was found to be the most
successful method for tracking toothpaste removal into the fluid flow stream. Two turbidity
meters were used with different ranges. The Kentrak meter measured turbidity in Formazine
Turbidity Units (FTU) across the range 0- 500 FTU, which allowed data to be collected across
the entire experimental range. The second turbidity meter, the Optec meter measured turbidity
in nominal ppm across the 0- 50 ppm range which occurred as the equipment became almost
clean. The end point of cleaning for toothpaste in this work on the ZEAL Pilot Plant
experiments has been determined to be 4 ppm on the Optec meter. This occurred when the
pipe was 99% clean by weight.
Pipe sections of fixed diameter and length were investigated, it was found that pipeline
removal of toothpaste by fluid flow happened by two mechanisms. Firstly the core of the
toothpaste was removed from the centre of the paste leaving a thin layer of toothpaste coating
the pipe walls, this core removal occurred within the first seconds of fluid flow. The
remaining thin wall coating took an extended amount of time to clean and was governed by
the removal of toothpaste from the walls by fluid flow. This process was tracked by initially
high readings in the measurements, corresponding to the core removal, followed by a gradual
decay in the responses as the thin film cleaning process occurred.
On the principal paste investigated in this work, the impact of increasing the temperature of
the cleaning water was a decrease in cleaning time between 20°C and 40°C, whilst at higher
temperatures no significant further benefit was seen in terms of reduced cleaning time. This
clustering of temperatures greater than 40°C was seen at all velocities and in all pipelines
investigated. A distinct trend was found between shorter cleaning times and increased velocity
of the cleaning fluid, this is less pronounced above 1.5 m s-1
as the returns are diminished in
terms of actual cleaning time.
Pipes of differing lengths were investigated and no significant difference was found in terms
of cleaning time for lengths between 0.3 m – 2 m. The cleaning process happened in two
stages, core removal and thin film wall removal. The process which was related to pipe length
Chapter 7: Conclusions and future work
172
was the core removal and this corresponded with the residence time of the fluid in the pipe.
This was very short; the longest residence time in the program was 2 s. The experiment time
for 47.7 mm diameter pipe was in the order of greater than 100 s and so the removal of the
pipe wall coating dominated the cleaning time. The wall coating removal was a function of
the diameter and not the length, so for short length differences no impact was seen.
Experiments with different pipe lengths, velocities and temperatures all have the cleaning
time as a power-law Reynolds number fit.
The effect of diameter has been assessed by studying removal from pipes of 23.9 mm,
47.7 mm, 73.2 mm and 101.6 mm diameters on the ZEAL Pilot Plant – it is not possible to
directly compare velocity for all the diameters. The flow rate on the plant is between 6 -
20 m3 h
-1. The 23.9 mm diameter is found to behave significantly differently from the other
diameters this may be due to small boundary layers at the velocities studied. The 47.7 mm,
73.2 mm and 101.6 mm diameter data tend to cluster when examined by Reynolds number
and nominal shear rate analysis, but a clear relationship across the different diameters is not
seen. This may be due to differences in the cleaning mechanisms.
7.5. Scale-up from laboratory to pilot scale
The coated „Plate‟ surface of a measurement port and the 47.7 mm diameter pipeline
experiments undertaken on the ZEAL Pilot Plant were compared and the cleaning times found
to occur in a similar range for otherwise similar conditions.
The data from the Coupon Rig, the Plate and the ZEAL Pilot Plant pipe line were compared,
to assess whether there is scalability for the cleaning result. A power law relationship was
found to fit Reynolds number and the nominal shear parameter introduced in
Cole et al (2010), reasonably well, but the coupon rig data was off set from the ZEAL Pilot
Plant data and so this descriptor had limitations in describing the full scale-up scenario.
Further comparison was done across the Coupon Rig, Flat Plate and ZEAL Pilot Plant pipe rig
experiments, using the wall shear stress. This was found to give a strong inverse correlation

Chapter 7: Conclusions and future work
173
with cleaning time for all the cleaning conditions (temperatures and velocities) experiments
across all scales. This is a consequence of the shear from the fluid flow acting on the wall
surface. This relationship is a significant result here. This demonstrates that the toothpaste,
which is representative of a viscous deposit which is removed exclusively by fluid mechanical
removal, is shown to have a simple relationship for different cleaning conditions, temperature
and flow rate, across scales from a coated 25 mm x 25mm coupon to a 1 m length fully filled
101.6 mm diameter pipe, and correlates data from several experimental equipments.
7.6. Environmental effects
The water usage for cleaning at different processing conditions was compared in the straight
to drain cleaning regimes for diameter 47.7 mm. It was found that the water usage tracks
cleaning time, and so was reduced at 40°C compared with 20°C. This was due to the cleaning
time being quicker at the higher temperatures (40°C) as seen in the cleaning time analysis. No
further benefit was seen from increasing the temperature further. The optimal velocity for
water usage is 1.5 m s-1
, below that velocity there is greater water usage and above which no
significant reduction is found.
The energy usage on the ZEAL Pilot Plant is attributed to two processes, the pumping energy
and the heating energy. The pumping energy will mirror the cleaning time, but the largest
energy use is in heating the water and so the higher the temperature the greater the energy use
will be. The optimum energy use in this process is to clean at 20°C, and at a velocity of
3 m s-1
, based on a clean tube velocity.
However, a balance must be struck between energy and water usage and cleaning time in
industry, and so it is suggested that 40°C and 1.5 m s-1
(velocity based on a clean tube), gives
the least water usage, approaching the lowest cleaning time and the extra energy usage of
heating to 40°C provides a benefit, whereas any further temperature increase sees no
additional reward.

Chapter 7: Conclusions and future work
174
7.7. Approaches to consider when optimising industrial CIP systems
Through this EngD some methods of optimising cleaning and CIP have been identified, these
are informed by the practical experience of performing the experiments, working in the
industry and some are guided by the experimental program.
7.7.1. Capital Costs
Capital costs can be minimised when installing a new CIP plant by considering:
Design: The most important factor in a cleaning process is whether water can contact
the surface, if it can not then it will not clean by CIP. Minimise dead-legs, or clean
these manually. Poor design was found to be significant cause of increased cleaning
for toothpaste using an invasive conductivity probe in which will be discussed in
Section 7.8.3.
Spray balls: Having appropriately sized spray balls can reduce the cost of the spray
balls and reduce water usage. If spray balls are over-specified, the effect of the spray
can be lost on the tank wall with the cleaning fluid becoming more of a mist. If spray
balls are under-specified then insufficient water will impact the wall surface.
Surface finishes: Surface finishes are often over-specified. For toothpaste at laboratory
scale (see Section 4.6) no additional benefit in cleaning time was seen by increasing
the surface finish of stainless steel, or by using polypropylene or PTFE coated
surfaces. Product contact surfaces must be of an appropriate standard, but non-product
contact surfaces do not have to have as high a surface finish. Mirror finishes on tanks
are only for aesthetic reasons.
CIP tank positioning – Reducing pressurised room requirements: If the facility
requires positive pressure rooms or a certain air quality. It is advisable to have as
many of the ancillary functions as possible in a „grey space‟ so that it is supplied

Chapter 7: Conclusions and future work
175
through walls rather than having to increase the size of the room and therefore the
costs of maintaining the room at certain conditions.
Alternatives to manual cleaning: Validation and swabbing are costly parts of the CIP
process. If the process is flexible and requires the connection and disconnection of
hoses etc. or the process has many parts which must be cleaned manually. It may be
possible to use „dish washer‟ type CIP systems, with designed holders to enable the
water to impact the surfaces repeatedly and with good coverage.
Reduced pump and tank sizing – smaller footprint: If the CIP process is optimised for
water usage the amount of water required for the clean is less, and so the CIP tank
required is smaller. As is the pump capacity if the velocity is minimised. Hence, the
associated footprint of the equipment is lower.
7.7.2. CIP system validation
If the types of vessel/production equipment are the same, and the same CIP processes are
applied it may reduce the expensive validation burden.
7.7.3. Reducing the cost of cleaning
Cleaning is responsible for many on-going costs;
replication of equipment, due to reduced equipment availability due to cleaning time
lost production time
energy – especially heating water
water – on-site and disposal costs
cleaning chemical
Environmental costs – effluent disposal
greenhouse gas emissions due to energy use.

Chapter 7: Conclusions and future work
176
To reduce the costs of cleaning, the first approach should be to minimise the amount of cleans
required and then the second should be to optimise the cleaning program.
Approach1: Minimise amounts of cleans
Product Grouping: If possible group similar products together, where the
flavours/actives ingredients etc. are the same. It may be possible to produce similar
batches on top of the previous batch, (dirty pan) or with a limited cleaning step in
between. Reducing the loss of production time and decreasing the amounts of cleans
required.
Product Scheduling: It is possible to schedule product manufacture to limit cleaning.
For example, if a product with more active is produced after one with less, it may be
possible to avoid cleaning between. The relationship with rheology found in this work,
could enable predictions related to cleaning time which could be beneficial when
planning the order of variants to be produced.
Dedicated Equipment: If certain lines are dedicated to one type of product, the need
for extensive cleaning between batches is limited.
Different Cleaning Schedules: If there are multiple pieces of equipment to be cleaned,
it is advisable to clean where possible on a schedule, so that it is possible to limit
peaks for the process water, steam for heating etc.
Approach 2: Minimise cost; time loss; water and energy use of cleans
Pigging: A pig may help reduce product losses/help product recovery and remove the
bulk foulant from the system.
Different Cleaning Processes: Have several CIP programs based on e.g., light clean;
normal clean; sterilant clean (SIP); worst to clean. Which require different amounts of

Chapter 7: Conclusions and future work
177
time, energy and chemical. For toothpaste, the relationship between
micromanipulation and the cleaning time trend could be used to cluster products based
on knowledge of the current portfolio into groups which have similar cleaning
demands.
Heat re-use: If there are hot processes in the production, these processes can be used
to heat water for cleaning via counter current heat exchangers.
Recycled Water: The use of recycled water from CIP systems is widely used in the
drinks industry. Water from the final rinse is saved for a limited time, for a pre-rinse in
the next clean. Chemical rinses where there is minimal product contamination can be
saved and refreshed.
Recirculation: If a foulant is only being removed by fluid contact it is probably worth
re-circulating water which is minimally fouled around the system to get more fluid-
surface contact, rather than putting the water straight to drain.
CIP Optimisation: The CIP process itself can be optimised as detailed in this work.
For the toothpaste plant this could be cleaning of pipe-lines at temperatures of 40°C
and at velocities of 1.5 m s-1
based on a clean tube.
Process Optimisation: Optimising the process, prior to validation, can lead to on-
going cost savings in terms of water and energy use, heating large and excessive
volumes of water is time and energy demanding. The greater the water quantities used,
the more time will be lost from production to fill and heat tanks. Cost savings
estimates on an efficient process verses an inefficient process are 25-50% of the
cleaning costs.
Water Usage: Only use the volume of water required, possibly have a part-fill option
available on balance tanks, where a whole tank is not required. This will reduce water
on to site and effluent volume costs.

Chapter 7: Conclusions and future work
178
Deposit cleaning conditions: Check the conditions which produce the best clean for
the chemical, some may require a soak, rather than spray etc.
Chemicals: The use of chemicals must be considered with respect to the product being
cleaned. It is possible to use less chemical and therefore save money in cleaning time,
energy etc. by using a smaller quantity of a more effective cleaning chemical. There
are novel chemicals which can act as sterilant as well as a detergent. There are
chemicals which can be used at low temperatures, overall reducing lost time and
energy for water heating.
Consider pulsing the chemical, this means that the chemical can act on the top layer of
the foulant, this may then remove with a pulse of water, allowing the chemical to be
used just to break down the fouling rather than to wash it away.
7.7.4. Measurement
If there is measurement instrumentation on the equipment which is used for processing, use it
during cleaning and analyse the data to see if any of the parameters indicate when the
equipment is clean, eg) a certain conductivity, or a certain pressure drop. For toothpaste,
turbidity is a sensitive technique in a once through system.
The system is not clean: If the clean is not working then do not simply increase the chemical
concentration, water volume or temperature as this can be counter-productive, possibly
adversely reacting with the product to form a worse foulant - baking the foulant onto the
surface or over-diluting the chemical.
Good Maintenance: Ensure heat exchangers; pumps etc. are operating efficiently with good
maintenance.
7.8. Future work
A key consideration for future work should be the investigation of different geometries.
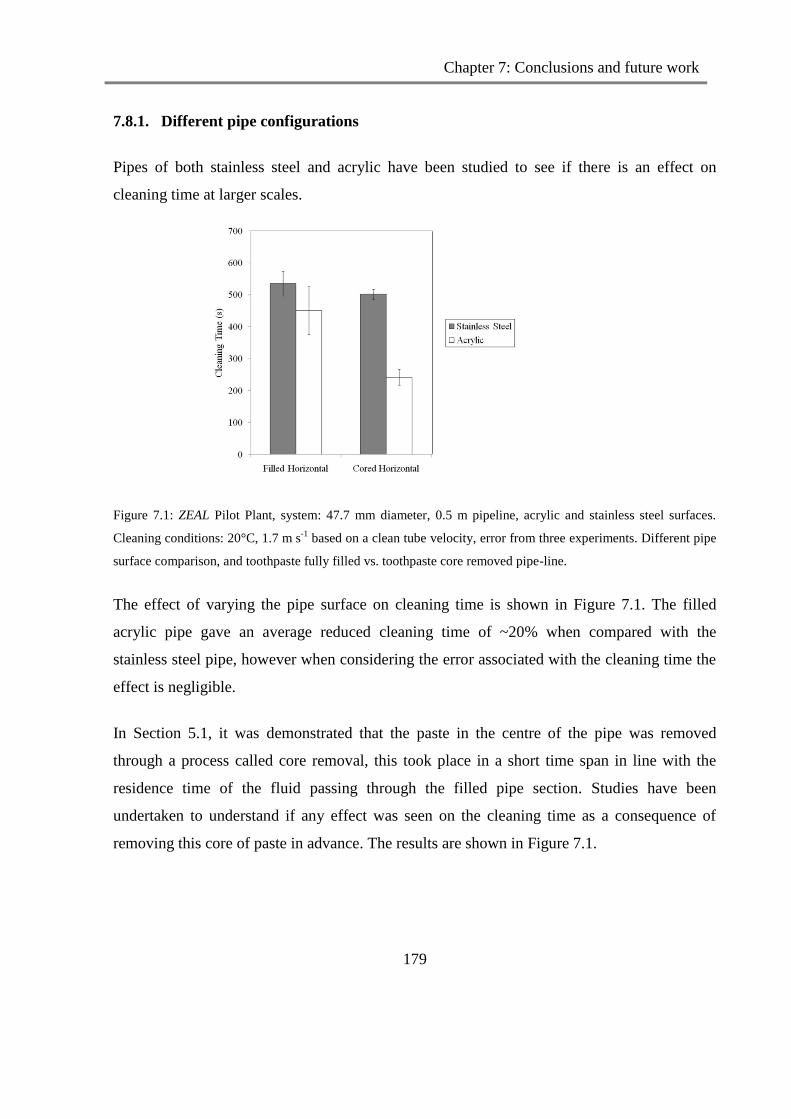
Chapter 7: Conclusions and future work
179
7.8.1. Different pipe configurations
Pipes of both stainless steel and acrylic have been studied to see if there is an effect on
cleaning time at larger scales.
Figure 7.1: ZEAL Pilot Plant, system: 47.7 mm diameter, 0.5 m pipeline, acrylic and stainless steel surfaces.
Cleaning conditions: 20°C, 1.7 m s-1
based on a clean tube velocity, error from three experiments. Different pipe
surface comparison, and toothpaste fully filled vs. toothpaste core removed pipe-line.
The effect of varying the pipe surface on cleaning time is shown in Figure 7.1. The filled
acrylic pipe gave an average reduced cleaning time of ~20% when compared with the
stainless steel pipe, however when considering the error associated with the cleaning time the
effect is negligible.
In Section 5.1, it was demonstrated that the paste in the centre of the pipe was removed
through a process called core removal, this took place in a short time span in line with the
residence time of the fluid passing through the filled pipe section. Studies have been
undertaken to understand if any effect was seen on the cleaning time as a consequence of
removing this core of paste in advance. The results are shown in Figure 7.1.

Chapter 7: Conclusions and future work
180
Figure 7.1 shows that the cleaning time between the stainless steel pipe when filled and with
core removed is the same. This study further demonstrates that the removal of the thin wall
coating is the rate dominating process in terms of cleaning time for toothpaste in a stainless
steel pipe. In the case of the acrylic pipe, a substantial cleaning time reduction was seen when
cleaning the core removed pipe to the fully filled pipe. It is postulated that this is due to the
effect of the different surfaces and that this has impacted the rate of removal. It would be
useful to progress this to include work on different surfaces, and different surface finishes,
and to look at different deposit types. This could form the basis for some modelling work.
7.8.2. Fouling loop
The pilot scale work in this thesis has focused on developing a base line for cleaning
knowledge based on a toothpaste filled pipe of a set length. To begin understand the effects
for more realistic plant items, some experiments have been performed using a fully fouled test
loop of 3 m length, with straight pipe sections, and incorporating bends and t-pieces. The
turbidity profile for the fouled loop is different from the test piece of set length as shown in
Figure 7.2.

Chapter 7: Conclusions and future work
181
Figure 7.2: ZEAL Pilot Plant: System: 47.7 mm diameter pipe, different lengths including a fouled test loop
incorporating t-pieces and bends. Cleaning conditions: 40°C, 1.7 m s-1
based on a clean tube velocity.
Comparing filled straight pipe with 3 m filled fouling loop including t-pieces and bends.
The fouling loop turbidity profile seen in Figure 7.2 shows a jagged response compared with
the smooth response due to the set pipe length. These spikes in the turbidity reading are
attributed to the different cleaning behaviours for the different geometries. The cleaning time
for the fouling loop vs. the set test piece length was increased from 280 s for the 2 m section,
to 560 s for the 3 m fouling loop, incorporating a 2 m straight pipe section. This is a
substantial increase in cleaning time, considering that it has been shown in Section 5.8 that
the length of the pipe has limited effect. This increased cleaning time must be due to the
presence of the t-pieces and bends.
Further work is required on different geometries, and on combinations of these plant items.
This could be by considering a cleaning index, where many plant items are compared to a
standard plant item, i.e. a pipe.

Chapter 7: Conclusions and future work
182
7.8.3. Protruding conductivity probe
The Pipe Rig reported in Section 3.6.1 where the low flow rate experiments took place,
incorporated a conductivity probe. In the Pipe Rig set-up the whole system was filled with
toothpaste including the conductivity probe which protruded into the flow stream.
Experiments found that the invasive conductivity probe was always the last item to clean in
the system, and so the conductivity response for these experiments was actually due to the
cleaning of the conductivity probe, and not in fact the cleaning of the pipe.
As the pipeline was filled with paste, the conductivity rose to 3.7 mS cm-1
, which was the
conductivity value corresponding to the neat toothpaste. This value was stable until the water
passed through the pipe and removed the core of the paste. Different conductivity profiles
arose when cleaning was undertaken at different velocities (based on a clean tube) as
represented in Figure 7.3.

Chapter 7: Conclusions and future work
183
i) ii)
iii)
Figure 7.3: Pipe Rig: System: 47.7 mm ID diameter, 1 m length of pipe, Conductivity difference (normalised) vs.
time with water at ambient temperature (15°C) and different velocities (based on a clean tube) i) typical
conductivity profile for velocities < 0.21 m s-1
, ii) typical conductivity profile for velocity ~ 0.30 m s-1
, iii)
typical conductivity profile for velocities 0.40 – 0.6 m s-1
.
The conductivity profiles presented in Figure 7.3 show that the toothpaste removal happens in
different ways from the invasive conductivity probe as a function of flow rate:
The profile seen in Figure 7.3 (i) shows that at < 0.21 m s-1
, a steady decline in the
conductivity measurement was observed throughout the experiment. This correlates
with the low flow removal images taken at the end of the test length (Figure 5.11)
where there was limited core removal and a thick layer remaining on the wall. As such
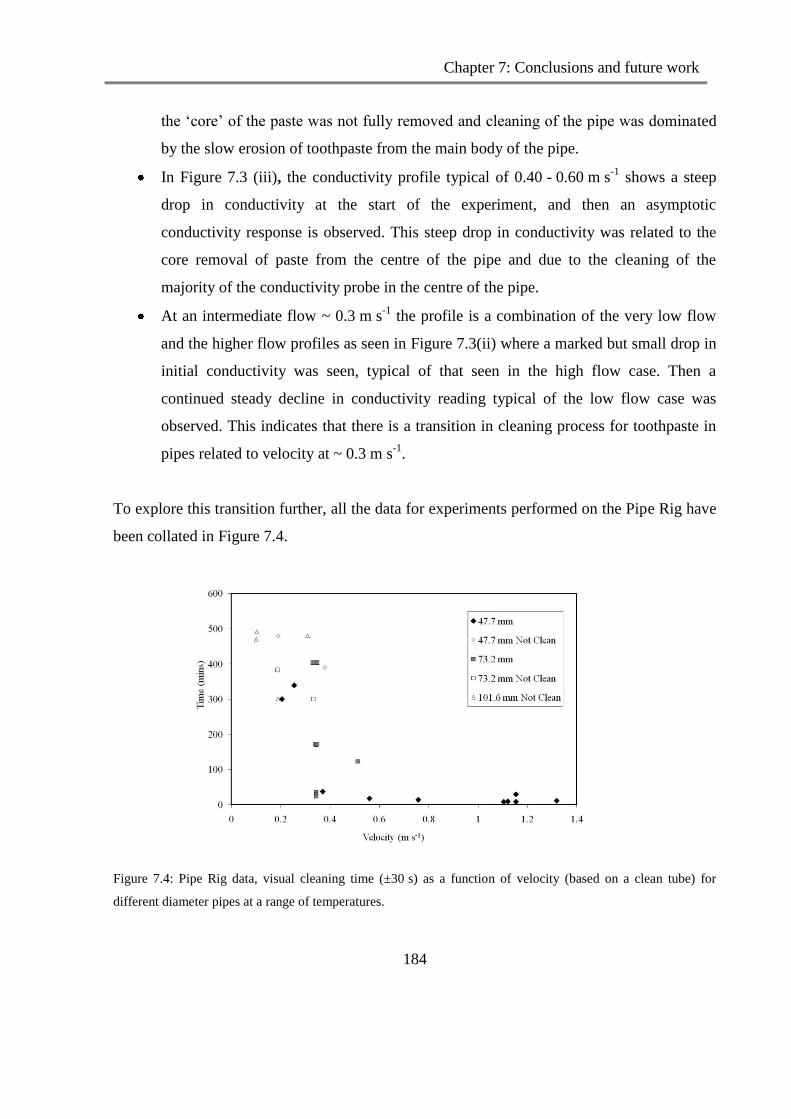
Chapter 7: Conclusions and future work
184
the „core‟ of the paste was not fully removed and cleaning of the pipe was dominated
by the slow erosion of toothpaste from the main body of the pipe.
In Figure 7.3 (iii), the conductivity profile typical of 0.40 - 0.60 m s-1
shows a steep
drop in conductivity at the start of the experiment, and then an asymptotic
conductivity response is observed. This steep drop in conductivity was related to the
core removal of paste from the centre of the pipe and due to the cleaning of the
majority of the conductivity probe in the centre of the pipe.
At an intermediate flow ~ 0.3 m s-1
the profile is a combination of the very low flow
and the higher flow profiles as seen in Figure 7.3(ii) where a marked but small drop in
initial conductivity was seen, typical of that seen in the high flow case. Then a
continued steady decline in conductivity reading typical of the low flow case was
observed. This indicates that there is a transition in cleaning process for toothpaste in
pipes related to velocity at ~ 0.3 m s-1
.
To explore this transition further, all the data for experiments performed on the Pipe Rig have
been collated in Figure 7.4.
Figure 7.4: Pipe Rig data, visual cleaning time (±30 s) as a function of velocity (based on a clean tube) for
different diameter pipes at a range of temperatures.

Chapter 7: Conclusions and future work
185
Figure 7.4 shows that for experiments conducted on the Pipe Rig for a variety of different
pipe systems spanning diameters of 47.7 mm, 73.2 mm and 101.6 mm, the cleaning times are
very long in all cases for velocities, of under 0.4 m s-1
(based on a clean tube velocity). At ~
0.4 m s-1
, cleaning times transition from > 100 mins to less than 20 mins. This velocity
corresponds to the change in conductivity profile for the conductivity probe seen in Figure
7.3. It appears that a transition in cleaning behaviour occurs at ~ 0.4 m s-1
for toothpaste
cleaning from a filled pipe.
7.8.4. Single Seat Valve
Extension from pipe work to other systems is going to be critical to gain confidence that
cleaning conditions identified at laboratory and pilot scale are applicable at industrial plant
scale. A model single seat valve has been examined to see if the lessons gained from a simple
pipe are relevant when looking at a more complicated geometry. The images associated with a
cleaning experiment are shown in Figure 7.5.
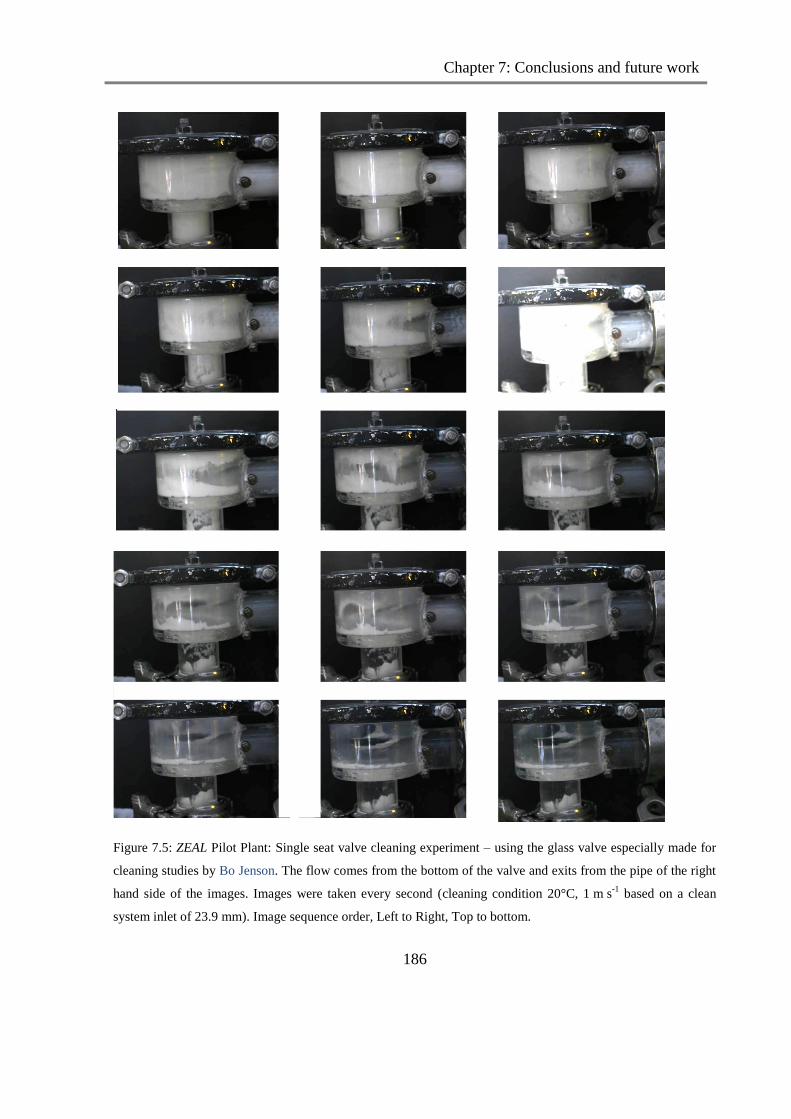
Chapter 7: Conclusions and future work
186
Figure 7.5: ZEAL Pilot Plant: Single seat valve cleaning experiment – using the glass valve especially made for
cleaning studies by Bo Jenson. The flow comes from the bottom of the valve and exits from the pipe of the right
hand side of the images. Images were taken every second (cleaning condition 20°C, 1 m s-1
based on a clean
system inlet of 23.9 mm). Image sequence order, Left to Right, Top to bottom.

Chapter 7: Conclusions and future work
187
The single seat valve was manually filled with toothpaste and then the toothpaste removed by
fluid flow. The flow inlet is at the base of the valve and the flow outlet at the right hand side
as shown in Figure 7.5. This cleaning experiment was imaged every 1 s.
Within the first few seconds no difference on the surface of the valve was observed. In
these first few seconds, the turbidity measurement showed a sharp initial peak. This
initial peak must correspond to core removal of the paste from the internal body of the
valve.
After this initial turbidity peak, very limited turbidity response was noted for the
remainder of the experiment. Toothpaste was seen to thin due to the fluid flow on the
surface of the valve at the inlet and outlet regions.
Further thinning of the paste was observed around the central body of the valve – with
a swirl pattern developing in the main valve body. This had the effect of cleaning the
glass surface in the main body of the valve and on the inlet and outlet.
After some time, paste was found only to remain at the very base of the valve in the
flat base of the valve body and on the internal valve parts and in the inlet entry zone.
These sections were cleaned more slowly with additional flow.
The seat valve took ~ 150 s to clean at 20°C and 1 m s-1
based on a 23.9 mm diameter clean
inlet velocity. This is compared to ~ 1350 s for similar cleaning conditions in a 1 m pipe
length of 47.7 mm diameter. Thus demonstrating that an item of more complex geometry can
promote fluid turbulence and consequently it can clean more quickly than simple pipe
geometry.
Further work could focus on plant items which are thought to be difficult to clean. These
could be modelled and equipment designed to increase turbulence in the equipment.
7.8.5. Different geometry summary
A small selection of different geometries have received preliminary cleaning investigations
for removal of toothpaste by fluid flow. It is essential for the cleaning studies to be extended

Chapter 7: Conclusions and future work
188
beyond pipes if the results are going to have more substantial application in industry. An
acrylic pipe could be placed inline in a manufacturing plant as a guide to when the
surrounding stainless steel pipe-work is likely to be clean, i.e. monitor the time for the acrylic
pipe and add 20%. It would be useful to further understand the effect on cleaning time
attributed to different surfaces, and different surface finishes, and to look at different deposit
types. This could form the basis for some modelling work.
Work has been done on the ZEAL Pilot Plant with a fully filled system which included bends
and t-pieces, which showed that the measurement profile is substantially different from that of
simple straight pipes and the cleaning time is significantly increased. This could form the
basis of interesting studies which develop a cleaning index comparing different geometry
equipment.
Work on the Pipe Rig, which included an invasive conductivity probe, emphasised the
importance of hygienic design as the measurement was found to track the cleaning of the
probe and not the cleaning of the plant. The profiles of this measurement were able to show
that a change in cleaning behaviour exists around 0.4 m s-1
. This was supported by the output
of a variety of experiments on the Pipe Rig which were monitored visually and found to have
substantially longer cleaning times at velocities less than 0.4 m s-1
. It would be interesting to
compare other materials of similar rheological property to toothpaste and see if this trend
exists in other cases and whether a velocity minimum occurs which could be related to
viscosity for instance.
The more complicated geometry of a MPV valve was cleaned and monitored and despite
being more complex was found to have a shorter cleaning time than the equivalent pipe
length, due to the design of the valve promoting turbulence in the valve and enhancing
cleaning. This work could be extended further to allow development of a cleaning index
where the cleaning of plant items is compared to that of a pipe length.
Further work could focus on plant items which are thought to be difficult to clean. These
could be modelled and design for equipment done to increase turbulence in the equipment.

Chapter 7: Conclusions and future work
189
7.8.6. Other further work
It would be interesting to compare the cleaning behaviour seen for toothpaste to other
deposits, both fluid mechanical cleaned and the other types of product using chemical cleans
to further build understanding of how different products clean in relation to each other.
Further work on measurement is required to establish a clear end-point which could prevent
over-cleaning; this must either be done by identifying measurements which are sensitive to
the cleaning end-point for every deposit or by data fusion techniques combining several
measurement responses.
It would also be interesting to look at the cleaning effect on different geometry items,
particularly tanks which are the major item for most production cleaning. It would be
interesting to evaluate if the inverse wall shear stress relationship holds true for other plant
items with viscous product. Some limited studies have been conducted on different plant
items to allow some basis for future work.

References
190
REFERENCES
Ab Aziz, N. (2007) Factors that affect cleaning process efficiency. Ph.D. thesis, University of
Birmingham, UK.
Akhtar, N., Bowen, J., Asteriadou, K., Robbins, P.T., Zhang, Z., and Fryer, P.J. (2010)
Matching the nano- to the meso- scale: measuring deposit surface interactions with
atomic force microscopy and micromanipulation. Foods and Bioproducts processing,
88: 341-348
Alfa Laval (2007) Sales Literature
Alfa Laval (2007) Spray Ball Impact Profile [online] Available from:
http://www.csidesigns.com/alfalaval/trax.php [Accessed 26th August 2011]
Almeida., R. M.; Guiton., T. A., Pantano., C. G.; (1990) Characterization of Silica Gels by
Infrared Reflection Spectroscopy, J. Non-Cryst. Solids,121: 193-197
APV (2005) Sales Literature
Bergman, B.O., and Trägårdh, C., (1990) An approach to study and model the hydrodynamic
cleaning effect. Journal of Food Process Engineering, 13: 135–154
Bird, M. R. and Fryer, P. J. (1991) An experimental study of the cleaning of surfaces fouled
by whey proteins. Trans IChemE, 69: 13–21
Bott, T. R., (1995) Fouling of Heat Exchangers. Chemical Engineering Monographs, 26,
Elsevier, Oxford.
Buchhave, P. (1992) Particle Image Velocimetry – status and trends. Experimental Thermal
Science. 5: 586-604

References
191
Casarin, M., Falcomer, D., Glisenti. A., Natile, M. N., Poli, F., Vittadini, A. (2005)
Experimental and QM/MM investigation of the hydrated silica surface reactivity.
Chemical Physics Letters, 405: 459–464
Changani, S. D., Belmar-Beriny, M. T., and Fryer, P. J. (1997) Engineering and chemical
factors associated with fouling and cleaning in milk processing. Experimental
Thermal and Fluid Science, 14(4): 392-406
Chew, J. Y. M., Paterson, W. R., Wilson, D. I. (2004). Fluid dynamic Gauging for measuring
the strength of soft deposits. Journal of Food Engineering, 65: 175-187
Christian, G. K. (2003) Cleaning of carbohydrate and dairy protein deposits. Ph.D. thesis,
University of Birmingham, UK.
Christian, G. K., Changani, S. D., Fryer, P. J. (2002) The effect of adding minerals on fouling
from whey protein concentrate - Development of a model fouling fluid for a plate heat
exchanger. Food and Bioproducts Processing, 80 (C4): 231-239
Christian, G. K., Fryer, P. J. (2006) The effect of pulsing cleaning chemicals on the cleaning
of whey protein deposits. Trans IChemE C, 84 (C4): 320-328.
Coates, J. (2006) Interpretation of Infrared Spectra, A Practical Approach. Encyclopedia of
Analytical Chemistry. DOI: 10.1002/9780470027318.a5606
Coussot, P., Nguyen, Q. D., Huyhn, H. Y., Bonn, D. (2002) Avalanche Behavior in Yield
Stress Fluids. The American Physical Society, Physical Review Letters, 88 (17):
175501-1 – 175501-4
Cole, P. A., Asteriadou, K. A., Robbins, P. T., Owen, E. G., Montague, G. A., Fryer, P. J.
(2010) Comparison of cleaning of toothpaste from surfaces and pilot scale pipework.
Food and Bioproducts Processing, 88: 392 -400

References
192
Das, S. K., Sharma, M. M. and Schechter, R. S. (1995) Adhesion and hydrodynamic removal
of collidal particles from surfaces. Particulate Sci Technol, 13: 227–247
De Goederen, G., Pritchard, N. J. and Hasting, A. P. M. (1989) Improved cleaning processes
for the food industry. In Fouling and Cleaning in Food Processing,. Kessler H G and
Lund D B, eds. University of Munich,Germany.De Jong P, pp 115–130
Doytcheva, B. K. (2003) Structural Disruption of Toothpastes Under Deformation – An Easy
Release of Active Ingredients. The Canadian Journal of Chemical Engineering, 81:
285-288
EHEDG Document No 8 (2004) Hygienic design criteria Second Edition.
EHEDG Document No 14 (2004) Hygienic design of valves for food processing Second
Edition.
Eide, M. H., Homleid, J. P. and Mattsson, B. (2003) Life cycle assessment (LCA) of cleaning-
in-place processes in dairies. Lebensmittel-Wissenschaft und-Technologie, 36 (3):
303-314
Farries, R. and Patel, H. (1993) The effect of flow reversal and pulsing on surface cleaning.
PhD Thesis, University of Cambridge, UK.
Friis, A. and Jenson, B. B. B. (2002) Prediction of hygiene in food processing equipment
using flow modelling. Trans IChemE, 80(C): 281-285
Fryer, P. J., Christian, G. K., Liu, W. (2006) How hygiene happens: the physics and chemistry
of cleaning. International Journal of Dairy Technology, 59 (2): 76-84
Fryer, P. J. and Asteriadou, K. (2009) A prototype cleaning map: A classification of industrial
cleaning processes. Trends in Food Science & Technology, 20: 255-262

References
193
Fryer, P. J., Robbins, P. T., Cole, Pamela. M., Goode, K. R., Zhibing, Z. (2011) Populating
the cleaning map: can data for cleaning be relevant across different lengthscales?
Procedia Food Science, 1: 1761-1767
Gallot-Lavallee, T., Lalande, M., and Corrieu, G. (1984). Cleaning kinetics modelling of
holding tubes fouled during milk pasteurisation. Journal of Food Process
Engineering, 7: 123-142
Gillham, C. R. (1997) Enhanced cleaning of surfaces fouled by whey protein. PhD Thesis,
University of Cambridge, U.K
Gillham, C. R., Fryer, P. J., Hasting, A. P. M. and Wilson, D. I. (1999) Cleaning-in-Place of
whey protein fouling deposits: mechanisms controlling cleaning, Trans IChemE C, 77:
127-136
Gillham, C. R., Fryer, P. J., Hasting, A. P. M. and Wilson, D. I. (2000) Enhanced cleaning of
whey protein soils using pulsed flows. Journal of Food Engineering, 46: 199-209.
Goode, K. G., Asteriadou, K., Fryer, P. J., Picksley, M. and Robbins, P. T. (2010)
Characterising the cleaning mechanisms of yeast and the implications for cleaning in
place (CIP). Trans IChemE C - Food and Bioproducts Processing, 88 (4): 365 - 374
Grasshoff, A. (1994) Efficiency assessment of a multiple stage CIP procedure for cleaning a
dairy plate heat exchanger. In Fouling and Cleaning in Food Processing, 23–
25March, Jesus College, Cambridge, 103–110
Gunasekaran, S., Mehmet Ak, M. (2000) Dynamic Oscillatory Shear Testing of Foods –
Selected Applications. Trends in Food Science & Technology, 11: 115-127
Guzel-Seydim, Z. B., Wyffels, J. T., Greene, A. K., Bodine, A. B. (2000) Removal of dairy
soil from heated stainless steel surfaces: use of oxonated water as a prerinse. Journal of
Dairy Science. 83 (8): 1887-1891

References
194
Hall, J. E. (1998) Computational fluid dynamics: a tool for hygienic design. In Fouling and
Cleaning in Food processing ’98, (Jesus College, Cambridge, UK)144–151
Hanjalic, K. and Smajevic, I. (1994) Detonation wave technique for local deposit removal
from surfaces exposed to fouling. Part I: Experimental investigation and development of
the method and Part II: Full scale application. Eng.Gas Turbines and Power J, 116:
223-236
Hankinson, D. J. and Carver, C. E. (1968) Fluid dynamic relationships involved in circulation
cleaning. Journal of Dairy Sciences. 51(11): 1761-1767
Hasting, A. P. M. (2005) Improving the hygienic design of closed equipment In H. L. M.
Lelieve (ed) Handbook of hygiene control in the food industry
Henningsson, M., Regner, M., Östergren, K., Trägårdh, C. and Dejmek, P. (2007) CFD
simulation and ERT visualization of the displacement of yoghurt by water on industrial
scale, Journal of Food Engineering, 80 (1): 166-175
Hooper, R. J., Liu, W., Fryer, P. J., Paterson, W. R., Wilson, D. I., Zhang, Z. (2006)
Comparative Studies of Fluid Dynamic Gauging and a Micromanipulation Probe for
strength measurements. Trans IChemE - Food and Bioproducts Processing, 84(C4):
353-358
Jensen, B. B. B., Adler-Nissen, J., Andersen, J. F. and Friis, A. (2001) Prediction of
cleanability in food processing equipment using CFD, In Proc Eighth Int Congr
Engineering and Food (ICEF8), (Technomic, Lancaster PA, USA). Chap. XIII.3, II:
1859–1863
Jensen, B. B. B. and Friis, A. (2004) Critical wall shear stress for the EHEDG test method.
Chemical Engineering and Processing, 43: 831-840.

References
195
Jesionowski, T., Krysztafkiewicz, A., (2000) Comparison of the techniques used to modify
amorphous hydrated silicas. Journal of Non-Crystalline Solids, 277: 45-57
Joiner, A. (2007) The Cleaning of Teeth, Handbook for Cleaning/Decontamination of
Surfaces, 371-405
Jordan, S. L., Taylor, L.T., McPherson, B., Rasmussen, H. T. (1996) Identification of an anti-
bacterial agent in toothpaste via liquid chromatography-Fourier transform infrared
spectrometry mobile phase elimination . Journal of Chromatography A, 755 (2):
211-218
Karamercan, O. E. and Gainer, J. L. (1979) The effect of pulsations on heat transfer.
Ind.Eng.Chem.Fundam, 18 (1): 11-15
Kaya, D. (2011) CIP Unit [online]. Available from: http://www.denizkaya.net/wp-
content/uploads/2010/01/FB_Single-Tank_Diagram.jpg [Accessed checked 26th August
2011]
Kenneth, J. D., MacKenzieb, Thaumaturgoa. C., Valeria, F. F. (2000) Synthesis and
characterisation of materials based on inorganic polymers of alumina and silica: sodium
polysialate polymers Barbosaa, International Journal of Inorganic Materials, 2: 309–
317
Klavenes, A., Stalheim, T., Sjovold, O., Josefson, K., Granum, P. E. (2002) Attachment of
Bacillus cereus spores with and without appendages to solids surfaces of stainless steel
and polypropylene. In Fouling, cleaning and disinfection in food processing UK:
Department of Chemical Engineering, University of Cambridge. (pp. 69–76)
LeBlanc, D. A. (2000) Validated cleaning technologies for pharmaceutical
manufacturing. Interpharm Press, Denver, Colorado, ISBN: 1-57491-116-3

References
196
Lelièvre, C., Antonini, G., Faille, C. and Bénézech, T. (2002) Cleaning-in-place - Modelling
of cleaning kinetics of pipes soiled by Bacillus spores assuming a process combining
removal and deposition, Trans. IChemE C, 80(C4): 305-311
Lelièvre, C., Legentilhomme, P., Gaucher, C., Legrand, J. and Bénézech, T. (2002b) Cleaning
in place: effect of local wall shear stress variation on bacterial removal from stainless
steel equipment. Chemical Engineering Science, 57(8): 1287-1297
Lemlich, R. (1961) Vibration and pulsation boost heat transfer. Chemical Engineering.
68(10): 171-176
Liu, W., Fryer, P. J., Zhang, Z., Zhao, Q., Liu, Y. (2006): Identification of cohesive and
adhesive effects in the cleaning of food fouling deposits: Innovation food Science and
Emerging Technologies. 7: 263-269
Liu, W., Ab. Aziz, N., Zhang, Z. and Fryer, P. J. (2007) Quantification of the cleaning of egg
albumin deposits using micromanipulation and direct observation techniques. Journal
of Food Engineering, 78: 217-224
Liu, W., Christian, G. K., Zhang, Z., Fryer, P. J. (2006). Direct measurement of the force
required to disrupt and remove fouling deposits of whey protein concentrate.
International Dairy Journal, 16 (2): 164-172
Liu, W., Christian, G. K., Zhang, Z., Fryer, P. J. (2002) Development and Use of a
Micromanipulation Technique for Measuring the Force Required to Disrupt and
Remove Fouling Deposits. Food and Bioproducts Processing: 80 (C4): 286-291
Liu, W., Fryer, P. J., Zhang, Z., Zhao, Q., Liu, Y. (2003) Identification of cohesive and
adhesive effects in the cleaning of food fouling deposits. Innovative Food Science and
Emerging Technologies, 7: 263-269

References
197
Martinelli, R. C., Boelter, L. M. K., Weinberg, E. B. and Yakal, S. (1943) Heat transfer to a
fluid flowing periodically at low frequencies in a vertical tube. Trans ASME, 65: 789
Mickaily, E. S. and Middleman, S. (1993) Hydrodynamic cleaning of a viscous film from the
inside of a long tube, AIChEJ, 39(5): 885-893
Morison, K. R., Thorpe, R. J. (2002) Spinning Disc cleaning of skimmed milk and whey
protein deposits. Trans IChemE, 80(C): 320
Mott, I. E. C., Sticker, D. J., Coakley, W. T. and Bott, T.R. (1995) Ultrasound in the control
of biofilms. In: Engineering Foundation Conference, USA
Náraigh, L. O. and Spelt, P. D. M. (2010) Interfacial instability of turbulent two-phase
stratified flow: Pressure-driven flow and non-Newtonian layers, Journal of Non-
Newtonian Fluid Mechanics, 165: 489-508
Othman, A.W., Asteriadou, K., Robbins, P.T., Fryer, P.J. (2010) Cleaning of sweet condensed
milk desposits on a stainless steel surface. In: Fouling & Cleaning in Food Processing.
2010 Conference Cambridge, Session V. Department of Chemical Engineering,
Cambridge, 174-182
Pan, Q. Y., Apelian, D., Alexandrou, A. N. (2004) Yield Behavior of Commercial Al-Si
Alloys in the semisolid state. Metallurgical and Materials Technologies
Transactions B, 35B: 1187-1202
Plett, E. A., (1985) Cleaning of fouled surfaces, in Lund, D. B. (ed). In Fouling and
Cleaning in Food Processing, 286–311
Prencipe, M., Masters, J. G., Thomas, K. P., Norfleet, J. (1995) Squeezing Out a Better
Toothpaste. CHEMTECH, 25(12): 38

References
198
Quarini, J. (2002) Ice-pigging to reduce and remove fouling and to achieve clean-in-place.
Applied Thermal Engineering, 22: 747–753
Reinemann, D. J. (1996) Technical design and assessment of tube equipment using two-phase
flow for cleaning and disinfection. International Journal of Hygiene and
Environmental Medicine 199(2-4) 355-365
Sahu, K. C., Ding, H., Valluri. P. and Matar, O.K. (2009) Linear stability analysis and
numerical simulation of miscible two-layer channel flow, Phys. Fluids, 21: 042104
Sahu, K. C., Valluri, P., Spelt, P. D. M. and Matar, O. K. (2007) Linear instability of
pressure-driven channel flow of a Newtonian and a Herschel-Bulkley fluid, Phys.
Fluids, 19: 122101
Shriver, D. F. and Atkins, P. W., (2001) Inorganic Chemistry, 3rd
edition 1999, reprint 2000,
2001, Oxford University Press, raman spec: Ch4, pg135
Steffe (1996) Rheological Methods in Food Process Engineering, 2nd
Ed; J.F.; Freeman
Press
TA Model Note (2007) Rheological Profiles. Available from TA instruments online help
system manual [Accessed last accessed 5-June-2007]
Timperley, D. A. and Smeulders, C. N. M. (1988) Cleaning of dairy HTST plate heat
exchangers: optimisation of the single-stage procedure. Journal of the Society of
Dairy Technology 41: 4–7
Tragardh, Ch. (1981) Cl0065aning in air water flow. In: Fundamentals and applications of
surface phenomena associated with fouling and cleaning in food processing,
Hallström, B., Lund, D. B. and Trägardh, Ch., Tylösand, Eds., Sweden. 424-429.

References
199
Tuladhar, T. R., Paterson, W. R. and Wilson, D. I. (2002) Investigation of alkaline cleaning-
in-place of whey protein deposits using dynamic gauging. Trans. IChemE C, 80: 199-
214
van Asselt, A. J., Houwelingen, G., and Te Giffel, M.C. (2002) Monitoring system for
improving cleaning efficiency of cleaning-in-place processes in dairy environments.
Trans IChemE C, 80: 276-280.
Vankeirsbilck, T., Vercauteren, A., Baeyens, W., Van der Weken, G., Verpoort, F., Vergote,
G., Remon, J.P. (2002) Applications of Raman spectroscopy in pharmaceutical analysis.
Trends in Analytical Chemistry, 21(12): 869-877
Visser, J. (1995) Particle adhesion and removal: A review Particulate Science and
Technology, 13: 169–196.
Watkinson, A. P., Wilson, D. I. (1997) Chemical Reaction Fouling: A Review. Experimental
Thermal and Fluid Science. 14: 361-375
Wiklund, J., Stading, M., Trägårdh, C., (2010) Monitoring liquid displacement of model and
industrial fluids in pipes by in-line ultrasonic rheometry. Journal of Food Engineering,
99(3): 330-337

Appendix 1: Paper
200
APPENDIX 1: PAPER
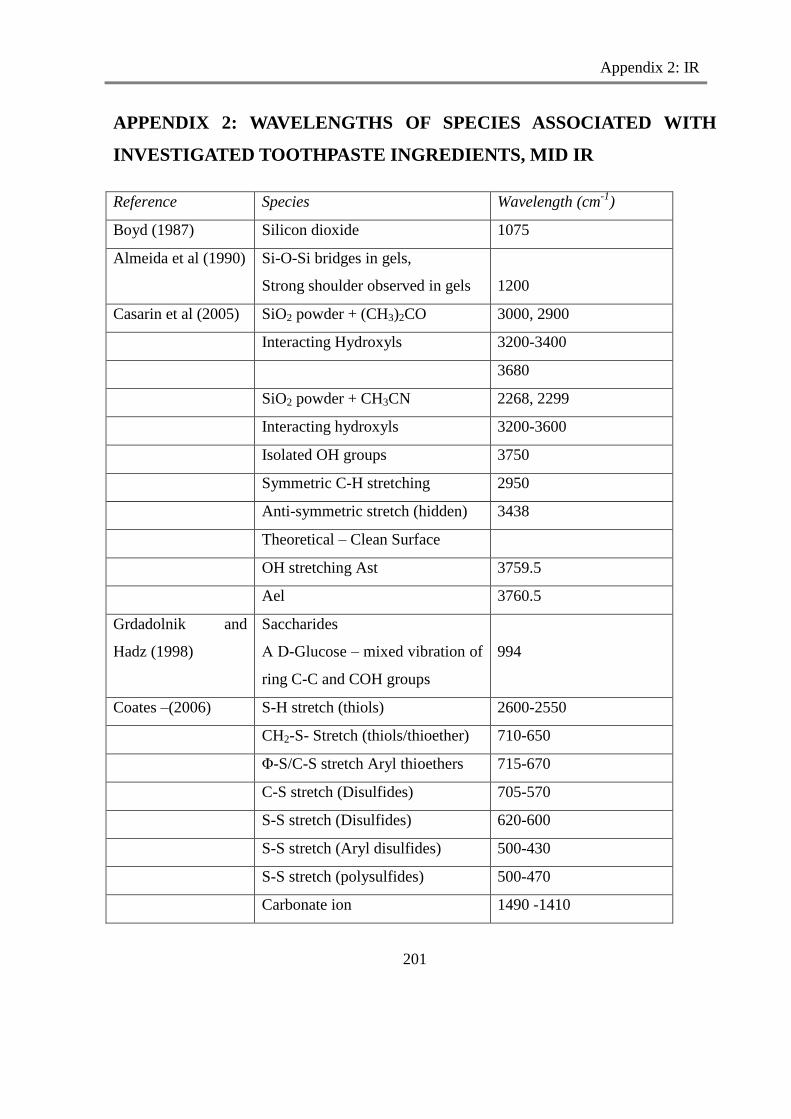
Appendix 2: IR
201
APPENDIX 2: WAVELENGTHS OF SPECIES ASSOCIATED WITH
INVESTIGATED TOOTHPASTE INGREDIENTS, MID IR
Reference Species Wavelength (cm-1
)
Boyd (1987) Silicon dioxide 1075
Almeida et al (1990) Si-O-Si bridges in gels,
Strong shoulder observed in gels
1200
Casarin et al (2005) SiO2 powder + (CH3)2CO 3000, 2900
Interacting Hydroxyls 3200-3400
3680
SiO2 powder + CH3CN 2268, 2299
Interacting hydroxyls 3200-3600
Isolated OH groups 3750
Symmetric C-H stretching 2950
Anti-symmetric stretch (hidden) 3438
Theoretical – Clean Surface
OH stretching Ast 3759.5
Ael 3760.5
Grdadolnik and
Hadz (1998)
Saccharides
Α D-Glucose – mixed vibration of
ring C-C and COH groups
994
Coates –(2006) S-H stretch (thiols) 2600-2550
CH2-S- Stretch (thiols/thioether) 710-650
Φ-S/C-S stretch Aryl thioethers 715-670
C-S stretch (Disulfides) 705-570
S-S stretch (Disulfides) 620-600
S-S stretch (Aryl disulfides) 500-430
S-S stretch (polysulfides) 500-470
Carbonate ion 1490 -1410
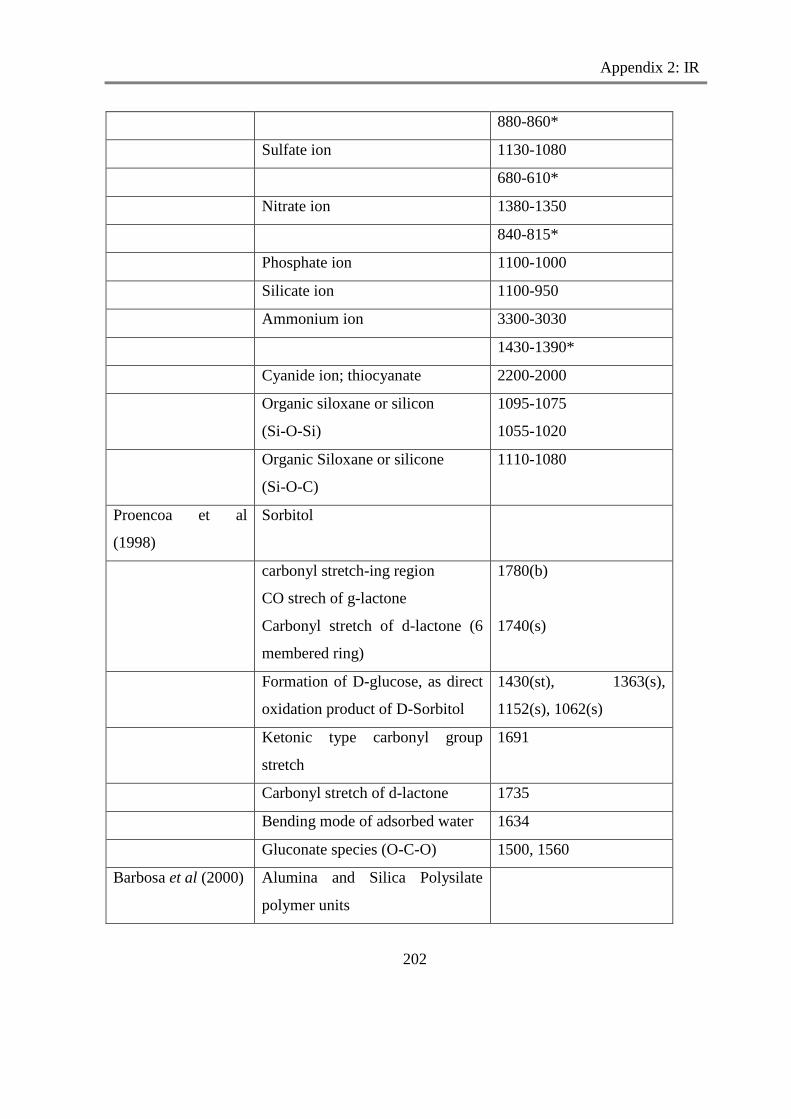
Appendix 2: IR
202
880-860*
Sulfate ion 1130-1080
680-610*
Nitrate ion 1380-1350
840-815*
Phosphate ion 1100-1000
Silicate ion 1100-950
Ammonium ion 3300-3030
1430-1390*
Cyanide ion; thiocyanate 2200-2000
Organic siloxane or silicon
(Si-O-Si)
1095-1075
1055-1020
Organic Siloxane or silicone
(Si-O-C)
1110-1080
Proencoa et al
(1998)
Sorbitol
carbonyl stretch-ing region
CO strech of g-lactone
Carbonyl stretch of d-lactone (6
membered ring)
1780(b)
1740(s)
Formation of D-glucose, as direct
oxidation product of D-Sorbitol
1430(st), 1363(s),
1152(s), 1062(s)
Ketonic type carbonyl group
stretch
1691
Carbonyl stretch of d-lactone 1735
Bending mode of adsorbed water 1634
Gluconate species (O-C-O) 1500, 1560
Barbosa et al (2000) Alumina and Silica Polysilate
polymer units

Appendix 2: IR
203
Metakaolinite 3450 (b)
Adsorbed atmospheric water 1650
Si-O strtching vibration 1088
Si-O Al Vib 810
Si-O Bending Vibration 450
Quartz impurity 1000
Formation of Polymer – water
increases intensity of peaks
3500,1650
Sodium carbonate 1460
Yue et al (2001) Calcite
Non-symmetrical stretching mode
of C1/4
O (n3)
1425(st,b)
Out of phase bending vibration
(n2)
874
In plane bending vibrational mode
(n4) of OCO
712
Ultra-fine calcite
Non symmetrical CO stretch 1425+40 blue shift (n)
Andersen (1991) Broad and strong n3 from
overlapping vibrations with
normal n2/n4 modes
A2u 354
2Eu 311, 227
Aragonite – split double peaks
due to calcium carbonate
intermolecular forces splitting the
degeneracy
Valerite – split double peaks due
to calcium carbonate

Appendix 2: IR
204
intermolecular forces splitting the
degeneracy
Yue et al (2001) Calcite 312, 228, 106
980227c 315, 280, 108
980602 378, 301, 289, 230, 185,
162, 115
980622 380, 324, 304, 229, 185,
162, 112
Andersen (1991) A 312, 229,106
Andersen (1991)
Socrates (1994)
B 360, 335, 182, 106
Donoghue et al
(1971)
C 342, 309, 229, 109
Socrates (1994) D 388, 310, 176, 106, 86
Adams et al (1980) E 303, 297, 223, 102, 92
Guiton (1990) Pourous silica gels (Si-O-Si) Shifts of up to 40cm-1
towards lower frequency
Bulk Vitreous Silica (Si-O-Si) 1100
* first is often broad and intense, second is often narrower and weaker and has multiple bands
associated with it useful as a fingerprinting tool
b; broad, s;small, st; strong, n; narrow
Table 2. 1: Wavelengths of species associated with investigated toothpaste ingredients: Near IR
Reference Species Wavelength
(cm-1
)
Jesionowski and
Krysztafkievicz (2000)
Surface silanol groups 7326

Appendix 2: IR
205
Table 2. 2: Wavelengths of species associated with investigated toothpaste ingredients : Raman
Reference Species Wavelength
(cm-1
)
Yue et al
(2001)
Calcite
One A1g molecular vibration – 2carbonate ions
vibrating in the same phase
1088
4 pairs of Eg double degenerate – 2 carbonate ions with
E0 symmetry of the free carbonate ion
714, 1432
Eg lattice vibration modes – Libration motion of calcite 156
Eg lattice vibration modes – translational motion of
calcite
283
Adams. D. M.; Williams. A. D. J., (1980) Chem. Soc. Dalton Trans 8, 1482.
Andersen, F.A.; Brecevic, Ljerka. (1991), Acta Chemica Science, 45, 1018.
Boyd, I.W., (1987) Deconvolution of the infrared absorption peak of the vibrational stretching
mode of silicon dioxide: Evidence for structural order? Applied Physics Letters, 51 (6)
418-420
Donoghue, M.; Hepburn, P.H.; Ross, S.D. (1971) Spectrochim. Acta, Part A, 27, 1065.
Grdadolnik. J., Hadz. D., (1998) FT infrared and Raman investigation of saccharide-
phosphatidylcholine interactions using novel structure probes. Spectrochimica Acta Part A,
54, 1989–2000
Appendix 2: IR
206
Proença. L., Lopes. M. I, S., Fonseca. I., Hahn. F., Lamy. C. (1998) An in situ IR reflectance
spectroscopic study of the electro-oxidation of D-sorbitol on platinum. Electrochimica
Acta., 44, 1423-1430
Seo, Y.H., Lee, H.-J, Jeon, H.I., Oh,. Photonluminescence, Raman scattering, and infrared
absorption studies of porous silicon.
Socrates. G., (1994) Infrared Characteristic Group Frequencies, John Wiley & Sons, New York
Yue. L., Shui. M., and Xu, Z., (2001) THE INFRA-RED AND RAMAN SPECTRA OF
ULTRA-FINE CALCITE, SPECTROSCOPY LETTERS, 34(6), 793–802

Appendix 3: Micromanipulation
207
APPENDIX 3: OPERATIONAL PROCEDURE FOR
MICROMANIPULATION RIG
1) Switch on all the power plugged in the sockets.
2) Switch on the power of transducer power box, motor power box and PC.
3) Open the files on PC for data acquisition and motor-driven operation.
For data acquisition: from Start – program –professorDAQ- first application;
For motor driven operation: Desktop- prior or program- accessories-
Hypeteminal-prior
4) After weighing the sample which has been put on the surface beforehand, the sample
is put on the stage. Adjust the probe to the upfront of the surface by using the auto-
handle or knob of micromanipulator. Fine-turning the knob to adjust the gap between
the probe tip and substrate to the required dimension, this gap is monitored by the
side-view microscope.
5) The measurement can be started now after the above-mentioned procedures have been
done.
On the interface of prior program, type:D,100(or 200 or 500 or 1000 depending on the
size or length of the substrate);on the data-acquisition interface, click the
professoeDAQ (on top ) and click run, the collection of date starts. After this, go to the
interface of prior, press Return, the motor starts movement. Please note: the data-
acquisition is always first activated before the motor is set to move.
The speed of probe can be adjusted by preset a command in prior. The command of
speed is smz, when you want to check what the current speed, type „smz‟ return, a line
of reply will appear, such as 10mz, it means the speed is 10, the digital number
correspond to a real speed. If you want to change speed, e.g. from current 10 change to
5, just type „smz,5‟, a line of 5mz will appear.
A series of calibration of digital number and real speed are shown below:
Digital speed real speed (mm/s)
1 0.125
2 0.227
5 0.59
10 1.11
20 1.82
30 2.22
40 2.3
50 2.5

Appendix 3: Micromanipulation
208
6) When the probe stops, the measurement is completed, save the file in
your folder on D drive.
7) Clean the probe very gently with tissue (dry or wet) if some sample is stick to the
probe, if too sticky, the tip of probe may need to sock in water in a small petri-disk to
let the sticky sample to be dissolved.
8) As the transducer is generally fragile and very expensive, much attention has to be
paid not to touch the probe with strong force (sometimes not deliberately) or object.
9) When you finish the measurement, switch off the power box of the transducer- motor
box- PC and unplugged all the cables from the sockets.
Note: there are some setting parameters in the data acquisition and motor-driven program,
so please not casually change any parameters without consulting with me. Please also
contact me first when you come across some unknown problems during your experiment.
Micromanipulation Calculation
W = work done (J)
d = distance (m)
te = time end
ts = time start
F = force (of removal)
t = time
Force (N) = area under curve * calibration factor
Area under curve =
Integral (N s) = Force (N) * time (s)
Work (N m or J) =
Pulling Strength (J m-2
) =

Appendix 3: Micromanipulation
209
Calibration Factor
kg m s-2
Mass
(g) force (N)
Output
(mV)
Output
(V)
1.27 0.012455 2.634527
0 0 1.648738 0.001649
0.5 0.004905 2.345296 0.002345
1 0.00981 2.49693 0.002497
1.5 0.014715 2.869401 0.002869
2 0.01962 3.202072 0.003202
2.5 0.024525 3.651618 0.003652
3 0.02943 4.145038 0.004145
3.5 0.034335 4.683592 0.004684
4 0.03924 4.869215 0.004869
4.5 0.044145 5.086426 0.005086
5 0.04905 5.958046 0.005958
5.5 0.053955 6.187921 0.006188
6 0.05886 6.484017 0.006484
6.5 0.063765 7.666244 0.007666
7 0.06867 8.035806 0.008036
7.5 0.073575 8.592508 0.008593
8 0.07848 9.016268 0.009016
8.5 0.083385 9.016268
Force (kg m s-2
) = x 9.81 m s-2
Calibration Factor = 10.81 when units are kg, N, V
Worked Example (11aug 10-7)

Appendix 3: Micromanipulation
210
1. Get a zero baseline. Output from micromanipulation equipment in blue column in mV
[Column F]
2. Average of Micromanipulation Outputs [Column G]
3. Note time points when experiment starts and end (in this example time start = 1.08 s, time
end = 25.16 s, initial output in cell G193, final output in cell G2528
4. Perform calculations (formulas shown in spreadsheet)

Appendix 4: Experimental protocol Coupon Rig
211
APPENDIX 4: EXPERIMENTAL PROTOCOL COUPON RIG
Experimental protocol – Coupon Rig
Heat water in heat exchanger to appropriate temperature.
Fill water tank with D.I water (if water does not cover the sensor for the pump,
inverter read out will be E.S. and the pump will not run).
Apply a layer of toothpaste to the coupon (0.80 g for the circular coupons, 1.30 g ±
0.06 g for the square coupons, 1.5 – 2.5 mm thick, 2.3 g on the large square
surfaces).
Secure in place in the flow cell (silicon glue layer on base of circular coupon, high
vacuum grease on rim of square coupons, in appropriate base for different surface
types).
Apply a layer of heat sink compound on the copper disk.
Fill and surround cooling block with ice bath.
Position coupon secured in horizontal duct above the heat flux sensor unit. and
lower clamps so that the coupon sits on the heat flux sensor.
Check conductivity meter is on (lit-up display can be visualised by mirror)
Set-up camera to take photos from above the coupon (Canon EOS 30D camera,
manually focussed, no flash, time intervals set with timer unit, typically 5 – 30 s,
depending on experiment duration)
Turn pump power on, set desired frequency on inverter unit (Frequency
corresponds to flow rate achievable)
Open labview software
Start software, note time.
Start camera, note time.
Adjust manual valves as appropriate, the toothpaste experiments are run from the
water tank, through the test section, and recirculation back to the water tank.
Start pump promptly after setting valves to ensure no back flow, note time. (It may
be necessary to lift the end of the duct after the coupon with clamps to allow air in
the system to escape, if possible lift heat flux sensor to remain in contact with the
coupon, note set-up duration).

Appendix 5: Hazop Pipe Rig
212
APPENDIX 5: PIPE RIG HAZOP
HAZOP STUDY
Deviatio
n Causes Consequences Safeguards Recommendations Responsibility
1.1 No Flow
Headset valve open air shock to ceiling Procedure CHECK STEP PC
pump valve open contaminate pump Procedure
designated route valves not
open pressure build regulated presure flow
pressure relief valve
block and bleed system so
can bleed off pressure
1.2 Reverse Flow
Part of the system no left open
to atmosphere and then all of
the system opened possible overspill
procedure - always shut
heatset valve before opening
line CHECK STEP
end of day open all valves to
atmospere so depressurised Procedure PC
sequence: open headset
valve; open remaining
valves in reverse order
1.3 More flow
regulator faulty excessive amount of discharge
pressure gauge reading (below
2bar)
pressure relief valve (3.5bar)
1.4 More Level
n/a
1.5 Less Level
n/a
1.6 More Presure
as per flow
regulator faulty excessive amount of discharge
pressure gauge reading (below
2bar)
pressure relief valve (3.5bar)
1.7 Less Pressure
n/a leak,
headset valve open shut valve -procedure
pressure relief valve faulty change and maintenance
line not sealed turn off air, tighten
1.8 More Temperature
n/a
1.9 Less Temperature
n/a
1.1 More Mixing
n/a
1.11 Less Mixing
n/a
1.12 More Reaction
n/a
1.13 Less Reaction
n/a
1.14 Composition change
n/a
1.15 Contamination
n/a
1.16 Relief
Plant: Fouling sequence: ppv to line to IBC
Drawing:
Design Conditions/Parameters:

Appendix 5: Hazop Pipe Rig
213
HAZOP STUDY
Deviatio
n Causes Consequences Safeguards Recommendations Responsibility
1.1 No Flow
valve closed procedure
heating off - closed tank pump cavitates turn of pump, turn on water
heating on, closed tank rapid heat up of pipe work
H/E mounted and labelled
- HOT SURFACE PC
DO NOT touch in the
event of no flow
valve outlet to pump pump cavitates, no flow
valve outlet from pump deadend line
valve outlet open to ppv
if at atmosphere: fill with water;
contamination; overflow on top check water level of tank procedural: valves
not at atmosphere n/a
H/E CHECK INTERNAL TRIPS
1.2 Reverse Flow
tank under pressure and water
shoots back to tank/rig
cold water wet
hot water scaulding
2 people in area on
fouling/cleaning switch over
until operation running
if change pump direction damage pump seal on button - CAP
invertor left high
H/E overflow to drain CHECK INTERNAL TRIPS
hot overflow scaulding
keep 3/4 full as the maximum
working level to provide time
Use Temp probe which
only sits towards top of
tank, and monitor
pump starts to cavitate
rapid heat or pipes
damage to pumps
H/E not being pumped in, auto top-up
fllow level trip
1.6 More Presure
dissipates when stop pumping
and pump will slip
pump doesn't allow
overpressure
1.7 Less Pressure
n/a
fan breaks down overheating CHECK INTERNAL TRIPS
1.1 More Mixing
1.11 Less Mixing
1.12 More Reaction
1.13 Less Reaction
1.14 Composition change
1.15 Contamination
Plant: Cleaning
Drawing:
Design Conditions/Parameters:

Appendix 5: Hazop Pipe Rig
214
Risks and Controls
Operator trained to prevent pressure build up
Pressure regular and pressure relieve valves positioned
on/after PPV
Tripping or Slipping Obvious Hazards, caution to be taken
Leak check undertaken using cold water prior to hot water
use
Caution to be taken
Temperature controlled by operators and so awareness of
problem
Caution to be taken
Operator to inform people in the area of work and get them
to check in
Operator to not work in area alone
Lone worker alarm to be used in event of lone working
Moving Objects Operator to avoid working near heat exchanger unit during
operation, exclusion zone of 0.5m2
Machine surface to remain free from objects and tools
electrical check wires periodically
Pressurised Plant
Hot Liquids
Hot Surfaces
Lone Working

Appendix 6: Pipe Rig SOP
215
APPENDIX 6: PIPE RIG SOP
Fouling
Open valves 5; 6; 7; 8
Close valves 3 & 9
Close valve 4
*Ensure valve sequence correct to ensure that overpressure doesn‟t occur
Slowly turn on air; ensuring pressure not greater than 2bar.
Fill pipeline until paste present in waste pipe
Stop air supply
Close valve 5
Open 4 slowly to vent ppv
Cleaning preparation Procedure (unheated)
*can go straight from tank to pump avoiding heat exchanger especially at low flow rates to
eliminate air entrapment
Fit water heater to water supply
* at start of day, run cold water through system to check for and alleviate leaks
Fill water tank (3/4) with water either hot or cold
Stop water fill
Turn on pump inverter
Set inverter to designated frequency dependant on required speed (exceptionally use
v7 to limit flow further at low flow rates)
Turn on datalogger
connect computer; begin datalogging
Cleaning preparation (heated)
as for unheated
turn on heat exchanger

Appendix 6: Pipe Rig SOP
216
fill h/e with water
*ensure good connections with ambient water run
set temperature for heating (possibly above desired to allow for greater heat transfer
Recirculate water through tank
open 1, 10
close 2
When temperature of process water reaches desired temp, clean through rig system
Clean through rig system, purge out paste to IBC
Ensure closed 5, 9
Ensure open 6, 7, 8
open 2 and close 10
when bulk paste removed switch to drain/recirculate
Open 9 to drain/recirculation and close 8
*monitor water level of water tank add more as required
Clean through rig system, film cleaning – drain or recirculation
ensure 5, 10 and 8 closed
ensure 1, 2, 3, 4, 6, 7, 9 open
monitor water level of water tank add more water as required, if necessary, pause
experiment and heat more water
Halting Experiment
turn off heat exchanger
turn off invertor,
close valve 1
allow system to drain if desired
stop data logger

Appendix 7: Pilot Plant SOP
217
APPENDIX 7: PILOT PLANT SOP
1) STARTING UP PROCEDURE
a) THE PILOT PLANT
Turn the power on at the mains and on the control panel (all valves should be
green)
Turn the compressed air power supply on and open the valve
Switch on the pump
Check that the main water valve is open to TK 21
b) THE LAPTOP
Turn on (no password)
Connect to the control panel USB and Ethernet
Open OPUS (password ZEAL)
Open MATLAB 2007b
c) USING ADDITIONAL INSTRUMENTATION (IR, TURNIDITY etc...)
Ensure instrument is in place in the line
Switch on instrument at the mains and ensure the instrument is reading
For MID IR liquid nitrogen is required from the chemistry department
2) FOULING THE TEST PIECE USING THE FOULING LOOP
Place the steel pipe connecting to the test piece via the pump into the product
Move the manual valves to the correct position
Plane the plastic overflow pipe into an empty bucket
In Matlab type soil(5) and press enter; type soil(0) and be ready to press enter
to stop the pumping (pumping does not have to be 5%)
Move the manual valves to ensure the cleaning loop is established for the
experiment
3) CARRYING OUT THE EXPERIMENT
If doing a heated experiment open the steam valve a small amount initially (5-10°).
Continue to open up to 45° as you do more experiments.
If doing a chemical clean you need to connect the dosing kit hose to the line going
into the correct tank. Manually input the amount of chemical to dose. Then
disconnect the hose from the line.
Go to the directory C\Matlab files\zeal_pilot
Type run_zeal
Click Run Experiment

Appendix 7: Pilot Plant SOP
218
Select the route number (determined from looking at the route skids), temperature,
and flow rate (m3h
-1)
When you are happy the set up is correct, click start experiment
Depending on the flowrate, there is a set volume of water that can be used from
each tank determined by visual timing (table 1), when the time is up click the
STOP button and yes in the experiment window
If required, fill tk23 and run experiment again, however REMEMBER TO SAVE
THE DATA FIRST (SEE SECTION 4))
After the experiment you have to drain the line into a bucket from the sample point
Take swabs by opening the tri clamp at one end of the test piece
Table 3. 3: Velocity comparisons at different diameters for Zeal Pilot Plant.
Velocity (m s-1
) 0.5 1 1.5 2.0 2.9
Flow-rate (m3 h
-1)
(47.7 mm diameter)
N/A 6.5 9.7 12.6 20
Flow-rate (m3 h
-1)
(73.2 mm diameter)
7.6 15.2 Not achievable Not
achievable
Not
achievable
Flow-rate (m3 h
-1)
(101.6 mm diameter)
15 Not achievable Not achievable Not
achievable
Not
achievable
4) SAVING THE DATA AND DATA EXTRACTION
After each experimental run
For the turbidity measuring in FTU, remove the front panel and connect to the
laptop using the provided cable
5) SHUTTING DOWN PROCEDURE
IN AN EMERGENCY HIT THE RED BUTTON ON THE CONTROL
PANEL
Close the steam valve (if used)
Close the main eater valve to tk21
Close Matlab and OPUS
Turn off control panel, mains to pilot plant and instruments, and air supply
Disconnect laptop from USB and Ethernet connections
Note: If carrying out an experiment the following day it is useful to fill tk23
Note: If the pilot plant is not in use for some days empty the tanks
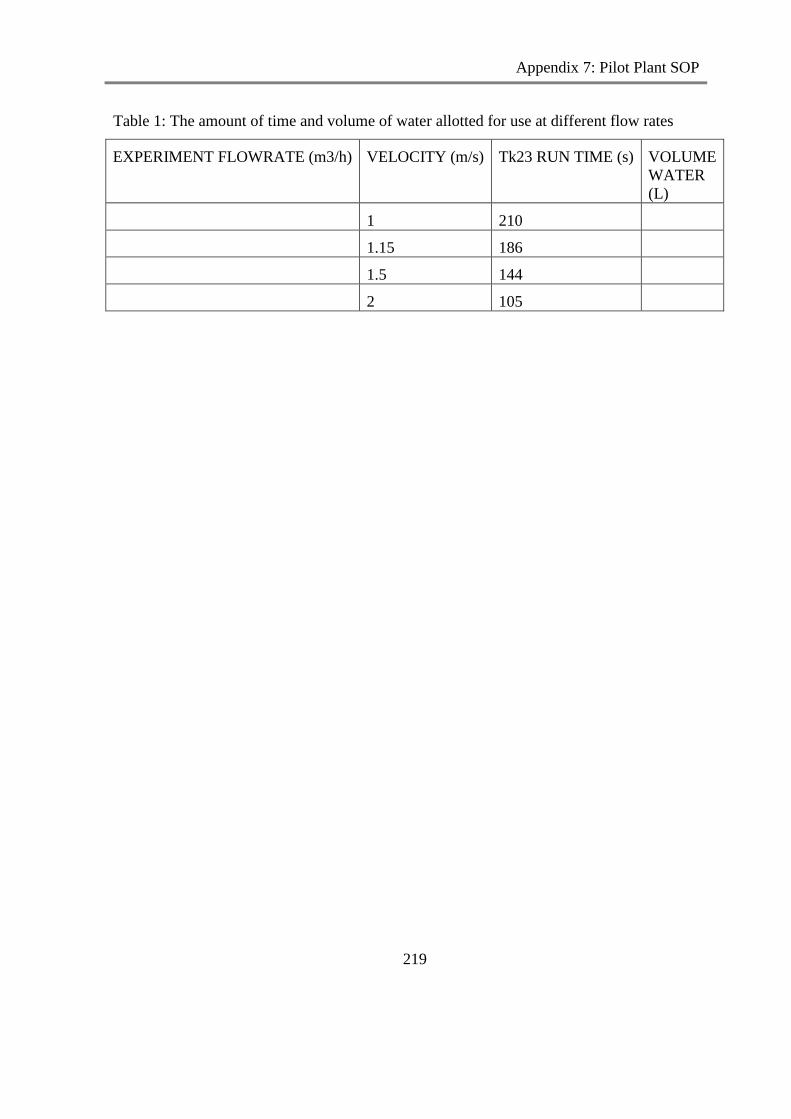
Appendix 7: Pilot Plant SOP
219
Table 1: The amount of time and volume of water allotted for use at different flow rates
EXPERIMENT FLOWRATE (m3/h) VELOCITY (m/s) Tk23 RUN TIME (s) VOLUME
WATER
(L)
1 210
1.15 186
1.5 144
2 105

Appendix 8: Pilot Plant Routes
220
APPENDIX 8: PILOT PLANT ROUTES
Straight to drain
Cleaning (ambient)
Route 2 – tank 21 to test piece to drain
Cleaning (hot)
Route 4a – transfer water from tank 23 to tank 21
Route 4b – heat water avoiding test section
Route 4c – hot water round test section to drain
Route 8a – transfer of water from tank 23 to tank 22
Route 4b – heat water avoiding test section
Route 22drain – hot water round test section to drain
Two-tank cleaning
Fill both tanks 21 and 22, run route 4c, and switch to the end tank (tank 22) before the tank
empties using the „Switch to 22‟ button on the Matlab display
Recirculation
Heat tanks as above, ensure the pipe-work is filled with water, ideally by running a straight-
to-drain route so that the pump doesn‟t cavitate
Route 5a – recirculate from tank 23
Recirculation by measurement, run straight to drain route for designated time or water
volume. Then recirculate until turbidity reaches 500 FTU, or until the reading stabilises, then
continue with straight-to-drain, recirculate routes until clean.