Clean Vehicles Consortium Project Fact · PDF fileCVC Project Fact Sheets Page 1 November...
74
CVC Project Fact Sheets Page 1 November 2014 U.S.-China Clean Energy Research Center CVC Projects: Characterization of Degradation Mechanisms in Li-Ion Batteries........................................................... 3 In-Situ Neutron Depth Profiling of Lithium Ion Battery Materials for Improved Electrochemical Performance and Aging Models .......................................................................................................................... 6 Li-Ion Battery Aging and Internal Degradation Mechanisms ................................................................. 9 Manufacturing of Pouch Cells for Battery Degradation Studies ........................................................... 12 Advanced Battery Chemistries ........................................................................................................ 15 Fundamental Understanding of Li-Air Reaction Mechanisms .............................................................. 17 Fundamental Autoignition Chemistry of Advanced Biofuels ................................................................ 20 Chemical and Physical Models for Novel Fuels .................................................................................. 22 Integrated Powertrain and Aftertreatment System Control for Clean Vehicles ...................................... 24 Energy Conversion ........................................................................................................................ 28 Efficient and High Power Density Electric Powertrain ........................................................................ 30 Rapid System Integration through Modular Configuration, Sizing and Control for Hybrid Vehicles ........... 32 Intelligent Fault Diagnosis and Prognosis......................................................................................... 34 Adaptive Battery Management System On and Off the Grid ............................................................... 37 Data-Based Techniques for Battery-Health Prediction ....................................................................... 39 Cost-Effective Lightweight Materials ............................................................................................... 41 Joining Multi-Material Structures – Vaporizing Foil Actuator Approach ............................................... 43 Electrically assisted friction stir welding for joining dissimilar materials ............................................... 45 Multi-Material Lightweight Body Subsystem and Vehicle Optimization................................................ 49 Hybrid Materials Interface Increased Strength Method and Modeling ................................................. 51 Vehicle–Grid System Modeling for Technology Deployment ............................................................... 53 Control Strategies for Vehicle-Grid Integration ................................................................................. 55 A Wireless Magnetic-Resonance Power Transmission System for EV Charging ...................................... 57 Clean Vehicles Consortium Project Fact Sheets
Transcript of Clean Vehicles Consortium Project Fact · PDF fileCVC Project Fact Sheets Page 1 November...

CVC Project Fact Sheets Page 1 November 2014
U.S.-China Clean Energy Research Center
CVC Projects:
Characterization of Degradation Mechanisms in Li-Ion Batteries ........................................................... 3
In-Situ Neutron Depth Profiling of Lithium Ion Battery Materials for Improved Electrochemical Performance
and Aging Models .......................................................................................................................... 6
Li-Ion Battery Aging and Internal Degradation Mechanisms ................................................................. 9
Manufacturing of Pouch Cells for Battery Degradation Studies ........................................................... 12
Advanced Battery Chemistries ........................................................................................................ 15
Fundamental Understanding of Li-Air Reaction Mechanisms .............................................................. 17
Fundamental Autoignition Chemistry of Advanced Biofuels ................................................................ 20
Chemical and Physical Models for Novel Fuels .................................................................................. 22
Integrated Powertrain and Aftertreatment System Control for Clean Vehicles ...................................... 24
Energy Conversion ........................................................................................................................ 28
Efficient and High Power Density Electric Powertrain ........................................................................ 30
Rapid System Integration through Modular Configuration, Sizing and Control for Hybrid Vehicles ........... 32
Intelligent Fault Diagnosis and Prognosis ......................................................................................... 34
Adaptive Battery Management System On and Off the Grid ............................................................... 37
Data-Based Techniques for Battery-Health Prediction ....................................................................... 39
Cost-Effective Lightweight Materials ............................................................................................... 41
Joining Multi-Material Structures – Vaporizing Foil Actuator Approach ............................................... 43
Electrically assisted friction stir welding for joining dissimilar materials ............................................... 45
Multi-Material Lightweight Body Subsystem and Vehicle Optimization ................................................ 49
Hybrid Materials Interface Increased Strength Method and Modeling ................................................. 51
Vehicle–Grid System Modeling for Technology Deployment ............................................................... 53
Control Strategies for Vehicle-Grid Integration ................................................................................. 55
A Wireless Magnetic-Resonance Power Transmission System for EV Charging ...................................... 57
Clean Vehicles Consortium Project Fact Sheets

CVC Project Fact Sheets Page 2 November 2014
Life Cycle Assessment of Wireless Charging of Electric Vehicles ........................................................... 60
Fuel Mix Strategies and Constraints ................................................................................................ 62
Fleet Modeling on China’s Electric Vehicle Development .................................................................... 65
Energy Systems Analysis, Technology Roadmaps and Policy ............................................................... 67
Evaluating the Significance of Allocation Methods on Interpretation of Lightweighting Results .............. 71
Improving Precision of Electricity Grid Modeling for Electrified Vehicle Sustainability Assessments .......... 73

CVC Project Fact Sheets Page 3 November 2014
Characterization of Degradation Mechanisms in
Li-Ion Batteries Joint Project
Research Objective
The project team aims to improve the robustness of current-generation lithium-ion batteries via detailed characterization of degradation and aging mechanisms. In addition, the project is formulating design principles based on the knowledge of degradation and aging mechanisms to improve battery cycle life.
Technical Approach
Generate aged cells by accelerated electro-thermal protocols that are representative of actual driving conditions for electric vehicles (EVs), hybrid EVs (HEVs), and plug-in HEVs
Conduct multi-scale ex situ analysis of the anodes and cathodes harvested from unaged and aged cells for changes in physical and morphological structures, surface deposits, micro structures, phase fraction, active lithium concentration, etc.
Perform electrical and electrochemical characterization at nanoscale using an atomic force microscope (AFM)
Apply the aging mechanism data to calibrate and evaluate the microscale models for battery performance
Significant Results
Previously acquired commercial cells from A123 (LiFePO4, 20Ah, prismatic) have been successfully aged in battery cyclers. A refined electron energy loss spectroscopy (EELS) methodology has been developed for identifying light elements (lithium, in this case) that involves special sample preparation techniques as well as minimization of beam-induced damage in the transmission electron microscope during analysis.
Figure 1. EELS spectra obtained from a region within a LiFePO4
nanoparticle powder (STEM-HAADF image in inset) obtained from a
battery cathode, sprinkled on a lacey support film TEM grid. The
lack of beam damage over several exposures is demonstrated.
U.S. Research Team Lead D.W. McComb, The Ohio State University
Bharat Bhushan, The Ohio State University
Marcello Canova, The Ohio State University
Raymond Cao, The Ohio State University
Terry Conlisk, The Ohio State University
U.S. Partners The Ohio State University
Argonne National Laboratory
University of Michigan
Sandia National Laboratories
Oak Ridge National Laboratory
China Research Team Lead Feiyu Kang, Tsinghua University
Xiangming He, Tsinghua University
Borong Wu, Beijing Institute of Technology
Daobin Mu, Beijing Institute of Technology
China Partners Tsinghua University
Beijing Institute of Technology
Clean Vehicles Consortium Project 1.1.1

CVC Project Fact Sheets Page 4 November 2014
Two sample preparation techniques have been used. In the first type, cathode material (powder) is extracted using a razor blade and subsequently ground in a pestle and mortar to obtain a fine powder with electron transparent regions. This powder is sprinkled on a lacey film support transmission electron microscopy grid for EELS analysis. This is a fast method for determination of phases forming in the cathode but lacks information on spatial correlation between nanoparticles in the cathode. Figure 1 shows a scanning transmission electron microscopy – high angle annular dark field detector (STEM-HAADF) image of the cathode nanoparticles sprinkled on a grid as an inset to several low-loss EELS spectra acquired from within a nanoparticle over several exposures lasting for five seconds each. The lithium–K edge is clearly visible (marked) after four exposures, demonstrating a lack of beam damage either during specimen preparation or EELS analysis.
In the second technique, electron transparent thin foils are created in a focused ion beam instrument using a procedure with modified parameters of the ion beam voltage, ion beam current, and ion beam milling angle on the
specimen surface [1]. The parameters are designed to minimize knock-on damage to the lithium during ion beam milling. This technique retains spatial correlation between various nanoparticles in the original cathode. Figure 2 shows EELS spectra taken from several areas of the FIB foil extracted from a cathode (blue box region). The spectra show variation in the shape of the Li-K edge across the sample. At this point, variations in the edge structure are purely qualitative, and attempts to quantify them are being pursued. Such spectra can be acquired from regions as small as 20 nm, allowing phase determination at the nanoparticle level.
The team has developed and utilized the in situ AFM technique for studying the aging mechanism in the LiFePO4 cathode [2]. The project team has developed an in situ AFM cell that is easy to assemble in a glove box. In the in-situ AFM cell design, special attention was paid to limit the electrolyte evaporation during in situ experiments. The in situ AFM cell performed on par with a
Figure 2. EELS spectra obtained from several regions within the blue box marked in the
STEM-HAADF image on the right.
Figure 3. (a) In-situ LiFePO4 cycling data. (b) AFM images at the
start and after 6 h of discharge.

CVC Project Fact Sheets Page 5 November 2014
commercial Li-ion battery at C rates below C/10. Diffusion limitations (i.e., distance between working and counter electrodes is around 2.5 mm) and a non-ideal counter electrode (CE) to working electrode (WE) surface area ratio (i.e., CE is ring shaped to accommodate AFM probe) dictates in situ experiments to be performed at C/10 rate or below. In situ AFM experiments conducted on the LiFePO4 cathode revealed that particle size changes during discharge showed a wide distribution, indicating the inhomogeneous nature of the cathode surface; see Figures 3 and 4.
Future Plans
The team will continue refining the EELS methodology, particularly to quantify the lithium in the sample. Simultaneous recording of core loss and low-loss EELS at higher energy resolution will allow the study of fine structure variations, which will provide information on local bonding and oxidation state. The team will also continue utilizing the in situ AFM technique to understand aging phenomenon in the LiFePO4 cathode. The team started studying aging mechanism in the thin film samples, which are especially useful for fundamental understanding of the aging mechanism since they only include active material (i.e., LiFePO4), as compared to composite cathodes (i.e., LiFePO4 active material, carbon coating and binder); therefore, thin film samples allow studying of the aging mechanism of LiFePO4 active material in isolation.
Expected Outcomes
A refined EELS methodology for light element analysis in battery materials
In situ AFM capabilities for direct analysis of morphological changes and electrochemical performance of LiFePO4
A robust understanding of aging mechanisms in batteries as a function of aging protocols and cell design and shape
Parameters to quantify and relate evolution of microstructure in the cathode with the system-level aging metrics
References
[1] Gilchrist, J. B., Basey-Fisher, Toby. H., Chang, S. C'E., Scheltens, F., McComb, D. W. and Heutz, S. (2014), “Uncovering Buried Structure and Interfaces in Molecular Photovoltaics.” Adv. Funct. Mater., doi: 10.1002/adfm.201400345.
[2] Demirocak, D. E. and Bhushan, B. (2014), “In situ atomic force microscopy analysis of morphology and particle size changes in Lithium Iron Phosphate cathode during discharge.” J Colloid and Interface Sci., vol. 423, pp. 151-157.
Figure 4. (a) Deflection and segmented images of areas 1 and 2 given in Figure 4(b).
Four LiFePO4 particles were analyzed for surface area change, (b) percent increase in
particle surface area after 6 h of discharge at C/20 rate.
CVC Project Fact Sheets Page 6 November 2014
In-Situ Neutron Depth Profiling of Lithium Ion
Battery Materials for Improved Electrochemical
Performance and Aging Models
Cooperative Project (U.S.)
Research Objective
To establish a direct method to measure the lithium intercalation in the anode and cathode of commercial lithium-ion batteries
To establish a technique to conduct in situ measurement of the lithium concentration distribution in the anode and cathode of lithium-ion cells during cell utilization (discharging – charging)
To identify the effect of aging and shape factors on the lithium intercalation in anode and cathode through direct in situ measurements
To improve the accuracy of performance and aging models through better understanding of the relation between the degree of lithiation and state of charge, and the relation between diffusion kinetics and concentration in the liquid and solid phases in the cell
Technical Approach
Improve capabilities of ex situ and develop in situ methodology for the analysis of lithium-ion electrode materials at The Ohio State University’s (OSU’s) Research Reactor
Develop a lithium-ion coin cell that allows for in situ NDP measurements
Conduct in situ and ex situ NDP to quantify the lithium concentration in the surface region of electrodes and relate the findings to cell-level testing results (electrochemical impedance spectroscopy, cycling data, calorimetry)
Achieve a systematic design of an experiment to evaluate the lithium concentration profile in electrode samples harvested from new and aged cells, and relate the experimental results to cell usage data
Analyze experimental results from in situ and ex situ NDP of lithium-ion cell electrodes through electrochemical modeling that is inclusive of aging (e.g., SEI growth models)
Significant Results
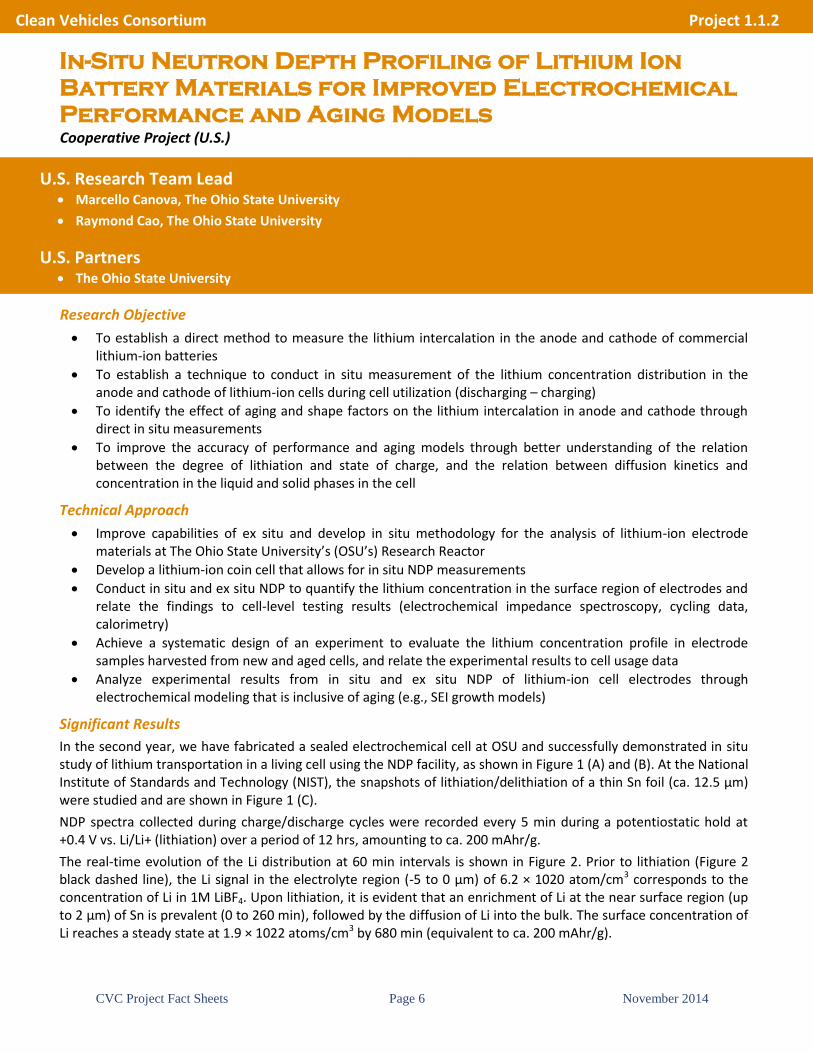
In the second year, we have fabricated a sealed electrochemical cell at OSU and successfully demonstrated in situ study of lithium transportation in a living cell using the NDP facility, as shown in Figure 1 (A) and (B). At the National Institute of Standards and Technology (NIST), the snapshots of lithiation/delithiation of a thin Sn foil (ca. 12.5 µm) were studied and are shown in Figure 1 (C).
NDP spectra collected during charge/discharge cycles were recorded every 5 min during a potentiostatic hold at +0.4 V vs. Li/Li+ (lithiation) over a period of 12 hrs, amounting to ca. 200 mAhr/g.
The real-time evolution of the Li distribution at 60 min intervals is shown in Figure 2. Prior to lithiation (Figure 2 black dashed line), the Li signal in the electrolyte region (-5 to 0 µm) of 6.2 × 10²⁰ atom/cm3 corresponds to the concentration of Li in 1M LiBF4. Upon lithiation, it is evident that an enrichment of Li at the near surface region (up to 2 µm) of Sn is prevalent (0 to 260 min), followed by the diffusion of Li into the bulk. The surface concentration of Li reaches a steady state at 1.9 × 10²² atoms/cm3 by 680 min (equivalent to ca. 200 mAhr/g).
U.S. Research Team Lead Marcello Canova, The Ohio State University
Raymond Cao, The Ohio State University
U.S. Partners The Ohio State University
Clean Vehicles Consortium Project 1.1.2

CVC Project Fact Sheets Page 7 November 2014
The experiment conducted also elucidated an interesting phenomenon occurring in the electrolyte region. Figure 2 shows an increase in the concentration of the electrolyte upon charge at relatively uniform increments with time. This increase can be attributed to increased concentration of Li salt due to solvent consumption during the formation of the SEI or due to a decrease in volume from the expansion of the electrodes. Another possible explanation is the preferential migration of 6Li towards the Sn during lithiation induced enrichment of 6Li. We exhibited the kinetics of Li reactions, intercalation, and transport by in situ NDP, providing information that is indispensable in the advancement of materials for energy storage.
This work is published at Angewandte Chemie (IF: 13) and was picked by the editors as a very important publication.
Figure 1. (A) A schematic representation of the battery components; (B) illustration of the NDP setup; and (C) a snapshot of the in
situ NDP spectra showing Li transport during charging/discharging a battery.

CVC Project Fact Sheets Page 8 November 2014
Future Plans
With the successful completion of the goal set in previous years, our future plan is to apply the developed technology to battery characterization of higher-rate and more commercialized products. To achieve this goal, we will continue to apply in situ NDP technology to lithium-ion battery studies to improve the understanding of lithium transport within electrodes and interface processes that occur during cycling behavior of new and aged batteries.
This diagnostic tool complements the multi-scale characterization studies that are being conducted at OSU to investigate the degradation mechanisms in lithium-ion battery materials due to cycle aging.
The unique ability of NDP to provide non-destructive and quantitative measures of lithium concentration in the surface region of electrodes will provide essential data for improved electrochemical performance and aging models. The aging models can then predict the life of the battery with a higher confidence level and can prove vital in diagnostic and prognostic applications for full-scale, production-level batteries.
Expected Outcomes
Demonstration of the in situ NDP capability for battery diagnostics
Definition of methods to combine the ex situ and in situ NDP experimental results with the design and calibration of system-level electrochemical models for lithium-ion battery performance prediction
Investigation of the growth of the SEI layer in lithium-ion cell anodes with NDP-based methods to provide dynamic information for modeling and simulation
Collaborations created with Chinese and industrial partners to develop applications of NDP-based measurement techniques
Figure 2. Lithium concentration profiles within a 12.5 m Sn foil as a
function of time (dashed) before electrochemical lithiation, (A) Lithiation
spectra plotted every 60 min interval from 20 min to 740 min at 0.4 V vs.
Li/Li+(reaching approx. 200 mAhr/g); (B) Delithiation spectra plotted
every 60 min interval from 10 min to 200 min delithiation at 1.0 V vs.
Li/Li+.

CVC Project Fact Sheets Page 9 November 2014
Li-Ion Battery Aging and Internal Degradation
Mechanisms
Joint Project
Research Objective
The objective of this project is to predict atomic-length-scale cathode degradation mechanisms (e.g., Mn[II] dissolution) from spinel LiMn2O4 oxides, a promising prototype material for cathodes in lithium-ion batteries. In addition, the project is investigating electrolyte decomposition on the oxide surface, possibly synergistic with LiMn2O4 degradation. A second objective is to apply similar methods to study the stability of electrolytes on lithium-air cathode surfaces. This work is synergistic with Don Siegel’s Clean Energy Research Center high-energy-density battery project.
Technical Approach
Use electronic structure density functional theory (DFT), including DFT with Hubbard augmentation of d-electrons (“DFT+U”) and hybrid DFT functionals
Use both geometry optimization and finite-temperature molecular dynamics calculations
Significant Results
The project team has recently published [1] its work on modeling initial electrolyte decomposition reactions of ethylene carbonate (EC) on the dominant [2] (111) surface of the LiMn2O4 (LMO) cathode. The methodology suggested by Karim et al. [3] was used to obtain the most stable LiMn2O4 bulk crystal and (111) surface structures. It was found that EC undergoes a two-step degradation reaction.
The first step (Figure 1[a]) is the rate determining proton abstraction from EC to the LMO (111) surface. A small second barrier after the transition state is primarily due to the rotation of the surface hydroxyl.
U.S. Research Team Lead Kevin Leung, Sandia National Laboratories
Don Siegel, University of Michigan
S. S. Babu, The Ohio State University
Marcello Canova, The Ohio State University
Raymond Cao, The Ohio State University
S. Nagpure, The Ohio State University
U.S. Partners Sandia National Laboratories
The Ohio State University
University of Michigan
Argonne National Laboratory
Oak Ridge National Laboratory
China Research Team Lead Xiangming He, Tsinghua University
Xinping Qiu, Tsinghua University
Borong Wu, Beijing Institute of Technology
China Partners Tsinghua University
Beijing Institute of Technology
Clean Vehicles Consortium Project 1.1.3
Figure 1. The two-step EC decomposition reaction pathway on
LMO (111) surface.

CVC Project Fact Sheets Page 10 November 2014
The second step (Figure 1[b]) involves ring opening of the proton abstracted EC, which turns out to have a smaller barrier. In both of these reactions, at least one electron is transferred from the EC molecule to the surface.
The project team also found that both of these reactions are strongly sensitive to the Li content, i.e. state of charge, of the electrode.
It is seen (Table 1) that the H-abstraction barrier decreases from +1.18 eV to +0.62 eV, which translates to a 109 fold increase in the reaction rate, ignoring entropic effects and assuming Arrhenius behavior of the reactions with typical molecular vibrational prefactor of 1012/sec at room temperature. Interestingly, this reaction is well within the typical charging/discharging rate of 1 C; i.e., about an hour. A similar Li-content dependence on the energy barrier is seen for the ring opening reaction. The fully discharged cathode has a barrierless ring opening of the H-abstracted EC. This barrier increases by a small amount to +0.35 eV when the cell reaches a higher charged state. Overall this is a much faster reaction than the H-abstraction with 106 reactions/sec. This shows that the H-abstraction barrier decreases whereas the EC’s ring opening barrier increases with decreasing Li content as the battery charges from a fully discharged state.
The products obtained after EC decomposition on LMO (111) surface are similar to that observed in an earlier work [4] on LMO (100) surface. On both surfaces, EC loses a proton followed by ring opening of the H-abstracted EC. However, the order of the reaction sequence is reversed on these two surfaces. As shown above, the (111) surface has a rate determining H-abstraction followed by EC ring opening. On the (100) surface, the first step of the reaction is the ring opening followed by an H-abstraction. The initial ring opening event is found to have a low (+0.48 eV) barrier on the (100) surface. However, the barriers for H-abstraction on both surfaces are similar (∼+0.6 eV).
Future Plans
The future plan is to model the LMO (111) surface covered with a layer of broken EC fragments and multilayer electrolytes, similar to the experimental situation. This will allow us to model Mn dissolution. In outlying years, the effect of defects and nickel substitution on spinel oxide surfaces will be examined.
Expected Outcomes
Understanding of the detailed, atomistic mechanisms of manganese dissolution from spinel LiMn2O4 surfaces and electrolyte decomposition is expected to yield insight that can better passivate such cathode oxide surfaces and prevent manganese dissolution, which is known to be a major reason for capacity fade in spinel oxide-based batteries
Ability to inform rational design of electrolyte additives or inorganic coatings that can prevent such degradation
Related insights that are particularly pertinent for nickel-doped high-voltage cathode materials that can more readily oxidize the electrolyte and cause further capacity fade in batteries
References
[1] N. Kumar, K. Leung, D. J. Siegel, “Crystal Surface and State of Charge Dependencies of Electrolyte Decomposition on LiMn2O4 Cathode.” J. Electrochem. Soc. 2014, 161, E3059–E3065.
[2] M.R. Huang, C. W. Lin, H. Y. Lu, “Chrystallographic faceting in solid-state reacted LiMn2O4 spinel powder,” Appl. Surf. Sci. 177, 103 (2001).
[3] A. Karim, S. Fosse, and K. Persson, “Surface structure and equilibrium particle shape of the LiMn2O4 spinel from first-principles calculations,” Phys. Rev. B 87, 075322 (2013).
Table 1. H-abstraction and the ring opening energy
barriers for varying Li content; i.e., state of charge of
the LMO (111) electrode. An estimate of the reaction
rate and the number of e- transferred from EC to the
LMO (111) slab is also reported.

CVC Project Fact Sheets Page 11 November 2014
[4] K. Leung, “First-Principals modeling of the Initial Stages of Organic Solvent Decomposition on LixMn2O4(100) Surfaces,” J. Phys. Chem. C 116, 9852 (2012).

CVC Project Fact Sheets Page 12 November 2014
Manufacturing of Pouch Cells for Battery
Degradation Studies
Joint Project
Research Objective
Understanding of the degradation mechanisms and the basic science required for the formulation of modeling tools to predict battery performance and cycle life is still largely insufficient. Establishing the relationship between system-level performance parameters and material degradation (micro to nano scale) is key to improve the Li-ion battery technology. Traditionally, coin cells are used to study the degradation mechanisms, which may not represent the actual behavior of large format batteries in building packs and modules for electric vehicles (EVs), and thus, are insufficient to diagnose degradation mechanisms.
The objective of this project is to demonstrate manufacturing of large format pouch cells (66x99x12 mm, 100 mAh-7 Ah) and deliver those cells to other partners for battery degradation study. Battery Manufacturing Facility (BMF) will manufacture and distribute large-size pouch cells to various CERC partners conducting degradation studies. BMF will also manufacture special cells with customized designs that can assist in characterization studies.
Technical Approach
BMF is a largest open-access battery assembly and research and development (R&D) facility in United States. It has a 1,400 ft2 dry room with humidity < 0.1% (~-56°C d.p.) that hosts state-of-the-art equipment for every step in cell assembly.
Followings are parameters of the lithium-ion batteries processed and assembled at BMF:
Standard Electrode Dimensions: o Cathode: 8.44 cm×5.60 cm o Anode: 8.64 cm×5.80 cm o 50–80 mAh per electrode with single-side coating
Current Collector: o Cathode: Aluminum (15 μm) o Anode: Copper (9 μm)
Capacity Range: 50 mAh to 7 Ah (typical 1.0 Ah)
Solid loading: o Cathode (NMC532): 7.0–16.0 mg/cm2 (typical 12.0 mg/cm2) o Anode: 4.0–9.4 mg/cm2 (typical 7.0 mg/cm2) o Electrode Balance: N/P=1.0–1.2
Uncalendered Electrode:
U.S. Research Team Lead Claus Daniel, Oak Ridge National Laboratory
Jianlin Li, Oak Ridge National Laboratory
David Wood III, Oak Ridge National Laboratory
Shrikant Nagpure, Oak Ridge National Laboratory
U.S. Partners Sandia National Laboratories
The Ohio State University
University of Michigan
Argonne National Laboratory
Oak Ridge National Laboratory
China Research Team Lead Xiangming He, Tsinghua University
Xinping Qiu, Tsinghua University
Borong Wu, Beijing Institute of Technology
China Partners Tsinghua University
Beijing Institute of Technology
Clean Vehicles Consortium Project 1.1.4
CVC Project Fact Sheets Page 13 November 2014
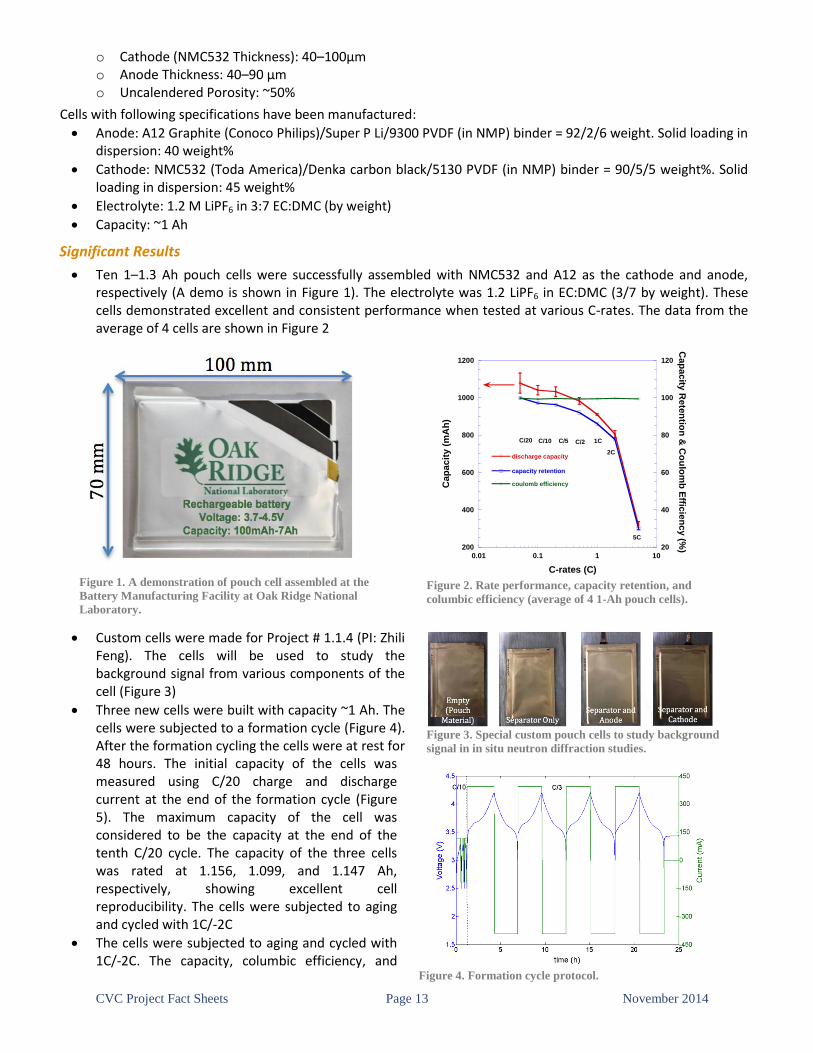
o Cathode (NMC532 Thickness): 40–100μm o Anode Thickness: 40–90 μm o Uncalendered Porosity: ~50%
Cells with following specifications have been manufactured:
Anode: A12 Graphite (Conoco Philips)/Super P Li/9300 PVDF (in NMP) binder = 92/2/6 weight. Solid loading in dispersion: 40 weight%
Cathode: NMC532 (Toda America)/Denka carbon black/5130 PVDF (in NMP) binder = 90/5/5 weight%. Solid loading in dispersion: 45 weight%
Electrolyte: 1.2 M LiPF6 in 3:7 EC:DMC (by weight)
Capacity: ~1 Ah
Significant Results
Ten 1–1.3 Ah pouch cells were successfully assembled with NMC532 and A12 as the cathode and anode, respectively (A demo is shown in Figure 1). The electrolyte was 1.2 LiPF6 in EC:DMC (3/7 by weight). These cells demonstrated excellent and consistent performance when tested at various C-rates. The data from the average of 4 cells are shown in Figure 2
Custom cells were made for Project # 1.1.4 (PI: Zhili Feng). The cells will be used to study the background signal from various components of the cell (Figure 3)
Three new cells were built with capacity ~1 Ah. The cells were subjected to a formation cycle (Figure 4). After the formation cycling the cells were at rest for 48 hours. The initial capacity of the cells was measured using C/20 charge and discharge current at the end of the formation cycle (Figure 5). The maximum capacity of the cell was considered to be the capacity at the end of the tenth C/20 cycle. The capacity of the three cells was rated at 1.156, 1.099, and 1.147 Ah, respectively, showing excellent cell reproducibility. The cells were subjected to aging and cycled with 1C/-2C
The cells were subjected to aging and cycled with 1C/-2C. The capacity, columbic efficiency, and
Figure 1. A demonstration of pouch cell assembled at the
Battery Manufacturing Facility at Oak Ridge National
Laboratory.
Figure 2. Rate performance, capacity retention, and
columbic efficiency (average of 4 1-Ah pouch cells).
200
400
600
800
1000
1200
20
40
60
80
100
120
0.01 0.1 1 10
discharge capacity
capacity retention
coulomb efficiencyCap
ac
ity (
mA
h)
C-rates (C)
Ca
pa
city
Rete
ntio
n &
Co
ulo
mb
Effic
ien
cy (%
)
C/20 C/10 C/5 C/2 1C
2C
5C
Figure 3. Special custom pouch cells to study background
signal in in situ neutron diffraction studies.
Figure 4. Formation cycle protocol.

CVC Project Fact Sheets Page 14 November 2014
capacity retention of these cells have been shown in Figure 6. Capacity retention was normalized to the maximum cell capacity. The capacity when discharged at 2C was around 87% of the maximum capacity, showing excellent power performance. It is noted that the electrodes were not calendered. The capacity fade over 100 cycles at 1C/-2C was around 8%, corresponding to 0.08% capacity fade per cycle
Future Plans
Manufacture, age cells, and characterize inhomogeneities and material degradation to understand the evolution of electrode structure during cycling using in situ neutron diffraction setup
A methodology to manufacture electrodes with areal solid loading gradient across the width will be developed to characterize the evolution of electrode structure in defective electrodes
Manufacture and assemble electrodes with aqueous processing to characterize material degradation in electrodes manufactured via non-traditional processing methods
Expected Outcomes
Considerably improve our understanding of degradation mechanisms in electrodes aged in large format cells under realistic conditions
Knowledge about components, their composition, and cell processing processes will enable CERC partners to better analyze and interpret the data
Improve the data collection and analysis capability of certain techniques by designing special cells
Flexibility in cell design will aid researchers in developing new experimental technique
Figure 5. Initial capacity of the cells.
Figure 6. Capacity, columbic efficiency, and capacity retention
of the cells while cycling with 1C/-2C rates.

CVC Project Fact Sheets Page 15 November 2014
Advanced Battery Chemistries Joint Project
Research Objective
This project aims to identify the primary mechanisms that limit the performance of rechargeable metal-air batteries, including high charging potentials, poor reversibility, and limited capacity/capacity fade. Revealing these mechanisms will enable the development of rational strategies for improving performance, with the ultimate goal of translating these batteries from the laboratory bench to commercial application in electric vehicles.
Technical Approach
Perform a combination of first-principles computational modeling of lithium-air and sodium-air battery materials in conjunction with parallel materials characterization experiments (at partner institutions)
Elucidate key morphological features of discharge phases in metal-air batteries
Calculate rates of charge and mass transport in metal-air discharge phases, and explore mechanisms for enhancing transport
More generally, uncover phenomena resulting in high charging potentials, poor reversibility, and limited capacity/capacity fade in lithium-air batteries
Significant Results
Thanks to their high theoretical specific energy density, rechargeable non-aqueous metal-air batteries are attracting increasing attention as a potentially transformative energy storage technology. In the absence of undesirable side reactions (e.g., degradation of the solvent or carbon support), a metal-air cell can be described by the reversible reaction xM + y/2 O2 ↔ MXOy. This chemistry is unlike conventional lithium-ion intercalation electrodes because the solid-phase discharge product, typically a metal-peroxide or superoxide (e.g., Li2O2 or NaO2), nucleates and grows on the cathode during discharge, and it subsequently decomposes during recharge.
In order to achieve a high energy density, the cathode of a metal-air cell should be substantially filled with discharge phase at the end of discharge. However, prior studies have suggested that charge transport limitations through an ostensibly insulating discharge phase may constrain the capacity and rate capability of these cells. Therefore, a question of both practical and fundamental importance to the metal-air system is the mechanism and efficiency of charge transport through the discharge product. Unfortunately, an accepted mechanism for charge transport in these cathodes has yet to emerge.
Our recent efforts have focused on understanding transport in the model Na-air system. The primary discharge product in Na-air batteries has been reported in some experiments to be sodium peroxide, Na2O2, while in others the formation of sodium superoxide, NaO2, is observed. Importantly, cells that discharge to NaO2 exhibit much lower charging overpotentials than those that discharge to Na2O2, suggesting a connection between round-trip efficiency and the composition of the discharge product. These differences could arise from a higher intrinsic conductivity of the superoxide phase; however, such an explanation remains speculative given that the charge transport properties of superoxides are relatively unexplored.
U.S. Research Team Lead Don Siegel, University of Michigan
Yang Shao-Horn and Gerd Ceder, Massachusetts
Institute of Technology
Khalil Amine, Argonne National Laboratory
U.S. Partners Argonne National Laboratory
University of Michigan
Massachusetts Institute of Technology
China Research Team Lead Feiyu Kang, Tsinghua University
Xiangming He, Tsinghua University
Borong Wu, Beijing Institute of Technology
Feng Wu, Beijing Institute of Technology
China Partners Tsinghua University
Beijing Institute of Technology
Clean Vehicles Consortium Project 1.2.1

CVC Project Fact Sheets Page 16 November 2014
In the present study, density functional and quasi particle GW methods are used to predict the intrinsic conductivity of Na-O2 discharge phases by calculating the concentration and mobility of charge carriers in bulk Na2O2 and NaO2. Both compounds are predicted to be wide band gap insulators, with band gaps of 6.65 (Na2O2) and 5.30 eV (NaO2). In the case of sodium peroxide, the calculated transport properties and charge carrying species (Figure 1)—small hole polarons and negative Na vacancies—are very similar to those reported previously for lithium peroxide. In contrast, NaO2 is predicted to exhibit larger electronic (103 higher) and ionic conductivities (107 higher), although the absolute value of the electronic component remains small overall. Surprisingly, electronic transport in NaO2 also occurs via hopping of hole polarons, resulting in a defect in which O2
1- dimers adopt an oxygen gas-like O2
0 state. Taken together, these data suggest that charge transport in bulk peroxides and superoxides is governed by the unusual ability of O2 dimers to access three distinct charge states: O2
2, O21-, and O2
0.
Future Plans
Examine stability of common electrolytes on NaO2 discharge phases
Characterize the properties and performance of other non-lithium-based metal-air chemistries
Expected Outcomes
Identification of mechanisms that most strongly impact the performance (rate capability, capacity, and efficiency) of metal-air batteries
Prediction of transport rates for cations and electrons/holes in the metal-air discharge phase
Prediction of optimal promoters to improve conductivity of discharge phases
Publications
M. D. Radin, J. F. Rodriguez, F. Tian, and D. J. Siegel, Lithium Peroxide Surfaces are Metallic, Lithium Oxide Surfaces are Not. Journal of the American Chemical Society, 134, 1093-1103 (2012)
(Invited Article in Special Issue: First Principles Computations) M. D. Radin, F. Tian, and D. J. Siegel, Electronic Structure of Li2O2 (0001) Surfaces. Journal of Materials Science 47, 7564 (2012). DOI: 10.1007/s10853-012-6552-6
T. J. Wallington, J. E. Anderson, D. J. Siegel, M. A. Tamor, S. A. Mueller. S. L. Winkler, and O.J. Nielsen, Sustainable Mobility, Future Fuels, and the Periodic Table, Journal of Chemical Education 90, 440 (2013). DOI:
10.1021/ed3004269
M. D. Radin and D. J. Siegel, Charge Transport in Lithium Peroxide: Relevance for Rechargeable Metal-Air Batteries, Energy & Environmental Science 6, 2370 (2013). DOI: 10.1039/C3EE41632A. Part of Themed Issue: “Post Li-ion Batteries”
Figure 1. Defect formation energy of O vacancies (red lines), Na vacancies (green lines), and electron polarons and hole polarons
(black lines) obtained using the HSEα (α = 0.48) hybrid functional in Na2O2 (left) and NaO2 (right). In Na2O2, dashed and solid lines
represent the two symmetry inequivalent oxygen and sodium sites.

CVC Project Fact Sheets Page 17 November 2014
Fundamental Understanding of Li-Air Reaction
Mechanisms
Joint Project
Research Objective
The objective of this project is to fundamentally understand reaction mechanisms in metal-oxygen batteries. This year, researchers focused on understanding reaction mechanisms in Li−O2 and Na-O2 cells, and possible effects on parasitic reactions that can be detrimental to battery performance. Using the first-principles computation, we gained new insights into the thermodynamics and kinetics of the formation of Na-O2 discharge products, which critically influence the battery performance metrics, such as theoretical energy densities, overpotentials, and rate capability. We also investigated species responsible for decomposition of discharge products in Li-O2 batteries with dimethylsulfoxide (DMSO)-based electrolytes and experimentally characterized decomposition products.
Technical Approach
Develop a computational method to correct the DFT errors in prediction of oxygen oxidation states by fitting calculated formation energies of various metal-oxides, -peroxides, and -superoxides to their experimental values
By applying the correction energies, predict the relative stability of sodium-oxygen compounds including Na2O, Na2O2, and NaO2, which are potential discharge products in sodium-oxygen batteries, as a function of temperature and oxygen partial pressure
In addition, compute the free energies of most probable surfaces and combine with the bulk energies to obtain the particle-size dependent phase diagram
Use x-ray diffraction (XRD), Raman, and Fourier-transform infrared (FTIR) spectroscopies to understand the effect of electrochemistry on discharge product chemistry and stability
Significant Results
Thermodynamic stability of sodium-oxygen compounds as a function of temperature, oxygen partial pressure, and particle size: The team used the first-principles computation to compute the formation free energies of sodium-oxygen compounds as a function of temperature, oxygen partial pressure, and particle size in order to investigate the formation conditions of each discharge product—i.e., Na2O2 and NaO2—in sodium-oxygen batteries. The results were published in Nano Letters.
This work has resulted in three major findings:
In bulk, within the range of temperature and oxygen partial pressure for the operation of sodium-oxygen batteries, Na2O2 is a thermodynamically stable phase so that Na2O2 is the only possible discharge product in sodium-oxygen batteries
U.S. Research Team Lead Yang Shao-Horn, Massachusetts Institute of
Technology
Gerbrand Ceder, Massachusetts Institute of
Technology
U.S. Partners Massachusetts Institute of Technology
Clean Vehicles Consortium Project 1.2.2
Figure 1. The predicted phase diagram of bulk
sodium-oxygen compounds as a function of
temperature and oxygen partial pressure.

CVC Project Fact Sheets Page 18 November 2014
However, when it comes to the nano-regime, where the nucleation takes place, the low surface energies of NaO2 lead NaO2 nanoparticles to be more stabilized than Na2O2
The critical parameter to control the formation of the desired discharge product that impacts the battery performance, in turn: When the oxygen partial pressure is high, NaO2 is not only thermodynamically stabilized, but also kinetically favored to nucleate. Therefore, it is critical to ensure high enough oxygen supply to promote the nucleation and growth of NaO2 as a discharge product
The formation free energies of bulk sodium-oxygen compounds were computed by combining the DFT ground state energies, phonon vibrational energies for temperature-dependent energies of solids, and experimental temperature-dependent energies of oxygen gas. The bulk phase diagram was constructed using the calculated formation free energies (Figure 1). At 300 K and 1 atm, the standard state, Na2O2 is stable and NaO2 cannot be formed under the operating conditions of sodium-oxygen batteries; e.g., T = 300 K and PO2 ≤ 1 atm.
Researchers proceeded to calculate the surface energies of Na2O2 and NaO2 as a function of oxygen chemical potential, indicating that the temperature and oxygen particle pressure-dependent environmental factors were taken into account. (Figure 2) While the lowest surface energies of Na2O2 are in range of 30−45 meV/Å2, the lowest surface energy of NaO2 is as low as 12 meV/Å2 within the stability window, respectively.
The calculated bulk formation energies and surface energies of sodium oxides were combined to construct a phase diagram as a function of particle size (Figure 3). Due to the lower surface energies of NaO2, NaO2 nanoparticles become more stable than Na2O2 at small particle size, for example, up to 6 nm at PO2 = 1 atm. Given that the structures of NaO2 and Na2O2 are distinct and the energy difference between NaO2 and Na2O2 is as small as 30 meV/Na at the bulk limit, the nucleated NaO2 nanoparticles may grow further to micron-size.
Chemical stability of Li-O2 discharge products as a function of time: We examined the chemical stability of DMSO as an electrolyte solvent for Li-O2 batteries in the presence of the Li2O2 discharge product. The time-dependent stability of chemical mixtures of commercially available Li2O2 in DMSO was also examined using a
variety of spectroscopic and structural techniques. The results were published in the Journal of Physical Chemistry Letters.
This work has resulted in two major findings:
We found that the expected Li2O2 discharge product is present immediately after discharge in a DMSO-based electrolyte, but decomposes upon prolonged contact with the electrolyte into LiOH (Figure 4), and that this process is accompanied by DMSO decomposition
Using XRD, mass spectrometry, and Raman and FTIR spectroscopies, the chemical reactivity of commercial KO2 and Li2O2 powders with DMSO was investigated, and showed that the instability of Li2O2 in contact with DMSO is greatly enhanced by the presence of superoxide anions in KO2, highlighting the unique role of superoxide species in acceleration parasitic reactions in Li-O2 cells
Figure 3. The predicted phase diagram of
sodium-oxygen nanoparticles as a function of
oxygen partial pressure and particle size.
Figure 4. XRD patterns showing evolution of
LiOH (red dashed lines) from Li2O2 in a carbon
nanotube (CNT) electrode discharged in 0.1 M
LiClO4 in DMSO after 0.5 and 380 h of aging in
electrolyte following the completion of
discharge. The gray asterisk denotes a peak
from the Al substrate.
Figure 2. Calculated surface energies of (a) Na2O2 and
(b) NaO2 as a function of oxygen chemical potential.
The stability window for Na2O2 and NaO2 is marked
by yellow boxes in (a) and (b), respectively.

CVC Project Fact Sheets Page 19 November 2014
Future Plans
Investigate the effect of Li+ and O2- ion solvation on redox potentials of intermediate species involved in the
Li-O2 reaction
In situ Raman and electrochemical quartz crystal microbalance (EQCM) experiments to directly investigate electrolyte solvent effects on Li2O2 growth mechanisms
X-ray absorption and emission measurements on Li2O2 in carbon-based and carbon-free lithium-oxygen battery cathodes
Expected Outcomes
Determination of factors affecting the contribution of LiO2 to the microstructure of electrochemically grown Li2O2
Optimized cathode materials for lithium-oxygen batteries with high activity toward oxygen reduction and evolution but minimal side reactivity with electrode/electrolyte components
Design principles for the development of nanostructured lithium-oxygen battery cathodes with high geometric power capabilities as well as high gravimetric and volumetric energy densities

CVC Project Fact Sheets Page 20 November 2014
Fundamental Autoignition Chemistry of Advanced
Biofuels
Cooperative Project (U.S.)
Research Objective
Broad and detailed characterization of the chemistry and physics related to autoignition is of particular importance to national goals of renewable fuel use, such as those described in the Renewable Fuel Standard. The Fundamental Autoignition Chemistry of Advanced Biofuels focus area of the U.S.–China Clean Energy Research Center (CERC) effort considers a component-centered approach toward elucidating combustion fundamentals vital to the understanding of autoignition for application to fuel-flexible engines. Fuel ignition at lower temperatures is governed strongly by a sequence of reactions initiated by fuel radicals (R) reacting with molecular oxygen: R + O2 ⇌ RO2. The alkylperoxy radical RO2 adduct can undergo isomerization to a hydroperoxyalkyl radical, QOOH, the class of molecules responsible for ignition-controlling chain branching at low temperatures (<~900 Kelvin [K]). Understanding the molecular structure dependence of R + O2 chemistry is key for predicting performance of novel fuels and is a central focus of this part of the CERC effort.
In the past year, research has concentrated on a terpenoid fuel, limonene, that can be efficiently produced by engineered microbial fermentation of sugars liberated from lignocellulosic biomass. Hydrogenation of limonene to the more stable and energy-dense limonane (4-iso-propyl-1-methylcyclohexane) also forms o-cymene, an ortho-substituted aromatic whose low-temperature autoignition chemistry exhibits an “ortho-effect,” a relatively increased propensity for low-temperature chain-branching in ortho-substituted aromatics. Due to significant interest in aromatic fuels, and the interest in characterizing the temperature dependence of the ortho-effect, the research team focused on o-cymene for fundamental oxidation studies, as a potentially important biofuel and as a means to study the fundamental chemistry of the ortho-effect (Figure 1).
Technical Approach
Use combined experimental and theoretical methods to determine fundamental reaction mechanisms for biofuel oxidation, especially autoignition processes that are critical for fuel-flexible, next-generation engines o Experimental:
limonene
(C10H16) hydrogenation limonane
(C10H20)
o-
cymene
(C10H14)
Figure 1. Oxidation chemistry of o-cymene, studied
both experimentally and computationally
simultaneously leads to important fundamental
characterization of a next-generation biofuel and the
ortho- effect.
U.S. Research Team Lead Craig A. Taatjes, Sandia National Laboratories
Blake A. Simmons, Joint BioEnergy Institute, Sandia
National Laboratories
Angela Violi, University of Michigan
Brandon Rotavera, Sandia National Laboratories
Mohamad Akbar Ali, University of Michigan
U.S. Partners Sandia National Laboratories
Joint BioEnergy Institute
University of Michigan
Clean Vehicles Consortium Project 2.1

CVC Project Fact Sheets Page 21 November 2014
Part I – Analyze high-resolution speciation of products from the first steps of laser-initiated oxidation of o-cymene; examine approximately 25 reaction classes for these two prototype molecules to constrain the definition of reaction mechanisms of the observed products
Part II – Measure of time-dependent OH and HO2 radical concentrations from pulsed laser-initiated oxidation, providing critical modeling targets for combustion mechanisms
o Theoretical: Conduct stationary point energy calculations to identify low-lying reaction pathways on R + O2 potential energy surfaces
Significant Results
The two important classes of bimolecular product channels following O2-addition to alkyl radicals (R) are OH- and HO2-elimination. As the HO2 radical is relatively unreactive, its formation is associated with chain termination, but the OH radical is a highly effective chain carrier and is a marker for the QOOH radical chemistry that drives low-temperature chain branching and autoignition. To probe these channels for the test fuels, the project team conducted a multiplexed mass spectrometry experiment utilizing photoionization of molecular beams. These experiments can quantify the isomeric coproducts of HO2 and OH in the R + O2 system and hence give detailed constraints on modeling of these reactions.
The oxidation of o-cymene was studied from 450 K to 750 K. Photolytically produced chlorine atoms abstract a hydrogen atom from the fuel molecule
to form the initial radical R, which then reacts with O2. Of particular interest was the influence of the ortho- configuration on the chain-propagation trend with temperature, compared to trends in m- and p-cymene. The results in Figure 2 indicate a higher yield of cyclic ether below 650 K in the oxidation of o-cymene due to facile QOOH formation and the presence of resonance-stabilized H-abstraction pathways.
Photoionization spectra (Figure 3), measured simultaneously, reflect a transition of the cyclic ether pathways initially stemming from reaction of both resonance-stabilized and non-resonance-stabilized o-cymenyl radicals at lower temperatures, to only non-resonance-stabilized radicals at higher temperatures.
Future Plans
Ongoing analysis of experimental results and theoretical calculations are focused on the following specific areas:
Short-term: OH/HO2 concentration time histories for o-cymene
Long-term: temperature-dependent ab initio rate coefficient calculations to support experimental observations of the transition from resonance- and non-resonance-stabilized ortho- radicals at lower temperatures, to only non-resonance-stabilized ortho- radicals at higher temperatures
Expected Outcomes
Identification of the feasibility of constraining reaction pathways
Rate coefficient calculations
Connection of fundamental results to CERC focus areas involving engine tests
450 500 550 600 650 700 750
0.0
0.2
0.4
0.6
0.8
1.0
o-cymene
m-cymene
p-cymene
Cycl
ic E
ther
/ C
on
jugat
e A
lken
e
Temperature (K)
Figure 2. Temperature-dependence of cyclic ether:
conjugate alkene ratios, which reflect OH:HO2
ratios, in cymene oxidation. Only o-cymene shows
significant cyclic ether formation below 650 K.
8.5 9.0 9.5 10.0
0
2
4
6
8
10 3-methyl-4-benzohydropyran 450 K 8 torr
2,2-dimethyl-3-benzohydrofuran
2-methyl-2-(2-methylphenyl)oxirane
m/z 148 (cyclic ether)
Ion
Sig
nal
(a.
u.)
Photon Energy (eV)
OO
O
8.5 9.0 9.5 10.0
0
2
4
6
8
10 3-methyl-4-benzohydropyran 700 K 8 torr
2,2-dimethyl-3-benzohydrofuran
2-methyl-2-(2-methylphenyl)oxirane
m/z 148 (cyclic ether)
Ion
Sig
nal
(a.
u.)
Photon Energy (eV)
OO
O
Figure 3. Photoionization spectra of products of
o-cymene oxidation at 8 Torr (450 K, above,
and 700 K, below) compared to reference
spectra of the most-favorable cyclic ether
products. The low-energy feature in the m/z 148
spectrum (red) disappears at 700 K due to the
absence of 2,2,-dimethyl-3-benzohydrofuran,
which arises only from reaction of resonance-
stabilized o-cymenyl radicals.
CVC Project Fact Sheets Page 22 November 2014
Chemical and Physical Models for Novel Fuels Cooperative Project (U.S.)
Research Objective
The aim of this project is to develop kinetic mechanisms to predict the combustion behavior of various renewable fuels that can be used to replace current fossil fuels. Using a series of atomistic simulations, the project team is investigating the major reaction pathways of new bio-derived fuels, such as farnesane and bisabolane. A detailed analysis is carried out to relate fuel formulation with combustion by-products and efficiency of combustion.
Technical Approach
Investigate systems of interest: methyl butanoate (MB), n-butylcyclohexane (n-BCH), 2,5-dimethylhexane, 2,6-dimethylheptane, and farnesane
Employ density functional theory to perform ab initio simulations of reactants, intermediates, and products present in various reaction pathways
Utilize Rice-Ramsperger-Kassel Marcus/master equation simulation solvers such as MultiWell to compute pressure- and temperature-dependent rate constants
Assemble the kinetic mechanisms and validate them with experimental data
Identify discrepancies between the kinetic model and experiments and refine the model
Significant Results
The main results of this project include developing the kinetic mechanisms, rate constants, and kinetic modeling of MB, n-BCH, 2,5-dimethylhexane, and 2,6-dimethylheptane.
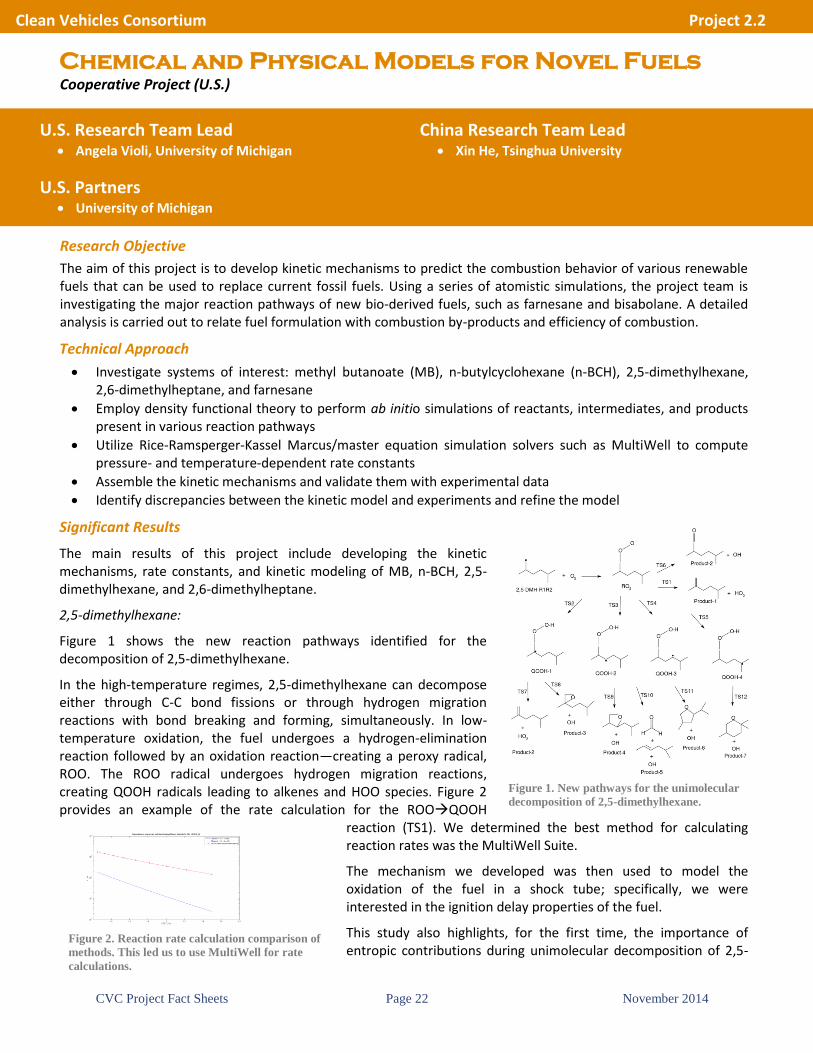
2,5-dimethylhexane:
Figure 1 shows the new reaction pathways identified for the decomposition of 2,5-dimethylhexane.
In the high-temperature regimes, 2,5-dimethylhexane can decompose either through C-C bond fissions or through hydrogen migration reactions with bond breaking and forming, simultaneously. In low-temperature oxidation, the fuel undergoes a hydrogen-elimination reaction followed by an oxidation reaction—creating a peroxy radical, ROO. The ROO radical undergoes hydrogen migration reactions, creating QOOH radicals leading to alkenes and HOO species. Figure 2 provides an example of the rate calculation for the ROOQOOH
reaction (TS1). We determined the best method for calculating reaction rates was the MultiWell Suite.
The mechanism we developed was then used to model the oxidation of the fuel in a shock tube; specifically, we were interested in the ignition delay properties of the fuel.
This study also highlights, for the first time, the importance of entropic contributions during unimolecular decomposition of 2,5-
U.S. Research Team Lead Angela Violi, University of Michigan
U.S. Partners University of Michigan
China Research Team Lead Xin He, Tsinghua University
Clean Vehicles Consortium Project 2.2
Figure 1. New pathways for the unimolecular
decomposition of 2,5-dimethylhexane.
Figure 2. Reaction rate calculation comparison of
methods. This led us to use MultiWell for rate
calculations.

CVC Project Fact Sheets Page 23 November 2014
dimethylhexane. The rate constants and branching ratio under different temperature ranges indicate that the main reaction pathway for thermal decomposition of 2,5-dimethylhexane is ROOalkene+HOO (TS1), with less contribution from hydrogen migration channels.
Low-temperature oxidation of 2,6-dimethyheptane:
Dimethylheptyl radical (model compound of Farnesane), which leads to two major products; namely, alkene + HO2 and cyclic ether + OH, as shown in Figure 5.
The focus is computation of potential energy surfaces of 2,6-dimethyheptyl radical + O2 reaction. Using the results, the project team implements ab initio transition state theory based on the master equation calculation to determine pressure- and temperature-dependent rate constants.
The methods and validation studies of the 2,6-dimethyheptane molecule were identical to those for the 2,5-dimethyhexane study.
Future Plans
The researchers will investigate the combustion behavior of new biodiesel molecules, such as farnesane and bisabolane.
Expected Outcomes
Low-temperature chemistry of farnesane and bisabolane
Rate coefficient calculations
Connection of fundamental results to U.S.-China Clean Energy Research Center focus areas involving engine tests
Figure 3. Comparison of the ignition delay property of 2,5-
dimethylhexane with shock tube experiments.
Figure 4. Reaction pathways for the oxidation of
dimethylheptyl radical.
Figure 5. Comparison of the ignition delay property of 2,6-
dimethylheptane with rapid compression machine experiments.
Figure 6. Structures of bisabolane and farnesane.

CVC Project Fact Sheets Page 24 November 2014
Integrated Powertrain and Aftertreatment
System Control for Clean Vehicles
Joint Project
Research Objective
The objective of this project is to develop systematic and generalizable estimation and control methodologies for clean vehicle diesel powertrain systems. Such control systems will optimally coordinate fuel property estimation, advanced combustion modes, exhaust aftertreatment systems, and hybrid powertrains to enable maximization of the energy efficiency and emission reduction potentials for clean vehicles.
Technical Approach
Develop onboard fuel property estimation systems. Model-based onboard fuel property estimation and adaptive engine control algorithms, considering the sensing and actuation capabilities and limitations, will be developed
Develop systematic, optimal, and generalizable control methodologies for clean vehicle powertrain systems. To conduct research on systematic and scalable control and management of diesel engine and aftertreatment systems
Significant Results
The project team has developed a method to estimate fuel properties using high-pressure common rail pressure signals for diesel engines. Figure 1 shows the simulated rail pressure signals of different fuels in the frequency domain, clearly demonstrating differences among different fuels
Developed a control-oriented, multiphase combustion model applicable for diesel and biodiesel fuels in diesel engines. The premixed and mixing-controlled combustion is modeled by using two cascaded Wiebe functions. A set of Wiebe coefficients, which are partially physics-based, is found through a grey-box parameter identification approach
Developed an ignition-delay correlation and CA50 prediction models applicable for diesel and biodiesel fuels. Figure 2 displays the comparison of model-predicted and measured CA50 for both B0 and B100 fuels. The model-predicted values match well with experimentally measured values
An observer-based simultaneous air-fraction and biodiesel blend level estimation method has been derived and experimentally studied. Figure 3 and Figure 4 show the experimental results
Mathematical models for describing the DOC and DPF temperature and oxygen dynamics have been produced for the integrated powertrain thermal management strategies. For example, Figure 5 displays the DOC-out gas temperature model validation results
The characteristics of diesel and biodiesel post injections during active diesel particulate filter regenerations have been experimentally studied. For example, Figure 6 gives the influences of SOI timing on the engine-out THC and CO emissions
U.S. Research Team Lead Junmin Wang, The Ohio State University
U.S. Partners The Ohio State University
China Research Team Lead Fuyuan Yang, Tsinghua University
China Partners Tsinghua University
Clean Vehicles Consortium Project 2.4

CVC Project Fact Sheets Page 25 November 2014
Figure 1. Simulated rail pressure signals and their
envelopes for different fuels.
400 450 500 5500
0.1
0.2
0.3
0.4
0.5
0.6
0.7
Frequency (Hz)
JP8
D770
B0
B50
B100
Figure 2. Comparison of model-predicted and measured
CA50 for both B0 and B100 fuels (biodiesel fuel blends).
6 8 10 12 14 16 186
8
10
12
14
16
18
CA50(aTDC) from experimentl[CAD]
CA
50
(aT
DC
) fr
om
sim
ula
tio
n [
CA
D]
-- 1CAD line
B0
B100
Figure 3. Experimental results of the air-fraction
estimation method.
0 200 400 600 800-10
0
10
20
30
40
50
time [s]
Openin
g o
f E
GR
Valv
es [
%]
HEGR-B0
LEGR-B0
HEGR-B100
LEGR-B100
0 200 400 600 8000.16
0.18
0.2
0.22
0.24
0.26
time [s]
F1
0 200 400 600 800
0.15
0.2
0.25
time [s]
F2
mes-B0
est-B0
mes-B100
est-B100
0 200 400 600 800
0.05
0.1
0.15
time [s]
F3
Figure 4. Experimental results of the biodiesel blend level
estimation method.
0 100 200 300 400 500 600 700 800-150
-100
-50
0
50
100
150
200
250
time [s]
Ble
nd L
evel
est-B0
true-B0
est-B100
true-B100
Figure 5. DOC-out gas temperature model validation.
Figure 6. Influences of SOI timing on the engine-out
THC and CO emissions.

CVC Project Fact Sheets Page 26 November 2014
The team produced 18 peer-reviewed publications so far:
Pingen Chen, Umar Ibrahim, and Junmin Wang, “Experimental Investigation of Diesel and Biodiesel Post Injections during Active Diesel Particulate Filter Regenerations,” Fuel, Vol. 130, pp. 286–295, 2014
Junfeng Zhao and Junmin Wang, “Adaptive Observer for Joint Estimation of Oxygen Fractions and Blend Level in Biodiesel Fueled Engines,” IEEE Transactions on Control Systems Technology (in press), 2014
Junfeng Zhao and Junmin Wang, “On-Board Fuel Property Identification Method Based on High-Pressure Common Rail Pressure Signal,” ASME Transactions Journal of Dynamic Systems, Measurement, and Control, Vol. 136, No. 3, 031010 (9 pages), 2014
Pingen Chen and Junmin Wang, “Control-Oriented Model for Integrated Diesel Engine and Aftertreatment Systems Thermal Management,” Control Engineering Practice, Vol. 22, pp. 81–93, 2014
Pingen Chen and Junmin Wang, “Nonlinear and Adaptive Control of NO/NO2 Ratio for Improving Selective Catalytic Reduction System Performance,” Journal of The Franklin Institute, Vol. 350, Issue 8, pp. 1992–2012, 2013
Pingen Chen and Junmin Wang, “Observer-based Estimation of Air-Fractions for a Diesel Engine Coupled with Aftertreatment Systems,” IEEE Transactions on Control Systems Technology, Vol. 21, No. 6, pp. 2239–2250, 2013
Junfeng Zhao and Junmin Wang, “Control-Oriented Multi-Phase Combustion Model for Biodiesel Fueled Engines,” Applied Energy, Vol. 108, pp. 92–99, 2013
Junfeng Zhao and Junmin Wang, “Effect of Exhaust Gas Recirculation on Biodiesel Blend Level Estimation in Diesel Engines,” ASME Transactions Journal of Dynamic Systems, Measurements, and Control, Vol. 135, Issue 1, 011011, 2013
Pingen Chen and Junmin Wang, “Oxygen Concentration Dynamic Model and Observer-Based Estimation through a Diesel Engine Aftertreatment System,” ASME Transactions Journal of Dynamic Systems, Measurement, and Control, Vol. 134, Issue 3, 031008 (10 pages), 2012
Pingen Chen and Junmin Wang, “Control-Oriented Modeling and Observer-based Estimation of Solid and Gas Temperatures for a Diesel Engine Aftertreatment System,” ASME Transactions Journal of Dynamic Systems, Measurement and Control, Vol. 134, Issue 6, 061011 (12 pages), 2012
Junfeng Zhao and Junmin Wang, “Model Predictive Control of Integrated Hybrid Electric Powertrains Coupled with Aftertreatment Systems” Proceedings of the 2014 ASME Dynamic Systems and Control Conference, 2014 (accepted)
Junfeng Zhao and Junmin Wang, “Engine Mass Airflow Sensor Fault Detection via an Adaptive Oxygen Fraction Observer,” Proceedings of the 2014 American Control Conference (Invited Paper), pp. 1517–1522, 2014
Junfeng Zhao and Junmin Wang, “Observer Based Oxygen Fraction Estimation for a Dual-Loop EGR Diesel Engine Fueled with Biodiesel Blends,” Proceedings of the 2013 ASME Dynamic Systems and Control Conference (Invited Paper), pp. 365 - 371, 2013
Pingen Chen and Junmin Wang, “Integrated Diesel Engine and Selective Catalytic Reduction System Active NOx Control for Fuel Economy Improvement,” Proceedings of the 2013 American Control Conference, pp. 2199–2204, 2013
Junfeng Zhao and Junmin Wang, “On-Board Fuel Property Identification Method Based on Common Rail Pressure Signal,” Proceedings of the 2012 ASME Dynamic Systems and Control Conference (Invited Paper), pp. 2238–2245, 2012
Junfeng Zhao and Junmin Wang, “Energy-based and Oxygen-based Biodiesel Blend Level Estimation Methods for Diesel Engines,” Proceedings of the 2012 American Control Conference (Invited Paper), pp. 4975–4980, 2012
Pingen Chen and Junmin Wang, “Control-Oriented Modeling of Thermal Behavior for a Diesel Oxidation Catalyst,” Proceedings of the 2012 American Control Conference, pp. 4987–4992, 2012
Pingen Chen and Junmin Wang, “Oxygen Concentration Dynamic Model through a Diesel Engine Aftertreatment System,” Proceedings of the ASME Dynamic Systems and Control Conference (Invited Paper), pp. 867–874, 2011

CVC Project Fact Sheets Page 27 November 2014
Future Plans
The project team will continue its efforts toward developing fuel property adaptive integrated powertrain and aftertreatment system control methodologies. The team will conduct an experimental investigation of the system control methods and an experimental investigation of optimal accommodation of fuel property in powertrain-aftertreatment system integrated control.
To support these efforts, mutual visits between U.S. and Chinese research partners for collaborative research activities will continue.
Expected Outcomes
Adaptive engine estimation and control methodologies for maintaining optimal engine performance with uncertainties in fuels
A framework for integrated engine, aftertreatment, and hybrid powertrain system control method development with consideration of diesel/biodiesel blend ratio variation

CVC Project Fact Sheets Page 28 November 2014
Energy Conversion Joint Project
Research Objective
The objective of this project is to develop novel, highly efficient, and inexpensive nanocomposite thermoelectric
materials with dimensionless figure of merit (ZT) 1.5 to convert waste heat of cars and trucks into electricity. The project will also determine a Seebeck coefficient using scanning thermoelectric microscopy (SThEM) in conjunction with scanning tunneling microscopy to measure sample homogeneity on a nanometer scale.
Technical Approach
Seek a high Seebeck coefficient and high electrical conductivity while simultaneously aiming for as low a thermal conductivity as possible. To achieve this, we explore the formation of band-resonant states in nanocomposite materials such as CoSb3-based skutterudites and various forms of doping Mg2Si1-xSnx solid solutions
Significant Results
The main results of this project so far include the development of antimony (Sb)-doped n-type Mg2Si1-xSnx solid solutions with ZT = 1.35, the development of operational scanning Seebeck coefficient microscopy, and most recently the development of a combustion synthesis known as the self-propagating-high-temperature-synthesis (SHS) for exceptionally rapid and economical fabrication of compound thermoelectric materials.
In addition, the research team has published several joint publications supported by the U.S.-China Clean Energy Research Center Clean Vehicles Consortium program:
W. Liu, X. Tan, K. Yin, H. Liu, X. F. Tang, J. Shi, Q. Zhang, and C. Uher. “Convergence of Conduction Bands as a Means of Enhancing Thermoelectric Performance of N-type Mg2Si1-xSnx Solid Solutions.” Physical Review Letters 108, 166601 (2012)
U.S. Research Team Lead Ctirad Uher, University of Michigan
Rachel Goldman, University of Michigan
Kevin Pipe, University of Michigan
Joseph Heremans, The Ohio State University
Hsin Wang, Oak Ridge National Laboratory
Douglas Medlin, Sandia National Laboratories
U.S. Partners University of Michigan
The Ohio State University
Oak Ridge National Laboratory
Sandia National Laboratories
China Research Team Lead Xinfeng Tang, Wuhan University of Technology
Han Li, Wuhan University of Technology
China Partners Wuhan University of Technology
Clean Vehicles Consortium Project 2.8
Figure 1. Schematics of the combustion (SHS) synthesis.

CVC Project Fact Sheets Page 29 November 2014
W. Liu, X. F. Tang, H. Li, K. Yin, J. Sharp, X. Zhou, and C. Uher. “Enhanced Thermoelectric Properties of N-type Mg2.16(Si0.4Sn0.6)1-ySby due to Nano-sized Sn-rich Precipitates and an Optimized Electron Concentration.” Journal of Materials Chemistry 22, 13653 (2012)
X. J. Tan, W. Liu, H. J. Liu, J. Shi, X. F. Tang, and C. Uher. “Multiscale Calculations of Thermoelectric Properties of N-type Mg2Si1-xSnx Solid Solutions.” Physical Review B 85, 205212 (2012)
W. Liu, K. Yin, X. Su, H. Li, Y. Gao, X. F. Tang, and C. Uher. “Enhanced Hole Concentration Through Ga Doping and Excess of Mg and Thermoelectric Properties of P-type Mg2(1+z)(Si0.3Sn0.7)1-yGay.” Intermetallics 32, 352 (2013)
J. C. Walrath, Y. H. Lin, K. P. Pipe, and R. S. Goldman. “Quantifying the Local Seebeck Coefficient Using Scanning Thermoelectric Microscopy.” Applied Physics Letters 103, 212101 (2013)
W. Liu, H. Chi, H. Sun, Q. Zhang, K. Yin, X. F. Tang, Q. Zhang, and C. Uher. “Advanced Thermoelectrics Governed by Single Parabolic Band: Mg2Si0.3Sn0.7, a Canonical Example.” Physical Chemistry and Chemical Physics 16, 6893 (2014)
J. Zhang, H. J. Liu, L. Cheng, J. Wei, J. Shi, X. F. Tang, and C. Uher. “Enhanced Thermoelectric Performance of a Quintuple Layer of Bi2Te3.” Journal of Applied Physics 116, 023706 (2014)
T. Liang, X. Su, Y. Yan, G. Zheng, Q. Zhang, H. Chi, X. F. Tang, and C. Uher. “Ultra-fast Synthesis and Thermoelectric Properties of Te-Doped Skutterudites.” Journal of Materials Chemistry A 2, 17914 (2014)
X. Su, F. Fu, Y. Yan, G. Zheng, T. Liang, Q. Zhang, X. Cheng, D. Yang, H. Chi, X. F. Tang, Q. Zhang, and C. Uher. “Self-Propagating High-Temperature Synthesis for Compound Thermoelectrics and New Criterion for Combustion Processing.” Nature Communications: DOI: 10.1038/ncomms5908, Sept. 2014
Future Plans
The initial attempt to form bond resonant states with tin (Sn) doping in CoSb3 will be followed with other prospective dopants to further improve the Seebeck coefficient of CoSb3-based skutterudites.
The research team will attempt to improve the performance of n-type Mg2Si1-xSnx solid solutions by doping with bismuth, which is a heavier element. A greater mass difference in comparison to antimony-doped structures should result in lower lattice thermal conductivity, and thus higher ZT.
The research team will also focus on improving the performance of p-type Mg2Si1-xSnx solid solutions that, so far, lag far behind the n-type forms of the material.
Modifications will be made to a sample holder of the SThEM apparatus to allow measurements of thin-film samples.
Expected Outcomes
Development of high-performance p-type skutterudites for waste heat recovery
Development of efficient and inexpensive n-type Mg2Si1-xSnx solid solutions
Improvement of p-type forms of Mg2Si1-xSnx
Development of low-resistance contacts to both forms of Mg2Si1-xSnx solid solutions
Implementation of scanning Seebeck coefficient microscopy for nanometer-scale characterization of dopant distribution in thermoelectric materials
Fine-tuning the SHS synthesis process for fabrication of skutterudites

CVC Project Fact Sheets Page 30 November 2014
Efficient and High Power Density Electric
Powertrain
Joint Project
Research Objective
This project seeks to develop innovative and optimized electric machines for electrified powertrains with significantly higher power density and efficiency. This will be achieved through the investigation of novel electric machine designs and the development of computationally efficient design tools.
Technical Approach
Develop computationally efficient steady-state analysis techniques for finite element models of electric machines to aid in high-fidelity loss calculations including skin- and proximity-effect
Develop innovative electric machine topologies that are integrated with vehicle transmissions
Reduce machine losses so that air cooling becomes feasible, dramatically increasing the power density of the overall system
Significant Results
Researchers at the University of Michigan have created and created improved three steady-state analysis techniques for electric machines through the application of advanced numerical integration techniques and iterative algorithms that exploit the underlying structure of the electric machine simulation problem. A comparison of existing time-domain based methods was presented in a recent publication, demonstrating over an order of magnitude improvement in simulation time over conventional approaches. New insights into the structure of the frequency-domain formulation of the steady-state problem have resulted in a novel preconditioner that allows the simulation times for this problem to achieve parity with the time-domain formulations. On a fixed mesh size, the improved algorithms have demonstrated simulation times within a factor of 4 of the lower-bound represented by uniform current density static finite-element analysis.
Figure 1. Top: Flux density distribution in a model of a UQM 145
surface mount permanent magnet machine. Bottom: Harmonic
amplitude of the current density in two slots of the UQM 145 machine
with stranded conductors demonstrating skin and proximity effect.
U.S. Research Team Lead Heath Hofmann, University of Michigan
Longya Xu, The Ohio State University
U.S. Partners University of Michigan
The Ohio State University
Oak Ridge National Laboratory
China Research Team Lead Wen Xuhui, Chinese Academy of Sciences
Tao Fan, Chinese Academy of Sciences
China Partners Chinese Academy of Sciences
Jing-Jin Electric
Hunan CSR Electric Vehicle Company
Clean Vehicles Consortium Project 3.1

CVC Project Fact Sheets Page 31 November 2014
Researchers at the Chinese Academy of Sciences have optimized the design of a permanent magnet machine with amorphous iron laminations. A prototype of this design was built and compared to a design with conventional silicon laminations. The high-frequency capability of the amorphous iron material allowed for a significant increase in efficiency (as much as five percentage points) over the conventional machine. The prototype machine is also significantly smaller than the conventional machine.
Recent publications related to this work include the following:
J. Pries and H. Hofmann. “Steady-State Algorithms for Nonlinear Time-Periodic Magnetic Diffusion Problems using Diagonally-Implicit Runge-Kutta Methods,” accepted for publication in IEEE Transactions on Magnetics
Q. Li, T. Fan, and X. Wen. “Armature-Reaction Magnetic Field Analysis for Interior Permanent Magnet Motor Based on Winding Function Theory.” IEEE Transactions on Magnetics 49(3) (March 2013): 1193–1201
T. Fan, Q. Li, and X. Wen. “Development of a High Power Density Motor Made of Amorphous Alloy Cores,” IEEE Transactions on Industrial Electronics, 61 (9) (September 2014): 4510–4518
Future Plans
Researchers at the University of Michigan are currently investigating the application of adaptive solution refinement to the steady-state simulation algorithms that they have previously developed. It is believed the simulation times of these algorithms can be further reduced by iteratively refining the solutions in an intelligent manner. In addition, adaptivity allows the solution accuracy to be controlled automatically, increasing confidence in the results and the ease of use of the simulation tool.
Expected Outcomes
Computationally efficient steady-state solvers for synchronous machines with time-domain adaptivity for automatically controlling solution accuracy
High-efficiency machine designs that will eliminate the need for liquid cooling, thereby dramatically increasing power density and reliability

CVC Project Fact Sheets Page 32 November 2014
Rapid System Integration through Modular
Configuration, Sizing and Control for Hybrid
Vehicles
Joint Project
Research Objective
To develop key techniques for the modeling, analysis, design, and control of power-split hybrid vehicles.
Technical Approach
Perform analysis and automated modeling of all configurations of power-split hybrid vehicles with multiple operating modes o Study powertrains that use a single planetary gear o Expand to powertrains using two planetary gears
Develop modeling and optimization methods that enable rapid computation of control algorithms for powertrains with multiple modes
Focus on specific applications to accelerate technology transfer
Significant Results
Over the last year, the team has extended the automated modeling and screening method to power-split powertrains that use two planetary gears and clutches. One of the key challenges in the modeling process arises from the fact that when a clutch is engaged, typically the degree of freedom of the dynamic system changes. This means the state matrix that describes the motion of the vehicle changes, as well as the state vector. It is then necessary to develop executable rules that enable automated model reduction and subsequent screening schemes to eliminate infeasible or redundant dynamic systems. In addition, when multiple modes are available, identifying the best mode to use is not trivial, because the large discrepancy between engine efficiency and electric motor efficiency. To address these issues, a near-optimal control method was developed that is 3–4 orders of magnitude faster than a traditional optimization method such as dynamic programming.
In order to study the effectiveness of the proposed design and near-optimal control strategy, we started from the two-planetary gear powertrain shown in Figure 1, which is the powertrain design used in current model year of Toyota Prius and Camry hybrid vehicles. This powertrain has no clutch and only has a single mode. Inspired by the analysis results of our previous research, a Prius 2010++ design (also in Figure 1) is also analyzed. Both designs shown in Figure 1 serve as
U.S. Research Team Lead Huei Peng, University of Michigan
Jing Sun, University of Michigan
Giorgio Rizzoni, The Ohio State University
U.S. Partners University of Michigan
The Ohio State University
China Research Team Lead Jianqiu Li, Tsinghua University
Chengliang Yin, Shanghai Jiao Tong University
China Partners Tsinghua University
Shanghai Jiao Tong University
Clean Vehicles Consortium Project 3.3.1
(a) Prius 2010
(b) Prius 2010++
Figure 1. The original input-split
configuration used in the Toyota Prius
model year 2010–2014 (top) and the
conceptual Prius 2010++ design (bottom)—
not used commercially. Both serve as
benchmarks of our design study.

CVC Project Fact Sheets Page 33 November 2014
benchmarks of our new results. After detailed analysis, we found that up to 16 clutches can be added (see Figure 2). We analyzed the so-called “Utopian Prius” design in which all 16 clutches are assumed to be available for use, which enables 101 different modes. This design apparently is too complicated and costly to be commercialized. However, it serves as the theoretical upper bound of possible performance of our subsequent designs.
We conducted an exhaustive design search using the developed automated modeling and near-optimal control method, and we searched through all possible designs that use only three clutches and a permanent connection. These connections can be any 4 of the 16 potential locations shown in Figure 2, and a total of more than 7,000 designs are possible. By limiting the number of clutches to three, the resulting designs are more likely to be practical (Chevy Volts, for example, use three clutches). Among the more than 7,000 design candidates, 181 were found to achieve both better launching performance and fuel economy, compared with the original Prius 2010 design in simulations (see Figure 3). We selected one design on the Pareto front, highlighted by the green donut symbol in Figure 3 as the “optimal design.” This design achieves 4.1% better fuel economy on combined urban/highway cycle driving, and the 0 to 60 mph launching performance is 32.7% better.
Future Plans
Hybrid vehicles have secured about 3.5% of the light-duty vehicle market share in the United States; we believe what is needed is a systematic design procedure to enable fast design for heavier vehicles, including full-size passenger cars, light trucks, and sport utility vehicles (SUVs). Some of these new target segments require more emphasis on attributes that are “beyond fuel economy,” such as towing and acceleration performance. The proposed methodology will be applied to study these vehicles, including light trucks and SUVs, with practical performance requirements, in consultation with CERC member researchers.
Expected Outcomes
Comprehensive modeling, analysis, and control tools for design and simulation of power-split vehicles using one or two planetary gears; two-planetary-gear designs are especially suitable for heavy-duty applications such as light trucks, SUVs, and trucks up to Class 6
A complete study of the benefits and challenges in deploying clutches to enable multiple modes
In-depth analysis of several powertrain designs for next-generation CV applications
Technology transfer to U.S. industrial partners
Figure 2. For power-split hybrid powertrains using
two planetary gears, up to 16 clutches can be added
(shown in black color). This is obtained after
eliminating redundant clutches (shown in red color).
Figure 3. Among more than 7,000 possible 3-clutch
designs, 181 were found to achieve better fuel
economy and better launching performance than the
Prius2010 benchmark, when the same
engine/motor/generator are used.

CVC Project Fact Sheets Page 34 November 2014
Intelligent Fault Diagnosis and Prognosis
Joint Project
Research Objective
The objective of this project is to develop methods, algorithms, and software tools for electrified vehicle diagnosis and prognosis to guarantee functional safety and longer life cycle of electrified vehicles. The current research objective is to develop an integrated methodology for fault diagnosis and fault tolerant control of the electric motor drive, battery pack systems, and automated manual transmissions (AMTs), as well as system-level prognosis for the battery pack system.
Technical Approach
Conduct hazard analysis (HA), including fault tree analysis and design failure modes and effects analysis for electrified powertrains
Develop fault and aging models, including a novel aging propagation modeling approach for interconnected systems
Develop simulators that incorporate fault and aging models at the component level, and simulate the effects of faults on the overall system
Develop fault detection and isolation schemes for electric drive systems, battery pack systems, and transmissions using structural approaches
Develop system-level model-based state-of-health assessment and prognostics
Figure 1. A ‘’V-like’’ model for fail-safe architectures, fault tolerant control, and limp-
home operation.
Diagnostics design process
Controls design process
U.S. Research Team Lead Jiyu Zhang, The Ohio State University
Zhentong Liu, Beijing Institute of Technology
Qi Chen, Hefei University of Technology
Giorgio Rizzoni, The Ohio State University
Qadeer Ahmed, The Ohio State University
Andrea Cordoba-Arenas, The Ohio State University
U.S. Partners The Ohio State University
China Research Team Lead Hongmei Li, Hefei University of Technology
China Partners Hefei University of Technology
Beijing Institute of Technology
Clean Vehicles Consortium Project 3.3.2
Figure 2. Structural analysis for FDI design.

CVC Project Fact Sheets Page 35 November 2014
schemes for life cycle management
Develop fault-tolerant control strategies for the electric drive system, as well as life extension strategies and algorithms for the battery system
To translate the proposed methodology into a process that implements ISO 26262 or some aspects thereof as part of the standard rapid prototyping software tool chain (Simulink/Matlab/dSpace)
Significant Results
Structural Analysis for FDI: The project team has successfully applied structural approaches for fault diagnosis of electric drive systems, battery systems, and automated transmission systems. (These separate
systems are done by three team members, Jiyu Zhang, Zhentong Liu, and Dr. Qi Chen, respectively.) Structural analysis analyzes the structure of the system’s mathematical model, aims to find system redundancy through mathematical manipulation of the system’s structural model, and constructs diagnostic tests through
minimum structurally over-determined sets.
The team has used the structural analysis approach to analyze the detectability and isolability for various faults in electric drives, battery systems, and AMTs. In particular, a sensor placement study has been performed to improve the isolation of faults for AMT systems. The team uses MSO sets for diagnosis test design and derived realizable sequential residual generators for each of the MSO sets to achieve detection and isolation of various faults. The residual generators have been validated through Matlab/Simulink.
PMSM Drive Systems: An FDI scheme has been proposed using the structural analysis approach for various sensor faults and motor internal faults. In particular, a set of diagnosis tests and sequential residual generators have been selected to enable effective FDI of major faults in PMSM drives.
Lithium-Ion Battery Systems: A model-based FDI scheme using structural analysis for battery systems. This
Figure 3. PMSM drive system architecture and fault locations.
Figure 4. Diagnosis tests selection for FDI of sensor faults in PMSM drive systems.
Figure 5. Lithium battery system architecture, modeling, and fault locations.
Sensors
...
Connectors
Battery Equalization Circuit
Cell
Current Sensor
Voltage Sensors
Temperature Sensors
Fuses
Module
Connectors
Battery Modules
Safety Management System
Contactors
Thermal Management
System
Cooling Motor
Fans
Battery Control Unit
Battery Monitoring Unit
Battery States Estimation
Battery Management SystemBattery System Hardware
Battery Parameters Estimation
SOC SOH RUL
CAN Network
Lithium-ion Battery System
Cell
...
...
Cell
Module
Connectors
Cell
...
...
Electrical
Model
SOC Model
Thermal
Model
Parameters
Model
Temperature
Sensor
Voltage
Sensor
Current
Sensor
Cooling System
(Motor and fan)
Cooling System
Controller
Load current Voltage
Temperature
fI
fV
fT
fOh

CVC Project Fact Sheets Page 36 November 2014
scheme can successfully detect and isolate current, voltage, and temperature sensor faults, as well as cooling system faults. The proposed FDI scheme is applied to a single cell as well as to a 2P2S battery module, and experimental data have been used for validation.
AMT: A systematic methodology based on structural analysis has been proposed to classify the sensor placements to maximize the fault detection and isolation utilizing the concept of structural analysis to the AMT. The team also develops a software tool in MATLAB GUI to conduct structural FDI easily and visually.
Industry and China Collaboration: The team has active collaborations with China through exchange of students and professors. Thanks to former visiting professor Hongmei Li’s expertise in electric machine fault diagnosis and control, the team has gained a great deal of knowledge on electric machine drive and their control. Ph.D student Jiyu Zhang visited Hefei twice (in summer 2013 and 2014) and had a deeper interaction with Prof. Li’s team.
The team also established collaborations with Delphi. The team is working in partnership with Delphi on a two-year project with potential for commercialization.
Future Plans
The project team will conduct a more complete model-based fault diagnosis and prognosis methods and procedures for EV powertrains. The team also plans to take advantage of the fault diagnosis techniques to assist control development. The methods and tools will be demonstrated on an experimental vehicle, in collaboration with industrial partners.
Expected Outcomes
A systematic methodology for the design of system-level solutions for EV state-of-health assessment, diagnosis, and prognosis
Methods, algorithms, and software tools for EV powertrain key systems life cycle management
Fault-tolerant control methods for limp-home and life-extending operation of electrified powertrains
Collaboration with U.S. and Chinese industry partners in validating these methods experimentally
Figure 6. Configurations of a six-speed AMT.
Gear trains
Synchronizer
Lubrication
Power
Electric
Motor
Inductor
Resistor
Electric Motor
CircuitGeartrains Screw Pair
Actuator Frame Lever
Push/pull Cable
X-Y direction
action
Shift Actuator
Shift Schedule
Communication with
Supervisory Controller
TCU(Transmissi
on Control Unit)
Parallel
Gearbox
6-Speed AMT
1 2 43 5 6
12
34
56
Transmission
Synchroniz
er
X
Y
X Y
Linear
Actuator
Fs2
Fs1
Tg1ωg1
Tg2ωg2
OUT
Figure 7. A Matlab Gui to enable using structural approaches for detectability,
isolability analysis, and sensor placement studies.

CVC Project Fact Sheets Page 37 November 2014
Adaptive Battery Management System On and Off
the Grid
Joint Project
Research Objective
This project seeks to develop intelligent monitoring (while driving), diagnosis/prognosis, and conditioning (while connected with the grid) strategies to improve the reliability, performance, and life cycle of battery systems on electrified vehicles. The current research objectives are directed toward the development of suitable models for battery system aging characterization and real-time adaptation, and the development of design framework and computational algorithms to perform robust battery system identification and diagnosis with onboard sensor and communication constraints.
Technical Approach
Develop phenomenological models that can represent battery aging data while explaining underlying physical behavior
Improve understanding of the aging and environmental effects on batteries’ cycle performance
Identify real-time and onboard battery system adaptation requirements and limitations
Develop energy management algorithms and strategies to maintain optimal and robust performance for battery systems with changing characteristics
Significant Results
Efforts have been focused on characterization and identification of battery state of health (SOH) for electrified vehicles. The team has built a large database of battery aging cycles over the past two years. The data sets have been analyzed to develop/validate new models and SOH identification algorithms. The main results achieved so far include the design of an effective identification framework for onboard battery SOH monitoring and degradation diagnosis and the development of a unified battery open-circuit-voltage (OCV) model for state of charge (SOC) and SOH estimation.
The incremental capacity analysis (ICA) leverages the lithium-ion battery staging phenomenon during the intercalation process at the graphite anode side. This analysis exploits the sensitivity of the battery charged capacity (Q) with respect to the terminal voltage (V) and transforms voltage plateaus on the V-Q curve into clearly identifiable peaks on the dQ/dV curve. While it is known that the peaks on the incremental capacity
U.S. Research Team Lead Jing Sun, University of Michigan
Huei Peng, University of Michigan
U.S. Partners University of Michigan
China Research Team Lead Minggao Ouyang, Tsinghua University
Jianqiu Li, Tsinghua University
Lifang Wang, Chinese Academy of Science
Chengliang Yin, Shanghai Jiaotong University
Li Chen, Shanghai Jiaotong University
China Partners Tsinghua University
Chinese Academy of Science
Shanghai Jiao Tong University
Clean Vehicles Consortium Project 3.4.1
Figure 1. IC curves of data at different aging stages.
3.2 3.25 3.3 3.35 3.4 3.450
5
10
15
20
Measured Voltage (V)
Incre
men
tal
Cap
acit
y (
V-1
)
Cycle 1000
Cycle 1400
Cycle 1900
Cycle 2300

CVC Project Fact Sheets Page 38 November 2014
(IC) curve are associated with battery electrochemical properties and aging status under quasi-equilibrium conditions, this project focuses on the investigation of the IC signature and its utility under normal charging conditions. Through extensive analysis of the aging data, a strong correlation is established between the IC peak at higher SOC range and the SOH for data collected under normal charging conditions (1/2 C rate).
Extracting the IC aging signatures from the battery charging/discharging data is challenging, as the flatness of the curve and the noise sensitivity make it infeasible to directly differentiate measured Q-V data. The team has explored both parametric and non-parametric approaches, developed and evaluated several algorithms, and validated the algorithms with battery aging data sets. The use of support vector regression (SVR) is shown to provide the most promising features for real-time applications, because the SVR model is able to extract the IC
peak information and predict the capacity fade within a 1% error bound more than 90% of the time, as validated on data collected for eight different A123 LiFePO4 cells with up to 2,800 aging cycles.
Furthermore, the established ICA-based battery SOH monitoring framework has been extended from single cells to battery packs. The applicability of ICA to battery packs was investigated through both model simulations and experimental tests. A battery pack model incorporating cell dynamic behavior and aging mechanism was built for the study. For the experiments, multiple battery packs consisting of cells with various aging conditions are built and tested. A cell inventory of about 30 A123 LiFePO4 cells is established. The cells in the inventory were cycled with different loading profiles before the pack tests. The cells are then combined into multi-cells packs and processed with characterization profiles. The preliminary test results (with three-cell packs) show that the IC behaviors of battery packs are consistent with those of cells. The ICA-based SOH monitoring framework is applicable to battery packs.
Future Plans
Future research activities include the following: (1) extend the SOH monitoring framework to battery packs with different number of cells and various chemistries; (2) investigate the sensitivity of the ICA-based SOH monitoring to environmental and operational parameters (such as temperature and cell non-uniformity); (3) develop adaptive power management strategies incorporating battery SOH information; and (4) implement the framework in electric vehicle applications.
Expected Outcomes
Algorithms and methodologies for online battery system identification and adaptation
Battery pack model for aging and degradation analysis
Design and validation of an integrated adaptive battery power management strategy
Recommendations on battery system prognosis and diagnosis strategy
Figure 2. Correlation between normalized battery
capacities and IC peaks.
0.4 0.5 0.6 0.7 0.8 0.9 10.91
0.92
0.93
0.94
0.95
0.96
0.97
0.98
0.99
1
Normalized IC Peak
No
rmali
zed
Cap
acit
y
Figure 3. Battery Pack Formulation and Characterization
Tests.

CVC Project Fact Sheets Page 39 November 2014
Data-Based Techniques for Battery-Health
Prediction Joint Project
Research Objective
The objective of this project is to develop and demonstrate a noninvasive method to estimate the health-relevant features of a battery and thus monitor and predict battery state of health (SOH).
Technical Approach
Adopt Retrospective-Cost Subsystem Identification (RCSI) and its modification, the Two Step Filter, as the noninvasive approach to identify the battery health subsystem
Use the RCSI and the Two Step Filter, under realistic measurement conditions, to estimate the side reaction current density as the indicator of battery SOH
Conduct simulations and laboratory experiments to validate the developed approach and evaluate its performance
Significant Results
The team has demonstrated in simulation for the first time the feasibility of tracking the root cause of battery degradation using noninvasive measurements as the battery is being used.
To this end, the team has formulated the battery SOH prediction problem as an inaccessible subsystem identification problem with the RCSI technique as the solution approach. It was shown in simulation using high-fidelity models of battery electrochemistry dynamics that the proposed approach can accurately predict battery SOH as measured by the side reaction current density.
Figures 1–3 present the simulation results of estimating the
side reaction current density ( sdJ ) during slow and fast constant current charge and discharge cycles, as well as the Urban Dynamometer Driving Schedule (UDDS) cycle when no state of charge (SOC) estimation error and noise are present. The results verified via simulation the effectiveness of RCSI in estimating side reaction current density with no SOC estimation error and no noise. The results are to be presented at the 2014 ASME Dynamic Systems and Control Conference.
The team also developed the Two Step Filter, which is a modification of RCSI, to decrease the sensitivity to SOC estimation error. The preliminary results of this investigation are in review for publication at the 2015 American Control Conference.
U.S. Research Team Lead Jeffrey Stein, University of Michigan
Dennis Bernstein, University of Michigan
Tulga Ersal, University of Michigan
U.S. Partners University of Michigan
China Research Team Lead Languang Lu, Tsinghua University
China Partners Tsinghua University
Clean Vehicles Consortium Project 3.4.2
Figure 1. The estimation of the side reaction current density,
the SOH indicator, during 0.1 C constant current charge and
discharge cycles using RCSI. The red dashed line represents
the true side reaction current density, while the blue solid line
represents the estimated side reaction current density. The
result shows that RCSI can estimate the side reaction current
density during slow constant current charge and discharge
cycles.

CVC Project Fact Sheets Page 40 November 2014
Future Plans
Investigate impact of SOC estimation error and measurement noise
Use the developed algorithm with laboratory cycling data
Collaborate with the Chinese partners to support their battery state of function estimation activities
Collaborate with the industry partners for technology transfer
Expected Outcomes
A battery SOH prediction algorithm that works with noninvasive measurements and can be applied to monitor and predict battery SOH as the battery is in use
Design techniques for the algorithm to work under realistic conditions, including measurement noise and SOC estimation errors
Validation of the algorithm and the design techniques using experimental data
Figure 2. The estimation of the side reaction current density,
the SOH indicator, during 20 C constant current charge and
discharge cycles using RCSI. The red dashed line represents the
true side reaction current density, while the blue line represents
the estimated side reaction current density. The result shows
that RCSI can estimate the side reaction current density during
fast constant current charge and discharge cycles.
Figure 3. The estimation of the side reaction current density, the
SOH indicator, during the UDDS cycle using RCSI. The red dashed
line represents the true side reaction current density, while the blue
line represents the estimated side reaction current density. The
result shows that RCSI can estimate the side reaction current
density during UDDS cycles. The relative estimation error of the side
reaction current density (estimation error normalized by the true
value) is below 0.8% during the UDDS cycle.
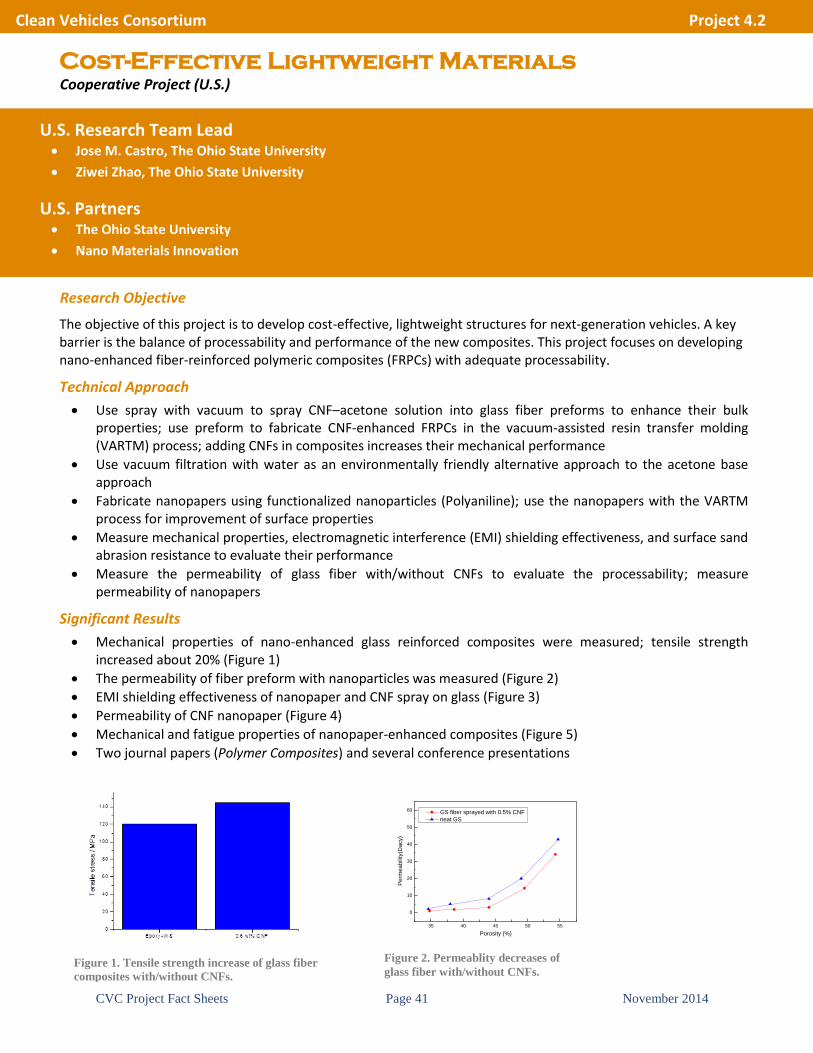
CVC Project Fact Sheets Page 41 November 2014
Cost-Effective Lightweight Materials Cooperative Project (U.S.)
Research Objective
The objective of this project is to develop cost-effective, lightweight structures for next-generation vehicles. A key barrier is the balance of processability and performance of the new composites. This project focuses on developing nano-enhanced fiber-reinforced polymeric composites (FRPCs) with adequate processability.
Technical Approach
Use spray with vacuum to spray CNF–acetone solution into glass fiber preforms to enhance their bulk properties; use preform to fabricate CNF-enhanced FRPCs in the vacuum-assisted resin transfer molding (VARTM) process; adding CNFs in composites increases their mechanical performance
Use vacuum filtration with water as an environmentally friendly alternative approach to the acetone base approach
Fabricate nanopapers using functionalized nanoparticles (Polyaniline); use the nanopapers with the VARTM process for improvement of surface properties
Measure mechanical properties, electromagnetic interference (EMI) shielding effectiveness, and surface sand abrasion resistance to evaluate their performance
Measure the permeability of glass fiber with/without CNFs to evaluate the processability; measure permeability of nanopapers
Significant Results
Mechanical properties of nano-enhanced glass reinforced composites were measured; tensile strength increased about 20% (Figure 1)
The permeability of fiber preform with nanoparticles was measured (Figure 2)
EMI shielding effectiveness of nanopaper and CNF spray on glass (Figure 3)
Permeability of CNF nanopaper (Figure 4)
Mechanical and fatigue properties of nanopaper-enhanced composites (Figure 5)
Two journal papers (Polymer Composites) and several conference presentations
U.S. Research Team Lead Jose M. Castro, The Ohio State University
Ziwei Zhao, The Ohio State University
U.S. Partners The Ohio State University
Nano Materials Innovation
Clean Vehicles Consortium Project 4.2
Figure 1. Tensile strength increase of glass fiber
composites with/without CNFs.
Figure 2. Permeablity decreases of
glass fiber with/without CNFs.
35 40 45 50 55
0
10
20
30
40
50
60
Porosity (%)
Perm
ea
bili
ty(D
acy)
GS fiber sprayed with 0.5% CNF
neat GS

CVC Project Fact Sheets Page 42 November 2014
Figure 3. EMI shielding effectiveness of composites with
nanopaper and CNF layer.
Figure 4. Permeability results of CNF nanopaper.
Figure 5. Effect of nanopaper on fatigue and flexural properties.
Future Plans
• Develop a water-based nanopaper manufacturing process that can produce larger-size nanopapers at reasonable production rates; we are prototyping a rotational device that will take advantage of the centrifugal force to increase the water filtration rate
• Evaluate the use of simulation to study the manufacturability of actual automotive parts • Select an automotive part to be prototyped • Study joining of multiple composite parts and or joining between composite parts and metallic parts
Expected Outcomes
Improvement in sand abrasion resistance and EMI shielding effectiveness with respect to conventional composites
A mathematical model to describe the flow and support processability studies
Design and building of a small automotive part
Evaluation of methods for composite joining

CVC Project Fact Sheets Page 43 November 2014
Joining Multi-Material Structures –
Vaporizing Foil Actuator Approach Cooperative Project (U.S.)
Research Objective
This project uses an integrated experimentation and modeling approach to establish a new method of developing very high pressures and speeds in sheet metal to provide to several manufacturing operations, including developing flyer speeds high enough for collision welding of aluminum and steel sheets with few to no heat-affected zones. Such a joint morphology could help produce multi-material structures with reduced weight and improved crash resistance; stiffness; and noise, vibration, and harshness characteristics.
Technical Approach
Electrically vaporized thin metal conductors have been used to drive aluminum sheets on the scale of 1 mm for the purpose of small-scale, lab- and industry-safe collision welding. The process uses the pressure pulse from the sudden expansion of the vaporized metal to controllably drive aluminum to velocities in excess of those needed to collision weld. The project has made 1.5 cm wide joints in lengths from 1.5 cm to over 15 cm
Instrumented experiments including velocity measurement are used to determine the predictability and repeatability of this method for use as a joining tool
Key variables to control are the velocity and collision angle, which must vary depending on the material pair and their thicknesses. Control of these parameters is essential to produce a strong joint free of voids or intermetallic layers
Significant Results
This project established many important elements.
The VFA approach has been shown to be very reproducible, and a scientific basis is being developed for understanding this
Key experiments are focused on developing an understanding of the size of weld that can be developed
Similar and dissimilar metal sheets can be joined with overlapping joints strong enough to break in the weaker parent material. Because of the nature of collision welding, heat-affected zones and resulting brittle intermetallic compounds can be minimized or eliminated, and the properties of age-hardened material can be maintained
U.S. Research Team Lead Glenn S. Daehn, The Ohio State University
Steven Hansen, The Ohio State University
U.S. Partners The Ohio State University
General Motors
University of Michigan
Oak Ridge National Laboratory
Clean Vehicles Consortium Project 4.3.2
Figure 1. Experimental joint over 10 cm using 0.5 mm thick AA6061-T6.

CVC Project Fact Sheets Page 44 November 2014
Experiments using velocity-measurement probes showed that the movement of the workpiece can be predictably controlled via input energy, allowing for high-quality joints to be made reproducibly
Future Plans
This method (termed “vaporizing foil actuator welding” or VFAW) shows promise as a new tool for impulse metalworking, including the formation of strong dissimilar-metal joints in lightweight structures. If and when specific geometric locations in automotive structures that will make use of these methods to join dissimilar metals are identified, focused research can be carried out to validate this for the particular joint configuration and set of materials of interest.
Figure 2. Velocity in repeated experiments using 0.508 mm AA2024-T3
sheets.

CVC Project Fact Sheets Page 45 November 2014
Figure 1. Schematic illustration of the experimental
configuration for the electrically assisted FSW process.
Electrically Assisted Friction Stir Welding for
Joining Dissimilar Materials Joint Project
Research Objective
The objective of this project is to develop high-quality and economical joining processes between dissimilar lightweight materials, especially for aluminum alloys and advanced high-strength steels. Electro-plastic effect (EPE) is incorporated into a traditional friction stir welding (FSW) process for reducing mechanical welding force, enlarging the process window and improving joint quality.
Technical Approach
Design and fabricate an experimental testbed for introducing high-density electrical current into the FSW process
Plunge stage study for aluminum alloy Al6061 and TRIP steel separately to investigate the appropriate range of the applied electrical current density
Study the electrically assisted FSW process under different process parameters in aspects of mechanical welding force as well as temperature history
Conduct microstructure analysis of the joint cross section obtained under electrically assisted FSW conditions
Significant Results
Figure 1 shows a schematic diagram of the developed experimental testbed for studying this electrically assisted FSW process. Two copper brushes were pressed against the top surface of the workpiece, serving as the anode and cathode to conduct the large current. The copper brushes were mounted to the spindle holder and travel together with the FSW tool in close proximity to guarantee a high current density. In order to account for height fluctuations due to workpiece surface roughness, these two electrodes were spring preloaded to address the concerns of spark generation as they slide on the workpiece. Electrodes were bolted to the leads of the welder, Lincoln Electric Power Wave 455, which is the electrical power source and can supply a continuously direct current of 560 A. Magnitude of the current was monitored using the OMEGA HHM596C multimeter during the process. Aluminum and steel sheets were machined to identical dimensions and placed in the same location each time through positioning blocks in the fixture for repeatability. Workpieces were clamped in both vertical and horizontal directions to minimize their initial contact resistance.
To achieve a maximum current density in the weld zone, steel and aluminum workpieces need to be electrically isolated from the backing plate. Thin layers of mica sheet (as shown in Figure 1) and ceramic plate were both attempted as suitable candidates for insulation materials. In the case of mica, a steel backing block was placed underlay along the weld track for further mechanical support and embedding thermocouples, which are shown as red spots in Figure 1. Three thermocouples were submerged 1 mm below the upper surface of steel and located at
U.S. Research Team Lead Jun Ni, University of Michigan
U.S. Partners University of Michigan
China Research Team Lead Xinmin Lai, Shanghai Jiao Tong University
China Partners Shanghai Jiao Tong University
Clean Vehicles Consortium Project 4.3.3

CVC Project Fact Sheets Page 46 November 2014
Current density distribution on A-A cross section: A/mm2
7 mm
1 mm
3 mm
A A
Current density distribution on workpiece top surface: A/mm2
10 mm
7 mm
Al 6061 TRIP Steel
Al 6061 TRIP Steel
Figure 4. Comparison of the electrical effect on the thermal history of
weld beginning point under different rotating speeds and tool offsets.
the beginning, middle, and ending points right beneath the original Al-Fe interface. However, it turns out that the mica sheet would be undesirably bonded to the workpiece under the combined conditions of high temperature and pressure during the FSW process, which substantially deteriorates the joint quality. Bearing this in mind, a ceramic plate was employed for subsequent welding force measurement and joint microstructure analysis.
Electrode configuration employed in the study and the corresponding numerical analysis results on the current density distribution are shown in Figure 2.
Figure 3 shows two sets of temperature results. It can be seen that the two data sets almost overlap with each other, which indicates good repeatability. However, insertion of a mica sheet between the workpiece and backing plate provides not only electrical but also thermal insulation. The highest temperature measured was less than 100°C, which is far below the actual temperature in the weld zone. An improved temperature measurement scheme in this regard will be developed in future works. Notwithstanding that, these measurements can still represent relative trends for the three welding locations under different process parameters. In Figure 3, it can be seen that the thermocouple at the initial plunge position has the largest temperature increasing gradient, which is the result of direct heating from friction and plastic deformation in
plunge stage. On the other hand, the other two are merely preheated through thermal conduction and have a relatively slower temperature rise. It should also be noted that the peak temperature at plunge position is smaller than that compared with welding regions. This can be construed from the aspect that the total amount of heat generation in the beginning is smaller compared with that in the stable welding stage. This is especially true for electrically assisted situations since the resistance heating will accumulate during the process until an equilibrium has been reached. Regarding the temperature profile of the
ending point, a sharp apex can be observed, which is due to the tool’s retraction and discontinuation of the current.
Figure 4 shows electrical effects on the thermal history of the weld’s beginning point, where different colors represent different tool rotating speeds and electrically assisted conditions are distinguished with circle symbols. It can be observed that in the first ten seconds, which is the period of plunge stage, electrical current exhibits little effect on the temperature profile. After that, accumulated resistance heating results in an elevated temperature. Peak temperature for conventional FSW conditions occurs at around 15 s, which is the finishing point of the 5-second dwell stage. In contrast, for electrically assisted cases, the temperature continued to rise after the tool started to translate along the weld seam. It can be seen that
Figure 2. Current density distribution for the asymmetric
electrodes configuration.
Figure 3. Two sets of temperature measurement results at the
beginning, middle and ending points below the weld line (processing
condition: rotational speed 1800 rpm; tool offset: 1.63mm; current
applied).

CVC Project Fact Sheets Page 47 November 2014
0 5 10 15 20 25 30 35 400
1
2
3
4
5
6R:1200 OFFSET:1.03
Time:second
Axia
l fo
rce
: kN
C0
C560
0 5 10 15 20 25 30 35 400
1
2
3
4
5
6R:1200 OFFSET:1.63
Time:second
Axia
l fo
rce
: kN
C0
C560
0 5 10 15 20 25 30 35 400
0.5
1
1.5
2
2.5
3
3.5
4
4.5R:1800 OFFSET:1.63
Time:second
Axia
l fo
rce
: kN
C0
C560
0 5 10 15 20 25 30 35 400
0.5
1
1.5
2
2.5
3
3.5
4
4.5
5R:1800 OFFSET:1.03
Time:second
Axia
l fo
rce
: kN
C0
C560
disparity of temperature due to electrical current is more substantial than that caused by varying rotational speed. This also shows that resistance heating is inevitable and hardly ignorable when introducing current into the FSW process. The amount of temperature increase on the first thermocouple due to electrical current is generally independent of tool rotating speed and offset. On the other hand, since electrodes are mounted onto the tool holder, shifting the tool to steel side for a smaller tool offset would also lead to a larger portion of steel involved in the high-current-density regions, which are between the two electrodes. Higher resistivity of steel should accordingly generate a greater amount of Joule heating and temperature increment, which is not obvious in the measured results. This can be explained through the aspect of electro-plastic effect. A certain fraction of the external electrical energy will contribute directly to the material plastic deformation instead of heating. Comparing the results of electro-plastic effect from Andrawes et al. (2004) for Al 6061 with that from Liu et al. (2013) for TRIP steel, it can be seen that same current density can lead to more effective flow stress reduction for TRIP steel than Al 6061. The greater extent of direct electrical softening would therefore alleviate the heating from higher resistance and accounts for the same overall temperature increment under different tool offsets. This is consistent with the following welding force measurement results in which smaller tool offset can result in a larger amount of force reduction.
Figure 5 compares the axial welding force in conventional and electrically assisted FSW conditions under various welding parameters. The axial force can be observed to be reduced in all conditions, especially during the initial plunge stage. Furthermore, a greater amount of force reduction can be observed under lower rotational speed and smaller tool offset, which means a larger fraction of the external electrical energy can be applied for direct material softening instead of resistance heating. The reduced welding force for smaller tool offset also indicates the possibility of involving a greater amount of steel in the weld nugget without overheating aluminum, which is conceivably beneficial for enhancing joint quality.
Metallurgical samples of the joint cross section perpendicular to weld line were prepared for different welding conditions. For each welding condition, two cuts were made at the plunge and weld middle position respectively. Figure 6 shows SEM images of the Al-Fe interface on the cross sections at plunge position under a higher rotating speed of 1800 rpm. The top two figures represent results from a larger tool offset, and the right side shows electrically assisted conditions. It can be observed that when the tool is shifted more into aluminum, some locations of the Al-Fe interface in the plunge section show no sign of intermetallic compound (IMC) formation under conventional FSW conditions. On the other hand, the IMC layer can be consistently found after external current is applied.
According to Lee et al. (2009), a thin layer of IMC is important to guarantee joint strength, which indicates that the electrically assisted process can achieve improved joint quality. Under a smaller tool offset where a greater fraction of steel is involved in the nugget, a continuous IMC layer can be found for both conventional and hybrid processes, as shown in Figure 6 (c) and (d). On the other hand, it can be noticed in Figure 6 (d) that a thin strip of steel, which is still connected to the base material, is encompassed by an IMC layer in its surroundings. This feature is more pronounced at welding sections, which are shown in Figure 7. Micro-interlock features where steel and IMC are intermixed can be observed for the electrically assisted conditions. This micro-interlock feature is believed to be advantageous for joint strength, since crack propagation in the brittle IMC region can be effectively inhibited by the surrounding steel, which has a much higher ductility.
Future Plans
More accurate temperature distribution will be measured directly on the workpiece. A finite element model (FEM) that can describe dissimilar material behavior in the weld nugget will be established for both the plunge stage and stable welding stage. Mechanical welding force, temperature distribution, and material flow will be predicted based on the developed model. The model will then further incorporate the electrical field and quantify its effect
Figure 5. Axial force comparison under various
processing conditions.

CVC Project Fact Sheets Page 48 November 2014
through modification of material constitutive law, which can accordingly predict mechanical welding force and temperature profile for the electrically assisted FSW process.
Expected Outcomes
Governing equations for description of dissimilar material behavior in the weld zone
An FEM model that can predict welding force, temperature, and material flow during both FSW and electrically assisted FSW conditions
Figure 6. Comparison of Al-Fe interface at plunge position for
conventional and electrically assisted condition under rotating
speed of 1800 rpm: (a) Larger tool offset of 1.63mm and no
current; (b) Larger tool offset of 1.63mm and a total current
of 560A.
Figure 7. Comparison of Al-Fe interface in the weld section
for conventional and electrically assisted conditions under a
higher rotating speed of 1800 rpm: (a) larger tool offset of
1.63 mm and no current; (b) larger tool offset of 1.63 mm and
a total current of 560 A; (c) smaller tool offset of 1.03 mm and
no current; (d) smaller tool offset of 1.03 mm and a total
current of 560 A.
TRIP Steel
Al 6061
No current
Al 6061
TRIP SteelC560A
(a) (b)
No current C560A
TRIP Steel
TRIP Steel
Al 6061
Al 6061
(c) (d)
C560A
Al 6061
TRIP SteelNo current
Al 6061
TRIP Steel
No current
Al 6061
TRIP SteelC560A
Al 6061
TRIP Steel
C560A
(a)
(c)
(b)
(d)

CVC Project Fact Sheets Page 49 November 2014
Figure 1. Crash simulation of small
electric vehicle body using finite element
analysis.
Figure 2. Computationally identified
critical failure modes for stretch-
bending process. Left: shear fracture
on the tight radii. Right: accumulated
side wall fracture.
Multi-Material Lightweight Body Subsystem and
Vehicle Optimization Joint Project
Research Objective
The project is developing a methodology for economically integrating components made of lightweight materials in vehicle body structure with maximum weight reduction benefit. The materials under consideration are aluminum, magnesium, high-strength steels (HSSs) and ultra-high-strength steels (UHSSs), and composites.
Technical Approach
Determine deformation control and failure prevention strategy: exploration of innovative load paths, crash modes, and component layouts (Tsinghua University)
Predict assembly dimensional variations: modeling of lightweight material process variations (Shanghai Jiao Tong University)
Establish evaluation criteria for ease of manufacture and assembly: modeling of constraints for lightweight material processes (forming and joining) on part and joint geometry (University of Michigan)
Enable multi-material optimization of vehicle body (sub)systems: a simplified body-in-white of a mini electric vehicle (EV) and an extended A-pillar of a midsize vehicle (all partners)
Significant Results
The project team from Tsinghua University built a small EV model for crash analysis (see Figure 1) and studied the influence of battery and occupant mass distribution on crash responses. Results showed that change of the center of gravity location had great influence on vehicle pitch direction. The team also analyzed the influence of lightweight materials on vehicle crash safety.
Researchers from University of Michigan applied the computational data mining approach to identify and model the manufacturability constraint on lightweight material forming/joining processes. From the massive process simulation data, the team computationally identified two critical failure modes for stretch-bending of advanced HSS, one of which is comparable with the quality index (R/t ratio) of shear fracture investigated previously through laboratory experiment by the Shanghai Jiao Tong team
U.S. Research Team Lead Kazuhiro Saitou, University of Michigan
U.S. Partners University of Michigan
China Research Team Lead Qing Zhou, Tsinghua University
Dafeng Jin, Tsinghua University
Xinmin Lai, Shanghai Jiao Tong University
Zhigang Yang, Tongji University
China Partners Tsinghua University
Shanghai Jiao Tong University
Tongji University
Clean Vehicles Consortium Project 4.4

CVC Project Fact Sheets Page 50 November 2014
Figure 3. Impact of vehicle door guard
beam position on the deformation under
different temperatures.
(see Figure 2 – left). The other computationally identified failure mode, side wall accumulated fracture (see Figure 2 – right), is difficult by nature to capture empirically but was identified computationally through data mining.
To study the thermal deformation on lightweight vehicle bodies, researchers showed that a car door made of dissimilar materials underwent a greater deformation with temperature variation, and the door guard beam position had great impact on the deformation under different temperatures (see Figure 3).
Future Plans
In 2014, the team plans to (1) design for battery pack protection against car crashes, (2) identify battery damage tolerance under impact, (3) apply the computational DFM/DFA constraint modeling synthesis to the composite manufacturing application and a lightweight material joining process, and (4) incorporate the identified manufacturing/joining constraint to the multi-material optimization of the mini-EV.
Expected Outcomes
Architecture and material selection strategy for mini-EV crash safety, including the protection of batteries
Guidelines to reduce dimensional variations of multi-material assemblies due to variations in fixtures, joints, and environmental temperature
Optimization method for multi-material vehicle body subsystems, incorporating manufacturability and ease-of-assembly criteria

CVC Project Fact Sheets Page 51 November 2014
Hybrid Materials Interface Increased Strength
Method and Modeling Cooperative Project (U.S.)
Research Objective
The objectives are as follows:
To demonstrate a methodology for modeling the bonding of hybrid materials, such as composites and metals, with a focus on demonstrating its capability for design and capturing the effects of surface modification
To work with industry to implement an approach to evaluate and design hybrid joints for lightweight materials
Technical Approach
Identification of appropriate thermoset composites and metals and adhesives for bonding, and surface treatments
Identification of suitable bonded hybrid geometries to measure cohesive parameters in Mode-I and Mode-II conditions
Use of these cohesive parameters in a finite element model (FEM) to predict the behavior of validation geometries, and to compare these predictions to observations
Significant Results
We have established a procedure to use digital-image correlation (DIC) to measure shear and normal displacements along adhesively bonded interfaces.
We have made two different types of bonded geometries with which to study the Mode-I and Mode-II traction-separation laws: the double-cantilever-beam (DCB) and lap-shear (LS) geometry.
The traction-separation law can be found by measuring the crack-opening displacements as a function of the J-integral. For the DCB geometry, this is done by monitoring the load and rotation of the load point. For the LS geometry, this is done by evaluating the J-integral for the geometry as a function of load by FEM. The cohesive tractions are found by differentiating the J-integral with respect to the crack opening. An alternative approach is to measure the traction-separation curves directly. This requires knowledge that the adhesive layer is being loaded uniformly, which can be validated with DIC measurements.
The Mode-I and Mode-II traction-separation laws for the steel/ composite bonded hybrid system identified by Eaton is shown in Figure 2.
Future Plans
Unfortunately, the bonding protocol identified by the industrial sponsor, and used to produce the data above, did not produce uniform bonds. We have, therefore, had to modify this protocol to include glass beads to ensure a
U.S. Research Team Lead Michael Thouless, University of Michigan
U.S. Partners Peter Fritz (Eaton Corporation)
Clean Vehicles Consortium Project 4.5
Figure 1. DIC image of interface, showing the speckle
pattern used. The color gradient shows the (uniform)
shear displacements across the lap-shear’s interface.

CVC Project Fact Sheets Page 52 November 2014
Figure 2. Mode-I and Mode-II traction-separation
laws for a steel-Garolite composite system bonded by
Spabond. The Mode-I toughness is 150-350 J/m2 with a
peak stress of 5±2 MPa. The Mode-II peak stress was
determined to be 24±2 MPa. The variability of the
critical displacement results in a large range of Mode-
II toughness values between 900 and 2100 J/m2.
Figure 3. Bonded hybrid gear-shaft
assembly that will be analyzed as part of the
validation approach.
uniform bond. The techniques developed in 2013–2014 will be used to obtain new values for the adhesive, and for some new adhesives identified by the industrial sponsor.
Owing to the mode-mixedness of this system, we still need to determine the critical shear displacement required for the Mode-II traction-separation law. We plan to determine this by running lap-shear tests with longer ligaments, which are expected to have a smaller opening component at the crack-tip, thereby giving us a better lower bound of the critical shear displacement.
We will validate these values by incorporating them in an FEM model of some laboratory test geometries, and then use the values to predict the behavior of a hybrid system, such as the gear-shaft assembly shown in Figure 3.
We also plan to explore whether DIC approaches can be used to make direct measurements of the J-integral at the tip of a bonded crack, in geometries that would otherwise be difficult to evaluate.
Expected Outcomes
Demonstration of an effective numerical modeling method for hybrid lightweight structures
A methodology for determining suitable test configurations to evaluate different bonding/surface treatments for hybrid systems such as steel/thermoset composite structures

CVC Project Fact Sheets Page 53 November 2014
Vehicle–Grid System Modeling for Technology
Deployment Joint Project
Research Objective
The objective of this project is to assess the impact on the electric grid of a large-scale deployment of plug-in electric vehicles (PEVs). The project team will also develop a technology roadmap and policy recommendations for accelerating PEV deployment in the United States and China.
Technical Approach
Develop a comprehensive suite of PEV technology adoption, PEV driving, PEV charger location, PEV charging, and power system unit commitment and economic dispatch models
Use these models in an integrated fashion to examine how PEV adoption and use can affect power system economics, operations, reliability, and capacity planning
Capture demographic, socioeconomic, and spatial and social network impacts and associated clustering of PEVs and charging loads using the PEV technology adoption model
Use simulation techniques to model PEV driving and grid-connection behavior
Combine simulated PEV driving and charging demand profiles with power system operation models to study interactions between PEVs and the power system, the use of control, and other techniques and technologies to mitigate adverse effects
Use results of these modeling efforts to develop technology and policy roadmaps that are specially tailored to vehicle and power system markets in the United States and China
Significant Results
Work on this project is proceeding in four main areas. First, the project has developed a comprehensive optimization/simulation model to locate public PEV charging infrastructure within a metropolitan area. This provides useful decision-making tools for public entities and private enterprises planning PEV charging station deployments. This model accounts for actual driving behavior and its inherent randomness and determines where best to locate charging stations with fixed resource constraints. A case study, based on the central Ohio region, demonstrates the flexibility of this framework to capture different optimization criteria. The U.S. and China teams are collaborating to expand this work to endogenously capture PEV destination decision making based on charging station availability.
Second, researchers are using actual vehicle adoption data to develop and calibrate spatial econometric models of PEV adoption. Given the relatively small penetration of pure PEVs, other advanced-technology vehicles (e.g., turbodiesels) and hybrid electric vehicles (HEVs) are being used as proxies for PEV adoption. Testing using census tract-level HEV adoption data for the state of Ohio shows strong spatial correlation in adoption patterns. Modeling and predicting the location of PEV owners is important for utility distribution infrastructure planning, given the new
U.S. Research Team Lead Ramteen Sioshansi, The Ohio State University
Ian Hiskens, University of Michigan
U.S. Partners The Ohio State University
University of Michigan
Eaton Corporation
PJM Interconnection
China Research Team Lead Hongbin Sun, Tsinghua University
Qinlai Guo, Tsinghua University
China Partners Tsinghua University
Beijing Institute of Technology
Clean Vehicles Consortium Project 5.2

CVC Project Fact Sheets Page 54 November 2014
loads that these vehicles impose on distribution feeders and transformers. These models can also be useful to firms marketing PEVs and other advanced vehicle technologies.
Third, the project team is exploring the use of price-based schemes to control PEV charging in a decentralized manner. The purpose of these control schemes is to coordinate PEV charging with power system operations. PEV economics can be substantively improved if PEVs charge at the “correct” time, when excess generating capacity is available. Moreover, PEVs can also provide an added source of demand flexibility to aid the integration of variable renewable resources, such as wind and solar. This work focuses on using iterative price-update schemes to efficiently guide PEV owners and load aggregators to charge vehicles at times that are mutually beneficial to the power system and PEV owners. These control schemes will also be refined to ensure algorithmic efficiency (i.e., PEVs converge to a desirable charging profile with minimal communication overhead required between vehicle owners and the electric utility).
Finally, the project team is studying the impacts of high-power public charging infrastructure (e.g., DC fast charging) on the distribution system. This includes the effects of spatially and temporally clustered PEV charging loads on transformers and other electrical equipment. This work will also study the use of control techniques and distributed resources, including distributed generation and storage, to mitigate the negative distribution-level impacts of high-power PEV charging.
Future Plans
Future work will focus on developing PEV swarm models to fully simulate the distribution- and bulk-power-system-level impacts of large PEV fleets. These models will highlight benefits and potential risks of large-scale PEV adoption. Based on these findings, technology and policy recommendations to mitigate any adverse impacts will be made. Policy recommendations will also be made for development and deployment of PEV technologies and related infrastructures in the United States and China.
Expected Outcomes
A flexible model to optimize the location of public charging infrastructure in different regions and with different optimization criteria and resource constraints
PEV adoption models that capture the effects of demographics, socioeconomics, and social and geographic spatial networks
Models and tools to analyze PEV impacts on the electric grid, at both the local distribution and bulk power system levels
Models and tools to study the benefits of different techniques and technologies in reducing the negative power system impacts of PEV charging
Policy recommendations for cohesive development and deployment of PEV technologies and related infrastructure in the United States and China
Optimized control strategies for vehicle–electric grid interactions, including centralized and market-based approaches
Figure 1. PEV charging infrastructure location
optimization model results for central Ohio.

CVC Project Fact Sheets Page 55 November 2014
Figure 2. Transformer temperature, PEV load, and
background load. The AIMD algorithm successfully
maintains a temperature with acceptable levels, while
the background load retains uninterrupted service.
Control Strategies for Vehicle-Grid Integration Joint Project
Research Objective
The project seeks to develop control strategies that mitigate distribution-level issues associated with high penetration of plug-in electric vehicles (PEVs) and that allow PEVs to provide operational services to the wider grid. A range of operational services are being considered, including peak reduction, regulation, spinning reserve, and the use of load to track variability in renewable generation.
Technical Approach
Define expected impact of PEV population charging at the distribution level
Extend distributed control strategies previously used in network congestion control to solve PEV overcharging challenges
Simulate a distribution grid environment and test the ability of algorithms to mitigate detrimental impacts of PEV charging
Significant Results
Previous work focused on developing distributed control algorithms to manage total PEV charging load at the distribution level, as well as the design and construction of a testbed utilizing wireless communication to physically verify these results. Since then, efforts have focused primarily on defining an accurate distribution system environment, and analyzing the broader voltage and current effects that PEVs have within this network.
Central to this thrust was the design of a distribution grid based on the IEEE-34 node network, which models a long, lightly-loaded feeder. The simulated circuit features a full three-phase power flow based on the DistFlow equations, and models individual pole-top
transformers as 25 kVA units, each servicing a randomized portion of the total load at each node. PEVs are attached to the transformers and charge in a manner typical of commuter driving patterns. Voltage regulating equipment, including capacitor banks and regulators, are also modeled within the network.
Having designed and coded this circuit, the next step was to analyze the voltage and current dynamics of the distribution network, and to assess whether thermal runaway on the transformers could be avoided. Using a series of Monte-Carlo
U.S. Research Team Lead Ian Hiskens, University of Michigan
U.S. Partners University of Michigan
China Research Team Lead Hongbin Sun, Tsinghua University
Qinglai Guo, Tsinghua University
China Partners Tsinghua University
Clean Vehicles Consortium Project 5.3
Figure 1. The additive-increase multiplicative-
decrease algorithm, one of several distributed
control methodologies used to manage PEV
charging.

CVC Project Fact Sheets Page 56 November 2014
simulations, the worst case scenarios were assessed as occuring when a large number of PEVs was attached to a transformer with significant background load. Even in these instances, however, transformer temperature was successfully constrained below the threshold value by the distributed charging algorithm. Furthermore, the variability in the voltage profile due to this control strategy was minor when compared to other switching phenomena endemic to the network. Thus, control was maintained with minimal system interference.
These ideas have recently been extended to larger vehicle populations—which are capable of providing transmission-level services, such as frequency regulation, to the grid—but must still adhere to the lower-level distribution dynamics identified previously. Ongoing efforts have focused on ways to ensure transformer health at the local level while introducing a minimum of disturbances to fleet-level power tracking.
Future Plans
The plan is to extend our ongoing work on PEV populations tracking a wind signal, and possibly a full grid-level frequency regulation signal, to achieve better performance and reduced error between the broadcast signal and the fleet’s aggregate power response. To achieve this, the optimal fleet behavior will be defined in terms of distributed control actions. Furthermore, the penalty of ensuring distribution-level protections while providing transmission-level tracking will be quantified in terms of lost capacity and delayed response. Poincare maps will also be used to assess fundamental limits on the type of service that can be provided.
Expected Outcomes
Distribution-level control of PEV charging
Control strategies for grid operational services
Coordination of PEV charging with renewable generation
Decentralized control strategies for PEV charging
An understanding of the impact of non-ideal communications networks and computational limitations on the coordination of PEV charging loads
Figure 3. Voltage dynamics at a sample network node.
The oscillatory behavior related to AIMD is
significantly reduced by the geographic disparity of
PEVs within the power system.
Figure 4. A simulation of a large population of PEVs
attempting to track a wind signal while maintaining the
lower-level system constraints identified in earlier
studies.

CVC Project Fact Sheets Page 57 November 2014
A Wireless Magnetic-Resonance Power
Transmission System for EV Charging Cooperative Project (U.S.)
Research Objective
The overarching objective of the project is to develop a theoretical framework and technologies enabling efficient and low-cost wireless battery charging of EVs and PHEVs using wireless magnetic-resonance power transfer theory. Specific objectives include the following:
Analyze the resonant condition or near-resonant condition (frequency bandwidth); perform theoretical analysis of maximum power transfer and maximum efficiency between the transmitter and the receiver, detailing the requirements and constraints of distance, power, geometry, and lateral and angular misalignments
Develop analytical methods based on S parameters (including the Smith chart) for the two-port network to calculate the key parameters, such as the maximum efficiency, the coupling coefficient, the power quality factor Q, the coil’s self-inductance and mutual inductance, the radiation resistance, and the Ohmic resistance
Develop an analytical model based on C++ or Matlab and numerical models based on finite element method (FEM) to verify correctness of the proposed methods
Perform analytical analysis on the effects of a finite conducting body on the charger; perform FEM simulations in the presence of finite conducting bodies to verify the analysis and explore more complex geometries found in an automotive environment
Construct the coils based on the analytical analysis and simulation results, and design the control and energy conversion systems; develop a hardware prototype with a corresponding co-FEM simulation model to verify the key aspects of the analysis
Build a hardware prototype for placement in an automotive environment to test the performance
Develop an algorithm for object detection between the source and the receiver coils for practical study
Evaluate the magnetic field levels using published IEEE/SAE standards as a function of frequency and its impact on the human body
Technical Approach
The wireless power transmission (WPT) technology has solid theoretical support in physics, and the basic concepts have been successfully proven by both the literature and the PI’s preliminary experiments. But the inductive WPT charger has several disadvantages. Because of the large air gap between the primary and secondary windings, WPT transformers have large leakage inductances and small mutual inductances, which leads to the weak coupling between transmitting and receiving coils. Weak coupling can result in poor transmission performance, low efficiency, and high resistive heating. Some researchers have proposed combining the physical resonance and the inductive WPT, which owns the merits of the inductive method but without the disadvantages. The PI believes that turning the significant resonant discovery in physics into a working WPT charger, called magnetic-resonance WPT, will have a strong impact not only on EV battery charging but also on a variety of other electronic devices. The goals of this project include:
Literature review, initial design and construction
Numerical program development and verification
Proposed FEM-BEM simulation program for system performance study
U.S. Research Team Lead Chris Mi, University of Michigan–Dearborn
U.S. Partners DENSO International
China Partners Mia Motors, LLC
Clean Vehicles Consortium Project 5.4

CVC Project Fact Sheets Page 58 November 2014
System co-simulation study, refined design and construction
EMI evaluation based on FEM simulation and measurements
System evaluation using EV battery model and publications
Objective detection
Significant Results
A double-sided LCC resonance topology has been developed. Two patents have been filed. With the proposed topology and its tuning method, the resonant frequency is irrelevant with the coupling coefficient between the two coils, and is also independent of the load condition. This means that the system can work at a constant switching frequency. Analysis in frequency domain is given to show the characteristics of the proposed method. We also propose a method to tune the network to realize zero voltage switching (ZVS) for the primary side switches. Simulation and experimental results verified analysis and validity of the proposed compensation network and the tuning method. A wireless charging system with up to 7.7 kW output power for electric vehicles was built, and 96% efficiency from DC power source to battery load was achieved, as well as system efficiency above 93% efficiency from AC plug to battery.
Figure 1. Complete wireless EV charger with the double-sided LCC topology, segmented coils, and multiphase interleaved power
factor correction.
Figure 2. Double sided LCC Topology for the wireless charger.
L1
Lf2
Lf1
L1
L2
Ferrites
Aluminum
Shield
X
Y
Lf1
C1
Cf1
L1
Lf2
Lf1
L1
L2
Ferrites
Aluminum
Shield
X
Y
Lf1
C1
Cf1
Figure 3. Segmented transmitting
and receiving coil with bipolar
structure.

CVC Project Fact Sheets Page 59 November 2014
Figure 4. Measured system efficiency (from AC plug to battery).
Future Plans
Future work will focus on the following:
Commercialize proposed wireless charging technology
Work with DENSO and Ford to develop a vehicle-level demonstration of a 3.3 kW or 6.6 kW wireless charger
Develop foreign object detection method based on multiple approaches, such as temperature detection, infrared camera, phase detection and others
Study the safety and electromagnetic emissions of the proposed system
Develop communication methods for the information exchange between the primary and secondary coils
Optimize the coil design and efficiency to satisfy the new SAE standard to be released in 2014
Develop workshops, seminars, short courses, tutorials, e-learning modules, and publications to publicize the technology
Expected Outcomes
The output of the project will include the detailed theory, analytical models, and simulation models, design validation tools, control algorithms, laboratory experiments, measurement prototypes, and a vehicle testing platform. The PI will work closely with the industry partner to make sure the models and tools developed are compatible with the tools used within the industry. The models will be delivered to the industry partner and will be incorporated into the current HEV and PHEV charging design and modeling platforms.

CVC Project Fact Sheets Page 60 November 2014
Life Cycle Assessment of Wireless Charging of
Electric Vehicles Joint Project
Research Objective
The project seeks to compare the energy, environmental, and economic performance of wireless charging to plug-in charging for electric vehicles using life cycle assessment methods. The project team assesses the tradeoffs of wireless charging, including potential lightweighting benefits from battery size reduction for fixed-route vehicles, such as transit buses, and potential increased burdens from infrastructure.
Technical Approach
Conduct life cycle inventory analysis of both wired and wireless charging hardware
Create life cycle models to assess the environmental, energy, and economic trade-offs of infrastructure installation versus subsequent use-phase savings
Use the Ann Arbor Transit Authority (AATA) bus system as a case study to evaluate the lightweighting benefits of wireless charging, including the fuel economy improvement induced by battery size reduction
Develop a method to quantify the battery size reduction due to the fact that wireless charged buses could be charged frequently during daily operation; quantify the resulting fuel economy improvement
Conduct a life cycle cost analysis to determine financial performance of each charging method
Significant Results
Results show that the wirelessly charged battery can be downsized to 27%–44% of a plug-in charged battery. The associated reduction of 12%–16% in bus weight for wireless buses can induce a reduction of 5.4%–7.0% in battery-to-wheel energy consumption.
U.S. Research Team Lead PI: Gregory Keoleian (UM)
Research specialist: Robb De Kleine (UM)
Graduate student: Zicheng (Kevin) Bi (UM)
U.S. Partners UM Dearborn (Chris Mi)
Ford Motor Company
Delphi Automotive
China Partners Visiting scholar: Lingjun Song (Beihang University)
Clean Vehicles Consortium Project 6.1
Daily Mileage Traveled (miles)
Overcharge Safety Margin (Plug-in Charged Battery)
No Operation Region (Plug-in Charged Battery)
(poor efficiency & performance and shorten life)
Full charge
No charge
Start of
Day
End of
Daily Duty
(1)
(4)
(3)
(2)(5)
Plug-in Charged
Battery Depleting
Slope (k1)
Wirelessly Charged
Battery Depleting
Slope (k2)
Electricity Charged at a Bus
Stop with Charging
Availability (ei)
Hidden Multiple
Charges During
the Day
Sta
te o
f C
harg
e (S
OC
) of
Plu
g-i
n C
harg
ed B
att
ery
(con
ver
ted
to t
he
un
it o
f k
Wh
)
Reserved Storage Capacity (Plug-in Charged Battery)
Figure 1. Battery downsizing calculation. Start from a plug-in charged
battery to quantify the minimum electricity needed at start of day for a
wirelessly charged battery. (1) Operating region (kWh) of plug-in charged
battery; (2) primary capacity reduction (kWh) due to wireless charging
availability; (3) secondary capacity reduction (kWh) due to fuel economy
improvement; (4) minimum electricity needed (kWh) at start of day for a
wirelessly charged battery (not yet including its own overcharge safety
margin, reserved storage capacity and no-operation region); (5) daily
energy saving (battery-to-wheel) due to wireless charging (kWh).
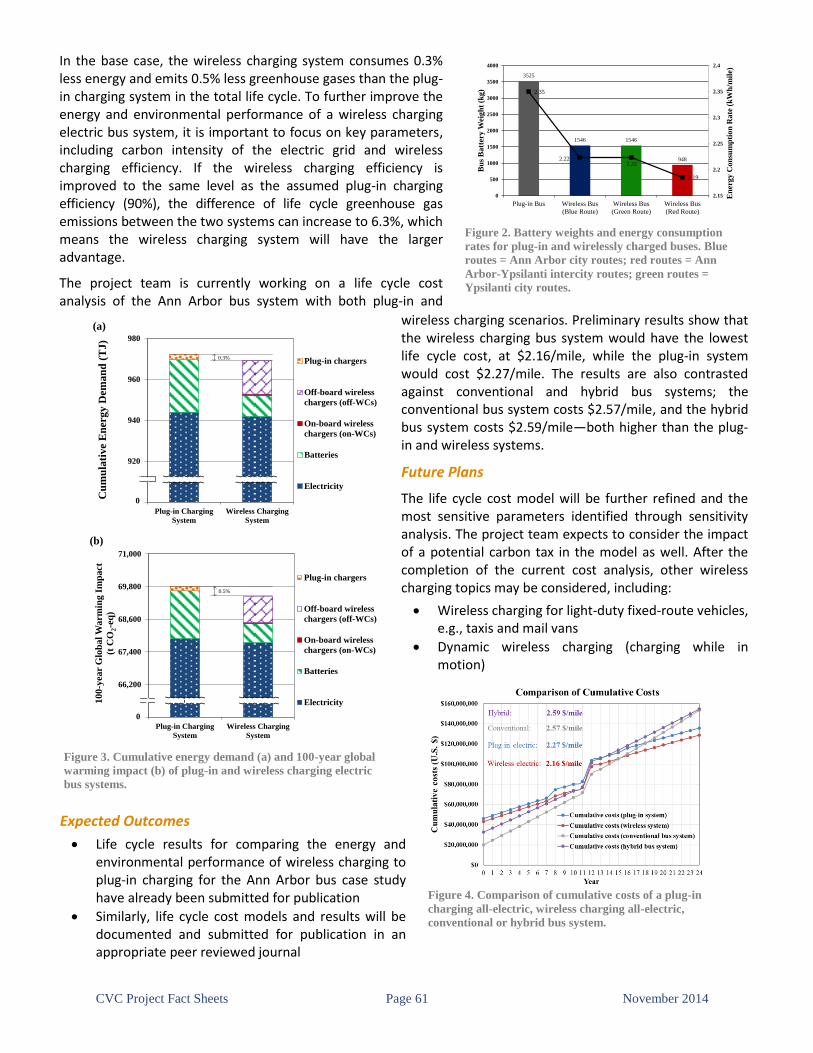
CVC Project Fact Sheets Page 61 November 2014
3525
1546 1546
948
2.35
2.222.22
2.19
2.15
2.2
2.25
2.3
2.35
2.4
0
500
1000
1500
2000
2500
3000
3500
4000
Plug-in Bus Wireless Bus
(Blue Route)
Wireless Bus
(Green Route)
Wireless Bus
(Red Route)
En
erg
y C
on
sum
pti
on
Ra
te (
kW
h/m
ile)
Bu
s B
att
ery
Wei
gh
t (k
g)
Figure 2. Battery weights and energy consumption
rates for plug-in and wirelessly charged buses. Blue
routes = Ann Arbor city routes; red routes = Ann
Arbor-Ypsilanti intercity routes; green routes =
Ypsilanti city routes.
900
920
940
960
980
Plug-in Charging
System
Wireless Charging
System
Cu
mu
lati
ve
En
erg
y D
ema
nd
(T
J)
(a)
Plug-in chargers
Off-board wireless
chargers (off-WCs)
On-board wireless
chargers (on-WCs)
Batteries
Electricity
65,000
66,200
67,400
68,600
69,800
71,000
Plug-in Charging
System
Wireless Charging
System
10
0-y
ear
Glo
bal
Warm
ing I
mp
act
(t C
O2-e
q)
(b)
Plug-in chargers
Off-board wireless
chargers (off-WCs)
On-board wireless
chargers (on-WCs)
Batteries
Electricity
0
0.3%
0
0.5%
Figure 3. Cumulative energy demand (a) and 100-year global
warming impact (b) of plug-in and wireless charging electric
bus systems.
Figure 4. Comparison of cumulative costs of a plug-in
charging all-electric, wireless charging all-electric,
conventional or hybrid bus system.
In the base case, the wireless charging system consumes 0.3% less energy and emits 0.5% less greenhouse gases than the plug-in charging system in the total life cycle. To further improve the energy and environmental performance of a wireless charging electric bus system, it is important to focus on key parameters, including carbon intensity of the electric grid and wireless charging efficiency. If the wireless charging efficiency is improved to the same level as the assumed plug-in charging efficiency (90%), the difference of life cycle greenhouse gas emissions between the two systems can increase to 6.3%, which means the wireless charging system will have the larger advantage.
The project team is currently working on a life cycle cost analysis of the Ann Arbor bus system with both plug-in and
wireless charging scenarios. Preliminary results show that the wireless charging bus system would have the lowest life cycle cost, at $2.16/mile, while the plug-in system would cost $2.27/mile. The results are also contrasted against conventional and hybrid bus systems; the conventional bus system costs $2.57/mile, and the hybrid bus system costs $2.59/mile—both higher than the plug-in and wireless systems.
Future Plans
The life cycle cost model will be further refined and the most sensitive parameters identified through sensitivity analysis. The project team expects to consider the impact of a potential carbon tax in the model as well. After the completion of the current cost analysis, other wireless charging topics may be considered, including:
Wireless charging for light-duty fixed-route vehicles, e.g., taxis and mail vans
Dynamic wireless charging (charging while in motion)
Expected Outcomes
Life cycle results for comparing the energy and environmental performance of wireless charging to plug-in charging for the Ann Arbor bus case study have already been submitted for publication
Similarly, life cycle cost models and results will be documented and submitted for publication in an appropriate peer reviewed journal

CVC Project Fact Sheets Page 62 November 2014
Figure 2. Optimized state-level water consumption and water flows
embodied in interstate trade of alternative fuels. Size and color of
circles indicate the amount of water consumption related to
producing designated fuels, including fuels consumed within the
states and those transported to other states. Lines go clockwise from
states producing to states consuming designated fuels. Line color
indicates the amount of water embodied in interstate trade of fuels.
Fuel Mix Strategies and Constraints Cooperative Project (U.S.)
Research Objective
The objective of this project is to assess the feasibility of alternative vehicle fueling, including biofuels and electricity, for meeting significant penetration of clean vehicles (CVs). This project will highlight critical resource availability and infrastructure constraints for both biofuels and electricity generation. This project will be complemented by activities that will address grid control and resilience in Thrust 6.
Technical Approach
Conduct a national assessment to understand resource constraints and competition with demands from other sectors (agriculture, urban, industrial activities, etc.)
Complete a regional analysis to develop optimized strategies to maximize the reduction of greenhouse gas (GHG) emissions and fossil fuel use, given the resource constraints
Conduct an assessment of the feasibility and opportunities for large-scale penetration of CV and fuel technologies
Understand the impact of real-world driving patterns on CV penetration, and that of electric vehicles in particular, based on different consumer responses to cost and range limitations
Apply the modeling framework to China
Significant Results
At the national level, based on existing policies, transitioning the current gasoline-based transportation into one with CVs will increase national annual water consumption by 1,950–2,810 billion gallons of water, or 1.5%–2.2%, depending on the market penetration of electric vehicles (Figure 1).
At the regional level, variances of water efficiency in producing different fuels are significant. Using an optimization approach to further evaluate impacts on regional water stress from a fully implemented CV system, we were able to identify potential roles (fuel producer or consumer) states may play in a real-world CV development scenario (Figure 2). This analysis has been submitted to Applied Energy.
U.S. Research Team Lead Dawn Manley, Sandia National Laboratories
Ming Xu, University of Michigan
U.S. Partners Sandia National Laboratories
University of Michigan
Clean Vehicles Consortium Project 6.2
Figure 1. Projected additional water consumption due to CV
deployment. Degree of electrification refers to the percentage of
remaining travel demand (after applying biofuels mandated by
RFS2) that is fulfilled by electric vehicles (the rest by gasoline).

CVC Project Fact Sheets Page 63 November 2014
Figure 3. The Renewable Fuel Standard biofuels mandate by
year. Figure from Schnepf and Yacobucci, Renewable Fuel
Standard (RFS): Overview and Issues. Congressional Research
Service (2012).
Figure 4. RFS2 can be satisfied at extreme values for oil and biomass, which make gasoline very expensive and biofuels very
inexpensive. Longer term, the conditions that encourage biofuel demand also encourage other alternative vehicles and fuels, and thus
biofuel demand decreases.
To complement the assessment of water utilization, researchers assessed the feasibility of the U.S. light-duty vehicle (LDV) park to consume biofuels prescribed by the modified Renewable Fuel Standard (RFS2). RFS2 prescribes the annual volume of biofuels to be used in the transportation sector through 2022 (Figure 3).
Sensitivity analyses indicate that the fuel price differential between gasoline and ethanol blendstocks, such as E85, is the principal factor in LDV biofuel consumption. The number of flex fuel vehicles and biofuel refueling stations will grow given a favorable price differential relative to petroleum. However, when considering the longer-term implications beyond 2022 shown in Figure 4, the extreme oil prices that make biofuels favorable in the near term also encourage use of other alternative powertrains, such as NGVs and EVs, and thus do not sustain high quantities of biofuel consumption. This analysis has been published in Energy Policy (Westbrook et al., 2014).
In addition to examining biofuels in competition with other alternatives, researchers considered the potential impact of range penalties, infrastructure availability, and recharge time on battery electric vehicle (BEV) adoption using driving distributions that represent real-world data. The assessment considered the difference in adoption based on representing penalties as cost versus thresholds for frequency of inconvenience for insufficient range. As shown in Figure 5, the relative impact of a cost penalty, requiring rental of an alternative, and availability of another household vehicle on days of inconvenience had an impact on the magnitude of BEV adoption. This work has been submitted to the Journal of the Transportation Research Board (Barter et al., 2014).
Publications
J. Westbrook, G.E. Barter, D.K. Manley, T.H. West, “A parametric analysis of future ethanol use in the light-duty transportation sector: Can the US meet its Renewable Fuel Standard goals without an enforcement mechanism?” Energy Policy, 65, 419-431 (2014)
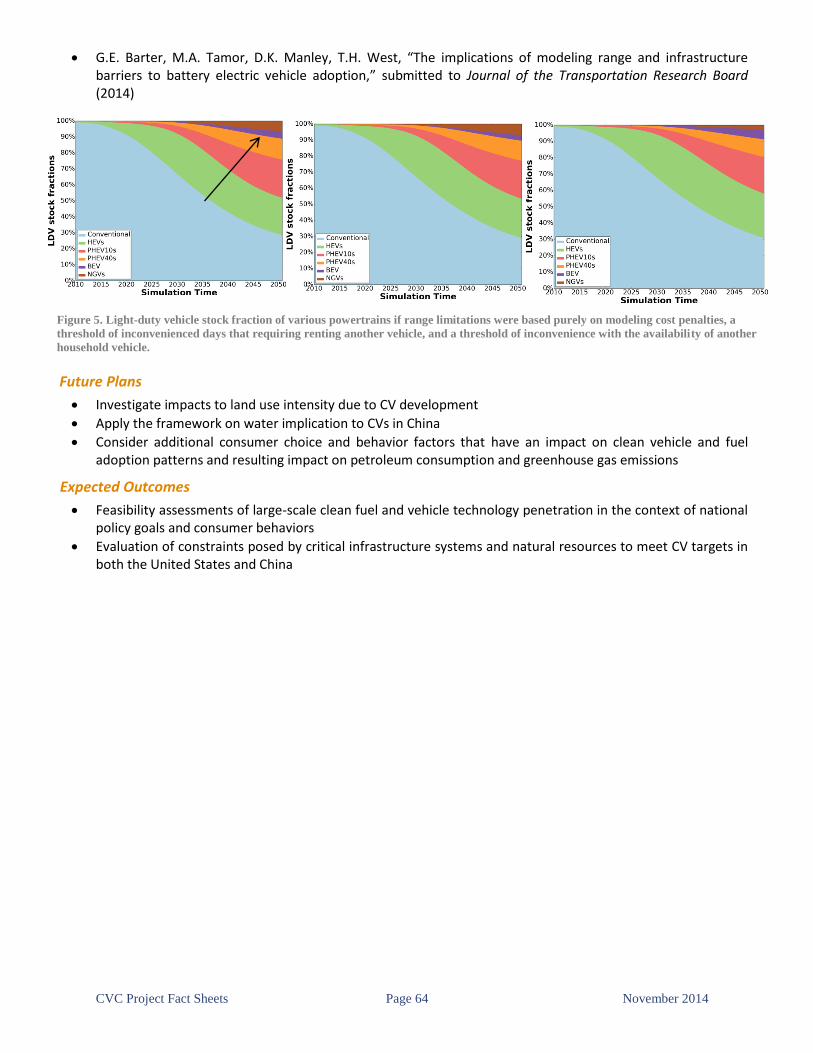
CVC Project Fact Sheets Page 64 November 2014
G.E. Barter, M.A. Tamor, D.K. Manley, T.H. West, “The implications of modeling range and infrastructure barriers to battery electric vehicle adoption,” submitted to Journal of the Transportation Research Board (2014)
Future Plans
Investigate impacts to land use intensity due to CV development
Apply the framework on water implication to CVs in China
Consider additional consumer choice and behavior factors that have an impact on clean vehicle and fuel adoption patterns and resulting impact on petroleum consumption and greenhouse gas emissions
Expected Outcomes
Feasibility assessments of large-scale clean fuel and vehicle technology penetration in the context of national policy goals and consumer behaviors
Evaluation of constraints posed by critical infrastructure systems and natural resources to meet CV targets in both the United States and China
Figure 5. Light-duty vehicle stock fraction of various powertrains if range limitations were based purely on modeling cost penalties, a
threshold of inconvenienced days that requiring renting another vehicle, and a threshold of inconvenience with the availability of another
household vehicle.

CVC Project Fact Sheets Page 65 November 2014
Figure 1. Comparison of energy usage among three models with similar FC assumptions.
Fleet Modeling on China’s Electric Vehicle
Development Joint Project
Research Objective
This project will use a Fleet model to forecast and analyze the different scenarios of electric vehicle (EV) penetration in China’s in-use vehicle fleet, measuring their impacts on reducing energy consumption and CO2 emissions. The CO2 emission impact is measured by forecasting the electric utilities’ expansion and assessing how much greener the electric grid would become in China. This project also conducts a comparison of different forecasting models. Researchers will be able to use the model and results from this project to determine under what scenarios EV development would a make a substantial environmental impact.
Technical Approach
Modify the existing Chinese Fleet model to include various detailed assumptions of EV growth in China; collect data on historical sales and mileage traveled (compared to conventional vehicles) for electric vehicles, including battery electric vehicles (BEVs), plug-in hybrid electric vehicles (PHEVs), and hybrid electric vehicles (HEVs)
Build a utility capacity expansion model to forecast the energy mix in China; if enough information can be extracted from literature reviews, then literature data will be used
Compare three types of forecasting models by breaking down the underlying logic and assumptions and comparing whether the model results are robust to their input assumptions
U.S. Research Team Lead John Heywood, Massachusetts Institute of
Technology
U.S. Partners Massachusetts Institute of Technology
University of Michigan
Argonne National Laboratory
Oak Ridge National Laboratory
China Research Team Lead Hong Huo, Tsinghua University
Hewu Wang, Tsinghua University
Jiuyu Du, Tsinghua University
Xunming Ou, Tsinghua University
China Partners Tsinghua University
China Automotive Technology Research Center
Clean Vehicles Consortium Project 6.4.1

CVC Project Fact Sheets Page 66 November 2014
Figure 2. The share of different powertrain technologies to total LDPV
sales market under four difference scenario designs, 2010–2030.
Significant Results
From the comparison analysis, it has been found that the fuel consumption (FC) factor is one of the most important assumptions that drive models’ energy usage results. Figure 1 shows that after the fuel consumption input factor for the EPPA model is adjusted to assemble the factor for the other two models, its outcome (the energy usage curve) collides with the other models’ outcome curves.
Literature reviews highlight this forecast of electric vehicle development scenarios in China (Figure 2, Wu et al.). The assumption of continued governmental support of BEVs and PHEVs plays a big role in the projection of the shape of the curves. But the inconvenience of charging and lack of infrastructure are critical barriers to the adoption of electric vehicles.
Future Plans
In the upcoming year, the following activities will be conducted:
Generate more detailed and realistic EV penetration scenarios by rigorously collecting data on EV technology characteristics, EV sales and mileage, MPG, and government policies for EV support
Conduct interviews and collect data on historical energy generation/usage from hydro power plants, PVs, wind power plants, and thermal power plants; forecast energy demand for the grid, and use the cost-optimization capacity expansion model to forecast the energy mix in China
Apply the capacity expansion model for six separate power grids in China to generate the total forecasts
Explore the interactions between EVs and the electric power systems; if time permits, assume a big EV penetration will change the curves of the hourly load profiles of the grid through both charging and providing storage for the grid; then analyze the impact on energy usage and CO2 emissions
Expected Outcomes
Comparison study of the three different forecasting models (complete)
Data analysis and a Fleet model that is able to generate different scenarios for EV penetration for light-duty transportation in China (in progress)
Scenario analysis on different levels of EV penetrations in the fleet, and how they affect energy usage and CO2 emissions (in progress)
Data analysis and a cost-optimization electric capacity expansion model that forecasts the energy mix of power grids in China (in progress)
Policy implications on how government support for EV should be conducted to bring the best impact/outcome on reducing energy usage and CO2 emissions (in progress)

CVC Project Fact Sheets Page 67 November 2014
Energy Systems Analysis, Technology Roadmaps
and Policy Cooperative Project (U.S.)
Research Objective
The project team is evaluating and identifying combinations of clean vehicle-fuel system (CVFS) technologies and deployment rates for achieving national energy and greenhouse gas (GHG) goals under varying assumptions regarding technology maturation and market growth. The team is conducting fundamental systems analysis and developing new modeling tools as needed for this effort; implications for clean vehicle technology roadmaps will be described, and policy recommendations will be identified.
Technical Approach
Review existing literature on clean vehicle and fuel technology assessment, roadmapping and policy
Identify major areas of uncertainty associated with existing CVFS systems analysis methodologies and compare them to other scientific methods applicable to transportation sector technology assessment, roadmapping and policy analysis
Develop new analytic frameworks based on fundamental energy and GHG emission relationships for the automobile sector
Use these frameworks to develop roadmapping models, and apply the models using available data on clean vehicle technologies and market parameters for the United States and China
Recommend improved methods for CVFS analysis and define new modeling and empirical evaluation approaches accordingly
Identify the implications of the improved methods for public policy and technology roadmapping
Significant Results
A number of substantive outcomes were achieved over the past three years as a result of the research conducted as part of this project. Key findings are summarized in three peer-reviewed publications resulting from the work:
Factoring the Car-Climate Challenge [1]
Biofuels' Carbon Balance [2]
The Liquid Carbon Challenge [3]
Full citations are given in the References section of this document. Results of the work have also been presented at conferences, through invited seminars and in private briefings at the U.S. Department of Energy and other organizations. Some of the work has also been covered by the media and summarized in both peer-reviewed and invited online publications.
Initial work on the project included literature review and critical analysis of existing systems analysis and roadmapping methods and findings. This review identified an opportunity to deconstruct established "well-to-wheel" scenario analysis methods into more fundamental factors that represent the underlying drivers of energy use and emissions from motor vehicles. Initial review and modeling work, utilizing aggregate data for automotive sectors in both the United States and China, was reported in a working paper titled "Mapping the Clean Vehicle Solution Space," a draft of which was circulated to the CERC-CVC community as well as other interested researchers in academia and industry in March 2012. Comments on this paper were received and addressed, resulting in a
U.S. Research Team Lead John DeCicco, University of Michigan
U.S. Partners University of Michigan
Clean Vehicles Consortium Project 6.4.2

CVC Project Fact Sheets Page 68 November 2014
journal-length version that was submitted to Energy Policy and subsequently accepted, resulting in publication as the "Factoring the Car-Climate Challenge" paper noted above [1].
That paper takes a fresh look at technology pathways with implications for roadmapping and climate policy by applying a version of the IPAT ("Impact = Population x Affluence x Technology") equation adapted for the automobile. Also known as the "three-legged stool" decomposition of motor vehicle emissions, it represents the total CO2 (or CO2-equivalent GHG) emissions (C) of any population of vehicles as a product of three factors: travel demand (D), vehicle energy intensity (E), and fuel system carbon impact (F), the latter being the factor often characterized as fuel "carbon intensity" using lifecycle analysis (LCA) methods. This framework enables an abstract representation of the solution space (targeted reductions in GHG emissions) for various CVFSs in a manner that is independent of the particular technologies used.
Normalizing the factors to baseline data for current systems enables technology combinations that can meet a given GHG reduction target to be depicted as level curves in the solution space. Such an analysis is shown in Figures 1 and 2, representing results for the United States and China, respectively. An implication is that for likely levels of improved vehicle efficiency (regardless of the type of powertrain, combustion or electric, and fuel, liquid or electricity), a substantial degree of reduction is needed in the net GHG impact of the fuel supply system. Moreover, the degree of reduction in fuel system GHG impact is similar for both the United States and China in spite of the very different levels of growth in travel demand and different GHG reduction expectations.
Given the importance of fuel system GHG impact, the next phase of work in this project entailed a fundamental systems analysis of this aspect of the clean vehicle challenge. A further reason to focus on an analysis of fuel systems is the very large uncertainty incurred when using LCA methods to address fuel system GHG impact. The literature reveals widely varying results even for existing fuels, and the uncertainties in LCA results are especially large for biofuels. Previous work had shown that attributional LCA methods (used as the foundation for the GREET model, for example) are scientifically irreducible for biomass-based fuel supply systems of any significant commercial scale (as opposed to idealized or laboratory-scale systems for which the spatial and temporal boundaries can be sufficiently constrained). Therefore, given the critical importance of fuels for clean vehicles and the limitations of existing systems analysis and roadmapping methods, new work was done to examine the issue on the basis of scientific fundamentals. Because biofuels involve both positive and negative carbon flows with respect to the atmosphere and can engage terrestrial carbon stocks in the biosphere, a biogeochemical stock-and-flow framework is necessary for correct analysis.
An extensive literature review as well as study of the carbon cycle was conducted, resulting in the development of a conceptually simple but scientifically rigorous model of the carbon flows for a coupled bio- and fossil fuel supply system for liquid motor fuels. This model is graphically depicted in Figure 3. The analysis was submitted to a leading
Figure 2. Normalized factor analysis for the Chinese automotive
sector.
Figure 1. Normalized factor analysis for the U.S. automotive
sector.

CVC Project Fact Sheets Page 69 November 2014
climate science journal, Climatic Change, for peer review. The resulting publication, "Biofuels Carbon Balance" [2], explains the terminology used in this figure, the associated equations and analysis, the results and implications.
The key finding is that the threshold condition for any biofuel to have a potential GHG mitigation benefit is that the production of its feedstock must result in an increase in net ecosystem production (NEP). NEP is a biogeochemical metric that refers to the net rate at which carbon is fixed over a given area of land (such as a farm field, plantation, geographic region, nation, or the globe, depending on the necessary scope of analysis). An implication of this finding is that biofuels derived from feedstocks taken from lands already in
production are unlikely meet this threshold test. That in turn implies GHG emission impacts substantially greater than those calculated using GREET and other LCA models. Thus, this new work suggests the need for extensive re-analysis of all biofuel pathways, both current and prospective (such as for cellulosic fuels), and likely revisions of both public policies and R&D priorities accordingly. These results were presented at the CERC-CVC Annual Meeting of August 2014; both the paper and the presentation are available via the CERC-CVC internal website.
For any clean vehicle systems that utilize carbon-based liquid fuels (regardless of their origin), both the "Factoring" paper [1] and the "Biofuels Carbon Balance" paper [2] underscore the importance of an upstream focus for systems analysis, empirical work and R&D. The findings apply to roadmapping and policy analysis for conventional, advanced internal combustion, hybrid, and plug-in hybrid vehicles running on either conventionally derived or biomass-based fuels. Although specific policy recommendations remain a topic for future work, this work identifies the need to reconsider existing policies based on LCA that seek to address the GHG impacts of transportation fuels, including the Renewable Fuel Standard (RFS) and California's Low-Carbon Fuel Standard (LCFS). A LCFS has also been proposed nationally and for China and other regions, so this work implies a need for great caution in that regard.
The final phase of this three-year research effort as part of CERC-CVC Thrust 6, Project 4 builds on this earlier work and additional extensive literature review, resulting in a major review paper, "The Liquid Carbon Challenge: Evolving Views on Transportation Fuels and Climate" [3], recently published online and forthcoming in the next issue of the journal Wiley Interdisciplinary Reviews: Energy and Environment (WIREs E&E). The critical analysis summarized in the paper compares fuel-related LCA (also known as fuel cycle analysis [FCA] methods, as embodied in models such as GREET), to other methods of carbon accounting. It is revealed that, in addition to large and irreducible uncertainties, FCA has serious structural flaws including an incorrect carbon cycle representation, misspecified system boundaries, and the inappropriate use of an equilibrium framework for a dynamic stock-and-flow problem (in contrast to the correct framework identified in the "Biofuels Carbon Balance" paper and which is also implicit in established integrated assessment modeling [IAM] methods).
This analysis implies significant new research needs, which include:
Redesigning the core structure of FCA models and developing protocols for appropriately qualified reporting and application of FCA results
Empirically testing model assumptions about CO2 uptake in biofuel feedstocks
Evaluating the measurable GHG impacts of actual biofuel production to date in order to better calibrate models used for prospective assessment of future vehicle-fuel systems
Exploring the applicability of systems dynamics methods, which may be better suited to the stock-and-flow nature of biofuel vs. fossil fuel comparisons
Figure 3. Carbon balance schematic for modeling a coupled
biofuel and fossil fuel system.

CVC Project Fact Sheets Page 70 November 2014
These findings also suggest a need for better coordination across relevant research communities, such as between DOE's biofuels programs and programs in DOE's Office of Science that address terrestrial carbon cycle measurement and analysis.
It can also be noted that, in addition to the direct publications resulting from this project, the work was both informed by and made available to a major National Research Council (NRC) study, "Transitions to Alternative Vehicles and Fuels," released in March 2013. Both Dr. DeCicco and Dr. Heywood, who are among the principal investigators in Thrust Area 6, served on the NRC committee that conducted the study. Results of our work helped inform the resulting report, and it is likely that results from the work will be incorporated into the ongoing technology roadmapping and policy analysis related to alternative vehicles and fuels.
Future Plans
Specific CERC-CVC work on the topics of this project (Thrust 6, Project 4.6) ended as of August 31, 2014, as the principal investigator is shifting to an appointment that no longer draws on the CERC-CVC budget. Nevertheless, ongoing research on the topic will continue at the University of Michigan Energy Institute (UMEI), which will pursue collaborations with CERC-CVC researchers as well as others in the broader U.S. DOE, national laboratory, academic, and industry research communities working on CVFSs in the United States, China, and globally.
Future research needs in this regard were summarized in the most recent published paper that had been supported in part through the CERC-CVC, as given in the publications list below.
Expected Outcomes
DOE and other agency program management consideration of the need for substantial revisions and updates to existing vehicle-fuel systems analysis methodologies and models based on them
Academic, industry, and public re-evaluation of policies and research roadmaps for addressing GHG emissions associated with the use of liquid fuels, including both petroleum fuels and biofuels
New research, analysis and discussion of national (United States and China) and international (other countries and international bodies such as IPCC) strategies related to transportation sector climate mitigation, including R&D programs, technology roadmaps, incentives, and regulatory policies
References
[1] DeCicco, J.M. 2013. Factoring the car-climate challenge: insights and implications. Energy Policy 59: 382-92. http://dx.doi.org/10.1016/j.enpol.2013.03.052
[2] DeCicco, J.M. 2013. Biofuel's carbon balance: doubts, certainties and implications. Climatic Change 121(4): 801-814. http://dx.doi.org/10.1007/s10584-013-0927-9
[3] DeCicco, J.M. 2014. The liquid carbon challenge: evolving views on transportation fuels and climate. Wiley Interdisciplinary Reviews: Energy and Environment. http://dx.doi.org/10.1002/wene.133
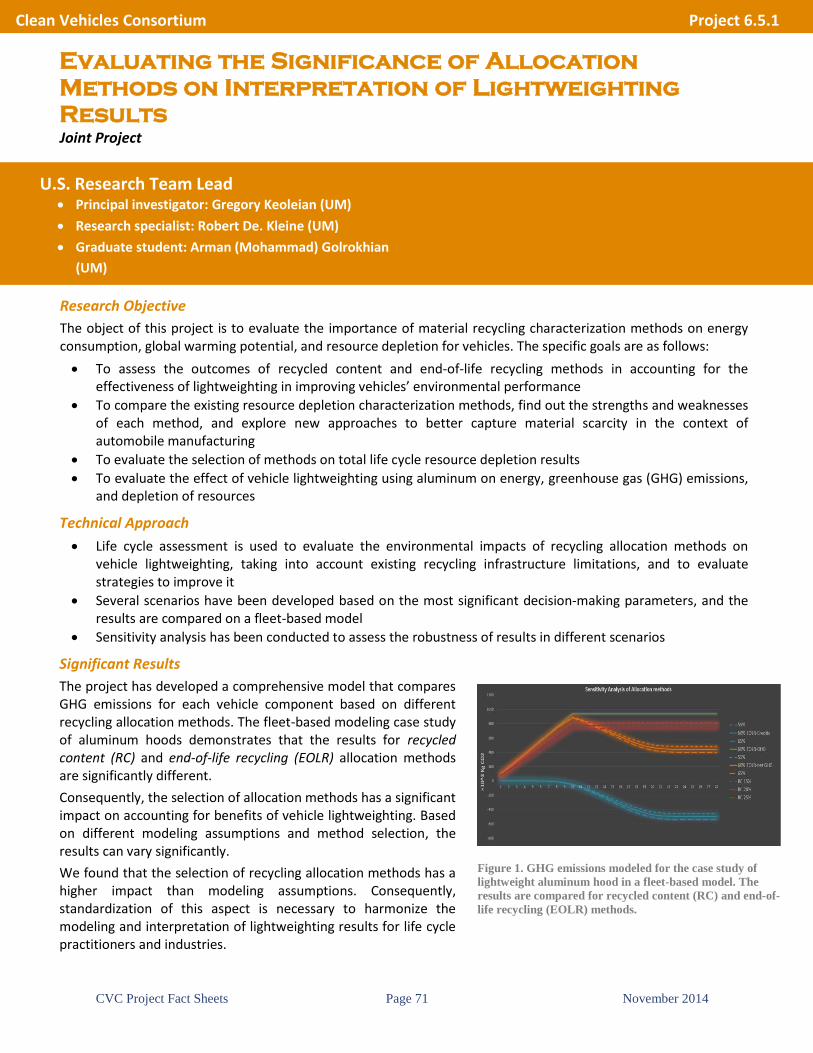
CVC Project Fact Sheets Page 71 November 2014
Evaluating the Significance of Allocation
Methods on Interpretation of Lightweighting
Results Joint Project
Research Objective
The object of this project is to evaluate the importance of material recycling characterization methods on energy consumption, global warming potential, and resource depletion for vehicles. The specific goals are as follows:
To assess the outcomes of recycled content and end-of-life recycling methods in accounting for the effectiveness of lightweighting in improving vehicles’ environmental performance
To compare the existing resource depletion characterization methods, find out the strengths and weaknesses of each method, and explore new approaches to better capture material scarcity in the context of automobile manufacturing
To evaluate the selection of methods on total life cycle resource depletion results
To evaluate the effect of vehicle lightweighting using aluminum on energy, greenhouse gas (GHG) emissions, and depletion of resources
Technical Approach
Life cycle assessment is used to evaluate the environmental impacts of recycling allocation methods on vehicle lightweighting, taking into account existing recycling infrastructure limitations, and to evaluate strategies to improve it
Several scenarios have been developed based on the most significant decision-making parameters, and the results are compared on a fleet-based model
Sensitivity analysis has been conducted to assess the robustness of results in different scenarios
Significant Results
The project has developed a comprehensive model that compares GHG emissions for each vehicle component based on different recycling allocation methods. The fleet-based modeling case study of aluminum hoods demonstrates that the results for recycled content (RC) and end-of-life recycling (EOLR) allocation methods are significantly different.
Consequently, the selection of allocation methods has a significant impact on accounting for benefits of vehicle lightweighting. Based on different modeling assumptions and method selection, the results can vary significantly.
We found that the selection of recycling allocation methods has a higher impact than modeling assumptions. Consequently, standardization of this aspect is necessary to harmonize the modeling and interpretation of lightweighting results for life cycle practitioners and industries.
U.S. Research Team Lead Principal investigator: Gregory Keoleian (UM)
Research specialist: Robert De. Kleine (UM)
Graduate student: Arman (Mohammad) Golrokhian
(UM)
Clean Vehicles Consortium Project 6.5.1
Figure 1. GHG emissions modeled for the case study of
lightweight aluminum hood in a fleet-based model. The
results are compared for recycled content (RC) and end-of-
life recycling (EOLR) methods.

CVC Project Fact Sheets Page 72 November 2014
Figure 2. Comparison of resource depletion results
associated with charging a vehicle with 1 kWh electricity in
the United States.
Similarly, we extended this model to resource depletion characterization methods. More than 7 separate methods exist in the literature. We cataloged these methods and any critiques of these methods. The PHEV aluminum hood case study developed in previous Project 6.5 research is being used to compare the results of each impact method.
Future Plans
Identify and recommend the most relevant recycling allocation method and resource depletion characterization method in the case of vehicle lightweighting
Explore improvements to current methods (or develop new methods) that take into account the benefits of using recycled materials from a resource-depletion-avoidance point of view
Inform policies to improve recycling infrastructure
Expected Outcomes
Recommendations on lightweighting’s effectiveness under different recycling allocation methods and resource depletion characterization methods
Recommendations on improving the existing recycling allocation methods and existing resource depletion characterization methods
Recommendations for developing strategic standardization in selection of allocation methods and resource depletion characterization methods

CVC Project Fact Sheets Page 73 November 2014
Improving Precision of Electricity Grid Modeling
for Electrified Vehicle Sustainability
Assessments Joint Project
Research Objective
The project is developing a comparative analysis of protocols and tools used to estimate emissions from electricity consumption. The analysis will provide the project team with a better understanding of the appropriate applications for existing emissions estimation tools and how their use will affect the life cycle emissions of a product or process. This is very relevant to electrified and lightweight vehicles, which are dependent on electricity for charging and material production (e.g., aluminum smelting), respectively. Both private and public electricity allocation protocols are available, and each uses a different set of variables in its fuel mix calculations: time, aggregation level, transmission constraints, fuel costs, marginal changes in consumption, etc. The research will focus on how the consideration or omission of these variables affects estimates of emissions, initially, in relation to electric vehicle charging stations. These results will provide the team with the information necessary to develop guidelines for the use of each tool in other applications. Finally, the analysis will show where these tools are lacking and how they could be improved, with the goal of creating an emissions estimation model that accounts for these deficiencies.
Technical Approach
Analyze the variations in emissions estimates from different electricity allocation protocols (e.g., AVERT, eGRID sub regions, balancing authorities, etc.) when applied to the electricity use at plug-in vehicle charging stations, with variation in station location, charging time, and season
Create emissions estimation curves, using a variety of electricity allocation models, for representational days during different seasons for charging stations in a variety of U.S. regions
Complete a literature review of all public and private electricity allocation protocols to better understand their appropriate applications
Develop a tool to estimate emissions from electricity usage based on the deficiencies found in the existing models
Significant Results
The project was launched less than two months prior to the time of the writing, but the team has already compiled information on 26 electricity allocation protocols that can be used to estimate emissions from electricity consumption. The protocols to be compared in the electric vehicle charging station case study were selected from these 26. Multiple protocol deficits and strengths have been identified. Some deficits found in the many public models include a lack of consideration of time of generation/consumption, electricity trading, and effects of marginal power production changes, along with an inability to account for changes in fuel prices or available generation assets. Many of the average estimations also use data several years old. The team has begun the development of emissions comparisons for specific charging stations. Work is also progressing on the literature review of existing tools and applications.
U.S. Research Team Lead Principal investigator: Gregory Keoleian (UM)
Collaborators: Jeremiah Johnson (UM), Robb De
Kleine (UM)
Graduate student: Nicole Ryan (UM)
Clean Vehicles Consortium Project 6.5.2

CVC Project Fact Sheets Page 74 November 2014
Future Plans
Future work includes the application of electricity allocation models to electric charging stations throughout the United States in order to complete the comparative analysis case study. Then recommendations for protocol applications based on the literature review and results of the case study will be developed. A final goal is to create an improved emissions estimation tool.
Expected Outcomes
Recommendations for which electricity allocation protocol to apply based on the application
Analysis of emissions produced from electric vehicle charging station use in a variety of geographic locations at different times of the day and year
A publicly available tool for estimating emissions from electricity usage based on time and location