
Clean Rivers, Clean Lake 2014 -- Pay for Performance to Reduce Phosphorus Loss
21
www.winrock.org Using Pay-for-Performance Conservation to Reduce Phosphorus Loss in the West Branch Milwaukee River The Pay-for-Performance Concept Jonathan Winsten, Ph.D. Agricultural Economist Winrock International
-
Upload
sweet-water -
Category
Documents
-
view
214 -
download
0
Transcript of Clean Rivers, Clean Lake 2014 -- Pay for Performance to Reduce Phosphorus Loss

www.winrock.org
Using Pay-for-Performance Conservation to Reduce
Phosphorus Loss in the West Branch Milwaukee River
The Pay-for-Performance Concept
Jonathan Winsten, Ph.D.
Agricultural Economist
Winrock International
www.winrock.org
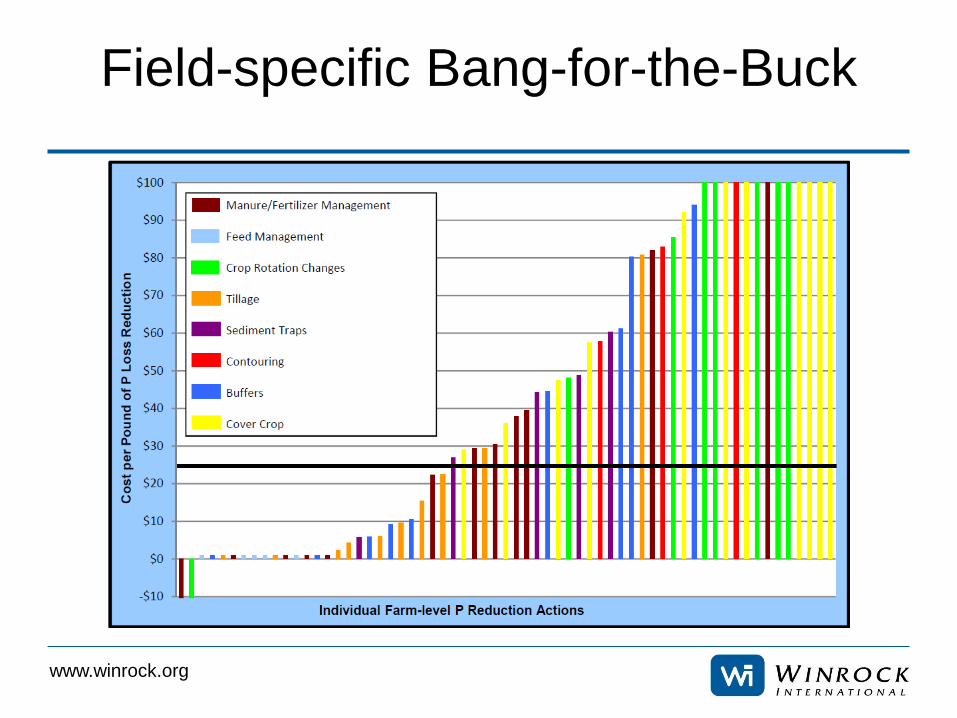
Field-specific Bang-for-the-Buck

www.winrock.org
What’s Needed?
Conservation programs that:
• Provide clear nutrient reduction goals
• Are focused on environmental outcomes
• Provide flexibility and incentive to maximize
“bang for the buck”
Can be achieved through government
programs or markets.

www.winrock.org
Background
• Food production and environmental quality
have inherent trade-offs.
• Regulations decrease productivity and increase
costs.
• Current conservation programs focus on
practices, not outcomes.
– Any BMP has highly variable outcomes.
• Pay-for-performance conservation can motivate
farmers, lead to innovation, and reduce costs.

www.winrock.org
• Rewards farmers for achieving specific
environmental performance targets;
• Farmers choose how to achieve targets;
• Incentivizes farmers to choose the most cost-
effective actions;
• Provides opportunities for additional farm
income.
Pay-for-Performance Conservation
www.winrock.org
The Economic Justification
• Market failure
• Current programs focus on specific practices
– Subset of possible actions
– Designed to offset cost
– Effectiveness varies greatly
• Performance-based incentives can serve as a
“price” for pollution control
• Environmental performance becomes
incorporated into farm business planning

www.winrock.org
Quantification
How do we quantify environmental performance? • Measurement vs. Modeling

www.winrock.org
Measured vs. Modeled
Performance
• Measured performance
Real data from actual conditions
Volatile weather makes planning difficult
Is measurement practical at the farm-level?
Use of proxy variables
• Modeled performance
Allows for scenario analysis – before actions are taken.
Is it accurate enough? • In a given year?
• Over the long-term?
Is it simple enough to use? • Trade-offs between simplicity and accuracy?

www.winrock.org
For More on Quantifying Performance

www.winrock.org
Quantification
How do we quantify environmental performance? • Measurement vs. Modeling
Where do we quantify environmental performance?
Need performance measures that are closely
related to ultimate water quality concern AND
directly influenced by farm management
decisions.

www.winrock.org
Performance Measures –
In the Lake, Bay, or Ocean

www.winrock.org
Performance Measures –
In the River

www.winrock.org
Performance Measures –
On the Farm

www.winrock.org
Model at the Farm –
Measure at the Watershed
• Modeling farm performance
– Allow scenario analysis
– Only the farmer’s actions affect performance
– Triggers primary incentive payment
• Measuring watershed performance
– Not prohibitively expensive
– Provides a focal point and real report card
– Triggers a secondary incentive payment
– Farmer-to-farmer peer pressure for participation
• Concept recent winner in U.S. “Nutrient Challenge”
www.winrock.org
Program Design Questions
What do we pay for? • Reduced losses vs stewardship levels
How much do we pay? • Setting the appropriate incentive level
Where will the funding come from? • More efficient use of current spending
• Generate demand from downstream for
reduced nutrient loads

www.winrock.org
Rock River Watershed - Vermont Cost per Pound of P Loss Reduced

www.winrock.org
Coffee Creek Watershed - Iowa Cost per Pound of P Loss Reduced
-$10
$0
$10
$20
$30
$40
$50
$60
$70
$80
$90
$100
Individual Farm-level P Reduction Actions
Co
st p
er P
ou
nd
of
P L
oss
Red
uct
ion
Manure/Fertilizer Management
Crop Rotation Changes
Tillage
Sediment Traps
Contouring
Buffers
Cover Crop

www.winrock.org
Cumulative Results
State
P Loss Reduced
(lbs/acre/yr)
Farm Cost
($/lb P)
Farm Profit
($/lb P)
Sediment Loss Reduced
(tons/acre/yr)
Iowa 0.88 -$0.61 $10.61 1.58
Vermont 0.26 $4.86 $20.14 1.01

www.winrock.org
Lessons Learned
• Cost-effectiveness varies greatly across AND within BMPs;
• Producers are motivated by becoming agents of change;
• Performance-based incentive payments can induce cost-effective outcomes;
• Quantifying performance is information and labor-intensive.
19

www.winrock.org
Looking Ahead
• Information systems are improving rapidly
– Models
– Remote sensing
– Measurement methods
• Tight budgets and persistent WQ problems require more cost-effective solutions

www.winrock.org
Contact Information
Jonathan R. Winsten
Agricultural Economist
Winrock International
Email: [email protected]
Tel: +1-802-343-3037


