“Clean Water, Clean Air, Clean Energy” TransTech Energy Conference 2013 1.
Clean EnergyBlueprint A Smarter National Energy Policyfor Today and the Future
STEVEN CLEMMER
DEBORAH DONOVAN
ALAN NOGEE
JEFF DEYETTE
UNION OF CONCERNED SCIENTISTS
WITH
AMERICAN COUNCIL FOR AN ENERGY-EFFICIENT ECONOMY
TELLUS INSTITUTE
October 2001
© 2001 Union of Concerned ScientistsAll rights reserved
Steven Clemmer is a senior analyst in the UCS Clean Energy Program. Deborah Donovan is the research coordinator for that program, Alan Nogee is its director, and Jeff Deyette is a research associate in the program.
The Union of Concerned Scientists is a nonprofi t partnership of scientists and citizens combining rigorous scientifi c analysis, innovative policy development, and effective citizen advocacy to achieve practical environmental solutions.
The UCS Clean Energy Program examines the benefi ts and costs of the country’s energy use and promotes energy solutions that are sustainable both environmentally and economically.
More information about UCS and the Clean Energy Program is available at the UCS site on the World Wide Web, at www.ucsusa.org.
The American Council for an Energy-Effi cient Economy is a nonprofi t organization dedicated to advancing energy effi ciency as a means of promoting both economic prosperity and environmental protection. Further information can be found at www.aceee.org.
The Tellus Institute is a nonprofi t research and consulting organization that analyzes evolving environmental problems and evaluates options for technological and institutional change. Further information can be found at www.tellus.org.
The full text of this report is available on the UCS website (www.ucsusa.org/energy) or may be obtained from
UCS Publications Two Brattle Square Cambridge, MA 02238-9105
Or email [email protected] or call 617-547-5552.
Figures iv
Tables iv
Acknowledgements v
Executive Summary vii
1. The Need for National Energy Policy 1
2. The Clean Energy Blueprint 3Renewable Portfolio Standard 3Public Benefi ts Fund 4Net Metering 4Production Tax Credit 5Increased R&D Funding 5Combined Heat and Power 6Improved Effi ciency Standards 6Enhanced Building Codes 7Tax Incentives 7Industrial Energy Effi ciency Measures 8
3. Our Methods 9
4. What We Found 13The Clean Energy Blueprint 13The Renewable Energy and Energy Effi ciency Investment Act of 2001 (S. 1333) 25
5. Additional Benefits of the Clean Energy Blueprint 31
6. A Promising Energy Future 35
References 37
Contents
iv UNION OF CONCERNED SCIENTISTS
1. Oil Savings from Clean Energy Blueprint and Fuel Economy Standards
vs. Arctic Refuge Oil Supply 15
2. Electricity Generation under Business as Usual 16
3. Electricity Generation and Efficiency under the Clean Energy Blueprint 16
4. Renewable Energy Generation under the Clean Energy Blueprint 18
5. Net Savings under the Clean Energy Blueprint 19
6. Natural Gas Prices 20
7. Typical Household Electricity Bill 21
8. Average Consumer Electricity Prices 21
9. Power Plant Carbon Dioxide Emissions 22
10. Power Plant SO2 and NOx Emissions 23
11. Natural Gas Prices—Higher Gas Prices 24
12. Average Consumer Electricity Prices—Higher Gas Prices 24
13. Electricity Generation and Efficiency under S. 1333 25
14. Net Savings under S. 1333 26
15. Natural Gas Prices under S. 1333 27
16. Typical Household Electricity Bill under S. 1333 27
17. Average Consumer Electricity Prices under S. 1333 28
18. Power Plant Carbon Dioxide Emissions under S. 1333 29
19. Natural Gas Prices under S. 1333 29
20. Average Consumer Electricity Prices under S. 1333 30
Figures
1. Consumer Energy Savings from the Energy Efficiency and Combined Heat and Power Policies 11 2. Total US Energy Use 14 3. Electricity Generation and Efficiency 17 4. Electricity Generation and Efficiency under S. 1333 26
Tables
Acknowledgements
The Union of Concerned Scientists greatly acknowledges the support of these foundations in helping to underwrite this report: The Energy Foundation, The Joyce Foundation, The Oak Foundation, The V. Kann Rasmussen Foundation and The Pew Charitable Trusts. The American Council for an Energy-Effi cient Economy (ACEEE) thanks the Energy Foundation, Joyce Foundation, and Pew Charitable Trusts for funding its work on this project.
ACEEE’s contributions toward this project draw heavily on the ACEEE report Smart Energy Policies by Steven Nadel and Howard Geller, published in September 2001.
Steven Bernow, Bill Dougherty, and Alison Bailie of the Tellus Institute performed computer modeling and provided invaluable expert assistance.
The authors gratefully acknowledge Anita Spiess for editing and layout; Brent Robie for graphic design; and the following individuals for providing their expertise in the review of our methodology, inputs, and assumptions:
Michael Brower, Brower and CompanyJack Cadogan, US Department of Energy, Offi ce of Energy Effi ciency and Renewable Energy, Wind Energy ProgramKevin Comer, Antares Group, Inc.Dan Entingh, Princeton Economic Research, Inc.Howard Geller, American Council for an Energy-Effi cient EconomyLynne Gillette, US Department of Energy, Office of Energy Efficiency and Renewable EnergyEtan Gummerman, Lawrence Berkeley LabsDan Lashof, Natural Resources Defense CouncilSteve Nadel, American Council for an Energy-Effi cient Economy Walter Short, National Renewable Energy LaboratoryMarie Walsh, Oak Ridge National LaboratoryFrancis Wood, OnLocation, Inc.
UCS would also like to extend our appreciation to Alan Beamon, Erin Boedecker, Zia Haq, Jeff Jones, Laura Martin, Tom Petersik, and Scott Sitzer of the Energy Information Administration for their capable assistance regarding the National Energy Modeling System (NEMS).
The energy effi ciency and renewable energy measures included here are based on updated research originally conducted by the American Council for an Energy-Effi cient Economy, Alliance to Save Energy, Natural Resources Defense Council, Tellus Institute, and UCS, Energy Innovations (1997), and the ACEEE follow-up to that analysis, Meeting America’s Kyoto Protocol Target (1999). The industrial energy efficiency

vi UNION OF CONCERNED SCIENTISTS
Cover credits: Background photo: San Clemente Island, California, photographed by Ed McKenna, courtesy of National Renewable Energy Laboratory (NREL). Back cover photos, clockwise from upper left: Wind turbines on Vanscycle Ridge in the Columbia River Gorge, Oregon, courtesy of FPL Energy, Inc. Wind turbines, Lake Benton, Minnesota, photographed by Jim Green, courtesy of NREL. Harvesting switchgrass in Iowa, photographed by Warren Gretz, courtesy of NREL. Rooftop photovoltaic panels, Northeastern University, Boston, Massachusetts, photographed by Warren Gretz, courtesy of NREL. Photovoltaic building skin, 4 Times Square, New York City, courtesy of Kiss and Cathcart Architects. Switchgrass, Auburn, Alabama, photographed by Warren Gretz, courtesy of NREL. Photovoltaic roofi ng tiles, Kissimmee, Florida, photographed by Herman Gyr, courtesy of NREL. Wind turbines, McCamey, Texas, courtesy of American Electric Power. Geothermal power plant, the Geysers, California, photographed by Lewis Stewart, courtesy of NREL. Solar concentrators, Boulder, Colorado, photographed by Warren Gretz, courtesy of NREL. Cover design: Brent Robie.
measures are based on the Interlaboratory Working Group, Scenarios for a Clean Energy Future (2000).
The opinions expressed in this report do not necessarily reflect the opinions of the foundations who supported the work or the many individuals who reviewed and commented on it. The Union of Concerned Scientists is solely responsible for the contents of this report.
Preliminary results of a partial set of scenarios presented in this full analysis were released in June 2001 as Clean Energy Blueprint, Phase I.
Executive Summary
Can America develop a balanced portfolio of clean energy solutions that will stop wasting energy and also develop diverse, domestic energy supplies to increase energy security?
Can America develop an energy system that will save consumers money, provide security and jobs, and leave a heritage of clean air, clean water, and pristine wilderness?
Can the United States restore international good will and credibility by reducing carbon dioxide emissions that threaten to destabilize the global climate?
This report demonstrates that the answer to those questions is “Yes.” The Union of Concerned Scientists, with assistance from the American Council for
an Energy-Effi cient Economy and the Tellus Institute, investigates the costs and benefi ts of a Clean Energy Blueprint to promote diversity in energy production and energy conservation. We also examine a subset of Clean Energy Blueprint policies included in the Renewable Energy and Energy Effi ciency Investment Act of 2001 (S. 1333). We compare our results with the business-as-usual forecast of the US Energy Information Administration. That forecast underlies the administration’s proposal, as part of a National Energy Policy, to develop 1,300 new power plants by 2020.
We fi nd that the United States can
• meet at least 20 percent of its electricity needs by renewable energy sources—wind, biomass, geothermal, and solar—by 2020
• save consumers a total of $440 billion by 2020, with annual savings reaching $105 billion per year or $350 for a typical family
• reduce the use of natural gas by 31 percent and coal by nearly 60 percent compared to business as usual by 2020, and save more oil in 18 years than can be economically recovered from the Arctic National Wildlife Refuge in 60 years
• simultaneously avoid the need for 975 new power plants (300 megawatts each), retire 180 old coal plants (500 MW each), retire 14 existing nuclear plants (1,000 MW each), and reduce the need for hundreds of thousands of miles of new gas pipelines and electricity transmission lines
• reduce carbon dioxide emissions by two-thirds from business as usual by 2020, while also reducing harmful air emissions of sulfur dioxide and nitrogen oxides by more than 55 percent
viii UNION OF CONCERNED SCIENTISTS
What Is the Clean Energy Blueprint?The Clean Energy Blueprint is a suite of policies to increase energy effi ciency
and renewable energy:
• A renewable portfolio standard would require utilities to increase nonhydropower renewable energy from about 2 percent today to 20 percent by 2020.
• A public benefits fund would be created by a 0.2 cent per kilowatt-hour (kWh) charge on electricity, equivalent to about $1 per month for a typical household. It would be used to match state programs for energy efficiency, renewable energy, research and development, and low-income customer protection.
• Production tax credits of 1.7 cents per kWh for renewable energy would be extended and expanded to cover all clean, nonhydro renewable resources, helping to level the playing field with fossil fuel and nuclear generation subsidies.
• Net metering would treat fairly those consumers who generate their own electricity with renewable energy systems by allowing them to feed surplus electricity back to the grid and spin their meters backward.
• Research and development spending on renewable energy and efficiency would increase 60 percent over three years to levels recommended by the president’s committee of advisors on science and technology in 1997.
• Combined heat and power: Incentives would be provided and regulatory barriers removed for power plants that produce both electricity and useful heat at high efficiencies.
• Improved efficiency standards: National minimum efficiency standards would be established for a dozen products, generally to the level of good practices today. In addition, existing national standards would be revised to levels that are technically feasible and economically justified.
• Enhanced building codes: States would adopt model building codes established in 1999/2000, as well as new more advanced codes established by 2010.
• Tax incentives would promote efficiency improvements for buildings and equipment beyond minimum standards.
• Industrial energy efficiency measures: Industry would improve its efficiency by 1 to 2 percent per year through voluntary agreements, incentives, or national standards.
Our analysis uses the US Energy Information Administration’s NEMS computer model. We based our business-as-usual scenario on Annual Energy Outlook 2001 (EIA, 2000), the EIA’s long-term forecast of US energy supply, demand, and prices. The UCS analysis removes the EIA’s artifi cial constraints on renewable energy growth, consistent with a recent analysis by the Interlaboratory Working Group, the fi ve national laboratories that do energy research. Additional adjustments were made as necessary to update assumptions to use the most recent data available. Most importantly, the IWG examined a renewable portfolio standard of 7.5 percent by 2010. The Blueprint increases the standard to 10 percent by 2010 and extends it to 20 percent by 2020. In addition, it uses more advanced energy-effi ciency measures developed by the American Council for an Energy-Effi cient Economy.
ixClean Energy Blueprint
The Clean Energy Blueprint Creates a More Diverse Energy SupplyUnder business as usual, and under the administration’s National Energy Policy,
the United States needs to build at least 1,300 new power plants by 2020. Natural gas use would increase from 16 percent to 36 percent over that period, and coal use would increase by 21 percent. Renewable electricity (not including hydropower) would increase from 2 percent today to only 2.4 percent by 2020.
Under the Clean Energy Blueprint, total energy use would be 19 percent lower than business as usual by 2020 and only 5 percent higher than 2000 levels, due to increased energy effi ciency in homes, offi ces, and factories. Natural gas use would be 31 percent less than business as usual by 2020. Oil use would be reduced by 5 percent, saving over 400 million barrels per year by 2020. More oil would be saved over the next 18 years than is economically recoverable from the Arctic National Wildlife Refuge over 60 years. Coal use would be reduced by nearly 60 percent.
Nonhydro renewable energy sources (wind, biomass, geothermal, and solar) would produce 20 percent of the nation’s electricity by 2020. Energy effi ciency measures would offset projected growth in electricity use. Combined heat and power plants would meet 39 percent of commercial and industrial electricity needs. Thus, the Clean Energy Blueprint would replace 975 of the 1,300 new power plants the National Energy Policy says we need by 2020, and retire 180 existing coal plants and 14 nuclear plants.
The Clean Energy Blueprint Saves Consumers MoneyUnder the Clean Energy Blueprint, net energy savings would grow to $105 billion
per year by 2020, totaling $440 billion between 2002 and 2020. (Total savings between 2002 and 2020 are in 1999 dollars using a 5 percent real discount rate.) A typical family would save $350 per year in lower energy bills by 2020.
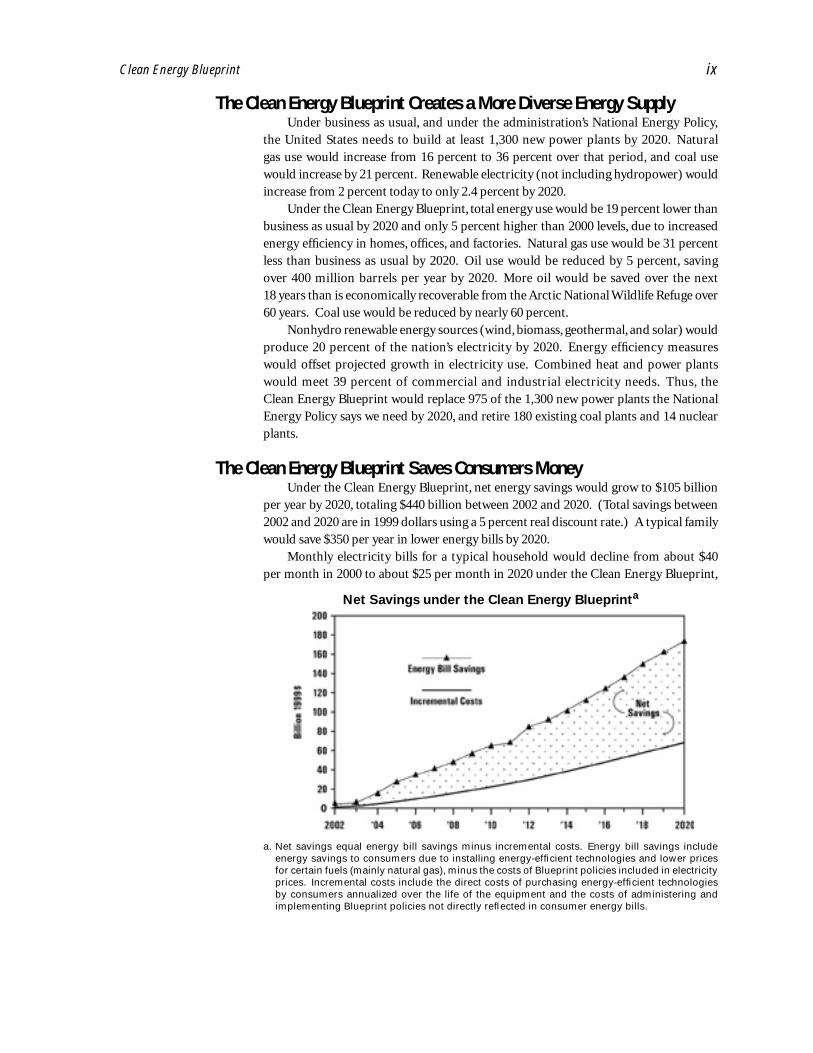
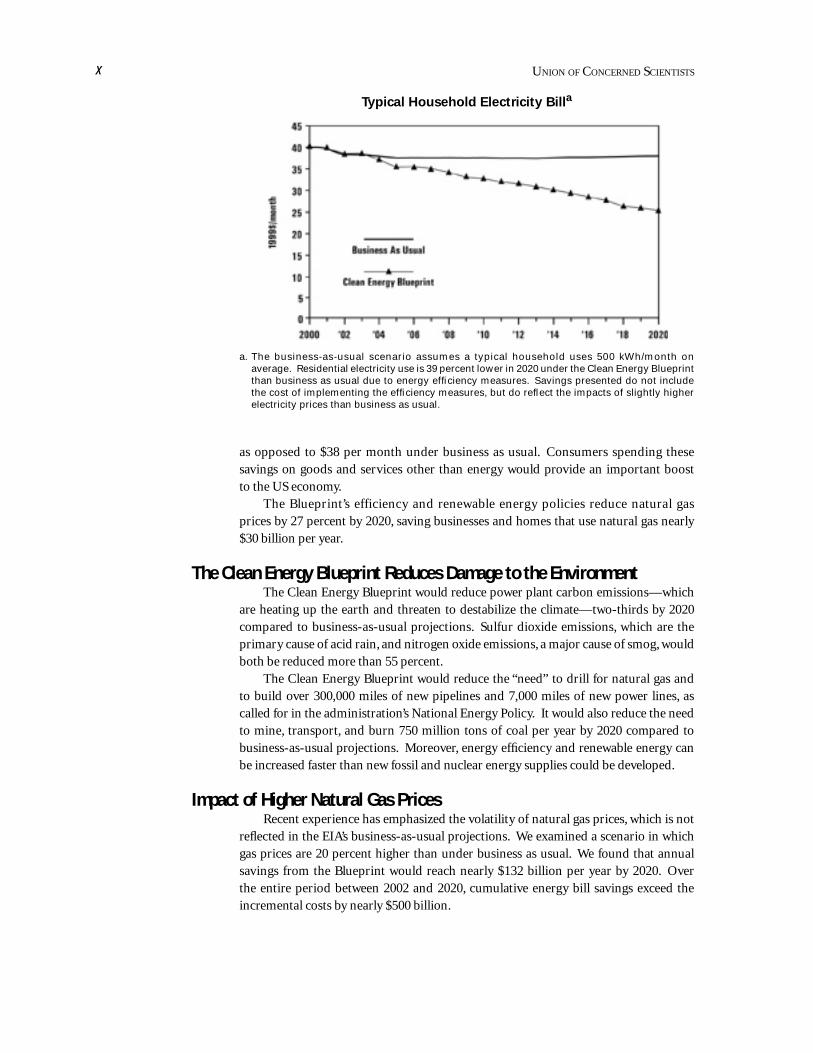
Monthly electricity bills for a typical household would decline from about $40 per month in 2000 to about $25 per month in 2020 under the Clean Energy Blueprint,
Net Savings under the Clean Energy Blueprinta
a. Net savings equal energy bill savings minus incremental costs. Energy bill savings include energy savings to consumers due to installing energy-effi cient technologies and lower prices for certain fuels (mainly natural gas), minus the costs of Blueprint policies included in electricity prices. Incremental costs include the direct costs of purchasing energy-effi cient technologies by consumers annualized over the life of the equipment and the costs of administering and implementing Blueprint policies not directly refl ected in consumer energy bills.
x UNION OF CONCERNED SCIENTISTS
as opposed to $38 per month under business as usual. Consumers spending these savings on goods and services other than energy would provide an important boost to the US economy.
The Blueprint’s efficiency and renewable energy policies reduce natural gas prices by 27 percent by 2020, saving businesses and homes that use natural gas nearly $30 billion per year.
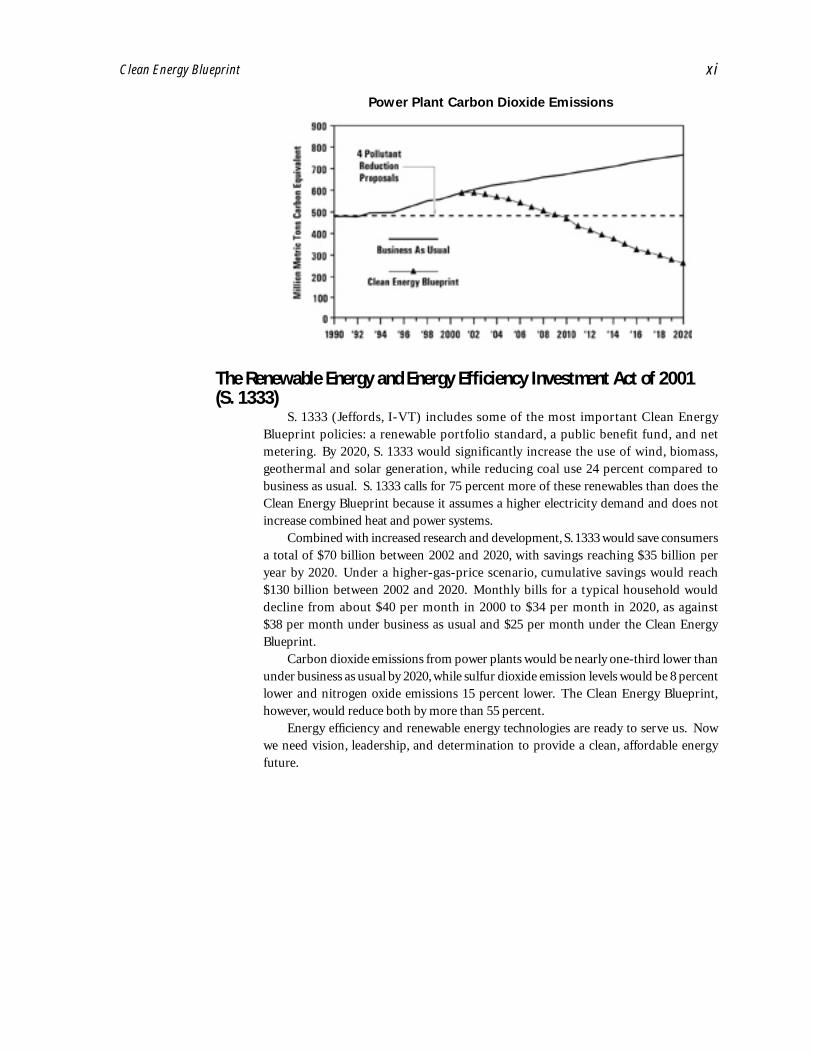
The Clean Energy Blueprint Reduces Damage to the EnvironmentThe Clean Energy Blueprint would reduce power plant carbon emissions—which
are heating up the earth and threaten to destabilize the climate—two-thirds by 2020 compared to business-as-usual projections. Sulfur dioxide emissions, which are the primary cause of acid rain, and nitrogen oxide emissions, a major cause of smog, would both be reduced more than 55 percent.
The Clean Energy Blueprint would reduce the “need” to drill for natural gas and to build over 300,000 miles of new pipelines and 7,000 miles of new power lines, as called for in the administration’s National Energy Policy. It would also reduce the need to mine, transport, and burn 750 million tons of coal per year by 2020 compared to business-as-usual projections. Moreover, energy effi ciency and renewable energy can be increased faster than new fossil and nuclear energy supplies could be developed.
Impact of Higher Natural Gas Prices Recent experience has emphasized the volatility of natural gas prices, which is not
refl ected in the EIA’s business-as-usual projections. We examined a scenario in which gas prices are 20 percent higher than under business as usual. We found that annual savings from the Blueprint would reach nearly $132 billion per year by 2020. Over the entire period between 2002 and 2020, cumulative energy bill savings exceed the incremental costs by nearly $500 billion.
Typical Household Electricity Billa
a. The business-as-usual scenario assumes a typical household uses 500 kWh/month on average. Residential electricity use is 39 percent lower in 2020 under the Clean Energy Blueprint than business as usual due to energy effi ciency measures. Savings presented do not include the cost of implementing the effi ciency measures, but do refl ect the impacts of slightly higher electricity prices than business as usual.
xiClean Energy Blueprint
The Renewable Energy and Energy Efficiency Investment Act of 2001 (S. 1333)
S. 1333 (Jeffords, I-VT) includes some of the most important Clean Energy Blueprint policies: a renewable portfolio standard, a public benefit fund, and net metering. By 2020, S. 1333 would significantly increase the use of wind, biomass, geothermal and solar generation, while reducing coal use 24 percent compared to business as usual. S. 1333 calls for 75 percent more of these renewables than does the Clean Energy Blueprint because it assumes a higher electricity demand and does not increase combined heat and power systems.
Combined with increased research and development, S. 1333 would save consumers a total of $70 billion between 2002 and 2020, with savings reaching $35 billion per year by 2020. Under a higher-gas-price scenario, cumulative savings would reach $130 billion between 2002 and 2020. Monthly bills for a typical household would decline from about $40 per month in 2000 to $34 per month in 2020, as against $38 per month under business as usual and $25 per month under the Clean Energy Blueprint.
Carbon dioxide emissions from power plants would be nearly one-third lower than under business as usual by 2020, while sulfur dioxide emission levels would be 8 percent lower and nitrogen oxide emissions 15 percent lower. The Clean Energy Blueprint, however, would reduce both by more than 55 percent.
Energy effi ciency and renewable energy technologies are ready to serve us. Now we need vision, leadership, and determination to provide a clean, affordable energy future.
Power Plant Carbon Dioxide Emissions

Can America develop a national energy system that will provide security and jobs, and also leave a heritage of clean air, clean water, and pristine wilderness areas for the children and grandchildren?
Can the United States increase international good will and credibility by reducing carbon dioxide emissions that threaten to destabilize the global climate, and also have economic growth?
Can the country plan for the long term and also respond to immediate problems and meet short-term energy needs?
Can the nation develop a truly balanced portfolio of clean energy solutions that will stop wasting energy and also develop diverse, domestic energy supplies that can reduce its dependence on energy imports?
The Union of Concerned Scientists, with assistance from the American Council for an Energy-Effi cient Economy and the Tellus Institute, explores these questions in this report. We used the US Energy Information Administration’s National Energy Modeling System to analyze the costs and benefi ts of a suite of proposals to
• increase the use of domestic renewable energy sources
• save electricity and fossil fuels by using more efficient energy technologies in homes, businesses, and industry
The administration launched a national debate on energy policy when it released the National Energy Plan last spring (NEPDG, 2001). According to that plan, “America
in the year 2001 faces the most serious energy shortage since the embargoes of the 1970s.”
Energy prices had increased sharply after a long period of decline. Americans were facing higher prices for natural gas, electricity, and gasoline. California faced a genuine power crisis, with periodic rotating blackouts and wholesale electricity prices ten times higher than in previous years.
The National Energy Plan proposed building 1,300 to 1,900 new electric power plants over the next 20 years—one to two plants every week—along with hundreds of thousands of miles of new gas pipelines and power lines. It recommended many
measures—including rolling back environmental and siting rules and exploiting the Arctic National Wildlife Refuge—to develop additional fossil fuel supplies, revive the nuclear industry, and build new pipelines, power lines, and power plants (NEPDG, 2001).
By September 2001, however, fuel price spikes have largely subsided. Widespread blackouts from inadequate power supplies did not occur in California or elsewhere
C H A P T E R 1
The Need For National Energy Policy
Can America develop an energy system that provides security and jobs, and also leaves a heritage of clean air, clean water, and pristine wilderness areas?
2 UNION OF CONCERNED SCIENTISTS
during the summer of 2001. The Federal Energy Regulatory Commission capped wholesale power prices in the Western electricity grid, and prices declined to more typical levels. Media stories shifted from energy shortages to predictions of energy gluts.
In the interim, the US House of Representatives passed the Securing America’s Future Energy Act of 2001. The act included a number of tax credits for energy conservation and renewable technologies. But the combined tax breaks for fossil fuel production and distribution, nuclear generation, and electricity transmission are
much greater than the tax breaks for clean energy sources, including over $3 billion in tax credits for “clean coal” technologies (JCT, 2001). The House also voted to open the Arctic National Wildlife Refuge to oil drilling.
Neither the administration nor the House of Representatives has presented a comprehensive analysis of the costs and benefi ts or the environmental impacts of their plans. Nor have they examined the costs and benefits of many proposals for expanded investments in energy effi ciency and renewable energy.
Ironically, the National Energy Plan extols the progress America has made in improving energy efficiency and developing clean renewable energy sources. It acknowledges that, without the efficiency improvements made since 1973, the US economy would need 30 to 50 percent more energy than it does today. The plan also notes that the cost of making electricity with solar or wind power has decreased more than 80 percent (NEPDG, 2001). Indeed, wind and solar are the fastest growing energy sources in the world, but America is losing its leadership position in the clean energy technologies that it developed.
The National Energy Plan provides no benchmarks, goals, or standards for increasing renewable energy (not including hydropower) beyond 2.8 percent of electricity by 2020, from 2 percent today. While the administration has said that the 2.8 percent figure does not represent its renewable energy goal, it has not yet met the challenge of stating an alternative goal or of supporting the policies that would achieve one.
The administration has also rejected the Kyoto Protocol, an agreement by 170 nations to reduce carbon dioxide emissions, the principal greenhouse gas that threatens to destabilize the climate. It has promised but not yet produced a plan to reduce domestic carbon emissions. The electricity sector is the largest source of such emissions, producing over 40 percent of the US total.
Secretary of Energy Spencer Abraham has challenged critics of the administration’s energy policy to produce an alternative energy plan (Lobsenz, 2001). This report proposes such a plan: the Clean Energy Blueprint. We describe and analyze a package of the strongest energy effi ciency and renewable energy policies Congress is considering, plus several others. We assess their direct costs, energy savings, and impacts on air emissions of carbon dioxide, sulfur dioxide, and nitrogen oxides.
Because fossil fuel prices are volatile, we also consider the costs and benefits of the policies under higher natural gas prices than the US Energy Information Administration’s most recent forecast. Finally, we assess the costs and benefi ts of the Renewable Energy and Energy Effi ciency Investment Act of 2001 (S. 1333), the most comprehensive clean energy bill being considered in the 107th Congress.
In this report, we analyze a package of the strongest energy effi ciency and renewable energy policies Congress is considering.

UCS and its co-authors analyzed a set of policies that includes standards and incentives to increase investment in clean energy by consumers and the electricity sector and to help overcome existing market barriers that currently slow investment. UCS has analyzed transportation effi ciency policies in a separate report, Drilling in Detroit (UCS, 2001). The analysis reported here examines the following 10 renewable energy and energy effi ciency policies:
• renewable portfolio standard
• public benefits fund
• net metering
• production tax credit
• increased R&D funding
• combined heat and power
• improved efficiency standards
• enhanced building codes
• energy efficiency tax incentives
• industrial energy efficiency measures
We also analyzed the impacts of a subset of the Blueprint policies included in the Renewable Energy and Energy Effi ciency Investment Act of 2001 (S. 1333)—the renewable portfolio standard, public benefi ts fund, and net metering—plus increased R&D funding for renewable energy.1
UCS has previously described the renewable energy technologies and policies, and how they work, in Powerful Solutions: Seven Ways to Switch America to Renewable Electricity (Nogee et al., 1999). ACEEE has discussed the effi ciency policies in detail in Smart Energy Policies: Saving Money and Reducing Pollutant Emissions Through Greater Energy Effi ciency (Nadel and Geller, 2001).
Renewable Portfolio Standard Under a renewable portfolio standard (RPS), all retail electricity providers must
supply a growing percentage of electricity from renewable energy sources. By using
C H A P T E R 2
The Clean energy Blueprint
1 Congress is poised to maintain the renewable energy R&D budget and could increase it by as much as 16 percent this year, despite the administration’s proposed funding cuts of 50 percent to solar, wind, and geothermal R&D. We assume that if Congress enacts the policies in S. 1333, increased R&D funding will continue to be necessary to help lower the cost and improve the performance of technologies that are competing to meet the RPS, as well as to make higher-cost emerging technologies better able to compete for the RPS and broader market share.

4 UNION OF CONCERNED SCIENTISTS
tradable “renewable energy credits,” the RPS achieves compliance at the lowest cost. The RPS would function in much the same way as the Clean Air Act emission allow-ance trading system, which lowers the cost of compliance with air pollution regula-tions. This market-based approach provides the greatest amount of clean power for the lowest price and creates an ongoing incentive to drive down costs. Twelve states have enacted minimum renewable energy standards.
The Clean Energy Blueprint includes a national RPS of 2 percent in 2002, growing to 10 percent in 2010 and 20 percent in 2020, using wind, biomass, geothermal, solar, and landfill gas energy sources. This standard is similar to the one proposed by Senators James Jeffords (I-VT), Diane Feinstein (D-CA), Joseph Lieberman (D-CT), John Kerry (D-MA), Charles Schumer (D-NY), and Olympia Snowe (R-ME) in the Renewable Energy and Energy Effi ciency Investment Act of 2001 (S. 1333).
Public Benefits Fund The public benefits fund (sometimes called system benefit fund) is a small
surcharge on electricity bills used to fund energy efficiency, renewable energy, low income assistance, and research and development for new technologies that
benefi t the public. The fund helps ensure that existing clean energy efforts can continue to operate and provides incentives for new energy efficiency initiatives and renewable energy development. Traditionally, state regulators required electric utilities to collect funds and implement programs. However, utilities cut these pro-grams in half between 1993 and 1998 as several states began to implement and consider electricity restructuring. To date, 19 states have adopted new public benefits programs, while several others continue to implement utility-based programs.
The Clean Energy Blueprint includes a small federal charge of up to two-tenths of a cent ($0.002) per kilowatt-hour (equivalent to $1 per month for a typical household), collected from all electricity customers. This charge provides matching funds to states to implement energy efficiency, renewable energy, research and development, and low income energy programs. We based the public benefi ts fund in the Clean Energy Blueprint on the proposal in S. 1333.
Net MeteringNet metering allows consumers who generate their own electricity from renew-
able technologies (e.g., a rooftop solar panel or small wind turbine) to feed excess power directly back into the electricity system, thereby running their electricity meters backward. Net metering customers are billed only for the net electricity consumed. This policy encourages the direct use of renewable resources by making the investment more cost-effective for individual consumers. Electricity providers also benefit from net metering, because it reduces the need to build costly new power lines and the demand for electricity during peak load periods. This is particularly true for rooftop solar systems, which work best on hot sunny days when the demand for power is typically high. Thirty-four states currently have net metering policies.
The Clean Energy Blueprint includes net metering implemented nationally, as proposed in S. 1333. Eligible renewable energy systems are those that produce 100 kilowatts or less using wind, solar, biomass, or geothermal energy sources. They
The public benefi ts fund provides incentives for new energy effi ciency initiatives and renewable energy development.

5Clean Energy Blueprint
must be located on the customer’s premises and used to offset some or all of the electricity the customer uses. In addition, they must be connected to the transmission and distribution system.
Production Tax Credit Most renewable energy technologies are more capital intensive than competing
conventional technologies. While higher up-front costs and lower operating costs make the long-term prices of renewable energy more stable and predictable, they also tend to discourage investment in these technologies. Several studies have shown that renewable technologies pay considerably more in property taxes and fi nancing costs than fossil fuel facilities in states that do not have explicit tax policies that overcome this inequity (e.g., Hadley, Hill, and Perlack, 1993). Other studies have found that fossil fuel and nuclear generation have received much higher tax subsidies than renewable technologies (e.g., Goldberg, 2000, and Sissine, 1994). The production tax credit helps to overcome these inequities by allowing facility owners to receive a tax credit based on the amount of renewable electricity they produce.
Currently, new facilities that use wind, biomass crops grown for energy, or poultry litter receive a tax credit of 1.7 cents per kWh for 10 years. Although the production tax credit is set to expire at the end of 2001, the US House of Representatives voted to extend these credits through 2006. The House also expanded eligibility to include facilities that use landfi ll gas and other forms of biomass and organic wastes in the Securing America’s Future Energy (SAFE) Act of 2001.
The Clean Energy Blueprint extends the 1.7 cents per kWh production tax credit through 2006 and expands eligibility to include geothermal, solar, landfi ll gas, and other forms of biomass and organic wastes, for facilities coming on line after December 31, 2001. Biomass cofi ring in existing coal plants becomes eligible for a production tax credit of 1.0 cent per kWh.
Increased R&D FundingInvestment in research and development is essential for commercializing renewable
energy and energy-effi cient technologies. R&D brings advances in performance and lowers the cost of emerging technologies. The Clean Energy Blueprint assumes a three-year ramp-up in federal R&D spending on renewable energy and energy effi ciency from fi scal year 2001 (FY01) levels to the total long-term funding levels recommended in a 1997 report by the President’s Committee of Advisors on Science and Technology
(PCAST, 1997). For renewable energy technologies, we project total R&D funding for DOE’s programs to increase from $375 million in FY01 to $652 million in FY05, a 74 percent increase. For energy effi ciency, we project total R&D funding for DOE’s programs and EPA’s Energy Star Program to increase from $600 million in FY01 to $900 million in FY05, a 50 percent increase. We also
assume that FY05 funding levels continue through 2020 and are matched by industry through investments in new equipment. This approach is consistent with the increase recommended in the advanced scenario in the 2000 study by fi ve national energy laboratories, Scenarios for a Clean Energy Future (IWG, 2000).
In contrast, the Bush administration’s budget proposed cutting R&D spending on wind, geothermal, and solar energy, and certain energy effi ciency programs by
The Clean Energy Blueprint increases R&D funding by $575 million a year.
6 UNION OF CONCERNED SCIENTISTS
about 50 percent. Congress, however, is expected to increase funding for effi ciency and renewable energy by about 10 percent in FY2002.
Combined Heat and PowerCombined heat and power (CHP) systems produce both heat and electricity
for a facility (and potentially the surrounding community) from a single source of fuel. These economical and highly effi cient technologies conserve fuel by recovering and utilizing heat that is normally wasted in conventional systems. Some CHP technologies can reach effi ciency levels of greater than 80 percent compared to the 33 percent average for conventional facilities (USCHPA, 2001).
Although CHP systems account for over 8 percent of the electricity generated in the United States, significant barriers prevent the technology from reaching its full potential. For example, current environmental standards do not recognize the effi ciency gains that CHP systems realize compared to conventional systems. Further, many prospective CHP projects seeking to interconnect with the electricity grid face discriminatory pricing practices and technical hurdles created by uncooperative utilities. To reduce these barriers, the Clean Energy Blueprint establishes a standard permitting process, uniform tax treatment, accurate environmental standards, and fair access to electricity consumers.
The Blueprint also includes a 10 percent investment tax credit (or a shortened depreciation period of 7 years for industrial systems and 10 years for building systems) for CHP systems achieving effi ciency improvements of 60 to 70 percent, depending on the size of the system. This proposal is also included in a Senate bill soon to be introduced by Senator Jeff Bingaman (D-NM). The House of Representatives included a 10 percent investment tax credit for combined heat and power property in the SAFE Act of 2001, but the House bill also lengthened depreciation periods, substantially reducing the total incentive provided for CHP systems.
Improved Efficiency Standards Federal appliance and equipment effi ciency standards remove the most ineffi cient
product models from the market while continuing to provide a full range of product options for consumers. Since their inception in 1987, effi ciency standards have been one of the federal government’s most effective energy-savings initiatives. ACEEE estimates that existing standards have already saved 2.5 percent of annual US electricity consumption and that these savings could rise to nearly 8 percent in 2020 (Geller, Kubo, and Nadel, 2001).
The Clean Energy Blueprint assumes that new or upgraded federal efficiency standards for several appliances and equipment types are put into place over the next fi ve years. These include national standards equivalent to
• new California standards for torchiere lighting, exit signs, traffic lights, and commercial refrigerators
• Massachusetts and Minnesota standards for distribution transformers
• current federal commercial furnace standard extended to additional types of commercial heaters
• existing federal purchase specifications for ice makers
7Clean Energy Blueprint
• energy use of 1 watt or less for standby power of consumer electronics such as televisions and VCRs, in line with President Bush’s recent executive order for federal purchases
In addition, this policy assumes the 30 percent effi ciency improvement established by the previous administration for air conditioning systems and heat pumps is maintained. In contrast, the current administration is seeking to roll back this stan-dard to a 20 percent improvement.
Enhanced Building Codes Building energy codes require that new residential and commercial buildings meet
minimum energy effi ciency criteria. This policy stimulates the widespread deployment of cost-effective effi ciency technologies and practices in all new construction.
Under the Clean Energy Blueprint, the US Department of Energy would enforce the Energy Policy Act of 1992, which requires that all states meet or exceed the ASHRAE 90.1 commercial building codes. In addition, all states would upgrade their residential building codes to late 1990s standards either voluntarily or through a new federal requirement. Under the Blueprint, model energy codes would be continuously improved over the next decade, so that by 2010 all states would be enforcing mandatory standards that go signifi cantly beyond current “good practice.”
Tax Incentives Many proven energy-effi cient products experience diffi culty gaining market share
because of high production costs, consumer’s lack of familiarity with the product, and entrenched competition. Temporary initial tax incentives help to surmount these barriers by attracting consumers to energy-effi cient products that they could other-wise not afford. Tax incentives also encourage companies to mass-market innovative products. As the technology achieves a greater market share, costs decline and the tax incentive can be phased out.
The Clean Energy Blueprint includes tax incentives for a wide range of energy-effi cient measures and products, including
• up to $2,500 for new houses that demonstrate 50 percent reductions in space heating and cooling costs compared to homes that meet the current Model Energy Code. The SAFE Act of 2001 includes tax credits for homes with 30 percent energy savings.
• $50–$100 for the manufacturers of high-efficiency refrigerators and clothes washers as is included in the SAFE Act of 2001.
• 20 percent investment tax credit for new high-efficiency building technologies, including air conditioners, heat pumps, stationary fuel cell power systems, and furnaces. The fuel cell provision is included in the SAFE Act of 2001, while the other provisions are found in a draft bill by Senator Bingaman.
• $2.25 per square foot tax deduction for commercial building and multifamily residential investments that result in at least 50 percent reductions in heating and cooling costs below the current ASHRAE model energy standards (these are included in the SAFE Act of 2001).
To prevent “free riders” and permanent subsidies, the tax incentives specify high eligibility criteria and limited duration.
8 UNION OF CONCERNED SCIENTISTS
Industrial Energy Efficiency Measures The industrial sector can also benefi t from many cost-effective opportunities to
improve energy effi ciency. For example, an analysis of 49 energy effi ciency technologies for the iron and steel industry found a total cost-effective energy savings potential of 18 percent (Worrell, Martin, and Price, 1999). Voluntary agreements between the government and industry may be an effective means to achieve this potential (e.g., Kauffman, 1999, and Romm, 1999).
Under the Clean Energy Blueprint companies or industry sectors would identify opportunities for improving energy effi ciency and pledge to reduce energy use by a meaningful percentage (1 to 2 percent annually) over a multiyear period. The federal government would encourage broad participation by offering to postpone new regulatory and tax proposals, provide technical and financial assistance, and increase federal R&D and demonstration programs. Should industries not adequately respond to federal initiatives to establish and meet energy effi ciency goals, a mandatory energy-intensity standard could be implemented to ensure that those targets are met.
UCS used the National Energy Modeling System (NEMS), a computer model maintained by the US Energy Information Administration, to compare the costs and benefits of the Clean Energy Blueprint described in Chapter 2 with business as usual.2 The business-as-usual scenario is based on Annual Energy Outlook 2001 (EIA, 2000a), the EIA’s most recent long-term forecast of US energy supply, demand, and prices. The year 1999 is the last year of history in the model, which makes projections through 2020.
UCS modified several NEMS assumptions for renewable energy in order to model these technologies more accurately and applied these modifications to both the business-as-usual scenario and the Clean Energy Blueprint. We used the changes to NEMS made by the Interlaboratory Working Group of the five national energy laboratories in Scenarios for a Clean Energy Future as the starting point for our analysis (IWG, 2000). The IWG removed or modi-fied several NEMS assumptions that artificially constrain the growth and raise the cost of renewable energy technologies. These modifi cations are described in Appendix C-4 of the IWG document (IWG, 2000). Like the IWG study, UCS’s analysis assumes that
implementing the Clean Energy Blueprint will help remove market barriers and lower the cost of developing renewable energy over time.
We diverged from some of the IWG study’s renewable energy assumptions in several respects:
• For wind energy, we conservatively assumed somewhat higher initial capital costs to conform to recent data and reduced the land area potentially available for development to account for additional siting restrictions.
• For geothermal energy, we assumed lower capital costs, based on recent experi-ence. We also assumed a technical potential for geothermal energy that is over 40 percent lower than in the IWG study, based on recent EIA revisions to NEMS.
• For solar energy, we estimated that over 4,000 megawatts (MW) of grid-connected rooftop photovoltaic systems would be installed on homes and businesses throughout the United States by 2020 through a combination of net metering, R&D funding, public benefits funding, and the DOE Million Solar Roofs Program. We based this estimate on the 25 percent annual average growth scenario in the US Photovoltaics Industry Roadmap report (DOE, 2001).
C H A P T E R 3
Our Methods
2 Tellus Institute performed the NEMS modeling for UCS.
UCS used the National Energy Modeling System computer model to compare the costs and benefi ts of the Clean Energy Blueprint with business as usual.
10 UNION OF CONCERNED SCIENTISTS
• For biomass energy, we assumed that a maximum of 10 percent of the heat input of existing coal plants can be cofired with biomass, rather than up to 5 percent as in NEMS and the IWG study, based on recent experience with that technology. While the EIA estimate of available forest residues already excluded roadless areas, steep slopes, and more than half the remaining residues, we reduced the amount of potential forestry residues included in the NEMS model by half again to provide an extra margin against using unsustainable sources. We also excluded an additional 5 percent of construction and demolition debris, on top of the EIA’s 75 percent exclusion, to provide an extra margin against using contaminated materials.
Perhaps most importantly, the IWG examined a set of policies in the electricity, buildings, and industrial sectors that were less extensive than the Clean Energy Blueprint policies. For example, the IWG study included a renewable portfolio standard (RPS) of 7.5 percent by 2010, with no subsequent renewable energy support. The Clean Energy Blueprint expands the RPS to 10 percent by 2010 and 20 percent by 2020. On the other hand, under the Blueprint, neither municipal solid waste nor black liquor (a biomass waste from the pulp and paper industry) are eligible for the RPS. The IWG assumed that all black liquor and over 60 percent of municipal solid waste would be eligible for the RPS.
Rooftop photovoltaic systems were the only technology included in NEMS that would be eligible for net metering. This limitation means that our analysis underestimates the potential renewable energy development that could occur through net metering of such technologies as small wind turbines, biomass methane digesters and gasifi ers, and fuel cells using renewable fuels.
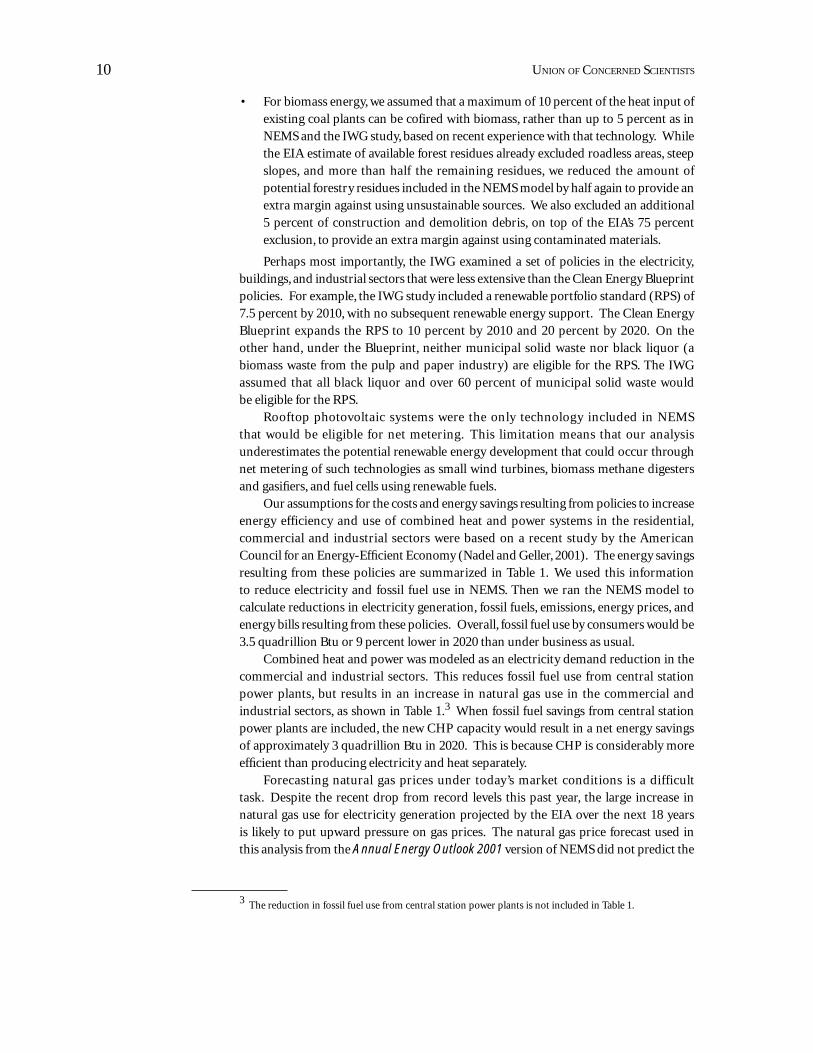
Our assumptions for the costs and energy savings resulting from policies to increase energy efficiency and use of combined heat and power systems in the residential, commercial and industrial sectors were based on a recent study by the American Council for an Energy-Effi cient Economy (Nadel and Geller, 2001). The energy savings resulting from these policies are summarized in Table 1. We used this information to reduce electricity and fossil fuel use in NEMS. Then we ran the NEMS model to calculate reductions in electricity generation, fossil fuels, emissions, energy prices, and energy bills resulting from these policies. Overall, fossil fuel use by consumers would be 3.5 quadrillion Btu or 9 percent lower in 2020 than under business as usual.
Combined heat and power was modeled as an electricity demand reduction in the commercial and industrial sectors. This reduces fossil fuel use from central station power plants, but results in an increase in natural gas use in the commercial and industrial sectors, as shown in Table 1.3 When fossil fuel savings from central station power plants are included, the new CHP capacity would result in a net energy savings of approximately 3 quadrillion Btu in 2020. This is because CHP is considerably more effi cient than producing electricity and heat separately.
Forecasting natural gas prices under today’s market conditions is a difficult task. Despite the recent drop from record levels this past year, the large increase in natural gas use for electricity generation projected by the EIA over the next 18 years is likely to put upward pressure on gas prices. The natural gas price forecast used in this analysis from the Annual Energy Outlook 2001 version of NEMS did not predict the
3 The reduction in fossil fuel use from central station power plants is not included in Table 1.
11Clean Energy Blueprint
spike in natural gas prices that occurred over the past year. The forecast shows a smooth trajectory that does not correspond to the historic volatility in gas prices.
For this analysis, in addition to using EIA’s gas price forecast, we also modeled the impact of higher gas prices on both the business-as-usual scenario and the Clean Energy Blueprint policies using assumptions from the EIA’s Slow Technology Progress case in Annual Energy Outlook 2001 (EIA, 2000a, p. 86). This case assumes a 25 percent reduction in the annual rates of technological progress and a 25 percent increase in costs of oil and natural gas supply technologies relative to business as usual. While we do not believe that technical progress in extracting oil and natural gas is necessarily likely to be slow, we believe this approach is a reasonable proxy for simulating the effects of higher gas prices that could result from increased gas supply constraints due to the projected increase in demand for gas to generate electricity.
Additional details of our methods and assumptions will be included in a technical appendix to this report released separately.
Table 1. Consumer Energy Savings from the Energy Effi ciency
and Combined Heat and Power Policies
Electricity Savings (billion kilowatt-hours) Fossil Fuel Savingsa (quadrillion Btu)
a. Includes direct consumer natural gas, oil, and coal savings from effi ciency measures and CHP. Does not include additional coal and natural gas savings from central station power plants.
b. Represents the increase in natural gas use in the commercial and industrial sectors for CHP.
a. Savings due to federal public benefi ts fund. b. CHP was treated as a demand reduction in the
electricity sector.


Below we present the results for two policy scenarios compared to the business-as-usual scenario. The first scenario illustrates the impacts of the full package of Clean Energy Blueprint policies. The second identifi es the impacts of the subset of the Blueprint policies included in the Renewable Energy and Energy Effi ciency Investment Act of 2001 (S. 1333)—the renewable portfolio standard, public benefi ts fund, and net metering—plus increased R&D funding for renewable energy.
The fi ndings of our analysis fall into fi ve categories. First, we identify the impacts of the policy scenarios on total energy use. Second, we present the impacts of the policy scenarios on the generation and use of electricity. Third, we show the economic benefi ts of these policies. Fourth, we illustrate how those changes reduce power plant emissions. Last, we highlight the impact that higher natural gas prices would have on the policy and business-as-usual scenarios.
The Clean Energy BlueprintTotal Energy Use
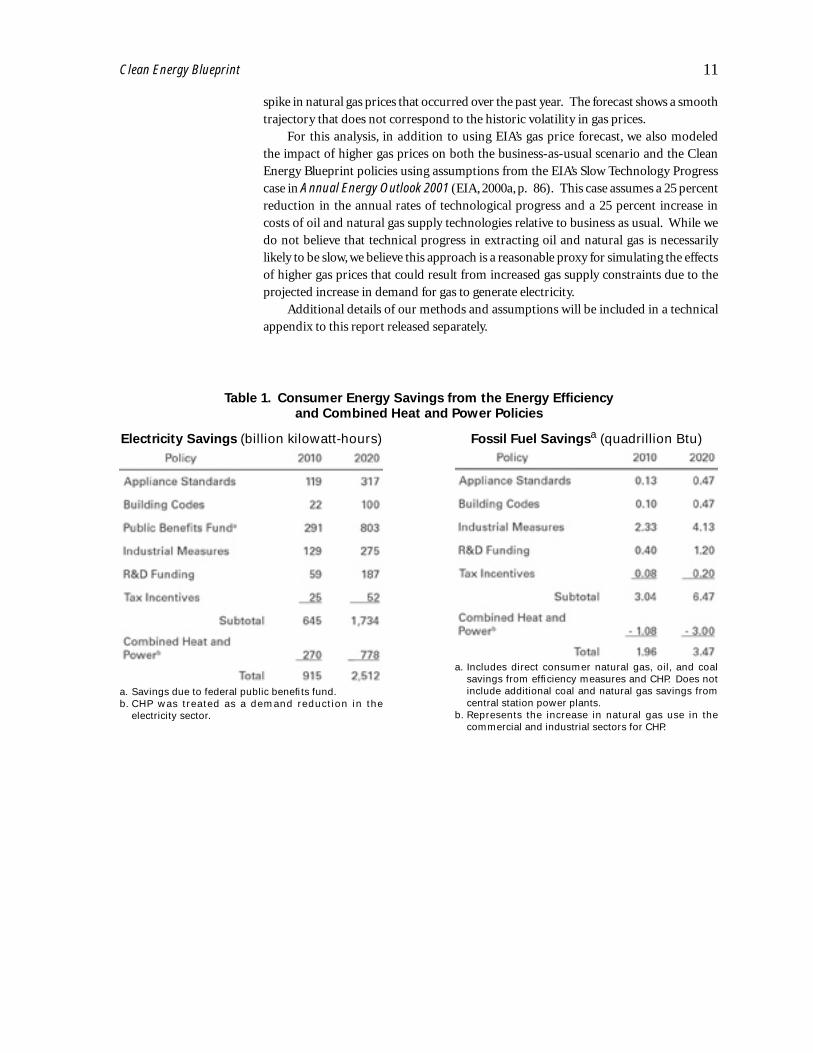
Business as Usual. Under the business-as-usual scenario, the United States primarily increases its reliance on fossil fuels to meet the nation’s growing appetite for energy (Table 2). Between 2000 and 2020, total US energy use grows over 30 percent, an average increase of 1.3 percent per year. Most of the 57 percent increase in natural gas use and 18 percent increase in coal use over the period is for generating electricity in new and existing power plants and to make up for the 24 percent decline in nuclear power. Almost all of the 33 percent increase in petroleum use over the period is for transportation. Hydropower remains relatively fl at over time.
Other renewable energy sources, such as wind, biomass, geothermal and solar energy increase 57 percent between 2000 and 2020 (includes primary energy for electric and nonelectric use, see note a in Table 2), largely due to existing state policies. However, their share of total energy use increases only from 3.2 percent in 2000 to 3.8 percent in 2020, due to the increase in overall energy demand over this period.
Clean Energy Blueprint. Under the Clean Energy Blueprint, energy effi ciency, combined heat and power, and renewable energy provide a much greater share of U.S. energy needs. By 2020, total energy use is 19 percent lower than business as usual and only 5 percent higher than 2000 levels. Wind, biomass, geothermal and solar energy use is more than twice as high as business as usual in 2020 and 3.4 times higher than 2000 levels (includes primary energy for electric and nonelectric use, see note a in Table 2), as these resources provide 20 percent of the nation’s electricity by 2020.
The Clean Energy Blueprint policies result in a signifi cant reduction in coal and natural gas use compared to business as usual. Total coal use is 58 percent lower than
C H A P T E R 4
What We Found
14 UNION OF CONCERNED SCIENTISTS
business as usual in 2020 and 50 percent lower than 2000 levels, as less coal is used to generate electricity and to a lesser extent for industrial energy needs. By 2020, the Clean Energy Blueprint would eliminate the need for mining, transporting, and burning 750 million tons of coal per year. It would take the equivalent of approximately 7.8 million train cars to transport this much coal across the country.
Total natural gas use is reduced by 11 quads (quadrillion Btu), or 31 percent, compared to business as usual in 2020, although it is still 8 percent higher than 2000 levels. Most of the reduction comes from eliminating the need for over 900 new conventional gas-fired power plants, due to investments in energy efficiency, renewable energy, and combined heat and power. Gas effi ciency measures in homes and businesses also make an important contribution to the reduction. The Clean Energy Blueprint would eliminate the need for much of the 301,000 miles of new natural gas transmission and distribution pipelines projected under the administration’s National Energy Policy (NEPDG, 2001).
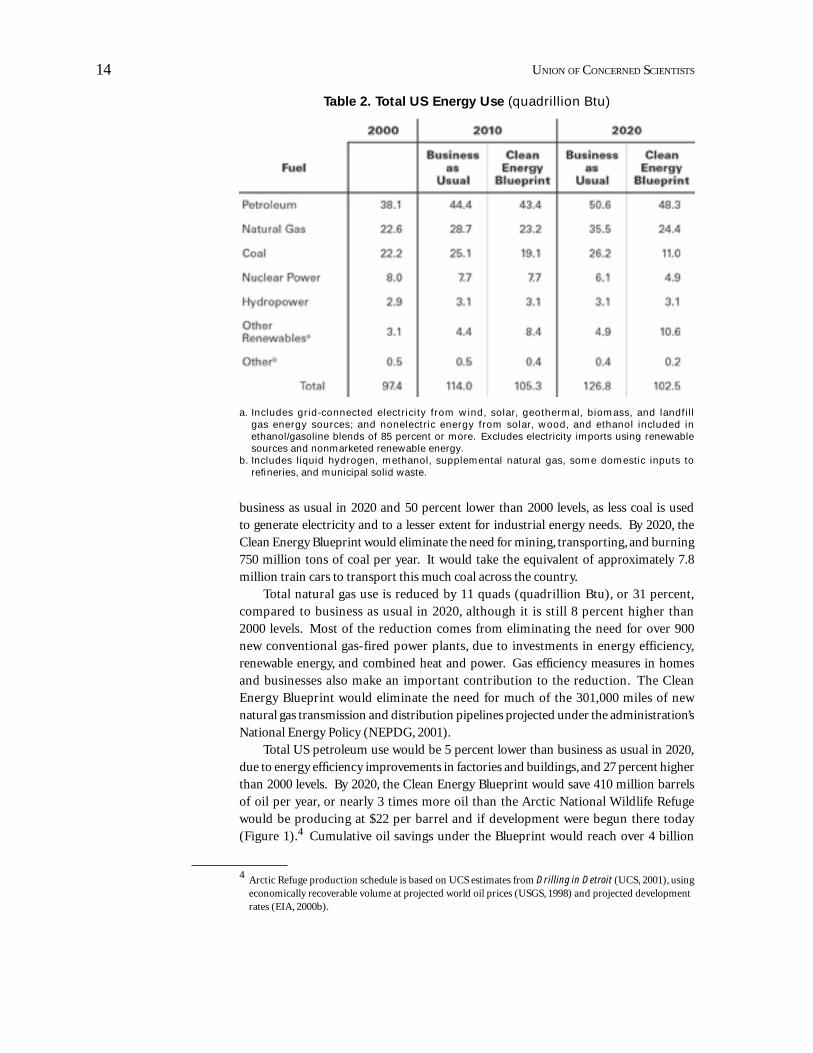
Total US petroleum use would be 5 percent lower than business as usual in 2020, due to energy effi ciency improvements in factories and buildings, and 27 percent higher than 2000 levels. By 2020, the Clean Energy Blueprint would save 410 million barrels of oil per year, or nearly 3 times more oil than the Arctic National Wildlife Refuge would be producing at $22 per barrel and if development were begun there today (Figure 1).4 Cumulative oil savings under the Blueprint would reach over 4 billion
Table 2. Total US Energy Use (quadrillion Btu)
a. Includes grid-connected electricity from wind, solar, geothermal, biomass, and landfill gas energy sources; and nonelectric energy from solar, wood, and ethanol included in ethanol/gasoline blends of 85 percent or more. Excludes electricity imports using renewable sources and nonmarketed renewable energy.
b. Includes liquid hydrogen, methanol, supplemental natural gas, some domestic inputs to refi neries, and municipal solid waste.
4 Arctic Refuge production schedule is based on UCS estimates from Drilling in Detroit (UCS, 2001), using economically recoverable volume at projected world oil prices (USGS, 1998) and projected development rates (EIA, 2000b).
15Clean Energy Blueprint
barrels by 2020, which is 25 percent more oil than the US Geological Survey projects is economically recoverable from the Wildlife Refuge at this price (USGS, 1998). However, even if refuge oil began fl owing in 2010, it could take up to 60 years to extract all of the oil at historic production rates.
The Clean Energy Blueprint does not include any oil savings from increased energy effi ciency and renewable energy use in the transportation sector. Another recent UCS study has shown that fuel economy improvements in cars and light trucks would provide signifi cant oil savings (UCS, 2001). If these savings were combined with the savings from the Clean Energy Blueprint, the United States would save more than 15 times the oil available in the Arctic Refuge at today’s oil prices and total oil use would be 9 percent lower in 2010 and 23 percent lower in 2020 than under business as usual (Figure 1).
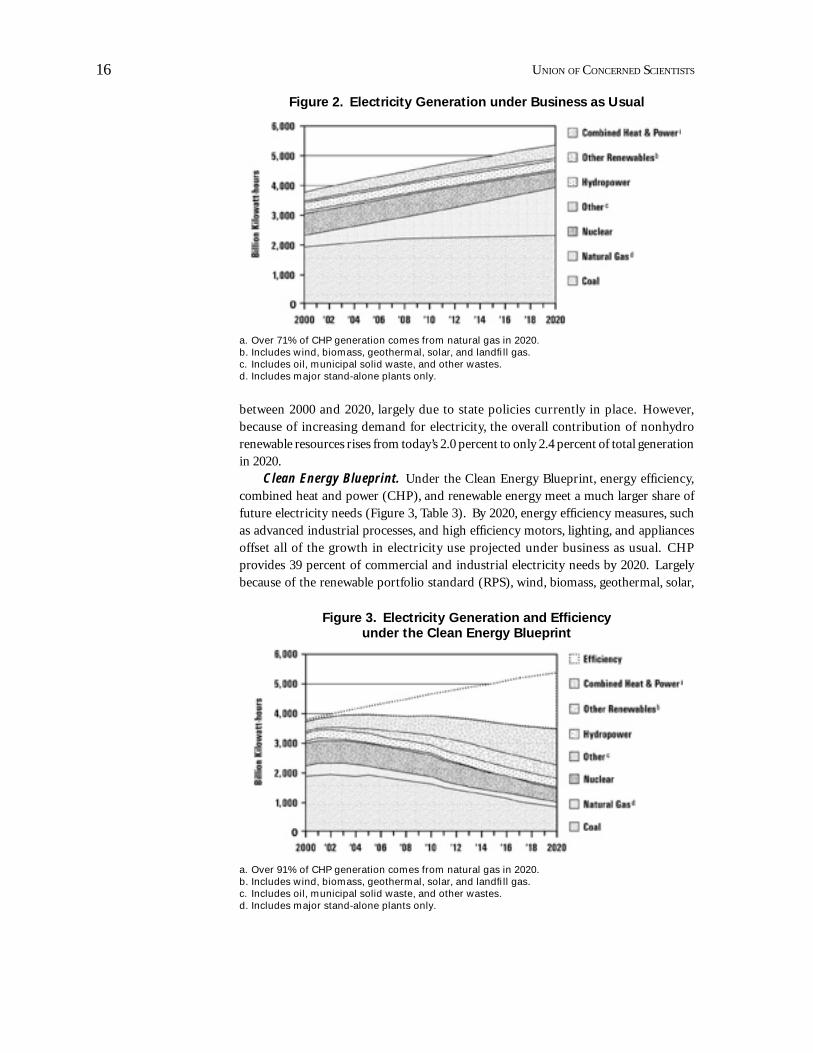
Electricity Generation and UseBusiness as Usual. Under the business-as-usual scenario, the nation increases its
reliance on coal and natural gas to meet strong growth in electricity use (Figure 2). As in the administration’s National Energy Plan, electricity use increases by 42 percent between 2000 and 2020 due to significant under-utilization of energy-efficient technologies and practices. Meeting this increase in electricity use and replacing existing plants that retire would require the construction of nearly 1,300 power plants of average size (300 megawatts).
Under business as usual, natural gas fuels most of the new electricity generation, rising from 16 percent of today’s total electricity generation (including combined heat and power) to 36 percent in 2020. Electricity generated from coal-fi red power plants increases 21 percent between 2000 and 2020. Nuclear power generation declines by 23 percent over the same period, as the EIA’s NEMS model predicts that some existing plants will be retired and no new plants will be built because they are not economically viable to operate relative to other new power plants. Electricity from hydropower plants remains unchanged from today’s levels.
Electricity generated by renewable resources, including wind, solar, geothermal, biomass, and landfill gas (i.e., nonhydro renewable resources) more than doubles
Figure 1. Oil Savings from Clean Energy Blueprint and
Fuel Economy Standards vs. Potential Arctic Refuge Supply
16 UNION OF CONCERNED SCIENTISTS
between 2000 and 2020, largely due to state policies currently in place. However, because of increasing demand for electricity, the overall contribution of nonhydro renewable resources rises from today’s 2.0 percent to only 2.4 percent of total generation in 2020.
Clean Energy Blueprint. Under the Clean Energy Blueprint, energy effi ciency, combined heat and power (CHP), and renewable energy meet a much larger share of future electricity needs (Figure 3, Table 3). By 2020, energy effi ciency measures, such as advanced industrial processes, and high effi ciency motors, lighting, and appliances offset all of the growth in electricity use projected under business as usual. CHP provides 39 percent of commercial and industrial electricity needs by 2020. Largely because of the renewable portfolio standard (RPS), wind, biomass, geothermal, solar,
Figure 3. Electricity Generation and Effi ciency
under the Clean Energy Blueprint
a. Over 91% of CHP generation comes from natural gas in 2020.b. Includes wind, biomass, geothermal, solar, and landfi ll gas.c. Includes oil, municipal solid waste, and other wastes.d. Includes major stand-alone plants only.
Figure 2. Electricity Generation under Business as Usual
a. Over 71% of CHP generation comes from natural gas in 2020.b. Includes wind, biomass, geothermal, solar, and landfi ll gas.c. Includes oil, municipal solid waste, and other wastes.d. Includes major stand-alone plants only.

17Clean Energy Blueprint
and landfi ll gas resources provide 10 percent of the nation’s electricity by 2010 and 20 percent by 2020.
Energy effi ciency, CHP, and renewable energy eliminate the need for 975 average (300 megawatt) new major gas and coal-fi red power plants built under the business-as-usual scenario. However, nearly 225 new average-sized gas plants are still needed between 2000 and 2020, primarily to generate electricity for periods of high demand.
Energy efficiency, CHP, and renewable energy also displace the need for over 120,000 MW of existing power plant capacity, three-quarters of which are dirty coal-fi red plants. This would lead to the retirement of approximately 180 average-sized coal plants (500 MW each). Coal-fi red electricity generation is 61 percent below business as usual in 2020 and 53 percent lower than today’s levels.
By 2020, natural gas consumption at major power plants is 89 percent lower than business as usual. However, when CHP plants are included, natural gas still fuels 36 percent of total electricity generation in 2020 under the Clean Energy Blueprint. Because of lower electricity demand and because natural gas is used both
Table 3. Electricity Generation and Effi ciency (billion kWh)
a. Includes oil, municipal solid waste, and other wastes.b. Includes a small amount of combined heat and power from biomass sources that are assumed
to be eligible for the RPS.c. In 2020, natural gas constitutes over 91% of CHP generation under the Blueprint and over
71% under business as usual.
18 UNION OF CONCERNED SCIENTISTS
to generate electricity and to produce useful heat, overall natural gas generation is 33 percent lower than business as usual in 2020.
As in the business-as-usual case, hydroelectric generation continues at current levels. Nuclear generation declines by 39 percent between 2000 and 2020, compared to a 23 percent decline under business as usual, as 14 more average-sized nuclear power plants are retired (1,000 MW each).
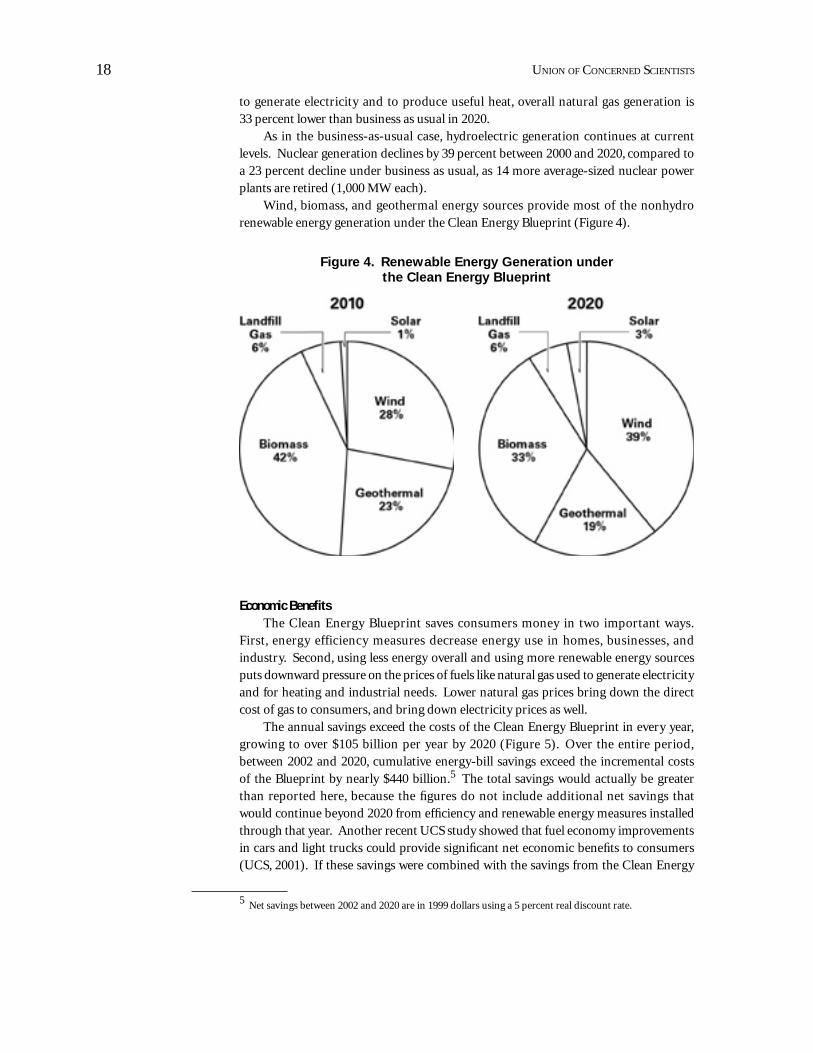
Wind, biomass, and geothermal energy sources provide most of the nonhydro renewable energy generation under the Clean Energy Blueprint (Figure 4).
Figure 4. Renewable Energy Generation under
the Clean Energy Blueprint
Economic BenefitsThe Clean Energy Blueprint saves consumers money in two important ways.
First, energy efficiency measures decrease energy use in homes, businesses, and industry. Second, using less energy overall and using more renewable energy sources puts downward pressure on the prices of fuels like natural gas used to generate electricity and for heating and industrial needs. Lower natural gas prices bring down the direct cost of gas to consumers, and bring down electricity prices as well.
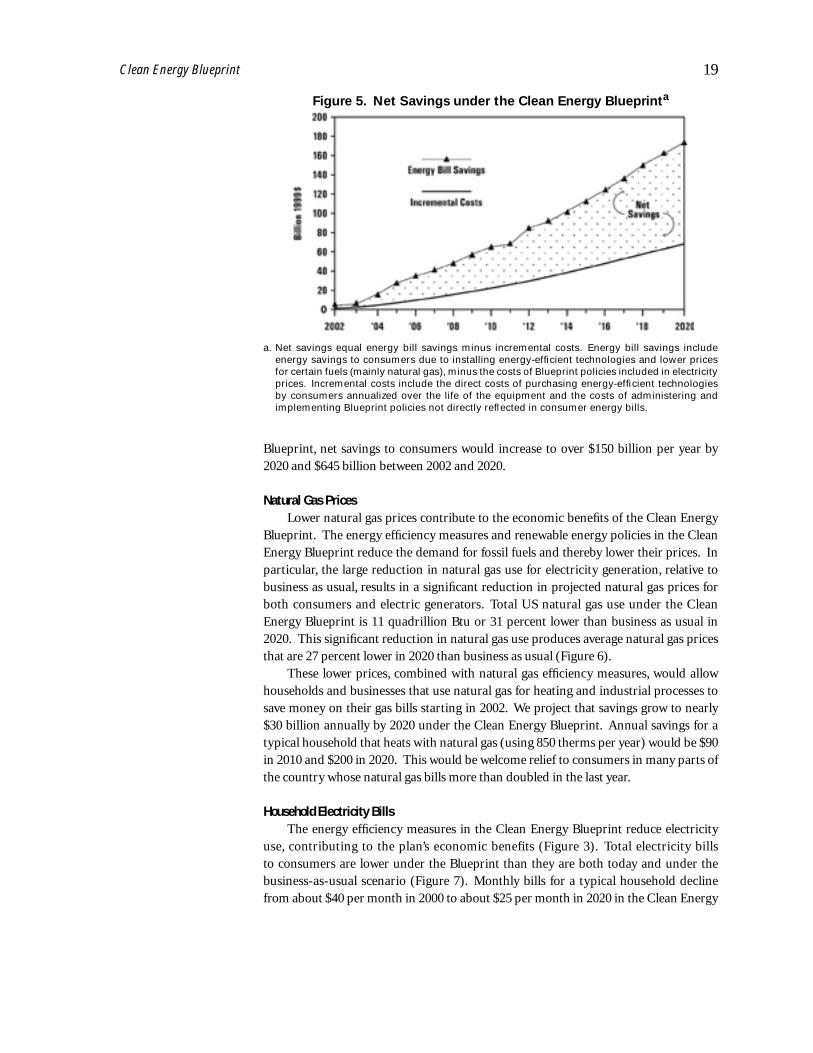
The annual savings exceed the costs of the Clean Energy Blueprint in every year, growing to over $105 billion per year by 2020 (Figure 5). Over the entire period, between 2002 and 2020, cumulative energy-bill savings exceed the incremental costs of the Blueprint by nearly $440 billion.5 The total savings would actually be greater than reported here, because the fi gures do not include additional net savings that would continue beyond 2020 from effi ciency and renewable energy measures installed through that year. Another recent UCS study showed that fuel economy improvements in cars and light trucks could provide signifi cant net economic benefi ts to consumers (UCS, 2001). If these savings were combined with the savings from the Clean Energy
5 Net savings between 2002 and 2020 are in 1999 dollars using a 5 percent real discount rate.
19Clean Energy Blueprint
Blueprint, net savings to consumers would increase to over $150 billion per year by 2020 and $645 billion between 2002 and 2020.
Natural Gas PricesLower natural gas prices contribute to the economic benefi ts of the Clean Energy
Blueprint. The energy effi ciency measures and renewable energy policies in the Clean Energy Blueprint reduce the demand for fossil fuels and thereby lower their prices. In particular, the large reduction in natural gas use for electricity generation, relative to business as usual, results in a signifi cant reduction in projected natural gas prices for both consumers and electric generators. Total US natural gas use under the Clean Energy Blueprint is 11 quadrillion Btu or 31 percent lower than business as usual in 2020. This signifi cant reduction in natural gas use produces average natural gas prices that are 27 percent lower in 2020 than business as usual (Figure 6).
These lower prices, combined with natural gas effi ciency measures, would allow households and businesses that use natural gas for heating and industrial processes to save money on their gas bills starting in 2002. We project that savings grow to nearly $30 billion annually by 2020 under the Clean Energy Blueprint. Annual savings for a typical household that heats with natural gas (using 850 therms per year) would be $90 in 2010 and $200 in 2020. This would be welcome relief to consumers in many parts of the country whose natural gas bills more than doubled in the last year.
Household Electricity BillsThe energy effi ciency measures in the Clean Energy Blueprint reduce electricity
use, contributing to the plan’s economic benefits (Figure 3). Total electricity bills to consumers are lower under the Blueprint than they are both today and under the business-as-usual scenario (Figure 7). Monthly bills for a typical household decline from about $40 per month in 2000 to about $25 per month in 2020 in the Clean Energy
Figure 5. Net Savings under the Clean Energy Blueprinta
a. Net savings equal energy bill savings minus incremental costs. Energy bill savings include energy savings to consumers due to installing energy-effi cient technologies and lower prices for certain fuels (mainly natural gas), minus the costs of Blueprint policies included in electricity prices. Incremental costs include the direct costs of purchasing energy-effi cient technologies by consumers annualized over the life of the equipment and the costs of administering and implementing Blueprint policies not directly refl ected in consumer energy bills.

20 UNION OF CONCERNED SCIENTISTS
Blueprint scenario and $38 per month under business as usual. Annual savings to consumers from lower electricity bills range from nearly $58 in 2010 to over $150 in 2020 compared to business as usual. When combined with savings on natural gas bills, a typical household would save $150 per year in 2010 and $350 per year in 2020 on their overall energy bill (not including transportation).
Electricity PricesConsumers’ electric bills are a function of how much they use and the price per
unit of electricity (cents/kWh). In both scenarios, electricity prices decline over time, although they decline slightly more under business as usual. Between 2000 and 2020, average consumer electricity prices fall almost 4 percent under the Clean Energy Blueprint and nearly 11 percent under business as usual (Figure 8).6 However, the savings from reduced electricity use and lower natural gas prices under the Clean Energy Blueprint more than offset this price difference, resulting in lower total electricity bills (Figure 7).
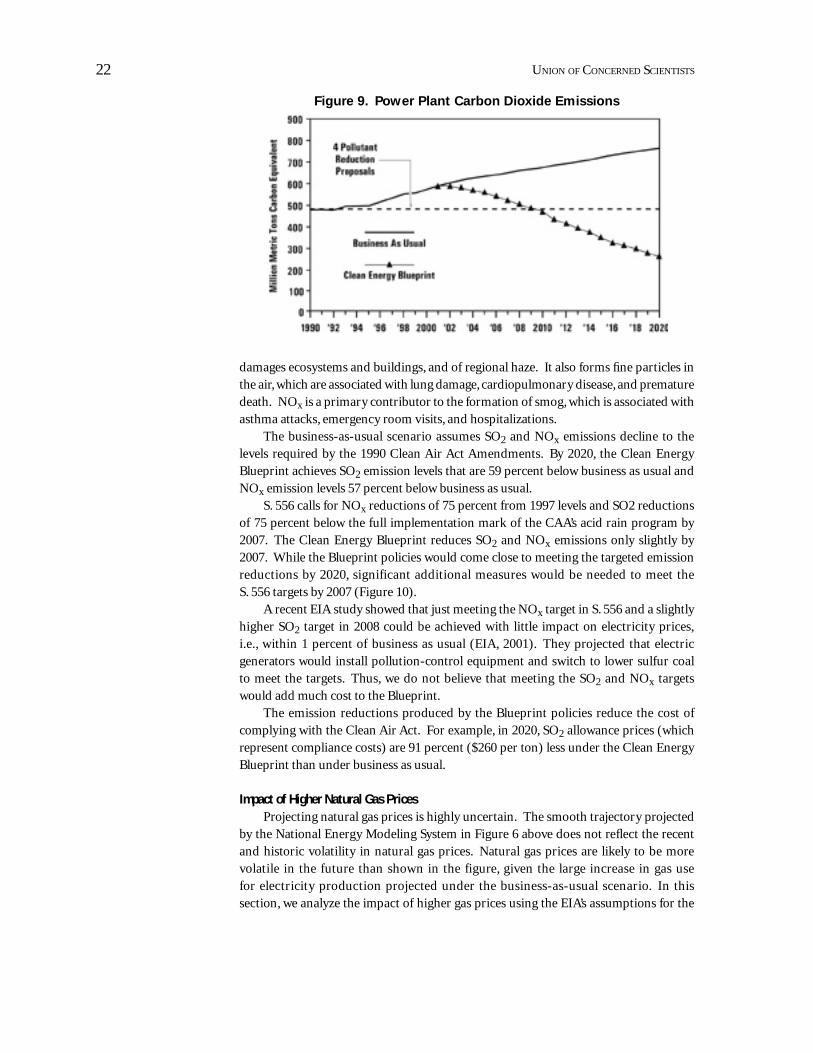
Power Plant EmissionsThe Clean Energy Blueprint significantly reduces air pollution from power
plants. By 2020, carbon dioxide emissions from power plants are over two-thirds lower than under business as usual. Carbon dioxide emissions, primarily from power plants, are the number one contributor to global warming. Under proposals from Senator James Jeffords (I-VT) and Representative Henry Waxman (D-CA) for reducing multiple
6 Actual model input showed an unusual increase in coal prices in 2014 relative to the long-term projec-tion of declining coal prices. This temporary increase in coal prices resulted in a fairly signifi cant shift in electricity generation from coal to natural gas in 2015, which in turn resulted in a small spike in electricity and natural gas prices in that year. Over the next two years, there was a shift from natural gas back to coal due to a decline in coal prices. We believe this result is a modeling artifact, unconnected to any change in policy or technology inputs in that year. We have therefore assumed a linear extrapolation of prices and coal and natural gas generation between 2013 and 2016.
Figure 6. Natural Gas Pricesa (national average)
a. In the Annual Energy Outlook 2001 version of the National Energy Modeling System used for this analysis, the fi rst year of the forecast is 2000. Actual natural gas prices in 2000 were signifi cantly higher than shown in the fi gure.

21Clean Energy Blueprint
pollutants (carbon dioxide, sulfur dioxide, nitrogen oxides, and mercury), power plants would be required to reduce carbon dioxide emissions to 1990 levels by 2007 (Figure 9).7 The results show that the Clean Energy Blueprint makes a signifi cant contribution to reaching this requirement. Under the Clean Energy Blueprint power plants reach that target in 2009, indicating that a small additional amount of switching from coal to gas, or other measures, would be needed to meet the 2007 target. By 2020, carbon dioxide emissions from power plants are 47 percent lower than 1990 levels under the Clean Energy Blueprint.
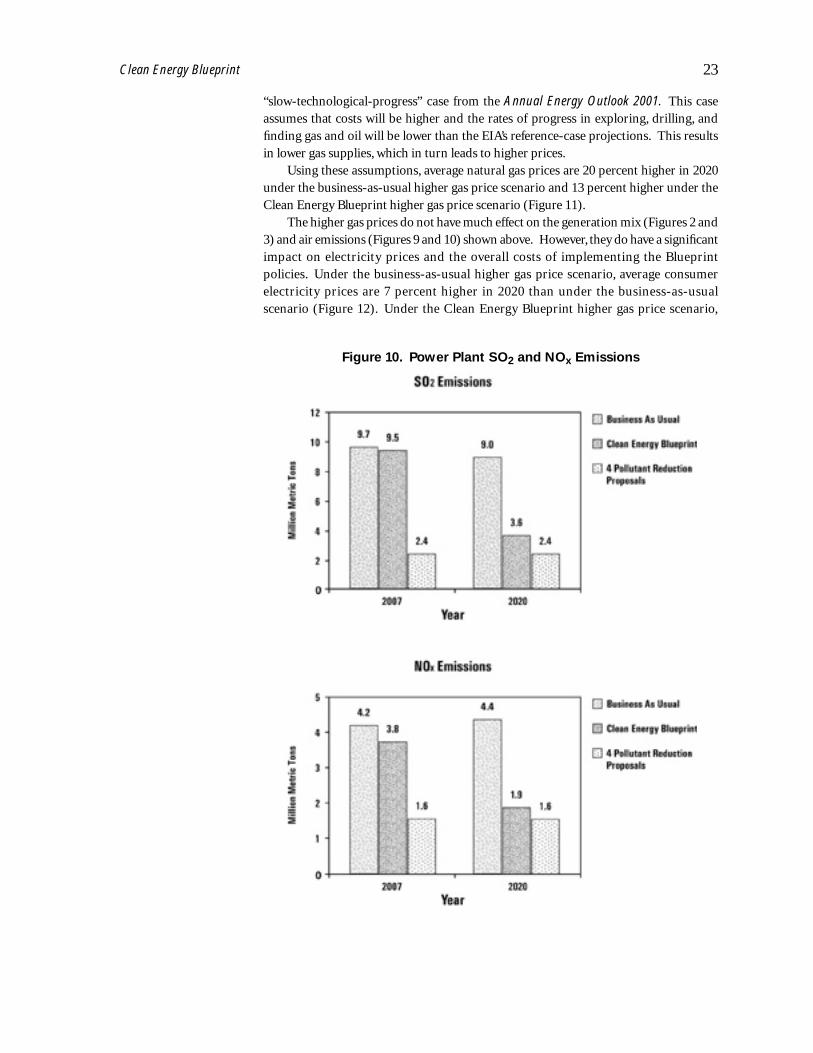
The Blueprint policies also reduce sulfur dioxide (SO2) and nitrogen oxide (NOx) emissions from fossil fuel power plants. SO2 is the primary cause of acid rain, which
Figure 8. Average Consumer Electricity Prices
a. The business-as-usual scenario assumes a typical household uses 500 kWh/month on average. Residential electricity use is 39 percent lower in 2020 under the Clean Energy Blueprint than business as usual due to energy effi ciency measures. Savings presented do not include the cost of implementing the effi ciency measures (which are included in Figure 5 above), but do refl ect the impacts of slightly higher electricity prices than business as usual.
Figure 7. Typical Household Electricity Billa
7 The Senate bill is S. 556. The House bill is H. 1256.
22 UNION OF CONCERNED SCIENTISTS
damages ecosystems and buildings, and of regional haze. It also forms fi ne particles in the air, which are associated with lung damage, cardiopulmonary disease, and premature death. NOx is a primary contributor to the formation of smog, which is associated with asthma attacks, emergency room visits, and hospitalizations.
The business-as-usual scenario assumes SO2 and NOx emissions decline to the levels required by the 1990 Clean Air Act Amendments. By 2020, the Clean Energy Blueprint achieves SO2 emission levels that are 59 percent below business as usual and NOx emission levels 57 percent below business as usual.
S. 556 calls for NOx reductions of 75 percent from 1997 levels and SO2 reductions of 75 percent below the full implementation mark of the CAA’s acid rain program by 2007. The Clean Energy Blueprint reduces SO2 and NOx emissions only slightly by 2007. While the Blueprint policies would come close to meeting the targeted emission reductions by 2020, significant additional measures would be needed to meet the S. 556 targets by 2007 (Figure 10).
A recent EIA study showed that just meeting the NOx target in S. 556 and a slightly higher SO2 target in 2008 could be achieved with little impact on electricity prices, i.e., within 1 percent of business as usual (EIA, 2001). They projected that electric generators would install pollution-control equipment and switch to lower sulfur coal to meet the targets. Thus, we do not believe that meeting the SO2 and NOx targets would add much cost to the Blueprint.
The emission reductions produced by the Blueprint policies reduce the cost of complying with the Clean Air Act. For example, in 2020, SO2 allowance prices (which represent compliance costs) are 91 percent ($260 per ton) less under the Clean Energy Blueprint than under business as usual.
Impact of Higher Natural Gas PricesProjecting natural gas prices is highly uncertain. The smooth trajectory projected
by the National Energy Modeling System in Figure 6 above does not refl ect the recent and historic volatility in natural gas prices. Natural gas prices are likely to be more volatile in the future than shown in the figure, given the large increase in gas use for electricity production projected under the business-as-usual scenario. In this section, we analyze the impact of higher gas prices using the EIA’s assumptions for the
Figure 9. Power Plant Carbon Dioxide Emissions
23Clean Energy Blueprint
“slow-technological-progress” case from the Annual Energy Outlook 2001. This case assumes that costs will be higher and the rates of progress in exploring, drilling, and fi nding gas and oil will be lower than the EIA’s reference-case projections. This results in lower gas supplies, which in turn leads to higher prices.
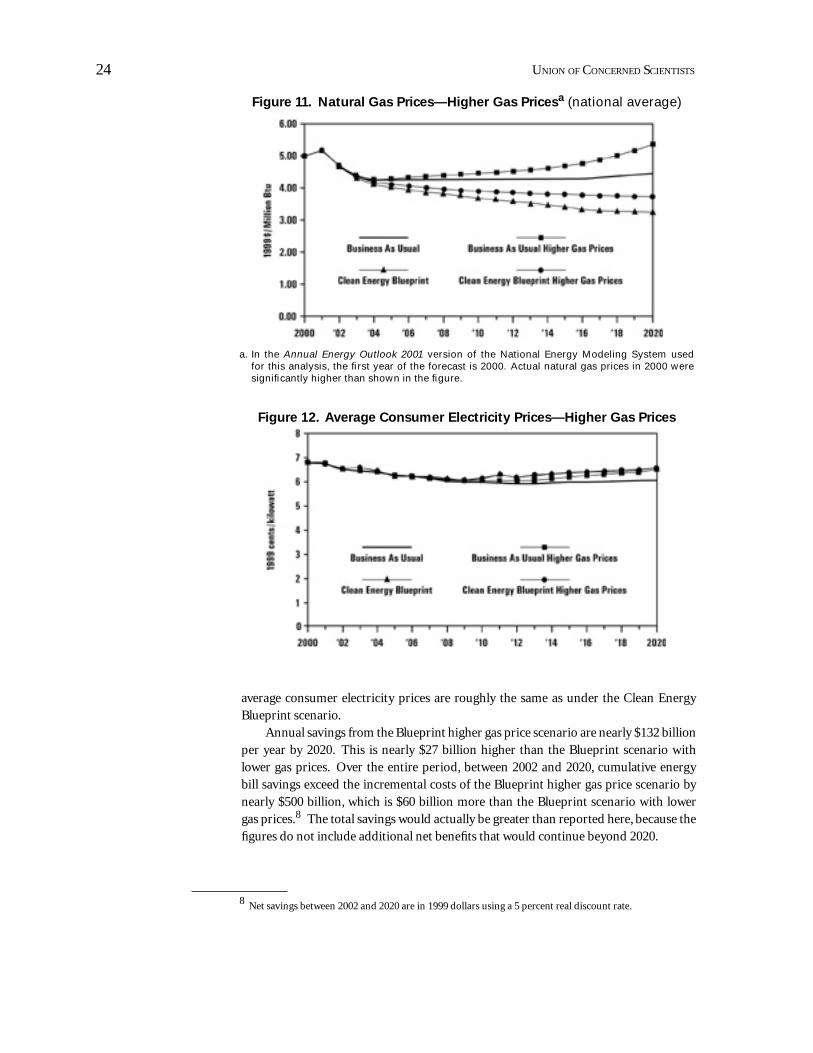
Using these assumptions, average natural gas prices are 20 percent higher in 2020 under the business-as-usual higher gas price scenario and 13 percent higher under the Clean Energy Blueprint higher gas price scenario (Figure 11).
The higher gas prices do not have much effect on the generation mix (Figures 2 and 3) and air emissions (Figures 9 and 10) shown above. However, they do have a signifi cant impact on electricity prices and the overall costs of implementing the Blueprint policies. Under the business-as-usual higher gas price scenario, average consumer electricity prices are 7 percent higher in 2020 than under the business-as-usual scenario (Figure 12). Under the Clean Energy Blueprint higher gas price scenario,
Figure 10. Power Plant SO2 and NOx Emissions
24 UNION OF CONCERNED SCIENTISTS
average consumer electricity prices are roughly the same as under the Clean Energy Blueprint scenario.
Annual savings from the Blueprint higher gas price scenario are nearly $132 billion per year by 2020. This is nearly $27 billion higher than the Blueprint scenario with lower gas prices. Over the entire period, between 2002 and 2020, cumulative energy bill savings exceed the incremental costs of the Blueprint higher gas price scenario by nearly $500 billion, which is $60 billion more than the Blueprint scenario with lower gas prices.8 The total savings would actually be greater than reported here, because the fi gures do not include additional net benefi ts that would continue beyond 2020.
Figure 12. Average Consumer Electricity Prices—Higher Gas Prices
8 Net savings between 2002 and 2020 are in 1999 dollars using a 5 percent real discount rate.
Figure 11. Natural Gas Prices—Higher Gas Pricesa (national average)
a. In the Annual Energy Outlook 2001 version of the National Energy Modeling System used for this analysis, the fi rst year of the forecast is 2000. Actual natural gas prices in 2000 were signifi cantly higher than shown in the fi gure.
25Clean Energy Blueprint
The Renewable Energy and Energy Efficiency Investment Act of 2001 (S. 1333)
Electricity Generation and Use under S. 1333We have chosen to analyze S. 1333 separately because it is the single most
comprehensive energy effi ciency and renewable energy bill currently being considered in Congress. S. 1333 includes the renewable portfolio standard, public benefi ts fund, and net metering—plus increased R&D funding for renewable energy. It does not, however, include all of the energy effi ciency, renewable energy, or CHP policies that are included in the Clean Energy Blueprint.
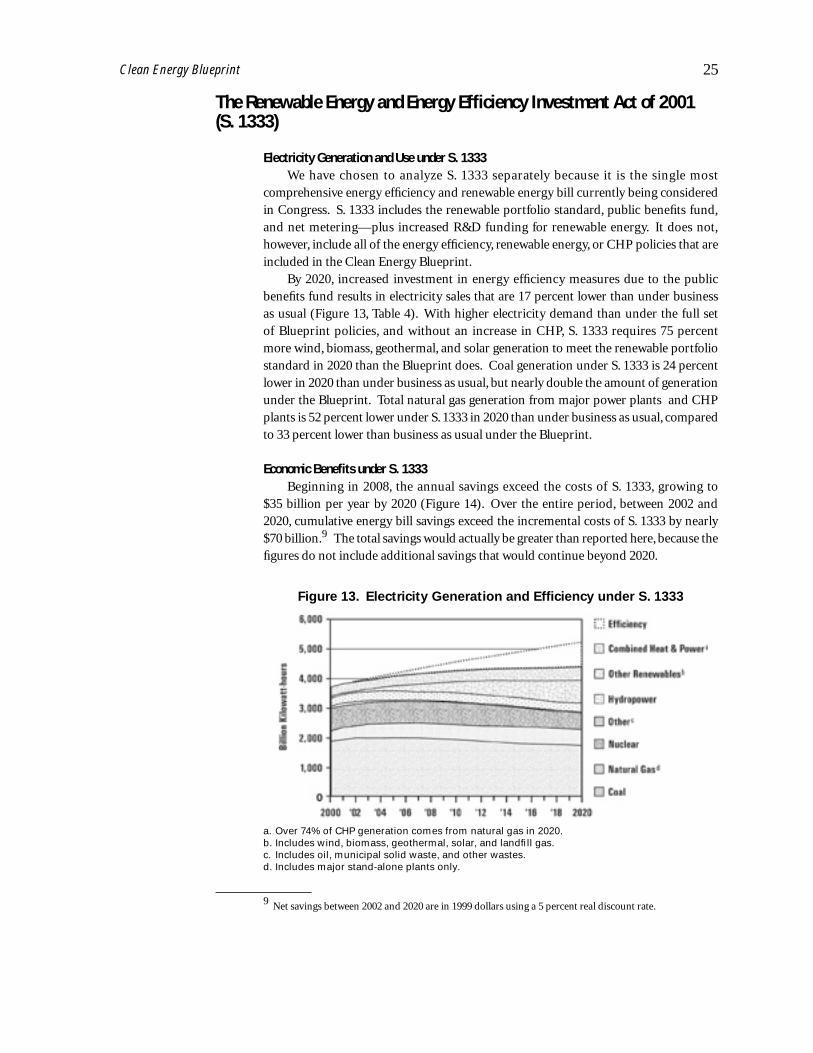
By 2020, increased investment in energy effi ciency measures due to the public benefi ts fund results in electricity sales that are 17 percent lower than under business as usual (Figure 13, Table 4). With higher electricity demand than under the full set of Blueprint policies, and without an increase in CHP, S. 1333 requires 75 percent more wind, biomass, geothermal, and solar generation to meet the renewable portfolio standard in 2020 than the Blueprint does. Coal generation under S. 1333 is 24 percent lower in 2020 than under business as usual, but nearly double the amount of generation under the Blueprint. Total natural gas generation from major power plants and CHP plants is 52 percent lower under S. 1333 in 2020 than under business as usual, compared to 33 percent lower than business as usual under the Blueprint.
Economic Benefits under S. 1333Beginning in 2008, the annual savings exceed the costs of S. 1333, growing to
$35 billion per year by 2020 (Figure 14). Over the entire period, between 2002 and 2020, cumulative energy bill savings exceed the incremental costs of S. 1333 by nearly $70 billion.9 The total savings would actually be greater than reported here, because the fi gures do not include additional savings that would continue beyond 2020.
9 Net savings between 2002 and 2020 are in 1999 dollars using a 5 percent real discount rate.
Figure 13. Electricity Generation and Effi ciency under S. 1333
a. Over 74% of CHP generation comes from natural gas in 2020.b. Includes wind, biomass, geothermal, solar, and landfi ll gas.c. Includes oil, municipal solid waste, and other wastes.d. Includes major stand-alone plants only.

26 UNION OF CONCERNED SCIENTISTS
Figure 14. Net Savings under S. 1333a
a. Net savings equal energy bill savings minus incremental costs. Energy bill savings include energy savings to consumers due to installing energy-effi cient technologies and lower prices for certain fuels (mainly natural gas), minus the costs of S. 1333 policies included in electricity prices. Incremental costs include the direct costs of purchasing energy-effi cient technologies by consumers annualized over the life of the equipment and the costs of administering and implementing the policies not directly refl ected in consumer energy bills.
Table 4. Electricity Generation and Effi ciency under S. 1333 (billion kWh)
a. Includes oil, municipal solid waste, and other wastes.b. Includes a small amount of combined heat and power from biomass sources that are assumed to be eligible for the RPS.c. In 2020, natural gas constitutes over 74% of CHP generation under S. 1333, 91% under the Clean Energy Blueprint, and
71% under business as usual.
27Clean Energy Blueprint
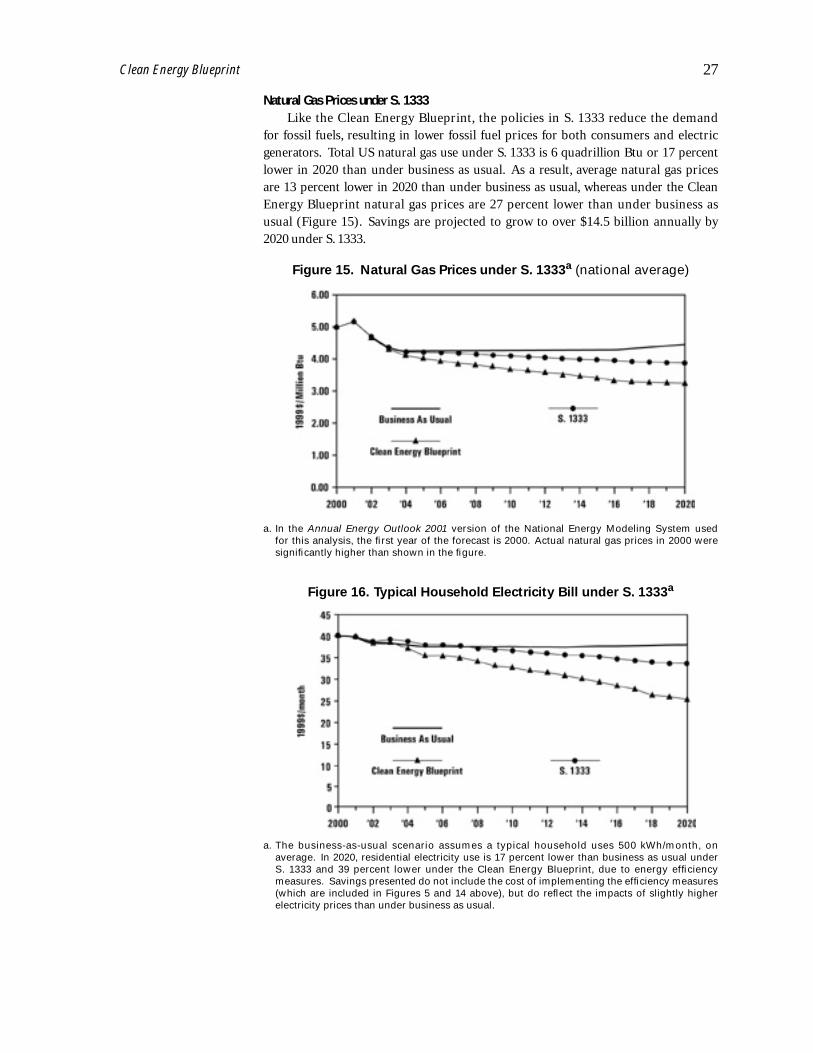
Natural Gas Prices under S. 1333Like the Clean Energy Blueprint, the policies in S. 1333 reduce the demand
for fossil fuels, resulting in lower fossil fuel prices for both consumers and electric generators. Total US natural gas use under S. 1333 is 6 quadrillion Btu or 17 percent lower in 2020 than under business as usual. As a result, average natural gas prices are 13 percent lower in 2020 than under business as usual, whereas under the Clean Energy Blueprint natural gas prices are 27 percent lower than under business as usual (Figure 15). Savings are projected to grow to over $14.5 billion annually by 2020 under S. 1333.
Figure 15. Natural Gas Prices under S. 1333a (national average)
a. In the Annual Energy Outlook 2001 version of the National Energy Modeling System used for this analysis, the fi rst year of the forecast is 2000. Actual natural gas prices in 2000 were signifi cantly higher than shown in the fi gure.
Figure 16. Typical Household Electricity Bill under S. 1333a
a. The business-as-usual scenario assumes a typical household uses 500 kWh/month, on average. In 2020, residential electricity use is 17 percent lower than business as usual under S. 1333 and 39 percent lower under the Clean Energy Blueprint, due to energy effi ciency measures. Savings presented do not include the cost of implementing the effi ciency measures (which are included in Figures 5 and 14 above), but do refl ect the impacts of slightly higher electricity prices than under business as usual.
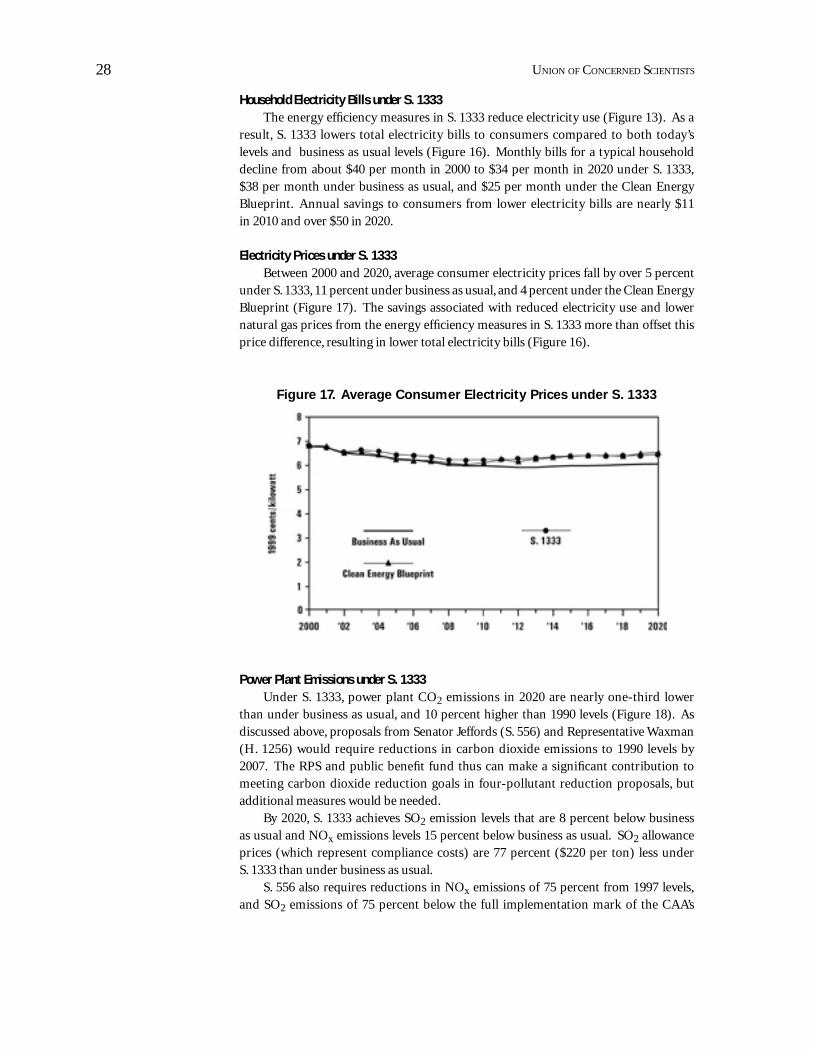
28 UNION OF CONCERNED SCIENTISTS
Household Electricity Bills under S. 1333The energy effi ciency measures in S. 1333 reduce electricity use (Figure 13). As a
result, S. 1333 lowers total electricity bills to consumers compared to both today’s levels and business as usual levels (Figure 16). Monthly bills for a typical household decline from about $40 per month in 2000 to $34 per month in 2020 under S. 1333, $38 per month under business as usual, and $25 per month under the Clean Energy Blueprint. Annual savings to consumers from lower electricity bills are nearly $11 in 2010 and over $50 in 2020.
Electricity Prices under S. 1333Between 2000 and 2020, average consumer electricity prices fall by over 5 percent
under S. 1333, 11 percent under business as usual, and 4 percent under the Clean Energy Blueprint (Figure 17). The savings associated with reduced electricity use and lower natural gas prices from the energy effi ciency measures in S. 1333 more than offset this price difference, resulting in lower total electricity bills (Figure 16).
Figure 17. Average Consumer Electricity Prices under S. 1333
Power Plant Emissions under S. 1333Under S. 1333, power plant CO2 emissions in 2020 are nearly one-third lower
than under business as usual, and 10 percent higher than 1990 levels (Figure 18). As discussed above, proposals from Senator Jeffords (S. 556) and Representative Waxman (H. 1256) would require reductions in carbon dioxide emissions to 1990 levels by 2007. The RPS and public benefi t fund thus can make a signifi cant contribution to meeting carbon dioxide reduction goals in four-pollutant reduction proposals, but additional measures would be needed.
By 2020, S. 1333 achieves SO2 emission levels that are 8 percent below business as usual and NOx emissions levels 15 percent below business as usual. SO2 allowance prices (which represent compliance costs) are 77 percent ($220 per ton) less under S. 1333 than under business as usual.
S. 556 also requires reductions in NOx emissions of 75 percent from 1997 levels, and SO2 emissions of 75 percent below the full implementation mark of the CAA’s
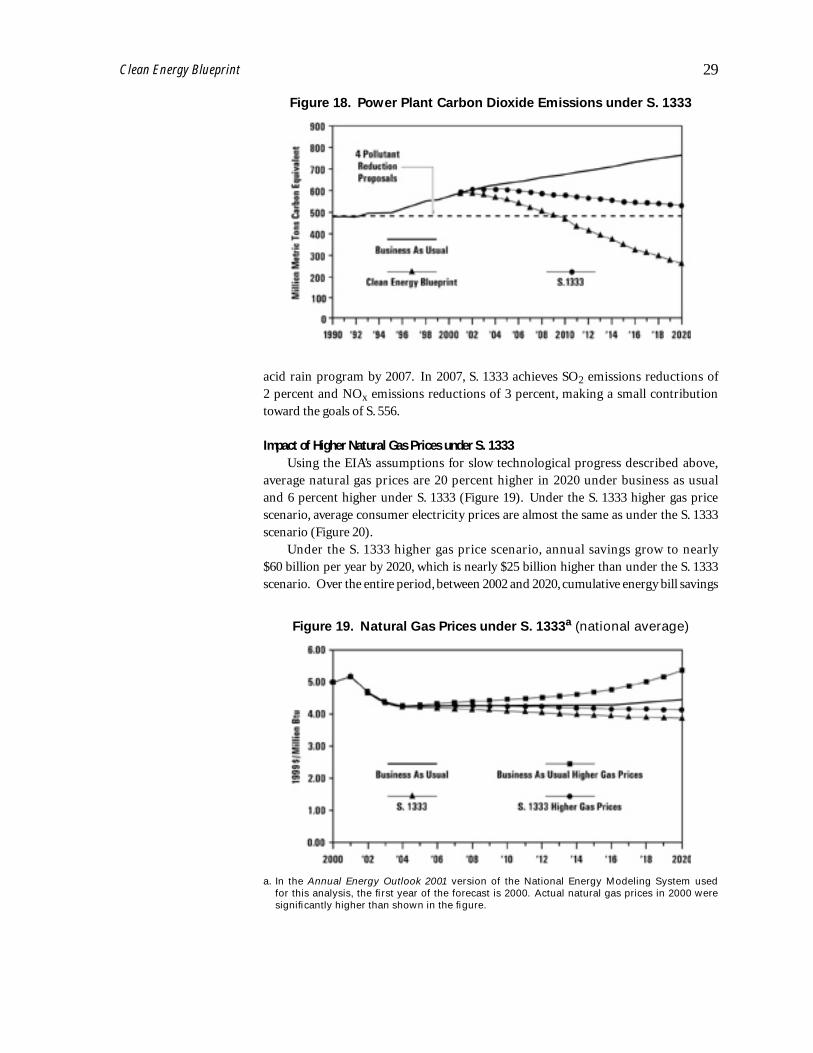
29Clean Energy Blueprint
acid rain program by 2007. In 2007, S. 1333 achieves SO2 emissions reductions of 2 percent and NOx emissions reductions of 3 percent, making a small contribution toward the goals of S. 556.
Impact of Higher Natural Gas Prices under S. 1333Using the EIA’s assumptions for slow technological progress described above,
average natural gas prices are 20 percent higher in 2020 under business as usual and 6 percent higher under S. 1333 (Figure 19). Under the S. 1333 higher gas price scenario, average consumer electricity prices are almost the same as under the S. 1333 scenario (Figure 20).
Under the S. 1333 higher gas price scenario, annual savings grow to nearly $60 billion per year by 2020, which is nearly $25 billion higher than under the S. 1333 scenario. Over the entire period, between 2002 and 2020, cumulative energy bill savings
Figure 19. Natural Gas Prices under S. 1333a (national average)
a. In the Annual Energy Outlook 2001 version of the National Energy Modeling System used for this analysis, the fi rst year of the forecast is 2000. Actual natural gas prices in 2000 were signifi cantly higher than shown in the fi gure.
Figure 18. Power Plant Carbon Dioxide Emissions under S. 1333
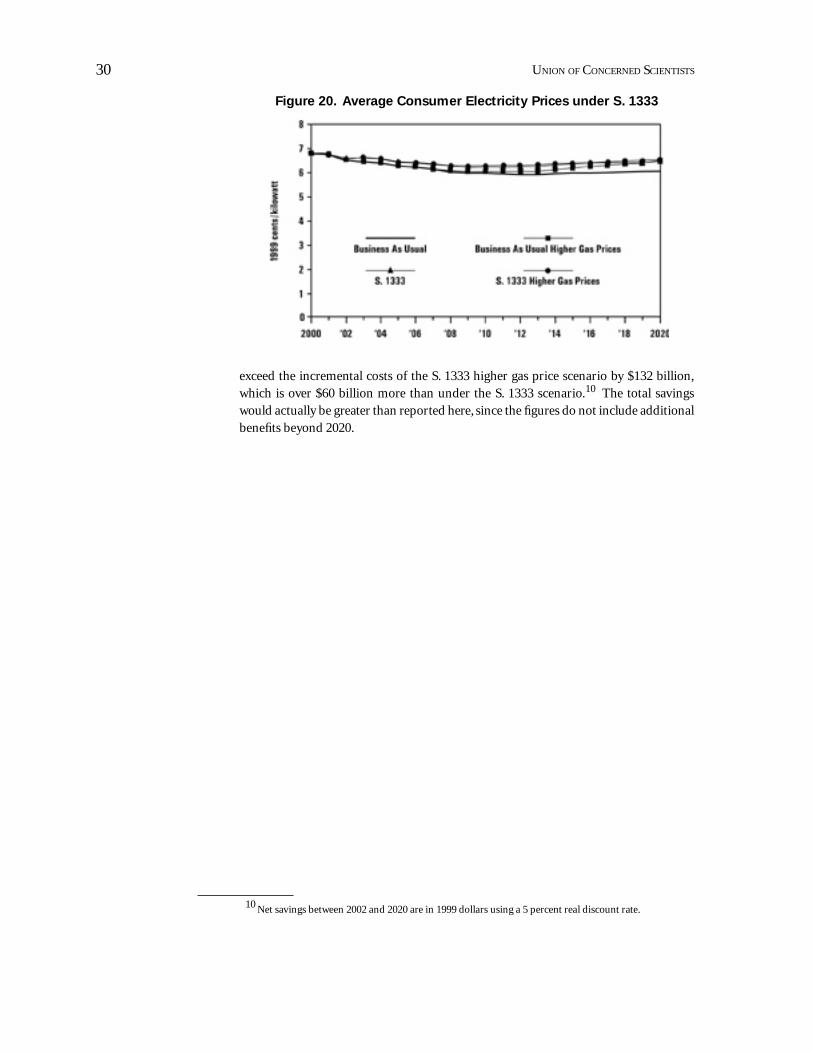
30 UNION OF CONCERNED SCIENTISTS
Figure 20. Average Consumer Electricity Prices under S. 1333
exceed the incremental costs of the S. 1333 higher gas price scenario by $132 billion, which is over $60 billion more than under the S. 1333 scenario.10 The total savings would actually be greater than reported here, since the fi gures do not include additional benefi ts beyond 2020.
10 Net savings between 2002 and 2020 are in 1999 dollars using a 5 percent real discount rate.
C H A P T E R 5
Additional benefi ts of the Clean Energy Blueprint
While they are not explicitly quantifi ed in this study, the Clean Energy Blueprint would also provide many additional environmental, economic, and national security benefi ts.
Environmental BenefitsBy reducing the use of natural gas and coal, the Clean Energy Blueprint decreases
the need to expand natural gas drilling and coal mining, creating less pressure to open public lands and sensitive areas to fossil fuel exploration. Less gas must be transported, lessening pressure for the 301,000 miles in natural gas transmission and distribution pipelines that the National Energy Plan says must be built (NEPDG, 2001). Less coal mining means less damage to land and water. And with consumers using less electricity, fewer new transmission lines would be needed, reducing pressure for extreme measures like federal seizure of private land for power lines under eminent domain.
The NEMS computer model does not calculate emissions of toxic chemicals. But with coal use dropping by nearly 60 percent under the Clean Energy Blueprint, emissions of mercury, arsenic, and other toxic metals would also drop, reducing damage to ecosystems and threats to human health.
Economic BenefitsMore efficient use of electricity increases the efficiency of the
economy as a whole, making the United States more competitive around the globe. Overall, the nation’s energy system will be more stable and reliable, which has numerous economic benefi ts. By lowering electricity demand, the Clean Energy Blueprint will reduce the threat of electricity shortages, helping to avoid price spikes as well as blackouts or brownouts. Adding renewable energy supplies will protect the consumer by diversifying the energy mix with resources that are not imported and that are less subject to supply and price manipulation.
Energy effi ciency and renewable energy can also create more jobs and income than investments in fossil fuels and nuclear power. A 1997 study by UCS and others—Energy Innovations—found that implementing a more comprehensive package of clean energy policies and technologies than considered in this study would create nearly 800,000 more jobs, $14 billion in additional income, and nearly $3 billion in higher gross domestic product than business as usual (in 1993 dollars) (Alliance to Save Energy et al., 1997).
The increase in renewable energy would especially benefi t rural economies and provide a new cash crop for farmers. For example, generating 5 percent of the country’s
More effi cient use of electricity increases the effi ciency of the economy as a whole.

32 UNION OF CONCERNED SCIENTISTS
electricity with wind power by 2020, would add $60 billion in capital investment in rural America, provide $1.2 billion in new income for farmers and rural landowners, and create 80,000 new jobs according to the US Department of Energy (DOE, 2000a). In the Midwest, wind developers are paying farmers $2,000 or more per year for each wind turbine installed on their land. Each turbine uses only about a quarter acre, so farmers can plant crops and graze livestock right to the turbine’s base. The DOE also estimates that tripling US use of biomass energy could provide as much as $20 billion in new income for farmers and rural communities (DOE, 2000b). Under the Clean Energy Blueprint, biomass energy use doubles and wind power provides nearly 8 percent of the country’s electricity by 2020. Thus, the Blueprint would capture many of these rural economic benefi ts.
Reducing air pollution through the Clean Energy Blueprint will also benefi t the economy. With less acid rain damaging lakes, forests, and wildlife, revenues from tourism and fi shing will increase. Decreasing smog and soot emissions will lower the number of asthma attacks, emergency room visits, premature deaths, and other illnesses, thereby lowering health care and insurance costs and increasing worker productivity.
National Security BenefitsImproving energy effi ciency, increasing the diversity of supply, and developing
small, distributed generation sources will all contribute to increasing national security (Lovins and Lovins, 1982). The Clean Energy Blueprint will reduce our use of oil and will reduce the vulnerability of our energy infrastructure.
Neither of these benefits are achievable quickly. We do not suggest that they are appropriate as emergency security measures or that they are substitutes for direct improvements in security at existing energy facilities. Over time, however, our energy choices will determine whether we face increased security risks, or decreasing vulnerability and risks.
As discussed on page 14 above, the Clean Energy Blueprint will reduce oil use by 410 million barrels of oil per year, or 5 percent less than business as usual, by 2020. While this reduction is modest, it is larger than the amount of oil that is economically recoverable over 60 years by drilling in the Arctic National Wildlife Refuge, which some have advocated as a security measure. When combined with transportation efficiency measures, the potential oil savings vastly outweigh the potential from drilling in the Wildlife Refuge. Moreover, oil savings through effi ciency do not rely on a long pipeline through remote areas, which is itself highly vulnerable to disruption.
The Clean Energy Blueprint will decrease the number and size of vulnerable energy processing, storage, and distribution facilities, such as refi neries, pipelines, gas storage facilities, and liquefi ed natural gas tankers. It will avoid the need for more than 900 new natural gas-fi red power plants and allow for the earlier retirement of 14 large nuclear plants.
Renewable generators, such as solar and wind, are geographically dispersed and contain no volatile fuel stocks or radioactive materials. Distributed generation, including combined heat and power systems and small renewable energy systems, is also less vulnerable to disruption and can help the nation create a more secure and resilient energy system. James Woolsey, former head of the Central Intelligence Agency,

33Clean Energy Blueprint
Robert McFarlane, former national security advisor, and Admiral Thomas Moorer, former chair of the Joint Chiefs of Staff, recently urged Congress to enact a federal renewable portfolio standard, public benefi t fund, and other measures, in order to help increase national security (Air Daily, 2001).

C H A P T E R 6
a pROMISING eNERGY fUTURE
The nation needs a balanced approach to meeting future energy demands—one that invests in clean and effi cient technologies both to reduce energy demands and to increase energy supplies. This analysis by UCS and its co-authors shows that energy effi ciency and renewable energy sources can meet a large share of the country’s energy needs both today and in the future, including replacing some of the most polluting power plants that operate today. Moreover, they do so while providing health and environmental benefi ts, lower energy bills, and net savings to consumers.
The policies in the Clean Energy Blueprint are practical and achievable. In fact, many of the policies proposed here have already proven successful and cost-effective at the national or the state level. Many states have been leaders in developing and
demonstrating new approaches for improving energy effi ciency and deploying renewable energy. Texas has been one such leader. Then-Governor Bush signed a law in 1999 that included a renewable portfolio standard—a policy completely ignored in the administration’s National Energy Plan. The Texas law created the largest market for new renew-able energy development in the country, requiring electricity companies to supply 2,000 megawatts of new renewable resources by 2009. The state may actually meet the goal for 2009 by the end of 2002, seven years early (AWEA, 2000).
One of the greatest advantages that energy effi ciency and renewable energy sources offer over new power plants, transmission lines, and pipelines is the ability deploy these technologies with almost no delay. Energy-effi cient technologies can be deployed much faster than any alternative. It takes only six months to add new wind turbines to existing wind farms. We can implement the policies of the Clean Energy Blueprint now and begin seeing benefi ts right away.
Over 18 years, the policies of the Clean Energy Blueprint can save consumers nearly $440 billion, with annual savings to consumers from lower total energy bills reaching $350 by 2020. The Clean Energy Blueprint can also eliminate the need for nearly 1,200 fossil fuel and nuclear power plants, cut coal use for electricity generation by nearly 60 percent of what it would have been, and affordably reduce over two thirds of the carbon dioxide emissions from power plants.
Energy effi ciency and renewable energy technologies are ready to serve us. Now we need vision, leadership, and determination to provide a clean, affordable energy future.
Many of the policies proposed here have already proven successful and cost-effective at the national or the state level.

References
Air Daily. 2001. “Terrorism Fallout Fuels Renewable Energy Debate.” Air Daily 8(190):1.
Alliance to Save Energy, American Council for an Energy-Efficient Economy, Natural Resource Defense Council, Tellus Institute, and Union of Concerned Scien-tists. 1997. Energy Innovations: A Prosperous Path to a Clean Environment. Washington, D.C.: Alliance to Save Energy.
American Wind Energy Association (AWEA). 2000. “Texas Utilities Power Ahead on Meeting Renewable Energy Goal.” On the American Wind Energy Association website at www.awea.org/news/news000831txu.html, accessed on August 31, 2000.
Energy Information Administration (EIA). 2001. Analysis of Strategies for Reducing Multiple Emissions from Electric Power Plants: Sulfur Dioxide, Nitrogen Oxides, Carbon Dioxide, and Mercury and a Renewable Portfolio Standard. Washington, D.C.: Energy Information Administration.
Energy Information Administration (EIA). 2000a. Annual Energy Outlook 2001. Wash-ington, D.C.: US Department of Energy. For more information on the National Energy Modeling System, see the EIA website at www.eia.doe.gov/oiaf/aeo.html.
Energy Information Administration (EIA). 2000b. Potential Oil Production from the Coastal Plain of the Arctic National Wildlife Refuge: Updated Assessment. SR/O&G/2000-02. Washington, D.C.: US Department of Energy. May.
Geller, H., T. Kubo, and S. Nadel, 2001. Overall Savings from Federal Appliance and Equipment Efficiency Standards. Washington, D.C.: American Council for an Energy-Effi cient Economy.
Geller, H., S. Bernow, and W. Dougherty. 1999. Meeting America’s Kyoto Protocol Target: Policies and Impacts. Washington, D.C.: American Council for an Energy-Effi cient Economy.
Goldberg, M. 2000. Federal Energy Subsidies: Not all Technologies are Created Equal. Washington, D.C.: Renewable Energy Policy Project.

38 UNION OF CONCERNED SCIENTISTS
Hadley, S., L. Hill, and R. Perlack. (1993). Report on the Study of the Tax and Rate Treatment of Renewable Energy Projects. ORNL-6772. Oak Ridge, Tenn.: Oak Ridge National Laboratory.
Interlaboratory Working Group (IWG). 2000. Scenarios for a Clean Energy Future. ORNL/CON-476. Oak Ridge, Tenn.: Oak Ridge National Laboratory. Available on the ORNL website at www.ornl.gov/ORNL/Energy_Eff/CEF.htm.
Joint Committee on Taxation (JCT). 2001. “Estimated Revenue Effects of a Chairman’s Amendment in the Nature of a Substitute to the Energy Tax Policy Act of 2001,” on the US House of Representatives website at www.house.gov/jct/x-62-01.pdf, accessed on July 18, 2001.
Kauffman, H. 1999. “Johnson & Johnson Strives to Implement Best Practices by 2000,” In Proceedings of the ACEEE 1999 Summer Study on Energy Efficiency in Industry, Washington, D.C.: American Council for an Energy-Effi cient Economy.
Lobsenz, G. 2001. “Abraham: ‘Dangerous Dependency’ Looms for Nation on Natural Gas,” Energy Daily 29(143):4.
Lovins, A., and L. Lovins. 1982. Brittle Power: Energy Strategy for National Security. Andover, Mass.: Brick House. For more information from A. Lovins on this topic, see also “Real Security: Exposing vulnerabilities in our energy system so that we might overcome them,” In Context 4(August 1983):13, on the In Context website at www.context.org/ICLIB/IC04/Lovins.htm.
Nadel, S., and H. Geller. 2001. Smart Energy Policies: Saving Money and Reducing Pollutant Emissions through Greater Energy Effi ciency. Washington, D.C.: American Council for an Energy-Effi cient Economy.
National Energy Policy Development Group (NEPDG). 2001. National Energy Policy. Washington, D.C.: National Energy Policy Development Group.
Nogee, A., S. Clemmer, B. Paulos, and B. Haddad. 1999. Powerful Solutions: 7 Ways to Switch to Renewable Electricity. Cambridge, Mass.: Union of Concerned Scientists.
President’s Committee of Advisors on Science and Technology (PCAST). 1997. Fed-eral Energy Research and Development for the Challenges of the Twenty-First Century. Washington, D.C.: Offi ce of the President.
Romm, J. 1999. Cool Companies: How the Best Businesses Boost Profi ts and Productivity by Cutting Greenhouse Gas Emissions. Washington, D.C.: Island Press.
Sissine, F. 1994. Renewable Energy: A National Commitment? Washington, D.C.: Science Policy Research Division, Congressional Research Service.
39Clean Energy Blueprint
Union of Concerned Scientists (UCS). 2001. Drilling in Detroit: Tapping Automaker Ingenuity to Build Safe and Efficient Automobiles. Cambridge, Mass.: Union of Concerned Scientists.
US Combined Heat and Power Association (USCHPA). 2001. “Combined Heat and Power: Distributed generation applications that save power, reduce costs, and improve energy security,” on the USCHPA website at www.nemw.org/CHPbenefi ts.pdf, accessed on September 4, 2001.
US Department of Energy (DOE). 2001. Solar-Electric Power: The US Photovoltaic Industry Roadmap. Golden, Colo.: National Center for Photovoltaics.
US Department of Energy (DOE). 2000a. Wind Powering America: Clean Energy for the 21st Century. Washington, D.C.: National Renewable Energy Laboratory.
US Department of Energy (DOE). 2000b. “New Energy Department Report Provides New Perspectives on Agriculture’s Link to Greenhouse Gases.” On the DOE website at www.energy.gov/HQPress/releases00/janpr/pr00007.htm, January 14, 2000.
US Geological Survey (USGS). 1998. Arctic National Wildlife Refuge, 1002 Area, Petroleum Assessment, 1998. USGS Fact Sheet FS-040-98. Washington, D.C.: US Department of Interior. May.
Worrell, E., N. Martin, and L. Price. 1999. Energy Efficiency and Carbon Dioxide Emissions Reduction Opportunities in the US Iron and Steel Industry. LBNL-41724. Berkeley, Calif.: Lawrence Berkeley National Laboratory.