CLEAN DEVELOPMENT MECHANISM SMALL-SCALE PROGRAM ACTIVITY DESIGN …carboncheck.co.in/projects/40...
52
PROJECT DESIGN DOCUMENT FORM (CDM-SSC-PDD) - Version 03 CDM – Executive Board 1 CLEAN DEVELOPMENT MECHANISM SMALL-SCALE PROGRAM ACTIVITY DESIGN DOCUMENT FORM (CDM-SSC-CPA-DD) Version 01 CONTENTS A. General description of CDM programme activity (CPA) B. Eligibility of CPA and Estimation of Emission Reductions C. Environmental Analysis D. Stakeholder comments Annexes Annex 1: Contact information on entity/individual responsible for the CPA Annex 2: Information regarding public funding Annex 3: Baseline information Annex 4: Monitoring plan NOTE: (i) This form is for submission of CPAs that apply a small scale approved methodology using the provision of the proposed small scale CDM PoA. (ii) The coordinating/managing entity shall prepare a CDM Small Scale Programme Activity Design Document (CDM-SSC-CPA-DD) 1,2 that is specified to the proposed PoA by using the provisions stated in the SSC PoA DD. At the time of requesting registration the SSC PoA DD must be accompanied by a CDM-SSC CPA-DD form that has been specified for the proposed SSC PoA, as well as by one completed CDM-SSC CPA-DD (using a real case). After the first CPA, every CPA that is added over time to the SSC PoA must submit a completed CDM-SSC CPA-DD. 1 The latest version of the template form CDM-CPA-DD is available on the UNFCCC CDM web site in the reference/document section. 2 At the time of requesting validation/registration, the coordinating managing entity is required to submit a completed CDM-POA-DD, the PoA specific CDM-CPA-DD, as well as one of such CDM-CPA-DD completed (using a real case).
Transcript of CLEAN DEVELOPMENT MECHANISM SMALL-SCALE PROGRAM ACTIVITY DESIGN …carboncheck.co.in/projects/40...
PROJECT DESIGN DOCUMENT FORM (CDM-SSC-PDD) - Version 03
CDM ndash Executive Board
1
CLEAN DEVELOPMENT MECHANISM
SMALL-SCALE PROGRAM ACTIVITY DESIGN DOCUMENT FORM (CDM-SSC-CPA-DD)
Version 01
CONTENTS
A General description of CDM programme activity (CPA)
B Eligibility of CPA and Estimation of Emission Reductions
C Environmental Analysis
D Stakeholder comments
Annexes
Annex 1 Contact information on entityindividual responsible for the CPA
Annex 2 Information regarding public funding
Annex 3 Baseline information
Annex 4 Monitoring plan
NOTE
(i) This form is for submission of CPAs that apply a small scale approved methodology using the
provision of the proposed small scale CDM PoA
(ii) The coordinatingmanaging entity shall prepare a CDM Small Scale Programme Activity Design
Document (CDM-SSC-CPA-DD)12 that is specified to the proposed PoA by using the provisions stated in
the SSC PoA DD At the time of requesting registration the SSC PoA DD must be accompanied by a
CDM-SSC CPA-DD form that has been specified for the proposed SSC PoA as well as by one completed
CDM-SSC CPA-DD (using a real case) After the first CPA every CPA that is added over time to the
SSC PoA must submit a completed CDM-SSC CPA-DD
1 The latest version of the template form CDM-CPA-DD is available on the UNFCCC CDM web site in the
referencedocument section
2 At the time of requesting validationregistration the coordinating managing entity is required to submit a
completed CDM-POA-DD the PoA specific CDM-CPA-DD as well as one of such CDM-CPA-DD completed
(using a real case)
PROJECT DESIGN DOCUMENT FORM (CDM-SSC-PDD) - Version 03
CDM ndash Executive Board
2
SECTION A General description of small scale CDM programme activity (CPA)
A1 Title of the small-scale CPA
Felda Triang Regional Biogas PoA ndash CPA 1
Version 10
Date 12032012
A2 Description of the small-scale CPA
The CPA for Felda Triang Regional Biogas PoA ndash CPA 1 is developed by Felda Palm Industrial Sdn
Bhd (ldquoFPISBrdquo) (hereafter referred to as the ldquoproject hostrdquo) who will act as ldquoProject Implementerrdquo It is a
biogas recovery and utilization project The CPA will be developed under the PoA of Regional Biogas
PoA and it is located in Triang Pahang Malaysia (ldquohost countryrdquo) It is an existing mill with a capacity to
process up to 54 metric tonnes of Fresh Fruit Bunch (FFB) per hour3 The palm oil extraction process
generates about 10 m3 of palm oil mill effluent (POME) for each metric tonnes of FFB processed4 In
order to reduce the impact on the environment the discharge limits of POME are currently reduced by
treatment in a series of lagoons in Effluent Treatment Plant (ldquoETPrdquo) It consists of several steps including
coolingmixing anaerobic facultative algae ponds bio-polishing treatment systems to reduce the BOD
to a level acceptable for river discharge There is no land application of the treated effluent
Purpose of project activity
This project aims to mitigate methane emissions a highly potent Greenhouse Gas resulting from
anaerobic digestion of palm oil mill effluent (POME) in the open lagoons treatment system (baseline) It
involves the introduction of a sequential stage wastewater treatment with biogas recovery and
combustion without sludge treatment from an existing anaerobic wastewater treatment system without
biogas recovery The captured biogas may be utilized either in gas engine(s) for electricity generation to
export to grid andor for diesel displacement at mill andor combusted in the biomass boiler(s) for heat
generation andor flared Currently there are no mandatory laws or regulations in Malaysia that require
biogas recovery at wastewater open lagoons system and to destroy or use it for any purpose It is
estimated that the CPA will reduce 29280 tCO2e annually
The project activity will reduce GHG emissions by capture and destruction of methane from anaerobic
decomposition of biogenic organic matter in an open lagoons treatment system and potentially by
displacing fossil fuel that would be used for electricity or heat generation in the absence of the project
activity
Environmental criterion
- The reduction of CH4 emissions will improve the quality of the surrounding air
- It will also reduce the GHG emissions and results in the preservation of the climate
3 SD 1 - Mill License EQA 1974 4 Mill designed for existing effluent treatment system
PROJECT DESIGN DOCUMENT FORM (CDM-SSC-PDD) - Version 03
CDM ndash Executive Board
3
- The new treatment plant is expected to improve the quality of the discharge water due to better
management
Social criterion
- By reducing the methane emission the project will contribute to the health of the population in the
area and nearby
- Besides providing job opportunities the project will also set in motion a demonstration effect leading
to other units adopting similar activity which would go to improve the job opportunity
- The increased job opportunity will reduce social disparity in the society and thereby contribute to
peace in the society
Economic criterion
- The project involves a technology transfer into host country Indeed the open anaerobic lagoons are
replaced by either bio-digester
- Training will be provided to the locals to ensure them to be able to execute and manage the project It
leads to the increase of the local skills
- Provide job opportunities especially for the local community live nearby
A3 Entityindividual responsible for the small-scale CPA
Felda Palm Industrial Sdn Bhd is the entity responsible for the Felda Triang Regional Biogas PoA ndash
CPA 1
A4 Technical description of the small-scale CPA
Technology Description
The project activity includes the following systems
a) The methane capture in newly built covered lagoon
The project activity involves the introduction of a sequential stage covered lagoon(s) to an existing
open lagoons system The biogas recovery system is designed by KPSR Construction Ltd with
experience in implementing projects at palm oil mills The project activity consists of newly
constructed covered lagoon(s) anaerobic treatment system that will be built for the treatment of
POME effluent and biogas recovery
The covered lagoon treatment system developed by KPSR Construction Ltd adopts a series of
treatment processes consisting mainly of pretreatment and anaerobic degradation Raw POME will
be channeled to the cooling pondtower intended for cooling of the effluent before being sent to the
covered anaerobic digester system The new lagoon(s) will be covered by synthetic high-density
polyethylene (HDPE) geo-membrane which is sealed by means of strip-to-strip welding and a
peripheral anchor trench dug around the perimeter of the existing lagoon HDPE is an excellent
product for large applications requiring UV ozone and chemical resistance and because of these
attributes is one of the most commonly used geo-membranes worldwide
PROJECT DESIGN DOCUMENT FORM (CDM-SSC-PDD) - Version 03
CDM ndash Executive Board
4
The recovery of biogas reduces odour and prevents methane emissions The covered lagoon system
is expected to be able to achieve 90 COD treatment efficiency The covered lagoon will utilize
biogas for mixing to enhance the anaerobic processes in the system The biogas mixing will ensure
the POME is well-mixed and homogenized in the digester tank for optimum system performance
Treated POME from the covered lagoon will send to existing Facultative Algae lagoons system and
bio-polishing system for further treatment to reduce the BODCOD to meet the discharge standard
before discharging to the watercourse5 Existing anaerobic lagoons will be closed after the treatment
systems is stable and achieving the discharge standard
b) Flaring system
Enclosed or open flare will be utilized to burn the excess of biogas in case of maintenance of the gas
engine(s) boiler(s) in case no gas engine(s) boiler is installed or during emergency
c) Gainful use of biogas
The technology that will be used is environmentally safe and sound the renewable based captive
power plant that will be installed will improve the security on site by controlling methane emissions
The recovered biogas will be gainfully use and it is depending on the final requirement of energy by
the mill
Recovered biogas may be combusted in gas engines for grid export andor utilisation at the mill
while balance of biogas (if any) is sent to existing biomass boiler(s) for heat generation and thus
displacing biomass (Palm Kernel Shell (PKS)) excess biogas will be combusted either in enclosed
or open flare equipped with safety features The flare type to be installed is not defined yet it might
be an enclosed flare or an open flare Flare(s) will be operating whenever suitable in case engines or
biomass boiler(s) are unavailable
According to theoretical volumes of biogas to be captured the installed capacity of the power plant
is likely to be 12 MW or more For 12 MW engine the electrical efficiency is around 41
(assumptions for ex-ante calculations)Bio-scrubber and gas drying system will be installed before
the biogas is combusted in the gas engine(s)
The equipments maybe connected to the public grid electricity system to satisfy their energy needs
and may use back-up such as reciprocating engines or other source of energy
The operational lifetime of the equipment is expected to be 20 years if the maintenance is performed
correctly No technology substitution is expected during the crediting period unless if it appears that
the chosen capacity is not adapted to the actual flow or if the equipment is damaged
5 SD 1 - Mill License EQA 1974
PROJECT DESIGN DOCUMENT FORM (CDM-SSC-PDD) - Version 03
CDM ndash Executive Board
5
MILL
Cooling Pond tower
Gas engine(s) Biogas
Project activity
Covered lagoon
River
Final Discharge
Bio-Polishing system
Effluent
Biogas
Enclosed Open flare
Excess biogas
Raw POME
Electricity
Facultative + Algae lagoons
Treated Effluent
Excess Sludge
Land application
To gird andor mill
Existing biomass boiler(s)
Electricity import from Grid for biogas plant
Heat
Displace PKS
Figure A1 Flow diagram of the Project Activity
A41 Identification of the small-scale CPA
A411 Host Party
The host party of this CPA is Malaysia
A412 Geographic reference or other means of identification allowing the
unique identification of the small-scale CPA (maximum one page)
Table A1 Details of the geographic reference of CPA
Name of entity responsible for CPA Felda Palm Industrial Sdn Bhd
Contact details of entity responsible for CPA Jabatan Biomass Tingkat 4 Balai Felda Jalan
Gurney Satu 54000 Kuala Lumpur Malaysia
Tel +603 2692 8066 Fax +603 2691 2563
CityTownCommunity Kuala Lumpur
RegionStateProvince Kuala Lumpur
Country Malaysia
Geographic coordinates of the site 3 16152 N 102 34567 E OR 32692 1025761
A map indicating the location of the CPA site is given below
PROJECT DESIGN DOCUMENT FORM (CDM-SSC-PDD) - Version 03
CDM ndash Executive Board
6
Figure A2 Location of the Project Activity
A42 Duration of the small-scale CPA
A421 Starting date of the small-scale CPA
Starting date of the CPA will be the date on which the Engineering Procurement and Construction (EPC)
contract for the CPA will be awarded The EPC contract for the CPA has not yet been awarded
The start date of the CPA is not or will not be prior to the commencement of validation of the PoA
A422 Expected operational lifetime of the small-scale CPA
The operational lifetime of the CPA will be 20 years
A43 Choice of the crediting period and related information
Renewable crediting period
A431 Starting date of the crediting period
01122012 or the date of its inclusion in the PoA whichever is later
A432 Length of the crediting period first crediting period if the choice is
renewable CP
PROJECT DESIGN DOCUMENT FORM (CDM-SSC-PDD) - Version 03
CDM ndash Executive Board
7
The length of the first crediting period of the CPA6 will be 7 years
A44 Estimated amount of emission reductions over the chosen crediting period
Years Annual estimation of emission reductions in tonnes of CO2e
2012 2440
2013 29280
2014 29280
2015 29280
2016 29280
2017 29280
2018 29280
2019 26840
Total estimated reductions
(tonnes of CO2e) 204960
Total number of crediting years 7
Annual average over the crediting
period of estimated reductions
(tonnes of CO2e)
29280
The starting date of the crediting period is 01122012 or the date of its inclusion in the PoA whichever
is later
A45 Public funding of the CPA
The project has not received and will not be seeking public funding from Annex 1 countries
A46 Information to confirm that the proposed small-scale CPA is not a de-bundled
component
1 For the purposes of registration of a Programme of Activities (PoA)7 a proposed small-scale CPA
of a PoA shall be deemed to be a de-bundled component of a large scale activity if there is
already an activity8 which
(a) Has the same activity implementer as the proposed small scale CPA or has a coordinating
or managing entity which also manages a large scale PoA of the same sectoral scope and
(b) The boundary is within 1 km of the boundary of the proposed small-scale CPA at the
closest point
6 Please note that the duration of crediting period of any CPA shall be limited to the end date of the PoA regardless of when
the CPA was added 7 Only those POAs need to be considered in determining de-bundling that are (i) in the same geographical area and (ii) use
the same methodology as the POA to which proposed CPA is being added 8 Which may be a (i) registered small-scale CPA of a PoA (ii) an application to register another small-scale CPA of a PoA or
(iii) another registered CDM project activity
PROJECT DESIGN DOCUMENT FORM (CDM-SSC-PDD) - Version 03
CDM ndash Executive Board
8
2 If a proposed small-scale CPA of a PoA is deemed to be a debundled component in accordance
with paragraph 2 above but the total size of such a CPA combined with a registered small-scale
CPA of a PoA or a registered CDM project activity does not exceed the limits for small-scale
CDM and small-scale AR project activities as set out in Annex II of the decision 4CMP1 and
5CMP1 respectively the CPA of a PoA can qualify to use simplified modalities and procedures
for small-scale CDM and small-scale AR CDM project activities
The CPA implementer is also implementing other methane recovery project activities but these projects
are more than 1km away from the proposed small-scale CPA at the closest point Therefore the proposed
CPA is not a de-bundled component of a large scale project activity as it does not satisfy any of the above
provisions
A47 Confirmation that small-scale CPA is neither registered as an individual CDM
project activity or is part of another Registered PoA
The project information of this CPA has been checked against the PoA and CDM database available on
UNFCCC website and no duplicate entries were identified It is confirmed that the proposed CPA is
neither registered as an individual CDM project activity nor is part of another PoA This has also been
confirmed by the project implementer Felda Palm Industrial Sdn Bhd
SECTION B Eligibility of small-scale CPA and Estimation of emissions reductions
B1 Title and reference of the Registered PoA to which small-scale CPA is added
Regional Biogas PoA
Version 10
Date 12032012
B2 Justification of the why the small-scale CPA is eligible to be included in the Registered PoA
Table B1 Eligibility of CPA to be included in the Registered PoA
Ndeg Criteria Justification
1 Geographical boundary The CPA takes
place within the borders of Malaysia
The proposed CPA-1 is located in the state of
Pahang Malaysia with GPS coordinates of 3
16152 N 102 34567 E OR 32692 1025761
2 No double counting
The CPA is not already included in another
PoA or developed as a stand-alone CDM
project
The proposed CPA is not already included in
another PoA or developed as a stand-alone CDM
project
PROJECT DESIGN DOCUMENT FORM (CDM-SSC-PDD) - Version 03
CDM ndash Executive Board
9
3
Applicability conditions of AMS-IIIH
a) Substitution of aerobic wastewater or
sludge treatment systems with anaerobic
systems with biogas recovery and
combustion
b) Introduction of anaerobic sludge
treatment system with biogas recovery
and combustion to a wastewater
treatment plant without sludge
treatment
c) Introduction of biogas recovery and
combustion to a sludge treatment
system
d) Introduction of biogas recovery and
combustion to an anaerobic wastewater
treatment system such as anaerobic
reactor lagoon septic tank or an on site
industrial plant
e) Introduction of anaerobic wastewater
treatment with biogas recovery and
combustion with or without anaerobic
sludge treatment to an untreated
wastewater stream
f) Introduction of a sequential stage of
wastewater treatment with biogas
recovery and combustion with or
without sludge treatment to an
anaerobic wastewater treatment system
without biogas recovery (eg
introduction of treatment in an
anaerobic reactor with biogas recovery
as a sequential treatment step for the
wastewater that is presently being
treated in an anaerobic lagoon without
methane recovery)
The CPA is applying Option (f)
Introduction of a sequential stage of wastewater
treatment with biogas recovery and combustion
with or without sludge treatment to an anaerobic
wastewater treatment system without biogas
recovery (eg introduction of treatment in an
anaerobic reactor with biogas recovery as a
sequential treatment step for the wastewater that is
presently being treated in an anaerobic lagoon
without methane recovery)
4(a) The recovered methane measured may also
be utilized for thermal or mechanical
electrical generation directly ndash AMS-IIIH
para 3(a)
The recovered biogas may be used for electricity
generation through combustion in biogas engine(s)
system andor biomass boiler(s) for heat
generation Excess biogas if any will be flared
This in compliance with only AMS-IIIH
paragraph 3(a) and not the others
4(b) The recovered methane measured may also
be utilized for thermal or mechanical
electrical energy generation after bottling of
upgraded biogas ndash AMS-IIIH para 3(b)
Not applicable
4(c) The recovered methane measured may also
be utilized for thermal or mechanical
electrical energy generation after upgrading
and distribution ndash AMS-IIIH para 3(c)
Not applicable
4(d) The recovered methane measured may also Not applicable
PROJECT DESIGN DOCUMENT FORM (CDM-SSC-PDD) - Version 03
CDM ndash Executive Board
10
be utilized for hydrogen production ndash AMS-
IIIH para 3(d)
4(e) The recovered methane measured may also
be utilized for use as fuel in transportation
applications after upgrading ndash AMS-IIIH
para 3(e)
Not applicable
5 If the recovered biogas is used for project
activities covered under AMS-IIIH
paragraph 3(a) that component of the
project activity can use a corresponding
methodology under Type I
The recovered biogas is planned for gainfully use
for electricity andor heat generation in the CPA
The approved baseline and monitoring
methodology AMS IA (version 14) andor AMS-
ID (version 17) are used for the electricity
component of the CPA
6 Conditions that ensure compliance with
applicability and other requirements of
single or multiple methodologyies applied
by CPA
The proposed CPA-01 will apply AMS-IIIH
AMS-IA andor AMS-ID Applicability criteria
are listed below
7 The project has to fulfill Host Country
National CDM criteria if any
Malaysia‟s National CDM criteria have been
fulfilled by the proposed CPA
8 The starting date of CPA is compliant with
the latest UNFCCC guidelines
The start date of the CPA is not or will not be
prior to the commencement of validation of the
PoA The EPC contract for biogas plant yet to be
awarded
9 Confirmation that the CPA does not involve
any public funding from Annex I Parties or
that in case public funding is used it does
not result in diversion of Official
Development Assistance (ODA)
The proposed CPA has not received and will not
be seeking public funding from Annex 1 countries
10 A local Stakeholder consultation has been
conducted prior to the CPA inclusion
Stakeholder consultation has been organized on
05032012 and it is prior to the CPA inclusion
11 Conditions pertaining to the demonstration
of additionality of each small scale CPA to
be included (less than 60 ktCO2 year) for
Type III and 15MW for Type I
methodologies
The proposed CPA may install gas engine with
maximum capacity of 12 MW and methane
avoidance of less than 60000 tCO2yr for AMS-
IIIH
12 Where applicable the conditions that ensure
that CPA in aggregate meets the small-scale
threshold criteria and remain within this
threshold throughout the crediting period of
the CPA
The proposed CPA may install gas engine with
maximum capacity of 12 MW and methane
avoidance of less than 60000 tCO2yr for AMS-
IIIH
13 Where applicable the requirements for the
debundling check in case CPAs belong to
small-scale (SSC) project categories
The proposed CPA is not a debundled component
of a large activity as described in the latest
ldquoGuidelines on assessment of debundling for SSC
project activitiesrdquo
14 Where applicable the conditions related to
sampling requirements for a PoA in
accordance with the approved
guidelinesstandard from the Board
pertaining to sampling and surveys
Not applicable all CPAs will be verified
15 Where applicable target group (eg The target group is prospective POME plants in
PROJECT DESIGN DOCUMENT FORM (CDM-SSC-PDD) - Version 03
CDM ndash Executive Board
11
domesticcommercialindustrial ruralurban
grid-connectedoff-grid) and distribution
mechanisms (eg direct installation)
Malaysia There are no specific distribution
mechanisms
16 Whether an EIA is required by local
authorities
Not applicable for the proposed CPA as EIA is not
required
17 The crediting period of the CPA shall not
exceed the length of the PoA (ie 28 years)
regardless of the time of inclusion of CPA in
the PoA
The crediting period of the proposed CPA will not
exceed the length of PoA 28 years
Additional eligibility criteria applicable in case of CPA that gainfully use of biogas for electrical
andor thermal energy generation
The proposed project conforms to the applicable requirements of AMS - ID version 17
Applicability Criteria Justification
This methodology comprises renewable energy
generation units such as photovoltaic hydro
tidalwave wind geothermal and renewable biomass
a) Supplying electricity to a national or a regional
grid
b) Supplying electricity to an identified consumer
facility via nationalregional grid through a
contractual arrangement such as wheeling
Applicable The proposed project activity is
based on biogas recovered from anaerobic bio-
digester a renewable energy generation source
The proposed project shall supply electricity to
the national grid
The project activity is not supplying electricity
to an identified consumer facility
This methodology is applicable to project activities that
(a) Install a new power plant at a site where there was
no renewable energy power plant operating prior
to the implementation of the project activity
(Greenfield plant)
(b) Involve a capacity addition
(c) Involve a retrofit of (an) existing plant(s)
(d) Involve a replacement of (an) existing plant(s)
Applicable to (a) where the proposed project
activity shall install a new power plant at a site
where there was no renewable energy power
plant operating prior to the implementation of
the project activity
Hydro power plants with reservoirs that satisfy at least
one of the following conditions are eligible to apply this
methodology
Not applicable The project activity is a biogas
recovery and utilization project
If the new unit has both renewable and non-renewable
components (eg a winddiesel unit) the eligibility limit
of 15MW for a small-scale CDM project activity applies
only to the renewable component If the new unit co-
fires fossil fuel the capacity of the entire unit shall not
exceed the limit of 15MW
Not applicable The project does not
incorporate a mix of renewable and non-
renewable components
Combined heat and power (co-generation) systems are
not eligible under this category
Applicable There is no combined heat and
power component in the project activity
PROJECT DESIGN DOCUMENT FORM (CDM-SSC-PDD) - Version 03
CDM ndash Executive Board
12
In the case of project activities that involve the addition
of renewable energy generation units at an existing
renewable power generation facility the added capacity
of the units added by the project should be lower than
15 MW and should be physically distinct from the
existing units
Not applicable The project activity does not
involve the addition of renewable energy
generation units at an existing facility
In the case of retrofit or replacement to qualify as a
small-scale project the total output of the retrofitted or
replacement unit shall not exceed the limit of 15 MW
Not applicable The project activity does not
seek to retrofit or replacement an existing
facility
The proposed project conforms to the applicable requirements of AMS - IA version 14
Applicability Criteria Justification
This category comprises renewable electricity
generation units that supply individual Households
users or groups of households users included in the
project boundary The applicability is limited to
individual households and users that do not have a grid
connection except when
a) A group of households or users are supplied
electricity through a standalone mini grid powered
by renewable energy generation unit(s) where the
capacity of the generating units does not exceed 15
MW or
b) The emissions reduction per renewable energy
based lighting system is less than 5 tonnes of CO2e
a year and where it can be shown that fossil fuel
would have been used in the absence of the project
activity by
(i) A representative sample survey (90
confidence interval plusmn10 error margin) of
target households or
(ii) Official statistics from the host country
government agencies
The renewable energy generation units include
technologies such as solar hydro wind biomass
gasification and other technologies that produce
electricity all of which is used on-sitelocally by the
user
The renewable generating units may be new
installations (Greenfield) or replace existing onsite
fossil-fuel-fired generation To qualify as a small-scale
project the total output of the unit(s) shall not exceed
the limit of 15 MW
Applicable The proposed project activity is not
grid connected
Furthermore the total installed capacity of the
generating units will not exceed 15 MW
Applicable The project activity involves the
combustion of the recovered biogas from the
anaerobic bio-digester for electricity generation
to be use on-site
Applicable The project activity involve the
replacement of existing onsite fossil fuel fired
generation and the total installed capacity is not
PROJECT DESIGN DOCUMENT FORM (CDM-SSC-PDD) - Version 03
CDM ndash Executive Board
13
exceed 15 MW
Hydro power plants with reservoirs that satisfy at least
one of the following conditions are eligible to apply this
methodology
The project activity is implemented in an existing
reservoir with no change in the volume of
reservoir
The project activity is implemented in an existing
reservoir where the volume of reservoir is
increased and the power density of the project
activity as per definitions given in the Project
Emissions section is greater than 4 Wm2
The project activity results in new reservoirs and
the power density of the power plant as per
definitions given in the Project Emissions section
is greater than 4 Wm2
Not applicable The project activity is not a
hydro power plant
Combined heat and power (co-generation) systems are
not eligible under this category
Applicable There is no combined heat and
power component in the project activity
If the unit added has both renewable and non-renewable
components (eg a winddiesel unit) the eligibility
limit of 15 MW for a small-scale CDM project activity
applies only to the renewable component If the unit
added co-fires fossil fuel the capacity of the entire unit
shall not exceed the limit of 15 MW
Not applicable The project does not
incorporate a mix of renewable and non-
renewable components
Project activities that involves retrofit or replacement of
an existing facility for renewable energy generation are
included in this category To qualify as a small-scale
project the total output of the modified or retrofitted
unit shall not exceed the limit of 15 MW
Not applicable The project activity does not
seek to retrofit or replacement an existing
facility
In the case of project activities that involve the addition
of renewable energy generation units at an existing
renewable power generation facility the added capacity
of the units added by the project should be lower than
15 MW and should be physically distinct3 from the
existing units
Not applicable The project activity does not
involve the addition of renewable energy
generation units at an existing facility
B3 Assessment and demonstration of additionality of the small-scale CPA as per eligibility
criteria listed in the Registered PoA
In Malaysia Environmental Quality (Prescribed Premises) (Crude Palm Oil) Regulation 1977 governs
environmental considerations including the wastewater treatment and discharge at palm oil mills The
regulation stipulates the discharge standards for water discharge or land application The regulation
however does not specify the required treatment technologies for wastewater or GHG emissions from
wastewater treatment operations
PROJECT DESIGN DOCUMENT FORM (CDM-SSC-PDD) - Version 03
CDM ndash Executive Board
14
More than 85 of palm oil mills are utilizing open based anaerobic ponds and it is considered the
prevailing practice for oil palm industry to treat the POME The open anaerobic ponds system is an
effective and low-tech solution that can easily meet the water discharge limits applicable to the palm oil
industry9 10
There is no financial incentive for the palm oil mill owners to invest into methane capture projects
particularly when there is no requirement under existing pending or planned national state or local
regulatory This is partly related to the fact that there are a lot of attractive and competing investments in
the sector However the PP has undertaken to set up this project in order to reduce the GHG emissions
and contribute his mite to the global GHG emission reduction
The project is a small scale project activity As such the provisions of Attachment A to Appendix B of
the simplified modalities and procedures for small-scale CDM project activities will apply to this project
The bdquoindicative simplified baseline and monitoring methodologies for selected small-scale CDM project
activity categories‟ require the project proponents to demonstrate that the project activity would not have
occurred anyway due to at least one of the following barriers
a) Investment barrier a financially more viable alternative to the project activity would have led to
higher emissions
b) Technological barrier a less technologically advanced alternative to the project activity involves
lower risks due to the performance uncertainty or low market share of the new technology
adopted for the project activity and so would have led to higher emissions
c) Barrier due to prevailing practice prevailing practice or existing regulatory or policy
requirements would have led to the implementation of a technology with higher emissions
d) Other barriers without the project activity for another specific reason identified by the project
participant such as institutional barriers or limited information managerial resources
organizational capacity financial resources or capacity to absorb new technologies emissions
would have been higher
Subsequently in its 35th Meeting the EB had issued bdquoNon-binding best practice examples to demonstrate
additionality for SSC project activities‟ wherein EB had given best practice examples of each of the
aforementioned category of barriers
The project participant has chosen Investment Barrier to demonstrate the additionality which is discussed
in the following paragraphs
Investment barrier
The most important of all the barriers faced by the company is the investment barrier The investment
analysis reveals that the project is not financially attractive The additionality tool permits the use of
simple cost analysis or investment comparison analysis or benchmark analysis to demonstrate the
additionality of the project
9 SD 05 ndash Yeoh B G 2004 A Technical and Economic Analysis of Heat and Power Generation from Biomethanation of
Palm Oil Mill Effluent Electrcity Supply Industry in Transition Issues and Prospect for Asia 10 SD 06 ndash Eco-Ideal Consulting Sdn Bhd (Eco-Ideal) 2004 MEWCPTMDANIDA Study on Clean Development
Mechanism Potential in the Waste Sectors in Malaysia Unpublished
PROJECT DESIGN DOCUMENT FORM (CDM-SSC-PDD) - Version 03
CDM ndash Executive Board
15
As the project activity generates revenue (other than CDM revenue) by exporting the electricity to the
grid and from the likely sale of biomass andor saving from diesel usage at the mill which is being
displaced by biogas simple cost analysis cannot be used Of the remaining PP has chosen the benchmark
analysis to demonstrate the financial unattractiveness of the project activity without carbon credits
There is a national policy on Feed-In-Tariff (FiT) gazetted in June 201111
that gives comparative
advantages to less emissions-intensive technologies over more emissions-intensive technologies (E-
policy as national andor sectoral policies or regulations that give comparative advantages to less
emissions-intensive technologies over more emissions-intensive technologies)
This is very conservative as paragraph 7 6 (b) EB22 Annex 3 states that ldquoNational andor sectoral
policies or regulations hellip that have been implemented since the adoption by the COP of the CDM MampP
(decision 17CP7 11 November 2001) need not be taken into account in developing a baseline scenario
(ie the baseline scenario could refer to a hypothetical situation without the national andor sectoral
policies or regulations being in place) In absence of the FiT the prevailing electricity sales tariff to
consumers is RM 021 per kWh
Project IRR has been chosen as the financial indicator for the financial analysis of the project activity
The project IRR has to be compared with a benchmark rate of return to demonstrate the additionality of
the project The Guidelines on the Assessment of Investment Analysis (Version 05 point 12) states ldquoIn
cases where a benchmark approach is used the applied benchmark shall be appropriate to the type of IRR
calculated Local commercial lending rates or weighted average costs of capital (WACC) are appropriate
benchmarks for a project IRR Requiredexpected returns on equity are appropriate benchmarks for an
equity IRR Benchmarks supplied by relevant national authorities are also appropriate if the DOE can
validate that they are applicable to the project activity and the type of IRR calculation presentedrdquo
In line with the Guidelines on the Assessment of Investment Analysis (Version 05) a default value
for the expected returns on equity is selected as the benchmark with 1090 The logic of choosing this
rate as benchmark is that the project should yield a return at least equivalent to the expected returns of
equity to merit consideration
For making the investment analysis the following assumptions have been made
Table B2 Investment Analysis
Sl No Description Value
1
Budgeted CAPEX
- Bioreactor amp accessories
- Flaring system
- Boiler adaptation cost for burners
- Gas engine(s)
- KPSR consultancy cost
4350000
140670
205000
4630000
220000
Total 9545670
2
Annual maintenance costs are estimated based on a of CAPEX12
Bioreactor (3 of CAPEX) = MYR 130500
Gas engine(s) (5 of CAPEX) = MYR 231500
3 Corporate tax ()13 25
11 httpwwwmbipvnetmydloadFiT20Handbook20Englishpdf 12 SD 05 ndash Maintenance cost (SIRIM Environmental and Bioprocess Technology Centre of Malaysia)
PROJECT DESIGN DOCUMENT FORM (CDM-SSC-PDD) - Version 03
CDM ndash Executive Board
16
Since losses can be carried forward indefinitely (so long as the ownership
remains unchanged) the incidence of taxation does not arise in the case of
this project activity
4
Manpower cost has been estimated based on 1 supervisor 2 operators 1
chargeman envisaged to be appointed and the ruling wagesalary structure
of the company14
182588 MYR yr
5 Salary increment rate has been applied based on the average expected
salary increment rate for year 20101115 40
6 Price of Biomass ex-factory (PKS) 156 MYRmt
7 Price of diesel 220 MYRliter
8 RE tariff export to grid (MYRkWh) 021
9
Laboratory Cost is estimated based on the quotations from accredited
laboratory anticipated number of tests and samples to be carried out and
transportation cost during the running and operating of the biogas plant for
maintaining optimum operating conditions
1920 MYR yr
10 Insurance premium per year ( of CAPEX)16 0412
11 Estimate of CER price (EUR) 8
12
Depreciation of equipment (years) has been provided as per the Inland
Revenue Authority regulations17 Since the project consists of only
environmental protection equipment it is entitled to initial capital
allowance of 40 and annual capital allowance of 20 as per the Inland
Revenue Authority notifications
4 years
13 Project life time for IRR calculation18 20 years
14
Residual value a fair value (5) of the project activity assets at the end of
the assessment period as per the Guidelines on The Assessment of
Investment Analysis version 05 EB 62
MYR 466284
Based on the above assumption the project IRR works out to be ndash 085 in contrast to the benchmark
rate of 1090 Thus the analysis proves that the project is not financially attractive
Sensitivity Analysis
A sensitivity analysis has also been conducted to test the robustness of the conclusions drawn Four (4)
factors have been identified as critical to IRR of the project viz project cost maintenance costs RE
tariff The results of sensitivity analysis are given below
13 SD 08 ndash Malaysian Tax and Business Booklet 201011 Page 12
httpwwwpwccomen_MYmyassetspublicationstaxbooklet1011pdf 14 SD 3 - Salary structure (biogas plant) 15 SD 09 - Salary increment rate (201011) 16 SD 2 - Biogas plant insurance policy 17 SD 08 ndash Malaysian Tax and Business Booklet 201011 Page 21
httpwwwpwccomen_MYmyassetspublicationstaxbooklet1011pdf 18 As per the Guidelines on the Assessment of Investment Analysis version 05 (Annex 5 EB 62 point 3) ldquoIn general a
minimum period of 10 years and a maximum of 20 years will be appropriaterdquo PP has chosen 20 years for financial
assessment as it is conservative
PROJECT DESIGN DOCUMENT FORM (CDM-SSC-PDD) - Version 03
CDM ndash Executive Board
17
Table B3 Sensitivity Analysis
FACTORS PROJECT IRR
-10 0 +10
Project cost -185 -085 033
Maintenance cost -491 -085 189
RE tariff 112 -085 -354
It could be seen from the above that even under the most optimistic conditions the project activity would
not yield a positive IRR let alone crossing the benchmark Therefore the project is not a business-as-
usual scenario and it is additional
Prior Consideration of CDM
As per the guidance of EB Meeting Report 49 Annex 22 the project proponent notified the UNFCCC and
the DNA of the intent to implement the project as a CDM project activity
Conclusion
The conclusion of the investment analysis remains identical to reasonable variations of the critical
assumptions (sensitivity analysis) Therefore the project activity IRR remains lower than the benchmark
In the above background it is proved that the project faces an investment barrier that establishes the
additionality
B4 Description of the sources and gases included in the project boundary and proof that the
small-scale CPA is located within the geographical boundary of the registered PoA
The emission sources and type of GHG which are included or excluded within the project boundary are
shown in the following table
Table B4 Emission Sources and Type of GHG
Source Gas Included Justification Explanation
Ba
seli
ne
Direct emissions
from the
wastewater
treatment processes
CO2 No Neutral CO2 emissions from biomass decaying
CH4 Yes Methane emissions from open lagoons treatment
process
N2O No Not significant Excluded for simplification and
conservativeness
Diesel usage in
diesel genset at mill
CO2 Yes CO2 emissions from combustion of diesel fuel
CH4 No Not significant Excluded for simplification and
conservativeness
N2O No Not significant Excluded for simplification and
conservativeness
Pro
ject
Act
ivit
y
Bio-digester
CO2 No Neutral CO2 emissions from biomass decaying
CH4 Yes Methane emissions from anaerobic treatment process
N2O No Not significant Excluded for simplification and
conservativeness
Existing
wastewater
treatment lagoons
CO2 No Neutral CO2 emissions from biomass decaying
CH4 Yes Methane emissions from poorly managed treatment
process (without aerators)
PROJECT DESIGN DOCUMENT FORM (CDM-SSC-PDD) - Version 03
CDM ndash Executive Board
18
(Facultative amp
algae system) N2O No
Not significant Excluded for simplification and
conservativeness
Gas engine(s)
(biogas
combustion)
CO2 No Neutral CO2 emissions from biogas combustion
CH4 No Not significant and excluded from calculation
Biogas combustion efficiency is considered 10019
N2O No Not significant Excluded for simplification and
conservativeness
Biomass Boiler(s)
(Biogas
combustion)
CO2 No Neutral CO2 emissions from biogas combustion
CH4 No Not significant and excluded from calculation
Biogas combustion efficiency is considered 10020
N2O No Not significant Excluded for simplification and
conservativeness
Grid electricity
consumption from
national grid
CO2 Yes CO2 emissions from grid energy
CH4 No Not significant Excluded for simplification and
conservativeness
N2O No Not significant Excluded for simplification and
conservativeness
Enclosed or Open
flaring system
CO2 No Neutral CO2 emissions from biogas combustion
CH4 Yes CH4 emissions due to incomplete combustion in
enclosed flare
N2O No Not significant Excluded for simplification and
conservativeness
The CPA is implemented at the address below
Kilang Sawit Felda Triang Triang Pahang Malaysia
The site is located at state of Pahang Malaysia with GPS coordinates 3 16152 N 102 34567 E or
32692 1025761 (refer also Section A412) and thus is located within the geographical boundary of the
PoA
B5 Emission reductions
B51 Data and parameters that are available at validation
Data Parameter GWPCH4
Data unit tCO2tCH4
Description Global Warming Potential the equivalent in CO2 of the effect of methane
gas to the atmosphere
Source of data used IPCC 2006
Value applied 21
Justification of the choice of
data or description of
measurement methods and
procedures actually applied
Global warming potential for methane gas since this is a methane
capture project
19 AMS-IIIH para 35 20 AMS-IIIH para 35
PROJECT DESIGN DOCUMENT FORM (CDM-SSC-PDD) - Version 03
CDM ndash Executive Board
19
Any comment
Data Parameter MCFwwtreatmentBL1
Data unit Fraction
Description Methane correction factor for baseline wastewater anaerobic treatment
systems
Source of data used Table IIIH1 AMS IIIH version 16
Value applied 08
Justification of the choice of
data or description of
measurement methods and
procedures actually applied
Table IIIH1 for baseline emission The lagoons depth are more than 2m
MCF value of 08 for anaerobic deep lagoon (depth gt 2 m)
Any comment
Data Parameter MCFwwtreatmentBL2
Data unit Fraction
Description Methane correction factor for baseline wastewater aerobic treatment
systems
Source of data used Methane correction factor for baseline aerobic wastewater treatment
system (poorly managed)
Value applied Table IIIH1 AMS IIIH version 16
Justification of the choice of
data or description of
measurement methods and
procedures actually applied
03
Any comment No aerators installed
Data Parameter MCFwwBLdischarge
Data unit Fraction
Description Methane correction factor based on discharge pathway in the baseline
situation
Source of data used Table IIIH1 AMS IIIH version 16
Value applied 01
Justification of the choice of
data or description of
measurement methods and
procedures actually applied
Table IIIH1 for baseline emission The final discharge of treated
effluent into river MCF value of 01 for river discharge
Any comment
Data Parameter Bo ww
Data unit kgCH4 kgCOD
Description Methane generation capacity of treated wastewater
Source of data used IPCC 2006
Value applied 025
Justification of the choice of
data or description of
measurement methods and
procedures actually applied
Default value as prescribed in the methodology
Any comment
PROJECT DESIGN DOCUMENT FORM (CDM-SSC-PDD) - Version 03
CDM ndash Executive Board
20
Data Parameter UFBL
Data unit -
Description Model correction factor to account for model uncertainties (baseline)
Source of data used AMS IIIH version 16
Value applied 089
Justification of the choice of
data or description of
measurement methods and
procedures actually applied
As per methodology AMS-IIIH point 24
Any comment -
Data Parameter UFPJ
Data unit -
Description Model correction factor to account for model uncertainties (project
activity)
Source of data used AMS IIIH version 16
Value applied 112
Justification of the choice of
data or description of
measurement methods and
procedures actually applied
As per methodology AMS-IIIH point 30(a)
Any comment -
Data Parameter CFEww
Data unit Fraction
Description Capture efficiency of the biogas recovery equipment in the wastewater
treatment system
Source of data used AMS IIIH version 16
Value applied 09
Justification of the choice of
data or description of
measurement methods and
procedures actually applied
A default value of 09 has been used as per the guidance in the
methodology
Any comment
Data Parameter MCF ww treatmentPJ1
Data unit Fraction
Description Methane correction factor for the project wastewater anaerobic treatment
system equipped with biogas recovery equipment
Source of data used Table IIIH1 AMS IIIH version 16
Value applied 08
Justification of the choice of
data or description of
measurement methods and
procedures actually applied
The lagoons depth are more than 2 m MCF values in table IIIH1 has
been used as per the guidance in the methodology (depth gt 2 m)
Any comment
Data Parameter MCF ww treatmentPJ2
PROJECT DESIGN DOCUMENT FORM (CDM-SSC-PDD) - Version 03
CDM ndash Executive Board
21
Data unit Fraction
Description Methane correction factor for the project wastewater aerobic treatment
system not equipped with biogas recovery equipment
Source of data used Table IIIH1 AMS IIIH version 16
Value applied 03
Justification of the choice of
data or description of
measurement methods and
procedures actually applied
Aerobic treatment poorly managed
Any comment
Data Parameter MCFwwPJdischarge
Data unit Fraction
Description Methane correction factor based on discharge pathway in the project
activity
Source of data used Table IIIH1 AMS IIIH version 16
Value applied 01
Justification of the choice of
data or description of
measurement methods and
procedures actually applied
Table IIIH1 for project emission The final discharge of treated effluent
into river MCF value of 01 for river discharge
Any comment Same discharge pathway as in the baseline
Data Parameter CODBL1
Data unit
Description COD removal efficiency of the baseline system (anaerobic treatment
system)
Source of data used 10 days measurement campaign
Value applied Anaerobic Treatment system 8880
Justification of the choice of
data or description of
measurement methods and
procedures actually applied
One year historical data not available
Any comment This data will be used for ex post emission reduction calculation
Data Parameter CODBL2
Data unit
Description COD removal efficiency of the baseline system (aerobic treatment
system)
Source of data used 10 days measurement campaign
Value applied Aerobic Treatment system 6369
Justification of the choice of
data or description of
measurement methods and
procedures actually applied
One year historical data not available
Any comment This data will be used for ex post emission reduction calculation
Data Parameter NCVCH4
Data unit MJkg
PROJECT DESIGN DOCUMENT FORM (CDM-SSC-PDD) - Version 03
CDM ndash Executive Board
22
Description Net Calorific Value of methane
Source of data used IPCC 2006 Default Value
Value applied 504
Justification of the choice of
data or description of
measurement methods and
procedures actually applied
IPCC 2006 value is used Volume 2 Chapter 1 Table 12
Any comment
Data Parameter NCVFF
Data unit MJkg
Description Net Calorific Value of diesel
Source of data used IPCC 2006 Default Value
Value applied 430
Justification of the choice of
data or description of
measurement methods and
procedures actually applied
IPCC 2006 value is used Volume 2 Chapter 1 Table 12
Any comment
Data Parameter EFCO2diesel
Data unit tCO2MWh
Description CO2 emission factor diesel genset
Source of data used AMS-IA version 14 point 14
Value applied 08
Justification of the choice of
data or description of
measurement methods and
procedures actually applied
Default value for diesel generation unit
Any comment
Data Parameter Grid Emission Factor
Data unit kgCO2ekWh
Description Emission factor for grid electricity in Peninsular Malaysia
Source of data used Pusat Tenaga Malaysia March 2010
Value applied 0672
Justification of the choice of
data or description of
measurement methods and
procedures actually applied
As per AMS-ID point 12
Any comment Study on Grid Connected Electricity Baselines in Malaysia 2008
B52 Ex-ante calculation of emission reductions
The ex ante emission reductions are calculated based on AMS-IIIH version 16 as per equations
explained in section E62 of PoA-DD Biogas PoA in Malaysia
PROJECT DESIGN DOCUMENT FORM (CDM-SSC-PDD) - Version 03
CDM ndash Executive Board
23
Calculation for AMS-IIIH
Baseline emissions
Source of baseline emissions Reference Applicable
(YN)
Comments
Wastewater and sludge treatment
systems equipped with a biogas
recovery facility shall be excluded
from the baseline
AMS-IIIH
Point 17
N No biogas recovery in the
baseline
Emissions on account of electricity or
fossil fuel used (BEpowery)
AMS-IIIH
Point 18 (i)
N For conservativeness no
emissions due to electricity or
fossil fuel will be claimed
BEpowery = 0
Methane emissions from baseline
wastewater treatment systems
(BEwwtreatmenty)
AMS-IIIH
Point 18 (ii)
Y Baseline includes anaerobic and
aerobic treatment conditions with
different MCF values selected as
per Table IIIH1
Methane emissions from baseline
sludge treatment systems (BEstreatmenty)
= 0
AMS-IIIH
Point 18 (iii)
N The baseline plant corresponds to
scenario Para 1(f) without sludge
treatment BEstreatmenty = 0
Methane emissions on account of
inefficiencies in the baseline
wastewater treatment systems and
presence of degradable organic carbon
in the treated wastewater discharged
into river (BEwwdischargey)
AMS-IIIH
Point 18 (iv)
Y Treated effluent is currently
discharged into the river
Methane emissions from the decay of
the final sludge generated by the
baseline treatment systems (BEsfinaly)
AMS-IIIH
Point 18 (v)
N Zero because in the baseline final
sludge used for soil application
BEsfinaly = 0
A) Calculation of baseline emissions
BEy = BEwwtreatmenty + BEwwdischargey
Abbreviation Description Value Source
BEy Baseline emissions in year y (tCO2e) 30762 Calculated
BEpowery Baseline emissions of diesel genset in year
y tCO2eyear 0 Calculated
BEwwtreatmenty Baseline emissions of the wastewater
treatment systems tCO2eyear 30663 Equation 2
BEwwdischargey
The methane emissions from degradable
organic carbon in treated wastewater
discharged tCO2eyear
100 Equation 6
A1) Baseline emissions
PROJECT DESIGN DOCUMENT FORM (CDM-SSC-PDD) - Version 03
CDM ndash Executive Board
24
Equation 2 BEwwtreatmenty = Qwwy (CODinflow1 y CODBL1 MCFwwtreatmentBL1) +
(CODinflow2y CODBL2 MCFwwtreatmentBL2) Boww UFBL GWPCH4
Abbreviation Description Value Source
BEwwtreatmenty Baseline emissions of the wastewater
treatment systems (tCO2eyear) 30663 Calculated
Qwwy Volume of wastewater treated in baseline
wastewater treatment system i in year y
(m3year)
333293
Volume based on 10 m3mt
FFB21 amp FFB historical data
(2009 ndash 2011)
CODinflow1y Chemical oxygen demand of the
wastewater inflow to the baseline treatment
system (anaerobic) in year y (tCOD m3)
0026905 10 days measurement
campaign
CODBL1 COD removal efficiency of the baseline
treatment system (anaerobic) () 8880
10 days measurement
campaign
CODinflow2y Chemical oxygen demand of the
wastewater inflow to the baseline treatment
system (aerobic) in year y (tCOD m3)
0003013 10 days measurement
campaign
CODBL2 COD removal efficiency of the baseline
treatment system (aerobic) () 6369
10 days measurement
campaign
MCFwwtreatmentBL 1 Methane correction factor for baseline
wastewater anaerobic treatment systems 08
MCF values as per table
IIIH1 anaerobic gt 2m
MCFwwtreatmentBL2 Methane correction factor for baseline
wastewater aerobic treatment systems 03
MCF values as per table
IIIH1 ndash poorly managed
Boww Methane producing capacity of the
wastewater (kg CH4kg COD) 025
IPCC 2006
UFBL Model correction factor to account for
model uncertainties 089
IPCC 2006
GWPCH4 Global Warming Potential for methane 21 IPCC 2006
A2) The methane emissions from degradable organic carbon in treated wastewater discharged
Equation 6 BEwwdischargey = Qwwy GWPCH4 Boww UFBL CODwwdischarge BLyMCFww BLdischarge
Abbreviation Description Value Source
BEwwdischargey
The methane emissions from degradable
organic carbon in treated wastewater
discharged (tCO2eyear)
100 Calculated
Qwwy Volume of treated wastewater discharged
in year y (m3year) 333293
Volume based on 10 m3mt
FFB22 amp FFB historical data
(2009 ndash 2011)
GWPCH4 Global warming potential of methane 21 IPCC 2006
Boww Methane producing capacity of the treated
wastewater (kgCH4 kgCOD) 025 IPCC 2006
21 Mill designed data for baseline effluent treatment plant 22 Mill designed data for baseline effluent treatment plant
PROJECT DESIGN DOCUMENT FORM (CDM-SSC-PDD) - Version 03
CDM ndash Executive Board
25
UFBL Model correction factor to account for
model uncertainties 089 IPCC 2006
CODwwdischarge BLy Chemical oxygen demand of the treated
wastewater discharged into sea river or
lake in the baseline situation in the year y
(tonnesm3)
0000642 10 days measurement
campaign
MCFwwBLdischarge Methane correction factor based on
discharge pathway in the baseline situation
(eg into sea river or lake) of the
wastewater (fraction)
01 MCF values as per table
IIIH1 version 16
Project activity emissions
The project activity emission sources as per the methodology and their relevance with respect to the
proposed CDM project activity are given below in a tabular format
Source of project activity
emission Reference
Applicable
(YN) Comments
CO2 emissions on account of
power and fossil fuel used by
the project activity facilities
(PEpowery)
AMS-IIIH
point 29(i)
Y The project activity uses the electricity
imported from the national grid
Methane emissions from
wastewater treatment systems
affected by the project
activity and not equipped with
biogas recovery in the project
situation (PEwwtreatmenty)
AMS-IIIH
point 29 (ii)
Y CH4 emissions from the poorly managed
aerobic lagoons
Methane emissions from
sludge treatment systems
affected by the project
activity and not equipped with
biogas recovery in the project
situation (PEstreatmenty)
AMS-IIIH
point 29 (iii)
N The project activity corresponds to
scenario (vi) without sludge treatment
PEystreatmenty = 0
Methane emissions on account
of inefficiency of the project
activity wastewater treatment
systems and presence of
degradable organic carbon in
treated wastewater
(PEwwdischargey)
AMS-IIIH
point 29 (iv)
Y Treated effluent from ETP will be
discharged into river
Methane emissions from the
decay of the final sludge
generated by the project
activity treatment systems
(PEsfinaly)
AMS-IIIH
point 29 (v)
N In the proposed CDM project activity
final sludge is used for soil application in
the same manner as in the baseline
PEsfinaly = 0
PROJECT DESIGN DOCUMENT FORM (CDM-SSC-PDD) - Version 03
CDM ndash Executive Board
26
Methane fugitive emissions on
account of inefficiencies in
capture systems (PEfugitivey)
AMS-IIIH
point 29 (vi)
Y Applicable to PEfugitivewwy
N The project activity corresponds to
scenario (vi) without sludge treatment
PEfugitivesy = 0
Methane emissions due to
incomplete flaring (PEflaringy)
AMS-IIIH
point 29 (vii)
Y Enclosed flaring system installed
Methane emissions from
biomass stored under
anaerobic conditions which
does not take place in the
baseline situation (PEbiomassy)
AMS-IIIH
point 29
(viii)
N In the project activity the biomass (PKS
+ mesocarp fibres) displaced will not be
stored under anaerobic conditions The
conditions of onsite storage are identical
in the baseline as in the project activity
The biomass will be sold to the market
on a regular basis PEbiomassy = 0
B) Calculation of project emissions
PEy = PEpowery + PEwwtreatmenty + PEww discharge y + PEfugitive y + PEflaring y
Abbreviation Description Value Source
PEy Project activity emissions in the year y
(tCO2eyr) 6050 Equation 8
PEpowery CO2 emissions on account of power used
by the project activity facilities (tCO2eyr) 604 -
PEwwtreatmenty Methane emissions from wastewater
treatment systems affected by the project
activity and not equipped with biogas
recovery in year y (tCO2eyr)
1523 Equation 9
PEwwdischargey
Methane emissions on account of
inefficiency of the project activity
wastewater treatment systems and presence
of degradable organic carbon in treated
wastewater (tCO2eyr)
126 Equation 12
PEfugitivey Methane fugitive emissions on account of
inefficiencies in capture systems (tCO2eyr) 3796 Equation 15
PEflaringy Methane emissions due to incomplete
flaring (tCO2eyr) 0 Equation 19
B1) Project emissions from CO2 emissions on account of power and fuel used by the project activity
facilities in year ldquoyrdquo in tCO2eyear
PEpowery = ECPJjy EFgridy
Abbreviation Description Value Source
PEpowery Project emissions from electricity
consumption in the year y (tCO2eyr) 604 Calculated
ECPJjy Internal power consumption from the grid 749 100 kW is the effective
PROJECT DESIGN DOCUMENT FORM (CDM-SSC-PDD) - Version 03
CDM ndash Executive Board
27
(MWh year) power based on the
equipments installed at the
site
EFgridy Grid Emission factor in Peninsular
Malaysia 2008 (tCO2 MWh) 0672
Study on Grid Connected
Electricity Baselines in
Malaysia 2008 published in
2010 by PTM
B2) Methane emissions from wastewater treatment systems affected by the project activity and not
equipped with biogas recovery in the project situation in year ldquoyrdquo in tCO2e
Equation 9 PEwwtreatment y = Qwwky CODinflowk y PJky MCFwwtreatmentPJk) Boww UFPJ GWPCH4
Abbreviation Description Value Source
PEwwtreatmenty
Methane emissions from wastewater
treatment systems affected by the project
activity and not equipped with biogas
recovery in the project situation (tCO2eyr)
1523 Calculated
Qwwky Volume of wastewater treated in project
activity wastewater treatment system k in
year y (m3year)
333293
Volume based on 10 m3mt
FFB23 amp FFB historical data
(2009 ndash 2011)
CODinflowky Chemical oxygen demand of the
wastewater inflow to the project activity
treatment system k in year y (tonnes COD
m3)
0002690 10 days measurement
campaign
PJky Chemical oxygen demand removal
efficiency of the project wastewater
treatment system k in year y (tm3)
measured based on inflow COD and
outflow COD in system k
90 Based on bio-digester COD
removal efficiency of 90
MCFwwtreatmentPJk Methane correction factor for project
wastewater treatment system k (MCF
values as per table IIIH1)
03
MCF values table IIIH1
Version 16 ndash aerobic poorly
managed (conservative)
Boww Methane generation capacity of the treated
wastewater (kg CH4kg COD) 025 IPCC 2006
UFPJ Model correction factor to account for
model uncertainties 112
IPCC 2006
GWPCH4 Global warming potential of methane 21 IPCC 2006
23 Mill designed data for baseline effluent treatment plant
PROJECT DESIGN DOCUMENT FORM (CDM-SSC-PDD) - Version 03
CDM ndash Executive Board
28
B3) Methane emissions on account of inefficiency of the project activity wastewater treatment
systems and presence of degradable organic carbon in treated wastewater in the year ldquoyrdquo (tonnes)
Equation 12 PEwwdischarge y = Qwwy GWPCH4 Boww UFPJ CODwwdischargePJy MCFwwPJdischarge
Abbreviation Description Value Source
PEwwdischargey
Methane emissions from degradable
organic carbon in treated wastewater
(tCO2eyr)
126 Calculated
Qwwy Quantity of wastewater treated in year y
(m3year) 333293
Volume based on 10 m3mt
FFB24 amp FFB historical data
(2009 ndash 2011)
CODwwdischargedPJ
y
Chemical oxygen demand of the treated
wastewater discharged into river in the
project situation in year y (tCOD m3)
0000642 10 days measurement
campaign
MCFwwPJ discharge
Methane correction factor based on
discharge pathway in the project situation
(river) of the wastewater (fraction)
01 MCF values as per table
IIIH1 Version 16
Boww Methane generation capacity of the treated
wastewater (kg CH4kg COD) 025 IPCC 2006
UFPJ Model correction factor to account for
model uncertainties 112 IPCC 2006
GWPCH4 Global warming potential of methane 21 IPCC 2006
B41) Methane fugitive emissions on account of inefficiencies in capture systems in the year ldquoyrdquo
(tonnes)
Equation 15 PEfugitivewwy = (1 ndash CFEww ) MEPywwtreatment GWPCH4
Abbreviation Description Value Source
PEfugitivey Methane fugitive emissions on account of
inefficiencies in capture systems (tCO2eyr) 3796 Calculated
CFEww Capture efficiency of the biogas recovery
equipment in the wastewater treatment
systems
09 AMS IIIH Version 16
MEPywwtreatment Methane emission potential of wastewater
treatment systems equipped with biogas
recovery system in year y (tCH4yr)
1808 Refer Equation 11 of AMS
IIIH version 16
GWPCH4 Global warming potential of methane 21 IPCC 2006
B42) Methane emission potential of wastewater treatment plant in the year ldquoyrdquo (tonnes)
Equation 16 MEPwwtreatmenty = Qwwy Boww UFPJ (CODremovedPJky MCFwwtreatmentPJk)
24 Mill designed data for baseline effluent treatment plant
PROJECT DESIGN DOCUMENT FORM (CDM-SSC-PDD) - Version 03
CDM ndash Executive Board
29
Abbreviation Description Value Source
MEPwwtreatmenty Methane emission potential of wastewater
treatment systems equipped with biogas
recovery system in year y (tonnes CH4yr)
1808 Calculated
Qyww Quantity of wastewater treated in year y
(m3year) 333293
Volume based on 10 m3mt
FFB25 amp FFB historical data
(2009 ndash 2011)
Boww Methane generation capacity of the treated
wastewater (kg CH4kg COD) 025 IPCC 2006
CODremovedPJy
The chemical oxygen demand removed by
the treatment anaerobic system of the
project activity equipped with biogas
recovery in the year y (tCOD m3)
0024214
10 days measurement
campaign amp bio-digester
design parameter
MCFwwtreatmentPJ
Methane correction factor for the project
wastewater treatment system k equipped
with biogas recovery equipment
08 MCF values as per table
IIIH1 Version 16
UFPJ Model correction factor to account for
model uncertainties 112 IPCC 2006
B5) Methane emissions due to incomplete flaring in the year ldquoyrdquo (tonnes)
Equation 13a PEflaringy = TMflaredy (1 - ηflarey) GWPCH4
Abbreviation Description Value Source
PEflaringy Methane emissions due to incomplete
flaring (tCO2eyr) 0 Calculated
TMflaredh Mass flow rate of methane flared in dry
basis in the hour h (tCH4 yr) 0 Calculated
ηflarey Flare efficiency in hour h based on default
values 50
Tools for methane flaring
(open flare) for conservative
GWPCH4 Global warming potential of methane 21 IPCC 2006
Leakage emissions
No leakage emission will occur in the project activity
LEy1 = 0
Emission reductions
Equation 22 ERy ex ante = BEy ex ante ndash (PEy ex ante + LEy ex ante)
25 Mill designed data for baseline effluent treatment plant
PROJECT DESIGN DOCUMENT FORM (CDM-SSC-PDD) - Version 03
CDM ndash Executive Board
30
Abbreviation Description Value Source
ERy1 ex ante Ex ante emission reduction in year y
(tCO2e) 24712 Equation 22
BEy1 ex ante Ex ante baseline emissions in year y
(tCO2e) 30762 Equation 1
PEy1 ex ante Ex ante project emissions in year y (tCO2e) 6050 Equation 8
LEy1 ex ante Ex ante Leakage emissions in year y
(tCO2e) 0 -
Calculation for AMS-ID
Baseline emissions
Electricity generated from biogas engines will be exported to the Peninsular Malaysia National Grid The
baseline emissions are described in AMS-ID (Version 17 EB 61) as the ldquoproduct of electrical energy
baseline expressed in kWh of electricity produced by the renewable energy generating unit multiplied by
an emission factorrdquo
Baseline emissions due to electricity exported to the grid in the year ldquoyrdquo (tonnes)
BEEGy = EGBLy EFCO2gridy
Abbreviation Description Value Source
BEEGy Baseline emissions in year y (tCO2eyr) 4568 Calculated
EGBLy
Quantity of net electricity supplied to the
grid as a result of the implementation of the
project activity in year y (kWh yr)
6797625 Calculated
EFCO2gridy
CO2 emission factor of the grid in year
(tCO2kWh) 0672
Study on Grid Connected
Electricity Baselines in
Malaysia 2008 published in
2010 by PTM
Project Activity Emissions
As per AMS-ID (Version 17 EB 61) project emissions for renewable energy project activities are zero
PEEGy = 0
Leakage
If the energy generating equipment is transferred from another activity leakage is to be considered
No leakage emission will occur in the project activity LEy = 0
PROJECT DESIGN DOCUMENT FORM (CDM-SSC-PDD) - Version 03
CDM ndash Executive Board
31
Emission reductions
ERy = BEy ndash PEy - LEy
Abbreviation Description Value Source
ERy Emission reduction in year y (tCO2ey) 4568 -
BEy Baseline emissions in year y (tCO2ey) 4568 -
PEy Project emissions in year y (tCO2ey) 0 -
LEy Leakage emissions in year y (tCO2ey) 0 -
Calculation for AMS-IA
Baseline emissions
The energy baseline is the fuel consumption of the technology in use or that would have been used in the
absence of the project activity to generate the equivalent quantity of energy Option 2 is applied This
methodology is only apply shall the recovered is in excess after export to the grid
Annual electricity sent to the mill for FF displacement in the year ldquoyrdquo (kWh)
EBLy = ΣEGiy (1 ndash l)
Abbreviation Description Value Source
EBLy Annual energy baseline (kWhyr) Calculated
EGiy
The estimated annual output of the
renewable energy technologies of the group
of i renewable energy technologies
installed (kWhyr)
0 Estimated
l
Average technical distribution losses that
would have been observed in diesel
powered mini-grids installed by public
programmes or distribution companies in
isolated areas expressed as a fraction
0 Conservative by applying
Zero (0)
Baseline electricity sent to the mill for FF displacement in the year ldquoyrdquo (tonnes)
BECO2y = EBLy EFCO2
Abbreviation Description Value Source
BECO2y Baseline emission in the year y (tCO2yr) 0 Calculated
EBLy Annual energy baseline (kWhyr) 0 Calculated
EFCO2 CO2 emission factor (tCO2kWh) 08
Default value which is
derived from diesel
generation units is used
PROJECT DESIGN DOCUMENT FORM (CDM-SSC-PDD) - Version 03
CDM ndash Executive Board
32
Project Activity Emissions
As per AMS-IA (Version 14 EB 54) project emissions for renewable energy project activities are zero
PEy = 0
Leakage
If the energy generating equipment is transferred from another activity or if the existing equipment is
transferred to another activity leakage is to be considered
No leakage emission will occur in the project activity LEy = 0
B53 Summary of the ex-ante estimation of emission reductions
Estimated emission reductions (total project activity)
Year
Estimation of
project activity
emissions (tCO2e)
Estimation of
baseline emissions
(tCO2e)
Estimation of
leakage (tCO2e)
Estimation of
overall emission
reductions (tCO2e)
2012 504 2944 0 2440
2013 6050 35330 0 29280
2014 6050 35330 0 29280
2015 6050 35330 0 29280
2016 6050 35330 0 29280
2017 6050 35330 0 29280
2018 6050 35330 0 29280
2019 5546 32386 0 26840
Total (tCO2) 42350 247310 0 204960
The starting date of the crediting period is 01122012 or the date of registration whichever is later
Estimated emission reductions for AMS-IIIH
Year
Estimation of
project activity
emissions (tCO2e)
Estimation of
baseline emissions
(tCO2e)
Estimation of
leakage (tCO2e)
Estimation of
overall emission
reductions (tCO2e)
2012 504 2563 0 2059
2013 6050 30762 0 24712
PROJECT DESIGN DOCUMENT FORM (CDM-SSC-PDD) - Version 03
CDM ndash Executive Board
33
2014 6050 30762 0 24712
2015 6050 30762 0 24712
2016 6050 30762 0 24712
2017 6050 30762 0 24712
2018 6050 30762 0 24712
2019 5546 28199 0 22653
Total (tCO2) 42350 215334 0 172984
The starting date of the crediting period is 01122012 or the date of registration whichever is later
Estimated emission reductions for AMS-ID
Year
Estimation of
project activity
emissions (tCO2e)
Estimation of
baseline emissions
(tCO2e)
Estimation of
leakage (tCO2e)
Estimation of
overall emission
reductions (tCO2e)
2012 0 381 0 381
2013 0 4568 0 4568
2014 0 4568 0 4568
2015 0 4568 0 4568
2016 0 4568 0 4568
2017 0 4568 0 4568
2018 0 4568 0 4568
2019 0 4187 0 4187
Total (tCO2) 0 31976 0 31976
The starting date of the crediting period is 01122012 or the date of registration whichever is later
Estimated emission reductions for AMS-IA
Year
Estimation of
project activity
emissions (tCO2e)
Estimation of
baseline emissions
(tCO2e)
Estimation of
leakage (tCO2e)
Estimation of
overall emission
reductions (tCO2e)
2012 0 0 0 0
2013 0 0 0 0
2014 0 0 0 0
2015 0 0 0 0
2016 0 0 0 0
PROJECT DESIGN DOCUMENT FORM (CDM-SSC-PDD) - Version 03
CDM ndash Executive Board
34
2017 0 0 0 0
2018 0 0 0 0
2019 0 0 0 0
Total (tCO2) 0 0 0 0
The starting date of the crediting period is 01122012 or the date of registration whichever is later
B6 Application of the monitoring methodology and description of the monitoring plan
B61 Description of the monitoring plan
The parameters to be monitored are
Please note that the amount of methane recovered and fuelled or flared (MDy ) is calculated as follows
MDy = TMfuelledy + TMflaredy Equation A
Where Description Units
MDy Quantity of methane recovered and fuelled or flared in the year y tonnes CH4year
TMfuelledy Quantity of methane fuelled in the year y tonnes CH4year
TMflaredy Quantity of methane flared in year y tonnes CH4year
Where
TMfuelledy = FVfuelledh fvCH4h ηfuelledh ρCH4n) 1000 Equation B
Where Description Units
TMfuelledy Quantity of methane fuelled in the year y tonnes CH4year
FVfuelledh Volumetric flow rate of the fuelled biogas gas at normal conditions in
hour h
Nm3 biogashour
ηfuelledh 100 for gainful purpose26
fvCH4h Volumetric fraction of methane in the biogas gas in the hour h
ρCH4n Density of methane at normal conditions kgCH4Nm3CH4
And
TMflaredy = FVflaredh fvCH4h ηflareh ρCH4n) 1000 Equation C
Where Description Units
TMflaredy Quantity of methane flared in year y tonnes CH4year
FVflaredh Volumetric flow rate of the flared biogas gas at normal conditions in
hour h
Nm3 biogashour
26 AMS-IIIH point 35
PROJECT DESIGN DOCUMENT FORM (CDM-SSC-PDD) - Version 03
CDM ndash Executive Board
35
ηflareh Flare efficiency in the hour h
fvCH4h Volumetric fraction of methane in the biogas gas in the hour h
ρCH4n Density of methane at normal conditions kgCH4Nm3CH4
Data Parameter ID1 Qwwy
Data unit m3 month
Description The flow of wastewater entering the bio-digester
Source of data Measurement by project participant by using a flowmeter
Value of data ~ 28000
Brief description of
measurement methods and
procedures to be applied
The flow is measured with an online flow meter or equivalent
QAQC procedures to be
applied (if any) Data are monitored continuously and recorded periodically
(monthly or at shorter interval) in a data log file (DLF)
Uncertainty level of data low
Maintenance and calibration as per manufacturer‟s specifications
or at least once every three (3) years
Any comment
Data Parameter ID2 CODwwuntreatedy
Data unit tCOD m3
Description Raw COD of wastewater entering the bio-digester
Source of data Laboratory (internal and external)
Value of data ~ 0030230
Brief description of
measurement methods and
procedures to be applied
Measure of COD according to national or international standards
COD is measure through representative sampling
QAQC procedures to be
applied (if any) Minimum once a month COD sampling to ensure a 9010
confidenceprecision level
COD reports are recorded manually
Uncertainty level of data low
Maintenance and calibration as per manufacturer‟s specifications
or at least once every three (3) years for internal laboratory
equipment
Any comment
Data Parameter ID3 CODwwtreatedy
Data unit tCOD m3
Description COD of treated wastewater leaving the bio-digester
Source of data Laboratory (internal and external)
Value of data ~ 0003023
Brief description of
measurement methods and
procedures to be applied
Measure of COD according to national or international standards
COD is measure through representative sampling
QAQC procedures to be
applied (if any) Minimum once a month COD sampling to ensure a 9010
confidenceprecision level
COD reports are recorded manually
Uncertainty level of data low
PROJECT DESIGN DOCUMENT FORM (CDM-SSC-PDD) - Version 03
CDM ndash Executive Board
36
Maintenance and calibration as per manufacturer‟s specifications
or at least once every three (3) years for internal laboratory
equipment
Any comment
Data Parameter ID5 End-use of the final sludge
Data unit ndash
Description The final sludge generated by the project activity will be sent to control
landfill site if any
Source of data By project participant
Value of data ndash
Brief description of
measurement methods and
procedures to be applied
The final disposal of the sludge will be monitored during the crediting
period if any For each disposal of the sludge the following will be
recorded disposal site and date of disposal
QAQC procedures to be
applied (if any)
Any comment
Data Parameter ID6 FVflaredh
Data unit Nm3 hour
Description Volumetric flow of biogas recovered and flared at normal conditions in
the hour h
Source of data By project participant
Value of data 0
Brief description of
measurement methods and
procedures to be applied
The volume of biogas will be measured with a normalised flow meter or
calculated from the volumetric flow pressure temperature
Biogas volume and methane content measurements shall be on the same
basis (wet or dry)
QAQC procedures to be
applied (if any) The biogas flow is monitored continuously recorded and stored
electronically in a data log file (DLF) (monthly or at shorter
interval)
Data Parameter ID4 CODww dischargey
Data unit tCOD m3
Description COD of treated wastewater discharge into river by treatment system
Source of data Laboratory (internal and external)
Value of data ~ 0000100
Brief description of
measurement methods and
procedures to be applied
Measure of COD according to national or international standards
COD is measure through representative sampling
QAQC procedures to be
applied (if any) Minimum once a month COD sampling to ensure a 9010
confidenceprecision level
COD reports are recorded manually
Uncertainty level of data low
Maintenance and calibration as per manufacturer‟s specifications
or at least once every three (3) years for internal laboratory
equipment
Any comment
PROJECT DESIGN DOCUMENT FORM (CDM-SSC-PDD) - Version 03
CDM ndash Executive Board
37
Uncertainty level of data low
Maintenance and calibration as per manufacturer‟s specifications
or at least once every 3 years
Any comment
Data Parameter ID7 FVfuelledgas engineh
Data unit Nm3 hour
Description Volumetric flow of biogas recovered and fuelled (gas engine) at normal
conditions in the hour h
Source of data By project participant
Value of data ~ 509
Brief description of
measurement methods and
procedures to be applied
The volume of biogas will be measured with a normalised flow meter or
calculated from the volumetric flow of biogas pressure temperature
Biogas volume and methane content measurements shall be on the same
basis (wet or dry)
QAQC procedures to be
applied (if any) The biogas flow is monitored continuously recorded and stored
electronically in a data log file (DLF) (monthly or at shorter
interval)
Uncertainty level of data low
Maintenance and calibration as per manufacturer‟s specifications
or at least once every 3 years
Any comment
Data Parameter ID8 FVfuelledboilerh
Data unit Nm3 hour
Description Volumetric flow of biogas recovered and fuelled (boilers) at normal
conditions in the hour h
Source of data By project participant
Value of data ~ 0
Brief description of
measurement methods and
procedures to be applied
The volume of biogas will be measured with a normalised flow meter or
calculated from the volumetric flow of biogas pressure temperature
Biogas volume and methane content measurements shall be on the same
basis (wet or dry)
QAQC procedures to be
applied (if any) The biogas flow is monitored continuously recorded and stored
electronically in a data log file (DLF) (monthly or at shorter
interval)
Uncertainty level of data low
Maintenance and calibration as per manufacturer‟s specifications
or at least once every 3 years
Any comment
Data Parameter ID9 wCH4h
Data unit
Description Methane content in biogas in same basis (wetdry) as the biogas flows in
year y
Source of data By project participant using a gas analyzer
Value of data ~ 60
PROJECT DESIGN DOCUMENT FORM (CDM-SSC-PDD) - Version 03
CDM ndash Executive Board
38
Brief description of
measurement methods and
procedures to be applied
Using calibrated gas analyzer either continuous or periodical
measurement at confidenceprecision level of 9010
QAQC procedures to be
applied (if any) In case a continuous gas analyser is used data will be recorded
and stored electronically in a data log file (DLF) every hour or at
shorter interval
Uncertainty level of data low
Maintenance and calibration as per manufacturer‟s specifications
or at least once every 3 years
Any comment See also clarification by EB Meth Panel 30102009 ndash SSC_360
httpcdmunfcccintUserManagementFileStorageAM_CLAR_
QS83SX5B7WM6UGZE31JYQEQ4F65F6V
The biogas flow and the methane content measurements shall be
carried out close to each others
Data Parameter ID10 Tbiogas
Data unit ordmC
Description Temperature of biogas
Source of data Temperature probe
Value of data 20 ndash 65
Brief description of
measurement methods and
procedures to be applied
By project participant
QAQC procedures to be
applied (if any) Shall be measured and recorded at the same time when methane
content in biogas (ID8) is measured
Uncertainty level of data low
Maintenance and calibration as per manufacturer‟s specifications
or at least once every 3 years
Any comment Pressure and temperature are required to determine the density of
the methane If the biogas flow meter employed measures flow
pressure and temperature and displaysoutputs normalised flow of
biogas there is no need to separate monitoring of pressure and
temperature of the biogas
Data Parameter ID11 Pbiogas
Data unit Bar(g)
Description Pressure of biogas
Source of data By project participant
Value of data 50 ndash 200 mbar
Brief description of
measurement methods and
procedures to be applied
Pressure measurement device
QAQC procedures to be
applied (if any) Shall be measured and recorded at the same time when methane
content in biogas (ID8) is measured
Uncertainty level of data low
Maintenance and calibration as per manufacturer‟s specifications
or at least once every three (3) years
Any comment Pressure and temperature are required to determine the density of
the methane If the biogas flow meter employed measures flow
PROJECT DESIGN DOCUMENT FORM (CDM-SSC-PDD) - Version 03
CDM ndash Executive Board
39
pressure and temperature and displaysoutputs normalised flow of
biogas there is no need to separate monitoring of pressure and
temperature of the biogas
Shall be measured at the same time when methane content in
biogas (ID9) is measured
Parameter ID12 ηflareh (enclosed flare)
Unit
Description Enclosed flare efficiency in the hour h
Source of data Calculated
Value of data 0 or 50 or 90
Brief description of
measurement methods and
procedures to be applied
This yearly efficiency will be based on hourly flare efficiencies calculated
as per the provisions in the ldquoTool to determine project emissions from
flaring gases containing methanerdquo
The hourly flare efficiency will be calculated based on
0 if the temperature in the exhaust gas of the flare (Tflare) is
below 500 degC for more than 20 minutes during the hour h
50 if the temperature in the exhaust gas of the flare (Tflare) is
above 500 degC for more than 40 minutes during the hour h but the
manufacturer‟s specifications on proper operation of the flare are
not met at any point in time during the hour h
90 if the temperature in the exhaust gas of the flare (Tflare) is
above 500 degC for more than 40 minutes during the hour h and the
manufacturer‟s specifications on proper operation of the flare are
met continuously during the hour h
QAQC procedures to be
applied (if any) Data are logged hourly in a data log file (DLF)
Uncertainty level of data low
Any comment For enclosed flare
Or
Parameter ID13 ηflareh (open flare)
Unit
Description Flare efficiency in the hour h
Source of data Calculated
Value of data 0 or 50
Brief description of
measurement methods and
procedures to be applied
This yearly efficiency will be based on hourly flare efficiencies calculated
as per the provisions in the ldquoTool to determine project emissions from
flaring gases containing methanerdquo
The hourly flare efficiency will be calculated based on the duration of
time during which the flame is detected by the thermocouple (or flame
detector) installed in the open flare
Flare efficiency in hour h is based on default values
0 if the flame detected for not more than 20 minutes during the
hour h and
PROJECT DESIGN DOCUMENT FORM (CDM-SSC-PDD) - Version 03
CDM ndash Executive Board
40
50 if the flame detected for more than 20 minutes during the
hour h
A flame detector or thermocouple will be used
QAQC procedures to be
applied (if any) Data are logged hourly in a data log file (DLF)
Uncertainty level of data low
Any comment The only monitored parameter related to the flare is its efficiency Indeed
according to the clarification SSC_19927 of the methodology AMS IIIH
version 9 accepted by the SSC WG on the 3092008 ldquoIf a thermocouple
is used as a flame detection system it is sufficient to reach the given
minimum temperature from the manufacturer ldquo Hence it is not necessary
to monitor the temperature of the open type flares (Tflare)
Data Parameter ID14 ECPJjy
Data unit MWh
Description The yearly grid electricity consumption of the project activity for the year
bdquoy‟
Source of data Onsite instrument
Value of data ~749
Brief description of
measurement methods and
procedures to be applied
The grid electricity consumption of the project activity is measured
continuously with an energy meter (cumulative reading)
QAQC procedures to be
applied (if any) Data are monitored continuously and recorded periodically
(yearly or at shorter interval) in a data log file (DLF)
Uncertainty level of data low
Maintenance and calibration as per manufacturer‟s specifications
or at least once every three (3) years
Any comment
Data Parameter ID15 EGBLy
Data unit MWh
Description Quantity of net electricity generated and send to grid in year y
Source of data By project participant
Value of data ~ 6798
Brief description of
measurement methods and
procedures to be applied
The electricity generated and sent to grid is measured continuously with
an energy meter (cumulative readings)
QAQC procedures to be
applied (if any) Data are monitored continuously and recorded periodically
(yearly or at shorter interval) in a data log file (DLF)
Uncertainty level of data low
Maintenance and calibration as per manufacturer‟s specifications
or at least once every 3 years
Any comment As per AMS-ID
27 The clarification SSC_199 if available here (last access on the 24052011)
httpcdmunfcccintfilestorageAM_AM_CLAR_HIOZ5CS1PASC187C0JQ668L2E9RCRJResponse20WG20provided
20at20SSC20WG2017pdft=bU98MTMwNjIxNjY0OS4xMQ==|BOKHqtO94N6XF1N2N1vo8Ori-Rc=
PROJECT DESIGN DOCUMENT FORM (CDM-SSC-PDD) - Version 03
CDM ndash Executive Board
41
Or
Data Parameter ID16 EGmilly
Data unit MWh
Description Quantity of annual output of renewable energy sent to the mill in year y
Source of data By project participant
Value of data ~ 0
Brief description of
measurement methods and
procedures to be applied
The electricity generated and sent to mill to displace diesel use in diesel
gensets is measured continuously with an energy meter (cumulative
readings)
QAQC procedures to be
applied (if any) Data are monitored continuously and recorded periodically
(yearly or at shorter interval) in a data log file (DLF)
Uncertainty level of data low
Maintenance and calibration as per manufacturer‟s specifications
or at least once every 3 years
Any comment As per AMS-IA
Data Parameter ID17 Displacement of Biomass
Data unit Mt
Description Total amount of biomass (PKS) displaced from biomass boilers
Source of data Weighing bridge
Value of data Measurement at site
Brief description of
measurement methods and
procedures to be applied
Biomass (PKS) displaced due to the project activity will be weighed
using weighing bridge at the palm oil mill
QAQC procedures to be
applied (if any) Monthly calculation based on every single trip of trucks recorded
Data is recorded manually in a data log file based on the weighing
records
Maintenance and calibration as per manufacturer‟s specifications
Uncertainty level of data low
Any comment In the project activity the biomass (PKS) displaced will not be stored
under anaerobic conditions The conditions of onsite storage are identical
in the baseline as in the project activity The biomass will be sold to the
market on a regular basis PEbiomassy = 0
A final monitoring plan will be prepared prior the initial verification based on the as-built project activity
It will address the following aspects
MONITORING
The Project will be managed by CME with the involvement from Project Implementer CME will ensure
safety in operation of the plant as well as in the monitoring of emission reduction which is generated from
the project activity
CME will implement and be responsible for the monitoring plan Their responsibility covers operation of
the monitoring maintenance of the monitoring equipment data collection and archiving and
management of total scheme of the monitoring CME and Project Implementer will assign specific trained
PROJECT DESIGN DOCUMENT FORM (CDM-SSC-PDD) - Version 03
CDM ndash Executive Board
42
personnel during project implementation for the overall monitoring measurement and reporting of key
parameters as required in this PDD
DATA LOGGING AND STORAGE
The data measured by the instruments will be collected and stored in a data logging system The data will
be retrieved remotely by modem or directly on site
If data cannot be retrieved no emissions reductions will be claimed for the period of data failure The
data collected will be recorded in a central data base Access to production data will be restricted All
records and data (hard copy and soft copy) will be archived up to two years after the end of the crediting
period or the last issuance of CERs for this project activity whichever occurs later
CALIBRATION AND MAINTENANCE PROCEDURES MALFUNCTION OF EQUIPMENT
Maintenance includes all preventive and corrective actions necessary for the good functioning of the
equipment such as
Visual control of the equipment state and real-time check of displayed parameters
Cleaning up the equipment and the sensors
Adding lubricant
Replacement and change of defective parts
Calibration of equipment consists in verifying by comparison with a standard the accuracy of a
measuring instrument
Measuring instruments will be periodically and appropriately calibrated according to the procedures
timing and methods recommended by the manufacturer or nationalinternational standards as available
General malfunction of equipment
Daily inspections of the equipment will allow controlling equipment failure If equipment fails the
supplier will be notified and repairs will be carried out If the damaged equipment cannot be repaired it
will be replaced at the earliest In some cases portable tools will be used in order to carry out daily
monitoring of the missing parameter(s) In such case this data will be recorded manually
Discrepancies
To avoid discrepancies between projected data in the PDD and actual data (eg due to deferred starting
date malfunction of equipment) cross-checks between internal meter readings and external sources (eg
electricity invoices) will be carried out Any source of inconsistencies will be clarified
Case of emergency
For the case of emergency (earthquakes explosions fires etc) an emergency preparedness plan will be
adapted to the project activity All employees involved in the project on-site will be trained in the code of
conduct and required actions at time of commissioning of the plant
PROJECT DESIGN DOCUMENT FORM (CDM-SSC-PDD) - Version 03
CDM ndash Executive Board
43
OPERATIONAL AND MANAGEMENT STRUCTURE
The CDM monitoring team will be composed by the following staff
Position Report to
Operators
Project owner Supervisors (technicalmaintenance)
Operation Engineer
CDM monitoring project manager External CDM consultant
TRAINING OF MONITORING PERSONNEL
The maintenance will be conducted in-house by staff employed and trained by the Project Participants
Employees involved in the monitoring will be trained internally andor externally Training may include
inter alia
a) Review of equipment and captors
b) Calibration requirement
c) Configuration of monitoring equipment
d) Maintenance requirement
C1 Please indicate the level at which environmental analysis as per requirements of the CDM
modalities and procedures is undertaken Justify the choice of level at which the environmental
analysis is undertaken
radic Please tick if this information is provided at the PoA level In this case sections C2 and C3
need not be completed in this form
C2 Documentation on the analysis of the environmental impacts including transboundary
impacts
The host country does not require an analysis of environmental impacts As the project involves reduction
of GHG through recovery and controlled combustion which improves the quality of air therefore there
are no significant environmental impacts identified
C3 Please state whether an environmental impact assessment is required for a typical CPA
included in the programme of activities (PoA) in accordance with the host Party lawsregulations
In accordance with Malaysia environmental regulations Environmental Quality (Prescribed Activities
Environmental Impact Assessment) Order 1987 an Environmental Impact Assessment (EIA) is not
required for this CPA
PROJECT DESIGN DOCUMENT FORM (CDM-SSC-PDD) - Version 03
CDM ndash Executive Board
44
SECTION D Stakeholdersrsquo comments
D1 Please indicate the level at which local stakeholder comments are invited Justify the
choice
Please tick if this information is provided at the PoA level In this case sections D2 to D4 need
not be completed in this form
D2 Brief description how comments by local stakeholders have been invited and compiled
The stakeholder meeting was conducted at the office of Kilang Sawit Felda Triang on 05032012 There
were 37 stakeholders attending the consultation Posters were pasted at the guard house and at the
entrance to office 1 week before the stakeholder consultation to inform the locals stakeholders which
comprise mostly the workers of the mill 20 stakeholders out of the 37 who attended the consultation are
2nd generation of the Felda settlers who live in the vicinity to the project activity and adequately represent
the local community composed entirely of Felda settlers (no other people live in the vicinity of this
remote plantation) Continuous input of ideascomments were allowed to all stakeholders who could
either send their input though an email account especially setup for the biogas project or directly inform
the project proponents
During the meeting presentations were made by the project owner to outline the proposed project activity
in a non-technical manner (including environmental social and technological considerations) climate
change and the role of the CDM Attendees were given opportunity to raise their concern and opinion
about the proposed project activity during the question and answer session
D3 Summary of the comments received
PROJECT DESIGN DOCUMENT FORM (CDM-SSC-PDD) - Version 03
CDM ndash Executive Board
45
Below are the questions raised during the stakeholder meeting
NAME QUESTION
Mohd Tarmizi Bin Mat
Daud What is CDM in Bahasa Malaysia
Mohd Tarmizi Bin Mat
Daud What is DoE‟s standard for treated water released into river
Mohd Azizi Bin Abdul
Aziz
Would the biogas be captured from the existing effluent treatment ponds or a
new structure
Azhar Bin Abdul What to do with the captured biogas from the bioreactor
D4 Report on how due account was taken of any comments received
Below are the answers to the questions asked during the stakeholder meeting
QUESTION ANSWER
What is CDM in Bahasa Malaysia
The meaning of CDM in Bahasa Malaysia is Mekanisme
Pembangunan Bersih or in English is Clean Development
Mechanism
By Abd Karim Bin Mohd Zin
What is DoE‟s standard for treated
water released into river
The discharge standard for BOD into river is less than 100ppm
By Abd Karim Bin Mohd Zin
Would the biogas be captured from
the existing effluent treatment
ponds or a new structure
New bioreactor will be constructed to replace the existing anaerobic
lagoon treatment system The new bioreactor will capture the
biogas produced from this anaerobic treatment process
By Abd Karim Bin Mohd Zin
What to do with the captured
biogas from the bioreactor
The biogas recovered from the bioreactor will mainly contain
methane (approximately 60) and the rest are CO2 H2 and H2S
Currently the biogas is just released to the atmosphere from the
existing open lagoons system During the project activity captured
biogas will be combusted thus will improve the air quality
By Abd Karim Bin Mohd Zin
PROJECT DESIGN DOCUMENT FORM (CDM-SSC-PDD) - Version 03
CDM ndash Executive Board
46
Annex 1
CONTACT INFORMATION ON ENTITYINDIVIDUAL RESPONSIBLE FOR THE SMALL-
SCALE CPA
Organization Felda Palm Industries Sdn Bhd (359584-V)
StreetPOBox Jalan Gurney 1
Building Balai Felda 4th Floor
City Kuala Lumpur
StateRegion Wilayah Persekutuan
PostfixZIP 54000
Country Malaysia
Telephone (03) 2692 8066
FAX (03) 2693 4148
URL wwwfeldanetmy
Represented by
Title Head of Department
Salutation Mr
Last Name Busu
Middle Name
First Name Zainuri
Department Biomass
Mobile
Direct FAX
Direct tel
Personal E-Mail zainuribfeldanetmy
Organization Ably Carbon Sdn Bhd
StreetPOBox Jalan Ipoh Kecil
Building No 17
City Kuala Lumpur
StateRegion
PostfixZIP 50350
Country Malaysia
Telephone +60 3 4042 1177
FAX +60 3 4044 4166
E-Mail stephanevidailletably-carboncom
URL
Represented by Stephane Vidaillet
Title Chairman
Salutation Mr
Last Name Vidaillet
Middle Name
First Name Steacutephane
Department
Mobile +33 6 59111 5600
Direct FAX
PROJECT DESIGN DOCUMENT FORM (CDM-SSC-PDD) - Version 03
CDM ndash Executive Board
47
Direct tel
Personal E-Mail stephanevidailletably-carboncom
PROJECT DESIGN DOCUMENT FORM (CDM-SSC-PDD) - Version 03
CDM ndash Executive Board
48
Annex 2
INFORMATION REGARDING PUBLIC FUNDING
The project activity is not receiving any funding from parties included in Annex 1 of the Kyoto Protocol
SMALL-SCALE CDM PROGRAMME ACTIVITY DESIGN DOCUMENT FORM (CDM-SSC-CPA-DD) - Version 01
NAME TITLE OF THE PoA Biogas Recovery and Utilization PoA Projects in
Malaysia
CDM ndash Executive Board page 49
This template shall not be altered It shall be completed without modifyingadding headings or logo format or font
Annex 3
BASELINE INFORMATION
1 2
Year 2009 2010 2011 2012 2013 2014
FFB (mtyr) 343720 345910 310250 333293 333293 333293
POME Volume
(cumyr)[1] 343720 345910 310250 333293 333293 333293
Mill Opearing hour (hryr) 68865 69225 6209 6673 6673 6673
PKS (mtyr) 18905 19025 17064 18331 18331 18331
3 4 5 6 7 8 9 10
2015 2016 2017 2018 2019 2020 2021 2022
333293 333293 333293 333293 333293 333293 333293 333293
333293 333293 333293 333293 333293 333293 333293 333293
6673 6673 6673 6673 6673 6673 6673 6673
18331 18331 18331 18331 18331 18331 18331 18331
SMALL-SCALE CDM PROGRAMME ACTIVITY DESIGN DOCUMENT FORM (CDM-SSC-CPA-DD) - Version 01
NAME TITLE OF THE PoA Biogas Recovery and Utilization PoA Projects in
Malaysia
CDM ndash Executive Board page 50
This template shall not be altered It shall be completed without modifyingadding headings or logo format or font
10 days measurement campaign for baseline wastewater treatment system
Day Date
ETP
Inlet
Anaerobic
system (mgl)
Outlet
Anaerobic
system (mgl)
Outlet Algae
System (mgl)
Final
Discharge to
River (mgl)
1 23-Feb-12 35693 3120 811 603
2 25-Feb-12 19511 2559 1186 83
3 26-Feb-12 32864 2767 749 437
4 27-Feb-12 30195 2330 1210 404
5 28-Feb-12 32436 1927 1188 941
6 29-Feb-12 38259 4256 896 717
7 1-Mar-12 28717 3584 1232 695
8 3-Mar-12 31002 4660 1658 1210
9 4-Mar-12 22400 4346 1389 963
10 5-Mar-12 31226 4301 1971 1165
Average 30230 3385 1229 722
ETP
COD removal efficiency (anaerobic system) 8880
COD removal efficiency (Facultativealgae system) 6369
COD removal efficiency (Bio-polishing system) 4127
Total COD removal efficiency of the treatment system 9761
The COD of the raw effluent during ex-post may vary from the one year historical records depending on
the improvement of the production process (outside of project boundary) thus ERex-post may vary from the
estimated ERex-ante
SMALL-SCALE CDM PROGRAMME ACTIVITY DESIGN DOCUMENT FORM (CDM-SSC-CPA-DD) - Version 01
NAME TITLE OF THE PoA Biogas Recovery and Utilization PoA Projects in
Malaysia
CDM ndash Executive Board page 51
This template shall not be altered It shall be completed without modifyingadding headings or logo format or font
Annex 4
MONITORING INFORMATION
General information
Monitoring refers to the collection and archiving of all relevant data necessary for determining the
baseline measuring anthropogenic emissions by sources of greenhouse gases (GHG) within the project
boundary of a CDM project activity and leakage It includes developing suitable data collection methods
and data interpretation techniques for monitoring and verification of GHG emissions
On-line monitoring system
Most key meters required to determine GHG emissions and emission reductions will be monitored from a
central control point which will record meter readings at a pre-determined interval
Ensuring adequate maintenance and calibration of monitoring instruments
Specific maintenance repair or replacement of monitoring equipment will be recorded dated and
described
The calibration will occur at intervals determined on the basis of instrument manufacturers
recommendations stability purpose usage and history of repeatability Recalibration should be
performed whenever an event occurs that places the accuracy of the instrument in doubt
Calibration will take place at least once every three (3) years to ensure that the monitoring
equipments are properly installed and functioning properly
Calibration will be performed according to national or international standards
Last calibration certificates will be provided during periodic verification
Sampling procedure
Wherever a statistical sample is used for monitoring the ldquogeneral guidelines for sampling and surveys for
SSC project activitiesrdquo shall be used COD shall be measured from a composite sample to obtain a
representative value
Data archiving
The monitored data will be kept for a minimum of 2 years after the end of the crediting years by using
paper documents or electronic files
Identification of non-conformities
A verification of inconsistencies of the data recorded will be performed based for example on
The comparison of the calculated quantities of methane versus expected
Spot checks of field instruments (local reading) and data in the log file
Any discrepancies (completeness calculation errors transcription errors instrument calibration issues)
will be analyzed and actions taken to correct the problem
Ensuring adequate training of staff
All new staff members will undergo bdquoon job training‟ covering the monitoring requirements
The monitoring plan will be made available to staff member involved in the monitoring
A copy will be located in the control room at the site
SMALL-SCALE CDM PROGRAMME ACTIVITY DESIGN DOCUMENT FORM (CDM-SSC-CPA-DD) - Version 01
NAME TITLE OF THE PoA Biogas Recovery and Utilization PoA Projects in
Malaysia
CDM ndash Executive Board page 52
This template shall not be altered It shall be completed without modifyingadding headings or logo format or font
During the training the employees will sign a training attendance list All training records shall
be documented inclusive of training attendance training memo and training material if any
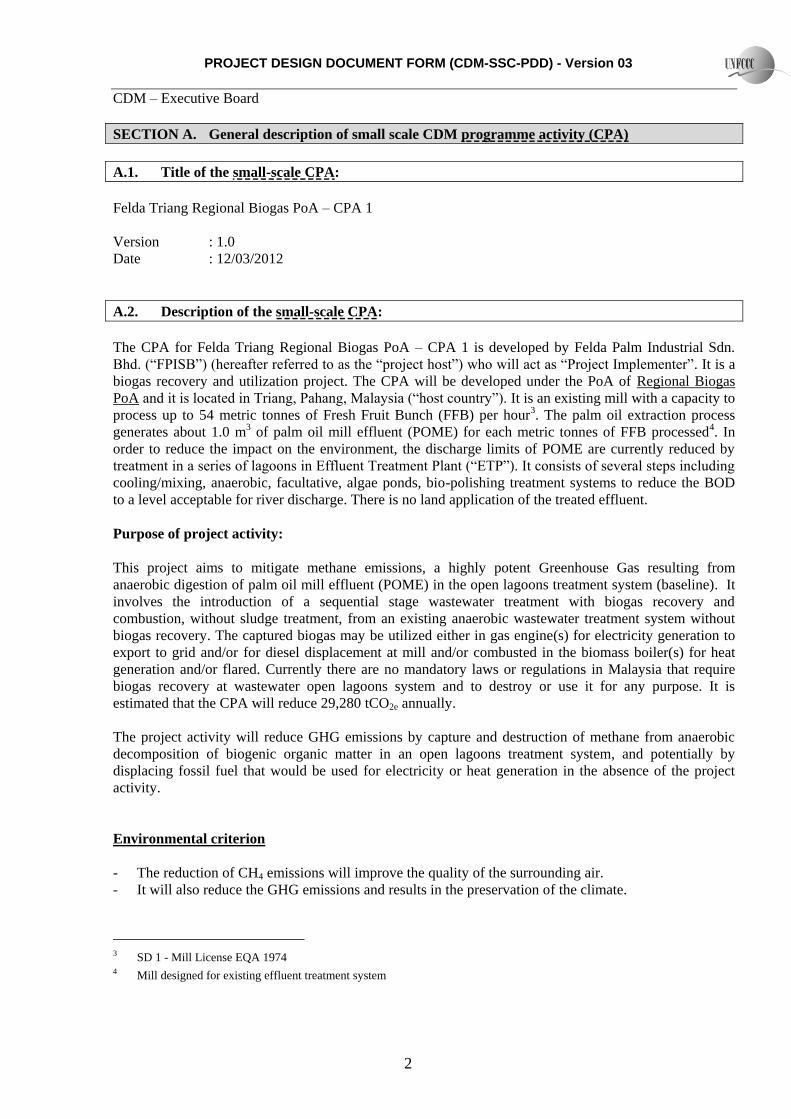
PROJECT DESIGN DOCUMENT FORM (CDM-SSC-PDD) - Version 03
CDM ndash Executive Board
2
SECTION A General description of small scale CDM programme activity (CPA)
A1 Title of the small-scale CPA
Felda Triang Regional Biogas PoA ndash CPA 1
Version 10
Date 12032012
A2 Description of the small-scale CPA
The CPA for Felda Triang Regional Biogas PoA ndash CPA 1 is developed by Felda Palm Industrial Sdn
Bhd (ldquoFPISBrdquo) (hereafter referred to as the ldquoproject hostrdquo) who will act as ldquoProject Implementerrdquo It is a
biogas recovery and utilization project The CPA will be developed under the PoA of Regional Biogas
PoA and it is located in Triang Pahang Malaysia (ldquohost countryrdquo) It is an existing mill with a capacity to
process up to 54 metric tonnes of Fresh Fruit Bunch (FFB) per hour3 The palm oil extraction process
generates about 10 m3 of palm oil mill effluent (POME) for each metric tonnes of FFB processed4 In
order to reduce the impact on the environment the discharge limits of POME are currently reduced by
treatment in a series of lagoons in Effluent Treatment Plant (ldquoETPrdquo) It consists of several steps including
coolingmixing anaerobic facultative algae ponds bio-polishing treatment systems to reduce the BOD
to a level acceptable for river discharge There is no land application of the treated effluent
Purpose of project activity
This project aims to mitigate methane emissions a highly potent Greenhouse Gas resulting from
anaerobic digestion of palm oil mill effluent (POME) in the open lagoons treatment system (baseline) It
involves the introduction of a sequential stage wastewater treatment with biogas recovery and
combustion without sludge treatment from an existing anaerobic wastewater treatment system without
biogas recovery The captured biogas may be utilized either in gas engine(s) for electricity generation to
export to grid andor for diesel displacement at mill andor combusted in the biomass boiler(s) for heat
generation andor flared Currently there are no mandatory laws or regulations in Malaysia that require
biogas recovery at wastewater open lagoons system and to destroy or use it for any purpose It is
estimated that the CPA will reduce 29280 tCO2e annually
The project activity will reduce GHG emissions by capture and destruction of methane from anaerobic
decomposition of biogenic organic matter in an open lagoons treatment system and potentially by
displacing fossil fuel that would be used for electricity or heat generation in the absence of the project
activity
Environmental criterion
- The reduction of CH4 emissions will improve the quality of the surrounding air
- It will also reduce the GHG emissions and results in the preservation of the climate
3 SD 1 - Mill License EQA 1974 4 Mill designed for existing effluent treatment system
PROJECT DESIGN DOCUMENT FORM (CDM-SSC-PDD) - Version 03
CDM ndash Executive Board
3
- The new treatment plant is expected to improve the quality of the discharge water due to better
management
Social criterion
- By reducing the methane emission the project will contribute to the health of the population in the
area and nearby
- Besides providing job opportunities the project will also set in motion a demonstration effect leading
to other units adopting similar activity which would go to improve the job opportunity
- The increased job opportunity will reduce social disparity in the society and thereby contribute to
peace in the society
Economic criterion
- The project involves a technology transfer into host country Indeed the open anaerobic lagoons are
replaced by either bio-digester
- Training will be provided to the locals to ensure them to be able to execute and manage the project It
leads to the increase of the local skills
- Provide job opportunities especially for the local community live nearby
A3 Entityindividual responsible for the small-scale CPA
Felda Palm Industrial Sdn Bhd is the entity responsible for the Felda Triang Regional Biogas PoA ndash
CPA 1
A4 Technical description of the small-scale CPA
Technology Description
The project activity includes the following systems
a) The methane capture in newly built covered lagoon
The project activity involves the introduction of a sequential stage covered lagoon(s) to an existing
open lagoons system The biogas recovery system is designed by KPSR Construction Ltd with
experience in implementing projects at palm oil mills The project activity consists of newly
constructed covered lagoon(s) anaerobic treatment system that will be built for the treatment of
POME effluent and biogas recovery
The covered lagoon treatment system developed by KPSR Construction Ltd adopts a series of
treatment processes consisting mainly of pretreatment and anaerobic degradation Raw POME will
be channeled to the cooling pondtower intended for cooling of the effluent before being sent to the
covered anaerobic digester system The new lagoon(s) will be covered by synthetic high-density
polyethylene (HDPE) geo-membrane which is sealed by means of strip-to-strip welding and a
peripheral anchor trench dug around the perimeter of the existing lagoon HDPE is an excellent
product for large applications requiring UV ozone and chemical resistance and because of these
attributes is one of the most commonly used geo-membranes worldwide
PROJECT DESIGN DOCUMENT FORM (CDM-SSC-PDD) - Version 03
CDM ndash Executive Board
4
The recovery of biogas reduces odour and prevents methane emissions The covered lagoon system
is expected to be able to achieve 90 COD treatment efficiency The covered lagoon will utilize
biogas for mixing to enhance the anaerobic processes in the system The biogas mixing will ensure
the POME is well-mixed and homogenized in the digester tank for optimum system performance
Treated POME from the covered lagoon will send to existing Facultative Algae lagoons system and
bio-polishing system for further treatment to reduce the BODCOD to meet the discharge standard
before discharging to the watercourse5 Existing anaerobic lagoons will be closed after the treatment
systems is stable and achieving the discharge standard
b) Flaring system
Enclosed or open flare will be utilized to burn the excess of biogas in case of maintenance of the gas
engine(s) boiler(s) in case no gas engine(s) boiler is installed or during emergency
c) Gainful use of biogas
The technology that will be used is environmentally safe and sound the renewable based captive
power plant that will be installed will improve the security on site by controlling methane emissions
The recovered biogas will be gainfully use and it is depending on the final requirement of energy by
the mill
Recovered biogas may be combusted in gas engines for grid export andor utilisation at the mill
while balance of biogas (if any) is sent to existing biomass boiler(s) for heat generation and thus
displacing biomass (Palm Kernel Shell (PKS)) excess biogas will be combusted either in enclosed
or open flare equipped with safety features The flare type to be installed is not defined yet it might
be an enclosed flare or an open flare Flare(s) will be operating whenever suitable in case engines or
biomass boiler(s) are unavailable
According to theoretical volumes of biogas to be captured the installed capacity of the power plant
is likely to be 12 MW or more For 12 MW engine the electrical efficiency is around 41
(assumptions for ex-ante calculations)Bio-scrubber and gas drying system will be installed before
the biogas is combusted in the gas engine(s)
The equipments maybe connected to the public grid electricity system to satisfy their energy needs
and may use back-up such as reciprocating engines or other source of energy
The operational lifetime of the equipment is expected to be 20 years if the maintenance is performed
correctly No technology substitution is expected during the crediting period unless if it appears that
the chosen capacity is not adapted to the actual flow or if the equipment is damaged
5 SD 1 - Mill License EQA 1974
PROJECT DESIGN DOCUMENT FORM (CDM-SSC-PDD) - Version 03
CDM ndash Executive Board
5
MILL
Cooling Pond tower
Gas engine(s) Biogas
Project activity
Covered lagoon
River
Final Discharge
Bio-Polishing system
Effluent
Biogas
Enclosed Open flare
Excess biogas
Raw POME
Electricity
Facultative + Algae lagoons
Treated Effluent
Excess Sludge
Land application
To gird andor mill
Existing biomass boiler(s)
Electricity import from Grid for biogas plant
Heat
Displace PKS
Figure A1 Flow diagram of the Project Activity
A41 Identification of the small-scale CPA
A411 Host Party
The host party of this CPA is Malaysia
A412 Geographic reference or other means of identification allowing the
unique identification of the small-scale CPA (maximum one page)
Table A1 Details of the geographic reference of CPA
Name of entity responsible for CPA Felda Palm Industrial Sdn Bhd
Contact details of entity responsible for CPA Jabatan Biomass Tingkat 4 Balai Felda Jalan
Gurney Satu 54000 Kuala Lumpur Malaysia
Tel +603 2692 8066 Fax +603 2691 2563
CityTownCommunity Kuala Lumpur
RegionStateProvince Kuala Lumpur
Country Malaysia
Geographic coordinates of the site 3 16152 N 102 34567 E OR 32692 1025761
A map indicating the location of the CPA site is given below
PROJECT DESIGN DOCUMENT FORM (CDM-SSC-PDD) - Version 03
CDM ndash Executive Board
6
Figure A2 Location of the Project Activity
A42 Duration of the small-scale CPA
A421 Starting date of the small-scale CPA
Starting date of the CPA will be the date on which the Engineering Procurement and Construction (EPC)
contract for the CPA will be awarded The EPC contract for the CPA has not yet been awarded
The start date of the CPA is not or will not be prior to the commencement of validation of the PoA
A422 Expected operational lifetime of the small-scale CPA
The operational lifetime of the CPA will be 20 years
A43 Choice of the crediting period and related information
Renewable crediting period
A431 Starting date of the crediting period
01122012 or the date of its inclusion in the PoA whichever is later
A432 Length of the crediting period first crediting period if the choice is
renewable CP
PROJECT DESIGN DOCUMENT FORM (CDM-SSC-PDD) - Version 03
CDM ndash Executive Board
7
The length of the first crediting period of the CPA6 will be 7 years
A44 Estimated amount of emission reductions over the chosen crediting period
Years Annual estimation of emission reductions in tonnes of CO2e
2012 2440
2013 29280
2014 29280
2015 29280
2016 29280
2017 29280
2018 29280
2019 26840
Total estimated reductions
(tonnes of CO2e) 204960
Total number of crediting years 7
Annual average over the crediting
period of estimated reductions
(tonnes of CO2e)
29280
The starting date of the crediting period is 01122012 or the date of its inclusion in the PoA whichever
is later
A45 Public funding of the CPA
The project has not received and will not be seeking public funding from Annex 1 countries
A46 Information to confirm that the proposed small-scale CPA is not a de-bundled
component
1 For the purposes of registration of a Programme of Activities (PoA)7 a proposed small-scale CPA
of a PoA shall be deemed to be a de-bundled component of a large scale activity if there is
already an activity8 which
(a) Has the same activity implementer as the proposed small scale CPA or has a coordinating
or managing entity which also manages a large scale PoA of the same sectoral scope and
(b) The boundary is within 1 km of the boundary of the proposed small-scale CPA at the
closest point
6 Please note that the duration of crediting period of any CPA shall be limited to the end date of the PoA regardless of when
the CPA was added 7 Only those POAs need to be considered in determining de-bundling that are (i) in the same geographical area and (ii) use
the same methodology as the POA to which proposed CPA is being added 8 Which may be a (i) registered small-scale CPA of a PoA (ii) an application to register another small-scale CPA of a PoA or
(iii) another registered CDM project activity
PROJECT DESIGN DOCUMENT FORM (CDM-SSC-PDD) - Version 03
CDM ndash Executive Board
8
2 If a proposed small-scale CPA of a PoA is deemed to be a debundled component in accordance
with paragraph 2 above but the total size of such a CPA combined with a registered small-scale
CPA of a PoA or a registered CDM project activity does not exceed the limits for small-scale
CDM and small-scale AR project activities as set out in Annex II of the decision 4CMP1 and
5CMP1 respectively the CPA of a PoA can qualify to use simplified modalities and procedures
for small-scale CDM and small-scale AR CDM project activities
The CPA implementer is also implementing other methane recovery project activities but these projects
are more than 1km away from the proposed small-scale CPA at the closest point Therefore the proposed
CPA is not a de-bundled component of a large scale project activity as it does not satisfy any of the above
provisions
A47 Confirmation that small-scale CPA is neither registered as an individual CDM
project activity or is part of another Registered PoA
The project information of this CPA has been checked against the PoA and CDM database available on
UNFCCC website and no duplicate entries were identified It is confirmed that the proposed CPA is
neither registered as an individual CDM project activity nor is part of another PoA This has also been
confirmed by the project implementer Felda Palm Industrial Sdn Bhd
SECTION B Eligibility of small-scale CPA and Estimation of emissions reductions
B1 Title and reference of the Registered PoA to which small-scale CPA is added
Regional Biogas PoA
Version 10
Date 12032012
B2 Justification of the why the small-scale CPA is eligible to be included in the Registered PoA
Table B1 Eligibility of CPA to be included in the Registered PoA
Ndeg Criteria Justification
1 Geographical boundary The CPA takes
place within the borders of Malaysia
The proposed CPA-1 is located in the state of
Pahang Malaysia with GPS coordinates of 3
16152 N 102 34567 E OR 32692 1025761
2 No double counting
The CPA is not already included in another
PoA or developed as a stand-alone CDM
project
The proposed CPA is not already included in
another PoA or developed as a stand-alone CDM
project
PROJECT DESIGN DOCUMENT FORM (CDM-SSC-PDD) - Version 03
CDM ndash Executive Board
9
3
Applicability conditions of AMS-IIIH
a) Substitution of aerobic wastewater or
sludge treatment systems with anaerobic
systems with biogas recovery and
combustion
b) Introduction of anaerobic sludge
treatment system with biogas recovery
and combustion to a wastewater
treatment plant without sludge
treatment
c) Introduction of biogas recovery and
combustion to a sludge treatment
system
d) Introduction of biogas recovery and
combustion to an anaerobic wastewater
treatment system such as anaerobic
reactor lagoon septic tank or an on site
industrial plant
e) Introduction of anaerobic wastewater
treatment with biogas recovery and
combustion with or without anaerobic
sludge treatment to an untreated
wastewater stream
f) Introduction of a sequential stage of
wastewater treatment with biogas
recovery and combustion with or
without sludge treatment to an
anaerobic wastewater treatment system
without biogas recovery (eg
introduction of treatment in an
anaerobic reactor with biogas recovery
as a sequential treatment step for the
wastewater that is presently being
treated in an anaerobic lagoon without
methane recovery)
The CPA is applying Option (f)
Introduction of a sequential stage of wastewater
treatment with biogas recovery and combustion
with or without sludge treatment to an anaerobic
wastewater treatment system without biogas
recovery (eg introduction of treatment in an
anaerobic reactor with biogas recovery as a
sequential treatment step for the wastewater that is
presently being treated in an anaerobic lagoon
without methane recovery)
4(a) The recovered methane measured may also
be utilized for thermal or mechanical
electrical generation directly ndash AMS-IIIH
para 3(a)
The recovered biogas may be used for electricity
generation through combustion in biogas engine(s)
system andor biomass boiler(s) for heat
generation Excess biogas if any will be flared
This in compliance with only AMS-IIIH
paragraph 3(a) and not the others
4(b) The recovered methane measured may also
be utilized for thermal or mechanical
electrical energy generation after bottling of
upgraded biogas ndash AMS-IIIH para 3(b)
Not applicable
4(c) The recovered methane measured may also
be utilized for thermal or mechanical
electrical energy generation after upgrading
and distribution ndash AMS-IIIH para 3(c)
Not applicable
4(d) The recovered methane measured may also Not applicable
PROJECT DESIGN DOCUMENT FORM (CDM-SSC-PDD) - Version 03
CDM ndash Executive Board
10
be utilized for hydrogen production ndash AMS-
IIIH para 3(d)
4(e) The recovered methane measured may also
be utilized for use as fuel in transportation
applications after upgrading ndash AMS-IIIH
para 3(e)
Not applicable
5 If the recovered biogas is used for project
activities covered under AMS-IIIH
paragraph 3(a) that component of the
project activity can use a corresponding
methodology under Type I
The recovered biogas is planned for gainfully use
for electricity andor heat generation in the CPA
The approved baseline and monitoring
methodology AMS IA (version 14) andor AMS-
ID (version 17) are used for the electricity
component of the CPA
6 Conditions that ensure compliance with
applicability and other requirements of
single or multiple methodologyies applied
by CPA
The proposed CPA-01 will apply AMS-IIIH
AMS-IA andor AMS-ID Applicability criteria
are listed below
7 The project has to fulfill Host Country
National CDM criteria if any
Malaysia‟s National CDM criteria have been
fulfilled by the proposed CPA
8 The starting date of CPA is compliant with
the latest UNFCCC guidelines
The start date of the CPA is not or will not be
prior to the commencement of validation of the
PoA The EPC contract for biogas plant yet to be
awarded
9 Confirmation that the CPA does not involve
any public funding from Annex I Parties or
that in case public funding is used it does
not result in diversion of Official
Development Assistance (ODA)
The proposed CPA has not received and will not
be seeking public funding from Annex 1 countries
10 A local Stakeholder consultation has been
conducted prior to the CPA inclusion
Stakeholder consultation has been organized on
05032012 and it is prior to the CPA inclusion
11 Conditions pertaining to the demonstration
of additionality of each small scale CPA to
be included (less than 60 ktCO2 year) for
Type III and 15MW for Type I
methodologies
The proposed CPA may install gas engine with
maximum capacity of 12 MW and methane
avoidance of less than 60000 tCO2yr for AMS-
IIIH
12 Where applicable the conditions that ensure
that CPA in aggregate meets the small-scale
threshold criteria and remain within this
threshold throughout the crediting period of
the CPA
The proposed CPA may install gas engine with
maximum capacity of 12 MW and methane
avoidance of less than 60000 tCO2yr for AMS-
IIIH
13 Where applicable the requirements for the
debundling check in case CPAs belong to
small-scale (SSC) project categories
The proposed CPA is not a debundled component
of a large activity as described in the latest
ldquoGuidelines on assessment of debundling for SSC
project activitiesrdquo
14 Where applicable the conditions related to
sampling requirements for a PoA in
accordance with the approved
guidelinesstandard from the Board
pertaining to sampling and surveys
Not applicable all CPAs will be verified
15 Where applicable target group (eg The target group is prospective POME plants in
PROJECT DESIGN DOCUMENT FORM (CDM-SSC-PDD) - Version 03
CDM ndash Executive Board
11
domesticcommercialindustrial ruralurban
grid-connectedoff-grid) and distribution
mechanisms (eg direct installation)
Malaysia There are no specific distribution
mechanisms
16 Whether an EIA is required by local
authorities
Not applicable for the proposed CPA as EIA is not
required
17 The crediting period of the CPA shall not
exceed the length of the PoA (ie 28 years)
regardless of the time of inclusion of CPA in
the PoA
The crediting period of the proposed CPA will not
exceed the length of PoA 28 years
Additional eligibility criteria applicable in case of CPA that gainfully use of biogas for electrical
andor thermal energy generation
The proposed project conforms to the applicable requirements of AMS - ID version 17
Applicability Criteria Justification
This methodology comprises renewable energy
generation units such as photovoltaic hydro
tidalwave wind geothermal and renewable biomass
a) Supplying electricity to a national or a regional
grid
b) Supplying electricity to an identified consumer
facility via nationalregional grid through a
contractual arrangement such as wheeling
Applicable The proposed project activity is
based on biogas recovered from anaerobic bio-
digester a renewable energy generation source
The proposed project shall supply electricity to
the national grid
The project activity is not supplying electricity
to an identified consumer facility
This methodology is applicable to project activities that
(a) Install a new power plant at a site where there was
no renewable energy power plant operating prior
to the implementation of the project activity
(Greenfield plant)
(b) Involve a capacity addition
(c) Involve a retrofit of (an) existing plant(s)
(d) Involve a replacement of (an) existing plant(s)
Applicable to (a) where the proposed project
activity shall install a new power plant at a site
where there was no renewable energy power
plant operating prior to the implementation of
the project activity
Hydro power plants with reservoirs that satisfy at least
one of the following conditions are eligible to apply this
methodology
Not applicable The project activity is a biogas
recovery and utilization project
If the new unit has both renewable and non-renewable
components (eg a winddiesel unit) the eligibility limit
of 15MW for a small-scale CDM project activity applies
only to the renewable component If the new unit co-
fires fossil fuel the capacity of the entire unit shall not
exceed the limit of 15MW
Not applicable The project does not
incorporate a mix of renewable and non-
renewable components
Combined heat and power (co-generation) systems are
not eligible under this category
Applicable There is no combined heat and
power component in the project activity
PROJECT DESIGN DOCUMENT FORM (CDM-SSC-PDD) - Version 03
CDM ndash Executive Board
12
In the case of project activities that involve the addition
of renewable energy generation units at an existing
renewable power generation facility the added capacity
of the units added by the project should be lower than
15 MW and should be physically distinct from the
existing units
Not applicable The project activity does not
involve the addition of renewable energy
generation units at an existing facility
In the case of retrofit or replacement to qualify as a
small-scale project the total output of the retrofitted or
replacement unit shall not exceed the limit of 15 MW
Not applicable The project activity does not
seek to retrofit or replacement an existing
facility
The proposed project conforms to the applicable requirements of AMS - IA version 14
Applicability Criteria Justification
This category comprises renewable electricity
generation units that supply individual Households
users or groups of households users included in the
project boundary The applicability is limited to
individual households and users that do not have a grid
connection except when
a) A group of households or users are supplied
electricity through a standalone mini grid powered
by renewable energy generation unit(s) where the
capacity of the generating units does not exceed 15
MW or
b) The emissions reduction per renewable energy
based lighting system is less than 5 tonnes of CO2e
a year and where it can be shown that fossil fuel
would have been used in the absence of the project
activity by
(i) A representative sample survey (90
confidence interval plusmn10 error margin) of
target households or
(ii) Official statistics from the host country
government agencies
The renewable energy generation units include
technologies such as solar hydro wind biomass
gasification and other technologies that produce
electricity all of which is used on-sitelocally by the
user
The renewable generating units may be new
installations (Greenfield) or replace existing onsite
fossil-fuel-fired generation To qualify as a small-scale
project the total output of the unit(s) shall not exceed
the limit of 15 MW
Applicable The proposed project activity is not
grid connected
Furthermore the total installed capacity of the
generating units will not exceed 15 MW
Applicable The project activity involves the
combustion of the recovered biogas from the
anaerobic bio-digester for electricity generation
to be use on-site
Applicable The project activity involve the
replacement of existing onsite fossil fuel fired
generation and the total installed capacity is not
PROJECT DESIGN DOCUMENT FORM (CDM-SSC-PDD) - Version 03
CDM ndash Executive Board
13
exceed 15 MW
Hydro power plants with reservoirs that satisfy at least
one of the following conditions are eligible to apply this
methodology
The project activity is implemented in an existing
reservoir with no change in the volume of
reservoir
The project activity is implemented in an existing
reservoir where the volume of reservoir is
increased and the power density of the project
activity as per definitions given in the Project
Emissions section is greater than 4 Wm2
The project activity results in new reservoirs and
the power density of the power plant as per
definitions given in the Project Emissions section
is greater than 4 Wm2
Not applicable The project activity is not a
hydro power plant
Combined heat and power (co-generation) systems are
not eligible under this category
Applicable There is no combined heat and
power component in the project activity
If the unit added has both renewable and non-renewable
components (eg a winddiesel unit) the eligibility
limit of 15 MW for a small-scale CDM project activity
applies only to the renewable component If the unit
added co-fires fossil fuel the capacity of the entire unit
shall not exceed the limit of 15 MW
Not applicable The project does not
incorporate a mix of renewable and non-
renewable components
Project activities that involves retrofit or replacement of
an existing facility for renewable energy generation are
included in this category To qualify as a small-scale
project the total output of the modified or retrofitted
unit shall not exceed the limit of 15 MW
Not applicable The project activity does not
seek to retrofit or replacement an existing
facility
In the case of project activities that involve the addition
of renewable energy generation units at an existing
renewable power generation facility the added capacity
of the units added by the project should be lower than
15 MW and should be physically distinct3 from the
existing units
Not applicable The project activity does not
involve the addition of renewable energy
generation units at an existing facility
B3 Assessment and demonstration of additionality of the small-scale CPA as per eligibility
criteria listed in the Registered PoA
In Malaysia Environmental Quality (Prescribed Premises) (Crude Palm Oil) Regulation 1977 governs
environmental considerations including the wastewater treatment and discharge at palm oil mills The
regulation stipulates the discharge standards for water discharge or land application The regulation
however does not specify the required treatment technologies for wastewater or GHG emissions from
wastewater treatment operations
PROJECT DESIGN DOCUMENT FORM (CDM-SSC-PDD) - Version 03
CDM ndash Executive Board
14
More than 85 of palm oil mills are utilizing open based anaerobic ponds and it is considered the
prevailing practice for oil palm industry to treat the POME The open anaerobic ponds system is an
effective and low-tech solution that can easily meet the water discharge limits applicable to the palm oil
industry9 10
There is no financial incentive for the palm oil mill owners to invest into methane capture projects
particularly when there is no requirement under existing pending or planned national state or local
regulatory This is partly related to the fact that there are a lot of attractive and competing investments in
the sector However the PP has undertaken to set up this project in order to reduce the GHG emissions
and contribute his mite to the global GHG emission reduction
The project is a small scale project activity As such the provisions of Attachment A to Appendix B of
the simplified modalities and procedures for small-scale CDM project activities will apply to this project
The bdquoindicative simplified baseline and monitoring methodologies for selected small-scale CDM project
activity categories‟ require the project proponents to demonstrate that the project activity would not have
occurred anyway due to at least one of the following barriers
a) Investment barrier a financially more viable alternative to the project activity would have led to
higher emissions
b) Technological barrier a less technologically advanced alternative to the project activity involves
lower risks due to the performance uncertainty or low market share of the new technology
adopted for the project activity and so would have led to higher emissions
c) Barrier due to prevailing practice prevailing practice or existing regulatory or policy
requirements would have led to the implementation of a technology with higher emissions
d) Other barriers without the project activity for another specific reason identified by the project
participant such as institutional barriers or limited information managerial resources
organizational capacity financial resources or capacity to absorb new technologies emissions
would have been higher
Subsequently in its 35th Meeting the EB had issued bdquoNon-binding best practice examples to demonstrate
additionality for SSC project activities‟ wherein EB had given best practice examples of each of the
aforementioned category of barriers
The project participant has chosen Investment Barrier to demonstrate the additionality which is discussed
in the following paragraphs
Investment barrier
The most important of all the barriers faced by the company is the investment barrier The investment
analysis reveals that the project is not financially attractive The additionality tool permits the use of
simple cost analysis or investment comparison analysis or benchmark analysis to demonstrate the
additionality of the project
9 SD 05 ndash Yeoh B G 2004 A Technical and Economic Analysis of Heat and Power Generation from Biomethanation of
Palm Oil Mill Effluent Electrcity Supply Industry in Transition Issues and Prospect for Asia 10 SD 06 ndash Eco-Ideal Consulting Sdn Bhd (Eco-Ideal) 2004 MEWCPTMDANIDA Study on Clean Development
Mechanism Potential in the Waste Sectors in Malaysia Unpublished
PROJECT DESIGN DOCUMENT FORM (CDM-SSC-PDD) - Version 03
CDM ndash Executive Board
15
As the project activity generates revenue (other than CDM revenue) by exporting the electricity to the
grid and from the likely sale of biomass andor saving from diesel usage at the mill which is being
displaced by biogas simple cost analysis cannot be used Of the remaining PP has chosen the benchmark
analysis to demonstrate the financial unattractiveness of the project activity without carbon credits
There is a national policy on Feed-In-Tariff (FiT) gazetted in June 201111
that gives comparative
advantages to less emissions-intensive technologies over more emissions-intensive technologies (E-
policy as national andor sectoral policies or regulations that give comparative advantages to less
emissions-intensive technologies over more emissions-intensive technologies)
This is very conservative as paragraph 7 6 (b) EB22 Annex 3 states that ldquoNational andor sectoral
policies or regulations hellip that have been implemented since the adoption by the COP of the CDM MampP
(decision 17CP7 11 November 2001) need not be taken into account in developing a baseline scenario
(ie the baseline scenario could refer to a hypothetical situation without the national andor sectoral
policies or regulations being in place) In absence of the FiT the prevailing electricity sales tariff to
consumers is RM 021 per kWh
Project IRR has been chosen as the financial indicator for the financial analysis of the project activity
The project IRR has to be compared with a benchmark rate of return to demonstrate the additionality of
the project The Guidelines on the Assessment of Investment Analysis (Version 05 point 12) states ldquoIn
cases where a benchmark approach is used the applied benchmark shall be appropriate to the type of IRR
calculated Local commercial lending rates or weighted average costs of capital (WACC) are appropriate
benchmarks for a project IRR Requiredexpected returns on equity are appropriate benchmarks for an
equity IRR Benchmarks supplied by relevant national authorities are also appropriate if the DOE can
validate that they are applicable to the project activity and the type of IRR calculation presentedrdquo
In line with the Guidelines on the Assessment of Investment Analysis (Version 05) a default value
for the expected returns on equity is selected as the benchmark with 1090 The logic of choosing this
rate as benchmark is that the project should yield a return at least equivalent to the expected returns of
equity to merit consideration
For making the investment analysis the following assumptions have been made
Table B2 Investment Analysis
Sl No Description Value
1
Budgeted CAPEX
- Bioreactor amp accessories
- Flaring system
- Boiler adaptation cost for burners
- Gas engine(s)
- KPSR consultancy cost
4350000
140670
205000
4630000
220000
Total 9545670
2
Annual maintenance costs are estimated based on a of CAPEX12
Bioreactor (3 of CAPEX) = MYR 130500
Gas engine(s) (5 of CAPEX) = MYR 231500
3 Corporate tax ()13 25
11 httpwwwmbipvnetmydloadFiT20Handbook20Englishpdf 12 SD 05 ndash Maintenance cost (SIRIM Environmental and Bioprocess Technology Centre of Malaysia)
PROJECT DESIGN DOCUMENT FORM (CDM-SSC-PDD) - Version 03
CDM ndash Executive Board
16
Since losses can be carried forward indefinitely (so long as the ownership
remains unchanged) the incidence of taxation does not arise in the case of
this project activity
4
Manpower cost has been estimated based on 1 supervisor 2 operators 1
chargeman envisaged to be appointed and the ruling wagesalary structure
of the company14
182588 MYR yr
5 Salary increment rate has been applied based on the average expected
salary increment rate for year 20101115 40
6 Price of Biomass ex-factory (PKS) 156 MYRmt
7 Price of diesel 220 MYRliter
8 RE tariff export to grid (MYRkWh) 021
9
Laboratory Cost is estimated based on the quotations from accredited
laboratory anticipated number of tests and samples to be carried out and
transportation cost during the running and operating of the biogas plant for
maintaining optimum operating conditions
1920 MYR yr
10 Insurance premium per year ( of CAPEX)16 0412
11 Estimate of CER price (EUR) 8
12
Depreciation of equipment (years) has been provided as per the Inland
Revenue Authority regulations17 Since the project consists of only
environmental protection equipment it is entitled to initial capital
allowance of 40 and annual capital allowance of 20 as per the Inland
Revenue Authority notifications
4 years
13 Project life time for IRR calculation18 20 years
14
Residual value a fair value (5) of the project activity assets at the end of
the assessment period as per the Guidelines on The Assessment of
Investment Analysis version 05 EB 62
MYR 466284
Based on the above assumption the project IRR works out to be ndash 085 in contrast to the benchmark
rate of 1090 Thus the analysis proves that the project is not financially attractive
Sensitivity Analysis
A sensitivity analysis has also been conducted to test the robustness of the conclusions drawn Four (4)
factors have been identified as critical to IRR of the project viz project cost maintenance costs RE
tariff The results of sensitivity analysis are given below
13 SD 08 ndash Malaysian Tax and Business Booklet 201011 Page 12
httpwwwpwccomen_MYmyassetspublicationstaxbooklet1011pdf 14 SD 3 - Salary structure (biogas plant) 15 SD 09 - Salary increment rate (201011) 16 SD 2 - Biogas plant insurance policy 17 SD 08 ndash Malaysian Tax and Business Booklet 201011 Page 21
httpwwwpwccomen_MYmyassetspublicationstaxbooklet1011pdf 18 As per the Guidelines on the Assessment of Investment Analysis version 05 (Annex 5 EB 62 point 3) ldquoIn general a
minimum period of 10 years and a maximum of 20 years will be appropriaterdquo PP has chosen 20 years for financial
assessment as it is conservative
PROJECT DESIGN DOCUMENT FORM (CDM-SSC-PDD) - Version 03
CDM ndash Executive Board
17
Table B3 Sensitivity Analysis
FACTORS PROJECT IRR
-10 0 +10
Project cost -185 -085 033
Maintenance cost -491 -085 189
RE tariff 112 -085 -354
It could be seen from the above that even under the most optimistic conditions the project activity would
not yield a positive IRR let alone crossing the benchmark Therefore the project is not a business-as-
usual scenario and it is additional
Prior Consideration of CDM
As per the guidance of EB Meeting Report 49 Annex 22 the project proponent notified the UNFCCC and
the DNA of the intent to implement the project as a CDM project activity
Conclusion
The conclusion of the investment analysis remains identical to reasonable variations of the critical
assumptions (sensitivity analysis) Therefore the project activity IRR remains lower than the benchmark
In the above background it is proved that the project faces an investment barrier that establishes the
additionality
B4 Description of the sources and gases included in the project boundary and proof that the
small-scale CPA is located within the geographical boundary of the registered PoA
The emission sources and type of GHG which are included or excluded within the project boundary are
shown in the following table
Table B4 Emission Sources and Type of GHG
Source Gas Included Justification Explanation
Ba
seli
ne
Direct emissions
from the
wastewater
treatment processes
CO2 No Neutral CO2 emissions from biomass decaying
CH4 Yes Methane emissions from open lagoons treatment
process
N2O No Not significant Excluded for simplification and
conservativeness
Diesel usage in
diesel genset at mill
CO2 Yes CO2 emissions from combustion of diesel fuel
CH4 No Not significant Excluded for simplification and
conservativeness
N2O No Not significant Excluded for simplification and
conservativeness
Pro
ject
Act
ivit
y
Bio-digester
CO2 No Neutral CO2 emissions from biomass decaying
CH4 Yes Methane emissions from anaerobic treatment process
N2O No Not significant Excluded for simplification and
conservativeness
Existing
wastewater
treatment lagoons
CO2 No Neutral CO2 emissions from biomass decaying
CH4 Yes Methane emissions from poorly managed treatment
process (without aerators)
PROJECT DESIGN DOCUMENT FORM (CDM-SSC-PDD) - Version 03
CDM ndash Executive Board
18
(Facultative amp
algae system) N2O No
Not significant Excluded for simplification and
conservativeness
Gas engine(s)
(biogas
combustion)
CO2 No Neutral CO2 emissions from biogas combustion
CH4 No Not significant and excluded from calculation
Biogas combustion efficiency is considered 10019
N2O No Not significant Excluded for simplification and
conservativeness
Biomass Boiler(s)
(Biogas
combustion)
CO2 No Neutral CO2 emissions from biogas combustion
CH4 No Not significant and excluded from calculation
Biogas combustion efficiency is considered 10020
N2O No Not significant Excluded for simplification and
conservativeness
Grid electricity
consumption from
national grid
CO2 Yes CO2 emissions from grid energy
CH4 No Not significant Excluded for simplification and
conservativeness
N2O No Not significant Excluded for simplification and
conservativeness
Enclosed or Open
flaring system
CO2 No Neutral CO2 emissions from biogas combustion
CH4 Yes CH4 emissions due to incomplete combustion in
enclosed flare
N2O No Not significant Excluded for simplification and
conservativeness
The CPA is implemented at the address below
Kilang Sawit Felda Triang Triang Pahang Malaysia
The site is located at state of Pahang Malaysia with GPS coordinates 3 16152 N 102 34567 E or
32692 1025761 (refer also Section A412) and thus is located within the geographical boundary of the
PoA
B5 Emission reductions
B51 Data and parameters that are available at validation
Data Parameter GWPCH4
Data unit tCO2tCH4
Description Global Warming Potential the equivalent in CO2 of the effect of methane
gas to the atmosphere
Source of data used IPCC 2006
Value applied 21
Justification of the choice of
data or description of
measurement methods and
procedures actually applied
Global warming potential for methane gas since this is a methane
capture project
19 AMS-IIIH para 35 20 AMS-IIIH para 35
PROJECT DESIGN DOCUMENT FORM (CDM-SSC-PDD) - Version 03
CDM ndash Executive Board
19
Any comment
Data Parameter MCFwwtreatmentBL1
Data unit Fraction
Description Methane correction factor for baseline wastewater anaerobic treatment
systems
Source of data used Table IIIH1 AMS IIIH version 16
Value applied 08
Justification of the choice of
data or description of
measurement methods and
procedures actually applied
Table IIIH1 for baseline emission The lagoons depth are more than 2m
MCF value of 08 for anaerobic deep lagoon (depth gt 2 m)
Any comment
Data Parameter MCFwwtreatmentBL2
Data unit Fraction
Description Methane correction factor for baseline wastewater aerobic treatment
systems
Source of data used Methane correction factor for baseline aerobic wastewater treatment
system (poorly managed)
Value applied Table IIIH1 AMS IIIH version 16
Justification of the choice of
data or description of
measurement methods and
procedures actually applied
03
Any comment No aerators installed
Data Parameter MCFwwBLdischarge
Data unit Fraction
Description Methane correction factor based on discharge pathway in the baseline
situation
Source of data used Table IIIH1 AMS IIIH version 16
Value applied 01
Justification of the choice of
data or description of
measurement methods and
procedures actually applied
Table IIIH1 for baseline emission The final discharge of treated
effluent into river MCF value of 01 for river discharge
Any comment
Data Parameter Bo ww
Data unit kgCH4 kgCOD
Description Methane generation capacity of treated wastewater
Source of data used IPCC 2006
Value applied 025
Justification of the choice of
data or description of
measurement methods and
procedures actually applied
Default value as prescribed in the methodology
Any comment
PROJECT DESIGN DOCUMENT FORM (CDM-SSC-PDD) - Version 03
CDM ndash Executive Board
20
Data Parameter UFBL
Data unit -
Description Model correction factor to account for model uncertainties (baseline)
Source of data used AMS IIIH version 16
Value applied 089
Justification of the choice of
data or description of
measurement methods and
procedures actually applied
As per methodology AMS-IIIH point 24
Any comment -
Data Parameter UFPJ
Data unit -
Description Model correction factor to account for model uncertainties (project
activity)
Source of data used AMS IIIH version 16
Value applied 112
Justification of the choice of
data or description of
measurement methods and
procedures actually applied
As per methodology AMS-IIIH point 30(a)
Any comment -
Data Parameter CFEww
Data unit Fraction
Description Capture efficiency of the biogas recovery equipment in the wastewater
treatment system
Source of data used AMS IIIH version 16
Value applied 09
Justification of the choice of
data or description of
measurement methods and
procedures actually applied
A default value of 09 has been used as per the guidance in the
methodology
Any comment
Data Parameter MCF ww treatmentPJ1
Data unit Fraction
Description Methane correction factor for the project wastewater anaerobic treatment
system equipped with biogas recovery equipment
Source of data used Table IIIH1 AMS IIIH version 16
Value applied 08
Justification of the choice of
data or description of
measurement methods and
procedures actually applied
The lagoons depth are more than 2 m MCF values in table IIIH1 has
been used as per the guidance in the methodology (depth gt 2 m)
Any comment
Data Parameter MCF ww treatmentPJ2
PROJECT DESIGN DOCUMENT FORM (CDM-SSC-PDD) - Version 03
CDM ndash Executive Board
21
Data unit Fraction
Description Methane correction factor for the project wastewater aerobic treatment
system not equipped with biogas recovery equipment
Source of data used Table IIIH1 AMS IIIH version 16
Value applied 03
Justification of the choice of
data or description of
measurement methods and
procedures actually applied
Aerobic treatment poorly managed
Any comment
Data Parameter MCFwwPJdischarge
Data unit Fraction
Description Methane correction factor based on discharge pathway in the project
activity
Source of data used Table IIIH1 AMS IIIH version 16
Value applied 01
Justification of the choice of
data or description of
measurement methods and
procedures actually applied
Table IIIH1 for project emission The final discharge of treated effluent
into river MCF value of 01 for river discharge
Any comment Same discharge pathway as in the baseline
Data Parameter CODBL1
Data unit
Description COD removal efficiency of the baseline system (anaerobic treatment
system)
Source of data used 10 days measurement campaign
Value applied Anaerobic Treatment system 8880
Justification of the choice of
data or description of
measurement methods and
procedures actually applied
One year historical data not available
Any comment This data will be used for ex post emission reduction calculation
Data Parameter CODBL2
Data unit
Description COD removal efficiency of the baseline system (aerobic treatment
system)
Source of data used 10 days measurement campaign
Value applied Aerobic Treatment system 6369
Justification of the choice of
data or description of
measurement methods and
procedures actually applied
One year historical data not available
Any comment This data will be used for ex post emission reduction calculation
Data Parameter NCVCH4
Data unit MJkg
PROJECT DESIGN DOCUMENT FORM (CDM-SSC-PDD) - Version 03
CDM ndash Executive Board
22
Description Net Calorific Value of methane
Source of data used IPCC 2006 Default Value
Value applied 504
Justification of the choice of
data or description of
measurement methods and
procedures actually applied
IPCC 2006 value is used Volume 2 Chapter 1 Table 12
Any comment
Data Parameter NCVFF
Data unit MJkg
Description Net Calorific Value of diesel
Source of data used IPCC 2006 Default Value
Value applied 430
Justification of the choice of
data or description of
measurement methods and
procedures actually applied
IPCC 2006 value is used Volume 2 Chapter 1 Table 12
Any comment
Data Parameter EFCO2diesel
Data unit tCO2MWh
Description CO2 emission factor diesel genset
Source of data used AMS-IA version 14 point 14
Value applied 08
Justification of the choice of
data or description of
measurement methods and
procedures actually applied
Default value for diesel generation unit
Any comment
Data Parameter Grid Emission Factor
Data unit kgCO2ekWh
Description Emission factor for grid electricity in Peninsular Malaysia
Source of data used Pusat Tenaga Malaysia March 2010
Value applied 0672
Justification of the choice of
data or description of
measurement methods and
procedures actually applied
As per AMS-ID point 12
Any comment Study on Grid Connected Electricity Baselines in Malaysia 2008
B52 Ex-ante calculation of emission reductions
The ex ante emission reductions are calculated based on AMS-IIIH version 16 as per equations
explained in section E62 of PoA-DD Biogas PoA in Malaysia
PROJECT DESIGN DOCUMENT FORM (CDM-SSC-PDD) - Version 03
CDM ndash Executive Board
23
Calculation for AMS-IIIH
Baseline emissions
Source of baseline emissions Reference Applicable
(YN)
Comments
Wastewater and sludge treatment
systems equipped with a biogas
recovery facility shall be excluded
from the baseline
AMS-IIIH
Point 17
N No biogas recovery in the
baseline
Emissions on account of electricity or
fossil fuel used (BEpowery)
AMS-IIIH
Point 18 (i)
N For conservativeness no
emissions due to electricity or
fossil fuel will be claimed
BEpowery = 0
Methane emissions from baseline
wastewater treatment systems
(BEwwtreatmenty)
AMS-IIIH
Point 18 (ii)
Y Baseline includes anaerobic and
aerobic treatment conditions with
different MCF values selected as
per Table IIIH1
Methane emissions from baseline
sludge treatment systems (BEstreatmenty)
= 0
AMS-IIIH
Point 18 (iii)
N The baseline plant corresponds to
scenario Para 1(f) without sludge
treatment BEstreatmenty = 0
Methane emissions on account of
inefficiencies in the baseline
wastewater treatment systems and
presence of degradable organic carbon
in the treated wastewater discharged
into river (BEwwdischargey)
AMS-IIIH
Point 18 (iv)
Y Treated effluent is currently
discharged into the river
Methane emissions from the decay of
the final sludge generated by the
baseline treatment systems (BEsfinaly)
AMS-IIIH
Point 18 (v)
N Zero because in the baseline final
sludge used for soil application
BEsfinaly = 0
A) Calculation of baseline emissions
BEy = BEwwtreatmenty + BEwwdischargey
Abbreviation Description Value Source
BEy Baseline emissions in year y (tCO2e) 30762 Calculated
BEpowery Baseline emissions of diesel genset in year
y tCO2eyear 0 Calculated
BEwwtreatmenty Baseline emissions of the wastewater
treatment systems tCO2eyear 30663 Equation 2
BEwwdischargey
The methane emissions from degradable
organic carbon in treated wastewater
discharged tCO2eyear
100 Equation 6
A1) Baseline emissions
PROJECT DESIGN DOCUMENT FORM (CDM-SSC-PDD) - Version 03
CDM ndash Executive Board
24
Equation 2 BEwwtreatmenty = Qwwy (CODinflow1 y CODBL1 MCFwwtreatmentBL1) +
(CODinflow2y CODBL2 MCFwwtreatmentBL2) Boww UFBL GWPCH4
Abbreviation Description Value Source
BEwwtreatmenty Baseline emissions of the wastewater
treatment systems (tCO2eyear) 30663 Calculated
Qwwy Volume of wastewater treated in baseline
wastewater treatment system i in year y
(m3year)
333293
Volume based on 10 m3mt
FFB21 amp FFB historical data
(2009 ndash 2011)
CODinflow1y Chemical oxygen demand of the
wastewater inflow to the baseline treatment
system (anaerobic) in year y (tCOD m3)
0026905 10 days measurement
campaign
CODBL1 COD removal efficiency of the baseline
treatment system (anaerobic) () 8880
10 days measurement
campaign
CODinflow2y Chemical oxygen demand of the
wastewater inflow to the baseline treatment
system (aerobic) in year y (tCOD m3)
0003013 10 days measurement
campaign
CODBL2 COD removal efficiency of the baseline
treatment system (aerobic) () 6369
10 days measurement
campaign
MCFwwtreatmentBL 1 Methane correction factor for baseline
wastewater anaerobic treatment systems 08
MCF values as per table
IIIH1 anaerobic gt 2m
MCFwwtreatmentBL2 Methane correction factor for baseline
wastewater aerobic treatment systems 03
MCF values as per table
IIIH1 ndash poorly managed
Boww Methane producing capacity of the
wastewater (kg CH4kg COD) 025
IPCC 2006
UFBL Model correction factor to account for
model uncertainties 089
IPCC 2006
GWPCH4 Global Warming Potential for methane 21 IPCC 2006
A2) The methane emissions from degradable organic carbon in treated wastewater discharged
Equation 6 BEwwdischargey = Qwwy GWPCH4 Boww UFBL CODwwdischarge BLyMCFww BLdischarge
Abbreviation Description Value Source
BEwwdischargey
The methane emissions from degradable
organic carbon in treated wastewater
discharged (tCO2eyear)
100 Calculated
Qwwy Volume of treated wastewater discharged
in year y (m3year) 333293
Volume based on 10 m3mt
FFB22 amp FFB historical data
(2009 ndash 2011)
GWPCH4 Global warming potential of methane 21 IPCC 2006
Boww Methane producing capacity of the treated
wastewater (kgCH4 kgCOD) 025 IPCC 2006
21 Mill designed data for baseline effluent treatment plant 22 Mill designed data for baseline effluent treatment plant
PROJECT DESIGN DOCUMENT FORM (CDM-SSC-PDD) - Version 03
CDM ndash Executive Board
25
UFBL Model correction factor to account for
model uncertainties 089 IPCC 2006
CODwwdischarge BLy Chemical oxygen demand of the treated
wastewater discharged into sea river or
lake in the baseline situation in the year y
(tonnesm3)
0000642 10 days measurement
campaign
MCFwwBLdischarge Methane correction factor based on
discharge pathway in the baseline situation
(eg into sea river or lake) of the
wastewater (fraction)
01 MCF values as per table
IIIH1 version 16
Project activity emissions
The project activity emission sources as per the methodology and their relevance with respect to the
proposed CDM project activity are given below in a tabular format
Source of project activity
emission Reference
Applicable
(YN) Comments
CO2 emissions on account of
power and fossil fuel used by
the project activity facilities
(PEpowery)
AMS-IIIH
point 29(i)
Y The project activity uses the electricity
imported from the national grid
Methane emissions from
wastewater treatment systems
affected by the project
activity and not equipped with
biogas recovery in the project
situation (PEwwtreatmenty)
AMS-IIIH
point 29 (ii)
Y CH4 emissions from the poorly managed
aerobic lagoons
Methane emissions from
sludge treatment systems
affected by the project
activity and not equipped with
biogas recovery in the project
situation (PEstreatmenty)
AMS-IIIH
point 29 (iii)
N The project activity corresponds to
scenario (vi) without sludge treatment
PEystreatmenty = 0
Methane emissions on account
of inefficiency of the project
activity wastewater treatment
systems and presence of
degradable organic carbon in
treated wastewater
(PEwwdischargey)
AMS-IIIH
point 29 (iv)
Y Treated effluent from ETP will be
discharged into river
Methane emissions from the
decay of the final sludge
generated by the project
activity treatment systems
(PEsfinaly)
AMS-IIIH
point 29 (v)
N In the proposed CDM project activity
final sludge is used for soil application in
the same manner as in the baseline
PEsfinaly = 0
PROJECT DESIGN DOCUMENT FORM (CDM-SSC-PDD) - Version 03
CDM ndash Executive Board
26
Methane fugitive emissions on
account of inefficiencies in
capture systems (PEfugitivey)
AMS-IIIH
point 29 (vi)
Y Applicable to PEfugitivewwy
N The project activity corresponds to
scenario (vi) without sludge treatment
PEfugitivesy = 0
Methane emissions due to
incomplete flaring (PEflaringy)
AMS-IIIH
point 29 (vii)
Y Enclosed flaring system installed
Methane emissions from
biomass stored under
anaerobic conditions which
does not take place in the
baseline situation (PEbiomassy)
AMS-IIIH
point 29
(viii)
N In the project activity the biomass (PKS
+ mesocarp fibres) displaced will not be
stored under anaerobic conditions The
conditions of onsite storage are identical
in the baseline as in the project activity
The biomass will be sold to the market
on a regular basis PEbiomassy = 0
B) Calculation of project emissions
PEy = PEpowery + PEwwtreatmenty + PEww discharge y + PEfugitive y + PEflaring y
Abbreviation Description Value Source
PEy Project activity emissions in the year y
(tCO2eyr) 6050 Equation 8
PEpowery CO2 emissions on account of power used
by the project activity facilities (tCO2eyr) 604 -
PEwwtreatmenty Methane emissions from wastewater
treatment systems affected by the project
activity and not equipped with biogas
recovery in year y (tCO2eyr)
1523 Equation 9
PEwwdischargey
Methane emissions on account of
inefficiency of the project activity
wastewater treatment systems and presence
of degradable organic carbon in treated
wastewater (tCO2eyr)
126 Equation 12
PEfugitivey Methane fugitive emissions on account of
inefficiencies in capture systems (tCO2eyr) 3796 Equation 15
PEflaringy Methane emissions due to incomplete
flaring (tCO2eyr) 0 Equation 19
B1) Project emissions from CO2 emissions on account of power and fuel used by the project activity
facilities in year ldquoyrdquo in tCO2eyear
PEpowery = ECPJjy EFgridy
Abbreviation Description Value Source
PEpowery Project emissions from electricity
consumption in the year y (tCO2eyr) 604 Calculated
ECPJjy Internal power consumption from the grid 749 100 kW is the effective
PROJECT DESIGN DOCUMENT FORM (CDM-SSC-PDD) - Version 03
CDM ndash Executive Board
27
(MWh year) power based on the
equipments installed at the
site
EFgridy Grid Emission factor in Peninsular
Malaysia 2008 (tCO2 MWh) 0672
Study on Grid Connected
Electricity Baselines in
Malaysia 2008 published in
2010 by PTM
B2) Methane emissions from wastewater treatment systems affected by the project activity and not
equipped with biogas recovery in the project situation in year ldquoyrdquo in tCO2e
Equation 9 PEwwtreatment y = Qwwky CODinflowk y PJky MCFwwtreatmentPJk) Boww UFPJ GWPCH4
Abbreviation Description Value Source
PEwwtreatmenty
Methane emissions from wastewater
treatment systems affected by the project
activity and not equipped with biogas
recovery in the project situation (tCO2eyr)
1523 Calculated
Qwwky Volume of wastewater treated in project
activity wastewater treatment system k in
year y (m3year)
333293
Volume based on 10 m3mt
FFB23 amp FFB historical data
(2009 ndash 2011)
CODinflowky Chemical oxygen demand of the
wastewater inflow to the project activity
treatment system k in year y (tonnes COD
m3)
0002690 10 days measurement
campaign
PJky Chemical oxygen demand removal
efficiency of the project wastewater
treatment system k in year y (tm3)
measured based on inflow COD and
outflow COD in system k
90 Based on bio-digester COD
removal efficiency of 90
MCFwwtreatmentPJk Methane correction factor for project
wastewater treatment system k (MCF
values as per table IIIH1)
03
MCF values table IIIH1
Version 16 ndash aerobic poorly
managed (conservative)
Boww Methane generation capacity of the treated
wastewater (kg CH4kg COD) 025 IPCC 2006
UFPJ Model correction factor to account for
model uncertainties 112
IPCC 2006
GWPCH4 Global warming potential of methane 21 IPCC 2006
23 Mill designed data for baseline effluent treatment plant
PROJECT DESIGN DOCUMENT FORM (CDM-SSC-PDD) - Version 03
CDM ndash Executive Board
28
B3) Methane emissions on account of inefficiency of the project activity wastewater treatment
systems and presence of degradable organic carbon in treated wastewater in the year ldquoyrdquo (tonnes)
Equation 12 PEwwdischarge y = Qwwy GWPCH4 Boww UFPJ CODwwdischargePJy MCFwwPJdischarge
Abbreviation Description Value Source
PEwwdischargey
Methane emissions from degradable
organic carbon in treated wastewater
(tCO2eyr)
126 Calculated
Qwwy Quantity of wastewater treated in year y
(m3year) 333293
Volume based on 10 m3mt
FFB24 amp FFB historical data
(2009 ndash 2011)
CODwwdischargedPJ
y
Chemical oxygen demand of the treated
wastewater discharged into river in the
project situation in year y (tCOD m3)
0000642 10 days measurement
campaign
MCFwwPJ discharge
Methane correction factor based on
discharge pathway in the project situation
(river) of the wastewater (fraction)
01 MCF values as per table
IIIH1 Version 16
Boww Methane generation capacity of the treated
wastewater (kg CH4kg COD) 025 IPCC 2006
UFPJ Model correction factor to account for
model uncertainties 112 IPCC 2006
GWPCH4 Global warming potential of methane 21 IPCC 2006
B41) Methane fugitive emissions on account of inefficiencies in capture systems in the year ldquoyrdquo
(tonnes)
Equation 15 PEfugitivewwy = (1 ndash CFEww ) MEPywwtreatment GWPCH4
Abbreviation Description Value Source
PEfugitivey Methane fugitive emissions on account of
inefficiencies in capture systems (tCO2eyr) 3796 Calculated
CFEww Capture efficiency of the biogas recovery
equipment in the wastewater treatment
systems
09 AMS IIIH Version 16
MEPywwtreatment Methane emission potential of wastewater
treatment systems equipped with biogas
recovery system in year y (tCH4yr)
1808 Refer Equation 11 of AMS
IIIH version 16
GWPCH4 Global warming potential of methane 21 IPCC 2006
B42) Methane emission potential of wastewater treatment plant in the year ldquoyrdquo (tonnes)
Equation 16 MEPwwtreatmenty = Qwwy Boww UFPJ (CODremovedPJky MCFwwtreatmentPJk)
24 Mill designed data for baseline effluent treatment plant
PROJECT DESIGN DOCUMENT FORM (CDM-SSC-PDD) - Version 03
CDM ndash Executive Board
29
Abbreviation Description Value Source
MEPwwtreatmenty Methane emission potential of wastewater
treatment systems equipped with biogas
recovery system in year y (tonnes CH4yr)
1808 Calculated
Qyww Quantity of wastewater treated in year y
(m3year) 333293
Volume based on 10 m3mt
FFB25 amp FFB historical data
(2009 ndash 2011)
Boww Methane generation capacity of the treated
wastewater (kg CH4kg COD) 025 IPCC 2006
CODremovedPJy
The chemical oxygen demand removed by
the treatment anaerobic system of the
project activity equipped with biogas
recovery in the year y (tCOD m3)
0024214
10 days measurement
campaign amp bio-digester
design parameter
MCFwwtreatmentPJ
Methane correction factor for the project
wastewater treatment system k equipped
with biogas recovery equipment
08 MCF values as per table
IIIH1 Version 16
UFPJ Model correction factor to account for
model uncertainties 112 IPCC 2006
B5) Methane emissions due to incomplete flaring in the year ldquoyrdquo (tonnes)
Equation 13a PEflaringy = TMflaredy (1 - ηflarey) GWPCH4
Abbreviation Description Value Source
PEflaringy Methane emissions due to incomplete
flaring (tCO2eyr) 0 Calculated
TMflaredh Mass flow rate of methane flared in dry
basis in the hour h (tCH4 yr) 0 Calculated
ηflarey Flare efficiency in hour h based on default
values 50
Tools for methane flaring
(open flare) for conservative
GWPCH4 Global warming potential of methane 21 IPCC 2006
Leakage emissions
No leakage emission will occur in the project activity
LEy1 = 0
Emission reductions
Equation 22 ERy ex ante = BEy ex ante ndash (PEy ex ante + LEy ex ante)
25 Mill designed data for baseline effluent treatment plant
PROJECT DESIGN DOCUMENT FORM (CDM-SSC-PDD) - Version 03
CDM ndash Executive Board
30
Abbreviation Description Value Source
ERy1 ex ante Ex ante emission reduction in year y
(tCO2e) 24712 Equation 22
BEy1 ex ante Ex ante baseline emissions in year y
(tCO2e) 30762 Equation 1
PEy1 ex ante Ex ante project emissions in year y (tCO2e) 6050 Equation 8
LEy1 ex ante Ex ante Leakage emissions in year y
(tCO2e) 0 -
Calculation for AMS-ID
Baseline emissions
Electricity generated from biogas engines will be exported to the Peninsular Malaysia National Grid The
baseline emissions are described in AMS-ID (Version 17 EB 61) as the ldquoproduct of electrical energy
baseline expressed in kWh of electricity produced by the renewable energy generating unit multiplied by
an emission factorrdquo
Baseline emissions due to electricity exported to the grid in the year ldquoyrdquo (tonnes)
BEEGy = EGBLy EFCO2gridy
Abbreviation Description Value Source
BEEGy Baseline emissions in year y (tCO2eyr) 4568 Calculated
EGBLy
Quantity of net electricity supplied to the
grid as a result of the implementation of the
project activity in year y (kWh yr)
6797625 Calculated
EFCO2gridy
CO2 emission factor of the grid in year
(tCO2kWh) 0672
Study on Grid Connected
Electricity Baselines in
Malaysia 2008 published in
2010 by PTM
Project Activity Emissions
As per AMS-ID (Version 17 EB 61) project emissions for renewable energy project activities are zero
PEEGy = 0
Leakage
If the energy generating equipment is transferred from another activity leakage is to be considered
No leakage emission will occur in the project activity LEy = 0
PROJECT DESIGN DOCUMENT FORM (CDM-SSC-PDD) - Version 03
CDM ndash Executive Board
31
Emission reductions
ERy = BEy ndash PEy - LEy
Abbreviation Description Value Source
ERy Emission reduction in year y (tCO2ey) 4568 -
BEy Baseline emissions in year y (tCO2ey) 4568 -
PEy Project emissions in year y (tCO2ey) 0 -
LEy Leakage emissions in year y (tCO2ey) 0 -
Calculation for AMS-IA
Baseline emissions
The energy baseline is the fuel consumption of the technology in use or that would have been used in the
absence of the project activity to generate the equivalent quantity of energy Option 2 is applied This
methodology is only apply shall the recovered is in excess after export to the grid
Annual electricity sent to the mill for FF displacement in the year ldquoyrdquo (kWh)
EBLy = ΣEGiy (1 ndash l)
Abbreviation Description Value Source
EBLy Annual energy baseline (kWhyr) Calculated
EGiy
The estimated annual output of the
renewable energy technologies of the group
of i renewable energy technologies
installed (kWhyr)
0 Estimated
l
Average technical distribution losses that
would have been observed in diesel
powered mini-grids installed by public
programmes or distribution companies in
isolated areas expressed as a fraction
0 Conservative by applying
Zero (0)
Baseline electricity sent to the mill for FF displacement in the year ldquoyrdquo (tonnes)
BECO2y = EBLy EFCO2
Abbreviation Description Value Source
BECO2y Baseline emission in the year y (tCO2yr) 0 Calculated
EBLy Annual energy baseline (kWhyr) 0 Calculated
EFCO2 CO2 emission factor (tCO2kWh) 08
Default value which is
derived from diesel
generation units is used
PROJECT DESIGN DOCUMENT FORM (CDM-SSC-PDD) - Version 03
CDM ndash Executive Board
32
Project Activity Emissions
As per AMS-IA (Version 14 EB 54) project emissions for renewable energy project activities are zero
PEy = 0
Leakage
If the energy generating equipment is transferred from another activity or if the existing equipment is
transferred to another activity leakage is to be considered
No leakage emission will occur in the project activity LEy = 0
B53 Summary of the ex-ante estimation of emission reductions
Estimated emission reductions (total project activity)
Year
Estimation of
project activity
emissions (tCO2e)
Estimation of
baseline emissions
(tCO2e)
Estimation of
leakage (tCO2e)
Estimation of
overall emission
reductions (tCO2e)
2012 504 2944 0 2440
2013 6050 35330 0 29280
2014 6050 35330 0 29280
2015 6050 35330 0 29280
2016 6050 35330 0 29280
2017 6050 35330 0 29280
2018 6050 35330 0 29280
2019 5546 32386 0 26840
Total (tCO2) 42350 247310 0 204960
The starting date of the crediting period is 01122012 or the date of registration whichever is later
Estimated emission reductions for AMS-IIIH
Year
Estimation of
project activity
emissions (tCO2e)
Estimation of
baseline emissions
(tCO2e)
Estimation of
leakage (tCO2e)
Estimation of
overall emission
reductions (tCO2e)
2012 504 2563 0 2059
2013 6050 30762 0 24712
PROJECT DESIGN DOCUMENT FORM (CDM-SSC-PDD) - Version 03
CDM ndash Executive Board
33
2014 6050 30762 0 24712
2015 6050 30762 0 24712
2016 6050 30762 0 24712
2017 6050 30762 0 24712
2018 6050 30762 0 24712
2019 5546 28199 0 22653
Total (tCO2) 42350 215334 0 172984
The starting date of the crediting period is 01122012 or the date of registration whichever is later
Estimated emission reductions for AMS-ID
Year
Estimation of
project activity
emissions (tCO2e)
Estimation of
baseline emissions
(tCO2e)
Estimation of
leakage (tCO2e)
Estimation of
overall emission
reductions (tCO2e)
2012 0 381 0 381
2013 0 4568 0 4568
2014 0 4568 0 4568
2015 0 4568 0 4568
2016 0 4568 0 4568
2017 0 4568 0 4568
2018 0 4568 0 4568
2019 0 4187 0 4187
Total (tCO2) 0 31976 0 31976
The starting date of the crediting period is 01122012 or the date of registration whichever is later
Estimated emission reductions for AMS-IA
Year
Estimation of
project activity
emissions (tCO2e)
Estimation of
baseline emissions
(tCO2e)
Estimation of
leakage (tCO2e)
Estimation of
overall emission
reductions (tCO2e)
2012 0 0 0 0
2013 0 0 0 0
2014 0 0 0 0
2015 0 0 0 0
2016 0 0 0 0
PROJECT DESIGN DOCUMENT FORM (CDM-SSC-PDD) - Version 03
CDM ndash Executive Board
34
2017 0 0 0 0
2018 0 0 0 0
2019 0 0 0 0
Total (tCO2) 0 0 0 0
The starting date of the crediting period is 01122012 or the date of registration whichever is later
B6 Application of the monitoring methodology and description of the monitoring plan
B61 Description of the monitoring plan
The parameters to be monitored are
Please note that the amount of methane recovered and fuelled or flared (MDy ) is calculated as follows
MDy = TMfuelledy + TMflaredy Equation A
Where Description Units
MDy Quantity of methane recovered and fuelled or flared in the year y tonnes CH4year
TMfuelledy Quantity of methane fuelled in the year y tonnes CH4year
TMflaredy Quantity of methane flared in year y tonnes CH4year
Where
TMfuelledy = FVfuelledh fvCH4h ηfuelledh ρCH4n) 1000 Equation B
Where Description Units
TMfuelledy Quantity of methane fuelled in the year y tonnes CH4year
FVfuelledh Volumetric flow rate of the fuelled biogas gas at normal conditions in
hour h
Nm3 biogashour
ηfuelledh 100 for gainful purpose26
fvCH4h Volumetric fraction of methane in the biogas gas in the hour h
ρCH4n Density of methane at normal conditions kgCH4Nm3CH4
And
TMflaredy = FVflaredh fvCH4h ηflareh ρCH4n) 1000 Equation C
Where Description Units
TMflaredy Quantity of methane flared in year y tonnes CH4year
FVflaredh Volumetric flow rate of the flared biogas gas at normal conditions in
hour h
Nm3 biogashour
26 AMS-IIIH point 35
PROJECT DESIGN DOCUMENT FORM (CDM-SSC-PDD) - Version 03
CDM ndash Executive Board
35
ηflareh Flare efficiency in the hour h
fvCH4h Volumetric fraction of methane in the biogas gas in the hour h
ρCH4n Density of methane at normal conditions kgCH4Nm3CH4
Data Parameter ID1 Qwwy
Data unit m3 month
Description The flow of wastewater entering the bio-digester
Source of data Measurement by project participant by using a flowmeter
Value of data ~ 28000
Brief description of
measurement methods and
procedures to be applied
The flow is measured with an online flow meter or equivalent
QAQC procedures to be
applied (if any) Data are monitored continuously and recorded periodically
(monthly or at shorter interval) in a data log file (DLF)
Uncertainty level of data low
Maintenance and calibration as per manufacturer‟s specifications
or at least once every three (3) years
Any comment
Data Parameter ID2 CODwwuntreatedy
Data unit tCOD m3
Description Raw COD of wastewater entering the bio-digester
Source of data Laboratory (internal and external)
Value of data ~ 0030230
Brief description of
measurement methods and
procedures to be applied
Measure of COD according to national or international standards
COD is measure through representative sampling
QAQC procedures to be
applied (if any) Minimum once a month COD sampling to ensure a 9010
confidenceprecision level
COD reports are recorded manually
Uncertainty level of data low
Maintenance and calibration as per manufacturer‟s specifications
or at least once every three (3) years for internal laboratory
equipment
Any comment
Data Parameter ID3 CODwwtreatedy
Data unit tCOD m3
Description COD of treated wastewater leaving the bio-digester
Source of data Laboratory (internal and external)
Value of data ~ 0003023
Brief description of
measurement methods and
procedures to be applied
Measure of COD according to national or international standards
COD is measure through representative sampling
QAQC procedures to be
applied (if any) Minimum once a month COD sampling to ensure a 9010
confidenceprecision level
COD reports are recorded manually
Uncertainty level of data low
PROJECT DESIGN DOCUMENT FORM (CDM-SSC-PDD) - Version 03
CDM ndash Executive Board
36
Maintenance and calibration as per manufacturer‟s specifications
or at least once every three (3) years for internal laboratory
equipment
Any comment
Data Parameter ID5 End-use of the final sludge
Data unit ndash
Description The final sludge generated by the project activity will be sent to control
landfill site if any
Source of data By project participant
Value of data ndash
Brief description of
measurement methods and
procedures to be applied
The final disposal of the sludge will be monitored during the crediting
period if any For each disposal of the sludge the following will be
recorded disposal site and date of disposal
QAQC procedures to be
applied (if any)
Any comment
Data Parameter ID6 FVflaredh
Data unit Nm3 hour
Description Volumetric flow of biogas recovered and flared at normal conditions in
the hour h
Source of data By project participant
Value of data 0
Brief description of
measurement methods and
procedures to be applied
The volume of biogas will be measured with a normalised flow meter or
calculated from the volumetric flow pressure temperature
Biogas volume and methane content measurements shall be on the same
basis (wet or dry)
QAQC procedures to be
applied (if any) The biogas flow is monitored continuously recorded and stored
electronically in a data log file (DLF) (monthly or at shorter
interval)
Data Parameter ID4 CODww dischargey
Data unit tCOD m3
Description COD of treated wastewater discharge into river by treatment system
Source of data Laboratory (internal and external)
Value of data ~ 0000100
Brief description of
measurement methods and
procedures to be applied
Measure of COD according to national or international standards
COD is measure through representative sampling
QAQC procedures to be
applied (if any) Minimum once a month COD sampling to ensure a 9010
confidenceprecision level
COD reports are recorded manually
Uncertainty level of data low
Maintenance and calibration as per manufacturer‟s specifications
or at least once every three (3) years for internal laboratory
equipment
Any comment
PROJECT DESIGN DOCUMENT FORM (CDM-SSC-PDD) - Version 03
CDM ndash Executive Board
37
Uncertainty level of data low
Maintenance and calibration as per manufacturer‟s specifications
or at least once every 3 years
Any comment
Data Parameter ID7 FVfuelledgas engineh
Data unit Nm3 hour
Description Volumetric flow of biogas recovered and fuelled (gas engine) at normal
conditions in the hour h
Source of data By project participant
Value of data ~ 509
Brief description of
measurement methods and
procedures to be applied
The volume of biogas will be measured with a normalised flow meter or
calculated from the volumetric flow of biogas pressure temperature
Biogas volume and methane content measurements shall be on the same
basis (wet or dry)
QAQC procedures to be
applied (if any) The biogas flow is monitored continuously recorded and stored
electronically in a data log file (DLF) (monthly or at shorter
interval)
Uncertainty level of data low
Maintenance and calibration as per manufacturer‟s specifications
or at least once every 3 years
Any comment
Data Parameter ID8 FVfuelledboilerh
Data unit Nm3 hour
Description Volumetric flow of biogas recovered and fuelled (boilers) at normal
conditions in the hour h
Source of data By project participant
Value of data ~ 0
Brief description of
measurement methods and
procedures to be applied
The volume of biogas will be measured with a normalised flow meter or
calculated from the volumetric flow of biogas pressure temperature
Biogas volume and methane content measurements shall be on the same
basis (wet or dry)
QAQC procedures to be
applied (if any) The biogas flow is monitored continuously recorded and stored
electronically in a data log file (DLF) (monthly or at shorter
interval)
Uncertainty level of data low
Maintenance and calibration as per manufacturer‟s specifications
or at least once every 3 years
Any comment
Data Parameter ID9 wCH4h
Data unit
Description Methane content in biogas in same basis (wetdry) as the biogas flows in
year y
Source of data By project participant using a gas analyzer
Value of data ~ 60
PROJECT DESIGN DOCUMENT FORM (CDM-SSC-PDD) - Version 03
CDM ndash Executive Board
38
Brief description of
measurement methods and
procedures to be applied
Using calibrated gas analyzer either continuous or periodical
measurement at confidenceprecision level of 9010
QAQC procedures to be
applied (if any) In case a continuous gas analyser is used data will be recorded
and stored electronically in a data log file (DLF) every hour or at
shorter interval
Uncertainty level of data low
Maintenance and calibration as per manufacturer‟s specifications
or at least once every 3 years
Any comment See also clarification by EB Meth Panel 30102009 ndash SSC_360
httpcdmunfcccintUserManagementFileStorageAM_CLAR_
QS83SX5B7WM6UGZE31JYQEQ4F65F6V
The biogas flow and the methane content measurements shall be
carried out close to each others
Data Parameter ID10 Tbiogas
Data unit ordmC
Description Temperature of biogas
Source of data Temperature probe
Value of data 20 ndash 65
Brief description of
measurement methods and
procedures to be applied
By project participant
QAQC procedures to be
applied (if any) Shall be measured and recorded at the same time when methane
content in biogas (ID8) is measured
Uncertainty level of data low
Maintenance and calibration as per manufacturer‟s specifications
or at least once every 3 years
Any comment Pressure and temperature are required to determine the density of
the methane If the biogas flow meter employed measures flow
pressure and temperature and displaysoutputs normalised flow of
biogas there is no need to separate monitoring of pressure and
temperature of the biogas
Data Parameter ID11 Pbiogas
Data unit Bar(g)
Description Pressure of biogas
Source of data By project participant
Value of data 50 ndash 200 mbar
Brief description of
measurement methods and
procedures to be applied
Pressure measurement device
QAQC procedures to be
applied (if any) Shall be measured and recorded at the same time when methane
content in biogas (ID8) is measured
Uncertainty level of data low
Maintenance and calibration as per manufacturer‟s specifications
or at least once every three (3) years
Any comment Pressure and temperature are required to determine the density of
the methane If the biogas flow meter employed measures flow
PROJECT DESIGN DOCUMENT FORM (CDM-SSC-PDD) - Version 03
CDM ndash Executive Board
39
pressure and temperature and displaysoutputs normalised flow of
biogas there is no need to separate monitoring of pressure and
temperature of the biogas
Shall be measured at the same time when methane content in
biogas (ID9) is measured
Parameter ID12 ηflareh (enclosed flare)
Unit
Description Enclosed flare efficiency in the hour h
Source of data Calculated
Value of data 0 or 50 or 90
Brief description of
measurement methods and
procedures to be applied
This yearly efficiency will be based on hourly flare efficiencies calculated
as per the provisions in the ldquoTool to determine project emissions from
flaring gases containing methanerdquo
The hourly flare efficiency will be calculated based on
0 if the temperature in the exhaust gas of the flare (Tflare) is
below 500 degC for more than 20 minutes during the hour h
50 if the temperature in the exhaust gas of the flare (Tflare) is
above 500 degC for more than 40 minutes during the hour h but the
manufacturer‟s specifications on proper operation of the flare are
not met at any point in time during the hour h
90 if the temperature in the exhaust gas of the flare (Tflare) is
above 500 degC for more than 40 minutes during the hour h and the
manufacturer‟s specifications on proper operation of the flare are
met continuously during the hour h
QAQC procedures to be
applied (if any) Data are logged hourly in a data log file (DLF)
Uncertainty level of data low
Any comment For enclosed flare
Or
Parameter ID13 ηflareh (open flare)
Unit
Description Flare efficiency in the hour h
Source of data Calculated
Value of data 0 or 50
Brief description of
measurement methods and
procedures to be applied
This yearly efficiency will be based on hourly flare efficiencies calculated
as per the provisions in the ldquoTool to determine project emissions from
flaring gases containing methanerdquo
The hourly flare efficiency will be calculated based on the duration of
time during which the flame is detected by the thermocouple (or flame
detector) installed in the open flare
Flare efficiency in hour h is based on default values
0 if the flame detected for not more than 20 minutes during the
hour h and
PROJECT DESIGN DOCUMENT FORM (CDM-SSC-PDD) - Version 03
CDM ndash Executive Board
40
50 if the flame detected for more than 20 minutes during the
hour h
A flame detector or thermocouple will be used
QAQC procedures to be
applied (if any) Data are logged hourly in a data log file (DLF)
Uncertainty level of data low
Any comment The only monitored parameter related to the flare is its efficiency Indeed
according to the clarification SSC_19927 of the methodology AMS IIIH
version 9 accepted by the SSC WG on the 3092008 ldquoIf a thermocouple
is used as a flame detection system it is sufficient to reach the given
minimum temperature from the manufacturer ldquo Hence it is not necessary
to monitor the temperature of the open type flares (Tflare)
Data Parameter ID14 ECPJjy
Data unit MWh
Description The yearly grid electricity consumption of the project activity for the year
bdquoy‟
Source of data Onsite instrument
Value of data ~749
Brief description of
measurement methods and
procedures to be applied
The grid electricity consumption of the project activity is measured
continuously with an energy meter (cumulative reading)
QAQC procedures to be
applied (if any) Data are monitored continuously and recorded periodically
(yearly or at shorter interval) in a data log file (DLF)
Uncertainty level of data low
Maintenance and calibration as per manufacturer‟s specifications
or at least once every three (3) years
Any comment
Data Parameter ID15 EGBLy
Data unit MWh
Description Quantity of net electricity generated and send to grid in year y
Source of data By project participant
Value of data ~ 6798
Brief description of
measurement methods and
procedures to be applied
The electricity generated and sent to grid is measured continuously with
an energy meter (cumulative readings)
QAQC procedures to be
applied (if any) Data are monitored continuously and recorded periodically
(yearly or at shorter interval) in a data log file (DLF)
Uncertainty level of data low
Maintenance and calibration as per manufacturer‟s specifications
or at least once every 3 years
Any comment As per AMS-ID
27 The clarification SSC_199 if available here (last access on the 24052011)
httpcdmunfcccintfilestorageAM_AM_CLAR_HIOZ5CS1PASC187C0JQ668L2E9RCRJResponse20WG20provided
20at20SSC20WG2017pdft=bU98MTMwNjIxNjY0OS4xMQ==|BOKHqtO94N6XF1N2N1vo8Ori-Rc=
PROJECT DESIGN DOCUMENT FORM (CDM-SSC-PDD) - Version 03
CDM ndash Executive Board
41
Or
Data Parameter ID16 EGmilly
Data unit MWh
Description Quantity of annual output of renewable energy sent to the mill in year y
Source of data By project participant
Value of data ~ 0
Brief description of
measurement methods and
procedures to be applied
The electricity generated and sent to mill to displace diesel use in diesel
gensets is measured continuously with an energy meter (cumulative
readings)
QAQC procedures to be
applied (if any) Data are monitored continuously and recorded periodically
(yearly or at shorter interval) in a data log file (DLF)
Uncertainty level of data low
Maintenance and calibration as per manufacturer‟s specifications
or at least once every 3 years
Any comment As per AMS-IA
Data Parameter ID17 Displacement of Biomass
Data unit Mt
Description Total amount of biomass (PKS) displaced from biomass boilers
Source of data Weighing bridge
Value of data Measurement at site
Brief description of
measurement methods and
procedures to be applied
Biomass (PKS) displaced due to the project activity will be weighed
using weighing bridge at the palm oil mill
QAQC procedures to be
applied (if any) Monthly calculation based on every single trip of trucks recorded
Data is recorded manually in a data log file based on the weighing
records
Maintenance and calibration as per manufacturer‟s specifications
Uncertainty level of data low
Any comment In the project activity the biomass (PKS) displaced will not be stored
under anaerobic conditions The conditions of onsite storage are identical
in the baseline as in the project activity The biomass will be sold to the
market on a regular basis PEbiomassy = 0
A final monitoring plan will be prepared prior the initial verification based on the as-built project activity
It will address the following aspects
MONITORING
The Project will be managed by CME with the involvement from Project Implementer CME will ensure
safety in operation of the plant as well as in the monitoring of emission reduction which is generated from
the project activity
CME will implement and be responsible for the monitoring plan Their responsibility covers operation of
the monitoring maintenance of the monitoring equipment data collection and archiving and
management of total scheme of the monitoring CME and Project Implementer will assign specific trained
PROJECT DESIGN DOCUMENT FORM (CDM-SSC-PDD) - Version 03
CDM ndash Executive Board
42
personnel during project implementation for the overall monitoring measurement and reporting of key
parameters as required in this PDD
DATA LOGGING AND STORAGE
The data measured by the instruments will be collected and stored in a data logging system The data will
be retrieved remotely by modem or directly on site
If data cannot be retrieved no emissions reductions will be claimed for the period of data failure The
data collected will be recorded in a central data base Access to production data will be restricted All
records and data (hard copy and soft copy) will be archived up to two years after the end of the crediting
period or the last issuance of CERs for this project activity whichever occurs later
CALIBRATION AND MAINTENANCE PROCEDURES MALFUNCTION OF EQUIPMENT
Maintenance includes all preventive and corrective actions necessary for the good functioning of the
equipment such as
Visual control of the equipment state and real-time check of displayed parameters
Cleaning up the equipment and the sensors
Adding lubricant
Replacement and change of defective parts
Calibration of equipment consists in verifying by comparison with a standard the accuracy of a
measuring instrument
Measuring instruments will be periodically and appropriately calibrated according to the procedures
timing and methods recommended by the manufacturer or nationalinternational standards as available
General malfunction of equipment
Daily inspections of the equipment will allow controlling equipment failure If equipment fails the
supplier will be notified and repairs will be carried out If the damaged equipment cannot be repaired it
will be replaced at the earliest In some cases portable tools will be used in order to carry out daily
monitoring of the missing parameter(s) In such case this data will be recorded manually
Discrepancies
To avoid discrepancies between projected data in the PDD and actual data (eg due to deferred starting
date malfunction of equipment) cross-checks between internal meter readings and external sources (eg
electricity invoices) will be carried out Any source of inconsistencies will be clarified
Case of emergency
For the case of emergency (earthquakes explosions fires etc) an emergency preparedness plan will be
adapted to the project activity All employees involved in the project on-site will be trained in the code of
conduct and required actions at time of commissioning of the plant
PROJECT DESIGN DOCUMENT FORM (CDM-SSC-PDD) - Version 03
CDM ndash Executive Board
43
OPERATIONAL AND MANAGEMENT STRUCTURE
The CDM monitoring team will be composed by the following staff
Position Report to
Operators
Project owner Supervisors (technicalmaintenance)
Operation Engineer
CDM monitoring project manager External CDM consultant
TRAINING OF MONITORING PERSONNEL
The maintenance will be conducted in-house by staff employed and trained by the Project Participants
Employees involved in the monitoring will be trained internally andor externally Training may include
inter alia
a) Review of equipment and captors
b) Calibration requirement
c) Configuration of monitoring equipment
d) Maintenance requirement
C1 Please indicate the level at which environmental analysis as per requirements of the CDM
modalities and procedures is undertaken Justify the choice of level at which the environmental
analysis is undertaken
radic Please tick if this information is provided at the PoA level In this case sections C2 and C3
need not be completed in this form
C2 Documentation on the analysis of the environmental impacts including transboundary
impacts
The host country does not require an analysis of environmental impacts As the project involves reduction
of GHG through recovery and controlled combustion which improves the quality of air therefore there
are no significant environmental impacts identified
C3 Please state whether an environmental impact assessment is required for a typical CPA
included in the programme of activities (PoA) in accordance with the host Party lawsregulations
In accordance with Malaysia environmental regulations Environmental Quality (Prescribed Activities
Environmental Impact Assessment) Order 1987 an Environmental Impact Assessment (EIA) is not
required for this CPA
PROJECT DESIGN DOCUMENT FORM (CDM-SSC-PDD) - Version 03
CDM ndash Executive Board
44
SECTION D Stakeholdersrsquo comments
D1 Please indicate the level at which local stakeholder comments are invited Justify the
choice
Please tick if this information is provided at the PoA level In this case sections D2 to D4 need
not be completed in this form
D2 Brief description how comments by local stakeholders have been invited and compiled
The stakeholder meeting was conducted at the office of Kilang Sawit Felda Triang on 05032012 There
were 37 stakeholders attending the consultation Posters were pasted at the guard house and at the
entrance to office 1 week before the stakeholder consultation to inform the locals stakeholders which
comprise mostly the workers of the mill 20 stakeholders out of the 37 who attended the consultation are
2nd generation of the Felda settlers who live in the vicinity to the project activity and adequately represent
the local community composed entirely of Felda settlers (no other people live in the vicinity of this
remote plantation) Continuous input of ideascomments were allowed to all stakeholders who could
either send their input though an email account especially setup for the biogas project or directly inform
the project proponents
During the meeting presentations were made by the project owner to outline the proposed project activity
in a non-technical manner (including environmental social and technological considerations) climate
change and the role of the CDM Attendees were given opportunity to raise their concern and opinion
about the proposed project activity during the question and answer session
D3 Summary of the comments received
PROJECT DESIGN DOCUMENT FORM (CDM-SSC-PDD) - Version 03
CDM ndash Executive Board
45
Below are the questions raised during the stakeholder meeting
NAME QUESTION
Mohd Tarmizi Bin Mat
Daud What is CDM in Bahasa Malaysia
Mohd Tarmizi Bin Mat
Daud What is DoE‟s standard for treated water released into river
Mohd Azizi Bin Abdul
Aziz
Would the biogas be captured from the existing effluent treatment ponds or a
new structure
Azhar Bin Abdul What to do with the captured biogas from the bioreactor
D4 Report on how due account was taken of any comments received
Below are the answers to the questions asked during the stakeholder meeting
QUESTION ANSWER
What is CDM in Bahasa Malaysia
The meaning of CDM in Bahasa Malaysia is Mekanisme
Pembangunan Bersih or in English is Clean Development
Mechanism
By Abd Karim Bin Mohd Zin
What is DoE‟s standard for treated
water released into river
The discharge standard for BOD into river is less than 100ppm
By Abd Karim Bin Mohd Zin
Would the biogas be captured from
the existing effluent treatment
ponds or a new structure
New bioreactor will be constructed to replace the existing anaerobic
lagoon treatment system The new bioreactor will capture the
biogas produced from this anaerobic treatment process
By Abd Karim Bin Mohd Zin
What to do with the captured
biogas from the bioreactor
The biogas recovered from the bioreactor will mainly contain
methane (approximately 60) and the rest are CO2 H2 and H2S
Currently the biogas is just released to the atmosphere from the
existing open lagoons system During the project activity captured
biogas will be combusted thus will improve the air quality
By Abd Karim Bin Mohd Zin
PROJECT DESIGN DOCUMENT FORM (CDM-SSC-PDD) - Version 03
CDM ndash Executive Board
46
Annex 1
CONTACT INFORMATION ON ENTITYINDIVIDUAL RESPONSIBLE FOR THE SMALL-
SCALE CPA
Organization Felda Palm Industries Sdn Bhd (359584-V)
StreetPOBox Jalan Gurney 1
Building Balai Felda 4th Floor
City Kuala Lumpur
StateRegion Wilayah Persekutuan
PostfixZIP 54000
Country Malaysia
Telephone (03) 2692 8066
FAX (03) 2693 4148
URL wwwfeldanetmy
Represented by
Title Head of Department
Salutation Mr
Last Name Busu
Middle Name
First Name Zainuri
Department Biomass
Mobile
Direct FAX
Direct tel
Personal E-Mail zainuribfeldanetmy
Organization Ably Carbon Sdn Bhd
StreetPOBox Jalan Ipoh Kecil
Building No 17
City Kuala Lumpur
StateRegion
PostfixZIP 50350
Country Malaysia
Telephone +60 3 4042 1177
FAX +60 3 4044 4166
E-Mail stephanevidailletably-carboncom
URL
Represented by Stephane Vidaillet
Title Chairman
Salutation Mr
Last Name Vidaillet
Middle Name
First Name Steacutephane
Department
Mobile +33 6 59111 5600
Direct FAX
PROJECT DESIGN DOCUMENT FORM (CDM-SSC-PDD) - Version 03
CDM ndash Executive Board
47
Direct tel
Personal E-Mail stephanevidailletably-carboncom
PROJECT DESIGN DOCUMENT FORM (CDM-SSC-PDD) - Version 03
CDM ndash Executive Board
48
Annex 2
INFORMATION REGARDING PUBLIC FUNDING
The project activity is not receiving any funding from parties included in Annex 1 of the Kyoto Protocol
SMALL-SCALE CDM PROGRAMME ACTIVITY DESIGN DOCUMENT FORM (CDM-SSC-CPA-DD) - Version 01
NAME TITLE OF THE PoA Biogas Recovery and Utilization PoA Projects in
Malaysia
CDM ndash Executive Board page 49
This template shall not be altered It shall be completed without modifyingadding headings or logo format or font
Annex 3
BASELINE INFORMATION
1 2
Year 2009 2010 2011 2012 2013 2014
FFB (mtyr) 343720 345910 310250 333293 333293 333293
POME Volume
(cumyr)[1] 343720 345910 310250 333293 333293 333293
Mill Opearing hour (hryr) 68865 69225 6209 6673 6673 6673
PKS (mtyr) 18905 19025 17064 18331 18331 18331
3 4 5 6 7 8 9 10
2015 2016 2017 2018 2019 2020 2021 2022
333293 333293 333293 333293 333293 333293 333293 333293
333293 333293 333293 333293 333293 333293 333293 333293
6673 6673 6673 6673 6673 6673 6673 6673
18331 18331 18331 18331 18331 18331 18331 18331
SMALL-SCALE CDM PROGRAMME ACTIVITY DESIGN DOCUMENT FORM (CDM-SSC-CPA-DD) - Version 01
NAME TITLE OF THE PoA Biogas Recovery and Utilization PoA Projects in
Malaysia
CDM ndash Executive Board page 50
This template shall not be altered It shall be completed without modifyingadding headings or logo format or font
10 days measurement campaign for baseline wastewater treatment system
Day Date
ETP
Inlet
Anaerobic
system (mgl)
Outlet
Anaerobic
system (mgl)
Outlet Algae
System (mgl)
Final
Discharge to
River (mgl)
1 23-Feb-12 35693 3120 811 603
2 25-Feb-12 19511 2559 1186 83
3 26-Feb-12 32864 2767 749 437
4 27-Feb-12 30195 2330 1210 404
5 28-Feb-12 32436 1927 1188 941
6 29-Feb-12 38259 4256 896 717
7 1-Mar-12 28717 3584 1232 695
8 3-Mar-12 31002 4660 1658 1210
9 4-Mar-12 22400 4346 1389 963
10 5-Mar-12 31226 4301 1971 1165
Average 30230 3385 1229 722
ETP
COD removal efficiency (anaerobic system) 8880
COD removal efficiency (Facultativealgae system) 6369
COD removal efficiency (Bio-polishing system) 4127
Total COD removal efficiency of the treatment system 9761
The COD of the raw effluent during ex-post may vary from the one year historical records depending on
the improvement of the production process (outside of project boundary) thus ERex-post may vary from the
estimated ERex-ante
SMALL-SCALE CDM PROGRAMME ACTIVITY DESIGN DOCUMENT FORM (CDM-SSC-CPA-DD) - Version 01
NAME TITLE OF THE PoA Biogas Recovery and Utilization PoA Projects in
Malaysia
CDM ndash Executive Board page 51
This template shall not be altered It shall be completed without modifyingadding headings or logo format or font
Annex 4
MONITORING INFORMATION
General information
Monitoring refers to the collection and archiving of all relevant data necessary for determining the
baseline measuring anthropogenic emissions by sources of greenhouse gases (GHG) within the project
boundary of a CDM project activity and leakage It includes developing suitable data collection methods
and data interpretation techniques for monitoring and verification of GHG emissions
On-line monitoring system
Most key meters required to determine GHG emissions and emission reductions will be monitored from a
central control point which will record meter readings at a pre-determined interval
Ensuring adequate maintenance and calibration of monitoring instruments
Specific maintenance repair or replacement of monitoring equipment will be recorded dated and
described
The calibration will occur at intervals determined on the basis of instrument manufacturers
recommendations stability purpose usage and history of repeatability Recalibration should be
performed whenever an event occurs that places the accuracy of the instrument in doubt
Calibration will take place at least once every three (3) years to ensure that the monitoring
equipments are properly installed and functioning properly
Calibration will be performed according to national or international standards
Last calibration certificates will be provided during periodic verification
Sampling procedure
Wherever a statistical sample is used for monitoring the ldquogeneral guidelines for sampling and surveys for
SSC project activitiesrdquo shall be used COD shall be measured from a composite sample to obtain a
representative value
Data archiving
The monitored data will be kept for a minimum of 2 years after the end of the crediting years by using
paper documents or electronic files
Identification of non-conformities
A verification of inconsistencies of the data recorded will be performed based for example on
The comparison of the calculated quantities of methane versus expected
Spot checks of field instruments (local reading) and data in the log file
Any discrepancies (completeness calculation errors transcription errors instrument calibration issues)
will be analyzed and actions taken to correct the problem
Ensuring adequate training of staff
All new staff members will undergo bdquoon job training‟ covering the monitoring requirements
The monitoring plan will be made available to staff member involved in the monitoring
A copy will be located in the control room at the site
SMALL-SCALE CDM PROGRAMME ACTIVITY DESIGN DOCUMENT FORM (CDM-SSC-CPA-DD) - Version 01
NAME TITLE OF THE PoA Biogas Recovery and Utilization PoA Projects in
Malaysia
CDM ndash Executive Board page 52
This template shall not be altered It shall be completed without modifyingadding headings or logo format or font
During the training the employees will sign a training attendance list All training records shall
be documented inclusive of training attendance training memo and training material if any

PROJECT DESIGN DOCUMENT FORM (CDM-SSC-PDD) - Version 03
CDM ndash Executive Board
3
- The new treatment plant is expected to improve the quality of the discharge water due to better
management
Social criterion
- By reducing the methane emission the project will contribute to the health of the population in the
area and nearby
- Besides providing job opportunities the project will also set in motion a demonstration effect leading
to other units adopting similar activity which would go to improve the job opportunity
- The increased job opportunity will reduce social disparity in the society and thereby contribute to
peace in the society
Economic criterion
- The project involves a technology transfer into host country Indeed the open anaerobic lagoons are
replaced by either bio-digester
- Training will be provided to the locals to ensure them to be able to execute and manage the project It
leads to the increase of the local skills
- Provide job opportunities especially for the local community live nearby
A3 Entityindividual responsible for the small-scale CPA
Felda Palm Industrial Sdn Bhd is the entity responsible for the Felda Triang Regional Biogas PoA ndash
CPA 1
A4 Technical description of the small-scale CPA
Technology Description
The project activity includes the following systems
a) The methane capture in newly built covered lagoon
The project activity involves the introduction of a sequential stage covered lagoon(s) to an existing
open lagoons system The biogas recovery system is designed by KPSR Construction Ltd with
experience in implementing projects at palm oil mills The project activity consists of newly
constructed covered lagoon(s) anaerobic treatment system that will be built for the treatment of
POME effluent and biogas recovery
The covered lagoon treatment system developed by KPSR Construction Ltd adopts a series of
treatment processes consisting mainly of pretreatment and anaerobic degradation Raw POME will
be channeled to the cooling pondtower intended for cooling of the effluent before being sent to the
covered anaerobic digester system The new lagoon(s) will be covered by synthetic high-density
polyethylene (HDPE) geo-membrane which is sealed by means of strip-to-strip welding and a
peripheral anchor trench dug around the perimeter of the existing lagoon HDPE is an excellent
product for large applications requiring UV ozone and chemical resistance and because of these
attributes is one of the most commonly used geo-membranes worldwide
PROJECT DESIGN DOCUMENT FORM (CDM-SSC-PDD) - Version 03
CDM ndash Executive Board
4
The recovery of biogas reduces odour and prevents methane emissions The covered lagoon system
is expected to be able to achieve 90 COD treatment efficiency The covered lagoon will utilize
biogas for mixing to enhance the anaerobic processes in the system The biogas mixing will ensure
the POME is well-mixed and homogenized in the digester tank for optimum system performance
Treated POME from the covered lagoon will send to existing Facultative Algae lagoons system and
bio-polishing system for further treatment to reduce the BODCOD to meet the discharge standard
before discharging to the watercourse5 Existing anaerobic lagoons will be closed after the treatment
systems is stable and achieving the discharge standard
b) Flaring system
Enclosed or open flare will be utilized to burn the excess of biogas in case of maintenance of the gas
engine(s) boiler(s) in case no gas engine(s) boiler is installed or during emergency
c) Gainful use of biogas
The technology that will be used is environmentally safe and sound the renewable based captive
power plant that will be installed will improve the security on site by controlling methane emissions
The recovered biogas will be gainfully use and it is depending on the final requirement of energy by
the mill
Recovered biogas may be combusted in gas engines for grid export andor utilisation at the mill
while balance of biogas (if any) is sent to existing biomass boiler(s) for heat generation and thus
displacing biomass (Palm Kernel Shell (PKS)) excess biogas will be combusted either in enclosed
or open flare equipped with safety features The flare type to be installed is not defined yet it might
be an enclosed flare or an open flare Flare(s) will be operating whenever suitable in case engines or
biomass boiler(s) are unavailable
According to theoretical volumes of biogas to be captured the installed capacity of the power plant
is likely to be 12 MW or more For 12 MW engine the electrical efficiency is around 41
(assumptions for ex-ante calculations)Bio-scrubber and gas drying system will be installed before
the biogas is combusted in the gas engine(s)
The equipments maybe connected to the public grid electricity system to satisfy their energy needs
and may use back-up such as reciprocating engines or other source of energy
The operational lifetime of the equipment is expected to be 20 years if the maintenance is performed
correctly No technology substitution is expected during the crediting period unless if it appears that
the chosen capacity is not adapted to the actual flow or if the equipment is damaged
5 SD 1 - Mill License EQA 1974
PROJECT DESIGN DOCUMENT FORM (CDM-SSC-PDD) - Version 03
CDM ndash Executive Board
5
MILL
Cooling Pond tower
Gas engine(s) Biogas
Project activity
Covered lagoon
River
Final Discharge
Bio-Polishing system
Effluent
Biogas
Enclosed Open flare
Excess biogas
Raw POME
Electricity
Facultative + Algae lagoons
Treated Effluent
Excess Sludge
Land application
To gird andor mill
Existing biomass boiler(s)
Electricity import from Grid for biogas plant
Heat
Displace PKS
Figure A1 Flow diagram of the Project Activity
A41 Identification of the small-scale CPA
A411 Host Party
The host party of this CPA is Malaysia
A412 Geographic reference or other means of identification allowing the
unique identification of the small-scale CPA (maximum one page)
Table A1 Details of the geographic reference of CPA
Name of entity responsible for CPA Felda Palm Industrial Sdn Bhd
Contact details of entity responsible for CPA Jabatan Biomass Tingkat 4 Balai Felda Jalan
Gurney Satu 54000 Kuala Lumpur Malaysia
Tel +603 2692 8066 Fax +603 2691 2563
CityTownCommunity Kuala Lumpur
RegionStateProvince Kuala Lumpur
Country Malaysia
Geographic coordinates of the site 3 16152 N 102 34567 E OR 32692 1025761
A map indicating the location of the CPA site is given below
PROJECT DESIGN DOCUMENT FORM (CDM-SSC-PDD) - Version 03
CDM ndash Executive Board
6
Figure A2 Location of the Project Activity
A42 Duration of the small-scale CPA
A421 Starting date of the small-scale CPA
Starting date of the CPA will be the date on which the Engineering Procurement and Construction (EPC)
contract for the CPA will be awarded The EPC contract for the CPA has not yet been awarded
The start date of the CPA is not or will not be prior to the commencement of validation of the PoA
A422 Expected operational lifetime of the small-scale CPA
The operational lifetime of the CPA will be 20 years
A43 Choice of the crediting period and related information
Renewable crediting period
A431 Starting date of the crediting period
01122012 or the date of its inclusion in the PoA whichever is later
A432 Length of the crediting period first crediting period if the choice is
renewable CP
PROJECT DESIGN DOCUMENT FORM (CDM-SSC-PDD) - Version 03
CDM ndash Executive Board
7
The length of the first crediting period of the CPA6 will be 7 years
A44 Estimated amount of emission reductions over the chosen crediting period
Years Annual estimation of emission reductions in tonnes of CO2e
2012 2440
2013 29280
2014 29280
2015 29280
2016 29280
2017 29280
2018 29280
2019 26840
Total estimated reductions
(tonnes of CO2e) 204960
Total number of crediting years 7
Annual average over the crediting
period of estimated reductions
(tonnes of CO2e)
29280
The starting date of the crediting period is 01122012 or the date of its inclusion in the PoA whichever
is later
A45 Public funding of the CPA
The project has not received and will not be seeking public funding from Annex 1 countries
A46 Information to confirm that the proposed small-scale CPA is not a de-bundled
component
1 For the purposes of registration of a Programme of Activities (PoA)7 a proposed small-scale CPA
of a PoA shall be deemed to be a de-bundled component of a large scale activity if there is
already an activity8 which
(a) Has the same activity implementer as the proposed small scale CPA or has a coordinating
or managing entity which also manages a large scale PoA of the same sectoral scope and
(b) The boundary is within 1 km of the boundary of the proposed small-scale CPA at the
closest point
6 Please note that the duration of crediting period of any CPA shall be limited to the end date of the PoA regardless of when
the CPA was added 7 Only those POAs need to be considered in determining de-bundling that are (i) in the same geographical area and (ii) use
the same methodology as the POA to which proposed CPA is being added 8 Which may be a (i) registered small-scale CPA of a PoA (ii) an application to register another small-scale CPA of a PoA or
(iii) another registered CDM project activity
PROJECT DESIGN DOCUMENT FORM (CDM-SSC-PDD) - Version 03
CDM ndash Executive Board
8
2 If a proposed small-scale CPA of a PoA is deemed to be a debundled component in accordance
with paragraph 2 above but the total size of such a CPA combined with a registered small-scale
CPA of a PoA or a registered CDM project activity does not exceed the limits for small-scale
CDM and small-scale AR project activities as set out in Annex II of the decision 4CMP1 and
5CMP1 respectively the CPA of a PoA can qualify to use simplified modalities and procedures
for small-scale CDM and small-scale AR CDM project activities
The CPA implementer is also implementing other methane recovery project activities but these projects
are more than 1km away from the proposed small-scale CPA at the closest point Therefore the proposed
CPA is not a de-bundled component of a large scale project activity as it does not satisfy any of the above
provisions
A47 Confirmation that small-scale CPA is neither registered as an individual CDM
project activity or is part of another Registered PoA
The project information of this CPA has been checked against the PoA and CDM database available on
UNFCCC website and no duplicate entries were identified It is confirmed that the proposed CPA is
neither registered as an individual CDM project activity nor is part of another PoA This has also been
confirmed by the project implementer Felda Palm Industrial Sdn Bhd
SECTION B Eligibility of small-scale CPA and Estimation of emissions reductions
B1 Title and reference of the Registered PoA to which small-scale CPA is added
Regional Biogas PoA
Version 10
Date 12032012
B2 Justification of the why the small-scale CPA is eligible to be included in the Registered PoA
Table B1 Eligibility of CPA to be included in the Registered PoA
Ndeg Criteria Justification
1 Geographical boundary The CPA takes
place within the borders of Malaysia
The proposed CPA-1 is located in the state of
Pahang Malaysia with GPS coordinates of 3
16152 N 102 34567 E OR 32692 1025761
2 No double counting
The CPA is not already included in another
PoA or developed as a stand-alone CDM
project
The proposed CPA is not already included in
another PoA or developed as a stand-alone CDM
project
PROJECT DESIGN DOCUMENT FORM (CDM-SSC-PDD) - Version 03
CDM ndash Executive Board
9
3
Applicability conditions of AMS-IIIH
a) Substitution of aerobic wastewater or
sludge treatment systems with anaerobic
systems with biogas recovery and
combustion
b) Introduction of anaerobic sludge
treatment system with biogas recovery
and combustion to a wastewater
treatment plant without sludge
treatment
c) Introduction of biogas recovery and
combustion to a sludge treatment
system
d) Introduction of biogas recovery and
combustion to an anaerobic wastewater
treatment system such as anaerobic
reactor lagoon septic tank or an on site
industrial plant
e) Introduction of anaerobic wastewater
treatment with biogas recovery and
combustion with or without anaerobic
sludge treatment to an untreated
wastewater stream
f) Introduction of a sequential stage of
wastewater treatment with biogas
recovery and combustion with or
without sludge treatment to an
anaerobic wastewater treatment system
without biogas recovery (eg
introduction of treatment in an
anaerobic reactor with biogas recovery
as a sequential treatment step for the
wastewater that is presently being
treated in an anaerobic lagoon without
methane recovery)
The CPA is applying Option (f)
Introduction of a sequential stage of wastewater
treatment with biogas recovery and combustion
with or without sludge treatment to an anaerobic
wastewater treatment system without biogas
recovery (eg introduction of treatment in an
anaerobic reactor with biogas recovery as a
sequential treatment step for the wastewater that is
presently being treated in an anaerobic lagoon
without methane recovery)
4(a) The recovered methane measured may also
be utilized for thermal or mechanical
electrical generation directly ndash AMS-IIIH
para 3(a)
The recovered biogas may be used for electricity
generation through combustion in biogas engine(s)
system andor biomass boiler(s) for heat
generation Excess biogas if any will be flared
This in compliance with only AMS-IIIH
paragraph 3(a) and not the others
4(b) The recovered methane measured may also
be utilized for thermal or mechanical
electrical energy generation after bottling of
upgraded biogas ndash AMS-IIIH para 3(b)
Not applicable
4(c) The recovered methane measured may also
be utilized for thermal or mechanical
electrical energy generation after upgrading
and distribution ndash AMS-IIIH para 3(c)
Not applicable
4(d) The recovered methane measured may also Not applicable
PROJECT DESIGN DOCUMENT FORM (CDM-SSC-PDD) - Version 03
CDM ndash Executive Board
10
be utilized for hydrogen production ndash AMS-
IIIH para 3(d)
4(e) The recovered methane measured may also
be utilized for use as fuel in transportation
applications after upgrading ndash AMS-IIIH
para 3(e)
Not applicable
5 If the recovered biogas is used for project
activities covered under AMS-IIIH
paragraph 3(a) that component of the
project activity can use a corresponding
methodology under Type I
The recovered biogas is planned for gainfully use
for electricity andor heat generation in the CPA
The approved baseline and monitoring
methodology AMS IA (version 14) andor AMS-
ID (version 17) are used for the electricity
component of the CPA
6 Conditions that ensure compliance with
applicability and other requirements of
single or multiple methodologyies applied
by CPA
The proposed CPA-01 will apply AMS-IIIH
AMS-IA andor AMS-ID Applicability criteria
are listed below
7 The project has to fulfill Host Country
National CDM criteria if any
Malaysia‟s National CDM criteria have been
fulfilled by the proposed CPA
8 The starting date of CPA is compliant with
the latest UNFCCC guidelines
The start date of the CPA is not or will not be
prior to the commencement of validation of the
PoA The EPC contract for biogas plant yet to be
awarded
9 Confirmation that the CPA does not involve
any public funding from Annex I Parties or
that in case public funding is used it does
not result in diversion of Official
Development Assistance (ODA)
The proposed CPA has not received and will not
be seeking public funding from Annex 1 countries
10 A local Stakeholder consultation has been
conducted prior to the CPA inclusion
Stakeholder consultation has been organized on
05032012 and it is prior to the CPA inclusion
11 Conditions pertaining to the demonstration
of additionality of each small scale CPA to
be included (less than 60 ktCO2 year) for
Type III and 15MW for Type I
methodologies
The proposed CPA may install gas engine with
maximum capacity of 12 MW and methane
avoidance of less than 60000 tCO2yr for AMS-
IIIH
12 Where applicable the conditions that ensure
that CPA in aggregate meets the small-scale
threshold criteria and remain within this
threshold throughout the crediting period of
the CPA
The proposed CPA may install gas engine with
maximum capacity of 12 MW and methane
avoidance of less than 60000 tCO2yr for AMS-
IIIH
13 Where applicable the requirements for the
debundling check in case CPAs belong to
small-scale (SSC) project categories
The proposed CPA is not a debundled component
of a large activity as described in the latest
ldquoGuidelines on assessment of debundling for SSC
project activitiesrdquo
14 Where applicable the conditions related to
sampling requirements for a PoA in
accordance with the approved
guidelinesstandard from the Board
pertaining to sampling and surveys
Not applicable all CPAs will be verified
15 Where applicable target group (eg The target group is prospective POME plants in
PROJECT DESIGN DOCUMENT FORM (CDM-SSC-PDD) - Version 03
CDM ndash Executive Board
11
domesticcommercialindustrial ruralurban
grid-connectedoff-grid) and distribution
mechanisms (eg direct installation)
Malaysia There are no specific distribution
mechanisms
16 Whether an EIA is required by local
authorities
Not applicable for the proposed CPA as EIA is not
required
17 The crediting period of the CPA shall not
exceed the length of the PoA (ie 28 years)
regardless of the time of inclusion of CPA in
the PoA
The crediting period of the proposed CPA will not
exceed the length of PoA 28 years
Additional eligibility criteria applicable in case of CPA that gainfully use of biogas for electrical
andor thermal energy generation
The proposed project conforms to the applicable requirements of AMS - ID version 17
Applicability Criteria Justification
This methodology comprises renewable energy
generation units such as photovoltaic hydro
tidalwave wind geothermal and renewable biomass
a) Supplying electricity to a national or a regional
grid
b) Supplying electricity to an identified consumer
facility via nationalregional grid through a
contractual arrangement such as wheeling
Applicable The proposed project activity is
based on biogas recovered from anaerobic bio-
digester a renewable energy generation source
The proposed project shall supply electricity to
the national grid
The project activity is not supplying electricity
to an identified consumer facility
This methodology is applicable to project activities that
(a) Install a new power plant at a site where there was
no renewable energy power plant operating prior
to the implementation of the project activity
(Greenfield plant)
(b) Involve a capacity addition
(c) Involve a retrofit of (an) existing plant(s)
(d) Involve a replacement of (an) existing plant(s)
Applicable to (a) where the proposed project
activity shall install a new power plant at a site
where there was no renewable energy power
plant operating prior to the implementation of
the project activity
Hydro power plants with reservoirs that satisfy at least
one of the following conditions are eligible to apply this
methodology
Not applicable The project activity is a biogas
recovery and utilization project
If the new unit has both renewable and non-renewable
components (eg a winddiesel unit) the eligibility limit
of 15MW for a small-scale CDM project activity applies
only to the renewable component If the new unit co-
fires fossil fuel the capacity of the entire unit shall not
exceed the limit of 15MW
Not applicable The project does not
incorporate a mix of renewable and non-
renewable components
Combined heat and power (co-generation) systems are
not eligible under this category
Applicable There is no combined heat and
power component in the project activity
PROJECT DESIGN DOCUMENT FORM (CDM-SSC-PDD) - Version 03
CDM ndash Executive Board
12
In the case of project activities that involve the addition
of renewable energy generation units at an existing
renewable power generation facility the added capacity
of the units added by the project should be lower than
15 MW and should be physically distinct from the
existing units
Not applicable The project activity does not
involve the addition of renewable energy
generation units at an existing facility
In the case of retrofit or replacement to qualify as a
small-scale project the total output of the retrofitted or
replacement unit shall not exceed the limit of 15 MW
Not applicable The project activity does not
seek to retrofit or replacement an existing
facility
The proposed project conforms to the applicable requirements of AMS - IA version 14
Applicability Criteria Justification
This category comprises renewable electricity
generation units that supply individual Households
users or groups of households users included in the
project boundary The applicability is limited to
individual households and users that do not have a grid
connection except when
a) A group of households or users are supplied
electricity through a standalone mini grid powered
by renewable energy generation unit(s) where the
capacity of the generating units does not exceed 15
MW or
b) The emissions reduction per renewable energy
based lighting system is less than 5 tonnes of CO2e
a year and where it can be shown that fossil fuel
would have been used in the absence of the project
activity by
(i) A representative sample survey (90
confidence interval plusmn10 error margin) of
target households or
(ii) Official statistics from the host country
government agencies
The renewable energy generation units include
technologies such as solar hydro wind biomass
gasification and other technologies that produce
electricity all of which is used on-sitelocally by the
user
The renewable generating units may be new
installations (Greenfield) or replace existing onsite
fossil-fuel-fired generation To qualify as a small-scale
project the total output of the unit(s) shall not exceed
the limit of 15 MW
Applicable The proposed project activity is not
grid connected
Furthermore the total installed capacity of the
generating units will not exceed 15 MW
Applicable The project activity involves the
combustion of the recovered biogas from the
anaerobic bio-digester for electricity generation
to be use on-site
Applicable The project activity involve the
replacement of existing onsite fossil fuel fired
generation and the total installed capacity is not
PROJECT DESIGN DOCUMENT FORM (CDM-SSC-PDD) - Version 03
CDM ndash Executive Board
13
exceed 15 MW
Hydro power plants with reservoirs that satisfy at least
one of the following conditions are eligible to apply this
methodology
The project activity is implemented in an existing
reservoir with no change in the volume of
reservoir
The project activity is implemented in an existing
reservoir where the volume of reservoir is
increased and the power density of the project
activity as per definitions given in the Project
Emissions section is greater than 4 Wm2
The project activity results in new reservoirs and
the power density of the power plant as per
definitions given in the Project Emissions section
is greater than 4 Wm2
Not applicable The project activity is not a
hydro power plant
Combined heat and power (co-generation) systems are
not eligible under this category
Applicable There is no combined heat and
power component in the project activity
If the unit added has both renewable and non-renewable
components (eg a winddiesel unit) the eligibility
limit of 15 MW for a small-scale CDM project activity
applies only to the renewable component If the unit
added co-fires fossil fuel the capacity of the entire unit
shall not exceed the limit of 15 MW
Not applicable The project does not
incorporate a mix of renewable and non-
renewable components
Project activities that involves retrofit or replacement of
an existing facility for renewable energy generation are
included in this category To qualify as a small-scale
project the total output of the modified or retrofitted
unit shall not exceed the limit of 15 MW
Not applicable The project activity does not
seek to retrofit or replacement an existing
facility
In the case of project activities that involve the addition
of renewable energy generation units at an existing
renewable power generation facility the added capacity
of the units added by the project should be lower than
15 MW and should be physically distinct3 from the
existing units
Not applicable The project activity does not
involve the addition of renewable energy
generation units at an existing facility
B3 Assessment and demonstration of additionality of the small-scale CPA as per eligibility
criteria listed in the Registered PoA
In Malaysia Environmental Quality (Prescribed Premises) (Crude Palm Oil) Regulation 1977 governs
environmental considerations including the wastewater treatment and discharge at palm oil mills The
regulation stipulates the discharge standards for water discharge or land application The regulation
however does not specify the required treatment technologies for wastewater or GHG emissions from
wastewater treatment operations
PROJECT DESIGN DOCUMENT FORM (CDM-SSC-PDD) - Version 03
CDM ndash Executive Board
14
More than 85 of palm oil mills are utilizing open based anaerobic ponds and it is considered the
prevailing practice for oil palm industry to treat the POME The open anaerobic ponds system is an
effective and low-tech solution that can easily meet the water discharge limits applicable to the palm oil
industry9 10
There is no financial incentive for the palm oil mill owners to invest into methane capture projects
particularly when there is no requirement under existing pending or planned national state or local
regulatory This is partly related to the fact that there are a lot of attractive and competing investments in
the sector However the PP has undertaken to set up this project in order to reduce the GHG emissions
and contribute his mite to the global GHG emission reduction
The project is a small scale project activity As such the provisions of Attachment A to Appendix B of
the simplified modalities and procedures for small-scale CDM project activities will apply to this project
The bdquoindicative simplified baseline and monitoring methodologies for selected small-scale CDM project
activity categories‟ require the project proponents to demonstrate that the project activity would not have
occurred anyway due to at least one of the following barriers
a) Investment barrier a financially more viable alternative to the project activity would have led to
higher emissions
b) Technological barrier a less technologically advanced alternative to the project activity involves
lower risks due to the performance uncertainty or low market share of the new technology
adopted for the project activity and so would have led to higher emissions
c) Barrier due to prevailing practice prevailing practice or existing regulatory or policy
requirements would have led to the implementation of a technology with higher emissions
d) Other barriers without the project activity for another specific reason identified by the project
participant such as institutional barriers or limited information managerial resources
organizational capacity financial resources or capacity to absorb new technologies emissions
would have been higher
Subsequently in its 35th Meeting the EB had issued bdquoNon-binding best practice examples to demonstrate
additionality for SSC project activities‟ wherein EB had given best practice examples of each of the
aforementioned category of barriers
The project participant has chosen Investment Barrier to demonstrate the additionality which is discussed
in the following paragraphs
Investment barrier
The most important of all the barriers faced by the company is the investment barrier The investment
analysis reveals that the project is not financially attractive The additionality tool permits the use of
simple cost analysis or investment comparison analysis or benchmark analysis to demonstrate the
additionality of the project
9 SD 05 ndash Yeoh B G 2004 A Technical and Economic Analysis of Heat and Power Generation from Biomethanation of
Palm Oil Mill Effluent Electrcity Supply Industry in Transition Issues and Prospect for Asia 10 SD 06 ndash Eco-Ideal Consulting Sdn Bhd (Eco-Ideal) 2004 MEWCPTMDANIDA Study on Clean Development
Mechanism Potential in the Waste Sectors in Malaysia Unpublished
PROJECT DESIGN DOCUMENT FORM (CDM-SSC-PDD) - Version 03
CDM ndash Executive Board
15
As the project activity generates revenue (other than CDM revenue) by exporting the electricity to the
grid and from the likely sale of biomass andor saving from diesel usage at the mill which is being
displaced by biogas simple cost analysis cannot be used Of the remaining PP has chosen the benchmark
analysis to demonstrate the financial unattractiveness of the project activity without carbon credits
There is a national policy on Feed-In-Tariff (FiT) gazetted in June 201111
that gives comparative
advantages to less emissions-intensive technologies over more emissions-intensive technologies (E-
policy as national andor sectoral policies or regulations that give comparative advantages to less
emissions-intensive technologies over more emissions-intensive technologies)
This is very conservative as paragraph 7 6 (b) EB22 Annex 3 states that ldquoNational andor sectoral
policies or regulations hellip that have been implemented since the adoption by the COP of the CDM MampP
(decision 17CP7 11 November 2001) need not be taken into account in developing a baseline scenario
(ie the baseline scenario could refer to a hypothetical situation without the national andor sectoral
policies or regulations being in place) In absence of the FiT the prevailing electricity sales tariff to
consumers is RM 021 per kWh
Project IRR has been chosen as the financial indicator for the financial analysis of the project activity
The project IRR has to be compared with a benchmark rate of return to demonstrate the additionality of
the project The Guidelines on the Assessment of Investment Analysis (Version 05 point 12) states ldquoIn
cases where a benchmark approach is used the applied benchmark shall be appropriate to the type of IRR
calculated Local commercial lending rates or weighted average costs of capital (WACC) are appropriate
benchmarks for a project IRR Requiredexpected returns on equity are appropriate benchmarks for an
equity IRR Benchmarks supplied by relevant national authorities are also appropriate if the DOE can
validate that they are applicable to the project activity and the type of IRR calculation presentedrdquo
In line with the Guidelines on the Assessment of Investment Analysis (Version 05) a default value
for the expected returns on equity is selected as the benchmark with 1090 The logic of choosing this
rate as benchmark is that the project should yield a return at least equivalent to the expected returns of
equity to merit consideration
For making the investment analysis the following assumptions have been made
Table B2 Investment Analysis
Sl No Description Value
1
Budgeted CAPEX
- Bioreactor amp accessories
- Flaring system
- Boiler adaptation cost for burners
- Gas engine(s)
- KPSR consultancy cost
4350000
140670
205000
4630000
220000
Total 9545670
2
Annual maintenance costs are estimated based on a of CAPEX12
Bioreactor (3 of CAPEX) = MYR 130500
Gas engine(s) (5 of CAPEX) = MYR 231500
3 Corporate tax ()13 25
11 httpwwwmbipvnetmydloadFiT20Handbook20Englishpdf 12 SD 05 ndash Maintenance cost (SIRIM Environmental and Bioprocess Technology Centre of Malaysia)
PROJECT DESIGN DOCUMENT FORM (CDM-SSC-PDD) - Version 03
CDM ndash Executive Board
16
Since losses can be carried forward indefinitely (so long as the ownership
remains unchanged) the incidence of taxation does not arise in the case of
this project activity
4
Manpower cost has been estimated based on 1 supervisor 2 operators 1
chargeman envisaged to be appointed and the ruling wagesalary structure
of the company14
182588 MYR yr
5 Salary increment rate has been applied based on the average expected
salary increment rate for year 20101115 40
6 Price of Biomass ex-factory (PKS) 156 MYRmt
7 Price of diesel 220 MYRliter
8 RE tariff export to grid (MYRkWh) 021
9
Laboratory Cost is estimated based on the quotations from accredited
laboratory anticipated number of tests and samples to be carried out and
transportation cost during the running and operating of the biogas plant for
maintaining optimum operating conditions
1920 MYR yr
10 Insurance premium per year ( of CAPEX)16 0412
11 Estimate of CER price (EUR) 8
12
Depreciation of equipment (years) has been provided as per the Inland
Revenue Authority regulations17 Since the project consists of only
environmental protection equipment it is entitled to initial capital
allowance of 40 and annual capital allowance of 20 as per the Inland
Revenue Authority notifications
4 years
13 Project life time for IRR calculation18 20 years
14
Residual value a fair value (5) of the project activity assets at the end of
the assessment period as per the Guidelines on The Assessment of
Investment Analysis version 05 EB 62
MYR 466284
Based on the above assumption the project IRR works out to be ndash 085 in contrast to the benchmark
rate of 1090 Thus the analysis proves that the project is not financially attractive
Sensitivity Analysis
A sensitivity analysis has also been conducted to test the robustness of the conclusions drawn Four (4)
factors have been identified as critical to IRR of the project viz project cost maintenance costs RE
tariff The results of sensitivity analysis are given below
13 SD 08 ndash Malaysian Tax and Business Booklet 201011 Page 12
httpwwwpwccomen_MYmyassetspublicationstaxbooklet1011pdf 14 SD 3 - Salary structure (biogas plant) 15 SD 09 - Salary increment rate (201011) 16 SD 2 - Biogas plant insurance policy 17 SD 08 ndash Malaysian Tax and Business Booklet 201011 Page 21
httpwwwpwccomen_MYmyassetspublicationstaxbooklet1011pdf 18 As per the Guidelines on the Assessment of Investment Analysis version 05 (Annex 5 EB 62 point 3) ldquoIn general a
minimum period of 10 years and a maximum of 20 years will be appropriaterdquo PP has chosen 20 years for financial
assessment as it is conservative
PROJECT DESIGN DOCUMENT FORM (CDM-SSC-PDD) - Version 03
CDM ndash Executive Board
17
Table B3 Sensitivity Analysis
FACTORS PROJECT IRR
-10 0 +10
Project cost -185 -085 033
Maintenance cost -491 -085 189
RE tariff 112 -085 -354
It could be seen from the above that even under the most optimistic conditions the project activity would
not yield a positive IRR let alone crossing the benchmark Therefore the project is not a business-as-
usual scenario and it is additional
Prior Consideration of CDM
As per the guidance of EB Meeting Report 49 Annex 22 the project proponent notified the UNFCCC and
the DNA of the intent to implement the project as a CDM project activity
Conclusion
The conclusion of the investment analysis remains identical to reasonable variations of the critical
assumptions (sensitivity analysis) Therefore the project activity IRR remains lower than the benchmark
In the above background it is proved that the project faces an investment barrier that establishes the
additionality
B4 Description of the sources and gases included in the project boundary and proof that the
small-scale CPA is located within the geographical boundary of the registered PoA
The emission sources and type of GHG which are included or excluded within the project boundary are
shown in the following table
Table B4 Emission Sources and Type of GHG
Source Gas Included Justification Explanation
Ba
seli
ne
Direct emissions
from the
wastewater
treatment processes
CO2 No Neutral CO2 emissions from biomass decaying
CH4 Yes Methane emissions from open lagoons treatment
process
N2O No Not significant Excluded for simplification and
conservativeness
Diesel usage in
diesel genset at mill
CO2 Yes CO2 emissions from combustion of diesel fuel
CH4 No Not significant Excluded for simplification and
conservativeness
N2O No Not significant Excluded for simplification and
conservativeness
Pro
ject
Act
ivit
y
Bio-digester
CO2 No Neutral CO2 emissions from biomass decaying
CH4 Yes Methane emissions from anaerobic treatment process
N2O No Not significant Excluded for simplification and
conservativeness
Existing
wastewater
treatment lagoons
CO2 No Neutral CO2 emissions from biomass decaying
CH4 Yes Methane emissions from poorly managed treatment
process (without aerators)
PROJECT DESIGN DOCUMENT FORM (CDM-SSC-PDD) - Version 03
CDM ndash Executive Board
18
(Facultative amp
algae system) N2O No
Not significant Excluded for simplification and
conservativeness
Gas engine(s)
(biogas
combustion)
CO2 No Neutral CO2 emissions from biogas combustion
CH4 No Not significant and excluded from calculation
Biogas combustion efficiency is considered 10019
N2O No Not significant Excluded for simplification and
conservativeness
Biomass Boiler(s)
(Biogas
combustion)
CO2 No Neutral CO2 emissions from biogas combustion
CH4 No Not significant and excluded from calculation
Biogas combustion efficiency is considered 10020
N2O No Not significant Excluded for simplification and
conservativeness
Grid electricity
consumption from
national grid
CO2 Yes CO2 emissions from grid energy
CH4 No Not significant Excluded for simplification and
conservativeness
N2O No Not significant Excluded for simplification and
conservativeness
Enclosed or Open
flaring system
CO2 No Neutral CO2 emissions from biogas combustion
CH4 Yes CH4 emissions due to incomplete combustion in
enclosed flare
N2O No Not significant Excluded for simplification and
conservativeness
The CPA is implemented at the address below
Kilang Sawit Felda Triang Triang Pahang Malaysia
The site is located at state of Pahang Malaysia with GPS coordinates 3 16152 N 102 34567 E or
32692 1025761 (refer also Section A412) and thus is located within the geographical boundary of the
PoA
B5 Emission reductions
B51 Data and parameters that are available at validation
Data Parameter GWPCH4
Data unit tCO2tCH4
Description Global Warming Potential the equivalent in CO2 of the effect of methane
gas to the atmosphere
Source of data used IPCC 2006
Value applied 21
Justification of the choice of
data or description of
measurement methods and
procedures actually applied
Global warming potential for methane gas since this is a methane
capture project
19 AMS-IIIH para 35 20 AMS-IIIH para 35
PROJECT DESIGN DOCUMENT FORM (CDM-SSC-PDD) - Version 03
CDM ndash Executive Board
19
Any comment
Data Parameter MCFwwtreatmentBL1
Data unit Fraction
Description Methane correction factor for baseline wastewater anaerobic treatment
systems
Source of data used Table IIIH1 AMS IIIH version 16
Value applied 08
Justification of the choice of
data or description of
measurement methods and
procedures actually applied
Table IIIH1 for baseline emission The lagoons depth are more than 2m
MCF value of 08 for anaerobic deep lagoon (depth gt 2 m)
Any comment
Data Parameter MCFwwtreatmentBL2
Data unit Fraction
Description Methane correction factor for baseline wastewater aerobic treatment
systems
Source of data used Methane correction factor for baseline aerobic wastewater treatment
system (poorly managed)
Value applied Table IIIH1 AMS IIIH version 16
Justification of the choice of
data or description of
measurement methods and
procedures actually applied
03
Any comment No aerators installed
Data Parameter MCFwwBLdischarge
Data unit Fraction
Description Methane correction factor based on discharge pathway in the baseline
situation
Source of data used Table IIIH1 AMS IIIH version 16
Value applied 01
Justification of the choice of
data or description of
measurement methods and
procedures actually applied
Table IIIH1 for baseline emission The final discharge of treated
effluent into river MCF value of 01 for river discharge
Any comment
Data Parameter Bo ww
Data unit kgCH4 kgCOD
Description Methane generation capacity of treated wastewater
Source of data used IPCC 2006
Value applied 025
Justification of the choice of
data or description of
measurement methods and
procedures actually applied
Default value as prescribed in the methodology
Any comment
PROJECT DESIGN DOCUMENT FORM (CDM-SSC-PDD) - Version 03
CDM ndash Executive Board
20
Data Parameter UFBL
Data unit -
Description Model correction factor to account for model uncertainties (baseline)
Source of data used AMS IIIH version 16
Value applied 089
Justification of the choice of
data or description of
measurement methods and
procedures actually applied
As per methodology AMS-IIIH point 24
Any comment -
Data Parameter UFPJ
Data unit -
Description Model correction factor to account for model uncertainties (project
activity)
Source of data used AMS IIIH version 16
Value applied 112
Justification of the choice of
data or description of
measurement methods and
procedures actually applied
As per methodology AMS-IIIH point 30(a)
Any comment -
Data Parameter CFEww
Data unit Fraction
Description Capture efficiency of the biogas recovery equipment in the wastewater
treatment system
Source of data used AMS IIIH version 16
Value applied 09
Justification of the choice of
data or description of
measurement methods and
procedures actually applied
A default value of 09 has been used as per the guidance in the
methodology
Any comment
Data Parameter MCF ww treatmentPJ1
Data unit Fraction
Description Methane correction factor for the project wastewater anaerobic treatment
system equipped with biogas recovery equipment
Source of data used Table IIIH1 AMS IIIH version 16
Value applied 08
Justification of the choice of
data or description of
measurement methods and
procedures actually applied
The lagoons depth are more than 2 m MCF values in table IIIH1 has
been used as per the guidance in the methodology (depth gt 2 m)
Any comment
Data Parameter MCF ww treatmentPJ2
PROJECT DESIGN DOCUMENT FORM (CDM-SSC-PDD) - Version 03
CDM ndash Executive Board
21
Data unit Fraction
Description Methane correction factor for the project wastewater aerobic treatment
system not equipped with biogas recovery equipment
Source of data used Table IIIH1 AMS IIIH version 16
Value applied 03
Justification of the choice of
data or description of
measurement methods and
procedures actually applied
Aerobic treatment poorly managed
Any comment
Data Parameter MCFwwPJdischarge
Data unit Fraction
Description Methane correction factor based on discharge pathway in the project
activity
Source of data used Table IIIH1 AMS IIIH version 16
Value applied 01
Justification of the choice of
data or description of
measurement methods and
procedures actually applied
Table IIIH1 for project emission The final discharge of treated effluent
into river MCF value of 01 for river discharge
Any comment Same discharge pathway as in the baseline
Data Parameter CODBL1
Data unit
Description COD removal efficiency of the baseline system (anaerobic treatment
system)
Source of data used 10 days measurement campaign
Value applied Anaerobic Treatment system 8880
Justification of the choice of
data or description of
measurement methods and
procedures actually applied
One year historical data not available
Any comment This data will be used for ex post emission reduction calculation
Data Parameter CODBL2
Data unit
Description COD removal efficiency of the baseline system (aerobic treatment
system)
Source of data used 10 days measurement campaign
Value applied Aerobic Treatment system 6369
Justification of the choice of
data or description of
measurement methods and
procedures actually applied
One year historical data not available
Any comment This data will be used for ex post emission reduction calculation
Data Parameter NCVCH4
Data unit MJkg
PROJECT DESIGN DOCUMENT FORM (CDM-SSC-PDD) - Version 03
CDM ndash Executive Board
22
Description Net Calorific Value of methane
Source of data used IPCC 2006 Default Value
Value applied 504
Justification of the choice of
data or description of
measurement methods and
procedures actually applied
IPCC 2006 value is used Volume 2 Chapter 1 Table 12
Any comment
Data Parameter NCVFF
Data unit MJkg
Description Net Calorific Value of diesel
Source of data used IPCC 2006 Default Value
Value applied 430
Justification of the choice of
data or description of
measurement methods and
procedures actually applied
IPCC 2006 value is used Volume 2 Chapter 1 Table 12
Any comment
Data Parameter EFCO2diesel
Data unit tCO2MWh
Description CO2 emission factor diesel genset
Source of data used AMS-IA version 14 point 14
Value applied 08
Justification of the choice of
data or description of
measurement methods and
procedures actually applied
Default value for diesel generation unit
Any comment
Data Parameter Grid Emission Factor
Data unit kgCO2ekWh
Description Emission factor for grid electricity in Peninsular Malaysia
Source of data used Pusat Tenaga Malaysia March 2010
Value applied 0672
Justification of the choice of
data or description of
measurement methods and
procedures actually applied
As per AMS-ID point 12
Any comment Study on Grid Connected Electricity Baselines in Malaysia 2008
B52 Ex-ante calculation of emission reductions
The ex ante emission reductions are calculated based on AMS-IIIH version 16 as per equations
explained in section E62 of PoA-DD Biogas PoA in Malaysia
PROJECT DESIGN DOCUMENT FORM (CDM-SSC-PDD) - Version 03
CDM ndash Executive Board
23
Calculation for AMS-IIIH
Baseline emissions
Source of baseline emissions Reference Applicable
(YN)
Comments
Wastewater and sludge treatment
systems equipped with a biogas
recovery facility shall be excluded
from the baseline
AMS-IIIH
Point 17
N No biogas recovery in the
baseline
Emissions on account of electricity or
fossil fuel used (BEpowery)
AMS-IIIH
Point 18 (i)
N For conservativeness no
emissions due to electricity or
fossil fuel will be claimed
BEpowery = 0
Methane emissions from baseline
wastewater treatment systems
(BEwwtreatmenty)
AMS-IIIH
Point 18 (ii)
Y Baseline includes anaerobic and
aerobic treatment conditions with
different MCF values selected as
per Table IIIH1
Methane emissions from baseline
sludge treatment systems (BEstreatmenty)
= 0
AMS-IIIH
Point 18 (iii)
N The baseline plant corresponds to
scenario Para 1(f) without sludge
treatment BEstreatmenty = 0
Methane emissions on account of
inefficiencies in the baseline
wastewater treatment systems and
presence of degradable organic carbon
in the treated wastewater discharged
into river (BEwwdischargey)
AMS-IIIH
Point 18 (iv)
Y Treated effluent is currently
discharged into the river
Methane emissions from the decay of
the final sludge generated by the
baseline treatment systems (BEsfinaly)
AMS-IIIH
Point 18 (v)
N Zero because in the baseline final
sludge used for soil application
BEsfinaly = 0
A) Calculation of baseline emissions
BEy = BEwwtreatmenty + BEwwdischargey
Abbreviation Description Value Source
BEy Baseline emissions in year y (tCO2e) 30762 Calculated
BEpowery Baseline emissions of diesel genset in year
y tCO2eyear 0 Calculated
BEwwtreatmenty Baseline emissions of the wastewater
treatment systems tCO2eyear 30663 Equation 2
BEwwdischargey
The methane emissions from degradable
organic carbon in treated wastewater
discharged tCO2eyear
100 Equation 6
A1) Baseline emissions
PROJECT DESIGN DOCUMENT FORM (CDM-SSC-PDD) - Version 03
CDM ndash Executive Board
24
Equation 2 BEwwtreatmenty = Qwwy (CODinflow1 y CODBL1 MCFwwtreatmentBL1) +
(CODinflow2y CODBL2 MCFwwtreatmentBL2) Boww UFBL GWPCH4
Abbreviation Description Value Source
BEwwtreatmenty Baseline emissions of the wastewater
treatment systems (tCO2eyear) 30663 Calculated
Qwwy Volume of wastewater treated in baseline
wastewater treatment system i in year y
(m3year)
333293
Volume based on 10 m3mt
FFB21 amp FFB historical data
(2009 ndash 2011)
CODinflow1y Chemical oxygen demand of the
wastewater inflow to the baseline treatment
system (anaerobic) in year y (tCOD m3)
0026905 10 days measurement
campaign
CODBL1 COD removal efficiency of the baseline
treatment system (anaerobic) () 8880
10 days measurement
campaign
CODinflow2y Chemical oxygen demand of the
wastewater inflow to the baseline treatment
system (aerobic) in year y (tCOD m3)
0003013 10 days measurement
campaign
CODBL2 COD removal efficiency of the baseline
treatment system (aerobic) () 6369
10 days measurement
campaign
MCFwwtreatmentBL 1 Methane correction factor for baseline
wastewater anaerobic treatment systems 08
MCF values as per table
IIIH1 anaerobic gt 2m
MCFwwtreatmentBL2 Methane correction factor for baseline
wastewater aerobic treatment systems 03
MCF values as per table
IIIH1 ndash poorly managed
Boww Methane producing capacity of the
wastewater (kg CH4kg COD) 025
IPCC 2006
UFBL Model correction factor to account for
model uncertainties 089
IPCC 2006
GWPCH4 Global Warming Potential for methane 21 IPCC 2006
A2) The methane emissions from degradable organic carbon in treated wastewater discharged
Equation 6 BEwwdischargey = Qwwy GWPCH4 Boww UFBL CODwwdischarge BLyMCFww BLdischarge
Abbreviation Description Value Source
BEwwdischargey
The methane emissions from degradable
organic carbon in treated wastewater
discharged (tCO2eyear)
100 Calculated
Qwwy Volume of treated wastewater discharged
in year y (m3year) 333293
Volume based on 10 m3mt
FFB22 amp FFB historical data
(2009 ndash 2011)
GWPCH4 Global warming potential of methane 21 IPCC 2006
Boww Methane producing capacity of the treated
wastewater (kgCH4 kgCOD) 025 IPCC 2006
21 Mill designed data for baseline effluent treatment plant 22 Mill designed data for baseline effluent treatment plant
PROJECT DESIGN DOCUMENT FORM (CDM-SSC-PDD) - Version 03
CDM ndash Executive Board
25
UFBL Model correction factor to account for
model uncertainties 089 IPCC 2006
CODwwdischarge BLy Chemical oxygen demand of the treated
wastewater discharged into sea river or
lake in the baseline situation in the year y
(tonnesm3)
0000642 10 days measurement
campaign
MCFwwBLdischarge Methane correction factor based on
discharge pathway in the baseline situation
(eg into sea river or lake) of the
wastewater (fraction)
01 MCF values as per table
IIIH1 version 16
Project activity emissions
The project activity emission sources as per the methodology and their relevance with respect to the
proposed CDM project activity are given below in a tabular format
Source of project activity
emission Reference
Applicable
(YN) Comments
CO2 emissions on account of
power and fossil fuel used by
the project activity facilities
(PEpowery)
AMS-IIIH
point 29(i)
Y The project activity uses the electricity
imported from the national grid
Methane emissions from
wastewater treatment systems
affected by the project
activity and not equipped with
biogas recovery in the project
situation (PEwwtreatmenty)
AMS-IIIH
point 29 (ii)
Y CH4 emissions from the poorly managed
aerobic lagoons
Methane emissions from
sludge treatment systems
affected by the project
activity and not equipped with
biogas recovery in the project
situation (PEstreatmenty)
AMS-IIIH
point 29 (iii)
N The project activity corresponds to
scenario (vi) without sludge treatment
PEystreatmenty = 0
Methane emissions on account
of inefficiency of the project
activity wastewater treatment
systems and presence of
degradable organic carbon in
treated wastewater
(PEwwdischargey)
AMS-IIIH
point 29 (iv)
Y Treated effluent from ETP will be
discharged into river
Methane emissions from the
decay of the final sludge
generated by the project
activity treatment systems
(PEsfinaly)
AMS-IIIH
point 29 (v)
N In the proposed CDM project activity
final sludge is used for soil application in
the same manner as in the baseline
PEsfinaly = 0
PROJECT DESIGN DOCUMENT FORM (CDM-SSC-PDD) - Version 03
CDM ndash Executive Board
26
Methane fugitive emissions on
account of inefficiencies in
capture systems (PEfugitivey)
AMS-IIIH
point 29 (vi)
Y Applicable to PEfugitivewwy
N The project activity corresponds to
scenario (vi) without sludge treatment
PEfugitivesy = 0
Methane emissions due to
incomplete flaring (PEflaringy)
AMS-IIIH
point 29 (vii)
Y Enclosed flaring system installed
Methane emissions from
biomass stored under
anaerobic conditions which
does not take place in the
baseline situation (PEbiomassy)
AMS-IIIH
point 29
(viii)
N In the project activity the biomass (PKS
+ mesocarp fibres) displaced will not be
stored under anaerobic conditions The
conditions of onsite storage are identical
in the baseline as in the project activity
The biomass will be sold to the market
on a regular basis PEbiomassy = 0
B) Calculation of project emissions
PEy = PEpowery + PEwwtreatmenty + PEww discharge y + PEfugitive y + PEflaring y
Abbreviation Description Value Source
PEy Project activity emissions in the year y
(tCO2eyr) 6050 Equation 8
PEpowery CO2 emissions on account of power used
by the project activity facilities (tCO2eyr) 604 -
PEwwtreatmenty Methane emissions from wastewater
treatment systems affected by the project
activity and not equipped with biogas
recovery in year y (tCO2eyr)
1523 Equation 9
PEwwdischargey
Methane emissions on account of
inefficiency of the project activity
wastewater treatment systems and presence
of degradable organic carbon in treated
wastewater (tCO2eyr)
126 Equation 12
PEfugitivey Methane fugitive emissions on account of
inefficiencies in capture systems (tCO2eyr) 3796 Equation 15
PEflaringy Methane emissions due to incomplete
flaring (tCO2eyr) 0 Equation 19
B1) Project emissions from CO2 emissions on account of power and fuel used by the project activity
facilities in year ldquoyrdquo in tCO2eyear
PEpowery = ECPJjy EFgridy
Abbreviation Description Value Source
PEpowery Project emissions from electricity
consumption in the year y (tCO2eyr) 604 Calculated
ECPJjy Internal power consumption from the grid 749 100 kW is the effective
PROJECT DESIGN DOCUMENT FORM (CDM-SSC-PDD) - Version 03
CDM ndash Executive Board
27
(MWh year) power based on the
equipments installed at the
site
EFgridy Grid Emission factor in Peninsular
Malaysia 2008 (tCO2 MWh) 0672
Study on Grid Connected
Electricity Baselines in
Malaysia 2008 published in
2010 by PTM
B2) Methane emissions from wastewater treatment systems affected by the project activity and not
equipped with biogas recovery in the project situation in year ldquoyrdquo in tCO2e
Equation 9 PEwwtreatment y = Qwwky CODinflowk y PJky MCFwwtreatmentPJk) Boww UFPJ GWPCH4
Abbreviation Description Value Source
PEwwtreatmenty
Methane emissions from wastewater
treatment systems affected by the project
activity and not equipped with biogas
recovery in the project situation (tCO2eyr)
1523 Calculated
Qwwky Volume of wastewater treated in project
activity wastewater treatment system k in
year y (m3year)
333293
Volume based on 10 m3mt
FFB23 amp FFB historical data
(2009 ndash 2011)
CODinflowky Chemical oxygen demand of the
wastewater inflow to the project activity
treatment system k in year y (tonnes COD
m3)
0002690 10 days measurement
campaign
PJky Chemical oxygen demand removal
efficiency of the project wastewater
treatment system k in year y (tm3)
measured based on inflow COD and
outflow COD in system k
90 Based on bio-digester COD
removal efficiency of 90
MCFwwtreatmentPJk Methane correction factor for project
wastewater treatment system k (MCF
values as per table IIIH1)
03
MCF values table IIIH1
Version 16 ndash aerobic poorly
managed (conservative)
Boww Methane generation capacity of the treated
wastewater (kg CH4kg COD) 025 IPCC 2006
UFPJ Model correction factor to account for
model uncertainties 112
IPCC 2006
GWPCH4 Global warming potential of methane 21 IPCC 2006
23 Mill designed data for baseline effluent treatment plant
PROJECT DESIGN DOCUMENT FORM (CDM-SSC-PDD) - Version 03
CDM ndash Executive Board
28
B3) Methane emissions on account of inefficiency of the project activity wastewater treatment
systems and presence of degradable organic carbon in treated wastewater in the year ldquoyrdquo (tonnes)
Equation 12 PEwwdischarge y = Qwwy GWPCH4 Boww UFPJ CODwwdischargePJy MCFwwPJdischarge
Abbreviation Description Value Source
PEwwdischargey
Methane emissions from degradable
organic carbon in treated wastewater
(tCO2eyr)
126 Calculated
Qwwy Quantity of wastewater treated in year y
(m3year) 333293
Volume based on 10 m3mt
FFB24 amp FFB historical data
(2009 ndash 2011)
CODwwdischargedPJ
y
Chemical oxygen demand of the treated
wastewater discharged into river in the
project situation in year y (tCOD m3)
0000642 10 days measurement
campaign
MCFwwPJ discharge
Methane correction factor based on
discharge pathway in the project situation
(river) of the wastewater (fraction)
01 MCF values as per table
IIIH1 Version 16
Boww Methane generation capacity of the treated
wastewater (kg CH4kg COD) 025 IPCC 2006
UFPJ Model correction factor to account for
model uncertainties 112 IPCC 2006
GWPCH4 Global warming potential of methane 21 IPCC 2006
B41) Methane fugitive emissions on account of inefficiencies in capture systems in the year ldquoyrdquo
(tonnes)
Equation 15 PEfugitivewwy = (1 ndash CFEww ) MEPywwtreatment GWPCH4
Abbreviation Description Value Source
PEfugitivey Methane fugitive emissions on account of
inefficiencies in capture systems (tCO2eyr) 3796 Calculated
CFEww Capture efficiency of the biogas recovery
equipment in the wastewater treatment
systems
09 AMS IIIH Version 16
MEPywwtreatment Methane emission potential of wastewater
treatment systems equipped with biogas
recovery system in year y (tCH4yr)
1808 Refer Equation 11 of AMS
IIIH version 16
GWPCH4 Global warming potential of methane 21 IPCC 2006
B42) Methane emission potential of wastewater treatment plant in the year ldquoyrdquo (tonnes)
Equation 16 MEPwwtreatmenty = Qwwy Boww UFPJ (CODremovedPJky MCFwwtreatmentPJk)
24 Mill designed data for baseline effluent treatment plant
PROJECT DESIGN DOCUMENT FORM (CDM-SSC-PDD) - Version 03
CDM ndash Executive Board
29
Abbreviation Description Value Source
MEPwwtreatmenty Methane emission potential of wastewater
treatment systems equipped with biogas
recovery system in year y (tonnes CH4yr)
1808 Calculated
Qyww Quantity of wastewater treated in year y
(m3year) 333293
Volume based on 10 m3mt
FFB25 amp FFB historical data
(2009 ndash 2011)
Boww Methane generation capacity of the treated
wastewater (kg CH4kg COD) 025 IPCC 2006
CODremovedPJy
The chemical oxygen demand removed by
the treatment anaerobic system of the
project activity equipped with biogas
recovery in the year y (tCOD m3)
0024214
10 days measurement
campaign amp bio-digester
design parameter
MCFwwtreatmentPJ
Methane correction factor for the project
wastewater treatment system k equipped
with biogas recovery equipment
08 MCF values as per table
IIIH1 Version 16
UFPJ Model correction factor to account for
model uncertainties 112 IPCC 2006
B5) Methane emissions due to incomplete flaring in the year ldquoyrdquo (tonnes)
Equation 13a PEflaringy = TMflaredy (1 - ηflarey) GWPCH4
Abbreviation Description Value Source
PEflaringy Methane emissions due to incomplete
flaring (tCO2eyr) 0 Calculated
TMflaredh Mass flow rate of methane flared in dry
basis in the hour h (tCH4 yr) 0 Calculated
ηflarey Flare efficiency in hour h based on default
values 50
Tools for methane flaring
(open flare) for conservative
GWPCH4 Global warming potential of methane 21 IPCC 2006
Leakage emissions
No leakage emission will occur in the project activity
LEy1 = 0
Emission reductions
Equation 22 ERy ex ante = BEy ex ante ndash (PEy ex ante + LEy ex ante)
25 Mill designed data for baseline effluent treatment plant
PROJECT DESIGN DOCUMENT FORM (CDM-SSC-PDD) - Version 03
CDM ndash Executive Board
30
Abbreviation Description Value Source
ERy1 ex ante Ex ante emission reduction in year y
(tCO2e) 24712 Equation 22
BEy1 ex ante Ex ante baseline emissions in year y
(tCO2e) 30762 Equation 1
PEy1 ex ante Ex ante project emissions in year y (tCO2e) 6050 Equation 8
LEy1 ex ante Ex ante Leakage emissions in year y
(tCO2e) 0 -
Calculation for AMS-ID
Baseline emissions
Electricity generated from biogas engines will be exported to the Peninsular Malaysia National Grid The
baseline emissions are described in AMS-ID (Version 17 EB 61) as the ldquoproduct of electrical energy
baseline expressed in kWh of electricity produced by the renewable energy generating unit multiplied by
an emission factorrdquo
Baseline emissions due to electricity exported to the grid in the year ldquoyrdquo (tonnes)
BEEGy = EGBLy EFCO2gridy
Abbreviation Description Value Source
BEEGy Baseline emissions in year y (tCO2eyr) 4568 Calculated
EGBLy
Quantity of net electricity supplied to the
grid as a result of the implementation of the
project activity in year y (kWh yr)
6797625 Calculated
EFCO2gridy
CO2 emission factor of the grid in year
(tCO2kWh) 0672
Study on Grid Connected
Electricity Baselines in
Malaysia 2008 published in
2010 by PTM
Project Activity Emissions
As per AMS-ID (Version 17 EB 61) project emissions for renewable energy project activities are zero
PEEGy = 0
Leakage
If the energy generating equipment is transferred from another activity leakage is to be considered
No leakage emission will occur in the project activity LEy = 0
PROJECT DESIGN DOCUMENT FORM (CDM-SSC-PDD) - Version 03
CDM ndash Executive Board
31
Emission reductions
ERy = BEy ndash PEy - LEy
Abbreviation Description Value Source
ERy Emission reduction in year y (tCO2ey) 4568 -
BEy Baseline emissions in year y (tCO2ey) 4568 -
PEy Project emissions in year y (tCO2ey) 0 -
LEy Leakage emissions in year y (tCO2ey) 0 -
Calculation for AMS-IA
Baseline emissions
The energy baseline is the fuel consumption of the technology in use or that would have been used in the
absence of the project activity to generate the equivalent quantity of energy Option 2 is applied This
methodology is only apply shall the recovered is in excess after export to the grid
Annual electricity sent to the mill for FF displacement in the year ldquoyrdquo (kWh)
EBLy = ΣEGiy (1 ndash l)
Abbreviation Description Value Source
EBLy Annual energy baseline (kWhyr) Calculated
EGiy
The estimated annual output of the
renewable energy technologies of the group
of i renewable energy technologies
installed (kWhyr)
0 Estimated
l
Average technical distribution losses that
would have been observed in diesel
powered mini-grids installed by public
programmes or distribution companies in
isolated areas expressed as a fraction
0 Conservative by applying
Zero (0)
Baseline electricity sent to the mill for FF displacement in the year ldquoyrdquo (tonnes)
BECO2y = EBLy EFCO2
Abbreviation Description Value Source
BECO2y Baseline emission in the year y (tCO2yr) 0 Calculated
EBLy Annual energy baseline (kWhyr) 0 Calculated
EFCO2 CO2 emission factor (tCO2kWh) 08
Default value which is
derived from diesel
generation units is used
PROJECT DESIGN DOCUMENT FORM (CDM-SSC-PDD) - Version 03
CDM ndash Executive Board
32
Project Activity Emissions
As per AMS-IA (Version 14 EB 54) project emissions for renewable energy project activities are zero
PEy = 0
Leakage
If the energy generating equipment is transferred from another activity or if the existing equipment is
transferred to another activity leakage is to be considered
No leakage emission will occur in the project activity LEy = 0
B53 Summary of the ex-ante estimation of emission reductions
Estimated emission reductions (total project activity)
Year
Estimation of
project activity
emissions (tCO2e)
Estimation of
baseline emissions
(tCO2e)
Estimation of
leakage (tCO2e)
Estimation of
overall emission
reductions (tCO2e)
2012 504 2944 0 2440
2013 6050 35330 0 29280
2014 6050 35330 0 29280
2015 6050 35330 0 29280
2016 6050 35330 0 29280
2017 6050 35330 0 29280
2018 6050 35330 0 29280
2019 5546 32386 0 26840
Total (tCO2) 42350 247310 0 204960
The starting date of the crediting period is 01122012 or the date of registration whichever is later
Estimated emission reductions for AMS-IIIH
Year
Estimation of
project activity
emissions (tCO2e)
Estimation of
baseline emissions
(tCO2e)
Estimation of
leakage (tCO2e)
Estimation of
overall emission
reductions (tCO2e)
2012 504 2563 0 2059
2013 6050 30762 0 24712
PROJECT DESIGN DOCUMENT FORM (CDM-SSC-PDD) - Version 03
CDM ndash Executive Board
33
2014 6050 30762 0 24712
2015 6050 30762 0 24712
2016 6050 30762 0 24712
2017 6050 30762 0 24712
2018 6050 30762 0 24712
2019 5546 28199 0 22653
Total (tCO2) 42350 215334 0 172984
The starting date of the crediting period is 01122012 or the date of registration whichever is later
Estimated emission reductions for AMS-ID
Year
Estimation of
project activity
emissions (tCO2e)
Estimation of
baseline emissions
(tCO2e)
Estimation of
leakage (tCO2e)
Estimation of
overall emission
reductions (tCO2e)
2012 0 381 0 381
2013 0 4568 0 4568
2014 0 4568 0 4568
2015 0 4568 0 4568
2016 0 4568 0 4568
2017 0 4568 0 4568
2018 0 4568 0 4568
2019 0 4187 0 4187
Total (tCO2) 0 31976 0 31976
The starting date of the crediting period is 01122012 or the date of registration whichever is later
Estimated emission reductions for AMS-IA
Year
Estimation of
project activity
emissions (tCO2e)
Estimation of
baseline emissions
(tCO2e)
Estimation of
leakage (tCO2e)
Estimation of
overall emission
reductions (tCO2e)
2012 0 0 0 0
2013 0 0 0 0
2014 0 0 0 0
2015 0 0 0 0
2016 0 0 0 0
PROJECT DESIGN DOCUMENT FORM (CDM-SSC-PDD) - Version 03
CDM ndash Executive Board
34
2017 0 0 0 0
2018 0 0 0 0
2019 0 0 0 0
Total (tCO2) 0 0 0 0
The starting date of the crediting period is 01122012 or the date of registration whichever is later
B6 Application of the monitoring methodology and description of the monitoring plan
B61 Description of the monitoring plan
The parameters to be monitored are
Please note that the amount of methane recovered and fuelled or flared (MDy ) is calculated as follows
MDy = TMfuelledy + TMflaredy Equation A
Where Description Units
MDy Quantity of methane recovered and fuelled or flared in the year y tonnes CH4year
TMfuelledy Quantity of methane fuelled in the year y tonnes CH4year
TMflaredy Quantity of methane flared in year y tonnes CH4year
Where
TMfuelledy = FVfuelledh fvCH4h ηfuelledh ρCH4n) 1000 Equation B
Where Description Units
TMfuelledy Quantity of methane fuelled in the year y tonnes CH4year
FVfuelledh Volumetric flow rate of the fuelled biogas gas at normal conditions in
hour h
Nm3 biogashour
ηfuelledh 100 for gainful purpose26
fvCH4h Volumetric fraction of methane in the biogas gas in the hour h
ρCH4n Density of methane at normal conditions kgCH4Nm3CH4
And
TMflaredy = FVflaredh fvCH4h ηflareh ρCH4n) 1000 Equation C
Where Description Units
TMflaredy Quantity of methane flared in year y tonnes CH4year
FVflaredh Volumetric flow rate of the flared biogas gas at normal conditions in
hour h
Nm3 biogashour
26 AMS-IIIH point 35
PROJECT DESIGN DOCUMENT FORM (CDM-SSC-PDD) - Version 03
CDM ndash Executive Board
35
ηflareh Flare efficiency in the hour h
fvCH4h Volumetric fraction of methane in the biogas gas in the hour h
ρCH4n Density of methane at normal conditions kgCH4Nm3CH4
Data Parameter ID1 Qwwy
Data unit m3 month
Description The flow of wastewater entering the bio-digester
Source of data Measurement by project participant by using a flowmeter
Value of data ~ 28000
Brief description of
measurement methods and
procedures to be applied
The flow is measured with an online flow meter or equivalent
QAQC procedures to be
applied (if any) Data are monitored continuously and recorded periodically
(monthly or at shorter interval) in a data log file (DLF)
Uncertainty level of data low
Maintenance and calibration as per manufacturer‟s specifications
or at least once every three (3) years
Any comment
Data Parameter ID2 CODwwuntreatedy
Data unit tCOD m3
Description Raw COD of wastewater entering the bio-digester
Source of data Laboratory (internal and external)
Value of data ~ 0030230
Brief description of
measurement methods and
procedures to be applied
Measure of COD according to national or international standards
COD is measure through representative sampling
QAQC procedures to be
applied (if any) Minimum once a month COD sampling to ensure a 9010
confidenceprecision level
COD reports are recorded manually
Uncertainty level of data low
Maintenance and calibration as per manufacturer‟s specifications
or at least once every three (3) years for internal laboratory
equipment
Any comment
Data Parameter ID3 CODwwtreatedy
Data unit tCOD m3
Description COD of treated wastewater leaving the bio-digester
Source of data Laboratory (internal and external)
Value of data ~ 0003023
Brief description of
measurement methods and
procedures to be applied
Measure of COD according to national or international standards
COD is measure through representative sampling
QAQC procedures to be
applied (if any) Minimum once a month COD sampling to ensure a 9010
confidenceprecision level
COD reports are recorded manually
Uncertainty level of data low
PROJECT DESIGN DOCUMENT FORM (CDM-SSC-PDD) - Version 03
CDM ndash Executive Board
36
Maintenance and calibration as per manufacturer‟s specifications
or at least once every three (3) years for internal laboratory
equipment
Any comment
Data Parameter ID5 End-use of the final sludge
Data unit ndash
Description The final sludge generated by the project activity will be sent to control
landfill site if any
Source of data By project participant
Value of data ndash
Brief description of
measurement methods and
procedures to be applied
The final disposal of the sludge will be monitored during the crediting
period if any For each disposal of the sludge the following will be
recorded disposal site and date of disposal
QAQC procedures to be
applied (if any)
Any comment
Data Parameter ID6 FVflaredh
Data unit Nm3 hour
Description Volumetric flow of biogas recovered and flared at normal conditions in
the hour h
Source of data By project participant
Value of data 0
Brief description of
measurement methods and
procedures to be applied
The volume of biogas will be measured with a normalised flow meter or
calculated from the volumetric flow pressure temperature
Biogas volume and methane content measurements shall be on the same
basis (wet or dry)
QAQC procedures to be
applied (if any) The biogas flow is monitored continuously recorded and stored
electronically in a data log file (DLF) (monthly or at shorter
interval)
Data Parameter ID4 CODww dischargey
Data unit tCOD m3
Description COD of treated wastewater discharge into river by treatment system
Source of data Laboratory (internal and external)
Value of data ~ 0000100
Brief description of
measurement methods and
procedures to be applied
Measure of COD according to national or international standards
COD is measure through representative sampling
QAQC procedures to be
applied (if any) Minimum once a month COD sampling to ensure a 9010
confidenceprecision level
COD reports are recorded manually
Uncertainty level of data low
Maintenance and calibration as per manufacturer‟s specifications
or at least once every three (3) years for internal laboratory
equipment
Any comment
PROJECT DESIGN DOCUMENT FORM (CDM-SSC-PDD) - Version 03
CDM ndash Executive Board
37
Uncertainty level of data low
Maintenance and calibration as per manufacturer‟s specifications
or at least once every 3 years
Any comment
Data Parameter ID7 FVfuelledgas engineh
Data unit Nm3 hour
Description Volumetric flow of biogas recovered and fuelled (gas engine) at normal
conditions in the hour h
Source of data By project participant
Value of data ~ 509
Brief description of
measurement methods and
procedures to be applied
The volume of biogas will be measured with a normalised flow meter or
calculated from the volumetric flow of biogas pressure temperature
Biogas volume and methane content measurements shall be on the same
basis (wet or dry)
QAQC procedures to be
applied (if any) The biogas flow is monitored continuously recorded and stored
electronically in a data log file (DLF) (monthly or at shorter
interval)
Uncertainty level of data low
Maintenance and calibration as per manufacturer‟s specifications
or at least once every 3 years
Any comment
Data Parameter ID8 FVfuelledboilerh
Data unit Nm3 hour
Description Volumetric flow of biogas recovered and fuelled (boilers) at normal
conditions in the hour h
Source of data By project participant
Value of data ~ 0
Brief description of
measurement methods and
procedures to be applied
The volume of biogas will be measured with a normalised flow meter or
calculated from the volumetric flow of biogas pressure temperature
Biogas volume and methane content measurements shall be on the same
basis (wet or dry)
QAQC procedures to be
applied (if any) The biogas flow is monitored continuously recorded and stored
electronically in a data log file (DLF) (monthly or at shorter
interval)
Uncertainty level of data low
Maintenance and calibration as per manufacturer‟s specifications
or at least once every 3 years
Any comment
Data Parameter ID9 wCH4h
Data unit
Description Methane content in biogas in same basis (wetdry) as the biogas flows in
year y
Source of data By project participant using a gas analyzer
Value of data ~ 60
PROJECT DESIGN DOCUMENT FORM (CDM-SSC-PDD) - Version 03
CDM ndash Executive Board
38
Brief description of
measurement methods and
procedures to be applied
Using calibrated gas analyzer either continuous or periodical
measurement at confidenceprecision level of 9010
QAQC procedures to be
applied (if any) In case a continuous gas analyser is used data will be recorded
and stored electronically in a data log file (DLF) every hour or at
shorter interval
Uncertainty level of data low
Maintenance and calibration as per manufacturer‟s specifications
or at least once every 3 years
Any comment See also clarification by EB Meth Panel 30102009 ndash SSC_360
httpcdmunfcccintUserManagementFileStorageAM_CLAR_
QS83SX5B7WM6UGZE31JYQEQ4F65F6V
The biogas flow and the methane content measurements shall be
carried out close to each others
Data Parameter ID10 Tbiogas
Data unit ordmC
Description Temperature of biogas
Source of data Temperature probe
Value of data 20 ndash 65
Brief description of
measurement methods and
procedures to be applied
By project participant
QAQC procedures to be
applied (if any) Shall be measured and recorded at the same time when methane
content in biogas (ID8) is measured
Uncertainty level of data low
Maintenance and calibration as per manufacturer‟s specifications
or at least once every 3 years
Any comment Pressure and temperature are required to determine the density of
the methane If the biogas flow meter employed measures flow
pressure and temperature and displaysoutputs normalised flow of
biogas there is no need to separate monitoring of pressure and
temperature of the biogas
Data Parameter ID11 Pbiogas
Data unit Bar(g)
Description Pressure of biogas
Source of data By project participant
Value of data 50 ndash 200 mbar
Brief description of
measurement methods and
procedures to be applied
Pressure measurement device
QAQC procedures to be
applied (if any) Shall be measured and recorded at the same time when methane
content in biogas (ID8) is measured
Uncertainty level of data low
Maintenance and calibration as per manufacturer‟s specifications
or at least once every three (3) years
Any comment Pressure and temperature are required to determine the density of
the methane If the biogas flow meter employed measures flow
PROJECT DESIGN DOCUMENT FORM (CDM-SSC-PDD) - Version 03
CDM ndash Executive Board
39
pressure and temperature and displaysoutputs normalised flow of
biogas there is no need to separate monitoring of pressure and
temperature of the biogas
Shall be measured at the same time when methane content in
biogas (ID9) is measured
Parameter ID12 ηflareh (enclosed flare)
Unit
Description Enclosed flare efficiency in the hour h
Source of data Calculated
Value of data 0 or 50 or 90
Brief description of
measurement methods and
procedures to be applied
This yearly efficiency will be based on hourly flare efficiencies calculated
as per the provisions in the ldquoTool to determine project emissions from
flaring gases containing methanerdquo
The hourly flare efficiency will be calculated based on
0 if the temperature in the exhaust gas of the flare (Tflare) is
below 500 degC for more than 20 minutes during the hour h
50 if the temperature in the exhaust gas of the flare (Tflare) is
above 500 degC for more than 40 minutes during the hour h but the
manufacturer‟s specifications on proper operation of the flare are
not met at any point in time during the hour h
90 if the temperature in the exhaust gas of the flare (Tflare) is
above 500 degC for more than 40 minutes during the hour h and the
manufacturer‟s specifications on proper operation of the flare are
met continuously during the hour h
QAQC procedures to be
applied (if any) Data are logged hourly in a data log file (DLF)
Uncertainty level of data low
Any comment For enclosed flare
Or
Parameter ID13 ηflareh (open flare)
Unit
Description Flare efficiency in the hour h
Source of data Calculated
Value of data 0 or 50
Brief description of
measurement methods and
procedures to be applied
This yearly efficiency will be based on hourly flare efficiencies calculated
as per the provisions in the ldquoTool to determine project emissions from
flaring gases containing methanerdquo
The hourly flare efficiency will be calculated based on the duration of
time during which the flame is detected by the thermocouple (or flame
detector) installed in the open flare
Flare efficiency in hour h is based on default values
0 if the flame detected for not more than 20 minutes during the
hour h and
PROJECT DESIGN DOCUMENT FORM (CDM-SSC-PDD) - Version 03
CDM ndash Executive Board
40
50 if the flame detected for more than 20 minutes during the
hour h
A flame detector or thermocouple will be used
QAQC procedures to be
applied (if any) Data are logged hourly in a data log file (DLF)
Uncertainty level of data low
Any comment The only monitored parameter related to the flare is its efficiency Indeed
according to the clarification SSC_19927 of the methodology AMS IIIH
version 9 accepted by the SSC WG on the 3092008 ldquoIf a thermocouple
is used as a flame detection system it is sufficient to reach the given
minimum temperature from the manufacturer ldquo Hence it is not necessary
to monitor the temperature of the open type flares (Tflare)
Data Parameter ID14 ECPJjy
Data unit MWh
Description The yearly grid electricity consumption of the project activity for the year
bdquoy‟
Source of data Onsite instrument
Value of data ~749
Brief description of
measurement methods and
procedures to be applied
The grid electricity consumption of the project activity is measured
continuously with an energy meter (cumulative reading)
QAQC procedures to be
applied (if any) Data are monitored continuously and recorded periodically
(yearly or at shorter interval) in a data log file (DLF)
Uncertainty level of data low
Maintenance and calibration as per manufacturer‟s specifications
or at least once every three (3) years
Any comment
Data Parameter ID15 EGBLy
Data unit MWh
Description Quantity of net electricity generated and send to grid in year y
Source of data By project participant
Value of data ~ 6798
Brief description of
measurement methods and
procedures to be applied
The electricity generated and sent to grid is measured continuously with
an energy meter (cumulative readings)
QAQC procedures to be
applied (if any) Data are monitored continuously and recorded periodically
(yearly or at shorter interval) in a data log file (DLF)
Uncertainty level of data low
Maintenance and calibration as per manufacturer‟s specifications
or at least once every 3 years
Any comment As per AMS-ID
27 The clarification SSC_199 if available here (last access on the 24052011)
httpcdmunfcccintfilestorageAM_AM_CLAR_HIOZ5CS1PASC187C0JQ668L2E9RCRJResponse20WG20provided
20at20SSC20WG2017pdft=bU98MTMwNjIxNjY0OS4xMQ==|BOKHqtO94N6XF1N2N1vo8Ori-Rc=
PROJECT DESIGN DOCUMENT FORM (CDM-SSC-PDD) - Version 03
CDM ndash Executive Board
41
Or
Data Parameter ID16 EGmilly
Data unit MWh
Description Quantity of annual output of renewable energy sent to the mill in year y
Source of data By project participant
Value of data ~ 0
Brief description of
measurement methods and
procedures to be applied
The electricity generated and sent to mill to displace diesel use in diesel
gensets is measured continuously with an energy meter (cumulative
readings)
QAQC procedures to be
applied (if any) Data are monitored continuously and recorded periodically
(yearly or at shorter interval) in a data log file (DLF)
Uncertainty level of data low
Maintenance and calibration as per manufacturer‟s specifications
or at least once every 3 years
Any comment As per AMS-IA
Data Parameter ID17 Displacement of Biomass
Data unit Mt
Description Total amount of biomass (PKS) displaced from biomass boilers
Source of data Weighing bridge
Value of data Measurement at site
Brief description of
measurement methods and
procedures to be applied
Biomass (PKS) displaced due to the project activity will be weighed
using weighing bridge at the palm oil mill
QAQC procedures to be
applied (if any) Monthly calculation based on every single trip of trucks recorded
Data is recorded manually in a data log file based on the weighing
records
Maintenance and calibration as per manufacturer‟s specifications
Uncertainty level of data low
Any comment In the project activity the biomass (PKS) displaced will not be stored
under anaerobic conditions The conditions of onsite storage are identical
in the baseline as in the project activity The biomass will be sold to the
market on a regular basis PEbiomassy = 0
A final monitoring plan will be prepared prior the initial verification based on the as-built project activity
It will address the following aspects
MONITORING
The Project will be managed by CME with the involvement from Project Implementer CME will ensure
safety in operation of the plant as well as in the monitoring of emission reduction which is generated from
the project activity
CME will implement and be responsible for the monitoring plan Their responsibility covers operation of
the monitoring maintenance of the monitoring equipment data collection and archiving and
management of total scheme of the monitoring CME and Project Implementer will assign specific trained
PROJECT DESIGN DOCUMENT FORM (CDM-SSC-PDD) - Version 03
CDM ndash Executive Board
42
personnel during project implementation for the overall monitoring measurement and reporting of key
parameters as required in this PDD
DATA LOGGING AND STORAGE
The data measured by the instruments will be collected and stored in a data logging system The data will
be retrieved remotely by modem or directly on site
If data cannot be retrieved no emissions reductions will be claimed for the period of data failure The
data collected will be recorded in a central data base Access to production data will be restricted All
records and data (hard copy and soft copy) will be archived up to two years after the end of the crediting
period or the last issuance of CERs for this project activity whichever occurs later
CALIBRATION AND MAINTENANCE PROCEDURES MALFUNCTION OF EQUIPMENT
Maintenance includes all preventive and corrective actions necessary for the good functioning of the
equipment such as
Visual control of the equipment state and real-time check of displayed parameters
Cleaning up the equipment and the sensors
Adding lubricant
Replacement and change of defective parts
Calibration of equipment consists in verifying by comparison with a standard the accuracy of a
measuring instrument
Measuring instruments will be periodically and appropriately calibrated according to the procedures
timing and methods recommended by the manufacturer or nationalinternational standards as available
General malfunction of equipment
Daily inspections of the equipment will allow controlling equipment failure If equipment fails the
supplier will be notified and repairs will be carried out If the damaged equipment cannot be repaired it
will be replaced at the earliest In some cases portable tools will be used in order to carry out daily
monitoring of the missing parameter(s) In such case this data will be recorded manually
Discrepancies
To avoid discrepancies between projected data in the PDD and actual data (eg due to deferred starting
date malfunction of equipment) cross-checks between internal meter readings and external sources (eg
electricity invoices) will be carried out Any source of inconsistencies will be clarified
Case of emergency
For the case of emergency (earthquakes explosions fires etc) an emergency preparedness plan will be
adapted to the project activity All employees involved in the project on-site will be trained in the code of
conduct and required actions at time of commissioning of the plant
PROJECT DESIGN DOCUMENT FORM (CDM-SSC-PDD) - Version 03
CDM ndash Executive Board
43
OPERATIONAL AND MANAGEMENT STRUCTURE
The CDM monitoring team will be composed by the following staff
Position Report to
Operators
Project owner Supervisors (technicalmaintenance)
Operation Engineer
CDM monitoring project manager External CDM consultant
TRAINING OF MONITORING PERSONNEL
The maintenance will be conducted in-house by staff employed and trained by the Project Participants
Employees involved in the monitoring will be trained internally andor externally Training may include
inter alia
a) Review of equipment and captors
b) Calibration requirement
c) Configuration of monitoring equipment
d) Maintenance requirement
C1 Please indicate the level at which environmental analysis as per requirements of the CDM
modalities and procedures is undertaken Justify the choice of level at which the environmental
analysis is undertaken
radic Please tick if this information is provided at the PoA level In this case sections C2 and C3
need not be completed in this form
C2 Documentation on the analysis of the environmental impacts including transboundary
impacts
The host country does not require an analysis of environmental impacts As the project involves reduction
of GHG through recovery and controlled combustion which improves the quality of air therefore there
are no significant environmental impacts identified
C3 Please state whether an environmental impact assessment is required for a typical CPA
included in the programme of activities (PoA) in accordance with the host Party lawsregulations
In accordance with Malaysia environmental regulations Environmental Quality (Prescribed Activities
Environmental Impact Assessment) Order 1987 an Environmental Impact Assessment (EIA) is not
required for this CPA
PROJECT DESIGN DOCUMENT FORM (CDM-SSC-PDD) - Version 03
CDM ndash Executive Board
44
SECTION D Stakeholdersrsquo comments
D1 Please indicate the level at which local stakeholder comments are invited Justify the
choice
Please tick if this information is provided at the PoA level In this case sections D2 to D4 need
not be completed in this form
D2 Brief description how comments by local stakeholders have been invited and compiled
The stakeholder meeting was conducted at the office of Kilang Sawit Felda Triang on 05032012 There
were 37 stakeholders attending the consultation Posters were pasted at the guard house and at the
entrance to office 1 week before the stakeholder consultation to inform the locals stakeholders which
comprise mostly the workers of the mill 20 stakeholders out of the 37 who attended the consultation are
2nd generation of the Felda settlers who live in the vicinity to the project activity and adequately represent
the local community composed entirely of Felda settlers (no other people live in the vicinity of this
remote plantation) Continuous input of ideascomments were allowed to all stakeholders who could
either send their input though an email account especially setup for the biogas project or directly inform
the project proponents
During the meeting presentations were made by the project owner to outline the proposed project activity
in a non-technical manner (including environmental social and technological considerations) climate
change and the role of the CDM Attendees were given opportunity to raise their concern and opinion
about the proposed project activity during the question and answer session
D3 Summary of the comments received
PROJECT DESIGN DOCUMENT FORM (CDM-SSC-PDD) - Version 03
CDM ndash Executive Board
45
Below are the questions raised during the stakeholder meeting
NAME QUESTION
Mohd Tarmizi Bin Mat
Daud What is CDM in Bahasa Malaysia
Mohd Tarmizi Bin Mat
Daud What is DoE‟s standard for treated water released into river
Mohd Azizi Bin Abdul
Aziz
Would the biogas be captured from the existing effluent treatment ponds or a
new structure
Azhar Bin Abdul What to do with the captured biogas from the bioreactor
D4 Report on how due account was taken of any comments received
Below are the answers to the questions asked during the stakeholder meeting
QUESTION ANSWER
What is CDM in Bahasa Malaysia
The meaning of CDM in Bahasa Malaysia is Mekanisme
Pembangunan Bersih or in English is Clean Development
Mechanism
By Abd Karim Bin Mohd Zin
What is DoE‟s standard for treated
water released into river
The discharge standard for BOD into river is less than 100ppm
By Abd Karim Bin Mohd Zin
Would the biogas be captured from
the existing effluent treatment
ponds or a new structure
New bioreactor will be constructed to replace the existing anaerobic
lagoon treatment system The new bioreactor will capture the
biogas produced from this anaerobic treatment process
By Abd Karim Bin Mohd Zin
What to do with the captured
biogas from the bioreactor
The biogas recovered from the bioreactor will mainly contain
methane (approximately 60) and the rest are CO2 H2 and H2S
Currently the biogas is just released to the atmosphere from the
existing open lagoons system During the project activity captured
biogas will be combusted thus will improve the air quality
By Abd Karim Bin Mohd Zin
PROJECT DESIGN DOCUMENT FORM (CDM-SSC-PDD) - Version 03
CDM ndash Executive Board
46
Annex 1
CONTACT INFORMATION ON ENTITYINDIVIDUAL RESPONSIBLE FOR THE SMALL-
SCALE CPA
Organization Felda Palm Industries Sdn Bhd (359584-V)
StreetPOBox Jalan Gurney 1
Building Balai Felda 4th Floor
City Kuala Lumpur
StateRegion Wilayah Persekutuan
PostfixZIP 54000
Country Malaysia
Telephone (03) 2692 8066
FAX (03) 2693 4148
URL wwwfeldanetmy
Represented by
Title Head of Department
Salutation Mr
Last Name Busu
Middle Name
First Name Zainuri
Department Biomass
Mobile
Direct FAX
Direct tel
Personal E-Mail zainuribfeldanetmy
Organization Ably Carbon Sdn Bhd
StreetPOBox Jalan Ipoh Kecil
Building No 17
City Kuala Lumpur
StateRegion
PostfixZIP 50350
Country Malaysia
Telephone +60 3 4042 1177
FAX +60 3 4044 4166
E-Mail stephanevidailletably-carboncom
URL
Represented by Stephane Vidaillet
Title Chairman
Salutation Mr
Last Name Vidaillet
Middle Name
First Name Steacutephane
Department
Mobile +33 6 59111 5600
Direct FAX
PROJECT DESIGN DOCUMENT FORM (CDM-SSC-PDD) - Version 03
CDM ndash Executive Board
47
Direct tel
Personal E-Mail stephanevidailletably-carboncom
PROJECT DESIGN DOCUMENT FORM (CDM-SSC-PDD) - Version 03
CDM ndash Executive Board
48
Annex 2
INFORMATION REGARDING PUBLIC FUNDING
The project activity is not receiving any funding from parties included in Annex 1 of the Kyoto Protocol
SMALL-SCALE CDM PROGRAMME ACTIVITY DESIGN DOCUMENT FORM (CDM-SSC-CPA-DD) - Version 01
NAME TITLE OF THE PoA Biogas Recovery and Utilization PoA Projects in
Malaysia
CDM ndash Executive Board page 49
This template shall not be altered It shall be completed without modifyingadding headings or logo format or font
Annex 3
BASELINE INFORMATION
1 2
Year 2009 2010 2011 2012 2013 2014
FFB (mtyr) 343720 345910 310250 333293 333293 333293
POME Volume
(cumyr)[1] 343720 345910 310250 333293 333293 333293
Mill Opearing hour (hryr) 68865 69225 6209 6673 6673 6673
PKS (mtyr) 18905 19025 17064 18331 18331 18331
3 4 5 6 7 8 9 10
2015 2016 2017 2018 2019 2020 2021 2022
333293 333293 333293 333293 333293 333293 333293 333293
333293 333293 333293 333293 333293 333293 333293 333293
6673 6673 6673 6673 6673 6673 6673 6673
18331 18331 18331 18331 18331 18331 18331 18331
SMALL-SCALE CDM PROGRAMME ACTIVITY DESIGN DOCUMENT FORM (CDM-SSC-CPA-DD) - Version 01
NAME TITLE OF THE PoA Biogas Recovery and Utilization PoA Projects in
Malaysia
CDM ndash Executive Board page 50
This template shall not be altered It shall be completed without modifyingadding headings or logo format or font
10 days measurement campaign for baseline wastewater treatment system
Day Date
ETP
Inlet
Anaerobic
system (mgl)
Outlet
Anaerobic
system (mgl)
Outlet Algae
System (mgl)
Final
Discharge to
River (mgl)
1 23-Feb-12 35693 3120 811 603
2 25-Feb-12 19511 2559 1186 83
3 26-Feb-12 32864 2767 749 437
4 27-Feb-12 30195 2330 1210 404
5 28-Feb-12 32436 1927 1188 941
6 29-Feb-12 38259 4256 896 717
7 1-Mar-12 28717 3584 1232 695
8 3-Mar-12 31002 4660 1658 1210
9 4-Mar-12 22400 4346 1389 963
10 5-Mar-12 31226 4301 1971 1165
Average 30230 3385 1229 722
ETP
COD removal efficiency (anaerobic system) 8880
COD removal efficiency (Facultativealgae system) 6369
COD removal efficiency (Bio-polishing system) 4127
Total COD removal efficiency of the treatment system 9761
The COD of the raw effluent during ex-post may vary from the one year historical records depending on
the improvement of the production process (outside of project boundary) thus ERex-post may vary from the
estimated ERex-ante
SMALL-SCALE CDM PROGRAMME ACTIVITY DESIGN DOCUMENT FORM (CDM-SSC-CPA-DD) - Version 01
NAME TITLE OF THE PoA Biogas Recovery and Utilization PoA Projects in
Malaysia
CDM ndash Executive Board page 51
This template shall not be altered It shall be completed without modifyingadding headings or logo format or font
Annex 4
MONITORING INFORMATION
General information
Monitoring refers to the collection and archiving of all relevant data necessary for determining the
baseline measuring anthropogenic emissions by sources of greenhouse gases (GHG) within the project
boundary of a CDM project activity and leakage It includes developing suitable data collection methods
and data interpretation techniques for monitoring and verification of GHG emissions
On-line monitoring system
Most key meters required to determine GHG emissions and emission reductions will be monitored from a
central control point which will record meter readings at a pre-determined interval
Ensuring adequate maintenance and calibration of monitoring instruments
Specific maintenance repair or replacement of monitoring equipment will be recorded dated and
described
The calibration will occur at intervals determined on the basis of instrument manufacturers
recommendations stability purpose usage and history of repeatability Recalibration should be
performed whenever an event occurs that places the accuracy of the instrument in doubt
Calibration will take place at least once every three (3) years to ensure that the monitoring
equipments are properly installed and functioning properly
Calibration will be performed according to national or international standards
Last calibration certificates will be provided during periodic verification
Sampling procedure
Wherever a statistical sample is used for monitoring the ldquogeneral guidelines for sampling and surveys for
SSC project activitiesrdquo shall be used COD shall be measured from a composite sample to obtain a
representative value
Data archiving
The monitored data will be kept for a minimum of 2 years after the end of the crediting years by using
paper documents or electronic files
Identification of non-conformities
A verification of inconsistencies of the data recorded will be performed based for example on
The comparison of the calculated quantities of methane versus expected
Spot checks of field instruments (local reading) and data in the log file
Any discrepancies (completeness calculation errors transcription errors instrument calibration issues)
will be analyzed and actions taken to correct the problem
Ensuring adequate training of staff
All new staff members will undergo bdquoon job training‟ covering the monitoring requirements
The monitoring plan will be made available to staff member involved in the monitoring
A copy will be located in the control room at the site
SMALL-SCALE CDM PROGRAMME ACTIVITY DESIGN DOCUMENT FORM (CDM-SSC-CPA-DD) - Version 01
NAME TITLE OF THE PoA Biogas Recovery and Utilization PoA Projects in
Malaysia
CDM ndash Executive Board page 52
This template shall not be altered It shall be completed without modifyingadding headings or logo format or font
During the training the employees will sign a training attendance list All training records shall
be documented inclusive of training attendance training memo and training material if any

PROJECT DESIGN DOCUMENT FORM (CDM-SSC-PDD) - Version 03
CDM ndash Executive Board
4
The recovery of biogas reduces odour and prevents methane emissions The covered lagoon system
is expected to be able to achieve 90 COD treatment efficiency The covered lagoon will utilize
biogas for mixing to enhance the anaerobic processes in the system The biogas mixing will ensure
the POME is well-mixed and homogenized in the digester tank for optimum system performance
Treated POME from the covered lagoon will send to existing Facultative Algae lagoons system and
bio-polishing system for further treatment to reduce the BODCOD to meet the discharge standard
before discharging to the watercourse5 Existing anaerobic lagoons will be closed after the treatment
systems is stable and achieving the discharge standard
b) Flaring system
Enclosed or open flare will be utilized to burn the excess of biogas in case of maintenance of the gas
engine(s) boiler(s) in case no gas engine(s) boiler is installed or during emergency
c) Gainful use of biogas
The technology that will be used is environmentally safe and sound the renewable based captive
power plant that will be installed will improve the security on site by controlling methane emissions
The recovered biogas will be gainfully use and it is depending on the final requirement of energy by
the mill
Recovered biogas may be combusted in gas engines for grid export andor utilisation at the mill
while balance of biogas (if any) is sent to existing biomass boiler(s) for heat generation and thus
displacing biomass (Palm Kernel Shell (PKS)) excess biogas will be combusted either in enclosed
or open flare equipped with safety features The flare type to be installed is not defined yet it might
be an enclosed flare or an open flare Flare(s) will be operating whenever suitable in case engines or
biomass boiler(s) are unavailable
According to theoretical volumes of biogas to be captured the installed capacity of the power plant
is likely to be 12 MW or more For 12 MW engine the electrical efficiency is around 41
(assumptions for ex-ante calculations)Bio-scrubber and gas drying system will be installed before
the biogas is combusted in the gas engine(s)
The equipments maybe connected to the public grid electricity system to satisfy their energy needs
and may use back-up such as reciprocating engines or other source of energy
The operational lifetime of the equipment is expected to be 20 years if the maintenance is performed
correctly No technology substitution is expected during the crediting period unless if it appears that
the chosen capacity is not adapted to the actual flow or if the equipment is damaged
5 SD 1 - Mill License EQA 1974
PROJECT DESIGN DOCUMENT FORM (CDM-SSC-PDD) - Version 03
CDM ndash Executive Board
5
MILL
Cooling Pond tower
Gas engine(s) Biogas
Project activity
Covered lagoon
River
Final Discharge
Bio-Polishing system
Effluent
Biogas
Enclosed Open flare
Excess biogas
Raw POME
Electricity
Facultative + Algae lagoons
Treated Effluent
Excess Sludge
Land application
To gird andor mill
Existing biomass boiler(s)
Electricity import from Grid for biogas plant
Heat
Displace PKS
Figure A1 Flow diagram of the Project Activity
A41 Identification of the small-scale CPA
A411 Host Party
The host party of this CPA is Malaysia
A412 Geographic reference or other means of identification allowing the
unique identification of the small-scale CPA (maximum one page)
Table A1 Details of the geographic reference of CPA
Name of entity responsible for CPA Felda Palm Industrial Sdn Bhd
Contact details of entity responsible for CPA Jabatan Biomass Tingkat 4 Balai Felda Jalan
Gurney Satu 54000 Kuala Lumpur Malaysia
Tel +603 2692 8066 Fax +603 2691 2563
CityTownCommunity Kuala Lumpur
RegionStateProvince Kuala Lumpur
Country Malaysia
Geographic coordinates of the site 3 16152 N 102 34567 E OR 32692 1025761
A map indicating the location of the CPA site is given below
PROJECT DESIGN DOCUMENT FORM (CDM-SSC-PDD) - Version 03
CDM ndash Executive Board
6
Figure A2 Location of the Project Activity
A42 Duration of the small-scale CPA
A421 Starting date of the small-scale CPA
Starting date of the CPA will be the date on which the Engineering Procurement and Construction (EPC)
contract for the CPA will be awarded The EPC contract for the CPA has not yet been awarded
The start date of the CPA is not or will not be prior to the commencement of validation of the PoA
A422 Expected operational lifetime of the small-scale CPA
The operational lifetime of the CPA will be 20 years
A43 Choice of the crediting period and related information
Renewable crediting period
A431 Starting date of the crediting period
01122012 or the date of its inclusion in the PoA whichever is later
A432 Length of the crediting period first crediting period if the choice is
renewable CP
PROJECT DESIGN DOCUMENT FORM (CDM-SSC-PDD) - Version 03
CDM ndash Executive Board
7
The length of the first crediting period of the CPA6 will be 7 years
A44 Estimated amount of emission reductions over the chosen crediting period
Years Annual estimation of emission reductions in tonnes of CO2e
2012 2440
2013 29280
2014 29280
2015 29280
2016 29280
2017 29280
2018 29280
2019 26840
Total estimated reductions
(tonnes of CO2e) 204960
Total number of crediting years 7
Annual average over the crediting
period of estimated reductions
(tonnes of CO2e)
29280
The starting date of the crediting period is 01122012 or the date of its inclusion in the PoA whichever
is later
A45 Public funding of the CPA
The project has not received and will not be seeking public funding from Annex 1 countries
A46 Information to confirm that the proposed small-scale CPA is not a de-bundled
component
1 For the purposes of registration of a Programme of Activities (PoA)7 a proposed small-scale CPA
of a PoA shall be deemed to be a de-bundled component of a large scale activity if there is
already an activity8 which
(a) Has the same activity implementer as the proposed small scale CPA or has a coordinating
or managing entity which also manages a large scale PoA of the same sectoral scope and
(b) The boundary is within 1 km of the boundary of the proposed small-scale CPA at the
closest point
6 Please note that the duration of crediting period of any CPA shall be limited to the end date of the PoA regardless of when
the CPA was added 7 Only those POAs need to be considered in determining de-bundling that are (i) in the same geographical area and (ii) use
the same methodology as the POA to which proposed CPA is being added 8 Which may be a (i) registered small-scale CPA of a PoA (ii) an application to register another small-scale CPA of a PoA or
(iii) another registered CDM project activity
PROJECT DESIGN DOCUMENT FORM (CDM-SSC-PDD) - Version 03
CDM ndash Executive Board
8
2 If a proposed small-scale CPA of a PoA is deemed to be a debundled component in accordance
with paragraph 2 above but the total size of such a CPA combined with a registered small-scale
CPA of a PoA or a registered CDM project activity does not exceed the limits for small-scale
CDM and small-scale AR project activities as set out in Annex II of the decision 4CMP1 and
5CMP1 respectively the CPA of a PoA can qualify to use simplified modalities and procedures
for small-scale CDM and small-scale AR CDM project activities
The CPA implementer is also implementing other methane recovery project activities but these projects
are more than 1km away from the proposed small-scale CPA at the closest point Therefore the proposed
CPA is not a de-bundled component of a large scale project activity as it does not satisfy any of the above
provisions
A47 Confirmation that small-scale CPA is neither registered as an individual CDM
project activity or is part of another Registered PoA
The project information of this CPA has been checked against the PoA and CDM database available on
UNFCCC website and no duplicate entries were identified It is confirmed that the proposed CPA is
neither registered as an individual CDM project activity nor is part of another PoA This has also been
confirmed by the project implementer Felda Palm Industrial Sdn Bhd
SECTION B Eligibility of small-scale CPA and Estimation of emissions reductions
B1 Title and reference of the Registered PoA to which small-scale CPA is added
Regional Biogas PoA
Version 10
Date 12032012
B2 Justification of the why the small-scale CPA is eligible to be included in the Registered PoA
Table B1 Eligibility of CPA to be included in the Registered PoA
Ndeg Criteria Justification
1 Geographical boundary The CPA takes
place within the borders of Malaysia
The proposed CPA-1 is located in the state of
Pahang Malaysia with GPS coordinates of 3
16152 N 102 34567 E OR 32692 1025761
2 No double counting
The CPA is not already included in another
PoA or developed as a stand-alone CDM
project
The proposed CPA is not already included in
another PoA or developed as a stand-alone CDM
project
PROJECT DESIGN DOCUMENT FORM (CDM-SSC-PDD) - Version 03
CDM ndash Executive Board
9
3
Applicability conditions of AMS-IIIH
a) Substitution of aerobic wastewater or
sludge treatment systems with anaerobic
systems with biogas recovery and
combustion
b) Introduction of anaerobic sludge
treatment system with biogas recovery
and combustion to a wastewater
treatment plant without sludge
treatment
c) Introduction of biogas recovery and
combustion to a sludge treatment
system
d) Introduction of biogas recovery and
combustion to an anaerobic wastewater
treatment system such as anaerobic
reactor lagoon septic tank or an on site
industrial plant
e) Introduction of anaerobic wastewater
treatment with biogas recovery and
combustion with or without anaerobic
sludge treatment to an untreated
wastewater stream
f) Introduction of a sequential stage of
wastewater treatment with biogas
recovery and combustion with or
without sludge treatment to an
anaerobic wastewater treatment system
without biogas recovery (eg
introduction of treatment in an
anaerobic reactor with biogas recovery
as a sequential treatment step for the
wastewater that is presently being
treated in an anaerobic lagoon without
methane recovery)
The CPA is applying Option (f)
Introduction of a sequential stage of wastewater
treatment with biogas recovery and combustion
with or without sludge treatment to an anaerobic
wastewater treatment system without biogas
recovery (eg introduction of treatment in an
anaerobic reactor with biogas recovery as a
sequential treatment step for the wastewater that is
presently being treated in an anaerobic lagoon
without methane recovery)
4(a) The recovered methane measured may also
be utilized for thermal or mechanical
electrical generation directly ndash AMS-IIIH
para 3(a)
The recovered biogas may be used for electricity
generation through combustion in biogas engine(s)
system andor biomass boiler(s) for heat
generation Excess biogas if any will be flared
This in compliance with only AMS-IIIH
paragraph 3(a) and not the others
4(b) The recovered methane measured may also
be utilized for thermal or mechanical
electrical energy generation after bottling of
upgraded biogas ndash AMS-IIIH para 3(b)
Not applicable
4(c) The recovered methane measured may also
be utilized for thermal or mechanical
electrical energy generation after upgrading
and distribution ndash AMS-IIIH para 3(c)
Not applicable
4(d) The recovered methane measured may also Not applicable
PROJECT DESIGN DOCUMENT FORM (CDM-SSC-PDD) - Version 03
CDM ndash Executive Board
10
be utilized for hydrogen production ndash AMS-
IIIH para 3(d)
4(e) The recovered methane measured may also
be utilized for use as fuel in transportation
applications after upgrading ndash AMS-IIIH
para 3(e)
Not applicable
5 If the recovered biogas is used for project
activities covered under AMS-IIIH
paragraph 3(a) that component of the
project activity can use a corresponding
methodology under Type I
The recovered biogas is planned for gainfully use
for electricity andor heat generation in the CPA
The approved baseline and monitoring
methodology AMS IA (version 14) andor AMS-
ID (version 17) are used for the electricity
component of the CPA
6 Conditions that ensure compliance with
applicability and other requirements of
single or multiple methodologyies applied
by CPA
The proposed CPA-01 will apply AMS-IIIH
AMS-IA andor AMS-ID Applicability criteria
are listed below
7 The project has to fulfill Host Country
National CDM criteria if any
Malaysia‟s National CDM criteria have been
fulfilled by the proposed CPA
8 The starting date of CPA is compliant with
the latest UNFCCC guidelines
The start date of the CPA is not or will not be
prior to the commencement of validation of the
PoA The EPC contract for biogas plant yet to be
awarded
9 Confirmation that the CPA does not involve
any public funding from Annex I Parties or
that in case public funding is used it does
not result in diversion of Official
Development Assistance (ODA)
The proposed CPA has not received and will not
be seeking public funding from Annex 1 countries
10 A local Stakeholder consultation has been
conducted prior to the CPA inclusion
Stakeholder consultation has been organized on
05032012 and it is prior to the CPA inclusion
11 Conditions pertaining to the demonstration
of additionality of each small scale CPA to
be included (less than 60 ktCO2 year) for
Type III and 15MW for Type I
methodologies
The proposed CPA may install gas engine with
maximum capacity of 12 MW and methane
avoidance of less than 60000 tCO2yr for AMS-
IIIH
12 Where applicable the conditions that ensure
that CPA in aggregate meets the small-scale
threshold criteria and remain within this
threshold throughout the crediting period of
the CPA
The proposed CPA may install gas engine with
maximum capacity of 12 MW and methane
avoidance of less than 60000 tCO2yr for AMS-
IIIH
13 Where applicable the requirements for the
debundling check in case CPAs belong to
small-scale (SSC) project categories
The proposed CPA is not a debundled component
of a large activity as described in the latest
ldquoGuidelines on assessment of debundling for SSC
project activitiesrdquo
14 Where applicable the conditions related to
sampling requirements for a PoA in
accordance with the approved
guidelinesstandard from the Board
pertaining to sampling and surveys
Not applicable all CPAs will be verified
15 Where applicable target group (eg The target group is prospective POME plants in
PROJECT DESIGN DOCUMENT FORM (CDM-SSC-PDD) - Version 03
CDM ndash Executive Board
11
domesticcommercialindustrial ruralurban
grid-connectedoff-grid) and distribution
mechanisms (eg direct installation)
Malaysia There are no specific distribution
mechanisms
16 Whether an EIA is required by local
authorities
Not applicable for the proposed CPA as EIA is not
required
17 The crediting period of the CPA shall not
exceed the length of the PoA (ie 28 years)
regardless of the time of inclusion of CPA in
the PoA
The crediting period of the proposed CPA will not
exceed the length of PoA 28 years
Additional eligibility criteria applicable in case of CPA that gainfully use of biogas for electrical
andor thermal energy generation
The proposed project conforms to the applicable requirements of AMS - ID version 17
Applicability Criteria Justification
This methodology comprises renewable energy
generation units such as photovoltaic hydro
tidalwave wind geothermal and renewable biomass
a) Supplying electricity to a national or a regional
grid
b) Supplying electricity to an identified consumer
facility via nationalregional grid through a
contractual arrangement such as wheeling
Applicable The proposed project activity is
based on biogas recovered from anaerobic bio-
digester a renewable energy generation source
The proposed project shall supply electricity to
the national grid
The project activity is not supplying electricity
to an identified consumer facility
This methodology is applicable to project activities that
(a) Install a new power plant at a site where there was
no renewable energy power plant operating prior
to the implementation of the project activity
(Greenfield plant)
(b) Involve a capacity addition
(c) Involve a retrofit of (an) existing plant(s)
(d) Involve a replacement of (an) existing plant(s)
Applicable to (a) where the proposed project
activity shall install a new power plant at a site
where there was no renewable energy power
plant operating prior to the implementation of
the project activity
Hydro power plants with reservoirs that satisfy at least
one of the following conditions are eligible to apply this
methodology
Not applicable The project activity is a biogas
recovery and utilization project
If the new unit has both renewable and non-renewable
components (eg a winddiesel unit) the eligibility limit
of 15MW for a small-scale CDM project activity applies
only to the renewable component If the new unit co-
fires fossil fuel the capacity of the entire unit shall not
exceed the limit of 15MW
Not applicable The project does not
incorporate a mix of renewable and non-
renewable components
Combined heat and power (co-generation) systems are
not eligible under this category
Applicable There is no combined heat and
power component in the project activity
PROJECT DESIGN DOCUMENT FORM (CDM-SSC-PDD) - Version 03
CDM ndash Executive Board
12
In the case of project activities that involve the addition
of renewable energy generation units at an existing
renewable power generation facility the added capacity
of the units added by the project should be lower than
15 MW and should be physically distinct from the
existing units
Not applicable The project activity does not
involve the addition of renewable energy
generation units at an existing facility
In the case of retrofit or replacement to qualify as a
small-scale project the total output of the retrofitted or
replacement unit shall not exceed the limit of 15 MW
Not applicable The project activity does not
seek to retrofit or replacement an existing
facility
The proposed project conforms to the applicable requirements of AMS - IA version 14
Applicability Criteria Justification
This category comprises renewable electricity
generation units that supply individual Households
users or groups of households users included in the
project boundary The applicability is limited to
individual households and users that do not have a grid
connection except when
a) A group of households or users are supplied
electricity through a standalone mini grid powered
by renewable energy generation unit(s) where the
capacity of the generating units does not exceed 15
MW or
b) The emissions reduction per renewable energy
based lighting system is less than 5 tonnes of CO2e
a year and where it can be shown that fossil fuel
would have been used in the absence of the project
activity by
(i) A representative sample survey (90
confidence interval plusmn10 error margin) of
target households or
(ii) Official statistics from the host country
government agencies
The renewable energy generation units include
technologies such as solar hydro wind biomass
gasification and other technologies that produce
electricity all of which is used on-sitelocally by the
user
The renewable generating units may be new
installations (Greenfield) or replace existing onsite
fossil-fuel-fired generation To qualify as a small-scale
project the total output of the unit(s) shall not exceed
the limit of 15 MW
Applicable The proposed project activity is not
grid connected
Furthermore the total installed capacity of the
generating units will not exceed 15 MW
Applicable The project activity involves the
combustion of the recovered biogas from the
anaerobic bio-digester for electricity generation
to be use on-site
Applicable The project activity involve the
replacement of existing onsite fossil fuel fired
generation and the total installed capacity is not
PROJECT DESIGN DOCUMENT FORM (CDM-SSC-PDD) - Version 03
CDM ndash Executive Board
13
exceed 15 MW
Hydro power plants with reservoirs that satisfy at least
one of the following conditions are eligible to apply this
methodology
The project activity is implemented in an existing
reservoir with no change in the volume of
reservoir
The project activity is implemented in an existing
reservoir where the volume of reservoir is
increased and the power density of the project
activity as per definitions given in the Project
Emissions section is greater than 4 Wm2
The project activity results in new reservoirs and
the power density of the power plant as per
definitions given in the Project Emissions section
is greater than 4 Wm2
Not applicable The project activity is not a
hydro power plant
Combined heat and power (co-generation) systems are
not eligible under this category
Applicable There is no combined heat and
power component in the project activity
If the unit added has both renewable and non-renewable
components (eg a winddiesel unit) the eligibility
limit of 15 MW for a small-scale CDM project activity
applies only to the renewable component If the unit
added co-fires fossil fuel the capacity of the entire unit
shall not exceed the limit of 15 MW
Not applicable The project does not
incorporate a mix of renewable and non-
renewable components
Project activities that involves retrofit or replacement of
an existing facility for renewable energy generation are
included in this category To qualify as a small-scale
project the total output of the modified or retrofitted
unit shall not exceed the limit of 15 MW
Not applicable The project activity does not
seek to retrofit or replacement an existing
facility
In the case of project activities that involve the addition
of renewable energy generation units at an existing
renewable power generation facility the added capacity
of the units added by the project should be lower than
15 MW and should be physically distinct3 from the
existing units
Not applicable The project activity does not
involve the addition of renewable energy
generation units at an existing facility
B3 Assessment and demonstration of additionality of the small-scale CPA as per eligibility
criteria listed in the Registered PoA
In Malaysia Environmental Quality (Prescribed Premises) (Crude Palm Oil) Regulation 1977 governs
environmental considerations including the wastewater treatment and discharge at palm oil mills The
regulation stipulates the discharge standards for water discharge or land application The regulation
however does not specify the required treatment technologies for wastewater or GHG emissions from
wastewater treatment operations
PROJECT DESIGN DOCUMENT FORM (CDM-SSC-PDD) - Version 03
CDM ndash Executive Board
14
More than 85 of palm oil mills are utilizing open based anaerobic ponds and it is considered the
prevailing practice for oil palm industry to treat the POME The open anaerobic ponds system is an
effective and low-tech solution that can easily meet the water discharge limits applicable to the palm oil
industry9 10
There is no financial incentive for the palm oil mill owners to invest into methane capture projects
particularly when there is no requirement under existing pending or planned national state or local
regulatory This is partly related to the fact that there are a lot of attractive and competing investments in
the sector However the PP has undertaken to set up this project in order to reduce the GHG emissions
and contribute his mite to the global GHG emission reduction
The project is a small scale project activity As such the provisions of Attachment A to Appendix B of
the simplified modalities and procedures for small-scale CDM project activities will apply to this project
The bdquoindicative simplified baseline and monitoring methodologies for selected small-scale CDM project
activity categories‟ require the project proponents to demonstrate that the project activity would not have
occurred anyway due to at least one of the following barriers
a) Investment barrier a financially more viable alternative to the project activity would have led to
higher emissions
b) Technological barrier a less technologically advanced alternative to the project activity involves
lower risks due to the performance uncertainty or low market share of the new technology
adopted for the project activity and so would have led to higher emissions
c) Barrier due to prevailing practice prevailing practice or existing regulatory or policy
requirements would have led to the implementation of a technology with higher emissions
d) Other barriers without the project activity for another specific reason identified by the project
participant such as institutional barriers or limited information managerial resources
organizational capacity financial resources or capacity to absorb new technologies emissions
would have been higher
Subsequently in its 35th Meeting the EB had issued bdquoNon-binding best practice examples to demonstrate
additionality for SSC project activities‟ wherein EB had given best practice examples of each of the
aforementioned category of barriers
The project participant has chosen Investment Barrier to demonstrate the additionality which is discussed
in the following paragraphs
Investment barrier
The most important of all the barriers faced by the company is the investment barrier The investment
analysis reveals that the project is not financially attractive The additionality tool permits the use of
simple cost analysis or investment comparison analysis or benchmark analysis to demonstrate the
additionality of the project
9 SD 05 ndash Yeoh B G 2004 A Technical and Economic Analysis of Heat and Power Generation from Biomethanation of
Palm Oil Mill Effluent Electrcity Supply Industry in Transition Issues and Prospect for Asia 10 SD 06 ndash Eco-Ideal Consulting Sdn Bhd (Eco-Ideal) 2004 MEWCPTMDANIDA Study on Clean Development
Mechanism Potential in the Waste Sectors in Malaysia Unpublished
PROJECT DESIGN DOCUMENT FORM (CDM-SSC-PDD) - Version 03
CDM ndash Executive Board
15
As the project activity generates revenue (other than CDM revenue) by exporting the electricity to the
grid and from the likely sale of biomass andor saving from diesel usage at the mill which is being
displaced by biogas simple cost analysis cannot be used Of the remaining PP has chosen the benchmark
analysis to demonstrate the financial unattractiveness of the project activity without carbon credits
There is a national policy on Feed-In-Tariff (FiT) gazetted in June 201111
that gives comparative
advantages to less emissions-intensive technologies over more emissions-intensive technologies (E-
policy as national andor sectoral policies or regulations that give comparative advantages to less
emissions-intensive technologies over more emissions-intensive technologies)
This is very conservative as paragraph 7 6 (b) EB22 Annex 3 states that ldquoNational andor sectoral
policies or regulations hellip that have been implemented since the adoption by the COP of the CDM MampP
(decision 17CP7 11 November 2001) need not be taken into account in developing a baseline scenario
(ie the baseline scenario could refer to a hypothetical situation without the national andor sectoral
policies or regulations being in place) In absence of the FiT the prevailing electricity sales tariff to
consumers is RM 021 per kWh
Project IRR has been chosen as the financial indicator for the financial analysis of the project activity
The project IRR has to be compared with a benchmark rate of return to demonstrate the additionality of
the project The Guidelines on the Assessment of Investment Analysis (Version 05 point 12) states ldquoIn
cases where a benchmark approach is used the applied benchmark shall be appropriate to the type of IRR
calculated Local commercial lending rates or weighted average costs of capital (WACC) are appropriate
benchmarks for a project IRR Requiredexpected returns on equity are appropriate benchmarks for an
equity IRR Benchmarks supplied by relevant national authorities are also appropriate if the DOE can
validate that they are applicable to the project activity and the type of IRR calculation presentedrdquo
In line with the Guidelines on the Assessment of Investment Analysis (Version 05) a default value
for the expected returns on equity is selected as the benchmark with 1090 The logic of choosing this
rate as benchmark is that the project should yield a return at least equivalent to the expected returns of
equity to merit consideration
For making the investment analysis the following assumptions have been made
Table B2 Investment Analysis
Sl No Description Value
1
Budgeted CAPEX
- Bioreactor amp accessories
- Flaring system
- Boiler adaptation cost for burners
- Gas engine(s)
- KPSR consultancy cost
4350000
140670
205000
4630000
220000
Total 9545670
2
Annual maintenance costs are estimated based on a of CAPEX12
Bioreactor (3 of CAPEX) = MYR 130500
Gas engine(s) (5 of CAPEX) = MYR 231500
3 Corporate tax ()13 25
11 httpwwwmbipvnetmydloadFiT20Handbook20Englishpdf 12 SD 05 ndash Maintenance cost (SIRIM Environmental and Bioprocess Technology Centre of Malaysia)
PROJECT DESIGN DOCUMENT FORM (CDM-SSC-PDD) - Version 03
CDM ndash Executive Board
16
Since losses can be carried forward indefinitely (so long as the ownership
remains unchanged) the incidence of taxation does not arise in the case of
this project activity
4
Manpower cost has been estimated based on 1 supervisor 2 operators 1
chargeman envisaged to be appointed and the ruling wagesalary structure
of the company14
182588 MYR yr
5 Salary increment rate has been applied based on the average expected
salary increment rate for year 20101115 40
6 Price of Biomass ex-factory (PKS) 156 MYRmt
7 Price of diesel 220 MYRliter
8 RE tariff export to grid (MYRkWh) 021
9
Laboratory Cost is estimated based on the quotations from accredited
laboratory anticipated number of tests and samples to be carried out and
transportation cost during the running and operating of the biogas plant for
maintaining optimum operating conditions
1920 MYR yr
10 Insurance premium per year ( of CAPEX)16 0412
11 Estimate of CER price (EUR) 8
12
Depreciation of equipment (years) has been provided as per the Inland
Revenue Authority regulations17 Since the project consists of only
environmental protection equipment it is entitled to initial capital
allowance of 40 and annual capital allowance of 20 as per the Inland
Revenue Authority notifications
4 years
13 Project life time for IRR calculation18 20 years
14
Residual value a fair value (5) of the project activity assets at the end of
the assessment period as per the Guidelines on The Assessment of
Investment Analysis version 05 EB 62
MYR 466284
Based on the above assumption the project IRR works out to be ndash 085 in contrast to the benchmark
rate of 1090 Thus the analysis proves that the project is not financially attractive
Sensitivity Analysis
A sensitivity analysis has also been conducted to test the robustness of the conclusions drawn Four (4)
factors have been identified as critical to IRR of the project viz project cost maintenance costs RE
tariff The results of sensitivity analysis are given below
13 SD 08 ndash Malaysian Tax and Business Booklet 201011 Page 12
httpwwwpwccomen_MYmyassetspublicationstaxbooklet1011pdf 14 SD 3 - Salary structure (biogas plant) 15 SD 09 - Salary increment rate (201011) 16 SD 2 - Biogas plant insurance policy 17 SD 08 ndash Malaysian Tax and Business Booklet 201011 Page 21
httpwwwpwccomen_MYmyassetspublicationstaxbooklet1011pdf 18 As per the Guidelines on the Assessment of Investment Analysis version 05 (Annex 5 EB 62 point 3) ldquoIn general a
minimum period of 10 years and a maximum of 20 years will be appropriaterdquo PP has chosen 20 years for financial
assessment as it is conservative
PROJECT DESIGN DOCUMENT FORM (CDM-SSC-PDD) - Version 03
CDM ndash Executive Board
17
Table B3 Sensitivity Analysis
FACTORS PROJECT IRR
-10 0 +10
Project cost -185 -085 033
Maintenance cost -491 -085 189
RE tariff 112 -085 -354
It could be seen from the above that even under the most optimistic conditions the project activity would
not yield a positive IRR let alone crossing the benchmark Therefore the project is not a business-as-
usual scenario and it is additional
Prior Consideration of CDM
As per the guidance of EB Meeting Report 49 Annex 22 the project proponent notified the UNFCCC and
the DNA of the intent to implement the project as a CDM project activity
Conclusion
The conclusion of the investment analysis remains identical to reasonable variations of the critical
assumptions (sensitivity analysis) Therefore the project activity IRR remains lower than the benchmark
In the above background it is proved that the project faces an investment barrier that establishes the
additionality
B4 Description of the sources and gases included in the project boundary and proof that the
small-scale CPA is located within the geographical boundary of the registered PoA
The emission sources and type of GHG which are included or excluded within the project boundary are
shown in the following table
Table B4 Emission Sources and Type of GHG
Source Gas Included Justification Explanation
Ba
seli
ne
Direct emissions
from the
wastewater
treatment processes
CO2 No Neutral CO2 emissions from biomass decaying
CH4 Yes Methane emissions from open lagoons treatment
process
N2O No Not significant Excluded for simplification and
conservativeness
Diesel usage in
diesel genset at mill
CO2 Yes CO2 emissions from combustion of diesel fuel
CH4 No Not significant Excluded for simplification and
conservativeness
N2O No Not significant Excluded for simplification and
conservativeness
Pro
ject
Act
ivit
y
Bio-digester
CO2 No Neutral CO2 emissions from biomass decaying
CH4 Yes Methane emissions from anaerobic treatment process
N2O No Not significant Excluded for simplification and
conservativeness
Existing
wastewater
treatment lagoons
CO2 No Neutral CO2 emissions from biomass decaying
CH4 Yes Methane emissions from poorly managed treatment
process (without aerators)
PROJECT DESIGN DOCUMENT FORM (CDM-SSC-PDD) - Version 03
CDM ndash Executive Board
18
(Facultative amp
algae system) N2O No
Not significant Excluded for simplification and
conservativeness
Gas engine(s)
(biogas
combustion)
CO2 No Neutral CO2 emissions from biogas combustion
CH4 No Not significant and excluded from calculation
Biogas combustion efficiency is considered 10019
N2O No Not significant Excluded for simplification and
conservativeness
Biomass Boiler(s)
(Biogas
combustion)
CO2 No Neutral CO2 emissions from biogas combustion
CH4 No Not significant and excluded from calculation
Biogas combustion efficiency is considered 10020
N2O No Not significant Excluded for simplification and
conservativeness
Grid electricity
consumption from
national grid
CO2 Yes CO2 emissions from grid energy
CH4 No Not significant Excluded for simplification and
conservativeness
N2O No Not significant Excluded for simplification and
conservativeness
Enclosed or Open
flaring system
CO2 No Neutral CO2 emissions from biogas combustion
CH4 Yes CH4 emissions due to incomplete combustion in
enclosed flare
N2O No Not significant Excluded for simplification and
conservativeness
The CPA is implemented at the address below
Kilang Sawit Felda Triang Triang Pahang Malaysia
The site is located at state of Pahang Malaysia with GPS coordinates 3 16152 N 102 34567 E or
32692 1025761 (refer also Section A412) and thus is located within the geographical boundary of the
PoA
B5 Emission reductions
B51 Data and parameters that are available at validation
Data Parameter GWPCH4
Data unit tCO2tCH4
Description Global Warming Potential the equivalent in CO2 of the effect of methane
gas to the atmosphere
Source of data used IPCC 2006
Value applied 21
Justification of the choice of
data or description of
measurement methods and
procedures actually applied
Global warming potential for methane gas since this is a methane
capture project
19 AMS-IIIH para 35 20 AMS-IIIH para 35
PROJECT DESIGN DOCUMENT FORM (CDM-SSC-PDD) - Version 03
CDM ndash Executive Board
19
Any comment
Data Parameter MCFwwtreatmentBL1
Data unit Fraction
Description Methane correction factor for baseline wastewater anaerobic treatment
systems
Source of data used Table IIIH1 AMS IIIH version 16
Value applied 08
Justification of the choice of
data or description of
measurement methods and
procedures actually applied
Table IIIH1 for baseline emission The lagoons depth are more than 2m
MCF value of 08 for anaerobic deep lagoon (depth gt 2 m)
Any comment
Data Parameter MCFwwtreatmentBL2
Data unit Fraction
Description Methane correction factor for baseline wastewater aerobic treatment
systems
Source of data used Methane correction factor for baseline aerobic wastewater treatment
system (poorly managed)
Value applied Table IIIH1 AMS IIIH version 16
Justification of the choice of
data or description of
measurement methods and
procedures actually applied
03
Any comment No aerators installed
Data Parameter MCFwwBLdischarge
Data unit Fraction
Description Methane correction factor based on discharge pathway in the baseline
situation
Source of data used Table IIIH1 AMS IIIH version 16
Value applied 01
Justification of the choice of
data or description of
measurement methods and
procedures actually applied
Table IIIH1 for baseline emission The final discharge of treated
effluent into river MCF value of 01 for river discharge
Any comment
Data Parameter Bo ww
Data unit kgCH4 kgCOD
Description Methane generation capacity of treated wastewater
Source of data used IPCC 2006
Value applied 025
Justification of the choice of
data or description of
measurement methods and
procedures actually applied
Default value as prescribed in the methodology
Any comment
PROJECT DESIGN DOCUMENT FORM (CDM-SSC-PDD) - Version 03
CDM ndash Executive Board
20
Data Parameter UFBL
Data unit -
Description Model correction factor to account for model uncertainties (baseline)
Source of data used AMS IIIH version 16
Value applied 089
Justification of the choice of
data or description of
measurement methods and
procedures actually applied
As per methodology AMS-IIIH point 24
Any comment -
Data Parameter UFPJ
Data unit -
Description Model correction factor to account for model uncertainties (project
activity)
Source of data used AMS IIIH version 16
Value applied 112
Justification of the choice of
data or description of
measurement methods and
procedures actually applied
As per methodology AMS-IIIH point 30(a)
Any comment -
Data Parameter CFEww
Data unit Fraction
Description Capture efficiency of the biogas recovery equipment in the wastewater
treatment system
Source of data used AMS IIIH version 16
Value applied 09
Justification of the choice of
data or description of
measurement methods and
procedures actually applied
A default value of 09 has been used as per the guidance in the
methodology
Any comment
Data Parameter MCF ww treatmentPJ1
Data unit Fraction
Description Methane correction factor for the project wastewater anaerobic treatment
system equipped with biogas recovery equipment
Source of data used Table IIIH1 AMS IIIH version 16
Value applied 08
Justification of the choice of
data or description of
measurement methods and
procedures actually applied
The lagoons depth are more than 2 m MCF values in table IIIH1 has
been used as per the guidance in the methodology (depth gt 2 m)
Any comment
Data Parameter MCF ww treatmentPJ2
PROJECT DESIGN DOCUMENT FORM (CDM-SSC-PDD) - Version 03
CDM ndash Executive Board
21
Data unit Fraction
Description Methane correction factor for the project wastewater aerobic treatment
system not equipped with biogas recovery equipment
Source of data used Table IIIH1 AMS IIIH version 16
Value applied 03
Justification of the choice of
data or description of
measurement methods and
procedures actually applied
Aerobic treatment poorly managed
Any comment
Data Parameter MCFwwPJdischarge
Data unit Fraction
Description Methane correction factor based on discharge pathway in the project
activity
Source of data used Table IIIH1 AMS IIIH version 16
Value applied 01
Justification of the choice of
data or description of
measurement methods and
procedures actually applied
Table IIIH1 for project emission The final discharge of treated effluent
into river MCF value of 01 for river discharge
Any comment Same discharge pathway as in the baseline
Data Parameter CODBL1
Data unit
Description COD removal efficiency of the baseline system (anaerobic treatment
system)
Source of data used 10 days measurement campaign
Value applied Anaerobic Treatment system 8880
Justification of the choice of
data or description of
measurement methods and
procedures actually applied
One year historical data not available
Any comment This data will be used for ex post emission reduction calculation
Data Parameter CODBL2
Data unit
Description COD removal efficiency of the baseline system (aerobic treatment
system)
Source of data used 10 days measurement campaign
Value applied Aerobic Treatment system 6369
Justification of the choice of
data or description of
measurement methods and
procedures actually applied
One year historical data not available
Any comment This data will be used for ex post emission reduction calculation
Data Parameter NCVCH4
Data unit MJkg
PROJECT DESIGN DOCUMENT FORM (CDM-SSC-PDD) - Version 03
CDM ndash Executive Board
22
Description Net Calorific Value of methane
Source of data used IPCC 2006 Default Value
Value applied 504
Justification of the choice of
data or description of
measurement methods and
procedures actually applied
IPCC 2006 value is used Volume 2 Chapter 1 Table 12
Any comment
Data Parameter NCVFF
Data unit MJkg
Description Net Calorific Value of diesel
Source of data used IPCC 2006 Default Value
Value applied 430
Justification of the choice of
data or description of
measurement methods and
procedures actually applied
IPCC 2006 value is used Volume 2 Chapter 1 Table 12
Any comment
Data Parameter EFCO2diesel
Data unit tCO2MWh
Description CO2 emission factor diesel genset
Source of data used AMS-IA version 14 point 14
Value applied 08
Justification of the choice of
data or description of
measurement methods and
procedures actually applied
Default value for diesel generation unit
Any comment
Data Parameter Grid Emission Factor
Data unit kgCO2ekWh
Description Emission factor for grid electricity in Peninsular Malaysia
Source of data used Pusat Tenaga Malaysia March 2010
Value applied 0672
Justification of the choice of
data or description of
measurement methods and
procedures actually applied
As per AMS-ID point 12
Any comment Study on Grid Connected Electricity Baselines in Malaysia 2008
B52 Ex-ante calculation of emission reductions
The ex ante emission reductions are calculated based on AMS-IIIH version 16 as per equations
explained in section E62 of PoA-DD Biogas PoA in Malaysia
PROJECT DESIGN DOCUMENT FORM (CDM-SSC-PDD) - Version 03
CDM ndash Executive Board
23
Calculation for AMS-IIIH
Baseline emissions
Source of baseline emissions Reference Applicable
(YN)
Comments
Wastewater and sludge treatment
systems equipped with a biogas
recovery facility shall be excluded
from the baseline
AMS-IIIH
Point 17
N No biogas recovery in the
baseline
Emissions on account of electricity or
fossil fuel used (BEpowery)
AMS-IIIH
Point 18 (i)
N For conservativeness no
emissions due to electricity or
fossil fuel will be claimed
BEpowery = 0
Methane emissions from baseline
wastewater treatment systems
(BEwwtreatmenty)
AMS-IIIH
Point 18 (ii)
Y Baseline includes anaerobic and
aerobic treatment conditions with
different MCF values selected as
per Table IIIH1
Methane emissions from baseline
sludge treatment systems (BEstreatmenty)
= 0
AMS-IIIH
Point 18 (iii)
N The baseline plant corresponds to
scenario Para 1(f) without sludge
treatment BEstreatmenty = 0
Methane emissions on account of
inefficiencies in the baseline
wastewater treatment systems and
presence of degradable organic carbon
in the treated wastewater discharged
into river (BEwwdischargey)
AMS-IIIH
Point 18 (iv)
Y Treated effluent is currently
discharged into the river
Methane emissions from the decay of
the final sludge generated by the
baseline treatment systems (BEsfinaly)
AMS-IIIH
Point 18 (v)
N Zero because in the baseline final
sludge used for soil application
BEsfinaly = 0
A) Calculation of baseline emissions
BEy = BEwwtreatmenty + BEwwdischargey
Abbreviation Description Value Source
BEy Baseline emissions in year y (tCO2e) 30762 Calculated
BEpowery Baseline emissions of diesel genset in year
y tCO2eyear 0 Calculated
BEwwtreatmenty Baseline emissions of the wastewater
treatment systems tCO2eyear 30663 Equation 2
BEwwdischargey
The methane emissions from degradable
organic carbon in treated wastewater
discharged tCO2eyear
100 Equation 6
A1) Baseline emissions
PROJECT DESIGN DOCUMENT FORM (CDM-SSC-PDD) - Version 03
CDM ndash Executive Board
24
Equation 2 BEwwtreatmenty = Qwwy (CODinflow1 y CODBL1 MCFwwtreatmentBL1) +
(CODinflow2y CODBL2 MCFwwtreatmentBL2) Boww UFBL GWPCH4
Abbreviation Description Value Source
BEwwtreatmenty Baseline emissions of the wastewater
treatment systems (tCO2eyear) 30663 Calculated
Qwwy Volume of wastewater treated in baseline
wastewater treatment system i in year y
(m3year)
333293
Volume based on 10 m3mt
FFB21 amp FFB historical data
(2009 ndash 2011)
CODinflow1y Chemical oxygen demand of the
wastewater inflow to the baseline treatment
system (anaerobic) in year y (tCOD m3)
0026905 10 days measurement
campaign
CODBL1 COD removal efficiency of the baseline
treatment system (anaerobic) () 8880
10 days measurement
campaign
CODinflow2y Chemical oxygen demand of the
wastewater inflow to the baseline treatment
system (aerobic) in year y (tCOD m3)
0003013 10 days measurement
campaign
CODBL2 COD removal efficiency of the baseline
treatment system (aerobic) () 6369
10 days measurement
campaign
MCFwwtreatmentBL 1 Methane correction factor for baseline
wastewater anaerobic treatment systems 08
MCF values as per table
IIIH1 anaerobic gt 2m
MCFwwtreatmentBL2 Methane correction factor for baseline
wastewater aerobic treatment systems 03
MCF values as per table
IIIH1 ndash poorly managed
Boww Methane producing capacity of the
wastewater (kg CH4kg COD) 025
IPCC 2006
UFBL Model correction factor to account for
model uncertainties 089
IPCC 2006
GWPCH4 Global Warming Potential for methane 21 IPCC 2006
A2) The methane emissions from degradable organic carbon in treated wastewater discharged
Equation 6 BEwwdischargey = Qwwy GWPCH4 Boww UFBL CODwwdischarge BLyMCFww BLdischarge
Abbreviation Description Value Source
BEwwdischargey
The methane emissions from degradable
organic carbon in treated wastewater
discharged (tCO2eyear)
100 Calculated
Qwwy Volume of treated wastewater discharged
in year y (m3year) 333293
Volume based on 10 m3mt
FFB22 amp FFB historical data
(2009 ndash 2011)
GWPCH4 Global warming potential of methane 21 IPCC 2006
Boww Methane producing capacity of the treated
wastewater (kgCH4 kgCOD) 025 IPCC 2006
21 Mill designed data for baseline effluent treatment plant 22 Mill designed data for baseline effluent treatment plant
PROJECT DESIGN DOCUMENT FORM (CDM-SSC-PDD) - Version 03
CDM ndash Executive Board
25
UFBL Model correction factor to account for
model uncertainties 089 IPCC 2006
CODwwdischarge BLy Chemical oxygen demand of the treated
wastewater discharged into sea river or
lake in the baseline situation in the year y
(tonnesm3)
0000642 10 days measurement
campaign
MCFwwBLdischarge Methane correction factor based on
discharge pathway in the baseline situation
(eg into sea river or lake) of the
wastewater (fraction)
01 MCF values as per table
IIIH1 version 16
Project activity emissions
The project activity emission sources as per the methodology and their relevance with respect to the
proposed CDM project activity are given below in a tabular format
Source of project activity
emission Reference
Applicable
(YN) Comments
CO2 emissions on account of
power and fossil fuel used by
the project activity facilities
(PEpowery)
AMS-IIIH
point 29(i)
Y The project activity uses the electricity
imported from the national grid
Methane emissions from
wastewater treatment systems
affected by the project
activity and not equipped with
biogas recovery in the project
situation (PEwwtreatmenty)
AMS-IIIH
point 29 (ii)
Y CH4 emissions from the poorly managed
aerobic lagoons
Methane emissions from
sludge treatment systems
affected by the project
activity and not equipped with
biogas recovery in the project
situation (PEstreatmenty)
AMS-IIIH
point 29 (iii)
N The project activity corresponds to
scenario (vi) without sludge treatment
PEystreatmenty = 0
Methane emissions on account
of inefficiency of the project
activity wastewater treatment
systems and presence of
degradable organic carbon in
treated wastewater
(PEwwdischargey)
AMS-IIIH
point 29 (iv)
Y Treated effluent from ETP will be
discharged into river
Methane emissions from the
decay of the final sludge
generated by the project
activity treatment systems
(PEsfinaly)
AMS-IIIH
point 29 (v)
N In the proposed CDM project activity
final sludge is used for soil application in
the same manner as in the baseline
PEsfinaly = 0
PROJECT DESIGN DOCUMENT FORM (CDM-SSC-PDD) - Version 03
CDM ndash Executive Board
26
Methane fugitive emissions on
account of inefficiencies in
capture systems (PEfugitivey)
AMS-IIIH
point 29 (vi)
Y Applicable to PEfugitivewwy
N The project activity corresponds to
scenario (vi) without sludge treatment
PEfugitivesy = 0
Methane emissions due to
incomplete flaring (PEflaringy)
AMS-IIIH
point 29 (vii)
Y Enclosed flaring system installed
Methane emissions from
biomass stored under
anaerobic conditions which
does not take place in the
baseline situation (PEbiomassy)
AMS-IIIH
point 29
(viii)
N In the project activity the biomass (PKS
+ mesocarp fibres) displaced will not be
stored under anaerobic conditions The
conditions of onsite storage are identical
in the baseline as in the project activity
The biomass will be sold to the market
on a regular basis PEbiomassy = 0
B) Calculation of project emissions
PEy = PEpowery + PEwwtreatmenty + PEww discharge y + PEfugitive y + PEflaring y
Abbreviation Description Value Source
PEy Project activity emissions in the year y
(tCO2eyr) 6050 Equation 8
PEpowery CO2 emissions on account of power used
by the project activity facilities (tCO2eyr) 604 -
PEwwtreatmenty Methane emissions from wastewater
treatment systems affected by the project
activity and not equipped with biogas
recovery in year y (tCO2eyr)
1523 Equation 9
PEwwdischargey
Methane emissions on account of
inefficiency of the project activity
wastewater treatment systems and presence
of degradable organic carbon in treated
wastewater (tCO2eyr)
126 Equation 12
PEfugitivey Methane fugitive emissions on account of
inefficiencies in capture systems (tCO2eyr) 3796 Equation 15
PEflaringy Methane emissions due to incomplete
flaring (tCO2eyr) 0 Equation 19
B1) Project emissions from CO2 emissions on account of power and fuel used by the project activity
facilities in year ldquoyrdquo in tCO2eyear
PEpowery = ECPJjy EFgridy
Abbreviation Description Value Source
PEpowery Project emissions from electricity
consumption in the year y (tCO2eyr) 604 Calculated
ECPJjy Internal power consumption from the grid 749 100 kW is the effective
PROJECT DESIGN DOCUMENT FORM (CDM-SSC-PDD) - Version 03
CDM ndash Executive Board
27
(MWh year) power based on the
equipments installed at the
site
EFgridy Grid Emission factor in Peninsular
Malaysia 2008 (tCO2 MWh) 0672
Study on Grid Connected
Electricity Baselines in
Malaysia 2008 published in
2010 by PTM
B2) Methane emissions from wastewater treatment systems affected by the project activity and not
equipped with biogas recovery in the project situation in year ldquoyrdquo in tCO2e
Equation 9 PEwwtreatment y = Qwwky CODinflowk y PJky MCFwwtreatmentPJk) Boww UFPJ GWPCH4
Abbreviation Description Value Source
PEwwtreatmenty
Methane emissions from wastewater
treatment systems affected by the project
activity and not equipped with biogas
recovery in the project situation (tCO2eyr)
1523 Calculated
Qwwky Volume of wastewater treated in project
activity wastewater treatment system k in
year y (m3year)
333293
Volume based on 10 m3mt
FFB23 amp FFB historical data
(2009 ndash 2011)
CODinflowky Chemical oxygen demand of the
wastewater inflow to the project activity
treatment system k in year y (tonnes COD
m3)
0002690 10 days measurement
campaign
PJky Chemical oxygen demand removal
efficiency of the project wastewater
treatment system k in year y (tm3)
measured based on inflow COD and
outflow COD in system k
90 Based on bio-digester COD
removal efficiency of 90
MCFwwtreatmentPJk Methane correction factor for project
wastewater treatment system k (MCF
values as per table IIIH1)
03
MCF values table IIIH1
Version 16 ndash aerobic poorly
managed (conservative)
Boww Methane generation capacity of the treated
wastewater (kg CH4kg COD) 025 IPCC 2006
UFPJ Model correction factor to account for
model uncertainties 112
IPCC 2006
GWPCH4 Global warming potential of methane 21 IPCC 2006
23 Mill designed data for baseline effluent treatment plant
PROJECT DESIGN DOCUMENT FORM (CDM-SSC-PDD) - Version 03
CDM ndash Executive Board
28
B3) Methane emissions on account of inefficiency of the project activity wastewater treatment
systems and presence of degradable organic carbon in treated wastewater in the year ldquoyrdquo (tonnes)
Equation 12 PEwwdischarge y = Qwwy GWPCH4 Boww UFPJ CODwwdischargePJy MCFwwPJdischarge
Abbreviation Description Value Source
PEwwdischargey
Methane emissions from degradable
organic carbon in treated wastewater
(tCO2eyr)
126 Calculated
Qwwy Quantity of wastewater treated in year y
(m3year) 333293
Volume based on 10 m3mt
FFB24 amp FFB historical data
(2009 ndash 2011)
CODwwdischargedPJ
y
Chemical oxygen demand of the treated
wastewater discharged into river in the
project situation in year y (tCOD m3)
0000642 10 days measurement
campaign
MCFwwPJ discharge
Methane correction factor based on
discharge pathway in the project situation
(river) of the wastewater (fraction)
01 MCF values as per table
IIIH1 Version 16
Boww Methane generation capacity of the treated
wastewater (kg CH4kg COD) 025 IPCC 2006
UFPJ Model correction factor to account for
model uncertainties 112 IPCC 2006
GWPCH4 Global warming potential of methane 21 IPCC 2006
B41) Methane fugitive emissions on account of inefficiencies in capture systems in the year ldquoyrdquo
(tonnes)
Equation 15 PEfugitivewwy = (1 ndash CFEww ) MEPywwtreatment GWPCH4
Abbreviation Description Value Source
PEfugitivey Methane fugitive emissions on account of
inefficiencies in capture systems (tCO2eyr) 3796 Calculated
CFEww Capture efficiency of the biogas recovery
equipment in the wastewater treatment
systems
09 AMS IIIH Version 16
MEPywwtreatment Methane emission potential of wastewater
treatment systems equipped with biogas
recovery system in year y (tCH4yr)
1808 Refer Equation 11 of AMS
IIIH version 16
GWPCH4 Global warming potential of methane 21 IPCC 2006
B42) Methane emission potential of wastewater treatment plant in the year ldquoyrdquo (tonnes)
Equation 16 MEPwwtreatmenty = Qwwy Boww UFPJ (CODremovedPJky MCFwwtreatmentPJk)
24 Mill designed data for baseline effluent treatment plant
PROJECT DESIGN DOCUMENT FORM (CDM-SSC-PDD) - Version 03
CDM ndash Executive Board
29
Abbreviation Description Value Source
MEPwwtreatmenty Methane emission potential of wastewater
treatment systems equipped with biogas
recovery system in year y (tonnes CH4yr)
1808 Calculated
Qyww Quantity of wastewater treated in year y
(m3year) 333293
Volume based on 10 m3mt
FFB25 amp FFB historical data
(2009 ndash 2011)
Boww Methane generation capacity of the treated
wastewater (kg CH4kg COD) 025 IPCC 2006
CODremovedPJy
The chemical oxygen demand removed by
the treatment anaerobic system of the
project activity equipped with biogas
recovery in the year y (tCOD m3)
0024214
10 days measurement
campaign amp bio-digester
design parameter
MCFwwtreatmentPJ
Methane correction factor for the project
wastewater treatment system k equipped
with biogas recovery equipment
08 MCF values as per table
IIIH1 Version 16
UFPJ Model correction factor to account for
model uncertainties 112 IPCC 2006
B5) Methane emissions due to incomplete flaring in the year ldquoyrdquo (tonnes)
Equation 13a PEflaringy = TMflaredy (1 - ηflarey) GWPCH4
Abbreviation Description Value Source
PEflaringy Methane emissions due to incomplete
flaring (tCO2eyr) 0 Calculated
TMflaredh Mass flow rate of methane flared in dry
basis in the hour h (tCH4 yr) 0 Calculated
ηflarey Flare efficiency in hour h based on default
values 50
Tools for methane flaring
(open flare) for conservative
GWPCH4 Global warming potential of methane 21 IPCC 2006
Leakage emissions
No leakage emission will occur in the project activity
LEy1 = 0
Emission reductions
Equation 22 ERy ex ante = BEy ex ante ndash (PEy ex ante + LEy ex ante)
25 Mill designed data for baseline effluent treatment plant
PROJECT DESIGN DOCUMENT FORM (CDM-SSC-PDD) - Version 03
CDM ndash Executive Board
30
Abbreviation Description Value Source
ERy1 ex ante Ex ante emission reduction in year y
(tCO2e) 24712 Equation 22
BEy1 ex ante Ex ante baseline emissions in year y
(tCO2e) 30762 Equation 1
PEy1 ex ante Ex ante project emissions in year y (tCO2e) 6050 Equation 8
LEy1 ex ante Ex ante Leakage emissions in year y
(tCO2e) 0 -
Calculation for AMS-ID
Baseline emissions
Electricity generated from biogas engines will be exported to the Peninsular Malaysia National Grid The
baseline emissions are described in AMS-ID (Version 17 EB 61) as the ldquoproduct of electrical energy
baseline expressed in kWh of electricity produced by the renewable energy generating unit multiplied by
an emission factorrdquo
Baseline emissions due to electricity exported to the grid in the year ldquoyrdquo (tonnes)
BEEGy = EGBLy EFCO2gridy
Abbreviation Description Value Source
BEEGy Baseline emissions in year y (tCO2eyr) 4568 Calculated
EGBLy
Quantity of net electricity supplied to the
grid as a result of the implementation of the
project activity in year y (kWh yr)
6797625 Calculated
EFCO2gridy
CO2 emission factor of the grid in year
(tCO2kWh) 0672
Study on Grid Connected
Electricity Baselines in
Malaysia 2008 published in
2010 by PTM
Project Activity Emissions
As per AMS-ID (Version 17 EB 61) project emissions for renewable energy project activities are zero
PEEGy = 0
Leakage
If the energy generating equipment is transferred from another activity leakage is to be considered
No leakage emission will occur in the project activity LEy = 0
PROJECT DESIGN DOCUMENT FORM (CDM-SSC-PDD) - Version 03
CDM ndash Executive Board
31
Emission reductions
ERy = BEy ndash PEy - LEy
Abbreviation Description Value Source
ERy Emission reduction in year y (tCO2ey) 4568 -
BEy Baseline emissions in year y (tCO2ey) 4568 -
PEy Project emissions in year y (tCO2ey) 0 -
LEy Leakage emissions in year y (tCO2ey) 0 -
Calculation for AMS-IA
Baseline emissions
The energy baseline is the fuel consumption of the technology in use or that would have been used in the
absence of the project activity to generate the equivalent quantity of energy Option 2 is applied This
methodology is only apply shall the recovered is in excess after export to the grid
Annual electricity sent to the mill for FF displacement in the year ldquoyrdquo (kWh)
EBLy = ΣEGiy (1 ndash l)
Abbreviation Description Value Source
EBLy Annual energy baseline (kWhyr) Calculated
EGiy
The estimated annual output of the
renewable energy technologies of the group
of i renewable energy technologies
installed (kWhyr)
0 Estimated
l
Average technical distribution losses that
would have been observed in diesel
powered mini-grids installed by public
programmes or distribution companies in
isolated areas expressed as a fraction
0 Conservative by applying
Zero (0)
Baseline electricity sent to the mill for FF displacement in the year ldquoyrdquo (tonnes)
BECO2y = EBLy EFCO2
Abbreviation Description Value Source
BECO2y Baseline emission in the year y (tCO2yr) 0 Calculated
EBLy Annual energy baseline (kWhyr) 0 Calculated
EFCO2 CO2 emission factor (tCO2kWh) 08
Default value which is
derived from diesel
generation units is used
PROJECT DESIGN DOCUMENT FORM (CDM-SSC-PDD) - Version 03
CDM ndash Executive Board
32
Project Activity Emissions
As per AMS-IA (Version 14 EB 54) project emissions for renewable energy project activities are zero
PEy = 0
Leakage
If the energy generating equipment is transferred from another activity or if the existing equipment is
transferred to another activity leakage is to be considered
No leakage emission will occur in the project activity LEy = 0
B53 Summary of the ex-ante estimation of emission reductions
Estimated emission reductions (total project activity)
Year
Estimation of
project activity
emissions (tCO2e)
Estimation of
baseline emissions
(tCO2e)
Estimation of
leakage (tCO2e)
Estimation of
overall emission
reductions (tCO2e)
2012 504 2944 0 2440
2013 6050 35330 0 29280
2014 6050 35330 0 29280
2015 6050 35330 0 29280
2016 6050 35330 0 29280
2017 6050 35330 0 29280
2018 6050 35330 0 29280
2019 5546 32386 0 26840
Total (tCO2) 42350 247310 0 204960
The starting date of the crediting period is 01122012 or the date of registration whichever is later
Estimated emission reductions for AMS-IIIH
Year
Estimation of
project activity
emissions (tCO2e)
Estimation of
baseline emissions
(tCO2e)
Estimation of
leakage (tCO2e)
Estimation of
overall emission
reductions (tCO2e)
2012 504 2563 0 2059
2013 6050 30762 0 24712
PROJECT DESIGN DOCUMENT FORM (CDM-SSC-PDD) - Version 03
CDM ndash Executive Board
33
2014 6050 30762 0 24712
2015 6050 30762 0 24712
2016 6050 30762 0 24712
2017 6050 30762 0 24712
2018 6050 30762 0 24712
2019 5546 28199 0 22653
Total (tCO2) 42350 215334 0 172984
The starting date of the crediting period is 01122012 or the date of registration whichever is later
Estimated emission reductions for AMS-ID
Year
Estimation of
project activity
emissions (tCO2e)
Estimation of
baseline emissions
(tCO2e)
Estimation of
leakage (tCO2e)
Estimation of
overall emission
reductions (tCO2e)
2012 0 381 0 381
2013 0 4568 0 4568
2014 0 4568 0 4568
2015 0 4568 0 4568
2016 0 4568 0 4568
2017 0 4568 0 4568
2018 0 4568 0 4568
2019 0 4187 0 4187
Total (tCO2) 0 31976 0 31976
The starting date of the crediting period is 01122012 or the date of registration whichever is later
Estimated emission reductions for AMS-IA
Year
Estimation of
project activity
emissions (tCO2e)
Estimation of
baseline emissions
(tCO2e)
Estimation of
leakage (tCO2e)
Estimation of
overall emission
reductions (tCO2e)
2012 0 0 0 0
2013 0 0 0 0
2014 0 0 0 0
2015 0 0 0 0
2016 0 0 0 0
PROJECT DESIGN DOCUMENT FORM (CDM-SSC-PDD) - Version 03
CDM ndash Executive Board
34
2017 0 0 0 0
2018 0 0 0 0
2019 0 0 0 0
Total (tCO2) 0 0 0 0
The starting date of the crediting period is 01122012 or the date of registration whichever is later
B6 Application of the monitoring methodology and description of the monitoring plan
B61 Description of the monitoring plan
The parameters to be monitored are
Please note that the amount of methane recovered and fuelled or flared (MDy ) is calculated as follows
MDy = TMfuelledy + TMflaredy Equation A
Where Description Units
MDy Quantity of methane recovered and fuelled or flared in the year y tonnes CH4year
TMfuelledy Quantity of methane fuelled in the year y tonnes CH4year
TMflaredy Quantity of methane flared in year y tonnes CH4year
Where
TMfuelledy = FVfuelledh fvCH4h ηfuelledh ρCH4n) 1000 Equation B
Where Description Units
TMfuelledy Quantity of methane fuelled in the year y tonnes CH4year
FVfuelledh Volumetric flow rate of the fuelled biogas gas at normal conditions in
hour h
Nm3 biogashour
ηfuelledh 100 for gainful purpose26
fvCH4h Volumetric fraction of methane in the biogas gas in the hour h
ρCH4n Density of methane at normal conditions kgCH4Nm3CH4
And
TMflaredy = FVflaredh fvCH4h ηflareh ρCH4n) 1000 Equation C
Where Description Units
TMflaredy Quantity of methane flared in year y tonnes CH4year
FVflaredh Volumetric flow rate of the flared biogas gas at normal conditions in
hour h
Nm3 biogashour
26 AMS-IIIH point 35
PROJECT DESIGN DOCUMENT FORM (CDM-SSC-PDD) - Version 03
CDM ndash Executive Board
35
ηflareh Flare efficiency in the hour h
fvCH4h Volumetric fraction of methane in the biogas gas in the hour h
ρCH4n Density of methane at normal conditions kgCH4Nm3CH4
Data Parameter ID1 Qwwy
Data unit m3 month
Description The flow of wastewater entering the bio-digester
Source of data Measurement by project participant by using a flowmeter
Value of data ~ 28000
Brief description of
measurement methods and
procedures to be applied
The flow is measured with an online flow meter or equivalent
QAQC procedures to be
applied (if any) Data are monitored continuously and recorded periodically
(monthly or at shorter interval) in a data log file (DLF)
Uncertainty level of data low
Maintenance and calibration as per manufacturer‟s specifications
or at least once every three (3) years
Any comment
Data Parameter ID2 CODwwuntreatedy
Data unit tCOD m3
Description Raw COD of wastewater entering the bio-digester
Source of data Laboratory (internal and external)
Value of data ~ 0030230
Brief description of
measurement methods and
procedures to be applied
Measure of COD according to national or international standards
COD is measure through representative sampling
QAQC procedures to be
applied (if any) Minimum once a month COD sampling to ensure a 9010
confidenceprecision level
COD reports are recorded manually
Uncertainty level of data low
Maintenance and calibration as per manufacturer‟s specifications
or at least once every three (3) years for internal laboratory
equipment
Any comment
Data Parameter ID3 CODwwtreatedy
Data unit tCOD m3
Description COD of treated wastewater leaving the bio-digester
Source of data Laboratory (internal and external)
Value of data ~ 0003023
Brief description of
measurement methods and
procedures to be applied
Measure of COD according to national or international standards
COD is measure through representative sampling
QAQC procedures to be
applied (if any) Minimum once a month COD sampling to ensure a 9010
confidenceprecision level
COD reports are recorded manually
Uncertainty level of data low
PROJECT DESIGN DOCUMENT FORM (CDM-SSC-PDD) - Version 03
CDM ndash Executive Board
36
Maintenance and calibration as per manufacturer‟s specifications
or at least once every three (3) years for internal laboratory
equipment
Any comment
Data Parameter ID5 End-use of the final sludge
Data unit ndash
Description The final sludge generated by the project activity will be sent to control
landfill site if any
Source of data By project participant
Value of data ndash
Brief description of
measurement methods and
procedures to be applied
The final disposal of the sludge will be monitored during the crediting
period if any For each disposal of the sludge the following will be
recorded disposal site and date of disposal
QAQC procedures to be
applied (if any)
Any comment
Data Parameter ID6 FVflaredh
Data unit Nm3 hour
Description Volumetric flow of biogas recovered and flared at normal conditions in
the hour h
Source of data By project participant
Value of data 0
Brief description of
measurement methods and
procedures to be applied
The volume of biogas will be measured with a normalised flow meter or
calculated from the volumetric flow pressure temperature
Biogas volume and methane content measurements shall be on the same
basis (wet or dry)
QAQC procedures to be
applied (if any) The biogas flow is monitored continuously recorded and stored
electronically in a data log file (DLF) (monthly or at shorter
interval)
Data Parameter ID4 CODww dischargey
Data unit tCOD m3
Description COD of treated wastewater discharge into river by treatment system
Source of data Laboratory (internal and external)
Value of data ~ 0000100
Brief description of
measurement methods and
procedures to be applied
Measure of COD according to national or international standards
COD is measure through representative sampling
QAQC procedures to be
applied (if any) Minimum once a month COD sampling to ensure a 9010
confidenceprecision level
COD reports are recorded manually
Uncertainty level of data low
Maintenance and calibration as per manufacturer‟s specifications
or at least once every three (3) years for internal laboratory
equipment
Any comment
PROJECT DESIGN DOCUMENT FORM (CDM-SSC-PDD) - Version 03
CDM ndash Executive Board
37
Uncertainty level of data low
Maintenance and calibration as per manufacturer‟s specifications
or at least once every 3 years
Any comment
Data Parameter ID7 FVfuelledgas engineh
Data unit Nm3 hour
Description Volumetric flow of biogas recovered and fuelled (gas engine) at normal
conditions in the hour h
Source of data By project participant
Value of data ~ 509
Brief description of
measurement methods and
procedures to be applied
The volume of biogas will be measured with a normalised flow meter or
calculated from the volumetric flow of biogas pressure temperature
Biogas volume and methane content measurements shall be on the same
basis (wet or dry)
QAQC procedures to be
applied (if any) The biogas flow is monitored continuously recorded and stored
electronically in a data log file (DLF) (monthly or at shorter
interval)
Uncertainty level of data low
Maintenance and calibration as per manufacturer‟s specifications
or at least once every 3 years
Any comment
Data Parameter ID8 FVfuelledboilerh
Data unit Nm3 hour
Description Volumetric flow of biogas recovered and fuelled (boilers) at normal
conditions in the hour h
Source of data By project participant
Value of data ~ 0
Brief description of
measurement methods and
procedures to be applied
The volume of biogas will be measured with a normalised flow meter or
calculated from the volumetric flow of biogas pressure temperature
Biogas volume and methane content measurements shall be on the same
basis (wet or dry)
QAQC procedures to be
applied (if any) The biogas flow is monitored continuously recorded and stored
electronically in a data log file (DLF) (monthly or at shorter
interval)
Uncertainty level of data low
Maintenance and calibration as per manufacturer‟s specifications
or at least once every 3 years
Any comment
Data Parameter ID9 wCH4h
Data unit
Description Methane content in biogas in same basis (wetdry) as the biogas flows in
year y
Source of data By project participant using a gas analyzer
Value of data ~ 60
PROJECT DESIGN DOCUMENT FORM (CDM-SSC-PDD) - Version 03
CDM ndash Executive Board
38
Brief description of
measurement methods and
procedures to be applied
Using calibrated gas analyzer either continuous or periodical
measurement at confidenceprecision level of 9010
QAQC procedures to be
applied (if any) In case a continuous gas analyser is used data will be recorded
and stored electronically in a data log file (DLF) every hour or at
shorter interval
Uncertainty level of data low
Maintenance and calibration as per manufacturer‟s specifications
or at least once every 3 years
Any comment See also clarification by EB Meth Panel 30102009 ndash SSC_360
httpcdmunfcccintUserManagementFileStorageAM_CLAR_
QS83SX5B7WM6UGZE31JYQEQ4F65F6V
The biogas flow and the methane content measurements shall be
carried out close to each others
Data Parameter ID10 Tbiogas
Data unit ordmC
Description Temperature of biogas
Source of data Temperature probe
Value of data 20 ndash 65
Brief description of
measurement methods and
procedures to be applied
By project participant
QAQC procedures to be
applied (if any) Shall be measured and recorded at the same time when methane
content in biogas (ID8) is measured
Uncertainty level of data low
Maintenance and calibration as per manufacturer‟s specifications
or at least once every 3 years
Any comment Pressure and temperature are required to determine the density of
the methane If the biogas flow meter employed measures flow
pressure and temperature and displaysoutputs normalised flow of
biogas there is no need to separate monitoring of pressure and
temperature of the biogas
Data Parameter ID11 Pbiogas
Data unit Bar(g)
Description Pressure of biogas
Source of data By project participant
Value of data 50 ndash 200 mbar
Brief description of
measurement methods and
procedures to be applied
Pressure measurement device
QAQC procedures to be
applied (if any) Shall be measured and recorded at the same time when methane
content in biogas (ID8) is measured
Uncertainty level of data low
Maintenance and calibration as per manufacturer‟s specifications
or at least once every three (3) years
Any comment Pressure and temperature are required to determine the density of
the methane If the biogas flow meter employed measures flow
PROJECT DESIGN DOCUMENT FORM (CDM-SSC-PDD) - Version 03
CDM ndash Executive Board
39
pressure and temperature and displaysoutputs normalised flow of
biogas there is no need to separate monitoring of pressure and
temperature of the biogas
Shall be measured at the same time when methane content in
biogas (ID9) is measured
Parameter ID12 ηflareh (enclosed flare)
Unit
Description Enclosed flare efficiency in the hour h
Source of data Calculated
Value of data 0 or 50 or 90
Brief description of
measurement methods and
procedures to be applied
This yearly efficiency will be based on hourly flare efficiencies calculated
as per the provisions in the ldquoTool to determine project emissions from
flaring gases containing methanerdquo
The hourly flare efficiency will be calculated based on
0 if the temperature in the exhaust gas of the flare (Tflare) is
below 500 degC for more than 20 minutes during the hour h
50 if the temperature in the exhaust gas of the flare (Tflare) is
above 500 degC for more than 40 minutes during the hour h but the
manufacturer‟s specifications on proper operation of the flare are
not met at any point in time during the hour h
90 if the temperature in the exhaust gas of the flare (Tflare) is
above 500 degC for more than 40 minutes during the hour h and the
manufacturer‟s specifications on proper operation of the flare are
met continuously during the hour h
QAQC procedures to be
applied (if any) Data are logged hourly in a data log file (DLF)
Uncertainty level of data low
Any comment For enclosed flare
Or
Parameter ID13 ηflareh (open flare)
Unit
Description Flare efficiency in the hour h
Source of data Calculated
Value of data 0 or 50
Brief description of
measurement methods and
procedures to be applied
This yearly efficiency will be based on hourly flare efficiencies calculated
as per the provisions in the ldquoTool to determine project emissions from
flaring gases containing methanerdquo
The hourly flare efficiency will be calculated based on the duration of
time during which the flame is detected by the thermocouple (or flame
detector) installed in the open flare
Flare efficiency in hour h is based on default values
0 if the flame detected for not more than 20 minutes during the
hour h and
PROJECT DESIGN DOCUMENT FORM (CDM-SSC-PDD) - Version 03
CDM ndash Executive Board
40
50 if the flame detected for more than 20 minutes during the
hour h
A flame detector or thermocouple will be used
QAQC procedures to be
applied (if any) Data are logged hourly in a data log file (DLF)
Uncertainty level of data low
Any comment The only monitored parameter related to the flare is its efficiency Indeed
according to the clarification SSC_19927 of the methodology AMS IIIH
version 9 accepted by the SSC WG on the 3092008 ldquoIf a thermocouple
is used as a flame detection system it is sufficient to reach the given
minimum temperature from the manufacturer ldquo Hence it is not necessary
to monitor the temperature of the open type flares (Tflare)
Data Parameter ID14 ECPJjy
Data unit MWh
Description The yearly grid electricity consumption of the project activity for the year
bdquoy‟
Source of data Onsite instrument
Value of data ~749
Brief description of
measurement methods and
procedures to be applied
The grid electricity consumption of the project activity is measured
continuously with an energy meter (cumulative reading)
QAQC procedures to be
applied (if any) Data are monitored continuously and recorded periodically
(yearly or at shorter interval) in a data log file (DLF)
Uncertainty level of data low
Maintenance and calibration as per manufacturer‟s specifications
or at least once every three (3) years
Any comment
Data Parameter ID15 EGBLy
Data unit MWh
Description Quantity of net electricity generated and send to grid in year y
Source of data By project participant
Value of data ~ 6798
Brief description of
measurement methods and
procedures to be applied
The electricity generated and sent to grid is measured continuously with
an energy meter (cumulative readings)
QAQC procedures to be
applied (if any) Data are monitored continuously and recorded periodically
(yearly or at shorter interval) in a data log file (DLF)
Uncertainty level of data low
Maintenance and calibration as per manufacturer‟s specifications
or at least once every 3 years
Any comment As per AMS-ID
27 The clarification SSC_199 if available here (last access on the 24052011)
httpcdmunfcccintfilestorageAM_AM_CLAR_HIOZ5CS1PASC187C0JQ668L2E9RCRJResponse20WG20provided
20at20SSC20WG2017pdft=bU98MTMwNjIxNjY0OS4xMQ==|BOKHqtO94N6XF1N2N1vo8Ori-Rc=
PROJECT DESIGN DOCUMENT FORM (CDM-SSC-PDD) - Version 03
CDM ndash Executive Board
41
Or
Data Parameter ID16 EGmilly
Data unit MWh
Description Quantity of annual output of renewable energy sent to the mill in year y
Source of data By project participant
Value of data ~ 0
Brief description of
measurement methods and
procedures to be applied
The electricity generated and sent to mill to displace diesel use in diesel
gensets is measured continuously with an energy meter (cumulative
readings)
QAQC procedures to be
applied (if any) Data are monitored continuously and recorded periodically
(yearly or at shorter interval) in a data log file (DLF)
Uncertainty level of data low
Maintenance and calibration as per manufacturer‟s specifications
or at least once every 3 years
Any comment As per AMS-IA
Data Parameter ID17 Displacement of Biomass
Data unit Mt
Description Total amount of biomass (PKS) displaced from biomass boilers
Source of data Weighing bridge
Value of data Measurement at site
Brief description of
measurement methods and
procedures to be applied
Biomass (PKS) displaced due to the project activity will be weighed
using weighing bridge at the palm oil mill
QAQC procedures to be
applied (if any) Monthly calculation based on every single trip of trucks recorded
Data is recorded manually in a data log file based on the weighing
records
Maintenance and calibration as per manufacturer‟s specifications
Uncertainty level of data low
Any comment In the project activity the biomass (PKS) displaced will not be stored
under anaerobic conditions The conditions of onsite storage are identical
in the baseline as in the project activity The biomass will be sold to the
market on a regular basis PEbiomassy = 0
A final monitoring plan will be prepared prior the initial verification based on the as-built project activity
It will address the following aspects
MONITORING
The Project will be managed by CME with the involvement from Project Implementer CME will ensure
safety in operation of the plant as well as in the monitoring of emission reduction which is generated from
the project activity
CME will implement and be responsible for the monitoring plan Their responsibility covers operation of
the monitoring maintenance of the monitoring equipment data collection and archiving and
management of total scheme of the monitoring CME and Project Implementer will assign specific trained
PROJECT DESIGN DOCUMENT FORM (CDM-SSC-PDD) - Version 03
CDM ndash Executive Board
42
personnel during project implementation for the overall monitoring measurement and reporting of key
parameters as required in this PDD
DATA LOGGING AND STORAGE
The data measured by the instruments will be collected and stored in a data logging system The data will
be retrieved remotely by modem or directly on site
If data cannot be retrieved no emissions reductions will be claimed for the period of data failure The
data collected will be recorded in a central data base Access to production data will be restricted All
records and data (hard copy and soft copy) will be archived up to two years after the end of the crediting
period or the last issuance of CERs for this project activity whichever occurs later
CALIBRATION AND MAINTENANCE PROCEDURES MALFUNCTION OF EQUIPMENT
Maintenance includes all preventive and corrective actions necessary for the good functioning of the
equipment such as
Visual control of the equipment state and real-time check of displayed parameters
Cleaning up the equipment and the sensors
Adding lubricant
Replacement and change of defective parts
Calibration of equipment consists in verifying by comparison with a standard the accuracy of a
measuring instrument
Measuring instruments will be periodically and appropriately calibrated according to the procedures
timing and methods recommended by the manufacturer or nationalinternational standards as available
General malfunction of equipment
Daily inspections of the equipment will allow controlling equipment failure If equipment fails the
supplier will be notified and repairs will be carried out If the damaged equipment cannot be repaired it
will be replaced at the earliest In some cases portable tools will be used in order to carry out daily
monitoring of the missing parameter(s) In such case this data will be recorded manually
Discrepancies
To avoid discrepancies between projected data in the PDD and actual data (eg due to deferred starting
date malfunction of equipment) cross-checks between internal meter readings and external sources (eg
electricity invoices) will be carried out Any source of inconsistencies will be clarified
Case of emergency
For the case of emergency (earthquakes explosions fires etc) an emergency preparedness plan will be
adapted to the project activity All employees involved in the project on-site will be trained in the code of
conduct and required actions at time of commissioning of the plant
PROJECT DESIGN DOCUMENT FORM (CDM-SSC-PDD) - Version 03
CDM ndash Executive Board
43
OPERATIONAL AND MANAGEMENT STRUCTURE
The CDM monitoring team will be composed by the following staff
Position Report to
Operators
Project owner Supervisors (technicalmaintenance)
Operation Engineer
CDM monitoring project manager External CDM consultant
TRAINING OF MONITORING PERSONNEL
The maintenance will be conducted in-house by staff employed and trained by the Project Participants
Employees involved in the monitoring will be trained internally andor externally Training may include
inter alia
a) Review of equipment and captors
b) Calibration requirement
c) Configuration of monitoring equipment
d) Maintenance requirement
C1 Please indicate the level at which environmental analysis as per requirements of the CDM
modalities and procedures is undertaken Justify the choice of level at which the environmental
analysis is undertaken
radic Please tick if this information is provided at the PoA level In this case sections C2 and C3
need not be completed in this form
C2 Documentation on the analysis of the environmental impacts including transboundary
impacts
The host country does not require an analysis of environmental impacts As the project involves reduction
of GHG through recovery and controlled combustion which improves the quality of air therefore there
are no significant environmental impacts identified
C3 Please state whether an environmental impact assessment is required for a typical CPA
included in the programme of activities (PoA) in accordance with the host Party lawsregulations
In accordance with Malaysia environmental regulations Environmental Quality (Prescribed Activities
Environmental Impact Assessment) Order 1987 an Environmental Impact Assessment (EIA) is not
required for this CPA
PROJECT DESIGN DOCUMENT FORM (CDM-SSC-PDD) - Version 03
CDM ndash Executive Board
44
SECTION D Stakeholdersrsquo comments
D1 Please indicate the level at which local stakeholder comments are invited Justify the
choice
Please tick if this information is provided at the PoA level In this case sections D2 to D4 need
not be completed in this form
D2 Brief description how comments by local stakeholders have been invited and compiled
The stakeholder meeting was conducted at the office of Kilang Sawit Felda Triang on 05032012 There
were 37 stakeholders attending the consultation Posters were pasted at the guard house and at the
entrance to office 1 week before the stakeholder consultation to inform the locals stakeholders which
comprise mostly the workers of the mill 20 stakeholders out of the 37 who attended the consultation are
2nd generation of the Felda settlers who live in the vicinity to the project activity and adequately represent
the local community composed entirely of Felda settlers (no other people live in the vicinity of this
remote plantation) Continuous input of ideascomments were allowed to all stakeholders who could
either send their input though an email account especially setup for the biogas project or directly inform
the project proponents
During the meeting presentations were made by the project owner to outline the proposed project activity
in a non-technical manner (including environmental social and technological considerations) climate
change and the role of the CDM Attendees were given opportunity to raise their concern and opinion
about the proposed project activity during the question and answer session
D3 Summary of the comments received
PROJECT DESIGN DOCUMENT FORM (CDM-SSC-PDD) - Version 03
CDM ndash Executive Board
45
Below are the questions raised during the stakeholder meeting
NAME QUESTION
Mohd Tarmizi Bin Mat
Daud What is CDM in Bahasa Malaysia
Mohd Tarmizi Bin Mat
Daud What is DoE‟s standard for treated water released into river
Mohd Azizi Bin Abdul
Aziz
Would the biogas be captured from the existing effluent treatment ponds or a
new structure
Azhar Bin Abdul What to do with the captured biogas from the bioreactor
D4 Report on how due account was taken of any comments received
Below are the answers to the questions asked during the stakeholder meeting
QUESTION ANSWER
What is CDM in Bahasa Malaysia
The meaning of CDM in Bahasa Malaysia is Mekanisme
Pembangunan Bersih or in English is Clean Development
Mechanism
By Abd Karim Bin Mohd Zin
What is DoE‟s standard for treated
water released into river
The discharge standard for BOD into river is less than 100ppm
By Abd Karim Bin Mohd Zin
Would the biogas be captured from
the existing effluent treatment
ponds or a new structure
New bioreactor will be constructed to replace the existing anaerobic
lagoon treatment system The new bioreactor will capture the
biogas produced from this anaerobic treatment process
By Abd Karim Bin Mohd Zin
What to do with the captured
biogas from the bioreactor
The biogas recovered from the bioreactor will mainly contain
methane (approximately 60) and the rest are CO2 H2 and H2S
Currently the biogas is just released to the atmosphere from the
existing open lagoons system During the project activity captured
biogas will be combusted thus will improve the air quality
By Abd Karim Bin Mohd Zin
PROJECT DESIGN DOCUMENT FORM (CDM-SSC-PDD) - Version 03
CDM ndash Executive Board
46
Annex 1
CONTACT INFORMATION ON ENTITYINDIVIDUAL RESPONSIBLE FOR THE SMALL-
SCALE CPA
Organization Felda Palm Industries Sdn Bhd (359584-V)
StreetPOBox Jalan Gurney 1
Building Balai Felda 4th Floor
City Kuala Lumpur
StateRegion Wilayah Persekutuan
PostfixZIP 54000
Country Malaysia
Telephone (03) 2692 8066
FAX (03) 2693 4148
URL wwwfeldanetmy
Represented by
Title Head of Department
Salutation Mr
Last Name Busu
Middle Name
First Name Zainuri
Department Biomass
Mobile
Direct FAX
Direct tel
Personal E-Mail zainuribfeldanetmy
Organization Ably Carbon Sdn Bhd
StreetPOBox Jalan Ipoh Kecil
Building No 17
City Kuala Lumpur
StateRegion
PostfixZIP 50350
Country Malaysia
Telephone +60 3 4042 1177
FAX +60 3 4044 4166
E-Mail stephanevidailletably-carboncom
URL
Represented by Stephane Vidaillet
Title Chairman
Salutation Mr
Last Name Vidaillet
Middle Name
First Name Steacutephane
Department
Mobile +33 6 59111 5600
Direct FAX
PROJECT DESIGN DOCUMENT FORM (CDM-SSC-PDD) - Version 03
CDM ndash Executive Board
47
Direct tel
Personal E-Mail stephanevidailletably-carboncom
PROJECT DESIGN DOCUMENT FORM (CDM-SSC-PDD) - Version 03
CDM ndash Executive Board
48
Annex 2
INFORMATION REGARDING PUBLIC FUNDING
The project activity is not receiving any funding from parties included in Annex 1 of the Kyoto Protocol
SMALL-SCALE CDM PROGRAMME ACTIVITY DESIGN DOCUMENT FORM (CDM-SSC-CPA-DD) - Version 01
NAME TITLE OF THE PoA Biogas Recovery and Utilization PoA Projects in
Malaysia
CDM ndash Executive Board page 49
This template shall not be altered It shall be completed without modifyingadding headings or logo format or font
Annex 3
BASELINE INFORMATION
1 2
Year 2009 2010 2011 2012 2013 2014
FFB (mtyr) 343720 345910 310250 333293 333293 333293
POME Volume
(cumyr)[1] 343720 345910 310250 333293 333293 333293
Mill Opearing hour (hryr) 68865 69225 6209 6673 6673 6673
PKS (mtyr) 18905 19025 17064 18331 18331 18331
3 4 5 6 7 8 9 10
2015 2016 2017 2018 2019 2020 2021 2022
333293 333293 333293 333293 333293 333293 333293 333293
333293 333293 333293 333293 333293 333293 333293 333293
6673 6673 6673 6673 6673 6673 6673 6673
18331 18331 18331 18331 18331 18331 18331 18331
SMALL-SCALE CDM PROGRAMME ACTIVITY DESIGN DOCUMENT FORM (CDM-SSC-CPA-DD) - Version 01
NAME TITLE OF THE PoA Biogas Recovery and Utilization PoA Projects in
Malaysia
CDM ndash Executive Board page 50
This template shall not be altered It shall be completed without modifyingadding headings or logo format or font
10 days measurement campaign for baseline wastewater treatment system
Day Date
ETP
Inlet
Anaerobic
system (mgl)
Outlet
Anaerobic
system (mgl)
Outlet Algae
System (mgl)
Final
Discharge to
River (mgl)
1 23-Feb-12 35693 3120 811 603
2 25-Feb-12 19511 2559 1186 83
3 26-Feb-12 32864 2767 749 437
4 27-Feb-12 30195 2330 1210 404
5 28-Feb-12 32436 1927 1188 941
6 29-Feb-12 38259 4256 896 717
7 1-Mar-12 28717 3584 1232 695
8 3-Mar-12 31002 4660 1658 1210
9 4-Mar-12 22400 4346 1389 963
10 5-Mar-12 31226 4301 1971 1165
Average 30230 3385 1229 722
ETP
COD removal efficiency (anaerobic system) 8880
COD removal efficiency (Facultativealgae system) 6369
COD removal efficiency (Bio-polishing system) 4127
Total COD removal efficiency of the treatment system 9761
The COD of the raw effluent during ex-post may vary from the one year historical records depending on
the improvement of the production process (outside of project boundary) thus ERex-post may vary from the
estimated ERex-ante
SMALL-SCALE CDM PROGRAMME ACTIVITY DESIGN DOCUMENT FORM (CDM-SSC-CPA-DD) - Version 01
NAME TITLE OF THE PoA Biogas Recovery and Utilization PoA Projects in
Malaysia
CDM ndash Executive Board page 51
This template shall not be altered It shall be completed without modifyingadding headings or logo format or font
Annex 4
MONITORING INFORMATION
General information
Monitoring refers to the collection and archiving of all relevant data necessary for determining the
baseline measuring anthropogenic emissions by sources of greenhouse gases (GHG) within the project
boundary of a CDM project activity and leakage It includes developing suitable data collection methods
and data interpretation techniques for monitoring and verification of GHG emissions
On-line monitoring system
Most key meters required to determine GHG emissions and emission reductions will be monitored from a
central control point which will record meter readings at a pre-determined interval
Ensuring adequate maintenance and calibration of monitoring instruments
Specific maintenance repair or replacement of monitoring equipment will be recorded dated and
described
The calibration will occur at intervals determined on the basis of instrument manufacturers
recommendations stability purpose usage and history of repeatability Recalibration should be
performed whenever an event occurs that places the accuracy of the instrument in doubt
Calibration will take place at least once every three (3) years to ensure that the monitoring
equipments are properly installed and functioning properly
Calibration will be performed according to national or international standards
Last calibration certificates will be provided during periodic verification
Sampling procedure
Wherever a statistical sample is used for monitoring the ldquogeneral guidelines for sampling and surveys for
SSC project activitiesrdquo shall be used COD shall be measured from a composite sample to obtain a
representative value
Data archiving
The monitored data will be kept for a minimum of 2 years after the end of the crediting years by using
paper documents or electronic files
Identification of non-conformities
A verification of inconsistencies of the data recorded will be performed based for example on
The comparison of the calculated quantities of methane versus expected
Spot checks of field instruments (local reading) and data in the log file
Any discrepancies (completeness calculation errors transcription errors instrument calibration issues)
will be analyzed and actions taken to correct the problem
Ensuring adequate training of staff
All new staff members will undergo bdquoon job training‟ covering the monitoring requirements
The monitoring plan will be made available to staff member involved in the monitoring
A copy will be located in the control room at the site
SMALL-SCALE CDM PROGRAMME ACTIVITY DESIGN DOCUMENT FORM (CDM-SSC-CPA-DD) - Version 01
NAME TITLE OF THE PoA Biogas Recovery and Utilization PoA Projects in
Malaysia
CDM ndash Executive Board page 52
This template shall not be altered It shall be completed without modifyingadding headings or logo format or font
During the training the employees will sign a training attendance list All training records shall
be documented inclusive of training attendance training memo and training material if any
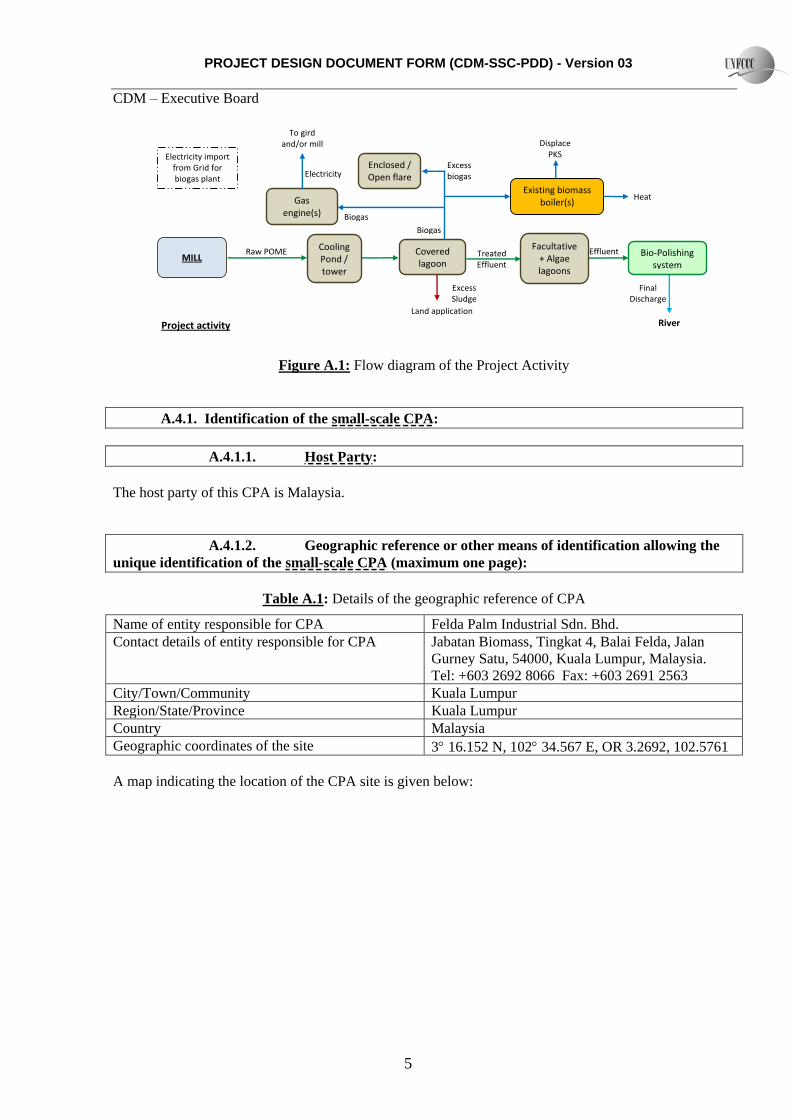
PROJECT DESIGN DOCUMENT FORM (CDM-SSC-PDD) - Version 03
CDM ndash Executive Board
7
The length of the first crediting period of the CPA6 will be 7 years
A44 Estimated amount of emission reductions over the chosen crediting period
Years Annual estimation of emission reductions in tonnes of CO2e
2012 2440
2013 29280
2014 29280
2015 29280
2016 29280
2017 29280
2018 29280
2019 26840
Total estimated reductions
(tonnes of CO2e) 204960
Total number of crediting years 7
Annual average over the crediting
period of estimated reductions
(tonnes of CO2e)
29280
The starting date of the crediting period is 01122012 or the date of its inclusion in the PoA whichever
is later
A45 Public funding of the CPA
The project has not received and will not be seeking public funding from Annex 1 countries
A46 Information to confirm that the proposed small-scale CPA is not a de-bundled
component
1 For the purposes of registration of a Programme of Activities (PoA)7 a proposed small-scale CPA
of a PoA shall be deemed to be a de-bundled component of a large scale activity if there is
already an activity8 which
(a) Has the same activity implementer as the proposed small scale CPA or has a coordinating
or managing entity which also manages a large scale PoA of the same sectoral scope and
(b) The boundary is within 1 km of the boundary of the proposed small-scale CPA at the
closest point
6 Please note that the duration of crediting period of any CPA shall be limited to the end date of the PoA regardless of when
the CPA was added 7 Only those POAs need to be considered in determining de-bundling that are (i) in the same geographical area and (ii) use
the same methodology as the POA to which proposed CPA is being added 8 Which may be a (i) registered small-scale CPA of a PoA (ii) an application to register another small-scale CPA of a PoA or
(iii) another registered CDM project activity
PROJECT DESIGN DOCUMENT FORM (CDM-SSC-PDD) - Version 03
CDM ndash Executive Board
8
2 If a proposed small-scale CPA of a PoA is deemed to be a debundled component in accordance
with paragraph 2 above but the total size of such a CPA combined with a registered small-scale
CPA of a PoA or a registered CDM project activity does not exceed the limits for small-scale
CDM and small-scale AR project activities as set out in Annex II of the decision 4CMP1 and
5CMP1 respectively the CPA of a PoA can qualify to use simplified modalities and procedures
for small-scale CDM and small-scale AR CDM project activities
The CPA implementer is also implementing other methane recovery project activities but these projects
are more than 1km away from the proposed small-scale CPA at the closest point Therefore the proposed
CPA is not a de-bundled component of a large scale project activity as it does not satisfy any of the above
provisions
A47 Confirmation that small-scale CPA is neither registered as an individual CDM
project activity or is part of another Registered PoA
The project information of this CPA has been checked against the PoA and CDM database available on
UNFCCC website and no duplicate entries were identified It is confirmed that the proposed CPA is
neither registered as an individual CDM project activity nor is part of another PoA This has also been
confirmed by the project implementer Felda Palm Industrial Sdn Bhd
SECTION B Eligibility of small-scale CPA and Estimation of emissions reductions
B1 Title and reference of the Registered PoA to which small-scale CPA is added
Regional Biogas PoA
Version 10
Date 12032012
B2 Justification of the why the small-scale CPA is eligible to be included in the Registered PoA
Table B1 Eligibility of CPA to be included in the Registered PoA
Ndeg Criteria Justification
1 Geographical boundary The CPA takes
place within the borders of Malaysia
The proposed CPA-1 is located in the state of
Pahang Malaysia with GPS coordinates of 3
16152 N 102 34567 E OR 32692 1025761
2 No double counting
The CPA is not already included in another
PoA or developed as a stand-alone CDM
project
The proposed CPA is not already included in
another PoA or developed as a stand-alone CDM
project
PROJECT DESIGN DOCUMENT FORM (CDM-SSC-PDD) - Version 03
CDM ndash Executive Board
9
3
Applicability conditions of AMS-IIIH
a) Substitution of aerobic wastewater or
sludge treatment systems with anaerobic
systems with biogas recovery and
combustion
b) Introduction of anaerobic sludge
treatment system with biogas recovery
and combustion to a wastewater
treatment plant without sludge
treatment
c) Introduction of biogas recovery and
combustion to a sludge treatment
system
d) Introduction of biogas recovery and
combustion to an anaerobic wastewater
treatment system such as anaerobic
reactor lagoon septic tank or an on site
industrial plant
e) Introduction of anaerobic wastewater
treatment with biogas recovery and
combustion with or without anaerobic
sludge treatment to an untreated
wastewater stream
f) Introduction of a sequential stage of
wastewater treatment with biogas
recovery and combustion with or
without sludge treatment to an
anaerobic wastewater treatment system
without biogas recovery (eg
introduction of treatment in an
anaerobic reactor with biogas recovery
as a sequential treatment step for the
wastewater that is presently being
treated in an anaerobic lagoon without
methane recovery)
The CPA is applying Option (f)
Introduction of a sequential stage of wastewater
treatment with biogas recovery and combustion
with or without sludge treatment to an anaerobic
wastewater treatment system without biogas
recovery (eg introduction of treatment in an
anaerobic reactor with biogas recovery as a
sequential treatment step for the wastewater that is
presently being treated in an anaerobic lagoon
without methane recovery)
4(a) The recovered methane measured may also
be utilized for thermal or mechanical
electrical generation directly ndash AMS-IIIH
para 3(a)
The recovered biogas may be used for electricity
generation through combustion in biogas engine(s)
system andor biomass boiler(s) for heat
generation Excess biogas if any will be flared
This in compliance with only AMS-IIIH
paragraph 3(a) and not the others
4(b) The recovered methane measured may also
be utilized for thermal or mechanical
electrical energy generation after bottling of
upgraded biogas ndash AMS-IIIH para 3(b)
Not applicable
4(c) The recovered methane measured may also
be utilized for thermal or mechanical
electrical energy generation after upgrading
and distribution ndash AMS-IIIH para 3(c)
Not applicable
4(d) The recovered methane measured may also Not applicable
PROJECT DESIGN DOCUMENT FORM (CDM-SSC-PDD) - Version 03
CDM ndash Executive Board
10
be utilized for hydrogen production ndash AMS-
IIIH para 3(d)
4(e) The recovered methane measured may also
be utilized for use as fuel in transportation
applications after upgrading ndash AMS-IIIH
para 3(e)
Not applicable
5 If the recovered biogas is used for project
activities covered under AMS-IIIH
paragraph 3(a) that component of the
project activity can use a corresponding
methodology under Type I
The recovered biogas is planned for gainfully use
for electricity andor heat generation in the CPA
The approved baseline and monitoring
methodology AMS IA (version 14) andor AMS-
ID (version 17) are used for the electricity
component of the CPA
6 Conditions that ensure compliance with
applicability and other requirements of
single or multiple methodologyies applied
by CPA
The proposed CPA-01 will apply AMS-IIIH
AMS-IA andor AMS-ID Applicability criteria
are listed below
7 The project has to fulfill Host Country
National CDM criteria if any
Malaysia‟s National CDM criteria have been
fulfilled by the proposed CPA
8 The starting date of CPA is compliant with
the latest UNFCCC guidelines
The start date of the CPA is not or will not be
prior to the commencement of validation of the
PoA The EPC contract for biogas plant yet to be
awarded
9 Confirmation that the CPA does not involve
any public funding from Annex I Parties or
that in case public funding is used it does
not result in diversion of Official
Development Assistance (ODA)
The proposed CPA has not received and will not
be seeking public funding from Annex 1 countries
10 A local Stakeholder consultation has been
conducted prior to the CPA inclusion
Stakeholder consultation has been organized on
05032012 and it is prior to the CPA inclusion
11 Conditions pertaining to the demonstration
of additionality of each small scale CPA to
be included (less than 60 ktCO2 year) for
Type III and 15MW for Type I
methodologies
The proposed CPA may install gas engine with
maximum capacity of 12 MW and methane
avoidance of less than 60000 tCO2yr for AMS-
IIIH
12 Where applicable the conditions that ensure
that CPA in aggregate meets the small-scale
threshold criteria and remain within this
threshold throughout the crediting period of
the CPA
The proposed CPA may install gas engine with
maximum capacity of 12 MW and methane
avoidance of less than 60000 tCO2yr for AMS-
IIIH
13 Where applicable the requirements for the
debundling check in case CPAs belong to
small-scale (SSC) project categories
The proposed CPA is not a debundled component
of a large activity as described in the latest
ldquoGuidelines on assessment of debundling for SSC
project activitiesrdquo
14 Where applicable the conditions related to
sampling requirements for a PoA in
accordance with the approved
guidelinesstandard from the Board
pertaining to sampling and surveys
Not applicable all CPAs will be verified
15 Where applicable target group (eg The target group is prospective POME plants in
PROJECT DESIGN DOCUMENT FORM (CDM-SSC-PDD) - Version 03
CDM ndash Executive Board
11
domesticcommercialindustrial ruralurban
grid-connectedoff-grid) and distribution
mechanisms (eg direct installation)
Malaysia There are no specific distribution
mechanisms
16 Whether an EIA is required by local
authorities
Not applicable for the proposed CPA as EIA is not
required
17 The crediting period of the CPA shall not
exceed the length of the PoA (ie 28 years)
regardless of the time of inclusion of CPA in
the PoA
The crediting period of the proposed CPA will not
exceed the length of PoA 28 years
Additional eligibility criteria applicable in case of CPA that gainfully use of biogas for electrical
andor thermal energy generation
The proposed project conforms to the applicable requirements of AMS - ID version 17
Applicability Criteria Justification
This methodology comprises renewable energy
generation units such as photovoltaic hydro
tidalwave wind geothermal and renewable biomass
a) Supplying electricity to a national or a regional
grid
b) Supplying electricity to an identified consumer
facility via nationalregional grid through a
contractual arrangement such as wheeling
Applicable The proposed project activity is
based on biogas recovered from anaerobic bio-
digester a renewable energy generation source
The proposed project shall supply electricity to
the national grid
The project activity is not supplying electricity
to an identified consumer facility
This methodology is applicable to project activities that
(a) Install a new power plant at a site where there was
no renewable energy power plant operating prior
to the implementation of the project activity
(Greenfield plant)
(b) Involve a capacity addition
(c) Involve a retrofit of (an) existing plant(s)
(d) Involve a replacement of (an) existing plant(s)
Applicable to (a) where the proposed project
activity shall install a new power plant at a site
where there was no renewable energy power
plant operating prior to the implementation of
the project activity
Hydro power plants with reservoirs that satisfy at least
one of the following conditions are eligible to apply this
methodology
Not applicable The project activity is a biogas
recovery and utilization project
If the new unit has both renewable and non-renewable
components (eg a winddiesel unit) the eligibility limit
of 15MW for a small-scale CDM project activity applies
only to the renewable component If the new unit co-
fires fossil fuel the capacity of the entire unit shall not
exceed the limit of 15MW
Not applicable The project does not
incorporate a mix of renewable and non-
renewable components
Combined heat and power (co-generation) systems are
not eligible under this category
Applicable There is no combined heat and
power component in the project activity
PROJECT DESIGN DOCUMENT FORM (CDM-SSC-PDD) - Version 03
CDM ndash Executive Board
12
In the case of project activities that involve the addition
of renewable energy generation units at an existing
renewable power generation facility the added capacity
of the units added by the project should be lower than
15 MW and should be physically distinct from the
existing units
Not applicable The project activity does not
involve the addition of renewable energy
generation units at an existing facility
In the case of retrofit or replacement to qualify as a
small-scale project the total output of the retrofitted or
replacement unit shall not exceed the limit of 15 MW
Not applicable The project activity does not
seek to retrofit or replacement an existing
facility
The proposed project conforms to the applicable requirements of AMS - IA version 14
Applicability Criteria Justification
This category comprises renewable electricity
generation units that supply individual Households
users or groups of households users included in the
project boundary The applicability is limited to
individual households and users that do not have a grid
connection except when
a) A group of households or users are supplied
electricity through a standalone mini grid powered
by renewable energy generation unit(s) where the
capacity of the generating units does not exceed 15
MW or
b) The emissions reduction per renewable energy
based lighting system is less than 5 tonnes of CO2e
a year and where it can be shown that fossil fuel
would have been used in the absence of the project
activity by
(i) A representative sample survey (90
confidence interval plusmn10 error margin) of
target households or
(ii) Official statistics from the host country
government agencies
The renewable energy generation units include
technologies such as solar hydro wind biomass
gasification and other technologies that produce
electricity all of which is used on-sitelocally by the
user
The renewable generating units may be new
installations (Greenfield) or replace existing onsite
fossil-fuel-fired generation To qualify as a small-scale
project the total output of the unit(s) shall not exceed
the limit of 15 MW
Applicable The proposed project activity is not
grid connected
Furthermore the total installed capacity of the
generating units will not exceed 15 MW
Applicable The project activity involves the
combustion of the recovered biogas from the
anaerobic bio-digester for electricity generation
to be use on-site
Applicable The project activity involve the
replacement of existing onsite fossil fuel fired
generation and the total installed capacity is not
PROJECT DESIGN DOCUMENT FORM (CDM-SSC-PDD) - Version 03
CDM ndash Executive Board
13
exceed 15 MW
Hydro power plants with reservoirs that satisfy at least
one of the following conditions are eligible to apply this
methodology
The project activity is implemented in an existing
reservoir with no change in the volume of
reservoir
The project activity is implemented in an existing
reservoir where the volume of reservoir is
increased and the power density of the project
activity as per definitions given in the Project
Emissions section is greater than 4 Wm2
The project activity results in new reservoirs and
the power density of the power plant as per
definitions given in the Project Emissions section
is greater than 4 Wm2
Not applicable The project activity is not a
hydro power plant
Combined heat and power (co-generation) systems are
not eligible under this category
Applicable There is no combined heat and
power component in the project activity
If the unit added has both renewable and non-renewable
components (eg a winddiesel unit) the eligibility
limit of 15 MW for a small-scale CDM project activity
applies only to the renewable component If the unit
added co-fires fossil fuel the capacity of the entire unit
shall not exceed the limit of 15 MW
Not applicable The project does not
incorporate a mix of renewable and non-
renewable components
Project activities that involves retrofit or replacement of
an existing facility for renewable energy generation are
included in this category To qualify as a small-scale
project the total output of the modified or retrofitted
unit shall not exceed the limit of 15 MW
Not applicable The project activity does not
seek to retrofit or replacement an existing
facility
In the case of project activities that involve the addition
of renewable energy generation units at an existing
renewable power generation facility the added capacity
of the units added by the project should be lower than
15 MW and should be physically distinct3 from the
existing units
Not applicable The project activity does not
involve the addition of renewable energy
generation units at an existing facility
B3 Assessment and demonstration of additionality of the small-scale CPA as per eligibility
criteria listed in the Registered PoA
In Malaysia Environmental Quality (Prescribed Premises) (Crude Palm Oil) Regulation 1977 governs
environmental considerations including the wastewater treatment and discharge at palm oil mills The
regulation stipulates the discharge standards for water discharge or land application The regulation
however does not specify the required treatment technologies for wastewater or GHG emissions from
wastewater treatment operations
PROJECT DESIGN DOCUMENT FORM (CDM-SSC-PDD) - Version 03
CDM ndash Executive Board
14
More than 85 of palm oil mills are utilizing open based anaerobic ponds and it is considered the
prevailing practice for oil palm industry to treat the POME The open anaerobic ponds system is an
effective and low-tech solution that can easily meet the water discharge limits applicable to the palm oil
industry9 10
There is no financial incentive for the palm oil mill owners to invest into methane capture projects
particularly when there is no requirement under existing pending or planned national state or local
regulatory This is partly related to the fact that there are a lot of attractive and competing investments in
the sector However the PP has undertaken to set up this project in order to reduce the GHG emissions
and contribute his mite to the global GHG emission reduction
The project is a small scale project activity As such the provisions of Attachment A to Appendix B of
the simplified modalities and procedures for small-scale CDM project activities will apply to this project
The bdquoindicative simplified baseline and monitoring methodologies for selected small-scale CDM project
activity categories‟ require the project proponents to demonstrate that the project activity would not have
occurred anyway due to at least one of the following barriers
a) Investment barrier a financially more viable alternative to the project activity would have led to
higher emissions
b) Technological barrier a less technologically advanced alternative to the project activity involves
lower risks due to the performance uncertainty or low market share of the new technology
adopted for the project activity and so would have led to higher emissions
c) Barrier due to prevailing practice prevailing practice or existing regulatory or policy
requirements would have led to the implementation of a technology with higher emissions
d) Other barriers without the project activity for another specific reason identified by the project
participant such as institutional barriers or limited information managerial resources
organizational capacity financial resources or capacity to absorb new technologies emissions
would have been higher
Subsequently in its 35th Meeting the EB had issued bdquoNon-binding best practice examples to demonstrate
additionality for SSC project activities‟ wherein EB had given best practice examples of each of the
aforementioned category of barriers
The project participant has chosen Investment Barrier to demonstrate the additionality which is discussed
in the following paragraphs
Investment barrier
The most important of all the barriers faced by the company is the investment barrier The investment
analysis reveals that the project is not financially attractive The additionality tool permits the use of
simple cost analysis or investment comparison analysis or benchmark analysis to demonstrate the
additionality of the project
9 SD 05 ndash Yeoh B G 2004 A Technical and Economic Analysis of Heat and Power Generation from Biomethanation of
Palm Oil Mill Effluent Electrcity Supply Industry in Transition Issues and Prospect for Asia 10 SD 06 ndash Eco-Ideal Consulting Sdn Bhd (Eco-Ideal) 2004 MEWCPTMDANIDA Study on Clean Development
Mechanism Potential in the Waste Sectors in Malaysia Unpublished
PROJECT DESIGN DOCUMENT FORM (CDM-SSC-PDD) - Version 03
CDM ndash Executive Board
15
As the project activity generates revenue (other than CDM revenue) by exporting the electricity to the
grid and from the likely sale of biomass andor saving from diesel usage at the mill which is being
displaced by biogas simple cost analysis cannot be used Of the remaining PP has chosen the benchmark
analysis to demonstrate the financial unattractiveness of the project activity without carbon credits
There is a national policy on Feed-In-Tariff (FiT) gazetted in June 201111
that gives comparative
advantages to less emissions-intensive technologies over more emissions-intensive technologies (E-
policy as national andor sectoral policies or regulations that give comparative advantages to less
emissions-intensive technologies over more emissions-intensive technologies)
This is very conservative as paragraph 7 6 (b) EB22 Annex 3 states that ldquoNational andor sectoral
policies or regulations hellip that have been implemented since the adoption by the COP of the CDM MampP
(decision 17CP7 11 November 2001) need not be taken into account in developing a baseline scenario
(ie the baseline scenario could refer to a hypothetical situation without the national andor sectoral
policies or regulations being in place) In absence of the FiT the prevailing electricity sales tariff to
consumers is RM 021 per kWh
Project IRR has been chosen as the financial indicator for the financial analysis of the project activity
The project IRR has to be compared with a benchmark rate of return to demonstrate the additionality of
the project The Guidelines on the Assessment of Investment Analysis (Version 05 point 12) states ldquoIn
cases where a benchmark approach is used the applied benchmark shall be appropriate to the type of IRR
calculated Local commercial lending rates or weighted average costs of capital (WACC) are appropriate
benchmarks for a project IRR Requiredexpected returns on equity are appropriate benchmarks for an
equity IRR Benchmarks supplied by relevant national authorities are also appropriate if the DOE can
validate that they are applicable to the project activity and the type of IRR calculation presentedrdquo
In line with the Guidelines on the Assessment of Investment Analysis (Version 05) a default value
for the expected returns on equity is selected as the benchmark with 1090 The logic of choosing this
rate as benchmark is that the project should yield a return at least equivalent to the expected returns of
equity to merit consideration
For making the investment analysis the following assumptions have been made
Table B2 Investment Analysis
Sl No Description Value
1
Budgeted CAPEX
- Bioreactor amp accessories
- Flaring system
- Boiler adaptation cost for burners
- Gas engine(s)
- KPSR consultancy cost
4350000
140670
205000
4630000
220000
Total 9545670
2
Annual maintenance costs are estimated based on a of CAPEX12
Bioreactor (3 of CAPEX) = MYR 130500
Gas engine(s) (5 of CAPEX) = MYR 231500
3 Corporate tax ()13 25
11 httpwwwmbipvnetmydloadFiT20Handbook20Englishpdf 12 SD 05 ndash Maintenance cost (SIRIM Environmental and Bioprocess Technology Centre of Malaysia)
PROJECT DESIGN DOCUMENT FORM (CDM-SSC-PDD) - Version 03
CDM ndash Executive Board
16
Since losses can be carried forward indefinitely (so long as the ownership
remains unchanged) the incidence of taxation does not arise in the case of
this project activity
4
Manpower cost has been estimated based on 1 supervisor 2 operators 1
chargeman envisaged to be appointed and the ruling wagesalary structure
of the company14
182588 MYR yr
5 Salary increment rate has been applied based on the average expected
salary increment rate for year 20101115 40
6 Price of Biomass ex-factory (PKS) 156 MYRmt
7 Price of diesel 220 MYRliter
8 RE tariff export to grid (MYRkWh) 021
9
Laboratory Cost is estimated based on the quotations from accredited
laboratory anticipated number of tests and samples to be carried out and
transportation cost during the running and operating of the biogas plant for
maintaining optimum operating conditions
1920 MYR yr
10 Insurance premium per year ( of CAPEX)16 0412
11 Estimate of CER price (EUR) 8
12
Depreciation of equipment (years) has been provided as per the Inland
Revenue Authority regulations17 Since the project consists of only
environmental protection equipment it is entitled to initial capital
allowance of 40 and annual capital allowance of 20 as per the Inland
Revenue Authority notifications
4 years
13 Project life time for IRR calculation18 20 years
14
Residual value a fair value (5) of the project activity assets at the end of
the assessment period as per the Guidelines on The Assessment of
Investment Analysis version 05 EB 62
MYR 466284
Based on the above assumption the project IRR works out to be ndash 085 in contrast to the benchmark
rate of 1090 Thus the analysis proves that the project is not financially attractive
Sensitivity Analysis
A sensitivity analysis has also been conducted to test the robustness of the conclusions drawn Four (4)
factors have been identified as critical to IRR of the project viz project cost maintenance costs RE
tariff The results of sensitivity analysis are given below
13 SD 08 ndash Malaysian Tax and Business Booklet 201011 Page 12
httpwwwpwccomen_MYmyassetspublicationstaxbooklet1011pdf 14 SD 3 - Salary structure (biogas plant) 15 SD 09 - Salary increment rate (201011) 16 SD 2 - Biogas plant insurance policy 17 SD 08 ndash Malaysian Tax and Business Booklet 201011 Page 21
httpwwwpwccomen_MYmyassetspublicationstaxbooklet1011pdf 18 As per the Guidelines on the Assessment of Investment Analysis version 05 (Annex 5 EB 62 point 3) ldquoIn general a
minimum period of 10 years and a maximum of 20 years will be appropriaterdquo PP has chosen 20 years for financial
assessment as it is conservative
PROJECT DESIGN DOCUMENT FORM (CDM-SSC-PDD) - Version 03
CDM ndash Executive Board
17
Table B3 Sensitivity Analysis
FACTORS PROJECT IRR
-10 0 +10
Project cost -185 -085 033
Maintenance cost -491 -085 189
RE tariff 112 -085 -354
It could be seen from the above that even under the most optimistic conditions the project activity would
not yield a positive IRR let alone crossing the benchmark Therefore the project is not a business-as-
usual scenario and it is additional
Prior Consideration of CDM
As per the guidance of EB Meeting Report 49 Annex 22 the project proponent notified the UNFCCC and
the DNA of the intent to implement the project as a CDM project activity
Conclusion
The conclusion of the investment analysis remains identical to reasonable variations of the critical
assumptions (sensitivity analysis) Therefore the project activity IRR remains lower than the benchmark
In the above background it is proved that the project faces an investment barrier that establishes the
additionality
B4 Description of the sources and gases included in the project boundary and proof that the
small-scale CPA is located within the geographical boundary of the registered PoA
The emission sources and type of GHG which are included or excluded within the project boundary are
shown in the following table
Table B4 Emission Sources and Type of GHG
Source Gas Included Justification Explanation
Ba
seli
ne
Direct emissions
from the
wastewater
treatment processes
CO2 No Neutral CO2 emissions from biomass decaying
CH4 Yes Methane emissions from open lagoons treatment
process
N2O No Not significant Excluded for simplification and
conservativeness
Diesel usage in
diesel genset at mill
CO2 Yes CO2 emissions from combustion of diesel fuel
CH4 No Not significant Excluded for simplification and
conservativeness
N2O No Not significant Excluded for simplification and
conservativeness
Pro
ject
Act
ivit
y
Bio-digester
CO2 No Neutral CO2 emissions from biomass decaying
CH4 Yes Methane emissions from anaerobic treatment process
N2O No Not significant Excluded for simplification and
conservativeness
Existing
wastewater
treatment lagoons
CO2 No Neutral CO2 emissions from biomass decaying
CH4 Yes Methane emissions from poorly managed treatment
process (without aerators)
PROJECT DESIGN DOCUMENT FORM (CDM-SSC-PDD) - Version 03
CDM ndash Executive Board
18
(Facultative amp
algae system) N2O No
Not significant Excluded for simplification and
conservativeness
Gas engine(s)
(biogas
combustion)
CO2 No Neutral CO2 emissions from biogas combustion
CH4 No Not significant and excluded from calculation
Biogas combustion efficiency is considered 10019
N2O No Not significant Excluded for simplification and
conservativeness
Biomass Boiler(s)
(Biogas
combustion)
CO2 No Neutral CO2 emissions from biogas combustion
CH4 No Not significant and excluded from calculation
Biogas combustion efficiency is considered 10020
N2O No Not significant Excluded for simplification and
conservativeness
Grid electricity
consumption from
national grid
CO2 Yes CO2 emissions from grid energy
CH4 No Not significant Excluded for simplification and
conservativeness
N2O No Not significant Excluded for simplification and
conservativeness
Enclosed or Open
flaring system
CO2 No Neutral CO2 emissions from biogas combustion
CH4 Yes CH4 emissions due to incomplete combustion in
enclosed flare
N2O No Not significant Excluded for simplification and
conservativeness
The CPA is implemented at the address below
Kilang Sawit Felda Triang Triang Pahang Malaysia
The site is located at state of Pahang Malaysia with GPS coordinates 3 16152 N 102 34567 E or
32692 1025761 (refer also Section A412) and thus is located within the geographical boundary of the
PoA
B5 Emission reductions
B51 Data and parameters that are available at validation
Data Parameter GWPCH4
Data unit tCO2tCH4
Description Global Warming Potential the equivalent in CO2 of the effect of methane
gas to the atmosphere
Source of data used IPCC 2006
Value applied 21
Justification of the choice of
data or description of
measurement methods and
procedures actually applied
Global warming potential for methane gas since this is a methane
capture project
19 AMS-IIIH para 35 20 AMS-IIIH para 35
PROJECT DESIGN DOCUMENT FORM (CDM-SSC-PDD) - Version 03
CDM ndash Executive Board
19
Any comment
Data Parameter MCFwwtreatmentBL1
Data unit Fraction
Description Methane correction factor for baseline wastewater anaerobic treatment
systems
Source of data used Table IIIH1 AMS IIIH version 16
Value applied 08
Justification of the choice of
data or description of
measurement methods and
procedures actually applied
Table IIIH1 for baseline emission The lagoons depth are more than 2m
MCF value of 08 for anaerobic deep lagoon (depth gt 2 m)
Any comment
Data Parameter MCFwwtreatmentBL2
Data unit Fraction
Description Methane correction factor for baseline wastewater aerobic treatment
systems
Source of data used Methane correction factor for baseline aerobic wastewater treatment
system (poorly managed)
Value applied Table IIIH1 AMS IIIH version 16
Justification of the choice of
data or description of
measurement methods and
procedures actually applied
03
Any comment No aerators installed
Data Parameter MCFwwBLdischarge
Data unit Fraction
Description Methane correction factor based on discharge pathway in the baseline
situation
Source of data used Table IIIH1 AMS IIIH version 16
Value applied 01
Justification of the choice of
data or description of
measurement methods and
procedures actually applied
Table IIIH1 for baseline emission The final discharge of treated
effluent into river MCF value of 01 for river discharge
Any comment
Data Parameter Bo ww
Data unit kgCH4 kgCOD
Description Methane generation capacity of treated wastewater
Source of data used IPCC 2006
Value applied 025
Justification of the choice of
data or description of
measurement methods and
procedures actually applied
Default value as prescribed in the methodology
Any comment
PROJECT DESIGN DOCUMENT FORM (CDM-SSC-PDD) - Version 03
CDM ndash Executive Board
20
Data Parameter UFBL
Data unit -
Description Model correction factor to account for model uncertainties (baseline)
Source of data used AMS IIIH version 16
Value applied 089
Justification of the choice of
data or description of
measurement methods and
procedures actually applied
As per methodology AMS-IIIH point 24
Any comment -
Data Parameter UFPJ
Data unit -
Description Model correction factor to account for model uncertainties (project
activity)
Source of data used AMS IIIH version 16
Value applied 112
Justification of the choice of
data or description of
measurement methods and
procedures actually applied
As per methodology AMS-IIIH point 30(a)
Any comment -
Data Parameter CFEww
Data unit Fraction
Description Capture efficiency of the biogas recovery equipment in the wastewater
treatment system
Source of data used AMS IIIH version 16
Value applied 09
Justification of the choice of
data or description of
measurement methods and
procedures actually applied
A default value of 09 has been used as per the guidance in the
methodology
Any comment
Data Parameter MCF ww treatmentPJ1
Data unit Fraction
Description Methane correction factor for the project wastewater anaerobic treatment
system equipped with biogas recovery equipment
Source of data used Table IIIH1 AMS IIIH version 16
Value applied 08
Justification of the choice of
data or description of
measurement methods and
procedures actually applied
The lagoons depth are more than 2 m MCF values in table IIIH1 has
been used as per the guidance in the methodology (depth gt 2 m)
Any comment
Data Parameter MCF ww treatmentPJ2
PROJECT DESIGN DOCUMENT FORM (CDM-SSC-PDD) - Version 03
CDM ndash Executive Board
21
Data unit Fraction
Description Methane correction factor for the project wastewater aerobic treatment
system not equipped with biogas recovery equipment
Source of data used Table IIIH1 AMS IIIH version 16
Value applied 03
Justification of the choice of
data or description of
measurement methods and
procedures actually applied
Aerobic treatment poorly managed
Any comment
Data Parameter MCFwwPJdischarge
Data unit Fraction
Description Methane correction factor based on discharge pathway in the project
activity
Source of data used Table IIIH1 AMS IIIH version 16
Value applied 01
Justification of the choice of
data or description of
measurement methods and
procedures actually applied
Table IIIH1 for project emission The final discharge of treated effluent
into river MCF value of 01 for river discharge
Any comment Same discharge pathway as in the baseline
Data Parameter CODBL1
Data unit
Description COD removal efficiency of the baseline system (anaerobic treatment
system)
Source of data used 10 days measurement campaign
Value applied Anaerobic Treatment system 8880
Justification of the choice of
data or description of
measurement methods and
procedures actually applied
One year historical data not available
Any comment This data will be used for ex post emission reduction calculation
Data Parameter CODBL2
Data unit
Description COD removal efficiency of the baseline system (aerobic treatment
system)
Source of data used 10 days measurement campaign
Value applied Aerobic Treatment system 6369
Justification of the choice of
data or description of
measurement methods and
procedures actually applied
One year historical data not available
Any comment This data will be used for ex post emission reduction calculation
Data Parameter NCVCH4
Data unit MJkg
PROJECT DESIGN DOCUMENT FORM (CDM-SSC-PDD) - Version 03
CDM ndash Executive Board
22
Description Net Calorific Value of methane
Source of data used IPCC 2006 Default Value
Value applied 504
Justification of the choice of
data or description of
measurement methods and
procedures actually applied
IPCC 2006 value is used Volume 2 Chapter 1 Table 12
Any comment
Data Parameter NCVFF
Data unit MJkg
Description Net Calorific Value of diesel
Source of data used IPCC 2006 Default Value
Value applied 430
Justification of the choice of
data or description of
measurement methods and
procedures actually applied
IPCC 2006 value is used Volume 2 Chapter 1 Table 12
Any comment
Data Parameter EFCO2diesel
Data unit tCO2MWh
Description CO2 emission factor diesel genset
Source of data used AMS-IA version 14 point 14
Value applied 08
Justification of the choice of
data or description of
measurement methods and
procedures actually applied
Default value for diesel generation unit
Any comment
Data Parameter Grid Emission Factor
Data unit kgCO2ekWh
Description Emission factor for grid electricity in Peninsular Malaysia
Source of data used Pusat Tenaga Malaysia March 2010
Value applied 0672
Justification of the choice of
data or description of
measurement methods and
procedures actually applied
As per AMS-ID point 12
Any comment Study on Grid Connected Electricity Baselines in Malaysia 2008
B52 Ex-ante calculation of emission reductions
The ex ante emission reductions are calculated based on AMS-IIIH version 16 as per equations
explained in section E62 of PoA-DD Biogas PoA in Malaysia
PROJECT DESIGN DOCUMENT FORM (CDM-SSC-PDD) - Version 03
CDM ndash Executive Board
23
Calculation for AMS-IIIH
Baseline emissions
Source of baseline emissions Reference Applicable
(YN)
Comments
Wastewater and sludge treatment
systems equipped with a biogas
recovery facility shall be excluded
from the baseline
AMS-IIIH
Point 17
N No biogas recovery in the
baseline
Emissions on account of electricity or
fossil fuel used (BEpowery)
AMS-IIIH
Point 18 (i)
N For conservativeness no
emissions due to electricity or
fossil fuel will be claimed
BEpowery = 0
Methane emissions from baseline
wastewater treatment systems
(BEwwtreatmenty)
AMS-IIIH
Point 18 (ii)
Y Baseline includes anaerobic and
aerobic treatment conditions with
different MCF values selected as
per Table IIIH1
Methane emissions from baseline
sludge treatment systems (BEstreatmenty)
= 0
AMS-IIIH
Point 18 (iii)
N The baseline plant corresponds to
scenario Para 1(f) without sludge
treatment BEstreatmenty = 0
Methane emissions on account of
inefficiencies in the baseline
wastewater treatment systems and
presence of degradable organic carbon
in the treated wastewater discharged
into river (BEwwdischargey)
AMS-IIIH
Point 18 (iv)
Y Treated effluent is currently
discharged into the river
Methane emissions from the decay of
the final sludge generated by the
baseline treatment systems (BEsfinaly)
AMS-IIIH
Point 18 (v)
N Zero because in the baseline final
sludge used for soil application
BEsfinaly = 0
A) Calculation of baseline emissions
BEy = BEwwtreatmenty + BEwwdischargey
Abbreviation Description Value Source
BEy Baseline emissions in year y (tCO2e) 30762 Calculated
BEpowery Baseline emissions of diesel genset in year
y tCO2eyear 0 Calculated
BEwwtreatmenty Baseline emissions of the wastewater
treatment systems tCO2eyear 30663 Equation 2
BEwwdischargey
The methane emissions from degradable
organic carbon in treated wastewater
discharged tCO2eyear
100 Equation 6
A1) Baseline emissions
PROJECT DESIGN DOCUMENT FORM (CDM-SSC-PDD) - Version 03
CDM ndash Executive Board
24
Equation 2 BEwwtreatmenty = Qwwy (CODinflow1 y CODBL1 MCFwwtreatmentBL1) +
(CODinflow2y CODBL2 MCFwwtreatmentBL2) Boww UFBL GWPCH4
Abbreviation Description Value Source
BEwwtreatmenty Baseline emissions of the wastewater
treatment systems (tCO2eyear) 30663 Calculated
Qwwy Volume of wastewater treated in baseline
wastewater treatment system i in year y
(m3year)
333293
Volume based on 10 m3mt
FFB21 amp FFB historical data
(2009 ndash 2011)
CODinflow1y Chemical oxygen demand of the
wastewater inflow to the baseline treatment
system (anaerobic) in year y (tCOD m3)
0026905 10 days measurement
campaign
CODBL1 COD removal efficiency of the baseline
treatment system (anaerobic) () 8880
10 days measurement
campaign
CODinflow2y Chemical oxygen demand of the
wastewater inflow to the baseline treatment
system (aerobic) in year y (tCOD m3)
0003013 10 days measurement
campaign
CODBL2 COD removal efficiency of the baseline
treatment system (aerobic) () 6369
10 days measurement
campaign
MCFwwtreatmentBL 1 Methane correction factor for baseline
wastewater anaerobic treatment systems 08
MCF values as per table
IIIH1 anaerobic gt 2m
MCFwwtreatmentBL2 Methane correction factor for baseline
wastewater aerobic treatment systems 03
MCF values as per table
IIIH1 ndash poorly managed
Boww Methane producing capacity of the
wastewater (kg CH4kg COD) 025
IPCC 2006
UFBL Model correction factor to account for
model uncertainties 089
IPCC 2006
GWPCH4 Global Warming Potential for methane 21 IPCC 2006
A2) The methane emissions from degradable organic carbon in treated wastewater discharged
Equation 6 BEwwdischargey = Qwwy GWPCH4 Boww UFBL CODwwdischarge BLyMCFww BLdischarge
Abbreviation Description Value Source
BEwwdischargey
The methane emissions from degradable
organic carbon in treated wastewater
discharged (tCO2eyear)
100 Calculated
Qwwy Volume of treated wastewater discharged
in year y (m3year) 333293
Volume based on 10 m3mt
FFB22 amp FFB historical data
(2009 ndash 2011)
GWPCH4 Global warming potential of methane 21 IPCC 2006
Boww Methane producing capacity of the treated
wastewater (kgCH4 kgCOD) 025 IPCC 2006
21 Mill designed data for baseline effluent treatment plant 22 Mill designed data for baseline effluent treatment plant
PROJECT DESIGN DOCUMENT FORM (CDM-SSC-PDD) - Version 03
CDM ndash Executive Board
25
UFBL Model correction factor to account for
model uncertainties 089 IPCC 2006
CODwwdischarge BLy Chemical oxygen demand of the treated
wastewater discharged into sea river or
lake in the baseline situation in the year y
(tonnesm3)
0000642 10 days measurement
campaign
MCFwwBLdischarge Methane correction factor based on
discharge pathway in the baseline situation
(eg into sea river or lake) of the
wastewater (fraction)
01 MCF values as per table
IIIH1 version 16
Project activity emissions
The project activity emission sources as per the methodology and their relevance with respect to the
proposed CDM project activity are given below in a tabular format
Source of project activity
emission Reference
Applicable
(YN) Comments
CO2 emissions on account of
power and fossil fuel used by
the project activity facilities
(PEpowery)
AMS-IIIH
point 29(i)
Y The project activity uses the electricity
imported from the national grid
Methane emissions from
wastewater treatment systems
affected by the project
activity and not equipped with
biogas recovery in the project
situation (PEwwtreatmenty)
AMS-IIIH
point 29 (ii)
Y CH4 emissions from the poorly managed
aerobic lagoons
Methane emissions from
sludge treatment systems
affected by the project
activity and not equipped with
biogas recovery in the project
situation (PEstreatmenty)
AMS-IIIH
point 29 (iii)
N The project activity corresponds to
scenario (vi) without sludge treatment
PEystreatmenty = 0
Methane emissions on account
of inefficiency of the project
activity wastewater treatment
systems and presence of
degradable organic carbon in
treated wastewater
(PEwwdischargey)
AMS-IIIH
point 29 (iv)
Y Treated effluent from ETP will be
discharged into river
Methane emissions from the
decay of the final sludge
generated by the project
activity treatment systems
(PEsfinaly)
AMS-IIIH
point 29 (v)
N In the proposed CDM project activity
final sludge is used for soil application in
the same manner as in the baseline
PEsfinaly = 0
PROJECT DESIGN DOCUMENT FORM (CDM-SSC-PDD) - Version 03
CDM ndash Executive Board
26
Methane fugitive emissions on
account of inefficiencies in
capture systems (PEfugitivey)
AMS-IIIH
point 29 (vi)
Y Applicable to PEfugitivewwy
N The project activity corresponds to
scenario (vi) without sludge treatment
PEfugitivesy = 0
Methane emissions due to
incomplete flaring (PEflaringy)
AMS-IIIH
point 29 (vii)
Y Enclosed flaring system installed
Methane emissions from
biomass stored under
anaerobic conditions which
does not take place in the
baseline situation (PEbiomassy)
AMS-IIIH
point 29
(viii)
N In the project activity the biomass (PKS
+ mesocarp fibres) displaced will not be
stored under anaerobic conditions The
conditions of onsite storage are identical
in the baseline as in the project activity
The biomass will be sold to the market
on a regular basis PEbiomassy = 0
B) Calculation of project emissions
PEy = PEpowery + PEwwtreatmenty + PEww discharge y + PEfugitive y + PEflaring y
Abbreviation Description Value Source
PEy Project activity emissions in the year y
(tCO2eyr) 6050 Equation 8
PEpowery CO2 emissions on account of power used
by the project activity facilities (tCO2eyr) 604 -
PEwwtreatmenty Methane emissions from wastewater
treatment systems affected by the project
activity and not equipped with biogas
recovery in year y (tCO2eyr)
1523 Equation 9
PEwwdischargey
Methane emissions on account of
inefficiency of the project activity
wastewater treatment systems and presence
of degradable organic carbon in treated
wastewater (tCO2eyr)
126 Equation 12
PEfugitivey Methane fugitive emissions on account of
inefficiencies in capture systems (tCO2eyr) 3796 Equation 15
PEflaringy Methane emissions due to incomplete
flaring (tCO2eyr) 0 Equation 19
B1) Project emissions from CO2 emissions on account of power and fuel used by the project activity
facilities in year ldquoyrdquo in tCO2eyear
PEpowery = ECPJjy EFgridy
Abbreviation Description Value Source
PEpowery Project emissions from electricity
consumption in the year y (tCO2eyr) 604 Calculated
ECPJjy Internal power consumption from the grid 749 100 kW is the effective
PROJECT DESIGN DOCUMENT FORM (CDM-SSC-PDD) - Version 03
CDM ndash Executive Board
27
(MWh year) power based on the
equipments installed at the
site
EFgridy Grid Emission factor in Peninsular
Malaysia 2008 (tCO2 MWh) 0672
Study on Grid Connected
Electricity Baselines in
Malaysia 2008 published in
2010 by PTM
B2) Methane emissions from wastewater treatment systems affected by the project activity and not
equipped with biogas recovery in the project situation in year ldquoyrdquo in tCO2e
Equation 9 PEwwtreatment y = Qwwky CODinflowk y PJky MCFwwtreatmentPJk) Boww UFPJ GWPCH4
Abbreviation Description Value Source
PEwwtreatmenty
Methane emissions from wastewater
treatment systems affected by the project
activity and not equipped with biogas
recovery in the project situation (tCO2eyr)
1523 Calculated
Qwwky Volume of wastewater treated in project
activity wastewater treatment system k in
year y (m3year)
333293
Volume based on 10 m3mt
FFB23 amp FFB historical data
(2009 ndash 2011)
CODinflowky Chemical oxygen demand of the
wastewater inflow to the project activity
treatment system k in year y (tonnes COD
m3)
0002690 10 days measurement
campaign
PJky Chemical oxygen demand removal
efficiency of the project wastewater
treatment system k in year y (tm3)
measured based on inflow COD and
outflow COD in system k
90 Based on bio-digester COD
removal efficiency of 90
MCFwwtreatmentPJk Methane correction factor for project
wastewater treatment system k (MCF
values as per table IIIH1)
03
MCF values table IIIH1
Version 16 ndash aerobic poorly
managed (conservative)
Boww Methane generation capacity of the treated
wastewater (kg CH4kg COD) 025 IPCC 2006
UFPJ Model correction factor to account for
model uncertainties 112
IPCC 2006
GWPCH4 Global warming potential of methane 21 IPCC 2006
23 Mill designed data for baseline effluent treatment plant
PROJECT DESIGN DOCUMENT FORM (CDM-SSC-PDD) - Version 03
CDM ndash Executive Board
28
B3) Methane emissions on account of inefficiency of the project activity wastewater treatment
systems and presence of degradable organic carbon in treated wastewater in the year ldquoyrdquo (tonnes)
Equation 12 PEwwdischarge y = Qwwy GWPCH4 Boww UFPJ CODwwdischargePJy MCFwwPJdischarge
Abbreviation Description Value Source
PEwwdischargey
Methane emissions from degradable
organic carbon in treated wastewater
(tCO2eyr)
126 Calculated
Qwwy Quantity of wastewater treated in year y
(m3year) 333293
Volume based on 10 m3mt
FFB24 amp FFB historical data
(2009 ndash 2011)
CODwwdischargedPJ
y
Chemical oxygen demand of the treated
wastewater discharged into river in the
project situation in year y (tCOD m3)
0000642 10 days measurement
campaign
MCFwwPJ discharge
Methane correction factor based on
discharge pathway in the project situation
(river) of the wastewater (fraction)
01 MCF values as per table
IIIH1 Version 16
Boww Methane generation capacity of the treated
wastewater (kg CH4kg COD) 025 IPCC 2006
UFPJ Model correction factor to account for
model uncertainties 112 IPCC 2006
GWPCH4 Global warming potential of methane 21 IPCC 2006
B41) Methane fugitive emissions on account of inefficiencies in capture systems in the year ldquoyrdquo
(tonnes)
Equation 15 PEfugitivewwy = (1 ndash CFEww ) MEPywwtreatment GWPCH4
Abbreviation Description Value Source
PEfugitivey Methane fugitive emissions on account of
inefficiencies in capture systems (tCO2eyr) 3796 Calculated
CFEww Capture efficiency of the biogas recovery
equipment in the wastewater treatment
systems
09 AMS IIIH Version 16
MEPywwtreatment Methane emission potential of wastewater
treatment systems equipped with biogas
recovery system in year y (tCH4yr)
1808 Refer Equation 11 of AMS
IIIH version 16
GWPCH4 Global warming potential of methane 21 IPCC 2006
B42) Methane emission potential of wastewater treatment plant in the year ldquoyrdquo (tonnes)
Equation 16 MEPwwtreatmenty = Qwwy Boww UFPJ (CODremovedPJky MCFwwtreatmentPJk)
24 Mill designed data for baseline effluent treatment plant
PROJECT DESIGN DOCUMENT FORM (CDM-SSC-PDD) - Version 03
CDM ndash Executive Board
29
Abbreviation Description Value Source
MEPwwtreatmenty Methane emission potential of wastewater
treatment systems equipped with biogas
recovery system in year y (tonnes CH4yr)
1808 Calculated
Qyww Quantity of wastewater treated in year y
(m3year) 333293
Volume based on 10 m3mt
FFB25 amp FFB historical data
(2009 ndash 2011)
Boww Methane generation capacity of the treated
wastewater (kg CH4kg COD) 025 IPCC 2006
CODremovedPJy
The chemical oxygen demand removed by
the treatment anaerobic system of the
project activity equipped with biogas
recovery in the year y (tCOD m3)
0024214
10 days measurement
campaign amp bio-digester
design parameter
MCFwwtreatmentPJ
Methane correction factor for the project
wastewater treatment system k equipped
with biogas recovery equipment
08 MCF values as per table
IIIH1 Version 16
UFPJ Model correction factor to account for
model uncertainties 112 IPCC 2006
B5) Methane emissions due to incomplete flaring in the year ldquoyrdquo (tonnes)
Equation 13a PEflaringy = TMflaredy (1 - ηflarey) GWPCH4
Abbreviation Description Value Source
PEflaringy Methane emissions due to incomplete
flaring (tCO2eyr) 0 Calculated
TMflaredh Mass flow rate of methane flared in dry
basis in the hour h (tCH4 yr) 0 Calculated
ηflarey Flare efficiency in hour h based on default
values 50
Tools for methane flaring
(open flare) for conservative
GWPCH4 Global warming potential of methane 21 IPCC 2006
Leakage emissions
No leakage emission will occur in the project activity
LEy1 = 0
Emission reductions
Equation 22 ERy ex ante = BEy ex ante ndash (PEy ex ante + LEy ex ante)
25 Mill designed data for baseline effluent treatment plant
PROJECT DESIGN DOCUMENT FORM (CDM-SSC-PDD) - Version 03
CDM ndash Executive Board
30
Abbreviation Description Value Source
ERy1 ex ante Ex ante emission reduction in year y
(tCO2e) 24712 Equation 22
BEy1 ex ante Ex ante baseline emissions in year y
(tCO2e) 30762 Equation 1
PEy1 ex ante Ex ante project emissions in year y (tCO2e) 6050 Equation 8
LEy1 ex ante Ex ante Leakage emissions in year y
(tCO2e) 0 -
Calculation for AMS-ID
Baseline emissions
Electricity generated from biogas engines will be exported to the Peninsular Malaysia National Grid The
baseline emissions are described in AMS-ID (Version 17 EB 61) as the ldquoproduct of electrical energy
baseline expressed in kWh of electricity produced by the renewable energy generating unit multiplied by
an emission factorrdquo
Baseline emissions due to electricity exported to the grid in the year ldquoyrdquo (tonnes)
BEEGy = EGBLy EFCO2gridy
Abbreviation Description Value Source
BEEGy Baseline emissions in year y (tCO2eyr) 4568 Calculated
EGBLy
Quantity of net electricity supplied to the
grid as a result of the implementation of the
project activity in year y (kWh yr)
6797625 Calculated
EFCO2gridy
CO2 emission factor of the grid in year
(tCO2kWh) 0672
Study on Grid Connected
Electricity Baselines in
Malaysia 2008 published in
2010 by PTM
Project Activity Emissions
As per AMS-ID (Version 17 EB 61) project emissions for renewable energy project activities are zero
PEEGy = 0
Leakage
If the energy generating equipment is transferred from another activity leakage is to be considered
No leakage emission will occur in the project activity LEy = 0
PROJECT DESIGN DOCUMENT FORM (CDM-SSC-PDD) - Version 03
CDM ndash Executive Board
31
Emission reductions
ERy = BEy ndash PEy - LEy
Abbreviation Description Value Source
ERy Emission reduction in year y (tCO2ey) 4568 -
BEy Baseline emissions in year y (tCO2ey) 4568 -
PEy Project emissions in year y (tCO2ey) 0 -
LEy Leakage emissions in year y (tCO2ey) 0 -
Calculation for AMS-IA
Baseline emissions
The energy baseline is the fuel consumption of the technology in use or that would have been used in the
absence of the project activity to generate the equivalent quantity of energy Option 2 is applied This
methodology is only apply shall the recovered is in excess after export to the grid
Annual electricity sent to the mill for FF displacement in the year ldquoyrdquo (kWh)
EBLy = ΣEGiy (1 ndash l)
Abbreviation Description Value Source
EBLy Annual energy baseline (kWhyr) Calculated
EGiy
The estimated annual output of the
renewable energy technologies of the group
of i renewable energy technologies
installed (kWhyr)
0 Estimated
l
Average technical distribution losses that
would have been observed in diesel
powered mini-grids installed by public
programmes or distribution companies in
isolated areas expressed as a fraction
0 Conservative by applying
Zero (0)
Baseline electricity sent to the mill for FF displacement in the year ldquoyrdquo (tonnes)
BECO2y = EBLy EFCO2
Abbreviation Description Value Source
BECO2y Baseline emission in the year y (tCO2yr) 0 Calculated
EBLy Annual energy baseline (kWhyr) 0 Calculated
EFCO2 CO2 emission factor (tCO2kWh) 08
Default value which is
derived from diesel
generation units is used
PROJECT DESIGN DOCUMENT FORM (CDM-SSC-PDD) - Version 03
CDM ndash Executive Board
32
Project Activity Emissions
As per AMS-IA (Version 14 EB 54) project emissions for renewable energy project activities are zero
PEy = 0
Leakage
If the energy generating equipment is transferred from another activity or if the existing equipment is
transferred to another activity leakage is to be considered
No leakage emission will occur in the project activity LEy = 0
B53 Summary of the ex-ante estimation of emission reductions
Estimated emission reductions (total project activity)
Year
Estimation of
project activity
emissions (tCO2e)
Estimation of
baseline emissions
(tCO2e)
Estimation of
leakage (tCO2e)
Estimation of
overall emission
reductions (tCO2e)
2012 504 2944 0 2440
2013 6050 35330 0 29280
2014 6050 35330 0 29280
2015 6050 35330 0 29280
2016 6050 35330 0 29280
2017 6050 35330 0 29280
2018 6050 35330 0 29280
2019 5546 32386 0 26840
Total (tCO2) 42350 247310 0 204960
The starting date of the crediting period is 01122012 or the date of registration whichever is later
Estimated emission reductions for AMS-IIIH
Year
Estimation of
project activity
emissions (tCO2e)
Estimation of
baseline emissions
(tCO2e)
Estimation of
leakage (tCO2e)
Estimation of
overall emission
reductions (tCO2e)
2012 504 2563 0 2059
2013 6050 30762 0 24712
PROJECT DESIGN DOCUMENT FORM (CDM-SSC-PDD) - Version 03
CDM ndash Executive Board
33
2014 6050 30762 0 24712
2015 6050 30762 0 24712
2016 6050 30762 0 24712
2017 6050 30762 0 24712
2018 6050 30762 0 24712
2019 5546 28199 0 22653
Total (tCO2) 42350 215334 0 172984
The starting date of the crediting period is 01122012 or the date of registration whichever is later
Estimated emission reductions for AMS-ID
Year
Estimation of
project activity
emissions (tCO2e)
Estimation of
baseline emissions
(tCO2e)
Estimation of
leakage (tCO2e)
Estimation of
overall emission
reductions (tCO2e)
2012 0 381 0 381
2013 0 4568 0 4568
2014 0 4568 0 4568
2015 0 4568 0 4568
2016 0 4568 0 4568
2017 0 4568 0 4568
2018 0 4568 0 4568
2019 0 4187 0 4187
Total (tCO2) 0 31976 0 31976
The starting date of the crediting period is 01122012 or the date of registration whichever is later
Estimated emission reductions for AMS-IA
Year
Estimation of
project activity
emissions (tCO2e)
Estimation of
baseline emissions
(tCO2e)
Estimation of
leakage (tCO2e)
Estimation of
overall emission
reductions (tCO2e)
2012 0 0 0 0
2013 0 0 0 0
2014 0 0 0 0
2015 0 0 0 0
2016 0 0 0 0
PROJECT DESIGN DOCUMENT FORM (CDM-SSC-PDD) - Version 03
CDM ndash Executive Board
34
2017 0 0 0 0
2018 0 0 0 0
2019 0 0 0 0
Total (tCO2) 0 0 0 0
The starting date of the crediting period is 01122012 or the date of registration whichever is later
B6 Application of the monitoring methodology and description of the monitoring plan
B61 Description of the monitoring plan
The parameters to be monitored are
Please note that the amount of methane recovered and fuelled or flared (MDy ) is calculated as follows
MDy = TMfuelledy + TMflaredy Equation A
Where Description Units
MDy Quantity of methane recovered and fuelled or flared in the year y tonnes CH4year
TMfuelledy Quantity of methane fuelled in the year y tonnes CH4year
TMflaredy Quantity of methane flared in year y tonnes CH4year
Where
TMfuelledy = FVfuelledh fvCH4h ηfuelledh ρCH4n) 1000 Equation B
Where Description Units
TMfuelledy Quantity of methane fuelled in the year y tonnes CH4year
FVfuelledh Volumetric flow rate of the fuelled biogas gas at normal conditions in
hour h
Nm3 biogashour
ηfuelledh 100 for gainful purpose26
fvCH4h Volumetric fraction of methane in the biogas gas in the hour h
ρCH4n Density of methane at normal conditions kgCH4Nm3CH4
And
TMflaredy = FVflaredh fvCH4h ηflareh ρCH4n) 1000 Equation C
Where Description Units
TMflaredy Quantity of methane flared in year y tonnes CH4year
FVflaredh Volumetric flow rate of the flared biogas gas at normal conditions in
hour h
Nm3 biogashour
26 AMS-IIIH point 35
PROJECT DESIGN DOCUMENT FORM (CDM-SSC-PDD) - Version 03
CDM ndash Executive Board
35
ηflareh Flare efficiency in the hour h
fvCH4h Volumetric fraction of methane in the biogas gas in the hour h
ρCH4n Density of methane at normal conditions kgCH4Nm3CH4
Data Parameter ID1 Qwwy
Data unit m3 month
Description The flow of wastewater entering the bio-digester
Source of data Measurement by project participant by using a flowmeter
Value of data ~ 28000
Brief description of
measurement methods and
procedures to be applied
The flow is measured with an online flow meter or equivalent
QAQC procedures to be
applied (if any) Data are monitored continuously and recorded periodically
(monthly or at shorter interval) in a data log file (DLF)
Uncertainty level of data low
Maintenance and calibration as per manufacturer‟s specifications
or at least once every three (3) years
Any comment
Data Parameter ID2 CODwwuntreatedy
Data unit tCOD m3
Description Raw COD of wastewater entering the bio-digester
Source of data Laboratory (internal and external)
Value of data ~ 0030230
Brief description of
measurement methods and
procedures to be applied
Measure of COD according to national or international standards
COD is measure through representative sampling
QAQC procedures to be
applied (if any) Minimum once a month COD sampling to ensure a 9010
confidenceprecision level
COD reports are recorded manually
Uncertainty level of data low
Maintenance and calibration as per manufacturer‟s specifications
or at least once every three (3) years for internal laboratory
equipment
Any comment
Data Parameter ID3 CODwwtreatedy
Data unit tCOD m3
Description COD of treated wastewater leaving the bio-digester
Source of data Laboratory (internal and external)
Value of data ~ 0003023
Brief description of
measurement methods and
procedures to be applied
Measure of COD according to national or international standards
COD is measure through representative sampling
QAQC procedures to be
applied (if any) Minimum once a month COD sampling to ensure a 9010
confidenceprecision level
COD reports are recorded manually
Uncertainty level of data low
PROJECT DESIGN DOCUMENT FORM (CDM-SSC-PDD) - Version 03
CDM ndash Executive Board
36
Maintenance and calibration as per manufacturer‟s specifications
or at least once every three (3) years for internal laboratory
equipment
Any comment
Data Parameter ID5 End-use of the final sludge
Data unit ndash
Description The final sludge generated by the project activity will be sent to control
landfill site if any
Source of data By project participant
Value of data ndash
Brief description of
measurement methods and
procedures to be applied
The final disposal of the sludge will be monitored during the crediting
period if any For each disposal of the sludge the following will be
recorded disposal site and date of disposal
QAQC procedures to be
applied (if any)
Any comment
Data Parameter ID6 FVflaredh
Data unit Nm3 hour
Description Volumetric flow of biogas recovered and flared at normal conditions in
the hour h
Source of data By project participant
Value of data 0
Brief description of
measurement methods and
procedures to be applied
The volume of biogas will be measured with a normalised flow meter or
calculated from the volumetric flow pressure temperature
Biogas volume and methane content measurements shall be on the same
basis (wet or dry)
QAQC procedures to be
applied (if any) The biogas flow is monitored continuously recorded and stored
electronically in a data log file (DLF) (monthly or at shorter
interval)
Data Parameter ID4 CODww dischargey
Data unit tCOD m3
Description COD of treated wastewater discharge into river by treatment system
Source of data Laboratory (internal and external)
Value of data ~ 0000100
Brief description of
measurement methods and
procedures to be applied
Measure of COD according to national or international standards
COD is measure through representative sampling
QAQC procedures to be
applied (if any) Minimum once a month COD sampling to ensure a 9010
confidenceprecision level
COD reports are recorded manually
Uncertainty level of data low
Maintenance and calibration as per manufacturer‟s specifications
or at least once every three (3) years for internal laboratory
equipment
Any comment
PROJECT DESIGN DOCUMENT FORM (CDM-SSC-PDD) - Version 03
CDM ndash Executive Board
37
Uncertainty level of data low
Maintenance and calibration as per manufacturer‟s specifications
or at least once every 3 years
Any comment
Data Parameter ID7 FVfuelledgas engineh
Data unit Nm3 hour
Description Volumetric flow of biogas recovered and fuelled (gas engine) at normal
conditions in the hour h
Source of data By project participant
Value of data ~ 509
Brief description of
measurement methods and
procedures to be applied
The volume of biogas will be measured with a normalised flow meter or
calculated from the volumetric flow of biogas pressure temperature
Biogas volume and methane content measurements shall be on the same
basis (wet or dry)
QAQC procedures to be
applied (if any) The biogas flow is monitored continuously recorded and stored
electronically in a data log file (DLF) (monthly or at shorter
interval)
Uncertainty level of data low
Maintenance and calibration as per manufacturer‟s specifications
or at least once every 3 years
Any comment
Data Parameter ID8 FVfuelledboilerh
Data unit Nm3 hour
Description Volumetric flow of biogas recovered and fuelled (boilers) at normal
conditions in the hour h
Source of data By project participant
Value of data ~ 0
Brief description of
measurement methods and
procedures to be applied
The volume of biogas will be measured with a normalised flow meter or
calculated from the volumetric flow of biogas pressure temperature
Biogas volume and methane content measurements shall be on the same
basis (wet or dry)
QAQC procedures to be
applied (if any) The biogas flow is monitored continuously recorded and stored
electronically in a data log file (DLF) (monthly or at shorter
interval)
Uncertainty level of data low
Maintenance and calibration as per manufacturer‟s specifications
or at least once every 3 years
Any comment
Data Parameter ID9 wCH4h
Data unit
Description Methane content in biogas in same basis (wetdry) as the biogas flows in
year y
Source of data By project participant using a gas analyzer
Value of data ~ 60
PROJECT DESIGN DOCUMENT FORM (CDM-SSC-PDD) - Version 03
CDM ndash Executive Board
38
Brief description of
measurement methods and
procedures to be applied
Using calibrated gas analyzer either continuous or periodical
measurement at confidenceprecision level of 9010
QAQC procedures to be
applied (if any) In case a continuous gas analyser is used data will be recorded
and stored electronically in a data log file (DLF) every hour or at
shorter interval
Uncertainty level of data low
Maintenance and calibration as per manufacturer‟s specifications
or at least once every 3 years
Any comment See also clarification by EB Meth Panel 30102009 ndash SSC_360
httpcdmunfcccintUserManagementFileStorageAM_CLAR_
QS83SX5B7WM6UGZE31JYQEQ4F65F6V
The biogas flow and the methane content measurements shall be
carried out close to each others
Data Parameter ID10 Tbiogas
Data unit ordmC
Description Temperature of biogas
Source of data Temperature probe
Value of data 20 ndash 65
Brief description of
measurement methods and
procedures to be applied
By project participant
QAQC procedures to be
applied (if any) Shall be measured and recorded at the same time when methane
content in biogas (ID8) is measured
Uncertainty level of data low
Maintenance and calibration as per manufacturer‟s specifications
or at least once every 3 years
Any comment Pressure and temperature are required to determine the density of
the methane If the biogas flow meter employed measures flow
pressure and temperature and displaysoutputs normalised flow of
biogas there is no need to separate monitoring of pressure and
temperature of the biogas
Data Parameter ID11 Pbiogas
Data unit Bar(g)
Description Pressure of biogas
Source of data By project participant
Value of data 50 ndash 200 mbar
Brief description of
measurement methods and
procedures to be applied
Pressure measurement device
QAQC procedures to be
applied (if any) Shall be measured and recorded at the same time when methane
content in biogas (ID8) is measured
Uncertainty level of data low
Maintenance and calibration as per manufacturer‟s specifications
or at least once every three (3) years
Any comment Pressure and temperature are required to determine the density of
the methane If the biogas flow meter employed measures flow
PROJECT DESIGN DOCUMENT FORM (CDM-SSC-PDD) - Version 03
CDM ndash Executive Board
39
pressure and temperature and displaysoutputs normalised flow of
biogas there is no need to separate monitoring of pressure and
temperature of the biogas
Shall be measured at the same time when methane content in
biogas (ID9) is measured
Parameter ID12 ηflareh (enclosed flare)
Unit
Description Enclosed flare efficiency in the hour h
Source of data Calculated
Value of data 0 or 50 or 90
Brief description of
measurement methods and
procedures to be applied
This yearly efficiency will be based on hourly flare efficiencies calculated
as per the provisions in the ldquoTool to determine project emissions from
flaring gases containing methanerdquo
The hourly flare efficiency will be calculated based on
0 if the temperature in the exhaust gas of the flare (Tflare) is
below 500 degC for more than 20 minutes during the hour h
50 if the temperature in the exhaust gas of the flare (Tflare) is
above 500 degC for more than 40 minutes during the hour h but the
manufacturer‟s specifications on proper operation of the flare are
not met at any point in time during the hour h
90 if the temperature in the exhaust gas of the flare (Tflare) is
above 500 degC for more than 40 minutes during the hour h and the
manufacturer‟s specifications on proper operation of the flare are
met continuously during the hour h
QAQC procedures to be
applied (if any) Data are logged hourly in a data log file (DLF)
Uncertainty level of data low
Any comment For enclosed flare
Or
Parameter ID13 ηflareh (open flare)
Unit
Description Flare efficiency in the hour h
Source of data Calculated
Value of data 0 or 50
Brief description of
measurement methods and
procedures to be applied
This yearly efficiency will be based on hourly flare efficiencies calculated
as per the provisions in the ldquoTool to determine project emissions from
flaring gases containing methanerdquo
The hourly flare efficiency will be calculated based on the duration of
time during which the flame is detected by the thermocouple (or flame
detector) installed in the open flare
Flare efficiency in hour h is based on default values
0 if the flame detected for not more than 20 minutes during the
hour h and
PROJECT DESIGN DOCUMENT FORM (CDM-SSC-PDD) - Version 03
CDM ndash Executive Board
40
50 if the flame detected for more than 20 minutes during the
hour h
A flame detector or thermocouple will be used
QAQC procedures to be
applied (if any) Data are logged hourly in a data log file (DLF)
Uncertainty level of data low
Any comment The only monitored parameter related to the flare is its efficiency Indeed
according to the clarification SSC_19927 of the methodology AMS IIIH
version 9 accepted by the SSC WG on the 3092008 ldquoIf a thermocouple
is used as a flame detection system it is sufficient to reach the given
minimum temperature from the manufacturer ldquo Hence it is not necessary
to monitor the temperature of the open type flares (Tflare)
Data Parameter ID14 ECPJjy
Data unit MWh
Description The yearly grid electricity consumption of the project activity for the year
bdquoy‟
Source of data Onsite instrument
Value of data ~749
Brief description of
measurement methods and
procedures to be applied
The grid electricity consumption of the project activity is measured
continuously with an energy meter (cumulative reading)
QAQC procedures to be
applied (if any) Data are monitored continuously and recorded periodically
(yearly or at shorter interval) in a data log file (DLF)
Uncertainty level of data low
Maintenance and calibration as per manufacturer‟s specifications
or at least once every three (3) years
Any comment
Data Parameter ID15 EGBLy
Data unit MWh
Description Quantity of net electricity generated and send to grid in year y
Source of data By project participant
Value of data ~ 6798
Brief description of
measurement methods and
procedures to be applied
The electricity generated and sent to grid is measured continuously with
an energy meter (cumulative readings)
QAQC procedures to be
applied (if any) Data are monitored continuously and recorded periodically
(yearly or at shorter interval) in a data log file (DLF)
Uncertainty level of data low
Maintenance and calibration as per manufacturer‟s specifications
or at least once every 3 years
Any comment As per AMS-ID
27 The clarification SSC_199 if available here (last access on the 24052011)
httpcdmunfcccintfilestorageAM_AM_CLAR_HIOZ5CS1PASC187C0JQ668L2E9RCRJResponse20WG20provided
20at20SSC20WG2017pdft=bU98MTMwNjIxNjY0OS4xMQ==|BOKHqtO94N6XF1N2N1vo8Ori-Rc=
PROJECT DESIGN DOCUMENT FORM (CDM-SSC-PDD) - Version 03
CDM ndash Executive Board
41
Or
Data Parameter ID16 EGmilly
Data unit MWh
Description Quantity of annual output of renewable energy sent to the mill in year y
Source of data By project participant
Value of data ~ 0
Brief description of
measurement methods and
procedures to be applied
The electricity generated and sent to mill to displace diesel use in diesel
gensets is measured continuously with an energy meter (cumulative
readings)
QAQC procedures to be
applied (if any) Data are monitored continuously and recorded periodically
(yearly or at shorter interval) in a data log file (DLF)
Uncertainty level of data low
Maintenance and calibration as per manufacturer‟s specifications
or at least once every 3 years
Any comment As per AMS-IA
Data Parameter ID17 Displacement of Biomass
Data unit Mt
Description Total amount of biomass (PKS) displaced from biomass boilers
Source of data Weighing bridge
Value of data Measurement at site
Brief description of
measurement methods and
procedures to be applied
Biomass (PKS) displaced due to the project activity will be weighed
using weighing bridge at the palm oil mill
QAQC procedures to be
applied (if any) Monthly calculation based on every single trip of trucks recorded
Data is recorded manually in a data log file based on the weighing
records
Maintenance and calibration as per manufacturer‟s specifications
Uncertainty level of data low
Any comment In the project activity the biomass (PKS) displaced will not be stored
under anaerobic conditions The conditions of onsite storage are identical
in the baseline as in the project activity The biomass will be sold to the
market on a regular basis PEbiomassy = 0
A final monitoring plan will be prepared prior the initial verification based on the as-built project activity
It will address the following aspects
MONITORING
The Project will be managed by CME with the involvement from Project Implementer CME will ensure
safety in operation of the plant as well as in the monitoring of emission reduction which is generated from
the project activity
CME will implement and be responsible for the monitoring plan Their responsibility covers operation of
the monitoring maintenance of the monitoring equipment data collection and archiving and
management of total scheme of the monitoring CME and Project Implementer will assign specific trained
PROJECT DESIGN DOCUMENT FORM (CDM-SSC-PDD) - Version 03
CDM ndash Executive Board
42
personnel during project implementation for the overall monitoring measurement and reporting of key
parameters as required in this PDD
DATA LOGGING AND STORAGE
The data measured by the instruments will be collected and stored in a data logging system The data will
be retrieved remotely by modem or directly on site
If data cannot be retrieved no emissions reductions will be claimed for the period of data failure The
data collected will be recorded in a central data base Access to production data will be restricted All
records and data (hard copy and soft copy) will be archived up to two years after the end of the crediting
period or the last issuance of CERs for this project activity whichever occurs later
CALIBRATION AND MAINTENANCE PROCEDURES MALFUNCTION OF EQUIPMENT
Maintenance includes all preventive and corrective actions necessary for the good functioning of the
equipment such as
Visual control of the equipment state and real-time check of displayed parameters
Cleaning up the equipment and the sensors
Adding lubricant
Replacement and change of defective parts
Calibration of equipment consists in verifying by comparison with a standard the accuracy of a
measuring instrument
Measuring instruments will be periodically and appropriately calibrated according to the procedures
timing and methods recommended by the manufacturer or nationalinternational standards as available
General malfunction of equipment
Daily inspections of the equipment will allow controlling equipment failure If equipment fails the
supplier will be notified and repairs will be carried out If the damaged equipment cannot be repaired it
will be replaced at the earliest In some cases portable tools will be used in order to carry out daily
monitoring of the missing parameter(s) In such case this data will be recorded manually
Discrepancies
To avoid discrepancies between projected data in the PDD and actual data (eg due to deferred starting
date malfunction of equipment) cross-checks between internal meter readings and external sources (eg
electricity invoices) will be carried out Any source of inconsistencies will be clarified
Case of emergency
For the case of emergency (earthquakes explosions fires etc) an emergency preparedness plan will be
adapted to the project activity All employees involved in the project on-site will be trained in the code of
conduct and required actions at time of commissioning of the plant
PROJECT DESIGN DOCUMENT FORM (CDM-SSC-PDD) - Version 03
CDM ndash Executive Board
43
OPERATIONAL AND MANAGEMENT STRUCTURE
The CDM monitoring team will be composed by the following staff
Position Report to
Operators
Project owner Supervisors (technicalmaintenance)
Operation Engineer
CDM monitoring project manager External CDM consultant
TRAINING OF MONITORING PERSONNEL
The maintenance will be conducted in-house by staff employed and trained by the Project Participants
Employees involved in the monitoring will be trained internally andor externally Training may include
inter alia
a) Review of equipment and captors
b) Calibration requirement
c) Configuration of monitoring equipment
d) Maintenance requirement
C1 Please indicate the level at which environmental analysis as per requirements of the CDM
modalities and procedures is undertaken Justify the choice of level at which the environmental
analysis is undertaken
radic Please tick if this information is provided at the PoA level In this case sections C2 and C3
need not be completed in this form
C2 Documentation on the analysis of the environmental impacts including transboundary
impacts
The host country does not require an analysis of environmental impacts As the project involves reduction
of GHG through recovery and controlled combustion which improves the quality of air therefore there
are no significant environmental impacts identified
C3 Please state whether an environmental impact assessment is required for a typical CPA
included in the programme of activities (PoA) in accordance with the host Party lawsregulations
In accordance with Malaysia environmental regulations Environmental Quality (Prescribed Activities
Environmental Impact Assessment) Order 1987 an Environmental Impact Assessment (EIA) is not
required for this CPA
PROJECT DESIGN DOCUMENT FORM (CDM-SSC-PDD) - Version 03
CDM ndash Executive Board
44
SECTION D Stakeholdersrsquo comments
D1 Please indicate the level at which local stakeholder comments are invited Justify the
choice
Please tick if this information is provided at the PoA level In this case sections D2 to D4 need
not be completed in this form
D2 Brief description how comments by local stakeholders have been invited and compiled
The stakeholder meeting was conducted at the office of Kilang Sawit Felda Triang on 05032012 There
were 37 stakeholders attending the consultation Posters were pasted at the guard house and at the
entrance to office 1 week before the stakeholder consultation to inform the locals stakeholders which
comprise mostly the workers of the mill 20 stakeholders out of the 37 who attended the consultation are
2nd generation of the Felda settlers who live in the vicinity to the project activity and adequately represent
the local community composed entirely of Felda settlers (no other people live in the vicinity of this
remote plantation) Continuous input of ideascomments were allowed to all stakeholders who could
either send their input though an email account especially setup for the biogas project or directly inform
the project proponents
During the meeting presentations were made by the project owner to outline the proposed project activity
in a non-technical manner (including environmental social and technological considerations) climate
change and the role of the CDM Attendees were given opportunity to raise their concern and opinion
about the proposed project activity during the question and answer session
D3 Summary of the comments received
PROJECT DESIGN DOCUMENT FORM (CDM-SSC-PDD) - Version 03
CDM ndash Executive Board
45
Below are the questions raised during the stakeholder meeting
NAME QUESTION
Mohd Tarmizi Bin Mat
Daud What is CDM in Bahasa Malaysia
Mohd Tarmizi Bin Mat
Daud What is DoE‟s standard for treated water released into river
Mohd Azizi Bin Abdul
Aziz
Would the biogas be captured from the existing effluent treatment ponds or a
new structure
Azhar Bin Abdul What to do with the captured biogas from the bioreactor
D4 Report on how due account was taken of any comments received
Below are the answers to the questions asked during the stakeholder meeting
QUESTION ANSWER
What is CDM in Bahasa Malaysia
The meaning of CDM in Bahasa Malaysia is Mekanisme
Pembangunan Bersih or in English is Clean Development
Mechanism
By Abd Karim Bin Mohd Zin
What is DoE‟s standard for treated
water released into river
The discharge standard for BOD into river is less than 100ppm
By Abd Karim Bin Mohd Zin
Would the biogas be captured from
the existing effluent treatment
ponds or a new structure
New bioreactor will be constructed to replace the existing anaerobic
lagoon treatment system The new bioreactor will capture the
biogas produced from this anaerobic treatment process
By Abd Karim Bin Mohd Zin
What to do with the captured
biogas from the bioreactor
The biogas recovered from the bioreactor will mainly contain
methane (approximately 60) and the rest are CO2 H2 and H2S
Currently the biogas is just released to the atmosphere from the
existing open lagoons system During the project activity captured
biogas will be combusted thus will improve the air quality
By Abd Karim Bin Mohd Zin
PROJECT DESIGN DOCUMENT FORM (CDM-SSC-PDD) - Version 03
CDM ndash Executive Board
46
Annex 1
CONTACT INFORMATION ON ENTITYINDIVIDUAL RESPONSIBLE FOR THE SMALL-
SCALE CPA
Organization Felda Palm Industries Sdn Bhd (359584-V)
StreetPOBox Jalan Gurney 1
Building Balai Felda 4th Floor
City Kuala Lumpur
StateRegion Wilayah Persekutuan
PostfixZIP 54000
Country Malaysia
Telephone (03) 2692 8066
FAX (03) 2693 4148
URL wwwfeldanetmy
Represented by
Title Head of Department
Salutation Mr
Last Name Busu
Middle Name
First Name Zainuri
Department Biomass
Mobile
Direct FAX
Direct tel
Personal E-Mail zainuribfeldanetmy
Organization Ably Carbon Sdn Bhd
StreetPOBox Jalan Ipoh Kecil
Building No 17
City Kuala Lumpur
StateRegion
PostfixZIP 50350
Country Malaysia
Telephone +60 3 4042 1177
FAX +60 3 4044 4166
E-Mail stephanevidailletably-carboncom
URL
Represented by Stephane Vidaillet
Title Chairman
Salutation Mr
Last Name Vidaillet
Middle Name
First Name Steacutephane
Department
Mobile +33 6 59111 5600
Direct FAX
PROJECT DESIGN DOCUMENT FORM (CDM-SSC-PDD) - Version 03
CDM ndash Executive Board
47
Direct tel
Personal E-Mail stephanevidailletably-carboncom
PROJECT DESIGN DOCUMENT FORM (CDM-SSC-PDD) - Version 03
CDM ndash Executive Board
48
Annex 2
INFORMATION REGARDING PUBLIC FUNDING
The project activity is not receiving any funding from parties included in Annex 1 of the Kyoto Protocol
SMALL-SCALE CDM PROGRAMME ACTIVITY DESIGN DOCUMENT FORM (CDM-SSC-CPA-DD) - Version 01
NAME TITLE OF THE PoA Biogas Recovery and Utilization PoA Projects in
Malaysia
CDM ndash Executive Board page 49
This template shall not be altered It shall be completed without modifyingadding headings or logo format or font
Annex 3
BASELINE INFORMATION
1 2
Year 2009 2010 2011 2012 2013 2014
FFB (mtyr) 343720 345910 310250 333293 333293 333293
POME Volume
(cumyr)[1] 343720 345910 310250 333293 333293 333293
Mill Opearing hour (hryr) 68865 69225 6209 6673 6673 6673
PKS (mtyr) 18905 19025 17064 18331 18331 18331
3 4 5 6 7 8 9 10
2015 2016 2017 2018 2019 2020 2021 2022
333293 333293 333293 333293 333293 333293 333293 333293
333293 333293 333293 333293 333293 333293 333293 333293
6673 6673 6673 6673 6673 6673 6673 6673
18331 18331 18331 18331 18331 18331 18331 18331
SMALL-SCALE CDM PROGRAMME ACTIVITY DESIGN DOCUMENT FORM (CDM-SSC-CPA-DD) - Version 01
NAME TITLE OF THE PoA Biogas Recovery and Utilization PoA Projects in
Malaysia
CDM ndash Executive Board page 50
This template shall not be altered It shall be completed without modifyingadding headings or logo format or font
10 days measurement campaign for baseline wastewater treatment system
Day Date
ETP
Inlet
Anaerobic
system (mgl)
Outlet
Anaerobic
system (mgl)
Outlet Algae
System (mgl)
Final
Discharge to
River (mgl)
1 23-Feb-12 35693 3120 811 603
2 25-Feb-12 19511 2559 1186 83
3 26-Feb-12 32864 2767 749 437
4 27-Feb-12 30195 2330 1210 404
5 28-Feb-12 32436 1927 1188 941
6 29-Feb-12 38259 4256 896 717
7 1-Mar-12 28717 3584 1232 695
8 3-Mar-12 31002 4660 1658 1210
9 4-Mar-12 22400 4346 1389 963
10 5-Mar-12 31226 4301 1971 1165
Average 30230 3385 1229 722
ETP
COD removal efficiency (anaerobic system) 8880
COD removal efficiency (Facultativealgae system) 6369
COD removal efficiency (Bio-polishing system) 4127
Total COD removal efficiency of the treatment system 9761
The COD of the raw effluent during ex-post may vary from the one year historical records depending on
the improvement of the production process (outside of project boundary) thus ERex-post may vary from the
estimated ERex-ante
SMALL-SCALE CDM PROGRAMME ACTIVITY DESIGN DOCUMENT FORM (CDM-SSC-CPA-DD) - Version 01
NAME TITLE OF THE PoA Biogas Recovery and Utilization PoA Projects in
Malaysia
CDM ndash Executive Board page 51
This template shall not be altered It shall be completed without modifyingadding headings or logo format or font
Annex 4
MONITORING INFORMATION
General information
Monitoring refers to the collection and archiving of all relevant data necessary for determining the
baseline measuring anthropogenic emissions by sources of greenhouse gases (GHG) within the project
boundary of a CDM project activity and leakage It includes developing suitable data collection methods
and data interpretation techniques for monitoring and verification of GHG emissions
On-line monitoring system
Most key meters required to determine GHG emissions and emission reductions will be monitored from a
central control point which will record meter readings at a pre-determined interval
Ensuring adequate maintenance and calibration of monitoring instruments
Specific maintenance repair or replacement of monitoring equipment will be recorded dated and
described
The calibration will occur at intervals determined on the basis of instrument manufacturers
recommendations stability purpose usage and history of repeatability Recalibration should be
performed whenever an event occurs that places the accuracy of the instrument in doubt
Calibration will take place at least once every three (3) years to ensure that the monitoring
equipments are properly installed and functioning properly
Calibration will be performed according to national or international standards
Last calibration certificates will be provided during periodic verification
Sampling procedure
Wherever a statistical sample is used for monitoring the ldquogeneral guidelines for sampling and surveys for
SSC project activitiesrdquo shall be used COD shall be measured from a composite sample to obtain a
representative value
Data archiving
The monitored data will be kept for a minimum of 2 years after the end of the crediting years by using
paper documents or electronic files
Identification of non-conformities
A verification of inconsistencies of the data recorded will be performed based for example on
The comparison of the calculated quantities of methane versus expected
Spot checks of field instruments (local reading) and data in the log file
Any discrepancies (completeness calculation errors transcription errors instrument calibration issues)
will be analyzed and actions taken to correct the problem
Ensuring adequate training of staff
All new staff members will undergo bdquoon job training‟ covering the monitoring requirements
The monitoring plan will be made available to staff member involved in the monitoring
A copy will be located in the control room at the site
SMALL-SCALE CDM PROGRAMME ACTIVITY DESIGN DOCUMENT FORM (CDM-SSC-CPA-DD) - Version 01
NAME TITLE OF THE PoA Biogas Recovery and Utilization PoA Projects in
Malaysia
CDM ndash Executive Board page 52
This template shall not be altered It shall be completed without modifyingadding headings or logo format or font
During the training the employees will sign a training attendance list All training records shall
be documented inclusive of training attendance training memo and training material if any
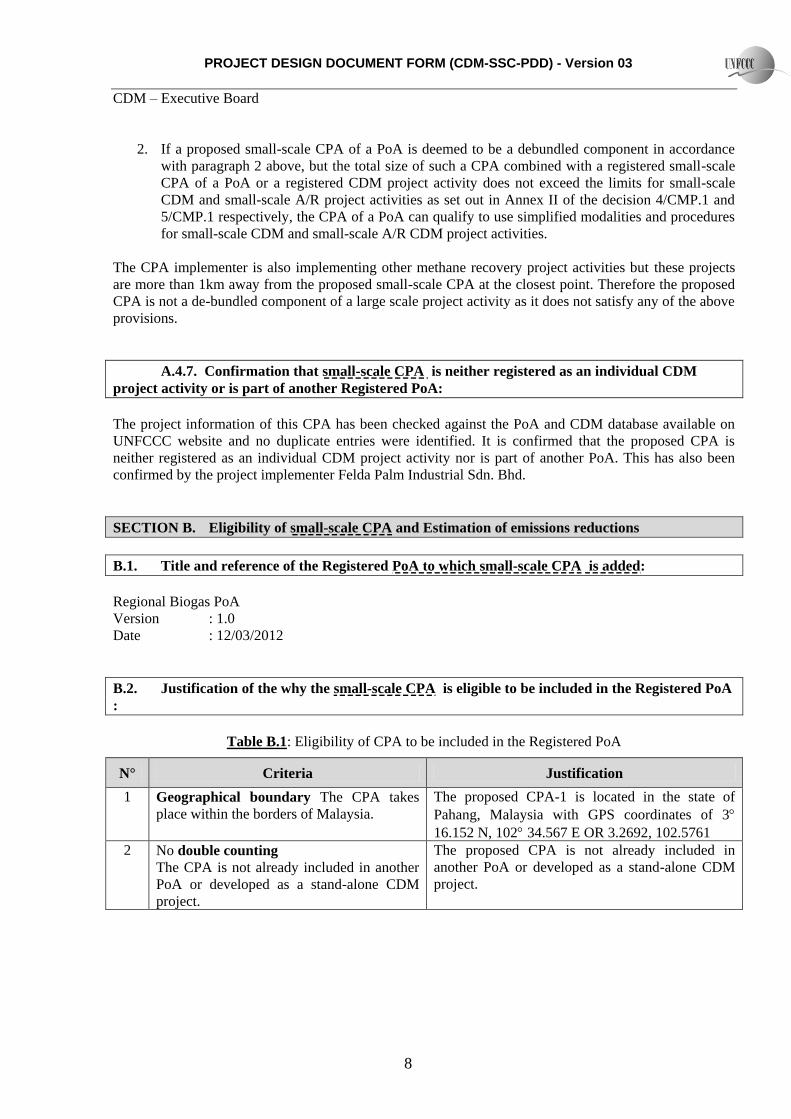
PROJECT DESIGN DOCUMENT FORM (CDM-SSC-PDD) - Version 03
CDM ndash Executive Board
8
2 If a proposed small-scale CPA of a PoA is deemed to be a debundled component in accordance
with paragraph 2 above but the total size of such a CPA combined with a registered small-scale
CPA of a PoA or a registered CDM project activity does not exceed the limits for small-scale
CDM and small-scale AR project activities as set out in Annex II of the decision 4CMP1 and
5CMP1 respectively the CPA of a PoA can qualify to use simplified modalities and procedures
for small-scale CDM and small-scale AR CDM project activities
The CPA implementer is also implementing other methane recovery project activities but these projects
are more than 1km away from the proposed small-scale CPA at the closest point Therefore the proposed
CPA is not a de-bundled component of a large scale project activity as it does not satisfy any of the above
provisions
A47 Confirmation that small-scale CPA is neither registered as an individual CDM
project activity or is part of another Registered PoA
The project information of this CPA has been checked against the PoA and CDM database available on
UNFCCC website and no duplicate entries were identified It is confirmed that the proposed CPA is
neither registered as an individual CDM project activity nor is part of another PoA This has also been
confirmed by the project implementer Felda Palm Industrial Sdn Bhd
SECTION B Eligibility of small-scale CPA and Estimation of emissions reductions
B1 Title and reference of the Registered PoA to which small-scale CPA is added
Regional Biogas PoA
Version 10
Date 12032012
B2 Justification of the why the small-scale CPA is eligible to be included in the Registered PoA
Table B1 Eligibility of CPA to be included in the Registered PoA
Ndeg Criteria Justification
1 Geographical boundary The CPA takes
place within the borders of Malaysia
The proposed CPA-1 is located in the state of
Pahang Malaysia with GPS coordinates of 3
16152 N 102 34567 E OR 32692 1025761
2 No double counting
The CPA is not already included in another
PoA or developed as a stand-alone CDM
project
The proposed CPA is not already included in
another PoA or developed as a stand-alone CDM
project
PROJECT DESIGN DOCUMENT FORM (CDM-SSC-PDD) - Version 03
CDM ndash Executive Board
9
3
Applicability conditions of AMS-IIIH
a) Substitution of aerobic wastewater or
sludge treatment systems with anaerobic
systems with biogas recovery and
combustion
b) Introduction of anaerobic sludge
treatment system with biogas recovery
and combustion to a wastewater
treatment plant without sludge
treatment
c) Introduction of biogas recovery and
combustion to a sludge treatment
system
d) Introduction of biogas recovery and
combustion to an anaerobic wastewater
treatment system such as anaerobic
reactor lagoon septic tank or an on site
industrial plant
e) Introduction of anaerobic wastewater
treatment with biogas recovery and
combustion with or without anaerobic
sludge treatment to an untreated
wastewater stream
f) Introduction of a sequential stage of
wastewater treatment with biogas
recovery and combustion with or
without sludge treatment to an
anaerobic wastewater treatment system
without biogas recovery (eg
introduction of treatment in an
anaerobic reactor with biogas recovery
as a sequential treatment step for the
wastewater that is presently being
treated in an anaerobic lagoon without
methane recovery)
The CPA is applying Option (f)
Introduction of a sequential stage of wastewater
treatment with biogas recovery and combustion
with or without sludge treatment to an anaerobic
wastewater treatment system without biogas
recovery (eg introduction of treatment in an
anaerobic reactor with biogas recovery as a
sequential treatment step for the wastewater that is
presently being treated in an anaerobic lagoon
without methane recovery)
4(a) The recovered methane measured may also
be utilized for thermal or mechanical
electrical generation directly ndash AMS-IIIH
para 3(a)
The recovered biogas may be used for electricity
generation through combustion in biogas engine(s)
system andor biomass boiler(s) for heat
generation Excess biogas if any will be flared
This in compliance with only AMS-IIIH
paragraph 3(a) and not the others
4(b) The recovered methane measured may also
be utilized for thermal or mechanical
electrical energy generation after bottling of
upgraded biogas ndash AMS-IIIH para 3(b)
Not applicable
4(c) The recovered methane measured may also
be utilized for thermal or mechanical
electrical energy generation after upgrading
and distribution ndash AMS-IIIH para 3(c)
Not applicable
4(d) The recovered methane measured may also Not applicable
PROJECT DESIGN DOCUMENT FORM (CDM-SSC-PDD) - Version 03
CDM ndash Executive Board
10
be utilized for hydrogen production ndash AMS-
IIIH para 3(d)
4(e) The recovered methane measured may also
be utilized for use as fuel in transportation
applications after upgrading ndash AMS-IIIH
para 3(e)
Not applicable
5 If the recovered biogas is used for project
activities covered under AMS-IIIH
paragraph 3(a) that component of the
project activity can use a corresponding
methodology under Type I
The recovered biogas is planned for gainfully use
for electricity andor heat generation in the CPA
The approved baseline and monitoring
methodology AMS IA (version 14) andor AMS-
ID (version 17) are used for the electricity
component of the CPA
6 Conditions that ensure compliance with
applicability and other requirements of
single or multiple methodologyies applied
by CPA
The proposed CPA-01 will apply AMS-IIIH
AMS-IA andor AMS-ID Applicability criteria
are listed below
7 The project has to fulfill Host Country
National CDM criteria if any
Malaysia‟s National CDM criteria have been
fulfilled by the proposed CPA
8 The starting date of CPA is compliant with
the latest UNFCCC guidelines
The start date of the CPA is not or will not be
prior to the commencement of validation of the
PoA The EPC contract for biogas plant yet to be
awarded
9 Confirmation that the CPA does not involve
any public funding from Annex I Parties or
that in case public funding is used it does
not result in diversion of Official
Development Assistance (ODA)
The proposed CPA has not received and will not
be seeking public funding from Annex 1 countries
10 A local Stakeholder consultation has been
conducted prior to the CPA inclusion
Stakeholder consultation has been organized on
05032012 and it is prior to the CPA inclusion
11 Conditions pertaining to the demonstration
of additionality of each small scale CPA to
be included (less than 60 ktCO2 year) for
Type III and 15MW for Type I
methodologies
The proposed CPA may install gas engine with
maximum capacity of 12 MW and methane
avoidance of less than 60000 tCO2yr for AMS-
IIIH
12 Where applicable the conditions that ensure
that CPA in aggregate meets the small-scale
threshold criteria and remain within this
threshold throughout the crediting period of
the CPA
The proposed CPA may install gas engine with
maximum capacity of 12 MW and methane
avoidance of less than 60000 tCO2yr for AMS-
IIIH
13 Where applicable the requirements for the
debundling check in case CPAs belong to
small-scale (SSC) project categories
The proposed CPA is not a debundled component
of a large activity as described in the latest
ldquoGuidelines on assessment of debundling for SSC
project activitiesrdquo
14 Where applicable the conditions related to
sampling requirements for a PoA in
accordance with the approved
guidelinesstandard from the Board
pertaining to sampling and surveys
Not applicable all CPAs will be verified
15 Where applicable target group (eg The target group is prospective POME plants in
PROJECT DESIGN DOCUMENT FORM (CDM-SSC-PDD) - Version 03
CDM ndash Executive Board
11
domesticcommercialindustrial ruralurban
grid-connectedoff-grid) and distribution
mechanisms (eg direct installation)
Malaysia There are no specific distribution
mechanisms
16 Whether an EIA is required by local
authorities
Not applicable for the proposed CPA as EIA is not
required
17 The crediting period of the CPA shall not
exceed the length of the PoA (ie 28 years)
regardless of the time of inclusion of CPA in
the PoA
The crediting period of the proposed CPA will not
exceed the length of PoA 28 years
Additional eligibility criteria applicable in case of CPA that gainfully use of biogas for electrical
andor thermal energy generation
The proposed project conforms to the applicable requirements of AMS - ID version 17
Applicability Criteria Justification
This methodology comprises renewable energy
generation units such as photovoltaic hydro
tidalwave wind geothermal and renewable biomass
a) Supplying electricity to a national or a regional
grid
b) Supplying electricity to an identified consumer
facility via nationalregional grid through a
contractual arrangement such as wheeling
Applicable The proposed project activity is
based on biogas recovered from anaerobic bio-
digester a renewable energy generation source
The proposed project shall supply electricity to
the national grid
The project activity is not supplying electricity
to an identified consumer facility
This methodology is applicable to project activities that
(a) Install a new power plant at a site where there was
no renewable energy power plant operating prior
to the implementation of the project activity
(Greenfield plant)
(b) Involve a capacity addition
(c) Involve a retrofit of (an) existing plant(s)
(d) Involve a replacement of (an) existing plant(s)
Applicable to (a) where the proposed project
activity shall install a new power plant at a site
where there was no renewable energy power
plant operating prior to the implementation of
the project activity
Hydro power plants with reservoirs that satisfy at least
one of the following conditions are eligible to apply this
methodology
Not applicable The project activity is a biogas
recovery and utilization project
If the new unit has both renewable and non-renewable
components (eg a winddiesel unit) the eligibility limit
of 15MW for a small-scale CDM project activity applies
only to the renewable component If the new unit co-
fires fossil fuel the capacity of the entire unit shall not
exceed the limit of 15MW
Not applicable The project does not
incorporate a mix of renewable and non-
renewable components
Combined heat and power (co-generation) systems are
not eligible under this category
Applicable There is no combined heat and
power component in the project activity
PROJECT DESIGN DOCUMENT FORM (CDM-SSC-PDD) - Version 03
CDM ndash Executive Board
12
In the case of project activities that involve the addition
of renewable energy generation units at an existing
renewable power generation facility the added capacity
of the units added by the project should be lower than
15 MW and should be physically distinct from the
existing units
Not applicable The project activity does not
involve the addition of renewable energy
generation units at an existing facility
In the case of retrofit or replacement to qualify as a
small-scale project the total output of the retrofitted or
replacement unit shall not exceed the limit of 15 MW
Not applicable The project activity does not
seek to retrofit or replacement an existing
facility
The proposed project conforms to the applicable requirements of AMS - IA version 14
Applicability Criteria Justification
This category comprises renewable electricity
generation units that supply individual Households
users or groups of households users included in the
project boundary The applicability is limited to
individual households and users that do not have a grid
connection except when
a) A group of households or users are supplied
electricity through a standalone mini grid powered
by renewable energy generation unit(s) where the
capacity of the generating units does not exceed 15
MW or
b) The emissions reduction per renewable energy
based lighting system is less than 5 tonnes of CO2e
a year and where it can be shown that fossil fuel
would have been used in the absence of the project
activity by
(i) A representative sample survey (90
confidence interval plusmn10 error margin) of
target households or
(ii) Official statistics from the host country
government agencies
The renewable energy generation units include
technologies such as solar hydro wind biomass
gasification and other technologies that produce
electricity all of which is used on-sitelocally by the
user
The renewable generating units may be new
installations (Greenfield) or replace existing onsite
fossil-fuel-fired generation To qualify as a small-scale
project the total output of the unit(s) shall not exceed
the limit of 15 MW
Applicable The proposed project activity is not
grid connected
Furthermore the total installed capacity of the
generating units will not exceed 15 MW
Applicable The project activity involves the
combustion of the recovered biogas from the
anaerobic bio-digester for electricity generation
to be use on-site
Applicable The project activity involve the
replacement of existing onsite fossil fuel fired
generation and the total installed capacity is not
PROJECT DESIGN DOCUMENT FORM (CDM-SSC-PDD) - Version 03
CDM ndash Executive Board
13
exceed 15 MW
Hydro power plants with reservoirs that satisfy at least
one of the following conditions are eligible to apply this
methodology
The project activity is implemented in an existing
reservoir with no change in the volume of
reservoir
The project activity is implemented in an existing
reservoir where the volume of reservoir is
increased and the power density of the project
activity as per definitions given in the Project
Emissions section is greater than 4 Wm2
The project activity results in new reservoirs and
the power density of the power plant as per
definitions given in the Project Emissions section
is greater than 4 Wm2
Not applicable The project activity is not a
hydro power plant
Combined heat and power (co-generation) systems are
not eligible under this category
Applicable There is no combined heat and
power component in the project activity
If the unit added has both renewable and non-renewable
components (eg a winddiesel unit) the eligibility
limit of 15 MW for a small-scale CDM project activity
applies only to the renewable component If the unit
added co-fires fossil fuel the capacity of the entire unit
shall not exceed the limit of 15 MW
Not applicable The project does not
incorporate a mix of renewable and non-
renewable components
Project activities that involves retrofit or replacement of
an existing facility for renewable energy generation are
included in this category To qualify as a small-scale
project the total output of the modified or retrofitted
unit shall not exceed the limit of 15 MW
Not applicable The project activity does not
seek to retrofit or replacement an existing
facility
In the case of project activities that involve the addition
of renewable energy generation units at an existing
renewable power generation facility the added capacity
of the units added by the project should be lower than
15 MW and should be physically distinct3 from the
existing units
Not applicable The project activity does not
involve the addition of renewable energy
generation units at an existing facility
B3 Assessment and demonstration of additionality of the small-scale CPA as per eligibility
criteria listed in the Registered PoA
In Malaysia Environmental Quality (Prescribed Premises) (Crude Palm Oil) Regulation 1977 governs
environmental considerations including the wastewater treatment and discharge at palm oil mills The
regulation stipulates the discharge standards for water discharge or land application The regulation
however does not specify the required treatment technologies for wastewater or GHG emissions from
wastewater treatment operations
PROJECT DESIGN DOCUMENT FORM (CDM-SSC-PDD) - Version 03
CDM ndash Executive Board
14
More than 85 of palm oil mills are utilizing open based anaerobic ponds and it is considered the
prevailing practice for oil palm industry to treat the POME The open anaerobic ponds system is an
effective and low-tech solution that can easily meet the water discharge limits applicable to the palm oil
industry9 10
There is no financial incentive for the palm oil mill owners to invest into methane capture projects
particularly when there is no requirement under existing pending or planned national state or local
regulatory This is partly related to the fact that there are a lot of attractive and competing investments in
the sector However the PP has undertaken to set up this project in order to reduce the GHG emissions
and contribute his mite to the global GHG emission reduction
The project is a small scale project activity As such the provisions of Attachment A to Appendix B of
the simplified modalities and procedures for small-scale CDM project activities will apply to this project
The bdquoindicative simplified baseline and monitoring methodologies for selected small-scale CDM project
activity categories‟ require the project proponents to demonstrate that the project activity would not have
occurred anyway due to at least one of the following barriers
a) Investment barrier a financially more viable alternative to the project activity would have led to
higher emissions
b) Technological barrier a less technologically advanced alternative to the project activity involves
lower risks due to the performance uncertainty or low market share of the new technology
adopted for the project activity and so would have led to higher emissions
c) Barrier due to prevailing practice prevailing practice or existing regulatory or policy
requirements would have led to the implementation of a technology with higher emissions
d) Other barriers without the project activity for another specific reason identified by the project
participant such as institutional barriers or limited information managerial resources
organizational capacity financial resources or capacity to absorb new technologies emissions
would have been higher
Subsequently in its 35th Meeting the EB had issued bdquoNon-binding best practice examples to demonstrate
additionality for SSC project activities‟ wherein EB had given best practice examples of each of the
aforementioned category of barriers
The project participant has chosen Investment Barrier to demonstrate the additionality which is discussed
in the following paragraphs
Investment barrier
The most important of all the barriers faced by the company is the investment barrier The investment
analysis reveals that the project is not financially attractive The additionality tool permits the use of
simple cost analysis or investment comparison analysis or benchmark analysis to demonstrate the
additionality of the project
9 SD 05 ndash Yeoh B G 2004 A Technical and Economic Analysis of Heat and Power Generation from Biomethanation of
Palm Oil Mill Effluent Electrcity Supply Industry in Transition Issues and Prospect for Asia 10 SD 06 ndash Eco-Ideal Consulting Sdn Bhd (Eco-Ideal) 2004 MEWCPTMDANIDA Study on Clean Development
Mechanism Potential in the Waste Sectors in Malaysia Unpublished
PROJECT DESIGN DOCUMENT FORM (CDM-SSC-PDD) - Version 03
CDM ndash Executive Board
15
As the project activity generates revenue (other than CDM revenue) by exporting the electricity to the
grid and from the likely sale of biomass andor saving from diesel usage at the mill which is being
displaced by biogas simple cost analysis cannot be used Of the remaining PP has chosen the benchmark
analysis to demonstrate the financial unattractiveness of the project activity without carbon credits
There is a national policy on Feed-In-Tariff (FiT) gazetted in June 201111
that gives comparative
advantages to less emissions-intensive technologies over more emissions-intensive technologies (E-
policy as national andor sectoral policies or regulations that give comparative advantages to less
emissions-intensive technologies over more emissions-intensive technologies)
This is very conservative as paragraph 7 6 (b) EB22 Annex 3 states that ldquoNational andor sectoral
policies or regulations hellip that have been implemented since the adoption by the COP of the CDM MampP
(decision 17CP7 11 November 2001) need not be taken into account in developing a baseline scenario
(ie the baseline scenario could refer to a hypothetical situation without the national andor sectoral
policies or regulations being in place) In absence of the FiT the prevailing electricity sales tariff to
consumers is RM 021 per kWh
Project IRR has been chosen as the financial indicator for the financial analysis of the project activity
The project IRR has to be compared with a benchmark rate of return to demonstrate the additionality of
the project The Guidelines on the Assessment of Investment Analysis (Version 05 point 12) states ldquoIn
cases where a benchmark approach is used the applied benchmark shall be appropriate to the type of IRR
calculated Local commercial lending rates or weighted average costs of capital (WACC) are appropriate
benchmarks for a project IRR Requiredexpected returns on equity are appropriate benchmarks for an
equity IRR Benchmarks supplied by relevant national authorities are also appropriate if the DOE can
validate that they are applicable to the project activity and the type of IRR calculation presentedrdquo
In line with the Guidelines on the Assessment of Investment Analysis (Version 05) a default value
for the expected returns on equity is selected as the benchmark with 1090 The logic of choosing this
rate as benchmark is that the project should yield a return at least equivalent to the expected returns of
equity to merit consideration
For making the investment analysis the following assumptions have been made
Table B2 Investment Analysis
Sl No Description Value
1
Budgeted CAPEX
- Bioreactor amp accessories
- Flaring system
- Boiler adaptation cost for burners
- Gas engine(s)
- KPSR consultancy cost
4350000
140670
205000
4630000
220000
Total 9545670
2
Annual maintenance costs are estimated based on a of CAPEX12
Bioreactor (3 of CAPEX) = MYR 130500
Gas engine(s) (5 of CAPEX) = MYR 231500
3 Corporate tax ()13 25
11 httpwwwmbipvnetmydloadFiT20Handbook20Englishpdf 12 SD 05 ndash Maintenance cost (SIRIM Environmental and Bioprocess Technology Centre of Malaysia)
PROJECT DESIGN DOCUMENT FORM (CDM-SSC-PDD) - Version 03
CDM ndash Executive Board
16
Since losses can be carried forward indefinitely (so long as the ownership
remains unchanged) the incidence of taxation does not arise in the case of
this project activity
4
Manpower cost has been estimated based on 1 supervisor 2 operators 1
chargeman envisaged to be appointed and the ruling wagesalary structure
of the company14
182588 MYR yr
5 Salary increment rate has been applied based on the average expected
salary increment rate for year 20101115 40
6 Price of Biomass ex-factory (PKS) 156 MYRmt
7 Price of diesel 220 MYRliter
8 RE tariff export to grid (MYRkWh) 021
9
Laboratory Cost is estimated based on the quotations from accredited
laboratory anticipated number of tests and samples to be carried out and
transportation cost during the running and operating of the biogas plant for
maintaining optimum operating conditions
1920 MYR yr
10 Insurance premium per year ( of CAPEX)16 0412
11 Estimate of CER price (EUR) 8
12
Depreciation of equipment (years) has been provided as per the Inland
Revenue Authority regulations17 Since the project consists of only
environmental protection equipment it is entitled to initial capital
allowance of 40 and annual capital allowance of 20 as per the Inland
Revenue Authority notifications
4 years
13 Project life time for IRR calculation18 20 years
14
Residual value a fair value (5) of the project activity assets at the end of
the assessment period as per the Guidelines on The Assessment of
Investment Analysis version 05 EB 62
MYR 466284
Based on the above assumption the project IRR works out to be ndash 085 in contrast to the benchmark
rate of 1090 Thus the analysis proves that the project is not financially attractive
Sensitivity Analysis
A sensitivity analysis has also been conducted to test the robustness of the conclusions drawn Four (4)
factors have been identified as critical to IRR of the project viz project cost maintenance costs RE
tariff The results of sensitivity analysis are given below
13 SD 08 ndash Malaysian Tax and Business Booklet 201011 Page 12
httpwwwpwccomen_MYmyassetspublicationstaxbooklet1011pdf 14 SD 3 - Salary structure (biogas plant) 15 SD 09 - Salary increment rate (201011) 16 SD 2 - Biogas plant insurance policy 17 SD 08 ndash Malaysian Tax and Business Booklet 201011 Page 21
httpwwwpwccomen_MYmyassetspublicationstaxbooklet1011pdf 18 As per the Guidelines on the Assessment of Investment Analysis version 05 (Annex 5 EB 62 point 3) ldquoIn general a
minimum period of 10 years and a maximum of 20 years will be appropriaterdquo PP has chosen 20 years for financial
assessment as it is conservative
PROJECT DESIGN DOCUMENT FORM (CDM-SSC-PDD) - Version 03
CDM ndash Executive Board
17
Table B3 Sensitivity Analysis
FACTORS PROJECT IRR
-10 0 +10
Project cost -185 -085 033
Maintenance cost -491 -085 189
RE tariff 112 -085 -354
It could be seen from the above that even under the most optimistic conditions the project activity would
not yield a positive IRR let alone crossing the benchmark Therefore the project is not a business-as-
usual scenario and it is additional
Prior Consideration of CDM
As per the guidance of EB Meeting Report 49 Annex 22 the project proponent notified the UNFCCC and
the DNA of the intent to implement the project as a CDM project activity
Conclusion
The conclusion of the investment analysis remains identical to reasonable variations of the critical
assumptions (sensitivity analysis) Therefore the project activity IRR remains lower than the benchmark
In the above background it is proved that the project faces an investment barrier that establishes the
additionality
B4 Description of the sources and gases included in the project boundary and proof that the
small-scale CPA is located within the geographical boundary of the registered PoA
The emission sources and type of GHG which are included or excluded within the project boundary are
shown in the following table
Table B4 Emission Sources and Type of GHG
Source Gas Included Justification Explanation
Ba
seli
ne
Direct emissions
from the
wastewater
treatment processes
CO2 No Neutral CO2 emissions from biomass decaying
CH4 Yes Methane emissions from open lagoons treatment
process
N2O No Not significant Excluded for simplification and
conservativeness
Diesel usage in
diesel genset at mill
CO2 Yes CO2 emissions from combustion of diesel fuel
CH4 No Not significant Excluded for simplification and
conservativeness
N2O No Not significant Excluded for simplification and
conservativeness
Pro
ject
Act
ivit
y
Bio-digester
CO2 No Neutral CO2 emissions from biomass decaying
CH4 Yes Methane emissions from anaerobic treatment process
N2O No Not significant Excluded for simplification and
conservativeness
Existing
wastewater
treatment lagoons
CO2 No Neutral CO2 emissions from biomass decaying
CH4 Yes Methane emissions from poorly managed treatment
process (without aerators)
PROJECT DESIGN DOCUMENT FORM (CDM-SSC-PDD) - Version 03
CDM ndash Executive Board
18
(Facultative amp
algae system) N2O No
Not significant Excluded for simplification and
conservativeness
Gas engine(s)
(biogas
combustion)
CO2 No Neutral CO2 emissions from biogas combustion
CH4 No Not significant and excluded from calculation
Biogas combustion efficiency is considered 10019
N2O No Not significant Excluded for simplification and
conservativeness
Biomass Boiler(s)
(Biogas
combustion)
CO2 No Neutral CO2 emissions from biogas combustion
CH4 No Not significant and excluded from calculation
Biogas combustion efficiency is considered 10020
N2O No Not significant Excluded for simplification and
conservativeness
Grid electricity
consumption from
national grid
CO2 Yes CO2 emissions from grid energy
CH4 No Not significant Excluded for simplification and
conservativeness
N2O No Not significant Excluded for simplification and
conservativeness
Enclosed or Open
flaring system
CO2 No Neutral CO2 emissions from biogas combustion
CH4 Yes CH4 emissions due to incomplete combustion in
enclosed flare
N2O No Not significant Excluded for simplification and
conservativeness
The CPA is implemented at the address below
Kilang Sawit Felda Triang Triang Pahang Malaysia
The site is located at state of Pahang Malaysia with GPS coordinates 3 16152 N 102 34567 E or
32692 1025761 (refer also Section A412) and thus is located within the geographical boundary of the
PoA
B5 Emission reductions
B51 Data and parameters that are available at validation
Data Parameter GWPCH4
Data unit tCO2tCH4
Description Global Warming Potential the equivalent in CO2 of the effect of methane
gas to the atmosphere
Source of data used IPCC 2006
Value applied 21
Justification of the choice of
data or description of
measurement methods and
procedures actually applied
Global warming potential for methane gas since this is a methane
capture project
19 AMS-IIIH para 35 20 AMS-IIIH para 35
PROJECT DESIGN DOCUMENT FORM (CDM-SSC-PDD) - Version 03
CDM ndash Executive Board
19
Any comment
Data Parameter MCFwwtreatmentBL1
Data unit Fraction
Description Methane correction factor for baseline wastewater anaerobic treatment
systems
Source of data used Table IIIH1 AMS IIIH version 16
Value applied 08
Justification of the choice of
data or description of
measurement methods and
procedures actually applied
Table IIIH1 for baseline emission The lagoons depth are more than 2m
MCF value of 08 for anaerobic deep lagoon (depth gt 2 m)
Any comment
Data Parameter MCFwwtreatmentBL2
Data unit Fraction
Description Methane correction factor for baseline wastewater aerobic treatment
systems
Source of data used Methane correction factor for baseline aerobic wastewater treatment
system (poorly managed)
Value applied Table IIIH1 AMS IIIH version 16
Justification of the choice of
data or description of
measurement methods and
procedures actually applied
03
Any comment No aerators installed
Data Parameter MCFwwBLdischarge
Data unit Fraction
Description Methane correction factor based on discharge pathway in the baseline
situation
Source of data used Table IIIH1 AMS IIIH version 16
Value applied 01
Justification of the choice of
data or description of
measurement methods and
procedures actually applied
Table IIIH1 for baseline emission The final discharge of treated
effluent into river MCF value of 01 for river discharge
Any comment
Data Parameter Bo ww
Data unit kgCH4 kgCOD
Description Methane generation capacity of treated wastewater
Source of data used IPCC 2006
Value applied 025
Justification of the choice of
data or description of
measurement methods and
procedures actually applied
Default value as prescribed in the methodology
Any comment
PROJECT DESIGN DOCUMENT FORM (CDM-SSC-PDD) - Version 03
CDM ndash Executive Board
20
Data Parameter UFBL
Data unit -
Description Model correction factor to account for model uncertainties (baseline)
Source of data used AMS IIIH version 16
Value applied 089
Justification of the choice of
data or description of
measurement methods and
procedures actually applied
As per methodology AMS-IIIH point 24
Any comment -
Data Parameter UFPJ
Data unit -
Description Model correction factor to account for model uncertainties (project
activity)
Source of data used AMS IIIH version 16
Value applied 112
Justification of the choice of
data or description of
measurement methods and
procedures actually applied
As per methodology AMS-IIIH point 30(a)
Any comment -
Data Parameter CFEww
Data unit Fraction
Description Capture efficiency of the biogas recovery equipment in the wastewater
treatment system
Source of data used AMS IIIH version 16
Value applied 09
Justification of the choice of
data or description of
measurement methods and
procedures actually applied
A default value of 09 has been used as per the guidance in the
methodology
Any comment
Data Parameter MCF ww treatmentPJ1
Data unit Fraction
Description Methane correction factor for the project wastewater anaerobic treatment
system equipped with biogas recovery equipment
Source of data used Table IIIH1 AMS IIIH version 16
Value applied 08
Justification of the choice of
data or description of
measurement methods and
procedures actually applied
The lagoons depth are more than 2 m MCF values in table IIIH1 has
been used as per the guidance in the methodology (depth gt 2 m)
Any comment
Data Parameter MCF ww treatmentPJ2
PROJECT DESIGN DOCUMENT FORM (CDM-SSC-PDD) - Version 03
CDM ndash Executive Board
21
Data unit Fraction
Description Methane correction factor for the project wastewater aerobic treatment
system not equipped with biogas recovery equipment
Source of data used Table IIIH1 AMS IIIH version 16
Value applied 03
Justification of the choice of
data or description of
measurement methods and
procedures actually applied
Aerobic treatment poorly managed
Any comment
Data Parameter MCFwwPJdischarge
Data unit Fraction
Description Methane correction factor based on discharge pathway in the project
activity
Source of data used Table IIIH1 AMS IIIH version 16
Value applied 01
Justification of the choice of
data or description of
measurement methods and
procedures actually applied
Table IIIH1 for project emission The final discharge of treated effluent
into river MCF value of 01 for river discharge
Any comment Same discharge pathway as in the baseline
Data Parameter CODBL1
Data unit
Description COD removal efficiency of the baseline system (anaerobic treatment
system)
Source of data used 10 days measurement campaign
Value applied Anaerobic Treatment system 8880
Justification of the choice of
data or description of
measurement methods and
procedures actually applied
One year historical data not available
Any comment This data will be used for ex post emission reduction calculation
Data Parameter CODBL2
Data unit
Description COD removal efficiency of the baseline system (aerobic treatment
system)
Source of data used 10 days measurement campaign
Value applied Aerobic Treatment system 6369
Justification of the choice of
data or description of
measurement methods and
procedures actually applied
One year historical data not available
Any comment This data will be used for ex post emission reduction calculation
Data Parameter NCVCH4
Data unit MJkg
PROJECT DESIGN DOCUMENT FORM (CDM-SSC-PDD) - Version 03
CDM ndash Executive Board
22
Description Net Calorific Value of methane
Source of data used IPCC 2006 Default Value
Value applied 504
Justification of the choice of
data or description of
measurement methods and
procedures actually applied
IPCC 2006 value is used Volume 2 Chapter 1 Table 12
Any comment
Data Parameter NCVFF
Data unit MJkg
Description Net Calorific Value of diesel
Source of data used IPCC 2006 Default Value
Value applied 430
Justification of the choice of
data or description of
measurement methods and
procedures actually applied
IPCC 2006 value is used Volume 2 Chapter 1 Table 12
Any comment
Data Parameter EFCO2diesel
Data unit tCO2MWh
Description CO2 emission factor diesel genset
Source of data used AMS-IA version 14 point 14
Value applied 08
Justification of the choice of
data or description of
measurement methods and
procedures actually applied
Default value for diesel generation unit
Any comment
Data Parameter Grid Emission Factor
Data unit kgCO2ekWh
Description Emission factor for grid electricity in Peninsular Malaysia
Source of data used Pusat Tenaga Malaysia March 2010
Value applied 0672
Justification of the choice of
data or description of
measurement methods and
procedures actually applied
As per AMS-ID point 12
Any comment Study on Grid Connected Electricity Baselines in Malaysia 2008
B52 Ex-ante calculation of emission reductions
The ex ante emission reductions are calculated based on AMS-IIIH version 16 as per equations
explained in section E62 of PoA-DD Biogas PoA in Malaysia
PROJECT DESIGN DOCUMENT FORM (CDM-SSC-PDD) - Version 03
CDM ndash Executive Board
23
Calculation for AMS-IIIH
Baseline emissions
Source of baseline emissions Reference Applicable
(YN)
Comments
Wastewater and sludge treatment
systems equipped with a biogas
recovery facility shall be excluded
from the baseline
AMS-IIIH
Point 17
N No biogas recovery in the
baseline
Emissions on account of electricity or
fossil fuel used (BEpowery)
AMS-IIIH
Point 18 (i)
N For conservativeness no
emissions due to electricity or
fossil fuel will be claimed
BEpowery = 0
Methane emissions from baseline
wastewater treatment systems
(BEwwtreatmenty)
AMS-IIIH
Point 18 (ii)
Y Baseline includes anaerobic and
aerobic treatment conditions with
different MCF values selected as
per Table IIIH1
Methane emissions from baseline
sludge treatment systems (BEstreatmenty)
= 0
AMS-IIIH
Point 18 (iii)
N The baseline plant corresponds to
scenario Para 1(f) without sludge
treatment BEstreatmenty = 0
Methane emissions on account of
inefficiencies in the baseline
wastewater treatment systems and
presence of degradable organic carbon
in the treated wastewater discharged
into river (BEwwdischargey)
AMS-IIIH
Point 18 (iv)
Y Treated effluent is currently
discharged into the river
Methane emissions from the decay of
the final sludge generated by the
baseline treatment systems (BEsfinaly)
AMS-IIIH
Point 18 (v)
N Zero because in the baseline final
sludge used for soil application
BEsfinaly = 0
A) Calculation of baseline emissions
BEy = BEwwtreatmenty + BEwwdischargey
Abbreviation Description Value Source
BEy Baseline emissions in year y (tCO2e) 30762 Calculated
BEpowery Baseline emissions of diesel genset in year
y tCO2eyear 0 Calculated
BEwwtreatmenty Baseline emissions of the wastewater
treatment systems tCO2eyear 30663 Equation 2
BEwwdischargey
The methane emissions from degradable
organic carbon in treated wastewater
discharged tCO2eyear
100 Equation 6
A1) Baseline emissions
PROJECT DESIGN DOCUMENT FORM (CDM-SSC-PDD) - Version 03
CDM ndash Executive Board
24
Equation 2 BEwwtreatmenty = Qwwy (CODinflow1 y CODBL1 MCFwwtreatmentBL1) +
(CODinflow2y CODBL2 MCFwwtreatmentBL2) Boww UFBL GWPCH4
Abbreviation Description Value Source
BEwwtreatmenty Baseline emissions of the wastewater
treatment systems (tCO2eyear) 30663 Calculated
Qwwy Volume of wastewater treated in baseline
wastewater treatment system i in year y
(m3year)
333293
Volume based on 10 m3mt
FFB21 amp FFB historical data
(2009 ndash 2011)
CODinflow1y Chemical oxygen demand of the
wastewater inflow to the baseline treatment
system (anaerobic) in year y (tCOD m3)
0026905 10 days measurement
campaign
CODBL1 COD removal efficiency of the baseline
treatment system (anaerobic) () 8880
10 days measurement
campaign
CODinflow2y Chemical oxygen demand of the
wastewater inflow to the baseline treatment
system (aerobic) in year y (tCOD m3)
0003013 10 days measurement
campaign
CODBL2 COD removal efficiency of the baseline
treatment system (aerobic) () 6369
10 days measurement
campaign
MCFwwtreatmentBL 1 Methane correction factor for baseline
wastewater anaerobic treatment systems 08
MCF values as per table
IIIH1 anaerobic gt 2m
MCFwwtreatmentBL2 Methane correction factor for baseline
wastewater aerobic treatment systems 03
MCF values as per table
IIIH1 ndash poorly managed
Boww Methane producing capacity of the
wastewater (kg CH4kg COD) 025
IPCC 2006
UFBL Model correction factor to account for
model uncertainties 089
IPCC 2006
GWPCH4 Global Warming Potential for methane 21 IPCC 2006
A2) The methane emissions from degradable organic carbon in treated wastewater discharged
Equation 6 BEwwdischargey = Qwwy GWPCH4 Boww UFBL CODwwdischarge BLyMCFww BLdischarge
Abbreviation Description Value Source
BEwwdischargey
The methane emissions from degradable
organic carbon in treated wastewater
discharged (tCO2eyear)
100 Calculated
Qwwy Volume of treated wastewater discharged
in year y (m3year) 333293
Volume based on 10 m3mt
FFB22 amp FFB historical data
(2009 ndash 2011)
GWPCH4 Global warming potential of methane 21 IPCC 2006
Boww Methane producing capacity of the treated
wastewater (kgCH4 kgCOD) 025 IPCC 2006
21 Mill designed data for baseline effluent treatment plant 22 Mill designed data for baseline effluent treatment plant
PROJECT DESIGN DOCUMENT FORM (CDM-SSC-PDD) - Version 03
CDM ndash Executive Board
25
UFBL Model correction factor to account for
model uncertainties 089 IPCC 2006
CODwwdischarge BLy Chemical oxygen demand of the treated
wastewater discharged into sea river or
lake in the baseline situation in the year y
(tonnesm3)
0000642 10 days measurement
campaign
MCFwwBLdischarge Methane correction factor based on
discharge pathway in the baseline situation
(eg into sea river or lake) of the
wastewater (fraction)
01 MCF values as per table
IIIH1 version 16
Project activity emissions
The project activity emission sources as per the methodology and their relevance with respect to the
proposed CDM project activity are given below in a tabular format
Source of project activity
emission Reference
Applicable
(YN) Comments
CO2 emissions on account of
power and fossil fuel used by
the project activity facilities
(PEpowery)
AMS-IIIH
point 29(i)
Y The project activity uses the electricity
imported from the national grid
Methane emissions from
wastewater treatment systems
affected by the project
activity and not equipped with
biogas recovery in the project
situation (PEwwtreatmenty)
AMS-IIIH
point 29 (ii)
Y CH4 emissions from the poorly managed
aerobic lagoons
Methane emissions from
sludge treatment systems
affected by the project
activity and not equipped with
biogas recovery in the project
situation (PEstreatmenty)
AMS-IIIH
point 29 (iii)
N The project activity corresponds to
scenario (vi) without sludge treatment
PEystreatmenty = 0
Methane emissions on account
of inefficiency of the project
activity wastewater treatment
systems and presence of
degradable organic carbon in
treated wastewater
(PEwwdischargey)
AMS-IIIH
point 29 (iv)
Y Treated effluent from ETP will be
discharged into river
Methane emissions from the
decay of the final sludge
generated by the project
activity treatment systems
(PEsfinaly)
AMS-IIIH
point 29 (v)
N In the proposed CDM project activity
final sludge is used for soil application in
the same manner as in the baseline
PEsfinaly = 0
PROJECT DESIGN DOCUMENT FORM (CDM-SSC-PDD) - Version 03
CDM ndash Executive Board
26
Methane fugitive emissions on
account of inefficiencies in
capture systems (PEfugitivey)
AMS-IIIH
point 29 (vi)
Y Applicable to PEfugitivewwy
N The project activity corresponds to
scenario (vi) without sludge treatment
PEfugitivesy = 0
Methane emissions due to
incomplete flaring (PEflaringy)
AMS-IIIH
point 29 (vii)
Y Enclosed flaring system installed
Methane emissions from
biomass stored under
anaerobic conditions which
does not take place in the
baseline situation (PEbiomassy)
AMS-IIIH
point 29
(viii)
N In the project activity the biomass (PKS
+ mesocarp fibres) displaced will not be
stored under anaerobic conditions The
conditions of onsite storage are identical
in the baseline as in the project activity
The biomass will be sold to the market
on a regular basis PEbiomassy = 0
B) Calculation of project emissions
PEy = PEpowery + PEwwtreatmenty + PEww discharge y + PEfugitive y + PEflaring y
Abbreviation Description Value Source
PEy Project activity emissions in the year y
(tCO2eyr) 6050 Equation 8
PEpowery CO2 emissions on account of power used
by the project activity facilities (tCO2eyr) 604 -
PEwwtreatmenty Methane emissions from wastewater
treatment systems affected by the project
activity and not equipped with biogas
recovery in year y (tCO2eyr)
1523 Equation 9
PEwwdischargey
Methane emissions on account of
inefficiency of the project activity
wastewater treatment systems and presence
of degradable organic carbon in treated
wastewater (tCO2eyr)
126 Equation 12
PEfugitivey Methane fugitive emissions on account of
inefficiencies in capture systems (tCO2eyr) 3796 Equation 15
PEflaringy Methane emissions due to incomplete
flaring (tCO2eyr) 0 Equation 19
B1) Project emissions from CO2 emissions on account of power and fuel used by the project activity
facilities in year ldquoyrdquo in tCO2eyear
PEpowery = ECPJjy EFgridy
Abbreviation Description Value Source
PEpowery Project emissions from electricity
consumption in the year y (tCO2eyr) 604 Calculated
ECPJjy Internal power consumption from the grid 749 100 kW is the effective
PROJECT DESIGN DOCUMENT FORM (CDM-SSC-PDD) - Version 03
CDM ndash Executive Board
27
(MWh year) power based on the
equipments installed at the
site
EFgridy Grid Emission factor in Peninsular
Malaysia 2008 (tCO2 MWh) 0672
Study on Grid Connected
Electricity Baselines in
Malaysia 2008 published in
2010 by PTM
B2) Methane emissions from wastewater treatment systems affected by the project activity and not
equipped with biogas recovery in the project situation in year ldquoyrdquo in tCO2e
Equation 9 PEwwtreatment y = Qwwky CODinflowk y PJky MCFwwtreatmentPJk) Boww UFPJ GWPCH4
Abbreviation Description Value Source
PEwwtreatmenty
Methane emissions from wastewater
treatment systems affected by the project
activity and not equipped with biogas
recovery in the project situation (tCO2eyr)
1523 Calculated
Qwwky Volume of wastewater treated in project
activity wastewater treatment system k in
year y (m3year)
333293
Volume based on 10 m3mt
FFB23 amp FFB historical data
(2009 ndash 2011)
CODinflowky Chemical oxygen demand of the
wastewater inflow to the project activity
treatment system k in year y (tonnes COD
m3)
0002690 10 days measurement
campaign
PJky Chemical oxygen demand removal
efficiency of the project wastewater
treatment system k in year y (tm3)
measured based on inflow COD and
outflow COD in system k
90 Based on bio-digester COD
removal efficiency of 90
MCFwwtreatmentPJk Methane correction factor for project
wastewater treatment system k (MCF
values as per table IIIH1)
03
MCF values table IIIH1
Version 16 ndash aerobic poorly
managed (conservative)
Boww Methane generation capacity of the treated
wastewater (kg CH4kg COD) 025 IPCC 2006
UFPJ Model correction factor to account for
model uncertainties 112
IPCC 2006
GWPCH4 Global warming potential of methane 21 IPCC 2006
23 Mill designed data for baseline effluent treatment plant
PROJECT DESIGN DOCUMENT FORM (CDM-SSC-PDD) - Version 03
CDM ndash Executive Board
28
B3) Methane emissions on account of inefficiency of the project activity wastewater treatment
systems and presence of degradable organic carbon in treated wastewater in the year ldquoyrdquo (tonnes)
Equation 12 PEwwdischarge y = Qwwy GWPCH4 Boww UFPJ CODwwdischargePJy MCFwwPJdischarge
Abbreviation Description Value Source
PEwwdischargey
Methane emissions from degradable
organic carbon in treated wastewater
(tCO2eyr)
126 Calculated
Qwwy Quantity of wastewater treated in year y
(m3year) 333293
Volume based on 10 m3mt
FFB24 amp FFB historical data
(2009 ndash 2011)
CODwwdischargedPJ
y
Chemical oxygen demand of the treated
wastewater discharged into river in the
project situation in year y (tCOD m3)
0000642 10 days measurement
campaign
MCFwwPJ discharge
Methane correction factor based on
discharge pathway in the project situation
(river) of the wastewater (fraction)
01 MCF values as per table
IIIH1 Version 16
Boww Methane generation capacity of the treated
wastewater (kg CH4kg COD) 025 IPCC 2006
UFPJ Model correction factor to account for
model uncertainties 112 IPCC 2006
GWPCH4 Global warming potential of methane 21 IPCC 2006
B41) Methane fugitive emissions on account of inefficiencies in capture systems in the year ldquoyrdquo
(tonnes)
Equation 15 PEfugitivewwy = (1 ndash CFEww ) MEPywwtreatment GWPCH4
Abbreviation Description Value Source
PEfugitivey Methane fugitive emissions on account of
inefficiencies in capture systems (tCO2eyr) 3796 Calculated
CFEww Capture efficiency of the biogas recovery
equipment in the wastewater treatment
systems
09 AMS IIIH Version 16
MEPywwtreatment Methane emission potential of wastewater
treatment systems equipped with biogas
recovery system in year y (tCH4yr)
1808 Refer Equation 11 of AMS
IIIH version 16
GWPCH4 Global warming potential of methane 21 IPCC 2006
B42) Methane emission potential of wastewater treatment plant in the year ldquoyrdquo (tonnes)
Equation 16 MEPwwtreatmenty = Qwwy Boww UFPJ (CODremovedPJky MCFwwtreatmentPJk)
24 Mill designed data for baseline effluent treatment plant
PROJECT DESIGN DOCUMENT FORM (CDM-SSC-PDD) - Version 03
CDM ndash Executive Board
29
Abbreviation Description Value Source
MEPwwtreatmenty Methane emission potential of wastewater
treatment systems equipped with biogas
recovery system in year y (tonnes CH4yr)
1808 Calculated
Qyww Quantity of wastewater treated in year y
(m3year) 333293
Volume based on 10 m3mt
FFB25 amp FFB historical data
(2009 ndash 2011)
Boww Methane generation capacity of the treated
wastewater (kg CH4kg COD) 025 IPCC 2006
CODremovedPJy
The chemical oxygen demand removed by
the treatment anaerobic system of the
project activity equipped with biogas
recovery in the year y (tCOD m3)
0024214
10 days measurement
campaign amp bio-digester
design parameter
MCFwwtreatmentPJ
Methane correction factor for the project
wastewater treatment system k equipped
with biogas recovery equipment
08 MCF values as per table
IIIH1 Version 16
UFPJ Model correction factor to account for
model uncertainties 112 IPCC 2006
B5) Methane emissions due to incomplete flaring in the year ldquoyrdquo (tonnes)
Equation 13a PEflaringy = TMflaredy (1 - ηflarey) GWPCH4
Abbreviation Description Value Source
PEflaringy Methane emissions due to incomplete
flaring (tCO2eyr) 0 Calculated
TMflaredh Mass flow rate of methane flared in dry
basis in the hour h (tCH4 yr) 0 Calculated
ηflarey Flare efficiency in hour h based on default
values 50
Tools for methane flaring
(open flare) for conservative
GWPCH4 Global warming potential of methane 21 IPCC 2006
Leakage emissions
No leakage emission will occur in the project activity
LEy1 = 0
Emission reductions
Equation 22 ERy ex ante = BEy ex ante ndash (PEy ex ante + LEy ex ante)
25 Mill designed data for baseline effluent treatment plant
PROJECT DESIGN DOCUMENT FORM (CDM-SSC-PDD) - Version 03
CDM ndash Executive Board
30
Abbreviation Description Value Source
ERy1 ex ante Ex ante emission reduction in year y
(tCO2e) 24712 Equation 22
BEy1 ex ante Ex ante baseline emissions in year y
(tCO2e) 30762 Equation 1
PEy1 ex ante Ex ante project emissions in year y (tCO2e) 6050 Equation 8
LEy1 ex ante Ex ante Leakage emissions in year y
(tCO2e) 0 -
Calculation for AMS-ID
Baseline emissions
Electricity generated from biogas engines will be exported to the Peninsular Malaysia National Grid The
baseline emissions are described in AMS-ID (Version 17 EB 61) as the ldquoproduct of electrical energy
baseline expressed in kWh of electricity produced by the renewable energy generating unit multiplied by
an emission factorrdquo
Baseline emissions due to electricity exported to the grid in the year ldquoyrdquo (tonnes)
BEEGy = EGBLy EFCO2gridy
Abbreviation Description Value Source
BEEGy Baseline emissions in year y (tCO2eyr) 4568 Calculated
EGBLy
Quantity of net electricity supplied to the
grid as a result of the implementation of the
project activity in year y (kWh yr)
6797625 Calculated
EFCO2gridy
CO2 emission factor of the grid in year
(tCO2kWh) 0672
Study on Grid Connected
Electricity Baselines in
Malaysia 2008 published in
2010 by PTM
Project Activity Emissions
As per AMS-ID (Version 17 EB 61) project emissions for renewable energy project activities are zero
PEEGy = 0
Leakage
If the energy generating equipment is transferred from another activity leakage is to be considered
No leakage emission will occur in the project activity LEy = 0
PROJECT DESIGN DOCUMENT FORM (CDM-SSC-PDD) - Version 03
CDM ndash Executive Board
31
Emission reductions
ERy = BEy ndash PEy - LEy
Abbreviation Description Value Source
ERy Emission reduction in year y (tCO2ey) 4568 -
BEy Baseline emissions in year y (tCO2ey) 4568 -
PEy Project emissions in year y (tCO2ey) 0 -
LEy Leakage emissions in year y (tCO2ey) 0 -
Calculation for AMS-IA
Baseline emissions
The energy baseline is the fuel consumption of the technology in use or that would have been used in the
absence of the project activity to generate the equivalent quantity of energy Option 2 is applied This
methodology is only apply shall the recovered is in excess after export to the grid
Annual electricity sent to the mill for FF displacement in the year ldquoyrdquo (kWh)
EBLy = ΣEGiy (1 ndash l)
Abbreviation Description Value Source
EBLy Annual energy baseline (kWhyr) Calculated
EGiy
The estimated annual output of the
renewable energy technologies of the group
of i renewable energy technologies
installed (kWhyr)
0 Estimated
l
Average technical distribution losses that
would have been observed in diesel
powered mini-grids installed by public
programmes or distribution companies in
isolated areas expressed as a fraction
0 Conservative by applying
Zero (0)
Baseline electricity sent to the mill for FF displacement in the year ldquoyrdquo (tonnes)
BECO2y = EBLy EFCO2
Abbreviation Description Value Source
BECO2y Baseline emission in the year y (tCO2yr) 0 Calculated
EBLy Annual energy baseline (kWhyr) 0 Calculated
EFCO2 CO2 emission factor (tCO2kWh) 08
Default value which is
derived from diesel
generation units is used
PROJECT DESIGN DOCUMENT FORM (CDM-SSC-PDD) - Version 03
CDM ndash Executive Board
32
Project Activity Emissions
As per AMS-IA (Version 14 EB 54) project emissions for renewable energy project activities are zero
PEy = 0
Leakage
If the energy generating equipment is transferred from another activity or if the existing equipment is
transferred to another activity leakage is to be considered
No leakage emission will occur in the project activity LEy = 0
B53 Summary of the ex-ante estimation of emission reductions
Estimated emission reductions (total project activity)
Year
Estimation of
project activity
emissions (tCO2e)
Estimation of
baseline emissions
(tCO2e)
Estimation of
leakage (tCO2e)
Estimation of
overall emission
reductions (tCO2e)
2012 504 2944 0 2440
2013 6050 35330 0 29280
2014 6050 35330 0 29280
2015 6050 35330 0 29280
2016 6050 35330 0 29280
2017 6050 35330 0 29280
2018 6050 35330 0 29280
2019 5546 32386 0 26840
Total (tCO2) 42350 247310 0 204960
The starting date of the crediting period is 01122012 or the date of registration whichever is later
Estimated emission reductions for AMS-IIIH
Year
Estimation of
project activity
emissions (tCO2e)
Estimation of
baseline emissions
(tCO2e)
Estimation of
leakage (tCO2e)
Estimation of
overall emission
reductions (tCO2e)
2012 504 2563 0 2059
2013 6050 30762 0 24712
PROJECT DESIGN DOCUMENT FORM (CDM-SSC-PDD) - Version 03
CDM ndash Executive Board
33
2014 6050 30762 0 24712
2015 6050 30762 0 24712
2016 6050 30762 0 24712
2017 6050 30762 0 24712
2018 6050 30762 0 24712
2019 5546 28199 0 22653
Total (tCO2) 42350 215334 0 172984
The starting date of the crediting period is 01122012 or the date of registration whichever is later
Estimated emission reductions for AMS-ID
Year
Estimation of
project activity
emissions (tCO2e)
Estimation of
baseline emissions
(tCO2e)
Estimation of
leakage (tCO2e)
Estimation of
overall emission
reductions (tCO2e)
2012 0 381 0 381
2013 0 4568 0 4568
2014 0 4568 0 4568
2015 0 4568 0 4568
2016 0 4568 0 4568
2017 0 4568 0 4568
2018 0 4568 0 4568
2019 0 4187 0 4187
Total (tCO2) 0 31976 0 31976
The starting date of the crediting period is 01122012 or the date of registration whichever is later
Estimated emission reductions for AMS-IA
Year
Estimation of
project activity
emissions (tCO2e)
Estimation of
baseline emissions
(tCO2e)
Estimation of
leakage (tCO2e)
Estimation of
overall emission
reductions (tCO2e)
2012 0 0 0 0
2013 0 0 0 0
2014 0 0 0 0
2015 0 0 0 0
2016 0 0 0 0
PROJECT DESIGN DOCUMENT FORM (CDM-SSC-PDD) - Version 03
CDM ndash Executive Board
34
2017 0 0 0 0
2018 0 0 0 0
2019 0 0 0 0
Total (tCO2) 0 0 0 0
The starting date of the crediting period is 01122012 or the date of registration whichever is later
B6 Application of the monitoring methodology and description of the monitoring plan
B61 Description of the monitoring plan
The parameters to be monitored are
Please note that the amount of methane recovered and fuelled or flared (MDy ) is calculated as follows
MDy = TMfuelledy + TMflaredy Equation A
Where Description Units
MDy Quantity of methane recovered and fuelled or flared in the year y tonnes CH4year
TMfuelledy Quantity of methane fuelled in the year y tonnes CH4year
TMflaredy Quantity of methane flared in year y tonnes CH4year
Where
TMfuelledy = FVfuelledh fvCH4h ηfuelledh ρCH4n) 1000 Equation B
Where Description Units
TMfuelledy Quantity of methane fuelled in the year y tonnes CH4year
FVfuelledh Volumetric flow rate of the fuelled biogas gas at normal conditions in
hour h
Nm3 biogashour
ηfuelledh 100 for gainful purpose26
fvCH4h Volumetric fraction of methane in the biogas gas in the hour h
ρCH4n Density of methane at normal conditions kgCH4Nm3CH4
And
TMflaredy = FVflaredh fvCH4h ηflareh ρCH4n) 1000 Equation C
Where Description Units
TMflaredy Quantity of methane flared in year y tonnes CH4year
FVflaredh Volumetric flow rate of the flared biogas gas at normal conditions in
hour h
Nm3 biogashour
26 AMS-IIIH point 35
PROJECT DESIGN DOCUMENT FORM (CDM-SSC-PDD) - Version 03
CDM ndash Executive Board
35
ηflareh Flare efficiency in the hour h
fvCH4h Volumetric fraction of methane in the biogas gas in the hour h
ρCH4n Density of methane at normal conditions kgCH4Nm3CH4
Data Parameter ID1 Qwwy
Data unit m3 month
Description The flow of wastewater entering the bio-digester
Source of data Measurement by project participant by using a flowmeter
Value of data ~ 28000
Brief description of
measurement methods and
procedures to be applied
The flow is measured with an online flow meter or equivalent
QAQC procedures to be
applied (if any) Data are monitored continuously and recorded periodically
(monthly or at shorter interval) in a data log file (DLF)
Uncertainty level of data low
Maintenance and calibration as per manufacturer‟s specifications
or at least once every three (3) years
Any comment
Data Parameter ID2 CODwwuntreatedy
Data unit tCOD m3
Description Raw COD of wastewater entering the bio-digester
Source of data Laboratory (internal and external)
Value of data ~ 0030230
Brief description of
measurement methods and
procedures to be applied
Measure of COD according to national or international standards
COD is measure through representative sampling
QAQC procedures to be
applied (if any) Minimum once a month COD sampling to ensure a 9010
confidenceprecision level
COD reports are recorded manually
Uncertainty level of data low
Maintenance and calibration as per manufacturer‟s specifications
or at least once every three (3) years for internal laboratory
equipment
Any comment
Data Parameter ID3 CODwwtreatedy
Data unit tCOD m3
Description COD of treated wastewater leaving the bio-digester
Source of data Laboratory (internal and external)
Value of data ~ 0003023
Brief description of
measurement methods and
procedures to be applied
Measure of COD according to national or international standards
COD is measure through representative sampling
QAQC procedures to be
applied (if any) Minimum once a month COD sampling to ensure a 9010
confidenceprecision level
COD reports are recorded manually
Uncertainty level of data low
PROJECT DESIGN DOCUMENT FORM (CDM-SSC-PDD) - Version 03
CDM ndash Executive Board
36
Maintenance and calibration as per manufacturer‟s specifications
or at least once every three (3) years for internal laboratory
equipment
Any comment
Data Parameter ID5 End-use of the final sludge
Data unit ndash
Description The final sludge generated by the project activity will be sent to control
landfill site if any
Source of data By project participant
Value of data ndash
Brief description of
measurement methods and
procedures to be applied
The final disposal of the sludge will be monitored during the crediting
period if any For each disposal of the sludge the following will be
recorded disposal site and date of disposal
QAQC procedures to be
applied (if any)
Any comment
Data Parameter ID6 FVflaredh
Data unit Nm3 hour
Description Volumetric flow of biogas recovered and flared at normal conditions in
the hour h
Source of data By project participant
Value of data 0
Brief description of
measurement methods and
procedures to be applied
The volume of biogas will be measured with a normalised flow meter or
calculated from the volumetric flow pressure temperature
Biogas volume and methane content measurements shall be on the same
basis (wet or dry)
QAQC procedures to be
applied (if any) The biogas flow is monitored continuously recorded and stored
electronically in a data log file (DLF) (monthly or at shorter
interval)
Data Parameter ID4 CODww dischargey
Data unit tCOD m3
Description COD of treated wastewater discharge into river by treatment system
Source of data Laboratory (internal and external)
Value of data ~ 0000100
Brief description of
measurement methods and
procedures to be applied
Measure of COD according to national or international standards
COD is measure through representative sampling
QAQC procedures to be
applied (if any) Minimum once a month COD sampling to ensure a 9010
confidenceprecision level
COD reports are recorded manually
Uncertainty level of data low
Maintenance and calibration as per manufacturer‟s specifications
or at least once every three (3) years for internal laboratory
equipment
Any comment
PROJECT DESIGN DOCUMENT FORM (CDM-SSC-PDD) - Version 03
CDM ndash Executive Board
37
Uncertainty level of data low
Maintenance and calibration as per manufacturer‟s specifications
or at least once every 3 years
Any comment
Data Parameter ID7 FVfuelledgas engineh
Data unit Nm3 hour
Description Volumetric flow of biogas recovered and fuelled (gas engine) at normal
conditions in the hour h
Source of data By project participant
Value of data ~ 509
Brief description of
measurement methods and
procedures to be applied
The volume of biogas will be measured with a normalised flow meter or
calculated from the volumetric flow of biogas pressure temperature
Biogas volume and methane content measurements shall be on the same
basis (wet or dry)
QAQC procedures to be
applied (if any) The biogas flow is monitored continuously recorded and stored
electronically in a data log file (DLF) (monthly or at shorter
interval)
Uncertainty level of data low
Maintenance and calibration as per manufacturer‟s specifications
or at least once every 3 years
Any comment
Data Parameter ID8 FVfuelledboilerh
Data unit Nm3 hour
Description Volumetric flow of biogas recovered and fuelled (boilers) at normal
conditions in the hour h
Source of data By project participant
Value of data ~ 0
Brief description of
measurement methods and
procedures to be applied
The volume of biogas will be measured with a normalised flow meter or
calculated from the volumetric flow of biogas pressure temperature
Biogas volume and methane content measurements shall be on the same
basis (wet or dry)
QAQC procedures to be
applied (if any) The biogas flow is monitored continuously recorded and stored
electronically in a data log file (DLF) (monthly or at shorter
interval)
Uncertainty level of data low
Maintenance and calibration as per manufacturer‟s specifications
or at least once every 3 years
Any comment
Data Parameter ID9 wCH4h
Data unit
Description Methane content in biogas in same basis (wetdry) as the biogas flows in
year y
Source of data By project participant using a gas analyzer
Value of data ~ 60
PROJECT DESIGN DOCUMENT FORM (CDM-SSC-PDD) - Version 03
CDM ndash Executive Board
38
Brief description of
measurement methods and
procedures to be applied
Using calibrated gas analyzer either continuous or periodical
measurement at confidenceprecision level of 9010
QAQC procedures to be
applied (if any) In case a continuous gas analyser is used data will be recorded
and stored electronically in a data log file (DLF) every hour or at
shorter interval
Uncertainty level of data low
Maintenance and calibration as per manufacturer‟s specifications
or at least once every 3 years
Any comment See also clarification by EB Meth Panel 30102009 ndash SSC_360
httpcdmunfcccintUserManagementFileStorageAM_CLAR_
QS83SX5B7WM6UGZE31JYQEQ4F65F6V
The biogas flow and the methane content measurements shall be
carried out close to each others
Data Parameter ID10 Tbiogas
Data unit ordmC
Description Temperature of biogas
Source of data Temperature probe
Value of data 20 ndash 65
Brief description of
measurement methods and
procedures to be applied
By project participant
QAQC procedures to be
applied (if any) Shall be measured and recorded at the same time when methane
content in biogas (ID8) is measured
Uncertainty level of data low
Maintenance and calibration as per manufacturer‟s specifications
or at least once every 3 years
Any comment Pressure and temperature are required to determine the density of
the methane If the biogas flow meter employed measures flow
pressure and temperature and displaysoutputs normalised flow of
biogas there is no need to separate monitoring of pressure and
temperature of the biogas
Data Parameter ID11 Pbiogas
Data unit Bar(g)
Description Pressure of biogas
Source of data By project participant
Value of data 50 ndash 200 mbar
Brief description of
measurement methods and
procedures to be applied
Pressure measurement device
QAQC procedures to be
applied (if any) Shall be measured and recorded at the same time when methane
content in biogas (ID8) is measured
Uncertainty level of data low
Maintenance and calibration as per manufacturer‟s specifications
or at least once every three (3) years
Any comment Pressure and temperature are required to determine the density of
the methane If the biogas flow meter employed measures flow
PROJECT DESIGN DOCUMENT FORM (CDM-SSC-PDD) - Version 03
CDM ndash Executive Board
39
pressure and temperature and displaysoutputs normalised flow of
biogas there is no need to separate monitoring of pressure and
temperature of the biogas
Shall be measured at the same time when methane content in
biogas (ID9) is measured
Parameter ID12 ηflareh (enclosed flare)
Unit
Description Enclosed flare efficiency in the hour h
Source of data Calculated
Value of data 0 or 50 or 90
Brief description of
measurement methods and
procedures to be applied
This yearly efficiency will be based on hourly flare efficiencies calculated
as per the provisions in the ldquoTool to determine project emissions from
flaring gases containing methanerdquo
The hourly flare efficiency will be calculated based on
0 if the temperature in the exhaust gas of the flare (Tflare) is
below 500 degC for more than 20 minutes during the hour h
50 if the temperature in the exhaust gas of the flare (Tflare) is
above 500 degC for more than 40 minutes during the hour h but the
manufacturer‟s specifications on proper operation of the flare are
not met at any point in time during the hour h
90 if the temperature in the exhaust gas of the flare (Tflare) is
above 500 degC for more than 40 minutes during the hour h and the
manufacturer‟s specifications on proper operation of the flare are
met continuously during the hour h
QAQC procedures to be
applied (if any) Data are logged hourly in a data log file (DLF)
Uncertainty level of data low
Any comment For enclosed flare
Or
Parameter ID13 ηflareh (open flare)
Unit
Description Flare efficiency in the hour h
Source of data Calculated
Value of data 0 or 50
Brief description of
measurement methods and
procedures to be applied
This yearly efficiency will be based on hourly flare efficiencies calculated
as per the provisions in the ldquoTool to determine project emissions from
flaring gases containing methanerdquo
The hourly flare efficiency will be calculated based on the duration of
time during which the flame is detected by the thermocouple (or flame
detector) installed in the open flare
Flare efficiency in hour h is based on default values
0 if the flame detected for not more than 20 minutes during the
hour h and
PROJECT DESIGN DOCUMENT FORM (CDM-SSC-PDD) - Version 03
CDM ndash Executive Board
40
50 if the flame detected for more than 20 minutes during the
hour h
A flame detector or thermocouple will be used
QAQC procedures to be
applied (if any) Data are logged hourly in a data log file (DLF)
Uncertainty level of data low
Any comment The only monitored parameter related to the flare is its efficiency Indeed
according to the clarification SSC_19927 of the methodology AMS IIIH
version 9 accepted by the SSC WG on the 3092008 ldquoIf a thermocouple
is used as a flame detection system it is sufficient to reach the given
minimum temperature from the manufacturer ldquo Hence it is not necessary
to monitor the temperature of the open type flares (Tflare)
Data Parameter ID14 ECPJjy
Data unit MWh
Description The yearly grid electricity consumption of the project activity for the year
bdquoy‟
Source of data Onsite instrument
Value of data ~749
Brief description of
measurement methods and
procedures to be applied
The grid electricity consumption of the project activity is measured
continuously with an energy meter (cumulative reading)
QAQC procedures to be
applied (if any) Data are monitored continuously and recorded periodically
(yearly or at shorter interval) in a data log file (DLF)
Uncertainty level of data low
Maintenance and calibration as per manufacturer‟s specifications
or at least once every three (3) years
Any comment
Data Parameter ID15 EGBLy
Data unit MWh
Description Quantity of net electricity generated and send to grid in year y
Source of data By project participant
Value of data ~ 6798
Brief description of
measurement methods and
procedures to be applied
The electricity generated and sent to grid is measured continuously with
an energy meter (cumulative readings)
QAQC procedures to be
applied (if any) Data are monitored continuously and recorded periodically
(yearly or at shorter interval) in a data log file (DLF)
Uncertainty level of data low
Maintenance and calibration as per manufacturer‟s specifications
or at least once every 3 years
Any comment As per AMS-ID
27 The clarification SSC_199 if available here (last access on the 24052011)
httpcdmunfcccintfilestorageAM_AM_CLAR_HIOZ5CS1PASC187C0JQ668L2E9RCRJResponse20WG20provided
20at20SSC20WG2017pdft=bU98MTMwNjIxNjY0OS4xMQ==|BOKHqtO94N6XF1N2N1vo8Ori-Rc=
PROJECT DESIGN DOCUMENT FORM (CDM-SSC-PDD) - Version 03
CDM ndash Executive Board
41
Or
Data Parameter ID16 EGmilly
Data unit MWh
Description Quantity of annual output of renewable energy sent to the mill in year y
Source of data By project participant
Value of data ~ 0
Brief description of
measurement methods and
procedures to be applied
The electricity generated and sent to mill to displace diesel use in diesel
gensets is measured continuously with an energy meter (cumulative
readings)
QAQC procedures to be
applied (if any) Data are monitored continuously and recorded periodically
(yearly or at shorter interval) in a data log file (DLF)
Uncertainty level of data low
Maintenance and calibration as per manufacturer‟s specifications
or at least once every 3 years
Any comment As per AMS-IA
Data Parameter ID17 Displacement of Biomass
Data unit Mt
Description Total amount of biomass (PKS) displaced from biomass boilers
Source of data Weighing bridge
Value of data Measurement at site
Brief description of
measurement methods and
procedures to be applied
Biomass (PKS) displaced due to the project activity will be weighed
using weighing bridge at the palm oil mill
QAQC procedures to be
applied (if any) Monthly calculation based on every single trip of trucks recorded
Data is recorded manually in a data log file based on the weighing
records
Maintenance and calibration as per manufacturer‟s specifications
Uncertainty level of data low
Any comment In the project activity the biomass (PKS) displaced will not be stored
under anaerobic conditions The conditions of onsite storage are identical
in the baseline as in the project activity The biomass will be sold to the
market on a regular basis PEbiomassy = 0
A final monitoring plan will be prepared prior the initial verification based on the as-built project activity
It will address the following aspects
MONITORING
The Project will be managed by CME with the involvement from Project Implementer CME will ensure
safety in operation of the plant as well as in the monitoring of emission reduction which is generated from
the project activity
CME will implement and be responsible for the monitoring plan Their responsibility covers operation of
the monitoring maintenance of the monitoring equipment data collection and archiving and
management of total scheme of the monitoring CME and Project Implementer will assign specific trained
PROJECT DESIGN DOCUMENT FORM (CDM-SSC-PDD) - Version 03
CDM ndash Executive Board
42
personnel during project implementation for the overall monitoring measurement and reporting of key
parameters as required in this PDD
DATA LOGGING AND STORAGE
The data measured by the instruments will be collected and stored in a data logging system The data will
be retrieved remotely by modem or directly on site
If data cannot be retrieved no emissions reductions will be claimed for the period of data failure The
data collected will be recorded in a central data base Access to production data will be restricted All
records and data (hard copy and soft copy) will be archived up to two years after the end of the crediting
period or the last issuance of CERs for this project activity whichever occurs later
CALIBRATION AND MAINTENANCE PROCEDURES MALFUNCTION OF EQUIPMENT
Maintenance includes all preventive and corrective actions necessary for the good functioning of the
equipment such as
Visual control of the equipment state and real-time check of displayed parameters
Cleaning up the equipment and the sensors
Adding lubricant
Replacement and change of defective parts
Calibration of equipment consists in verifying by comparison with a standard the accuracy of a
measuring instrument
Measuring instruments will be periodically and appropriately calibrated according to the procedures
timing and methods recommended by the manufacturer or nationalinternational standards as available
General malfunction of equipment
Daily inspections of the equipment will allow controlling equipment failure If equipment fails the
supplier will be notified and repairs will be carried out If the damaged equipment cannot be repaired it
will be replaced at the earliest In some cases portable tools will be used in order to carry out daily
monitoring of the missing parameter(s) In such case this data will be recorded manually
Discrepancies
To avoid discrepancies between projected data in the PDD and actual data (eg due to deferred starting
date malfunction of equipment) cross-checks between internal meter readings and external sources (eg
electricity invoices) will be carried out Any source of inconsistencies will be clarified
Case of emergency
For the case of emergency (earthquakes explosions fires etc) an emergency preparedness plan will be
adapted to the project activity All employees involved in the project on-site will be trained in the code of
conduct and required actions at time of commissioning of the plant
PROJECT DESIGN DOCUMENT FORM (CDM-SSC-PDD) - Version 03
CDM ndash Executive Board
43
OPERATIONAL AND MANAGEMENT STRUCTURE
The CDM monitoring team will be composed by the following staff
Position Report to
Operators
Project owner Supervisors (technicalmaintenance)
Operation Engineer
CDM monitoring project manager External CDM consultant
TRAINING OF MONITORING PERSONNEL
The maintenance will be conducted in-house by staff employed and trained by the Project Participants
Employees involved in the monitoring will be trained internally andor externally Training may include
inter alia
a) Review of equipment and captors
b) Calibration requirement
c) Configuration of monitoring equipment
d) Maintenance requirement
C1 Please indicate the level at which environmental analysis as per requirements of the CDM
modalities and procedures is undertaken Justify the choice of level at which the environmental
analysis is undertaken
radic Please tick if this information is provided at the PoA level In this case sections C2 and C3
need not be completed in this form
C2 Documentation on the analysis of the environmental impacts including transboundary
impacts
The host country does not require an analysis of environmental impacts As the project involves reduction
of GHG through recovery and controlled combustion which improves the quality of air therefore there
are no significant environmental impacts identified
C3 Please state whether an environmental impact assessment is required for a typical CPA
included in the programme of activities (PoA) in accordance with the host Party lawsregulations
In accordance with Malaysia environmental regulations Environmental Quality (Prescribed Activities
Environmental Impact Assessment) Order 1987 an Environmental Impact Assessment (EIA) is not
required for this CPA
PROJECT DESIGN DOCUMENT FORM (CDM-SSC-PDD) - Version 03
CDM ndash Executive Board
44
SECTION D Stakeholdersrsquo comments
D1 Please indicate the level at which local stakeholder comments are invited Justify the
choice
Please tick if this information is provided at the PoA level In this case sections D2 to D4 need
not be completed in this form
D2 Brief description how comments by local stakeholders have been invited and compiled
The stakeholder meeting was conducted at the office of Kilang Sawit Felda Triang on 05032012 There
were 37 stakeholders attending the consultation Posters were pasted at the guard house and at the
entrance to office 1 week before the stakeholder consultation to inform the locals stakeholders which
comprise mostly the workers of the mill 20 stakeholders out of the 37 who attended the consultation are
2nd generation of the Felda settlers who live in the vicinity to the project activity and adequately represent
the local community composed entirely of Felda settlers (no other people live in the vicinity of this
remote plantation) Continuous input of ideascomments were allowed to all stakeholders who could
either send their input though an email account especially setup for the biogas project or directly inform
the project proponents
During the meeting presentations were made by the project owner to outline the proposed project activity
in a non-technical manner (including environmental social and technological considerations) climate
change and the role of the CDM Attendees were given opportunity to raise their concern and opinion
about the proposed project activity during the question and answer session
D3 Summary of the comments received
PROJECT DESIGN DOCUMENT FORM (CDM-SSC-PDD) - Version 03
CDM ndash Executive Board
45
Below are the questions raised during the stakeholder meeting
NAME QUESTION
Mohd Tarmizi Bin Mat
Daud What is CDM in Bahasa Malaysia
Mohd Tarmizi Bin Mat
Daud What is DoE‟s standard for treated water released into river
Mohd Azizi Bin Abdul
Aziz
Would the biogas be captured from the existing effluent treatment ponds or a
new structure
Azhar Bin Abdul What to do with the captured biogas from the bioreactor
D4 Report on how due account was taken of any comments received
Below are the answers to the questions asked during the stakeholder meeting
QUESTION ANSWER
What is CDM in Bahasa Malaysia
The meaning of CDM in Bahasa Malaysia is Mekanisme
Pembangunan Bersih or in English is Clean Development
Mechanism
By Abd Karim Bin Mohd Zin
What is DoE‟s standard for treated
water released into river
The discharge standard for BOD into river is less than 100ppm
By Abd Karim Bin Mohd Zin
Would the biogas be captured from
the existing effluent treatment
ponds or a new structure
New bioreactor will be constructed to replace the existing anaerobic
lagoon treatment system The new bioreactor will capture the
biogas produced from this anaerobic treatment process
By Abd Karim Bin Mohd Zin
What to do with the captured
biogas from the bioreactor
The biogas recovered from the bioreactor will mainly contain
methane (approximately 60) and the rest are CO2 H2 and H2S
Currently the biogas is just released to the atmosphere from the
existing open lagoons system During the project activity captured
biogas will be combusted thus will improve the air quality
By Abd Karim Bin Mohd Zin
PROJECT DESIGN DOCUMENT FORM (CDM-SSC-PDD) - Version 03
CDM ndash Executive Board
46
Annex 1
CONTACT INFORMATION ON ENTITYINDIVIDUAL RESPONSIBLE FOR THE SMALL-
SCALE CPA
Organization Felda Palm Industries Sdn Bhd (359584-V)
StreetPOBox Jalan Gurney 1
Building Balai Felda 4th Floor
City Kuala Lumpur
StateRegion Wilayah Persekutuan
PostfixZIP 54000
Country Malaysia
Telephone (03) 2692 8066
FAX (03) 2693 4148
URL wwwfeldanetmy
Represented by
Title Head of Department
Salutation Mr
Last Name Busu
Middle Name
First Name Zainuri
Department Biomass
Mobile
Direct FAX
Direct tel
Personal E-Mail zainuribfeldanetmy
Organization Ably Carbon Sdn Bhd
StreetPOBox Jalan Ipoh Kecil
Building No 17
City Kuala Lumpur
StateRegion
PostfixZIP 50350
Country Malaysia
Telephone +60 3 4042 1177
FAX +60 3 4044 4166
E-Mail stephanevidailletably-carboncom
URL
Represented by Stephane Vidaillet
Title Chairman
Salutation Mr
Last Name Vidaillet
Middle Name
First Name Steacutephane
Department
Mobile +33 6 59111 5600
Direct FAX
PROJECT DESIGN DOCUMENT FORM (CDM-SSC-PDD) - Version 03
CDM ndash Executive Board
47
Direct tel
Personal E-Mail stephanevidailletably-carboncom
PROJECT DESIGN DOCUMENT FORM (CDM-SSC-PDD) - Version 03
CDM ndash Executive Board
48
Annex 2
INFORMATION REGARDING PUBLIC FUNDING
The project activity is not receiving any funding from parties included in Annex 1 of the Kyoto Protocol
SMALL-SCALE CDM PROGRAMME ACTIVITY DESIGN DOCUMENT FORM (CDM-SSC-CPA-DD) - Version 01
NAME TITLE OF THE PoA Biogas Recovery and Utilization PoA Projects in
Malaysia
CDM ndash Executive Board page 49
This template shall not be altered It shall be completed without modifyingadding headings or logo format or font
Annex 3
BASELINE INFORMATION
1 2
Year 2009 2010 2011 2012 2013 2014
FFB (mtyr) 343720 345910 310250 333293 333293 333293
POME Volume
(cumyr)[1] 343720 345910 310250 333293 333293 333293
Mill Opearing hour (hryr) 68865 69225 6209 6673 6673 6673
PKS (mtyr) 18905 19025 17064 18331 18331 18331
3 4 5 6 7 8 9 10
2015 2016 2017 2018 2019 2020 2021 2022
333293 333293 333293 333293 333293 333293 333293 333293
333293 333293 333293 333293 333293 333293 333293 333293
6673 6673 6673 6673 6673 6673 6673 6673
18331 18331 18331 18331 18331 18331 18331 18331
SMALL-SCALE CDM PROGRAMME ACTIVITY DESIGN DOCUMENT FORM (CDM-SSC-CPA-DD) - Version 01
NAME TITLE OF THE PoA Biogas Recovery and Utilization PoA Projects in
Malaysia
CDM ndash Executive Board page 50
This template shall not be altered It shall be completed without modifyingadding headings or logo format or font
10 days measurement campaign for baseline wastewater treatment system
Day Date
ETP
Inlet
Anaerobic
system (mgl)
Outlet
Anaerobic
system (mgl)
Outlet Algae
System (mgl)
Final
Discharge to
River (mgl)
1 23-Feb-12 35693 3120 811 603
2 25-Feb-12 19511 2559 1186 83
3 26-Feb-12 32864 2767 749 437
4 27-Feb-12 30195 2330 1210 404
5 28-Feb-12 32436 1927 1188 941
6 29-Feb-12 38259 4256 896 717
7 1-Mar-12 28717 3584 1232 695
8 3-Mar-12 31002 4660 1658 1210
9 4-Mar-12 22400 4346 1389 963
10 5-Mar-12 31226 4301 1971 1165
Average 30230 3385 1229 722
ETP
COD removal efficiency (anaerobic system) 8880
COD removal efficiency (Facultativealgae system) 6369
COD removal efficiency (Bio-polishing system) 4127
Total COD removal efficiency of the treatment system 9761
The COD of the raw effluent during ex-post may vary from the one year historical records depending on
the improvement of the production process (outside of project boundary) thus ERex-post may vary from the
estimated ERex-ante
SMALL-SCALE CDM PROGRAMME ACTIVITY DESIGN DOCUMENT FORM (CDM-SSC-CPA-DD) - Version 01
NAME TITLE OF THE PoA Biogas Recovery and Utilization PoA Projects in
Malaysia
CDM ndash Executive Board page 51
This template shall not be altered It shall be completed without modifyingadding headings or logo format or font
Annex 4
MONITORING INFORMATION
General information
Monitoring refers to the collection and archiving of all relevant data necessary for determining the
baseline measuring anthropogenic emissions by sources of greenhouse gases (GHG) within the project
boundary of a CDM project activity and leakage It includes developing suitable data collection methods
and data interpretation techniques for monitoring and verification of GHG emissions
On-line monitoring system
Most key meters required to determine GHG emissions and emission reductions will be monitored from a
central control point which will record meter readings at a pre-determined interval
Ensuring adequate maintenance and calibration of monitoring instruments
Specific maintenance repair or replacement of monitoring equipment will be recorded dated and
described
The calibration will occur at intervals determined on the basis of instrument manufacturers
recommendations stability purpose usage and history of repeatability Recalibration should be
performed whenever an event occurs that places the accuracy of the instrument in doubt
Calibration will take place at least once every three (3) years to ensure that the monitoring
equipments are properly installed and functioning properly
Calibration will be performed according to national or international standards
Last calibration certificates will be provided during periodic verification
Sampling procedure
Wherever a statistical sample is used for monitoring the ldquogeneral guidelines for sampling and surveys for
SSC project activitiesrdquo shall be used COD shall be measured from a composite sample to obtain a
representative value
Data archiving
The monitored data will be kept for a minimum of 2 years after the end of the crediting years by using
paper documents or electronic files
Identification of non-conformities
A verification of inconsistencies of the data recorded will be performed based for example on
The comparison of the calculated quantities of methane versus expected
Spot checks of field instruments (local reading) and data in the log file
Any discrepancies (completeness calculation errors transcription errors instrument calibration issues)
will be analyzed and actions taken to correct the problem
Ensuring adequate training of staff
All new staff members will undergo bdquoon job training‟ covering the monitoring requirements
The monitoring plan will be made available to staff member involved in the monitoring
A copy will be located in the control room at the site
SMALL-SCALE CDM PROGRAMME ACTIVITY DESIGN DOCUMENT FORM (CDM-SSC-CPA-DD) - Version 01
NAME TITLE OF THE PoA Biogas Recovery and Utilization PoA Projects in
Malaysia
CDM ndash Executive Board page 52
This template shall not be altered It shall be completed without modifyingadding headings or logo format or font
During the training the employees will sign a training attendance list All training records shall
be documented inclusive of training attendance training memo and training material if any
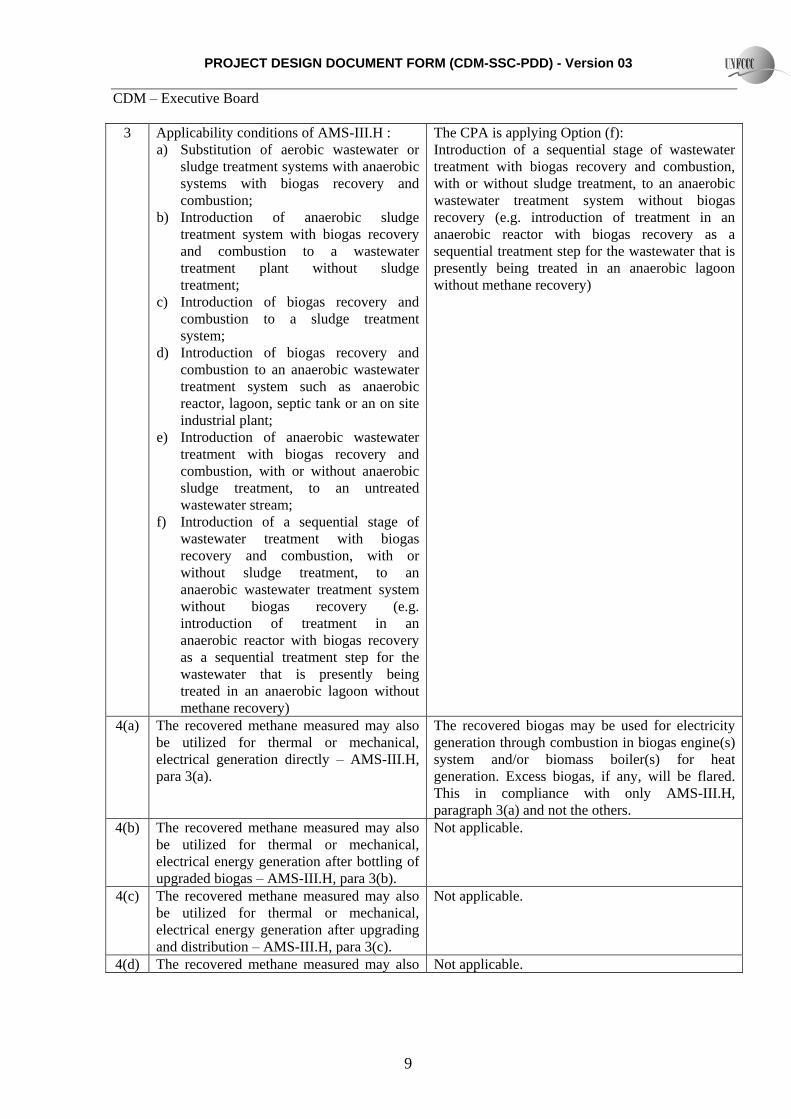
PROJECT DESIGN DOCUMENT FORM (CDM-SSC-PDD) - Version 03
CDM ndash Executive Board
9
3
Applicability conditions of AMS-IIIH
a) Substitution of aerobic wastewater or
sludge treatment systems with anaerobic
systems with biogas recovery and
combustion
b) Introduction of anaerobic sludge
treatment system with biogas recovery
and combustion to a wastewater
treatment plant without sludge
treatment
c) Introduction of biogas recovery and
combustion to a sludge treatment
system
d) Introduction of biogas recovery and
combustion to an anaerobic wastewater
treatment system such as anaerobic
reactor lagoon septic tank or an on site
industrial plant
e) Introduction of anaerobic wastewater
treatment with biogas recovery and
combustion with or without anaerobic
sludge treatment to an untreated
wastewater stream
f) Introduction of a sequential stage of
wastewater treatment with biogas
recovery and combustion with or
without sludge treatment to an
anaerobic wastewater treatment system
without biogas recovery (eg
introduction of treatment in an
anaerobic reactor with biogas recovery
as a sequential treatment step for the
wastewater that is presently being
treated in an anaerobic lagoon without
methane recovery)
The CPA is applying Option (f)
Introduction of a sequential stage of wastewater
treatment with biogas recovery and combustion
with or without sludge treatment to an anaerobic
wastewater treatment system without biogas
recovery (eg introduction of treatment in an
anaerobic reactor with biogas recovery as a
sequential treatment step for the wastewater that is
presently being treated in an anaerobic lagoon
without methane recovery)
4(a) The recovered methane measured may also
be utilized for thermal or mechanical
electrical generation directly ndash AMS-IIIH
para 3(a)
The recovered biogas may be used for electricity
generation through combustion in biogas engine(s)
system andor biomass boiler(s) for heat
generation Excess biogas if any will be flared
This in compliance with only AMS-IIIH
paragraph 3(a) and not the others
4(b) The recovered methane measured may also
be utilized for thermal or mechanical
electrical energy generation after bottling of
upgraded biogas ndash AMS-IIIH para 3(b)
Not applicable
4(c) The recovered methane measured may also
be utilized for thermal or mechanical
electrical energy generation after upgrading
and distribution ndash AMS-IIIH para 3(c)
Not applicable
4(d) The recovered methane measured may also Not applicable
PROJECT DESIGN DOCUMENT FORM (CDM-SSC-PDD) - Version 03
CDM ndash Executive Board
10
be utilized for hydrogen production ndash AMS-
IIIH para 3(d)
4(e) The recovered methane measured may also
be utilized for use as fuel in transportation
applications after upgrading ndash AMS-IIIH
para 3(e)
Not applicable
5 If the recovered biogas is used for project
activities covered under AMS-IIIH
paragraph 3(a) that component of the
project activity can use a corresponding
methodology under Type I
The recovered biogas is planned for gainfully use
for electricity andor heat generation in the CPA
The approved baseline and monitoring
methodology AMS IA (version 14) andor AMS-
ID (version 17) are used for the electricity
component of the CPA
6 Conditions that ensure compliance with
applicability and other requirements of
single or multiple methodologyies applied
by CPA
The proposed CPA-01 will apply AMS-IIIH
AMS-IA andor AMS-ID Applicability criteria
are listed below
7 The project has to fulfill Host Country
National CDM criteria if any
Malaysia‟s National CDM criteria have been
fulfilled by the proposed CPA
8 The starting date of CPA is compliant with
the latest UNFCCC guidelines
The start date of the CPA is not or will not be
prior to the commencement of validation of the
PoA The EPC contract for biogas plant yet to be
awarded
9 Confirmation that the CPA does not involve
any public funding from Annex I Parties or
that in case public funding is used it does
not result in diversion of Official
Development Assistance (ODA)
The proposed CPA has not received and will not
be seeking public funding from Annex 1 countries
10 A local Stakeholder consultation has been
conducted prior to the CPA inclusion
Stakeholder consultation has been organized on
05032012 and it is prior to the CPA inclusion
11 Conditions pertaining to the demonstration
of additionality of each small scale CPA to
be included (less than 60 ktCO2 year) for
Type III and 15MW for Type I
methodologies
The proposed CPA may install gas engine with
maximum capacity of 12 MW and methane
avoidance of less than 60000 tCO2yr for AMS-
IIIH
12 Where applicable the conditions that ensure
that CPA in aggregate meets the small-scale
threshold criteria and remain within this
threshold throughout the crediting period of
the CPA
The proposed CPA may install gas engine with
maximum capacity of 12 MW and methane
avoidance of less than 60000 tCO2yr for AMS-
IIIH
13 Where applicable the requirements for the
debundling check in case CPAs belong to
small-scale (SSC) project categories
The proposed CPA is not a debundled component
of a large activity as described in the latest
ldquoGuidelines on assessment of debundling for SSC
project activitiesrdquo
14 Where applicable the conditions related to
sampling requirements for a PoA in
accordance with the approved
guidelinesstandard from the Board
pertaining to sampling and surveys
Not applicable all CPAs will be verified
15 Where applicable target group (eg The target group is prospective POME plants in
PROJECT DESIGN DOCUMENT FORM (CDM-SSC-PDD) - Version 03
CDM ndash Executive Board
11
domesticcommercialindustrial ruralurban
grid-connectedoff-grid) and distribution
mechanisms (eg direct installation)
Malaysia There are no specific distribution
mechanisms
16 Whether an EIA is required by local
authorities
Not applicable for the proposed CPA as EIA is not
required
17 The crediting period of the CPA shall not
exceed the length of the PoA (ie 28 years)
regardless of the time of inclusion of CPA in
the PoA
The crediting period of the proposed CPA will not
exceed the length of PoA 28 years
Additional eligibility criteria applicable in case of CPA that gainfully use of biogas for electrical
andor thermal energy generation
The proposed project conforms to the applicable requirements of AMS - ID version 17
Applicability Criteria Justification
This methodology comprises renewable energy
generation units such as photovoltaic hydro
tidalwave wind geothermal and renewable biomass
a) Supplying electricity to a national or a regional
grid
b) Supplying electricity to an identified consumer
facility via nationalregional grid through a
contractual arrangement such as wheeling
Applicable The proposed project activity is
based on biogas recovered from anaerobic bio-
digester a renewable energy generation source
The proposed project shall supply electricity to
the national grid
The project activity is not supplying electricity
to an identified consumer facility
This methodology is applicable to project activities that
(a) Install a new power plant at a site where there was
no renewable energy power plant operating prior
to the implementation of the project activity
(Greenfield plant)
(b) Involve a capacity addition
(c) Involve a retrofit of (an) existing plant(s)
(d) Involve a replacement of (an) existing plant(s)
Applicable to (a) where the proposed project
activity shall install a new power plant at a site
where there was no renewable energy power
plant operating prior to the implementation of
the project activity
Hydro power plants with reservoirs that satisfy at least
one of the following conditions are eligible to apply this
methodology
Not applicable The project activity is a biogas
recovery and utilization project
If the new unit has both renewable and non-renewable
components (eg a winddiesel unit) the eligibility limit
of 15MW for a small-scale CDM project activity applies
only to the renewable component If the new unit co-
fires fossil fuel the capacity of the entire unit shall not
exceed the limit of 15MW
Not applicable The project does not
incorporate a mix of renewable and non-
renewable components
Combined heat and power (co-generation) systems are
not eligible under this category
Applicable There is no combined heat and
power component in the project activity
PROJECT DESIGN DOCUMENT FORM (CDM-SSC-PDD) - Version 03
CDM ndash Executive Board
12
In the case of project activities that involve the addition
of renewable energy generation units at an existing
renewable power generation facility the added capacity
of the units added by the project should be lower than
15 MW and should be physically distinct from the
existing units
Not applicable The project activity does not
involve the addition of renewable energy
generation units at an existing facility
In the case of retrofit or replacement to qualify as a
small-scale project the total output of the retrofitted or
replacement unit shall not exceed the limit of 15 MW
Not applicable The project activity does not
seek to retrofit or replacement an existing
facility
The proposed project conforms to the applicable requirements of AMS - IA version 14
Applicability Criteria Justification
This category comprises renewable electricity
generation units that supply individual Households
users or groups of households users included in the
project boundary The applicability is limited to
individual households and users that do not have a grid
connection except when
a) A group of households or users are supplied
electricity through a standalone mini grid powered
by renewable energy generation unit(s) where the
capacity of the generating units does not exceed 15
MW or
b) The emissions reduction per renewable energy
based lighting system is less than 5 tonnes of CO2e
a year and where it can be shown that fossil fuel
would have been used in the absence of the project
activity by
(i) A representative sample survey (90
confidence interval plusmn10 error margin) of
target households or
(ii) Official statistics from the host country
government agencies
The renewable energy generation units include
technologies such as solar hydro wind biomass
gasification and other technologies that produce
electricity all of which is used on-sitelocally by the
user
The renewable generating units may be new
installations (Greenfield) or replace existing onsite
fossil-fuel-fired generation To qualify as a small-scale
project the total output of the unit(s) shall not exceed
the limit of 15 MW
Applicable The proposed project activity is not
grid connected
Furthermore the total installed capacity of the
generating units will not exceed 15 MW
Applicable The project activity involves the
combustion of the recovered biogas from the
anaerobic bio-digester for electricity generation
to be use on-site
Applicable The project activity involve the
replacement of existing onsite fossil fuel fired
generation and the total installed capacity is not
PROJECT DESIGN DOCUMENT FORM (CDM-SSC-PDD) - Version 03
CDM ndash Executive Board
13
exceed 15 MW
Hydro power plants with reservoirs that satisfy at least
one of the following conditions are eligible to apply this
methodology
The project activity is implemented in an existing
reservoir with no change in the volume of
reservoir
The project activity is implemented in an existing
reservoir where the volume of reservoir is
increased and the power density of the project
activity as per definitions given in the Project
Emissions section is greater than 4 Wm2
The project activity results in new reservoirs and
the power density of the power plant as per
definitions given in the Project Emissions section
is greater than 4 Wm2
Not applicable The project activity is not a
hydro power plant
Combined heat and power (co-generation) systems are
not eligible under this category
Applicable There is no combined heat and
power component in the project activity
If the unit added has both renewable and non-renewable
components (eg a winddiesel unit) the eligibility
limit of 15 MW for a small-scale CDM project activity
applies only to the renewable component If the unit
added co-fires fossil fuel the capacity of the entire unit
shall not exceed the limit of 15 MW
Not applicable The project does not
incorporate a mix of renewable and non-
renewable components
Project activities that involves retrofit or replacement of
an existing facility for renewable energy generation are
included in this category To qualify as a small-scale
project the total output of the modified or retrofitted
unit shall not exceed the limit of 15 MW
Not applicable The project activity does not
seek to retrofit or replacement an existing
facility
In the case of project activities that involve the addition
of renewable energy generation units at an existing
renewable power generation facility the added capacity
of the units added by the project should be lower than
15 MW and should be physically distinct3 from the
existing units
Not applicable The project activity does not
involve the addition of renewable energy
generation units at an existing facility
B3 Assessment and demonstration of additionality of the small-scale CPA as per eligibility
criteria listed in the Registered PoA
In Malaysia Environmental Quality (Prescribed Premises) (Crude Palm Oil) Regulation 1977 governs
environmental considerations including the wastewater treatment and discharge at palm oil mills The
regulation stipulates the discharge standards for water discharge or land application The regulation
however does not specify the required treatment technologies for wastewater or GHG emissions from
wastewater treatment operations
PROJECT DESIGN DOCUMENT FORM (CDM-SSC-PDD) - Version 03
CDM ndash Executive Board
14
More than 85 of palm oil mills are utilizing open based anaerobic ponds and it is considered the
prevailing practice for oil palm industry to treat the POME The open anaerobic ponds system is an
effective and low-tech solution that can easily meet the water discharge limits applicable to the palm oil
industry9 10
There is no financial incentive for the palm oil mill owners to invest into methane capture projects
particularly when there is no requirement under existing pending or planned national state or local
regulatory This is partly related to the fact that there are a lot of attractive and competing investments in
the sector However the PP has undertaken to set up this project in order to reduce the GHG emissions
and contribute his mite to the global GHG emission reduction
The project is a small scale project activity As such the provisions of Attachment A to Appendix B of
the simplified modalities and procedures for small-scale CDM project activities will apply to this project
The bdquoindicative simplified baseline and monitoring methodologies for selected small-scale CDM project
activity categories‟ require the project proponents to demonstrate that the project activity would not have
occurred anyway due to at least one of the following barriers
a) Investment barrier a financially more viable alternative to the project activity would have led to
higher emissions
b) Technological barrier a less technologically advanced alternative to the project activity involves
lower risks due to the performance uncertainty or low market share of the new technology
adopted for the project activity and so would have led to higher emissions
c) Barrier due to prevailing practice prevailing practice or existing regulatory or policy
requirements would have led to the implementation of a technology with higher emissions
d) Other barriers without the project activity for another specific reason identified by the project
participant such as institutional barriers or limited information managerial resources
organizational capacity financial resources or capacity to absorb new technologies emissions
would have been higher
Subsequently in its 35th Meeting the EB had issued bdquoNon-binding best practice examples to demonstrate
additionality for SSC project activities‟ wherein EB had given best practice examples of each of the
aforementioned category of barriers
The project participant has chosen Investment Barrier to demonstrate the additionality which is discussed
in the following paragraphs
Investment barrier
The most important of all the barriers faced by the company is the investment barrier The investment
analysis reveals that the project is not financially attractive The additionality tool permits the use of
simple cost analysis or investment comparison analysis or benchmark analysis to demonstrate the
additionality of the project
9 SD 05 ndash Yeoh B G 2004 A Technical and Economic Analysis of Heat and Power Generation from Biomethanation of
Palm Oil Mill Effluent Electrcity Supply Industry in Transition Issues and Prospect for Asia 10 SD 06 ndash Eco-Ideal Consulting Sdn Bhd (Eco-Ideal) 2004 MEWCPTMDANIDA Study on Clean Development
Mechanism Potential in the Waste Sectors in Malaysia Unpublished
PROJECT DESIGN DOCUMENT FORM (CDM-SSC-PDD) - Version 03
CDM ndash Executive Board
15
As the project activity generates revenue (other than CDM revenue) by exporting the electricity to the
grid and from the likely sale of biomass andor saving from diesel usage at the mill which is being
displaced by biogas simple cost analysis cannot be used Of the remaining PP has chosen the benchmark
analysis to demonstrate the financial unattractiveness of the project activity without carbon credits
There is a national policy on Feed-In-Tariff (FiT) gazetted in June 201111
that gives comparative
advantages to less emissions-intensive technologies over more emissions-intensive technologies (E-
policy as national andor sectoral policies or regulations that give comparative advantages to less
emissions-intensive technologies over more emissions-intensive technologies)
This is very conservative as paragraph 7 6 (b) EB22 Annex 3 states that ldquoNational andor sectoral
policies or regulations hellip that have been implemented since the adoption by the COP of the CDM MampP
(decision 17CP7 11 November 2001) need not be taken into account in developing a baseline scenario
(ie the baseline scenario could refer to a hypothetical situation without the national andor sectoral
policies or regulations being in place) In absence of the FiT the prevailing electricity sales tariff to
consumers is RM 021 per kWh
Project IRR has been chosen as the financial indicator for the financial analysis of the project activity
The project IRR has to be compared with a benchmark rate of return to demonstrate the additionality of
the project The Guidelines on the Assessment of Investment Analysis (Version 05 point 12) states ldquoIn
cases where a benchmark approach is used the applied benchmark shall be appropriate to the type of IRR
calculated Local commercial lending rates or weighted average costs of capital (WACC) are appropriate
benchmarks for a project IRR Requiredexpected returns on equity are appropriate benchmarks for an
equity IRR Benchmarks supplied by relevant national authorities are also appropriate if the DOE can
validate that they are applicable to the project activity and the type of IRR calculation presentedrdquo
In line with the Guidelines on the Assessment of Investment Analysis (Version 05) a default value
for the expected returns on equity is selected as the benchmark with 1090 The logic of choosing this
rate as benchmark is that the project should yield a return at least equivalent to the expected returns of
equity to merit consideration
For making the investment analysis the following assumptions have been made
Table B2 Investment Analysis
Sl No Description Value
1
Budgeted CAPEX
- Bioreactor amp accessories
- Flaring system
- Boiler adaptation cost for burners
- Gas engine(s)
- KPSR consultancy cost
4350000
140670
205000
4630000
220000
Total 9545670
2
Annual maintenance costs are estimated based on a of CAPEX12
Bioreactor (3 of CAPEX) = MYR 130500
Gas engine(s) (5 of CAPEX) = MYR 231500
3 Corporate tax ()13 25
11 httpwwwmbipvnetmydloadFiT20Handbook20Englishpdf 12 SD 05 ndash Maintenance cost (SIRIM Environmental and Bioprocess Technology Centre of Malaysia)
PROJECT DESIGN DOCUMENT FORM (CDM-SSC-PDD) - Version 03
CDM ndash Executive Board
16
Since losses can be carried forward indefinitely (so long as the ownership
remains unchanged) the incidence of taxation does not arise in the case of
this project activity
4
Manpower cost has been estimated based on 1 supervisor 2 operators 1
chargeman envisaged to be appointed and the ruling wagesalary structure
of the company14
182588 MYR yr
5 Salary increment rate has been applied based on the average expected
salary increment rate for year 20101115 40
6 Price of Biomass ex-factory (PKS) 156 MYRmt
7 Price of diesel 220 MYRliter
8 RE tariff export to grid (MYRkWh) 021
9
Laboratory Cost is estimated based on the quotations from accredited
laboratory anticipated number of tests and samples to be carried out and
transportation cost during the running and operating of the biogas plant for
maintaining optimum operating conditions
1920 MYR yr
10 Insurance premium per year ( of CAPEX)16 0412
11 Estimate of CER price (EUR) 8
12
Depreciation of equipment (years) has been provided as per the Inland
Revenue Authority regulations17 Since the project consists of only
environmental protection equipment it is entitled to initial capital
allowance of 40 and annual capital allowance of 20 as per the Inland
Revenue Authority notifications
4 years
13 Project life time for IRR calculation18 20 years
14
Residual value a fair value (5) of the project activity assets at the end of
the assessment period as per the Guidelines on The Assessment of
Investment Analysis version 05 EB 62
MYR 466284
Based on the above assumption the project IRR works out to be ndash 085 in contrast to the benchmark
rate of 1090 Thus the analysis proves that the project is not financially attractive
Sensitivity Analysis
A sensitivity analysis has also been conducted to test the robustness of the conclusions drawn Four (4)
factors have been identified as critical to IRR of the project viz project cost maintenance costs RE
tariff The results of sensitivity analysis are given below
13 SD 08 ndash Malaysian Tax and Business Booklet 201011 Page 12
httpwwwpwccomen_MYmyassetspublicationstaxbooklet1011pdf 14 SD 3 - Salary structure (biogas plant) 15 SD 09 - Salary increment rate (201011) 16 SD 2 - Biogas plant insurance policy 17 SD 08 ndash Malaysian Tax and Business Booklet 201011 Page 21
httpwwwpwccomen_MYmyassetspublicationstaxbooklet1011pdf 18 As per the Guidelines on the Assessment of Investment Analysis version 05 (Annex 5 EB 62 point 3) ldquoIn general a
minimum period of 10 years and a maximum of 20 years will be appropriaterdquo PP has chosen 20 years for financial
assessment as it is conservative
PROJECT DESIGN DOCUMENT FORM (CDM-SSC-PDD) - Version 03
CDM ndash Executive Board
17
Table B3 Sensitivity Analysis
FACTORS PROJECT IRR
-10 0 +10
Project cost -185 -085 033
Maintenance cost -491 -085 189
RE tariff 112 -085 -354
It could be seen from the above that even under the most optimistic conditions the project activity would
not yield a positive IRR let alone crossing the benchmark Therefore the project is not a business-as-
usual scenario and it is additional
Prior Consideration of CDM
As per the guidance of EB Meeting Report 49 Annex 22 the project proponent notified the UNFCCC and
the DNA of the intent to implement the project as a CDM project activity
Conclusion
The conclusion of the investment analysis remains identical to reasonable variations of the critical
assumptions (sensitivity analysis) Therefore the project activity IRR remains lower than the benchmark
In the above background it is proved that the project faces an investment barrier that establishes the
additionality
B4 Description of the sources and gases included in the project boundary and proof that the
small-scale CPA is located within the geographical boundary of the registered PoA
The emission sources and type of GHG which are included or excluded within the project boundary are
shown in the following table
Table B4 Emission Sources and Type of GHG
Source Gas Included Justification Explanation
Ba
seli
ne
Direct emissions
from the
wastewater
treatment processes
CO2 No Neutral CO2 emissions from biomass decaying
CH4 Yes Methane emissions from open lagoons treatment
process
N2O No Not significant Excluded for simplification and
conservativeness
Diesel usage in
diesel genset at mill
CO2 Yes CO2 emissions from combustion of diesel fuel
CH4 No Not significant Excluded for simplification and
conservativeness
N2O No Not significant Excluded for simplification and
conservativeness
Pro
ject
Act
ivit
y
Bio-digester
CO2 No Neutral CO2 emissions from biomass decaying
CH4 Yes Methane emissions from anaerobic treatment process
N2O No Not significant Excluded for simplification and
conservativeness
Existing
wastewater
treatment lagoons
CO2 No Neutral CO2 emissions from biomass decaying
CH4 Yes Methane emissions from poorly managed treatment
process (without aerators)
PROJECT DESIGN DOCUMENT FORM (CDM-SSC-PDD) - Version 03
CDM ndash Executive Board
18
(Facultative amp
algae system) N2O No
Not significant Excluded for simplification and
conservativeness
Gas engine(s)
(biogas
combustion)
CO2 No Neutral CO2 emissions from biogas combustion
CH4 No Not significant and excluded from calculation
Biogas combustion efficiency is considered 10019
N2O No Not significant Excluded for simplification and
conservativeness
Biomass Boiler(s)
(Biogas
combustion)
CO2 No Neutral CO2 emissions from biogas combustion
CH4 No Not significant and excluded from calculation
Biogas combustion efficiency is considered 10020
N2O No Not significant Excluded for simplification and
conservativeness
Grid electricity
consumption from
national grid
CO2 Yes CO2 emissions from grid energy
CH4 No Not significant Excluded for simplification and
conservativeness
N2O No Not significant Excluded for simplification and
conservativeness
Enclosed or Open
flaring system
CO2 No Neutral CO2 emissions from biogas combustion
CH4 Yes CH4 emissions due to incomplete combustion in
enclosed flare
N2O No Not significant Excluded for simplification and
conservativeness
The CPA is implemented at the address below
Kilang Sawit Felda Triang Triang Pahang Malaysia
The site is located at state of Pahang Malaysia with GPS coordinates 3 16152 N 102 34567 E or
32692 1025761 (refer also Section A412) and thus is located within the geographical boundary of the
PoA
B5 Emission reductions
B51 Data and parameters that are available at validation
Data Parameter GWPCH4
Data unit tCO2tCH4
Description Global Warming Potential the equivalent in CO2 of the effect of methane
gas to the atmosphere
Source of data used IPCC 2006
Value applied 21
Justification of the choice of
data or description of
measurement methods and
procedures actually applied
Global warming potential for methane gas since this is a methane
capture project
19 AMS-IIIH para 35 20 AMS-IIIH para 35
PROJECT DESIGN DOCUMENT FORM (CDM-SSC-PDD) - Version 03
CDM ndash Executive Board
19
Any comment
Data Parameter MCFwwtreatmentBL1
Data unit Fraction
Description Methane correction factor for baseline wastewater anaerobic treatment
systems
Source of data used Table IIIH1 AMS IIIH version 16
Value applied 08
Justification of the choice of
data or description of
measurement methods and
procedures actually applied
Table IIIH1 for baseline emission The lagoons depth are more than 2m
MCF value of 08 for anaerobic deep lagoon (depth gt 2 m)
Any comment
Data Parameter MCFwwtreatmentBL2
Data unit Fraction
Description Methane correction factor for baseline wastewater aerobic treatment
systems
Source of data used Methane correction factor for baseline aerobic wastewater treatment
system (poorly managed)
Value applied Table IIIH1 AMS IIIH version 16
Justification of the choice of
data or description of
measurement methods and
procedures actually applied
03
Any comment No aerators installed
Data Parameter MCFwwBLdischarge
Data unit Fraction
Description Methane correction factor based on discharge pathway in the baseline
situation
Source of data used Table IIIH1 AMS IIIH version 16
Value applied 01
Justification of the choice of
data or description of
measurement methods and
procedures actually applied
Table IIIH1 for baseline emission The final discharge of treated
effluent into river MCF value of 01 for river discharge
Any comment
Data Parameter Bo ww
Data unit kgCH4 kgCOD
Description Methane generation capacity of treated wastewater
Source of data used IPCC 2006
Value applied 025
Justification of the choice of
data or description of
measurement methods and
procedures actually applied
Default value as prescribed in the methodology
Any comment
PROJECT DESIGN DOCUMENT FORM (CDM-SSC-PDD) - Version 03
CDM ndash Executive Board
20
Data Parameter UFBL
Data unit -
Description Model correction factor to account for model uncertainties (baseline)
Source of data used AMS IIIH version 16
Value applied 089
Justification of the choice of
data or description of
measurement methods and
procedures actually applied
As per methodology AMS-IIIH point 24
Any comment -
Data Parameter UFPJ
Data unit -
Description Model correction factor to account for model uncertainties (project
activity)
Source of data used AMS IIIH version 16
Value applied 112
Justification of the choice of
data or description of
measurement methods and
procedures actually applied
As per methodology AMS-IIIH point 30(a)
Any comment -
Data Parameter CFEww
Data unit Fraction
Description Capture efficiency of the biogas recovery equipment in the wastewater
treatment system
Source of data used AMS IIIH version 16
Value applied 09
Justification of the choice of
data or description of
measurement methods and
procedures actually applied
A default value of 09 has been used as per the guidance in the
methodology
Any comment
Data Parameter MCF ww treatmentPJ1
Data unit Fraction
Description Methane correction factor for the project wastewater anaerobic treatment
system equipped with biogas recovery equipment
Source of data used Table IIIH1 AMS IIIH version 16
Value applied 08
Justification of the choice of
data or description of
measurement methods and
procedures actually applied
The lagoons depth are more than 2 m MCF values in table IIIH1 has
been used as per the guidance in the methodology (depth gt 2 m)
Any comment
Data Parameter MCF ww treatmentPJ2
PROJECT DESIGN DOCUMENT FORM (CDM-SSC-PDD) - Version 03
CDM ndash Executive Board
21
Data unit Fraction
Description Methane correction factor for the project wastewater aerobic treatment
system not equipped with biogas recovery equipment
Source of data used Table IIIH1 AMS IIIH version 16
Value applied 03
Justification of the choice of
data or description of
measurement methods and
procedures actually applied
Aerobic treatment poorly managed
Any comment
Data Parameter MCFwwPJdischarge
Data unit Fraction
Description Methane correction factor based on discharge pathway in the project
activity
Source of data used Table IIIH1 AMS IIIH version 16
Value applied 01
Justification of the choice of
data or description of
measurement methods and
procedures actually applied
Table IIIH1 for project emission The final discharge of treated effluent
into river MCF value of 01 for river discharge
Any comment Same discharge pathway as in the baseline
Data Parameter CODBL1
Data unit
Description COD removal efficiency of the baseline system (anaerobic treatment
system)
Source of data used 10 days measurement campaign
Value applied Anaerobic Treatment system 8880
Justification of the choice of
data or description of
measurement methods and
procedures actually applied
One year historical data not available
Any comment This data will be used for ex post emission reduction calculation
Data Parameter CODBL2
Data unit
Description COD removal efficiency of the baseline system (aerobic treatment
system)
Source of data used 10 days measurement campaign
Value applied Aerobic Treatment system 6369
Justification of the choice of
data or description of
measurement methods and
procedures actually applied
One year historical data not available
Any comment This data will be used for ex post emission reduction calculation
Data Parameter NCVCH4
Data unit MJkg
PROJECT DESIGN DOCUMENT FORM (CDM-SSC-PDD) - Version 03
CDM ndash Executive Board
22
Description Net Calorific Value of methane
Source of data used IPCC 2006 Default Value
Value applied 504
Justification of the choice of
data or description of
measurement methods and
procedures actually applied
IPCC 2006 value is used Volume 2 Chapter 1 Table 12
Any comment
Data Parameter NCVFF
Data unit MJkg
Description Net Calorific Value of diesel
Source of data used IPCC 2006 Default Value
Value applied 430
Justification of the choice of
data or description of
measurement methods and
procedures actually applied
IPCC 2006 value is used Volume 2 Chapter 1 Table 12
Any comment
Data Parameter EFCO2diesel
Data unit tCO2MWh
Description CO2 emission factor diesel genset
Source of data used AMS-IA version 14 point 14
Value applied 08
Justification of the choice of
data or description of
measurement methods and
procedures actually applied
Default value for diesel generation unit
Any comment
Data Parameter Grid Emission Factor
Data unit kgCO2ekWh
Description Emission factor for grid electricity in Peninsular Malaysia
Source of data used Pusat Tenaga Malaysia March 2010
Value applied 0672
Justification of the choice of
data or description of
measurement methods and
procedures actually applied
As per AMS-ID point 12
Any comment Study on Grid Connected Electricity Baselines in Malaysia 2008
B52 Ex-ante calculation of emission reductions
The ex ante emission reductions are calculated based on AMS-IIIH version 16 as per equations
explained in section E62 of PoA-DD Biogas PoA in Malaysia
PROJECT DESIGN DOCUMENT FORM (CDM-SSC-PDD) - Version 03
CDM ndash Executive Board
23
Calculation for AMS-IIIH
Baseline emissions
Source of baseline emissions Reference Applicable
(YN)
Comments
Wastewater and sludge treatment
systems equipped with a biogas
recovery facility shall be excluded
from the baseline
AMS-IIIH
Point 17
N No biogas recovery in the
baseline
Emissions on account of electricity or
fossil fuel used (BEpowery)
AMS-IIIH
Point 18 (i)
N For conservativeness no
emissions due to electricity or
fossil fuel will be claimed
BEpowery = 0
Methane emissions from baseline
wastewater treatment systems
(BEwwtreatmenty)
AMS-IIIH
Point 18 (ii)
Y Baseline includes anaerobic and
aerobic treatment conditions with
different MCF values selected as
per Table IIIH1
Methane emissions from baseline
sludge treatment systems (BEstreatmenty)
= 0
AMS-IIIH
Point 18 (iii)
N The baseline plant corresponds to
scenario Para 1(f) without sludge
treatment BEstreatmenty = 0
Methane emissions on account of
inefficiencies in the baseline
wastewater treatment systems and
presence of degradable organic carbon
in the treated wastewater discharged
into river (BEwwdischargey)
AMS-IIIH
Point 18 (iv)
Y Treated effluent is currently
discharged into the river
Methane emissions from the decay of
the final sludge generated by the
baseline treatment systems (BEsfinaly)
AMS-IIIH
Point 18 (v)
N Zero because in the baseline final
sludge used for soil application
BEsfinaly = 0
A) Calculation of baseline emissions
BEy = BEwwtreatmenty + BEwwdischargey
Abbreviation Description Value Source
BEy Baseline emissions in year y (tCO2e) 30762 Calculated
BEpowery Baseline emissions of diesel genset in year
y tCO2eyear 0 Calculated
BEwwtreatmenty Baseline emissions of the wastewater
treatment systems tCO2eyear 30663 Equation 2
BEwwdischargey
The methane emissions from degradable
organic carbon in treated wastewater
discharged tCO2eyear
100 Equation 6
A1) Baseline emissions
PROJECT DESIGN DOCUMENT FORM (CDM-SSC-PDD) - Version 03
CDM ndash Executive Board
24
Equation 2 BEwwtreatmenty = Qwwy (CODinflow1 y CODBL1 MCFwwtreatmentBL1) +
(CODinflow2y CODBL2 MCFwwtreatmentBL2) Boww UFBL GWPCH4
Abbreviation Description Value Source
BEwwtreatmenty Baseline emissions of the wastewater
treatment systems (tCO2eyear) 30663 Calculated
Qwwy Volume of wastewater treated in baseline
wastewater treatment system i in year y
(m3year)
333293
Volume based on 10 m3mt
FFB21 amp FFB historical data
(2009 ndash 2011)
CODinflow1y Chemical oxygen demand of the
wastewater inflow to the baseline treatment
system (anaerobic) in year y (tCOD m3)
0026905 10 days measurement
campaign
CODBL1 COD removal efficiency of the baseline
treatment system (anaerobic) () 8880
10 days measurement
campaign
CODinflow2y Chemical oxygen demand of the
wastewater inflow to the baseline treatment
system (aerobic) in year y (tCOD m3)
0003013 10 days measurement
campaign
CODBL2 COD removal efficiency of the baseline
treatment system (aerobic) () 6369
10 days measurement
campaign
MCFwwtreatmentBL 1 Methane correction factor for baseline
wastewater anaerobic treatment systems 08
MCF values as per table
IIIH1 anaerobic gt 2m
MCFwwtreatmentBL2 Methane correction factor for baseline
wastewater aerobic treatment systems 03
MCF values as per table
IIIH1 ndash poorly managed
Boww Methane producing capacity of the
wastewater (kg CH4kg COD) 025
IPCC 2006
UFBL Model correction factor to account for
model uncertainties 089
IPCC 2006
GWPCH4 Global Warming Potential for methane 21 IPCC 2006
A2) The methane emissions from degradable organic carbon in treated wastewater discharged
Equation 6 BEwwdischargey = Qwwy GWPCH4 Boww UFBL CODwwdischarge BLyMCFww BLdischarge
Abbreviation Description Value Source
BEwwdischargey
The methane emissions from degradable
organic carbon in treated wastewater
discharged (tCO2eyear)
100 Calculated
Qwwy Volume of treated wastewater discharged
in year y (m3year) 333293
Volume based on 10 m3mt
FFB22 amp FFB historical data
(2009 ndash 2011)
GWPCH4 Global warming potential of methane 21 IPCC 2006
Boww Methane producing capacity of the treated
wastewater (kgCH4 kgCOD) 025 IPCC 2006
21 Mill designed data for baseline effluent treatment plant 22 Mill designed data for baseline effluent treatment plant
PROJECT DESIGN DOCUMENT FORM (CDM-SSC-PDD) - Version 03
CDM ndash Executive Board
25
UFBL Model correction factor to account for
model uncertainties 089 IPCC 2006
CODwwdischarge BLy Chemical oxygen demand of the treated
wastewater discharged into sea river or
lake in the baseline situation in the year y
(tonnesm3)
0000642 10 days measurement
campaign
MCFwwBLdischarge Methane correction factor based on
discharge pathway in the baseline situation
(eg into sea river or lake) of the
wastewater (fraction)
01 MCF values as per table
IIIH1 version 16
Project activity emissions
The project activity emission sources as per the methodology and their relevance with respect to the
proposed CDM project activity are given below in a tabular format
Source of project activity
emission Reference
Applicable
(YN) Comments
CO2 emissions on account of
power and fossil fuel used by
the project activity facilities
(PEpowery)
AMS-IIIH
point 29(i)
Y The project activity uses the electricity
imported from the national grid
Methane emissions from
wastewater treatment systems
affected by the project
activity and not equipped with
biogas recovery in the project
situation (PEwwtreatmenty)
AMS-IIIH
point 29 (ii)
Y CH4 emissions from the poorly managed
aerobic lagoons
Methane emissions from
sludge treatment systems
affected by the project
activity and not equipped with
biogas recovery in the project
situation (PEstreatmenty)
AMS-IIIH
point 29 (iii)
N The project activity corresponds to
scenario (vi) without sludge treatment
PEystreatmenty = 0
Methane emissions on account
of inefficiency of the project
activity wastewater treatment
systems and presence of
degradable organic carbon in
treated wastewater
(PEwwdischargey)
AMS-IIIH
point 29 (iv)
Y Treated effluent from ETP will be
discharged into river
Methane emissions from the
decay of the final sludge
generated by the project
activity treatment systems
(PEsfinaly)
AMS-IIIH
point 29 (v)
N In the proposed CDM project activity
final sludge is used for soil application in
the same manner as in the baseline
PEsfinaly = 0
PROJECT DESIGN DOCUMENT FORM (CDM-SSC-PDD) - Version 03
CDM ndash Executive Board
26
Methane fugitive emissions on
account of inefficiencies in
capture systems (PEfugitivey)
AMS-IIIH
point 29 (vi)
Y Applicable to PEfugitivewwy
N The project activity corresponds to
scenario (vi) without sludge treatment
PEfugitivesy = 0
Methane emissions due to
incomplete flaring (PEflaringy)
AMS-IIIH
point 29 (vii)
Y Enclosed flaring system installed
Methane emissions from
biomass stored under
anaerobic conditions which
does not take place in the
baseline situation (PEbiomassy)
AMS-IIIH
point 29
(viii)
N In the project activity the biomass (PKS
+ mesocarp fibres) displaced will not be
stored under anaerobic conditions The
conditions of onsite storage are identical
in the baseline as in the project activity
The biomass will be sold to the market
on a regular basis PEbiomassy = 0
B) Calculation of project emissions
PEy = PEpowery + PEwwtreatmenty + PEww discharge y + PEfugitive y + PEflaring y
Abbreviation Description Value Source
PEy Project activity emissions in the year y
(tCO2eyr) 6050 Equation 8
PEpowery CO2 emissions on account of power used
by the project activity facilities (tCO2eyr) 604 -
PEwwtreatmenty Methane emissions from wastewater
treatment systems affected by the project
activity and not equipped with biogas
recovery in year y (tCO2eyr)
1523 Equation 9
PEwwdischargey
Methane emissions on account of
inefficiency of the project activity
wastewater treatment systems and presence
of degradable organic carbon in treated
wastewater (tCO2eyr)
126 Equation 12
PEfugitivey Methane fugitive emissions on account of
inefficiencies in capture systems (tCO2eyr) 3796 Equation 15
PEflaringy Methane emissions due to incomplete
flaring (tCO2eyr) 0 Equation 19
B1) Project emissions from CO2 emissions on account of power and fuel used by the project activity
facilities in year ldquoyrdquo in tCO2eyear
PEpowery = ECPJjy EFgridy
Abbreviation Description Value Source
PEpowery Project emissions from electricity
consumption in the year y (tCO2eyr) 604 Calculated
ECPJjy Internal power consumption from the grid 749 100 kW is the effective
PROJECT DESIGN DOCUMENT FORM (CDM-SSC-PDD) - Version 03
CDM ndash Executive Board
27
(MWh year) power based on the
equipments installed at the
site
EFgridy Grid Emission factor in Peninsular
Malaysia 2008 (tCO2 MWh) 0672
Study on Grid Connected
Electricity Baselines in
Malaysia 2008 published in
2010 by PTM
B2) Methane emissions from wastewater treatment systems affected by the project activity and not
equipped with biogas recovery in the project situation in year ldquoyrdquo in tCO2e
Equation 9 PEwwtreatment y = Qwwky CODinflowk y PJky MCFwwtreatmentPJk) Boww UFPJ GWPCH4
Abbreviation Description Value Source
PEwwtreatmenty
Methane emissions from wastewater
treatment systems affected by the project
activity and not equipped with biogas
recovery in the project situation (tCO2eyr)
1523 Calculated
Qwwky Volume of wastewater treated in project
activity wastewater treatment system k in
year y (m3year)
333293
Volume based on 10 m3mt
FFB23 amp FFB historical data
(2009 ndash 2011)
CODinflowky Chemical oxygen demand of the
wastewater inflow to the project activity
treatment system k in year y (tonnes COD
m3)
0002690 10 days measurement
campaign
PJky Chemical oxygen demand removal
efficiency of the project wastewater
treatment system k in year y (tm3)
measured based on inflow COD and
outflow COD in system k
90 Based on bio-digester COD
removal efficiency of 90
MCFwwtreatmentPJk Methane correction factor for project
wastewater treatment system k (MCF
values as per table IIIH1)
03
MCF values table IIIH1
Version 16 ndash aerobic poorly
managed (conservative)
Boww Methane generation capacity of the treated
wastewater (kg CH4kg COD) 025 IPCC 2006
UFPJ Model correction factor to account for
model uncertainties 112
IPCC 2006
GWPCH4 Global warming potential of methane 21 IPCC 2006
23 Mill designed data for baseline effluent treatment plant
PROJECT DESIGN DOCUMENT FORM (CDM-SSC-PDD) - Version 03
CDM ndash Executive Board
28
B3) Methane emissions on account of inefficiency of the project activity wastewater treatment
systems and presence of degradable organic carbon in treated wastewater in the year ldquoyrdquo (tonnes)
Equation 12 PEwwdischarge y = Qwwy GWPCH4 Boww UFPJ CODwwdischargePJy MCFwwPJdischarge
Abbreviation Description Value Source
PEwwdischargey
Methane emissions from degradable
organic carbon in treated wastewater
(tCO2eyr)
126 Calculated
Qwwy Quantity of wastewater treated in year y
(m3year) 333293
Volume based on 10 m3mt
FFB24 amp FFB historical data
(2009 ndash 2011)
CODwwdischargedPJ
y
Chemical oxygen demand of the treated
wastewater discharged into river in the
project situation in year y (tCOD m3)
0000642 10 days measurement
campaign
MCFwwPJ discharge
Methane correction factor based on
discharge pathway in the project situation
(river) of the wastewater (fraction)
01 MCF values as per table
IIIH1 Version 16
Boww Methane generation capacity of the treated
wastewater (kg CH4kg COD) 025 IPCC 2006
UFPJ Model correction factor to account for
model uncertainties 112 IPCC 2006
GWPCH4 Global warming potential of methane 21 IPCC 2006
B41) Methane fugitive emissions on account of inefficiencies in capture systems in the year ldquoyrdquo
(tonnes)
Equation 15 PEfugitivewwy = (1 ndash CFEww ) MEPywwtreatment GWPCH4
Abbreviation Description Value Source
PEfugitivey Methane fugitive emissions on account of
inefficiencies in capture systems (tCO2eyr) 3796 Calculated
CFEww Capture efficiency of the biogas recovery
equipment in the wastewater treatment
systems
09 AMS IIIH Version 16
MEPywwtreatment Methane emission potential of wastewater
treatment systems equipped with biogas
recovery system in year y (tCH4yr)
1808 Refer Equation 11 of AMS
IIIH version 16
GWPCH4 Global warming potential of methane 21 IPCC 2006
B42) Methane emission potential of wastewater treatment plant in the year ldquoyrdquo (tonnes)
Equation 16 MEPwwtreatmenty = Qwwy Boww UFPJ (CODremovedPJky MCFwwtreatmentPJk)
24 Mill designed data for baseline effluent treatment plant
PROJECT DESIGN DOCUMENT FORM (CDM-SSC-PDD) - Version 03
CDM ndash Executive Board
29
Abbreviation Description Value Source
MEPwwtreatmenty Methane emission potential of wastewater
treatment systems equipped with biogas
recovery system in year y (tonnes CH4yr)
1808 Calculated
Qyww Quantity of wastewater treated in year y
(m3year) 333293
Volume based on 10 m3mt
FFB25 amp FFB historical data
(2009 ndash 2011)
Boww Methane generation capacity of the treated
wastewater (kg CH4kg COD) 025 IPCC 2006
CODremovedPJy
The chemical oxygen demand removed by
the treatment anaerobic system of the
project activity equipped with biogas
recovery in the year y (tCOD m3)
0024214
10 days measurement
campaign amp bio-digester
design parameter
MCFwwtreatmentPJ
Methane correction factor for the project
wastewater treatment system k equipped
with biogas recovery equipment
08 MCF values as per table
IIIH1 Version 16
UFPJ Model correction factor to account for
model uncertainties 112 IPCC 2006
B5) Methane emissions due to incomplete flaring in the year ldquoyrdquo (tonnes)
Equation 13a PEflaringy = TMflaredy (1 - ηflarey) GWPCH4
Abbreviation Description Value Source
PEflaringy Methane emissions due to incomplete
flaring (tCO2eyr) 0 Calculated
TMflaredh Mass flow rate of methane flared in dry
basis in the hour h (tCH4 yr) 0 Calculated
ηflarey Flare efficiency in hour h based on default
values 50
Tools for methane flaring
(open flare) for conservative
GWPCH4 Global warming potential of methane 21 IPCC 2006
Leakage emissions
No leakage emission will occur in the project activity
LEy1 = 0
Emission reductions
Equation 22 ERy ex ante = BEy ex ante ndash (PEy ex ante + LEy ex ante)
25 Mill designed data for baseline effluent treatment plant
PROJECT DESIGN DOCUMENT FORM (CDM-SSC-PDD) - Version 03
CDM ndash Executive Board
30
Abbreviation Description Value Source
ERy1 ex ante Ex ante emission reduction in year y
(tCO2e) 24712 Equation 22
BEy1 ex ante Ex ante baseline emissions in year y
(tCO2e) 30762 Equation 1
PEy1 ex ante Ex ante project emissions in year y (tCO2e) 6050 Equation 8
LEy1 ex ante Ex ante Leakage emissions in year y
(tCO2e) 0 -
Calculation for AMS-ID
Baseline emissions
Electricity generated from biogas engines will be exported to the Peninsular Malaysia National Grid The
baseline emissions are described in AMS-ID (Version 17 EB 61) as the ldquoproduct of electrical energy
baseline expressed in kWh of electricity produced by the renewable energy generating unit multiplied by
an emission factorrdquo
Baseline emissions due to electricity exported to the grid in the year ldquoyrdquo (tonnes)
BEEGy = EGBLy EFCO2gridy
Abbreviation Description Value Source
BEEGy Baseline emissions in year y (tCO2eyr) 4568 Calculated
EGBLy
Quantity of net electricity supplied to the
grid as a result of the implementation of the
project activity in year y (kWh yr)
6797625 Calculated
EFCO2gridy
CO2 emission factor of the grid in year
(tCO2kWh) 0672
Study on Grid Connected
Electricity Baselines in
Malaysia 2008 published in
2010 by PTM
Project Activity Emissions
As per AMS-ID (Version 17 EB 61) project emissions for renewable energy project activities are zero
PEEGy = 0
Leakage
If the energy generating equipment is transferred from another activity leakage is to be considered
No leakage emission will occur in the project activity LEy = 0
PROJECT DESIGN DOCUMENT FORM (CDM-SSC-PDD) - Version 03
CDM ndash Executive Board
31
Emission reductions
ERy = BEy ndash PEy - LEy
Abbreviation Description Value Source
ERy Emission reduction in year y (tCO2ey) 4568 -
BEy Baseline emissions in year y (tCO2ey) 4568 -
PEy Project emissions in year y (tCO2ey) 0 -
LEy Leakage emissions in year y (tCO2ey) 0 -
Calculation for AMS-IA
Baseline emissions
The energy baseline is the fuel consumption of the technology in use or that would have been used in the
absence of the project activity to generate the equivalent quantity of energy Option 2 is applied This
methodology is only apply shall the recovered is in excess after export to the grid
Annual electricity sent to the mill for FF displacement in the year ldquoyrdquo (kWh)
EBLy = ΣEGiy (1 ndash l)
Abbreviation Description Value Source
EBLy Annual energy baseline (kWhyr) Calculated
EGiy
The estimated annual output of the
renewable energy technologies of the group
of i renewable energy technologies
installed (kWhyr)
0 Estimated
l
Average technical distribution losses that
would have been observed in diesel
powered mini-grids installed by public
programmes or distribution companies in
isolated areas expressed as a fraction
0 Conservative by applying
Zero (0)
Baseline electricity sent to the mill for FF displacement in the year ldquoyrdquo (tonnes)
BECO2y = EBLy EFCO2
Abbreviation Description Value Source
BECO2y Baseline emission in the year y (tCO2yr) 0 Calculated
EBLy Annual energy baseline (kWhyr) 0 Calculated
EFCO2 CO2 emission factor (tCO2kWh) 08
Default value which is
derived from diesel
generation units is used
PROJECT DESIGN DOCUMENT FORM (CDM-SSC-PDD) - Version 03
CDM ndash Executive Board
32
Project Activity Emissions
As per AMS-IA (Version 14 EB 54) project emissions for renewable energy project activities are zero
PEy = 0
Leakage
If the energy generating equipment is transferred from another activity or if the existing equipment is
transferred to another activity leakage is to be considered
No leakage emission will occur in the project activity LEy = 0
B53 Summary of the ex-ante estimation of emission reductions
Estimated emission reductions (total project activity)
Year
Estimation of
project activity
emissions (tCO2e)
Estimation of
baseline emissions
(tCO2e)
Estimation of
leakage (tCO2e)
Estimation of
overall emission
reductions (tCO2e)
2012 504 2944 0 2440
2013 6050 35330 0 29280
2014 6050 35330 0 29280
2015 6050 35330 0 29280
2016 6050 35330 0 29280
2017 6050 35330 0 29280
2018 6050 35330 0 29280
2019 5546 32386 0 26840
Total (tCO2) 42350 247310 0 204960
The starting date of the crediting period is 01122012 or the date of registration whichever is later
Estimated emission reductions for AMS-IIIH
Year
Estimation of
project activity
emissions (tCO2e)
Estimation of
baseline emissions
(tCO2e)
Estimation of
leakage (tCO2e)
Estimation of
overall emission
reductions (tCO2e)
2012 504 2563 0 2059
2013 6050 30762 0 24712
PROJECT DESIGN DOCUMENT FORM (CDM-SSC-PDD) - Version 03
CDM ndash Executive Board
33
2014 6050 30762 0 24712
2015 6050 30762 0 24712
2016 6050 30762 0 24712
2017 6050 30762 0 24712
2018 6050 30762 0 24712
2019 5546 28199 0 22653
Total (tCO2) 42350 215334 0 172984
The starting date of the crediting period is 01122012 or the date of registration whichever is later
Estimated emission reductions for AMS-ID
Year
Estimation of
project activity
emissions (tCO2e)
Estimation of
baseline emissions
(tCO2e)
Estimation of
leakage (tCO2e)
Estimation of
overall emission
reductions (tCO2e)
2012 0 381 0 381
2013 0 4568 0 4568
2014 0 4568 0 4568
2015 0 4568 0 4568
2016 0 4568 0 4568
2017 0 4568 0 4568
2018 0 4568 0 4568
2019 0 4187 0 4187
Total (tCO2) 0 31976 0 31976
The starting date of the crediting period is 01122012 or the date of registration whichever is later
Estimated emission reductions for AMS-IA
Year
Estimation of
project activity
emissions (tCO2e)
Estimation of
baseline emissions
(tCO2e)
Estimation of
leakage (tCO2e)
Estimation of
overall emission
reductions (tCO2e)
2012 0 0 0 0
2013 0 0 0 0
2014 0 0 0 0
2015 0 0 0 0
2016 0 0 0 0
PROJECT DESIGN DOCUMENT FORM (CDM-SSC-PDD) - Version 03
CDM ndash Executive Board
34
2017 0 0 0 0
2018 0 0 0 0
2019 0 0 0 0
Total (tCO2) 0 0 0 0
The starting date of the crediting period is 01122012 or the date of registration whichever is later
B6 Application of the monitoring methodology and description of the monitoring plan
B61 Description of the monitoring plan
The parameters to be monitored are
Please note that the amount of methane recovered and fuelled or flared (MDy ) is calculated as follows
MDy = TMfuelledy + TMflaredy Equation A
Where Description Units
MDy Quantity of methane recovered and fuelled or flared in the year y tonnes CH4year
TMfuelledy Quantity of methane fuelled in the year y tonnes CH4year
TMflaredy Quantity of methane flared in year y tonnes CH4year
Where
TMfuelledy = FVfuelledh fvCH4h ηfuelledh ρCH4n) 1000 Equation B
Where Description Units
TMfuelledy Quantity of methane fuelled in the year y tonnes CH4year
FVfuelledh Volumetric flow rate of the fuelled biogas gas at normal conditions in
hour h
Nm3 biogashour
ηfuelledh 100 for gainful purpose26
fvCH4h Volumetric fraction of methane in the biogas gas in the hour h
ρCH4n Density of methane at normal conditions kgCH4Nm3CH4
And
TMflaredy = FVflaredh fvCH4h ηflareh ρCH4n) 1000 Equation C
Where Description Units
TMflaredy Quantity of methane flared in year y tonnes CH4year
FVflaredh Volumetric flow rate of the flared biogas gas at normal conditions in
hour h
Nm3 biogashour
26 AMS-IIIH point 35
PROJECT DESIGN DOCUMENT FORM (CDM-SSC-PDD) - Version 03
CDM ndash Executive Board
35
ηflareh Flare efficiency in the hour h
fvCH4h Volumetric fraction of methane in the biogas gas in the hour h
ρCH4n Density of methane at normal conditions kgCH4Nm3CH4
Data Parameter ID1 Qwwy
Data unit m3 month
Description The flow of wastewater entering the bio-digester
Source of data Measurement by project participant by using a flowmeter
Value of data ~ 28000
Brief description of
measurement methods and
procedures to be applied
The flow is measured with an online flow meter or equivalent
QAQC procedures to be
applied (if any) Data are monitored continuously and recorded periodically
(monthly or at shorter interval) in a data log file (DLF)
Uncertainty level of data low
Maintenance and calibration as per manufacturer‟s specifications
or at least once every three (3) years
Any comment
Data Parameter ID2 CODwwuntreatedy
Data unit tCOD m3
Description Raw COD of wastewater entering the bio-digester
Source of data Laboratory (internal and external)
Value of data ~ 0030230
Brief description of
measurement methods and
procedures to be applied
Measure of COD according to national or international standards
COD is measure through representative sampling
QAQC procedures to be
applied (if any) Minimum once a month COD sampling to ensure a 9010
confidenceprecision level
COD reports are recorded manually
Uncertainty level of data low
Maintenance and calibration as per manufacturer‟s specifications
or at least once every three (3) years for internal laboratory
equipment
Any comment
Data Parameter ID3 CODwwtreatedy
Data unit tCOD m3
Description COD of treated wastewater leaving the bio-digester
Source of data Laboratory (internal and external)
Value of data ~ 0003023
Brief description of
measurement methods and
procedures to be applied
Measure of COD according to national or international standards
COD is measure through representative sampling
QAQC procedures to be
applied (if any) Minimum once a month COD sampling to ensure a 9010
confidenceprecision level
COD reports are recorded manually
Uncertainty level of data low
PROJECT DESIGN DOCUMENT FORM (CDM-SSC-PDD) - Version 03
CDM ndash Executive Board
36
Maintenance and calibration as per manufacturer‟s specifications
or at least once every three (3) years for internal laboratory
equipment
Any comment
Data Parameter ID5 End-use of the final sludge
Data unit ndash
Description The final sludge generated by the project activity will be sent to control
landfill site if any
Source of data By project participant
Value of data ndash
Brief description of
measurement methods and
procedures to be applied
The final disposal of the sludge will be monitored during the crediting
period if any For each disposal of the sludge the following will be
recorded disposal site and date of disposal
QAQC procedures to be
applied (if any)
Any comment
Data Parameter ID6 FVflaredh
Data unit Nm3 hour
Description Volumetric flow of biogas recovered and flared at normal conditions in
the hour h
Source of data By project participant
Value of data 0
Brief description of
measurement methods and
procedures to be applied
The volume of biogas will be measured with a normalised flow meter or
calculated from the volumetric flow pressure temperature
Biogas volume and methane content measurements shall be on the same
basis (wet or dry)
QAQC procedures to be
applied (if any) The biogas flow is monitored continuously recorded and stored
electronically in a data log file (DLF) (monthly or at shorter
interval)
Data Parameter ID4 CODww dischargey
Data unit tCOD m3
Description COD of treated wastewater discharge into river by treatment system
Source of data Laboratory (internal and external)
Value of data ~ 0000100
Brief description of
measurement methods and
procedures to be applied
Measure of COD according to national or international standards
COD is measure through representative sampling
QAQC procedures to be
applied (if any) Minimum once a month COD sampling to ensure a 9010
confidenceprecision level
COD reports are recorded manually
Uncertainty level of data low
Maintenance and calibration as per manufacturer‟s specifications
or at least once every three (3) years for internal laboratory
equipment
Any comment
PROJECT DESIGN DOCUMENT FORM (CDM-SSC-PDD) - Version 03
CDM ndash Executive Board
37
Uncertainty level of data low
Maintenance and calibration as per manufacturer‟s specifications
or at least once every 3 years
Any comment
Data Parameter ID7 FVfuelledgas engineh
Data unit Nm3 hour
Description Volumetric flow of biogas recovered and fuelled (gas engine) at normal
conditions in the hour h
Source of data By project participant
Value of data ~ 509
Brief description of
measurement methods and
procedures to be applied
The volume of biogas will be measured with a normalised flow meter or
calculated from the volumetric flow of biogas pressure temperature
Biogas volume and methane content measurements shall be on the same
basis (wet or dry)
QAQC procedures to be
applied (if any) The biogas flow is monitored continuously recorded and stored
electronically in a data log file (DLF) (monthly or at shorter
interval)
Uncertainty level of data low
Maintenance and calibration as per manufacturer‟s specifications
or at least once every 3 years
Any comment
Data Parameter ID8 FVfuelledboilerh
Data unit Nm3 hour
Description Volumetric flow of biogas recovered and fuelled (boilers) at normal
conditions in the hour h
Source of data By project participant
Value of data ~ 0
Brief description of
measurement methods and
procedures to be applied
The volume of biogas will be measured with a normalised flow meter or
calculated from the volumetric flow of biogas pressure temperature
Biogas volume and methane content measurements shall be on the same
basis (wet or dry)
QAQC procedures to be
applied (if any) The biogas flow is monitored continuously recorded and stored
electronically in a data log file (DLF) (monthly or at shorter
interval)
Uncertainty level of data low
Maintenance and calibration as per manufacturer‟s specifications
or at least once every 3 years
Any comment
Data Parameter ID9 wCH4h
Data unit
Description Methane content in biogas in same basis (wetdry) as the biogas flows in
year y
Source of data By project participant using a gas analyzer
Value of data ~ 60
PROJECT DESIGN DOCUMENT FORM (CDM-SSC-PDD) - Version 03
CDM ndash Executive Board
38
Brief description of
measurement methods and
procedures to be applied
Using calibrated gas analyzer either continuous or periodical
measurement at confidenceprecision level of 9010
QAQC procedures to be
applied (if any) In case a continuous gas analyser is used data will be recorded
and stored electronically in a data log file (DLF) every hour or at
shorter interval
Uncertainty level of data low
Maintenance and calibration as per manufacturer‟s specifications
or at least once every 3 years
Any comment See also clarification by EB Meth Panel 30102009 ndash SSC_360
httpcdmunfcccintUserManagementFileStorageAM_CLAR_
QS83SX5B7WM6UGZE31JYQEQ4F65F6V
The biogas flow and the methane content measurements shall be
carried out close to each others
Data Parameter ID10 Tbiogas
Data unit ordmC
Description Temperature of biogas
Source of data Temperature probe
Value of data 20 ndash 65
Brief description of
measurement methods and
procedures to be applied
By project participant
QAQC procedures to be
applied (if any) Shall be measured and recorded at the same time when methane
content in biogas (ID8) is measured
Uncertainty level of data low
Maintenance and calibration as per manufacturer‟s specifications
or at least once every 3 years
Any comment Pressure and temperature are required to determine the density of
the methane If the biogas flow meter employed measures flow
pressure and temperature and displaysoutputs normalised flow of
biogas there is no need to separate monitoring of pressure and
temperature of the biogas
Data Parameter ID11 Pbiogas
Data unit Bar(g)
Description Pressure of biogas
Source of data By project participant
Value of data 50 ndash 200 mbar
Brief description of
measurement methods and
procedures to be applied
Pressure measurement device
QAQC procedures to be
applied (if any) Shall be measured and recorded at the same time when methane
content in biogas (ID8) is measured
Uncertainty level of data low
Maintenance and calibration as per manufacturer‟s specifications
or at least once every three (3) years
Any comment Pressure and temperature are required to determine the density of
the methane If the biogas flow meter employed measures flow
PROJECT DESIGN DOCUMENT FORM (CDM-SSC-PDD) - Version 03
CDM ndash Executive Board
39
pressure and temperature and displaysoutputs normalised flow of
biogas there is no need to separate monitoring of pressure and
temperature of the biogas
Shall be measured at the same time when methane content in
biogas (ID9) is measured
Parameter ID12 ηflareh (enclosed flare)
Unit
Description Enclosed flare efficiency in the hour h
Source of data Calculated
Value of data 0 or 50 or 90
Brief description of
measurement methods and
procedures to be applied
This yearly efficiency will be based on hourly flare efficiencies calculated
as per the provisions in the ldquoTool to determine project emissions from
flaring gases containing methanerdquo
The hourly flare efficiency will be calculated based on
0 if the temperature in the exhaust gas of the flare (Tflare) is
below 500 degC for more than 20 minutes during the hour h
50 if the temperature in the exhaust gas of the flare (Tflare) is
above 500 degC for more than 40 minutes during the hour h but the
manufacturer‟s specifications on proper operation of the flare are
not met at any point in time during the hour h
90 if the temperature in the exhaust gas of the flare (Tflare) is
above 500 degC for more than 40 minutes during the hour h and the
manufacturer‟s specifications on proper operation of the flare are
met continuously during the hour h
QAQC procedures to be
applied (if any) Data are logged hourly in a data log file (DLF)
Uncertainty level of data low
Any comment For enclosed flare
Or
Parameter ID13 ηflareh (open flare)
Unit
Description Flare efficiency in the hour h
Source of data Calculated
Value of data 0 or 50
Brief description of
measurement methods and
procedures to be applied
This yearly efficiency will be based on hourly flare efficiencies calculated
as per the provisions in the ldquoTool to determine project emissions from
flaring gases containing methanerdquo
The hourly flare efficiency will be calculated based on the duration of
time during which the flame is detected by the thermocouple (or flame
detector) installed in the open flare
Flare efficiency in hour h is based on default values
0 if the flame detected for not more than 20 minutes during the
hour h and
PROJECT DESIGN DOCUMENT FORM (CDM-SSC-PDD) - Version 03
CDM ndash Executive Board
40
50 if the flame detected for more than 20 minutes during the
hour h
A flame detector or thermocouple will be used
QAQC procedures to be
applied (if any) Data are logged hourly in a data log file (DLF)
Uncertainty level of data low
Any comment The only monitored parameter related to the flare is its efficiency Indeed
according to the clarification SSC_19927 of the methodology AMS IIIH
version 9 accepted by the SSC WG on the 3092008 ldquoIf a thermocouple
is used as a flame detection system it is sufficient to reach the given
minimum temperature from the manufacturer ldquo Hence it is not necessary
to monitor the temperature of the open type flares (Tflare)
Data Parameter ID14 ECPJjy
Data unit MWh
Description The yearly grid electricity consumption of the project activity for the year
bdquoy‟
Source of data Onsite instrument
Value of data ~749
Brief description of
measurement methods and
procedures to be applied
The grid electricity consumption of the project activity is measured
continuously with an energy meter (cumulative reading)
QAQC procedures to be
applied (if any) Data are monitored continuously and recorded periodically
(yearly or at shorter interval) in a data log file (DLF)
Uncertainty level of data low
Maintenance and calibration as per manufacturer‟s specifications
or at least once every three (3) years
Any comment
Data Parameter ID15 EGBLy
Data unit MWh
Description Quantity of net electricity generated and send to grid in year y
Source of data By project participant
Value of data ~ 6798
Brief description of
measurement methods and
procedures to be applied
The electricity generated and sent to grid is measured continuously with
an energy meter (cumulative readings)
QAQC procedures to be
applied (if any) Data are monitored continuously and recorded periodically
(yearly or at shorter interval) in a data log file (DLF)
Uncertainty level of data low
Maintenance and calibration as per manufacturer‟s specifications
or at least once every 3 years
Any comment As per AMS-ID
27 The clarification SSC_199 if available here (last access on the 24052011)
httpcdmunfcccintfilestorageAM_AM_CLAR_HIOZ5CS1PASC187C0JQ668L2E9RCRJResponse20WG20provided
20at20SSC20WG2017pdft=bU98MTMwNjIxNjY0OS4xMQ==|BOKHqtO94N6XF1N2N1vo8Ori-Rc=
PROJECT DESIGN DOCUMENT FORM (CDM-SSC-PDD) - Version 03
CDM ndash Executive Board
41
Or
Data Parameter ID16 EGmilly
Data unit MWh
Description Quantity of annual output of renewable energy sent to the mill in year y
Source of data By project participant
Value of data ~ 0
Brief description of
measurement methods and
procedures to be applied
The electricity generated and sent to mill to displace diesel use in diesel
gensets is measured continuously with an energy meter (cumulative
readings)
QAQC procedures to be
applied (if any) Data are monitored continuously and recorded periodically
(yearly or at shorter interval) in a data log file (DLF)
Uncertainty level of data low
Maintenance and calibration as per manufacturer‟s specifications
or at least once every 3 years
Any comment As per AMS-IA
Data Parameter ID17 Displacement of Biomass
Data unit Mt
Description Total amount of biomass (PKS) displaced from biomass boilers
Source of data Weighing bridge
Value of data Measurement at site
Brief description of
measurement methods and
procedures to be applied
Biomass (PKS) displaced due to the project activity will be weighed
using weighing bridge at the palm oil mill
QAQC procedures to be
applied (if any) Monthly calculation based on every single trip of trucks recorded
Data is recorded manually in a data log file based on the weighing
records
Maintenance and calibration as per manufacturer‟s specifications
Uncertainty level of data low
Any comment In the project activity the biomass (PKS) displaced will not be stored
under anaerobic conditions The conditions of onsite storage are identical
in the baseline as in the project activity The biomass will be sold to the
market on a regular basis PEbiomassy = 0
A final monitoring plan will be prepared prior the initial verification based on the as-built project activity
It will address the following aspects
MONITORING
The Project will be managed by CME with the involvement from Project Implementer CME will ensure
safety in operation of the plant as well as in the monitoring of emission reduction which is generated from
the project activity
CME will implement and be responsible for the monitoring plan Their responsibility covers operation of
the monitoring maintenance of the monitoring equipment data collection and archiving and
management of total scheme of the monitoring CME and Project Implementer will assign specific trained
PROJECT DESIGN DOCUMENT FORM (CDM-SSC-PDD) - Version 03
CDM ndash Executive Board
42
personnel during project implementation for the overall monitoring measurement and reporting of key
parameters as required in this PDD
DATA LOGGING AND STORAGE
The data measured by the instruments will be collected and stored in a data logging system The data will
be retrieved remotely by modem or directly on site
If data cannot be retrieved no emissions reductions will be claimed for the period of data failure The
data collected will be recorded in a central data base Access to production data will be restricted All
records and data (hard copy and soft copy) will be archived up to two years after the end of the crediting
period or the last issuance of CERs for this project activity whichever occurs later
CALIBRATION AND MAINTENANCE PROCEDURES MALFUNCTION OF EQUIPMENT
Maintenance includes all preventive and corrective actions necessary for the good functioning of the
equipment such as
Visual control of the equipment state and real-time check of displayed parameters
Cleaning up the equipment and the sensors
Adding lubricant
Replacement and change of defective parts
Calibration of equipment consists in verifying by comparison with a standard the accuracy of a
measuring instrument
Measuring instruments will be periodically and appropriately calibrated according to the procedures
timing and methods recommended by the manufacturer or nationalinternational standards as available
General malfunction of equipment
Daily inspections of the equipment will allow controlling equipment failure If equipment fails the
supplier will be notified and repairs will be carried out If the damaged equipment cannot be repaired it
will be replaced at the earliest In some cases portable tools will be used in order to carry out daily
monitoring of the missing parameter(s) In such case this data will be recorded manually
Discrepancies
To avoid discrepancies between projected data in the PDD and actual data (eg due to deferred starting
date malfunction of equipment) cross-checks between internal meter readings and external sources (eg
electricity invoices) will be carried out Any source of inconsistencies will be clarified
Case of emergency
For the case of emergency (earthquakes explosions fires etc) an emergency preparedness plan will be
adapted to the project activity All employees involved in the project on-site will be trained in the code of
conduct and required actions at time of commissioning of the plant
PROJECT DESIGN DOCUMENT FORM (CDM-SSC-PDD) - Version 03
CDM ndash Executive Board
43
OPERATIONAL AND MANAGEMENT STRUCTURE
The CDM monitoring team will be composed by the following staff
Position Report to
Operators
Project owner Supervisors (technicalmaintenance)
Operation Engineer
CDM monitoring project manager External CDM consultant
TRAINING OF MONITORING PERSONNEL
The maintenance will be conducted in-house by staff employed and trained by the Project Participants
Employees involved in the monitoring will be trained internally andor externally Training may include
inter alia
a) Review of equipment and captors
b) Calibration requirement
c) Configuration of monitoring equipment
d) Maintenance requirement
C1 Please indicate the level at which environmental analysis as per requirements of the CDM
modalities and procedures is undertaken Justify the choice of level at which the environmental
analysis is undertaken
radic Please tick if this information is provided at the PoA level In this case sections C2 and C3
need not be completed in this form
C2 Documentation on the analysis of the environmental impacts including transboundary
impacts
The host country does not require an analysis of environmental impacts As the project involves reduction
of GHG through recovery and controlled combustion which improves the quality of air therefore there
are no significant environmental impacts identified
C3 Please state whether an environmental impact assessment is required for a typical CPA
included in the programme of activities (PoA) in accordance with the host Party lawsregulations
In accordance with Malaysia environmental regulations Environmental Quality (Prescribed Activities
Environmental Impact Assessment) Order 1987 an Environmental Impact Assessment (EIA) is not
required for this CPA
PROJECT DESIGN DOCUMENT FORM (CDM-SSC-PDD) - Version 03
CDM ndash Executive Board
44
SECTION D Stakeholdersrsquo comments
D1 Please indicate the level at which local stakeholder comments are invited Justify the
choice
Please tick if this information is provided at the PoA level In this case sections D2 to D4 need
not be completed in this form
D2 Brief description how comments by local stakeholders have been invited and compiled
The stakeholder meeting was conducted at the office of Kilang Sawit Felda Triang on 05032012 There
were 37 stakeholders attending the consultation Posters were pasted at the guard house and at the
entrance to office 1 week before the stakeholder consultation to inform the locals stakeholders which
comprise mostly the workers of the mill 20 stakeholders out of the 37 who attended the consultation are
2nd generation of the Felda settlers who live in the vicinity to the project activity and adequately represent
the local community composed entirely of Felda settlers (no other people live in the vicinity of this
remote plantation) Continuous input of ideascomments were allowed to all stakeholders who could
either send their input though an email account especially setup for the biogas project or directly inform
the project proponents
During the meeting presentations were made by the project owner to outline the proposed project activity
in a non-technical manner (including environmental social and technological considerations) climate
change and the role of the CDM Attendees were given opportunity to raise their concern and opinion
about the proposed project activity during the question and answer session
D3 Summary of the comments received
PROJECT DESIGN DOCUMENT FORM (CDM-SSC-PDD) - Version 03
CDM ndash Executive Board
45
Below are the questions raised during the stakeholder meeting
NAME QUESTION
Mohd Tarmizi Bin Mat
Daud What is CDM in Bahasa Malaysia
Mohd Tarmizi Bin Mat
Daud What is DoE‟s standard for treated water released into river
Mohd Azizi Bin Abdul
Aziz
Would the biogas be captured from the existing effluent treatment ponds or a
new structure
Azhar Bin Abdul What to do with the captured biogas from the bioreactor
D4 Report on how due account was taken of any comments received
Below are the answers to the questions asked during the stakeholder meeting
QUESTION ANSWER
What is CDM in Bahasa Malaysia
The meaning of CDM in Bahasa Malaysia is Mekanisme
Pembangunan Bersih or in English is Clean Development
Mechanism
By Abd Karim Bin Mohd Zin
What is DoE‟s standard for treated
water released into river
The discharge standard for BOD into river is less than 100ppm
By Abd Karim Bin Mohd Zin
Would the biogas be captured from
the existing effluent treatment
ponds or a new structure
New bioreactor will be constructed to replace the existing anaerobic
lagoon treatment system The new bioreactor will capture the
biogas produced from this anaerobic treatment process
By Abd Karim Bin Mohd Zin
What to do with the captured
biogas from the bioreactor
The biogas recovered from the bioreactor will mainly contain
methane (approximately 60) and the rest are CO2 H2 and H2S
Currently the biogas is just released to the atmosphere from the
existing open lagoons system During the project activity captured
biogas will be combusted thus will improve the air quality
By Abd Karim Bin Mohd Zin
PROJECT DESIGN DOCUMENT FORM (CDM-SSC-PDD) - Version 03
CDM ndash Executive Board
46
Annex 1
CONTACT INFORMATION ON ENTITYINDIVIDUAL RESPONSIBLE FOR THE SMALL-
SCALE CPA
Organization Felda Palm Industries Sdn Bhd (359584-V)
StreetPOBox Jalan Gurney 1
Building Balai Felda 4th Floor
City Kuala Lumpur
StateRegion Wilayah Persekutuan
PostfixZIP 54000
Country Malaysia
Telephone (03) 2692 8066
FAX (03) 2693 4148
URL wwwfeldanetmy
Represented by
Title Head of Department
Salutation Mr
Last Name Busu
Middle Name
First Name Zainuri
Department Biomass
Mobile
Direct FAX
Direct tel
Personal E-Mail zainuribfeldanetmy
Organization Ably Carbon Sdn Bhd
StreetPOBox Jalan Ipoh Kecil
Building No 17
City Kuala Lumpur
StateRegion
PostfixZIP 50350
Country Malaysia
Telephone +60 3 4042 1177
FAX +60 3 4044 4166
E-Mail stephanevidailletably-carboncom
URL
Represented by Stephane Vidaillet
Title Chairman
Salutation Mr
Last Name Vidaillet
Middle Name
First Name Steacutephane
Department
Mobile +33 6 59111 5600
Direct FAX
PROJECT DESIGN DOCUMENT FORM (CDM-SSC-PDD) - Version 03
CDM ndash Executive Board
47
Direct tel
Personal E-Mail stephanevidailletably-carboncom
PROJECT DESIGN DOCUMENT FORM (CDM-SSC-PDD) - Version 03
CDM ndash Executive Board
48
Annex 2
INFORMATION REGARDING PUBLIC FUNDING
The project activity is not receiving any funding from parties included in Annex 1 of the Kyoto Protocol
SMALL-SCALE CDM PROGRAMME ACTIVITY DESIGN DOCUMENT FORM (CDM-SSC-CPA-DD) - Version 01
NAME TITLE OF THE PoA Biogas Recovery and Utilization PoA Projects in
Malaysia
CDM ndash Executive Board page 49
This template shall not be altered It shall be completed without modifyingadding headings or logo format or font
Annex 3
BASELINE INFORMATION
1 2
Year 2009 2010 2011 2012 2013 2014
FFB (mtyr) 343720 345910 310250 333293 333293 333293
POME Volume
(cumyr)[1] 343720 345910 310250 333293 333293 333293
Mill Opearing hour (hryr) 68865 69225 6209 6673 6673 6673
PKS (mtyr) 18905 19025 17064 18331 18331 18331
3 4 5 6 7 8 9 10
2015 2016 2017 2018 2019 2020 2021 2022
333293 333293 333293 333293 333293 333293 333293 333293
333293 333293 333293 333293 333293 333293 333293 333293
6673 6673 6673 6673 6673 6673 6673 6673
18331 18331 18331 18331 18331 18331 18331 18331
SMALL-SCALE CDM PROGRAMME ACTIVITY DESIGN DOCUMENT FORM (CDM-SSC-CPA-DD) - Version 01
NAME TITLE OF THE PoA Biogas Recovery and Utilization PoA Projects in
Malaysia
CDM ndash Executive Board page 50
This template shall not be altered It shall be completed without modifyingadding headings or logo format or font
10 days measurement campaign for baseline wastewater treatment system
Day Date
ETP
Inlet
Anaerobic
system (mgl)
Outlet
Anaerobic
system (mgl)
Outlet Algae
System (mgl)
Final
Discharge to
River (mgl)
1 23-Feb-12 35693 3120 811 603
2 25-Feb-12 19511 2559 1186 83
3 26-Feb-12 32864 2767 749 437
4 27-Feb-12 30195 2330 1210 404
5 28-Feb-12 32436 1927 1188 941
6 29-Feb-12 38259 4256 896 717
7 1-Mar-12 28717 3584 1232 695
8 3-Mar-12 31002 4660 1658 1210
9 4-Mar-12 22400 4346 1389 963
10 5-Mar-12 31226 4301 1971 1165
Average 30230 3385 1229 722
ETP
COD removal efficiency (anaerobic system) 8880
COD removal efficiency (Facultativealgae system) 6369
COD removal efficiency (Bio-polishing system) 4127
Total COD removal efficiency of the treatment system 9761
The COD of the raw effluent during ex-post may vary from the one year historical records depending on
the improvement of the production process (outside of project boundary) thus ERex-post may vary from the
estimated ERex-ante
SMALL-SCALE CDM PROGRAMME ACTIVITY DESIGN DOCUMENT FORM (CDM-SSC-CPA-DD) - Version 01
NAME TITLE OF THE PoA Biogas Recovery and Utilization PoA Projects in
Malaysia
CDM ndash Executive Board page 51
This template shall not be altered It shall be completed without modifyingadding headings or logo format or font
Annex 4
MONITORING INFORMATION
General information
Monitoring refers to the collection and archiving of all relevant data necessary for determining the
baseline measuring anthropogenic emissions by sources of greenhouse gases (GHG) within the project
boundary of a CDM project activity and leakage It includes developing suitable data collection methods
and data interpretation techniques for monitoring and verification of GHG emissions
On-line monitoring system
Most key meters required to determine GHG emissions and emission reductions will be monitored from a
central control point which will record meter readings at a pre-determined interval
Ensuring adequate maintenance and calibration of monitoring instruments
Specific maintenance repair or replacement of monitoring equipment will be recorded dated and
described
The calibration will occur at intervals determined on the basis of instrument manufacturers
recommendations stability purpose usage and history of repeatability Recalibration should be
performed whenever an event occurs that places the accuracy of the instrument in doubt
Calibration will take place at least once every three (3) years to ensure that the monitoring
equipments are properly installed and functioning properly
Calibration will be performed according to national or international standards
Last calibration certificates will be provided during periodic verification
Sampling procedure
Wherever a statistical sample is used for monitoring the ldquogeneral guidelines for sampling and surveys for
SSC project activitiesrdquo shall be used COD shall be measured from a composite sample to obtain a
representative value
Data archiving
The monitored data will be kept for a minimum of 2 years after the end of the crediting years by using
paper documents or electronic files
Identification of non-conformities
A verification of inconsistencies of the data recorded will be performed based for example on
The comparison of the calculated quantities of methane versus expected
Spot checks of field instruments (local reading) and data in the log file
Any discrepancies (completeness calculation errors transcription errors instrument calibration issues)
will be analyzed and actions taken to correct the problem
Ensuring adequate training of staff
All new staff members will undergo bdquoon job training‟ covering the monitoring requirements
The monitoring plan will be made available to staff member involved in the monitoring
A copy will be located in the control room at the site
SMALL-SCALE CDM PROGRAMME ACTIVITY DESIGN DOCUMENT FORM (CDM-SSC-CPA-DD) - Version 01
NAME TITLE OF THE PoA Biogas Recovery and Utilization PoA Projects in
Malaysia
CDM ndash Executive Board page 52
This template shall not be altered It shall be completed without modifyingadding headings or logo format or font
During the training the employees will sign a training attendance list All training records shall
be documented inclusive of training attendance training memo and training material if any

PROJECT DESIGN DOCUMENT FORM (CDM-SSC-PDD) - Version 03
CDM ndash Executive Board
11
domesticcommercialindustrial ruralurban
grid-connectedoff-grid) and distribution
mechanisms (eg direct installation)
Malaysia There are no specific distribution
mechanisms
16 Whether an EIA is required by local
authorities
Not applicable for the proposed CPA as EIA is not
required
17 The crediting period of the CPA shall not
exceed the length of the PoA (ie 28 years)
regardless of the time of inclusion of CPA in
the PoA
The crediting period of the proposed CPA will not
exceed the length of PoA 28 years
Additional eligibility criteria applicable in case of CPA that gainfully use of biogas for electrical
andor thermal energy generation
The proposed project conforms to the applicable requirements of AMS - ID version 17
Applicability Criteria Justification
This methodology comprises renewable energy
generation units such as photovoltaic hydro
tidalwave wind geothermal and renewable biomass
a) Supplying electricity to a national or a regional
grid
b) Supplying electricity to an identified consumer
facility via nationalregional grid through a
contractual arrangement such as wheeling
Applicable The proposed project activity is
based on biogas recovered from anaerobic bio-
digester a renewable energy generation source
The proposed project shall supply electricity to
the national grid
The project activity is not supplying electricity
to an identified consumer facility
This methodology is applicable to project activities that
(a) Install a new power plant at a site where there was
no renewable energy power plant operating prior
to the implementation of the project activity
(Greenfield plant)
(b) Involve a capacity addition
(c) Involve a retrofit of (an) existing plant(s)
(d) Involve a replacement of (an) existing plant(s)
Applicable to (a) where the proposed project
activity shall install a new power plant at a site
where there was no renewable energy power
plant operating prior to the implementation of
the project activity
Hydro power plants with reservoirs that satisfy at least
one of the following conditions are eligible to apply this
methodology
Not applicable The project activity is a biogas
recovery and utilization project
If the new unit has both renewable and non-renewable
components (eg a winddiesel unit) the eligibility limit
of 15MW for a small-scale CDM project activity applies
only to the renewable component If the new unit co-
fires fossil fuel the capacity of the entire unit shall not
exceed the limit of 15MW
Not applicable The project does not
incorporate a mix of renewable and non-
renewable components
Combined heat and power (co-generation) systems are
not eligible under this category
Applicable There is no combined heat and
power component in the project activity
PROJECT DESIGN DOCUMENT FORM (CDM-SSC-PDD) - Version 03
CDM ndash Executive Board
12
In the case of project activities that involve the addition
of renewable energy generation units at an existing
renewable power generation facility the added capacity
of the units added by the project should be lower than
15 MW and should be physically distinct from the
existing units
Not applicable The project activity does not
involve the addition of renewable energy
generation units at an existing facility
In the case of retrofit or replacement to qualify as a
small-scale project the total output of the retrofitted or
replacement unit shall not exceed the limit of 15 MW
Not applicable The project activity does not
seek to retrofit or replacement an existing
facility
The proposed project conforms to the applicable requirements of AMS - IA version 14
Applicability Criteria Justification
This category comprises renewable electricity
generation units that supply individual Households
users or groups of households users included in the
project boundary The applicability is limited to
individual households and users that do not have a grid
connection except when
a) A group of households or users are supplied
electricity through a standalone mini grid powered
by renewable energy generation unit(s) where the
capacity of the generating units does not exceed 15
MW or
b) The emissions reduction per renewable energy
based lighting system is less than 5 tonnes of CO2e
a year and where it can be shown that fossil fuel
would have been used in the absence of the project
activity by
(i) A representative sample survey (90
confidence interval plusmn10 error margin) of
target households or
(ii) Official statistics from the host country
government agencies
The renewable energy generation units include
technologies such as solar hydro wind biomass
gasification and other technologies that produce
electricity all of which is used on-sitelocally by the
user
The renewable generating units may be new
installations (Greenfield) or replace existing onsite
fossil-fuel-fired generation To qualify as a small-scale
project the total output of the unit(s) shall not exceed
the limit of 15 MW
Applicable The proposed project activity is not
grid connected
Furthermore the total installed capacity of the
generating units will not exceed 15 MW
Applicable The project activity involves the
combustion of the recovered biogas from the
anaerobic bio-digester for electricity generation
to be use on-site
Applicable The project activity involve the
replacement of existing onsite fossil fuel fired
generation and the total installed capacity is not
PROJECT DESIGN DOCUMENT FORM (CDM-SSC-PDD) - Version 03
CDM ndash Executive Board
13
exceed 15 MW
Hydro power plants with reservoirs that satisfy at least
one of the following conditions are eligible to apply this
methodology
The project activity is implemented in an existing
reservoir with no change in the volume of
reservoir
The project activity is implemented in an existing
reservoir where the volume of reservoir is
increased and the power density of the project
activity as per definitions given in the Project
Emissions section is greater than 4 Wm2
The project activity results in new reservoirs and
the power density of the power plant as per
definitions given in the Project Emissions section
is greater than 4 Wm2
Not applicable The project activity is not a
hydro power plant
Combined heat and power (co-generation) systems are
not eligible under this category
Applicable There is no combined heat and
power component in the project activity
If the unit added has both renewable and non-renewable
components (eg a winddiesel unit) the eligibility
limit of 15 MW for a small-scale CDM project activity
applies only to the renewable component If the unit
added co-fires fossil fuel the capacity of the entire unit
shall not exceed the limit of 15 MW
Not applicable The project does not
incorporate a mix of renewable and non-
renewable components
Project activities that involves retrofit or replacement of
an existing facility for renewable energy generation are
included in this category To qualify as a small-scale
project the total output of the modified or retrofitted
unit shall not exceed the limit of 15 MW
Not applicable The project activity does not
seek to retrofit or replacement an existing
facility
In the case of project activities that involve the addition
of renewable energy generation units at an existing
renewable power generation facility the added capacity
of the units added by the project should be lower than
15 MW and should be physically distinct3 from the
existing units
Not applicable The project activity does not
involve the addition of renewable energy
generation units at an existing facility
B3 Assessment and demonstration of additionality of the small-scale CPA as per eligibility
criteria listed in the Registered PoA
In Malaysia Environmental Quality (Prescribed Premises) (Crude Palm Oil) Regulation 1977 governs
environmental considerations including the wastewater treatment and discharge at palm oil mills The
regulation stipulates the discharge standards for water discharge or land application The regulation
however does not specify the required treatment technologies for wastewater or GHG emissions from
wastewater treatment operations
PROJECT DESIGN DOCUMENT FORM (CDM-SSC-PDD) - Version 03
CDM ndash Executive Board
14
More than 85 of palm oil mills are utilizing open based anaerobic ponds and it is considered the
prevailing practice for oil palm industry to treat the POME The open anaerobic ponds system is an
effective and low-tech solution that can easily meet the water discharge limits applicable to the palm oil
industry9 10
There is no financial incentive for the palm oil mill owners to invest into methane capture projects
particularly when there is no requirement under existing pending or planned national state or local
regulatory This is partly related to the fact that there are a lot of attractive and competing investments in
the sector However the PP has undertaken to set up this project in order to reduce the GHG emissions
and contribute his mite to the global GHG emission reduction
The project is a small scale project activity As such the provisions of Attachment A to Appendix B of
the simplified modalities and procedures for small-scale CDM project activities will apply to this project
The bdquoindicative simplified baseline and monitoring methodologies for selected small-scale CDM project
activity categories‟ require the project proponents to demonstrate that the project activity would not have
occurred anyway due to at least one of the following barriers
a) Investment barrier a financially more viable alternative to the project activity would have led to
higher emissions
b) Technological barrier a less technologically advanced alternative to the project activity involves
lower risks due to the performance uncertainty or low market share of the new technology
adopted for the project activity and so would have led to higher emissions
c) Barrier due to prevailing practice prevailing practice or existing regulatory or policy
requirements would have led to the implementation of a technology with higher emissions
d) Other barriers without the project activity for another specific reason identified by the project
participant such as institutional barriers or limited information managerial resources
organizational capacity financial resources or capacity to absorb new technologies emissions
would have been higher
Subsequently in its 35th Meeting the EB had issued bdquoNon-binding best practice examples to demonstrate
additionality for SSC project activities‟ wherein EB had given best practice examples of each of the
aforementioned category of barriers
The project participant has chosen Investment Barrier to demonstrate the additionality which is discussed
in the following paragraphs
Investment barrier
The most important of all the barriers faced by the company is the investment barrier The investment
analysis reveals that the project is not financially attractive The additionality tool permits the use of
simple cost analysis or investment comparison analysis or benchmark analysis to demonstrate the
additionality of the project
9 SD 05 ndash Yeoh B G 2004 A Technical and Economic Analysis of Heat and Power Generation from Biomethanation of
Palm Oil Mill Effluent Electrcity Supply Industry in Transition Issues and Prospect for Asia 10 SD 06 ndash Eco-Ideal Consulting Sdn Bhd (Eco-Ideal) 2004 MEWCPTMDANIDA Study on Clean Development
Mechanism Potential in the Waste Sectors in Malaysia Unpublished
PROJECT DESIGN DOCUMENT FORM (CDM-SSC-PDD) - Version 03
CDM ndash Executive Board
15
As the project activity generates revenue (other than CDM revenue) by exporting the electricity to the
grid and from the likely sale of biomass andor saving from diesel usage at the mill which is being
displaced by biogas simple cost analysis cannot be used Of the remaining PP has chosen the benchmark
analysis to demonstrate the financial unattractiveness of the project activity without carbon credits
There is a national policy on Feed-In-Tariff (FiT) gazetted in June 201111
that gives comparative
advantages to less emissions-intensive technologies over more emissions-intensive technologies (E-
policy as national andor sectoral policies or regulations that give comparative advantages to less
emissions-intensive technologies over more emissions-intensive technologies)
This is very conservative as paragraph 7 6 (b) EB22 Annex 3 states that ldquoNational andor sectoral
policies or regulations hellip that have been implemented since the adoption by the COP of the CDM MampP
(decision 17CP7 11 November 2001) need not be taken into account in developing a baseline scenario
(ie the baseline scenario could refer to a hypothetical situation without the national andor sectoral
policies or regulations being in place) In absence of the FiT the prevailing electricity sales tariff to
consumers is RM 021 per kWh
Project IRR has been chosen as the financial indicator for the financial analysis of the project activity
The project IRR has to be compared with a benchmark rate of return to demonstrate the additionality of
the project The Guidelines on the Assessment of Investment Analysis (Version 05 point 12) states ldquoIn
cases where a benchmark approach is used the applied benchmark shall be appropriate to the type of IRR
calculated Local commercial lending rates or weighted average costs of capital (WACC) are appropriate
benchmarks for a project IRR Requiredexpected returns on equity are appropriate benchmarks for an
equity IRR Benchmarks supplied by relevant national authorities are also appropriate if the DOE can
validate that they are applicable to the project activity and the type of IRR calculation presentedrdquo
In line with the Guidelines on the Assessment of Investment Analysis (Version 05) a default value
for the expected returns on equity is selected as the benchmark with 1090 The logic of choosing this
rate as benchmark is that the project should yield a return at least equivalent to the expected returns of
equity to merit consideration
For making the investment analysis the following assumptions have been made
Table B2 Investment Analysis
Sl No Description Value
1
Budgeted CAPEX
- Bioreactor amp accessories
- Flaring system
- Boiler adaptation cost for burners
- Gas engine(s)
- KPSR consultancy cost
4350000
140670
205000
4630000
220000
Total 9545670
2
Annual maintenance costs are estimated based on a of CAPEX12
Bioreactor (3 of CAPEX) = MYR 130500
Gas engine(s) (5 of CAPEX) = MYR 231500
3 Corporate tax ()13 25
11 httpwwwmbipvnetmydloadFiT20Handbook20Englishpdf 12 SD 05 ndash Maintenance cost (SIRIM Environmental and Bioprocess Technology Centre of Malaysia)
PROJECT DESIGN DOCUMENT FORM (CDM-SSC-PDD) - Version 03
CDM ndash Executive Board
16
Since losses can be carried forward indefinitely (so long as the ownership
remains unchanged) the incidence of taxation does not arise in the case of
this project activity
4
Manpower cost has been estimated based on 1 supervisor 2 operators 1
chargeman envisaged to be appointed and the ruling wagesalary structure
of the company14
182588 MYR yr
5 Salary increment rate has been applied based on the average expected
salary increment rate for year 20101115 40
6 Price of Biomass ex-factory (PKS) 156 MYRmt
7 Price of diesel 220 MYRliter
8 RE tariff export to grid (MYRkWh) 021
9
Laboratory Cost is estimated based on the quotations from accredited
laboratory anticipated number of tests and samples to be carried out and
transportation cost during the running and operating of the biogas plant for
maintaining optimum operating conditions
1920 MYR yr
10 Insurance premium per year ( of CAPEX)16 0412
11 Estimate of CER price (EUR) 8
12
Depreciation of equipment (years) has been provided as per the Inland
Revenue Authority regulations17 Since the project consists of only
environmental protection equipment it is entitled to initial capital
allowance of 40 and annual capital allowance of 20 as per the Inland
Revenue Authority notifications
4 years
13 Project life time for IRR calculation18 20 years
14
Residual value a fair value (5) of the project activity assets at the end of
the assessment period as per the Guidelines on The Assessment of
Investment Analysis version 05 EB 62
MYR 466284
Based on the above assumption the project IRR works out to be ndash 085 in contrast to the benchmark
rate of 1090 Thus the analysis proves that the project is not financially attractive
Sensitivity Analysis
A sensitivity analysis has also been conducted to test the robustness of the conclusions drawn Four (4)
factors have been identified as critical to IRR of the project viz project cost maintenance costs RE
tariff The results of sensitivity analysis are given below
13 SD 08 ndash Malaysian Tax and Business Booklet 201011 Page 12
httpwwwpwccomen_MYmyassetspublicationstaxbooklet1011pdf 14 SD 3 - Salary structure (biogas plant) 15 SD 09 - Salary increment rate (201011) 16 SD 2 - Biogas plant insurance policy 17 SD 08 ndash Malaysian Tax and Business Booklet 201011 Page 21
httpwwwpwccomen_MYmyassetspublicationstaxbooklet1011pdf 18 As per the Guidelines on the Assessment of Investment Analysis version 05 (Annex 5 EB 62 point 3) ldquoIn general a
minimum period of 10 years and a maximum of 20 years will be appropriaterdquo PP has chosen 20 years for financial
assessment as it is conservative
PROJECT DESIGN DOCUMENT FORM (CDM-SSC-PDD) - Version 03
CDM ndash Executive Board
17
Table B3 Sensitivity Analysis
FACTORS PROJECT IRR
-10 0 +10
Project cost -185 -085 033
Maintenance cost -491 -085 189
RE tariff 112 -085 -354
It could be seen from the above that even under the most optimistic conditions the project activity would
not yield a positive IRR let alone crossing the benchmark Therefore the project is not a business-as-
usual scenario and it is additional
Prior Consideration of CDM
As per the guidance of EB Meeting Report 49 Annex 22 the project proponent notified the UNFCCC and
the DNA of the intent to implement the project as a CDM project activity
Conclusion
The conclusion of the investment analysis remains identical to reasonable variations of the critical
assumptions (sensitivity analysis) Therefore the project activity IRR remains lower than the benchmark
In the above background it is proved that the project faces an investment barrier that establishes the
additionality
B4 Description of the sources and gases included in the project boundary and proof that the
small-scale CPA is located within the geographical boundary of the registered PoA
The emission sources and type of GHG which are included or excluded within the project boundary are
shown in the following table
Table B4 Emission Sources and Type of GHG
Source Gas Included Justification Explanation
Ba
seli
ne
Direct emissions
from the
wastewater
treatment processes
CO2 No Neutral CO2 emissions from biomass decaying
CH4 Yes Methane emissions from open lagoons treatment
process
N2O No Not significant Excluded for simplification and
conservativeness
Diesel usage in
diesel genset at mill
CO2 Yes CO2 emissions from combustion of diesel fuel
CH4 No Not significant Excluded for simplification and
conservativeness
N2O No Not significant Excluded for simplification and
conservativeness
Pro
ject
Act
ivit
y
Bio-digester
CO2 No Neutral CO2 emissions from biomass decaying
CH4 Yes Methane emissions from anaerobic treatment process
N2O No Not significant Excluded for simplification and
conservativeness
Existing
wastewater
treatment lagoons
CO2 No Neutral CO2 emissions from biomass decaying
CH4 Yes Methane emissions from poorly managed treatment
process (without aerators)
PROJECT DESIGN DOCUMENT FORM (CDM-SSC-PDD) - Version 03
CDM ndash Executive Board
18
(Facultative amp
algae system) N2O No
Not significant Excluded for simplification and
conservativeness
Gas engine(s)
(biogas
combustion)
CO2 No Neutral CO2 emissions from biogas combustion
CH4 No Not significant and excluded from calculation
Biogas combustion efficiency is considered 10019
N2O No Not significant Excluded for simplification and
conservativeness
Biomass Boiler(s)
(Biogas
combustion)
CO2 No Neutral CO2 emissions from biogas combustion
CH4 No Not significant and excluded from calculation
Biogas combustion efficiency is considered 10020
N2O No Not significant Excluded for simplification and
conservativeness
Grid electricity
consumption from
national grid
CO2 Yes CO2 emissions from grid energy
CH4 No Not significant Excluded for simplification and
conservativeness
N2O No Not significant Excluded for simplification and
conservativeness
Enclosed or Open
flaring system
CO2 No Neutral CO2 emissions from biogas combustion
CH4 Yes CH4 emissions due to incomplete combustion in
enclosed flare
N2O No Not significant Excluded for simplification and
conservativeness
The CPA is implemented at the address below
Kilang Sawit Felda Triang Triang Pahang Malaysia
The site is located at state of Pahang Malaysia with GPS coordinates 3 16152 N 102 34567 E or
32692 1025761 (refer also Section A412) and thus is located within the geographical boundary of the
PoA
B5 Emission reductions
B51 Data and parameters that are available at validation
Data Parameter GWPCH4
Data unit tCO2tCH4
Description Global Warming Potential the equivalent in CO2 of the effect of methane
gas to the atmosphere
Source of data used IPCC 2006
Value applied 21
Justification of the choice of
data or description of
measurement methods and
procedures actually applied
Global warming potential for methane gas since this is a methane
capture project
19 AMS-IIIH para 35 20 AMS-IIIH para 35
PROJECT DESIGN DOCUMENT FORM (CDM-SSC-PDD) - Version 03
CDM ndash Executive Board
19
Any comment
Data Parameter MCFwwtreatmentBL1
Data unit Fraction
Description Methane correction factor for baseline wastewater anaerobic treatment
systems
Source of data used Table IIIH1 AMS IIIH version 16
Value applied 08
Justification of the choice of
data or description of
measurement methods and
procedures actually applied
Table IIIH1 for baseline emission The lagoons depth are more than 2m
MCF value of 08 for anaerobic deep lagoon (depth gt 2 m)
Any comment
Data Parameter MCFwwtreatmentBL2
Data unit Fraction
Description Methane correction factor for baseline wastewater aerobic treatment
systems
Source of data used Methane correction factor for baseline aerobic wastewater treatment
system (poorly managed)
Value applied Table IIIH1 AMS IIIH version 16
Justification of the choice of
data or description of
measurement methods and
procedures actually applied
03
Any comment No aerators installed
Data Parameter MCFwwBLdischarge
Data unit Fraction
Description Methane correction factor based on discharge pathway in the baseline
situation
Source of data used Table IIIH1 AMS IIIH version 16
Value applied 01
Justification of the choice of
data or description of
measurement methods and
procedures actually applied
Table IIIH1 for baseline emission The final discharge of treated
effluent into river MCF value of 01 for river discharge
Any comment
Data Parameter Bo ww
Data unit kgCH4 kgCOD
Description Methane generation capacity of treated wastewater
Source of data used IPCC 2006
Value applied 025
Justification of the choice of
data or description of
measurement methods and
procedures actually applied
Default value as prescribed in the methodology
Any comment
PROJECT DESIGN DOCUMENT FORM (CDM-SSC-PDD) - Version 03
CDM ndash Executive Board
20
Data Parameter UFBL
Data unit -
Description Model correction factor to account for model uncertainties (baseline)
Source of data used AMS IIIH version 16
Value applied 089
Justification of the choice of
data or description of
measurement methods and
procedures actually applied
As per methodology AMS-IIIH point 24
Any comment -
Data Parameter UFPJ
Data unit -
Description Model correction factor to account for model uncertainties (project
activity)
Source of data used AMS IIIH version 16
Value applied 112
Justification of the choice of
data or description of
measurement methods and
procedures actually applied
As per methodology AMS-IIIH point 30(a)
Any comment -
Data Parameter CFEww
Data unit Fraction
Description Capture efficiency of the biogas recovery equipment in the wastewater
treatment system
Source of data used AMS IIIH version 16
Value applied 09
Justification of the choice of
data or description of
measurement methods and
procedures actually applied
A default value of 09 has been used as per the guidance in the
methodology
Any comment
Data Parameter MCF ww treatmentPJ1
Data unit Fraction
Description Methane correction factor for the project wastewater anaerobic treatment
system equipped with biogas recovery equipment
Source of data used Table IIIH1 AMS IIIH version 16
Value applied 08
Justification of the choice of
data or description of
measurement methods and
procedures actually applied
The lagoons depth are more than 2 m MCF values in table IIIH1 has
been used as per the guidance in the methodology (depth gt 2 m)
Any comment
Data Parameter MCF ww treatmentPJ2
PROJECT DESIGN DOCUMENT FORM (CDM-SSC-PDD) - Version 03
CDM ndash Executive Board
21
Data unit Fraction
Description Methane correction factor for the project wastewater aerobic treatment
system not equipped with biogas recovery equipment
Source of data used Table IIIH1 AMS IIIH version 16
Value applied 03
Justification of the choice of
data or description of
measurement methods and
procedures actually applied
Aerobic treatment poorly managed
Any comment
Data Parameter MCFwwPJdischarge
Data unit Fraction
Description Methane correction factor based on discharge pathway in the project
activity
Source of data used Table IIIH1 AMS IIIH version 16
Value applied 01
Justification of the choice of
data or description of
measurement methods and
procedures actually applied
Table IIIH1 for project emission The final discharge of treated effluent
into river MCF value of 01 for river discharge
Any comment Same discharge pathway as in the baseline
Data Parameter CODBL1
Data unit
Description COD removal efficiency of the baseline system (anaerobic treatment
system)
Source of data used 10 days measurement campaign
Value applied Anaerobic Treatment system 8880
Justification of the choice of
data or description of
measurement methods and
procedures actually applied
One year historical data not available
Any comment This data will be used for ex post emission reduction calculation
Data Parameter CODBL2
Data unit
Description COD removal efficiency of the baseline system (aerobic treatment
system)
Source of data used 10 days measurement campaign
Value applied Aerobic Treatment system 6369
Justification of the choice of
data or description of
measurement methods and
procedures actually applied
One year historical data not available
Any comment This data will be used for ex post emission reduction calculation
Data Parameter NCVCH4
Data unit MJkg
PROJECT DESIGN DOCUMENT FORM (CDM-SSC-PDD) - Version 03
CDM ndash Executive Board
22
Description Net Calorific Value of methane
Source of data used IPCC 2006 Default Value
Value applied 504
Justification of the choice of
data or description of
measurement methods and
procedures actually applied
IPCC 2006 value is used Volume 2 Chapter 1 Table 12
Any comment
Data Parameter NCVFF
Data unit MJkg
Description Net Calorific Value of diesel
Source of data used IPCC 2006 Default Value
Value applied 430
Justification of the choice of
data or description of
measurement methods and
procedures actually applied
IPCC 2006 value is used Volume 2 Chapter 1 Table 12
Any comment
Data Parameter EFCO2diesel
Data unit tCO2MWh
Description CO2 emission factor diesel genset
Source of data used AMS-IA version 14 point 14
Value applied 08
Justification of the choice of
data or description of
measurement methods and
procedures actually applied
Default value for diesel generation unit
Any comment
Data Parameter Grid Emission Factor
Data unit kgCO2ekWh
Description Emission factor for grid electricity in Peninsular Malaysia
Source of data used Pusat Tenaga Malaysia March 2010
Value applied 0672
Justification of the choice of
data or description of
measurement methods and
procedures actually applied
As per AMS-ID point 12
Any comment Study on Grid Connected Electricity Baselines in Malaysia 2008
B52 Ex-ante calculation of emission reductions
The ex ante emission reductions are calculated based on AMS-IIIH version 16 as per equations
explained in section E62 of PoA-DD Biogas PoA in Malaysia
PROJECT DESIGN DOCUMENT FORM (CDM-SSC-PDD) - Version 03
CDM ndash Executive Board
23
Calculation for AMS-IIIH
Baseline emissions
Source of baseline emissions Reference Applicable
(YN)
Comments
Wastewater and sludge treatment
systems equipped with a biogas
recovery facility shall be excluded
from the baseline
AMS-IIIH
Point 17
N No biogas recovery in the
baseline
Emissions on account of electricity or
fossil fuel used (BEpowery)
AMS-IIIH
Point 18 (i)
N For conservativeness no
emissions due to electricity or
fossil fuel will be claimed
BEpowery = 0
Methane emissions from baseline
wastewater treatment systems
(BEwwtreatmenty)
AMS-IIIH
Point 18 (ii)
Y Baseline includes anaerobic and
aerobic treatment conditions with
different MCF values selected as
per Table IIIH1
Methane emissions from baseline
sludge treatment systems (BEstreatmenty)
= 0
AMS-IIIH
Point 18 (iii)
N The baseline plant corresponds to
scenario Para 1(f) without sludge
treatment BEstreatmenty = 0
Methane emissions on account of
inefficiencies in the baseline
wastewater treatment systems and
presence of degradable organic carbon
in the treated wastewater discharged
into river (BEwwdischargey)
AMS-IIIH
Point 18 (iv)
Y Treated effluent is currently
discharged into the river
Methane emissions from the decay of
the final sludge generated by the
baseline treatment systems (BEsfinaly)
AMS-IIIH
Point 18 (v)
N Zero because in the baseline final
sludge used for soil application
BEsfinaly = 0
A) Calculation of baseline emissions
BEy = BEwwtreatmenty + BEwwdischargey
Abbreviation Description Value Source
BEy Baseline emissions in year y (tCO2e) 30762 Calculated
BEpowery Baseline emissions of diesel genset in year
y tCO2eyear 0 Calculated
BEwwtreatmenty Baseline emissions of the wastewater
treatment systems tCO2eyear 30663 Equation 2
BEwwdischargey
The methane emissions from degradable
organic carbon in treated wastewater
discharged tCO2eyear
100 Equation 6
A1) Baseline emissions
PROJECT DESIGN DOCUMENT FORM (CDM-SSC-PDD) - Version 03
CDM ndash Executive Board
24
Equation 2 BEwwtreatmenty = Qwwy (CODinflow1 y CODBL1 MCFwwtreatmentBL1) +
(CODinflow2y CODBL2 MCFwwtreatmentBL2) Boww UFBL GWPCH4
Abbreviation Description Value Source
BEwwtreatmenty Baseline emissions of the wastewater
treatment systems (tCO2eyear) 30663 Calculated
Qwwy Volume of wastewater treated in baseline
wastewater treatment system i in year y
(m3year)
333293
Volume based on 10 m3mt
FFB21 amp FFB historical data
(2009 ndash 2011)
CODinflow1y Chemical oxygen demand of the
wastewater inflow to the baseline treatment
system (anaerobic) in year y (tCOD m3)
0026905 10 days measurement
campaign
CODBL1 COD removal efficiency of the baseline
treatment system (anaerobic) () 8880
10 days measurement
campaign
CODinflow2y Chemical oxygen demand of the
wastewater inflow to the baseline treatment
system (aerobic) in year y (tCOD m3)
0003013 10 days measurement
campaign
CODBL2 COD removal efficiency of the baseline
treatment system (aerobic) () 6369
10 days measurement
campaign
MCFwwtreatmentBL 1 Methane correction factor for baseline
wastewater anaerobic treatment systems 08
MCF values as per table
IIIH1 anaerobic gt 2m
MCFwwtreatmentBL2 Methane correction factor for baseline
wastewater aerobic treatment systems 03
MCF values as per table
IIIH1 ndash poorly managed
Boww Methane producing capacity of the
wastewater (kg CH4kg COD) 025
IPCC 2006
UFBL Model correction factor to account for
model uncertainties 089
IPCC 2006
GWPCH4 Global Warming Potential for methane 21 IPCC 2006
A2) The methane emissions from degradable organic carbon in treated wastewater discharged
Equation 6 BEwwdischargey = Qwwy GWPCH4 Boww UFBL CODwwdischarge BLyMCFww BLdischarge
Abbreviation Description Value Source
BEwwdischargey
The methane emissions from degradable
organic carbon in treated wastewater
discharged (tCO2eyear)
100 Calculated
Qwwy Volume of treated wastewater discharged
in year y (m3year) 333293
Volume based on 10 m3mt
FFB22 amp FFB historical data
(2009 ndash 2011)
GWPCH4 Global warming potential of methane 21 IPCC 2006
Boww Methane producing capacity of the treated
wastewater (kgCH4 kgCOD) 025 IPCC 2006
21 Mill designed data for baseline effluent treatment plant 22 Mill designed data for baseline effluent treatment plant
PROJECT DESIGN DOCUMENT FORM (CDM-SSC-PDD) - Version 03
CDM ndash Executive Board
25
UFBL Model correction factor to account for
model uncertainties 089 IPCC 2006
CODwwdischarge BLy Chemical oxygen demand of the treated
wastewater discharged into sea river or
lake in the baseline situation in the year y
(tonnesm3)
0000642 10 days measurement
campaign
MCFwwBLdischarge Methane correction factor based on
discharge pathway in the baseline situation
(eg into sea river or lake) of the
wastewater (fraction)
01 MCF values as per table
IIIH1 version 16
Project activity emissions
The project activity emission sources as per the methodology and their relevance with respect to the
proposed CDM project activity are given below in a tabular format
Source of project activity
emission Reference
Applicable
(YN) Comments
CO2 emissions on account of
power and fossil fuel used by
the project activity facilities
(PEpowery)
AMS-IIIH
point 29(i)
Y The project activity uses the electricity
imported from the national grid
Methane emissions from
wastewater treatment systems
affected by the project
activity and not equipped with
biogas recovery in the project
situation (PEwwtreatmenty)
AMS-IIIH
point 29 (ii)
Y CH4 emissions from the poorly managed
aerobic lagoons
Methane emissions from
sludge treatment systems
affected by the project
activity and not equipped with
biogas recovery in the project
situation (PEstreatmenty)
AMS-IIIH
point 29 (iii)
N The project activity corresponds to
scenario (vi) without sludge treatment
PEystreatmenty = 0
Methane emissions on account
of inefficiency of the project
activity wastewater treatment
systems and presence of
degradable organic carbon in
treated wastewater
(PEwwdischargey)
AMS-IIIH
point 29 (iv)
Y Treated effluent from ETP will be
discharged into river
Methane emissions from the
decay of the final sludge
generated by the project
activity treatment systems
(PEsfinaly)
AMS-IIIH
point 29 (v)
N In the proposed CDM project activity
final sludge is used for soil application in
the same manner as in the baseline
PEsfinaly = 0
PROJECT DESIGN DOCUMENT FORM (CDM-SSC-PDD) - Version 03
CDM ndash Executive Board
26
Methane fugitive emissions on
account of inefficiencies in
capture systems (PEfugitivey)
AMS-IIIH
point 29 (vi)
Y Applicable to PEfugitivewwy
N The project activity corresponds to
scenario (vi) without sludge treatment
PEfugitivesy = 0
Methane emissions due to
incomplete flaring (PEflaringy)
AMS-IIIH
point 29 (vii)
Y Enclosed flaring system installed
Methane emissions from
biomass stored under
anaerobic conditions which
does not take place in the
baseline situation (PEbiomassy)
AMS-IIIH
point 29
(viii)
N In the project activity the biomass (PKS
+ mesocarp fibres) displaced will not be
stored under anaerobic conditions The
conditions of onsite storage are identical
in the baseline as in the project activity
The biomass will be sold to the market
on a regular basis PEbiomassy = 0
B) Calculation of project emissions
PEy = PEpowery + PEwwtreatmenty + PEww discharge y + PEfugitive y + PEflaring y
Abbreviation Description Value Source
PEy Project activity emissions in the year y
(tCO2eyr) 6050 Equation 8
PEpowery CO2 emissions on account of power used
by the project activity facilities (tCO2eyr) 604 -
PEwwtreatmenty Methane emissions from wastewater
treatment systems affected by the project
activity and not equipped with biogas
recovery in year y (tCO2eyr)
1523 Equation 9
PEwwdischargey
Methane emissions on account of
inefficiency of the project activity
wastewater treatment systems and presence
of degradable organic carbon in treated
wastewater (tCO2eyr)
126 Equation 12
PEfugitivey Methane fugitive emissions on account of
inefficiencies in capture systems (tCO2eyr) 3796 Equation 15
PEflaringy Methane emissions due to incomplete
flaring (tCO2eyr) 0 Equation 19
B1) Project emissions from CO2 emissions on account of power and fuel used by the project activity
facilities in year ldquoyrdquo in tCO2eyear
PEpowery = ECPJjy EFgridy
Abbreviation Description Value Source
PEpowery Project emissions from electricity
consumption in the year y (tCO2eyr) 604 Calculated
ECPJjy Internal power consumption from the grid 749 100 kW is the effective
PROJECT DESIGN DOCUMENT FORM (CDM-SSC-PDD) - Version 03
CDM ndash Executive Board
27
(MWh year) power based on the
equipments installed at the
site
EFgridy Grid Emission factor in Peninsular
Malaysia 2008 (tCO2 MWh) 0672
Study on Grid Connected
Electricity Baselines in
Malaysia 2008 published in
2010 by PTM
B2) Methane emissions from wastewater treatment systems affected by the project activity and not
equipped with biogas recovery in the project situation in year ldquoyrdquo in tCO2e
Equation 9 PEwwtreatment y = Qwwky CODinflowk y PJky MCFwwtreatmentPJk) Boww UFPJ GWPCH4
Abbreviation Description Value Source
PEwwtreatmenty
Methane emissions from wastewater
treatment systems affected by the project
activity and not equipped with biogas
recovery in the project situation (tCO2eyr)
1523 Calculated
Qwwky Volume of wastewater treated in project
activity wastewater treatment system k in
year y (m3year)
333293
Volume based on 10 m3mt
FFB23 amp FFB historical data
(2009 ndash 2011)
CODinflowky Chemical oxygen demand of the
wastewater inflow to the project activity
treatment system k in year y (tonnes COD
m3)
0002690 10 days measurement
campaign
PJky Chemical oxygen demand removal
efficiency of the project wastewater
treatment system k in year y (tm3)
measured based on inflow COD and
outflow COD in system k
90 Based on bio-digester COD
removal efficiency of 90
MCFwwtreatmentPJk Methane correction factor for project
wastewater treatment system k (MCF
values as per table IIIH1)
03
MCF values table IIIH1
Version 16 ndash aerobic poorly
managed (conservative)
Boww Methane generation capacity of the treated
wastewater (kg CH4kg COD) 025 IPCC 2006
UFPJ Model correction factor to account for
model uncertainties 112
IPCC 2006
GWPCH4 Global warming potential of methane 21 IPCC 2006
23 Mill designed data for baseline effluent treatment plant
PROJECT DESIGN DOCUMENT FORM (CDM-SSC-PDD) - Version 03
CDM ndash Executive Board
28
B3) Methane emissions on account of inefficiency of the project activity wastewater treatment
systems and presence of degradable organic carbon in treated wastewater in the year ldquoyrdquo (tonnes)
Equation 12 PEwwdischarge y = Qwwy GWPCH4 Boww UFPJ CODwwdischargePJy MCFwwPJdischarge
Abbreviation Description Value Source
PEwwdischargey
Methane emissions from degradable
organic carbon in treated wastewater
(tCO2eyr)
126 Calculated
Qwwy Quantity of wastewater treated in year y
(m3year) 333293
Volume based on 10 m3mt
FFB24 amp FFB historical data
(2009 ndash 2011)
CODwwdischargedPJ
y
Chemical oxygen demand of the treated
wastewater discharged into river in the
project situation in year y (tCOD m3)
0000642 10 days measurement
campaign
MCFwwPJ discharge
Methane correction factor based on
discharge pathway in the project situation
(river) of the wastewater (fraction)
01 MCF values as per table
IIIH1 Version 16
Boww Methane generation capacity of the treated
wastewater (kg CH4kg COD) 025 IPCC 2006
UFPJ Model correction factor to account for
model uncertainties 112 IPCC 2006
GWPCH4 Global warming potential of methane 21 IPCC 2006
B41) Methane fugitive emissions on account of inefficiencies in capture systems in the year ldquoyrdquo
(tonnes)
Equation 15 PEfugitivewwy = (1 ndash CFEww ) MEPywwtreatment GWPCH4
Abbreviation Description Value Source
PEfugitivey Methane fugitive emissions on account of
inefficiencies in capture systems (tCO2eyr) 3796 Calculated
CFEww Capture efficiency of the biogas recovery
equipment in the wastewater treatment
systems
09 AMS IIIH Version 16
MEPywwtreatment Methane emission potential of wastewater
treatment systems equipped with biogas
recovery system in year y (tCH4yr)
1808 Refer Equation 11 of AMS
IIIH version 16
GWPCH4 Global warming potential of methane 21 IPCC 2006
B42) Methane emission potential of wastewater treatment plant in the year ldquoyrdquo (tonnes)
Equation 16 MEPwwtreatmenty = Qwwy Boww UFPJ (CODremovedPJky MCFwwtreatmentPJk)
24 Mill designed data for baseline effluent treatment plant
PROJECT DESIGN DOCUMENT FORM (CDM-SSC-PDD) - Version 03
CDM ndash Executive Board
29
Abbreviation Description Value Source
MEPwwtreatmenty Methane emission potential of wastewater
treatment systems equipped with biogas
recovery system in year y (tonnes CH4yr)
1808 Calculated
Qyww Quantity of wastewater treated in year y
(m3year) 333293
Volume based on 10 m3mt
FFB25 amp FFB historical data
(2009 ndash 2011)
Boww Methane generation capacity of the treated
wastewater (kg CH4kg COD) 025 IPCC 2006
CODremovedPJy
The chemical oxygen demand removed by
the treatment anaerobic system of the
project activity equipped with biogas
recovery in the year y (tCOD m3)
0024214
10 days measurement
campaign amp bio-digester
design parameter
MCFwwtreatmentPJ
Methane correction factor for the project
wastewater treatment system k equipped
with biogas recovery equipment
08 MCF values as per table
IIIH1 Version 16
UFPJ Model correction factor to account for
model uncertainties 112 IPCC 2006
B5) Methane emissions due to incomplete flaring in the year ldquoyrdquo (tonnes)
Equation 13a PEflaringy = TMflaredy (1 - ηflarey) GWPCH4
Abbreviation Description Value Source
PEflaringy Methane emissions due to incomplete
flaring (tCO2eyr) 0 Calculated
TMflaredh Mass flow rate of methane flared in dry
basis in the hour h (tCH4 yr) 0 Calculated
ηflarey Flare efficiency in hour h based on default
values 50
Tools for methane flaring
(open flare) for conservative
GWPCH4 Global warming potential of methane 21 IPCC 2006
Leakage emissions
No leakage emission will occur in the project activity
LEy1 = 0
Emission reductions
Equation 22 ERy ex ante = BEy ex ante ndash (PEy ex ante + LEy ex ante)
25 Mill designed data for baseline effluent treatment plant
PROJECT DESIGN DOCUMENT FORM (CDM-SSC-PDD) - Version 03
CDM ndash Executive Board
30
Abbreviation Description Value Source
ERy1 ex ante Ex ante emission reduction in year y
(tCO2e) 24712 Equation 22
BEy1 ex ante Ex ante baseline emissions in year y
(tCO2e) 30762 Equation 1
PEy1 ex ante Ex ante project emissions in year y (tCO2e) 6050 Equation 8
LEy1 ex ante Ex ante Leakage emissions in year y
(tCO2e) 0 -
Calculation for AMS-ID
Baseline emissions
Electricity generated from biogas engines will be exported to the Peninsular Malaysia National Grid The
baseline emissions are described in AMS-ID (Version 17 EB 61) as the ldquoproduct of electrical energy
baseline expressed in kWh of electricity produced by the renewable energy generating unit multiplied by
an emission factorrdquo
Baseline emissions due to electricity exported to the grid in the year ldquoyrdquo (tonnes)
BEEGy = EGBLy EFCO2gridy
Abbreviation Description Value Source
BEEGy Baseline emissions in year y (tCO2eyr) 4568 Calculated
EGBLy
Quantity of net electricity supplied to the
grid as a result of the implementation of the
project activity in year y (kWh yr)
6797625 Calculated
EFCO2gridy
CO2 emission factor of the grid in year
(tCO2kWh) 0672
Study on Grid Connected
Electricity Baselines in
Malaysia 2008 published in
2010 by PTM
Project Activity Emissions
As per AMS-ID (Version 17 EB 61) project emissions for renewable energy project activities are zero
PEEGy = 0
Leakage
If the energy generating equipment is transferred from another activity leakage is to be considered
No leakage emission will occur in the project activity LEy = 0
PROJECT DESIGN DOCUMENT FORM (CDM-SSC-PDD) - Version 03
CDM ndash Executive Board
31
Emission reductions
ERy = BEy ndash PEy - LEy
Abbreviation Description Value Source
ERy Emission reduction in year y (tCO2ey) 4568 -
BEy Baseline emissions in year y (tCO2ey) 4568 -
PEy Project emissions in year y (tCO2ey) 0 -
LEy Leakage emissions in year y (tCO2ey) 0 -
Calculation for AMS-IA
Baseline emissions
The energy baseline is the fuel consumption of the technology in use or that would have been used in the
absence of the project activity to generate the equivalent quantity of energy Option 2 is applied This
methodology is only apply shall the recovered is in excess after export to the grid
Annual electricity sent to the mill for FF displacement in the year ldquoyrdquo (kWh)
EBLy = ΣEGiy (1 ndash l)
Abbreviation Description Value Source
EBLy Annual energy baseline (kWhyr) Calculated
EGiy
The estimated annual output of the
renewable energy technologies of the group
of i renewable energy technologies
installed (kWhyr)
0 Estimated
l
Average technical distribution losses that
would have been observed in diesel
powered mini-grids installed by public
programmes or distribution companies in
isolated areas expressed as a fraction
0 Conservative by applying
Zero (0)
Baseline electricity sent to the mill for FF displacement in the year ldquoyrdquo (tonnes)
BECO2y = EBLy EFCO2
Abbreviation Description Value Source
BECO2y Baseline emission in the year y (tCO2yr) 0 Calculated
EBLy Annual energy baseline (kWhyr) 0 Calculated
EFCO2 CO2 emission factor (tCO2kWh) 08
Default value which is
derived from diesel
generation units is used
PROJECT DESIGN DOCUMENT FORM (CDM-SSC-PDD) - Version 03
CDM ndash Executive Board
32
Project Activity Emissions
As per AMS-IA (Version 14 EB 54) project emissions for renewable energy project activities are zero
PEy = 0
Leakage
If the energy generating equipment is transferred from another activity or if the existing equipment is
transferred to another activity leakage is to be considered
No leakage emission will occur in the project activity LEy = 0
B53 Summary of the ex-ante estimation of emission reductions
Estimated emission reductions (total project activity)
Year
Estimation of
project activity
emissions (tCO2e)
Estimation of
baseline emissions
(tCO2e)
Estimation of
leakage (tCO2e)
Estimation of
overall emission
reductions (tCO2e)
2012 504 2944 0 2440
2013 6050 35330 0 29280
2014 6050 35330 0 29280
2015 6050 35330 0 29280
2016 6050 35330 0 29280
2017 6050 35330 0 29280
2018 6050 35330 0 29280
2019 5546 32386 0 26840
Total (tCO2) 42350 247310 0 204960
The starting date of the crediting period is 01122012 or the date of registration whichever is later
Estimated emission reductions for AMS-IIIH
Year
Estimation of
project activity
emissions (tCO2e)
Estimation of
baseline emissions
(tCO2e)
Estimation of
leakage (tCO2e)
Estimation of
overall emission
reductions (tCO2e)
2012 504 2563 0 2059
2013 6050 30762 0 24712
PROJECT DESIGN DOCUMENT FORM (CDM-SSC-PDD) - Version 03
CDM ndash Executive Board
33
2014 6050 30762 0 24712
2015 6050 30762 0 24712
2016 6050 30762 0 24712
2017 6050 30762 0 24712
2018 6050 30762 0 24712
2019 5546 28199 0 22653
Total (tCO2) 42350 215334 0 172984
The starting date of the crediting period is 01122012 or the date of registration whichever is later
Estimated emission reductions for AMS-ID
Year
Estimation of
project activity
emissions (tCO2e)
Estimation of
baseline emissions
(tCO2e)
Estimation of
leakage (tCO2e)
Estimation of
overall emission
reductions (tCO2e)
2012 0 381 0 381
2013 0 4568 0 4568
2014 0 4568 0 4568
2015 0 4568 0 4568
2016 0 4568 0 4568
2017 0 4568 0 4568
2018 0 4568 0 4568
2019 0 4187 0 4187
Total (tCO2) 0 31976 0 31976
The starting date of the crediting period is 01122012 or the date of registration whichever is later
Estimated emission reductions for AMS-IA
Year
Estimation of
project activity
emissions (tCO2e)
Estimation of
baseline emissions
(tCO2e)
Estimation of
leakage (tCO2e)
Estimation of
overall emission
reductions (tCO2e)
2012 0 0 0 0
2013 0 0 0 0
2014 0 0 0 0
2015 0 0 0 0
2016 0 0 0 0
PROJECT DESIGN DOCUMENT FORM (CDM-SSC-PDD) - Version 03
CDM ndash Executive Board
34
2017 0 0 0 0
2018 0 0 0 0
2019 0 0 0 0
Total (tCO2) 0 0 0 0
The starting date of the crediting period is 01122012 or the date of registration whichever is later
B6 Application of the monitoring methodology and description of the monitoring plan
B61 Description of the monitoring plan
The parameters to be monitored are
Please note that the amount of methane recovered and fuelled or flared (MDy ) is calculated as follows
MDy = TMfuelledy + TMflaredy Equation A
Where Description Units
MDy Quantity of methane recovered and fuelled or flared in the year y tonnes CH4year
TMfuelledy Quantity of methane fuelled in the year y tonnes CH4year
TMflaredy Quantity of methane flared in year y tonnes CH4year
Where
TMfuelledy = FVfuelledh fvCH4h ηfuelledh ρCH4n) 1000 Equation B
Where Description Units
TMfuelledy Quantity of methane fuelled in the year y tonnes CH4year
FVfuelledh Volumetric flow rate of the fuelled biogas gas at normal conditions in
hour h
Nm3 biogashour
ηfuelledh 100 for gainful purpose26
fvCH4h Volumetric fraction of methane in the biogas gas in the hour h
ρCH4n Density of methane at normal conditions kgCH4Nm3CH4
And
TMflaredy = FVflaredh fvCH4h ηflareh ρCH4n) 1000 Equation C
Where Description Units
TMflaredy Quantity of methane flared in year y tonnes CH4year
FVflaredh Volumetric flow rate of the flared biogas gas at normal conditions in
hour h
Nm3 biogashour
26 AMS-IIIH point 35
PROJECT DESIGN DOCUMENT FORM (CDM-SSC-PDD) - Version 03
CDM ndash Executive Board
35
ηflareh Flare efficiency in the hour h
fvCH4h Volumetric fraction of methane in the biogas gas in the hour h
ρCH4n Density of methane at normal conditions kgCH4Nm3CH4
Data Parameter ID1 Qwwy
Data unit m3 month
Description The flow of wastewater entering the bio-digester
Source of data Measurement by project participant by using a flowmeter
Value of data ~ 28000
Brief description of
measurement methods and
procedures to be applied
The flow is measured with an online flow meter or equivalent
QAQC procedures to be
applied (if any) Data are monitored continuously and recorded periodically
(monthly or at shorter interval) in a data log file (DLF)
Uncertainty level of data low
Maintenance and calibration as per manufacturer‟s specifications
or at least once every three (3) years
Any comment
Data Parameter ID2 CODwwuntreatedy
Data unit tCOD m3
Description Raw COD of wastewater entering the bio-digester
Source of data Laboratory (internal and external)
Value of data ~ 0030230
Brief description of
measurement methods and
procedures to be applied
Measure of COD according to national or international standards
COD is measure through representative sampling
QAQC procedures to be
applied (if any) Minimum once a month COD sampling to ensure a 9010
confidenceprecision level
COD reports are recorded manually
Uncertainty level of data low
Maintenance and calibration as per manufacturer‟s specifications
or at least once every three (3) years for internal laboratory
equipment
Any comment
Data Parameter ID3 CODwwtreatedy
Data unit tCOD m3
Description COD of treated wastewater leaving the bio-digester
Source of data Laboratory (internal and external)
Value of data ~ 0003023
Brief description of
measurement methods and
procedures to be applied
Measure of COD according to national or international standards
COD is measure through representative sampling
QAQC procedures to be
applied (if any) Minimum once a month COD sampling to ensure a 9010
confidenceprecision level
COD reports are recorded manually
Uncertainty level of data low
PROJECT DESIGN DOCUMENT FORM (CDM-SSC-PDD) - Version 03
CDM ndash Executive Board
36
Maintenance and calibration as per manufacturer‟s specifications
or at least once every three (3) years for internal laboratory
equipment
Any comment
Data Parameter ID5 End-use of the final sludge
Data unit ndash
Description The final sludge generated by the project activity will be sent to control
landfill site if any
Source of data By project participant
Value of data ndash
Brief description of
measurement methods and
procedures to be applied
The final disposal of the sludge will be monitored during the crediting
period if any For each disposal of the sludge the following will be
recorded disposal site and date of disposal
QAQC procedures to be
applied (if any)
Any comment
Data Parameter ID6 FVflaredh
Data unit Nm3 hour
Description Volumetric flow of biogas recovered and flared at normal conditions in
the hour h
Source of data By project participant
Value of data 0
Brief description of
measurement methods and
procedures to be applied
The volume of biogas will be measured with a normalised flow meter or
calculated from the volumetric flow pressure temperature
Biogas volume and methane content measurements shall be on the same
basis (wet or dry)
QAQC procedures to be
applied (if any) The biogas flow is monitored continuously recorded and stored
electronically in a data log file (DLF) (monthly or at shorter
interval)
Data Parameter ID4 CODww dischargey
Data unit tCOD m3
Description COD of treated wastewater discharge into river by treatment system
Source of data Laboratory (internal and external)
Value of data ~ 0000100
Brief description of
measurement methods and
procedures to be applied
Measure of COD according to national or international standards
COD is measure through representative sampling
QAQC procedures to be
applied (if any) Minimum once a month COD sampling to ensure a 9010
confidenceprecision level
COD reports are recorded manually
Uncertainty level of data low
Maintenance and calibration as per manufacturer‟s specifications
or at least once every three (3) years for internal laboratory
equipment
Any comment
PROJECT DESIGN DOCUMENT FORM (CDM-SSC-PDD) - Version 03
CDM ndash Executive Board
37
Uncertainty level of data low
Maintenance and calibration as per manufacturer‟s specifications
or at least once every 3 years
Any comment
Data Parameter ID7 FVfuelledgas engineh
Data unit Nm3 hour
Description Volumetric flow of biogas recovered and fuelled (gas engine) at normal
conditions in the hour h
Source of data By project participant
Value of data ~ 509
Brief description of
measurement methods and
procedures to be applied
The volume of biogas will be measured with a normalised flow meter or
calculated from the volumetric flow of biogas pressure temperature
Biogas volume and methane content measurements shall be on the same
basis (wet or dry)
QAQC procedures to be
applied (if any) The biogas flow is monitored continuously recorded and stored
electronically in a data log file (DLF) (monthly or at shorter
interval)
Uncertainty level of data low
Maintenance and calibration as per manufacturer‟s specifications
or at least once every 3 years
Any comment
Data Parameter ID8 FVfuelledboilerh
Data unit Nm3 hour
Description Volumetric flow of biogas recovered and fuelled (boilers) at normal
conditions in the hour h
Source of data By project participant
Value of data ~ 0
Brief description of
measurement methods and
procedures to be applied
The volume of biogas will be measured with a normalised flow meter or
calculated from the volumetric flow of biogas pressure temperature
Biogas volume and methane content measurements shall be on the same
basis (wet or dry)
QAQC procedures to be
applied (if any) The biogas flow is monitored continuously recorded and stored
electronically in a data log file (DLF) (monthly or at shorter
interval)
Uncertainty level of data low
Maintenance and calibration as per manufacturer‟s specifications
or at least once every 3 years
Any comment
Data Parameter ID9 wCH4h
Data unit
Description Methane content in biogas in same basis (wetdry) as the biogas flows in
year y
Source of data By project participant using a gas analyzer
Value of data ~ 60
PROJECT DESIGN DOCUMENT FORM (CDM-SSC-PDD) - Version 03
CDM ndash Executive Board
38
Brief description of
measurement methods and
procedures to be applied
Using calibrated gas analyzer either continuous or periodical
measurement at confidenceprecision level of 9010
QAQC procedures to be
applied (if any) In case a continuous gas analyser is used data will be recorded
and stored electronically in a data log file (DLF) every hour or at
shorter interval
Uncertainty level of data low
Maintenance and calibration as per manufacturer‟s specifications
or at least once every 3 years
Any comment See also clarification by EB Meth Panel 30102009 ndash SSC_360
httpcdmunfcccintUserManagementFileStorageAM_CLAR_
QS83SX5B7WM6UGZE31JYQEQ4F65F6V
The biogas flow and the methane content measurements shall be
carried out close to each others
Data Parameter ID10 Tbiogas
Data unit ordmC
Description Temperature of biogas
Source of data Temperature probe
Value of data 20 ndash 65
Brief description of
measurement methods and
procedures to be applied
By project participant
QAQC procedures to be
applied (if any) Shall be measured and recorded at the same time when methane
content in biogas (ID8) is measured
Uncertainty level of data low
Maintenance and calibration as per manufacturer‟s specifications
or at least once every 3 years
Any comment Pressure and temperature are required to determine the density of
the methane If the biogas flow meter employed measures flow
pressure and temperature and displaysoutputs normalised flow of
biogas there is no need to separate monitoring of pressure and
temperature of the biogas
Data Parameter ID11 Pbiogas
Data unit Bar(g)
Description Pressure of biogas
Source of data By project participant
Value of data 50 ndash 200 mbar
Brief description of
measurement methods and
procedures to be applied
Pressure measurement device
QAQC procedures to be
applied (if any) Shall be measured and recorded at the same time when methane
content in biogas (ID8) is measured
Uncertainty level of data low
Maintenance and calibration as per manufacturer‟s specifications
or at least once every three (3) years
Any comment Pressure and temperature are required to determine the density of
the methane If the biogas flow meter employed measures flow
PROJECT DESIGN DOCUMENT FORM (CDM-SSC-PDD) - Version 03
CDM ndash Executive Board
39
pressure and temperature and displaysoutputs normalised flow of
biogas there is no need to separate monitoring of pressure and
temperature of the biogas
Shall be measured at the same time when methane content in
biogas (ID9) is measured
Parameter ID12 ηflareh (enclosed flare)
Unit
Description Enclosed flare efficiency in the hour h
Source of data Calculated
Value of data 0 or 50 or 90
Brief description of
measurement methods and
procedures to be applied
This yearly efficiency will be based on hourly flare efficiencies calculated
as per the provisions in the ldquoTool to determine project emissions from
flaring gases containing methanerdquo
The hourly flare efficiency will be calculated based on
0 if the temperature in the exhaust gas of the flare (Tflare) is
below 500 degC for more than 20 minutes during the hour h
50 if the temperature in the exhaust gas of the flare (Tflare) is
above 500 degC for more than 40 minutes during the hour h but the
manufacturer‟s specifications on proper operation of the flare are
not met at any point in time during the hour h
90 if the temperature in the exhaust gas of the flare (Tflare) is
above 500 degC for more than 40 minutes during the hour h and the
manufacturer‟s specifications on proper operation of the flare are
met continuously during the hour h
QAQC procedures to be
applied (if any) Data are logged hourly in a data log file (DLF)
Uncertainty level of data low
Any comment For enclosed flare
Or
Parameter ID13 ηflareh (open flare)
Unit
Description Flare efficiency in the hour h
Source of data Calculated
Value of data 0 or 50
Brief description of
measurement methods and
procedures to be applied
This yearly efficiency will be based on hourly flare efficiencies calculated
as per the provisions in the ldquoTool to determine project emissions from
flaring gases containing methanerdquo
The hourly flare efficiency will be calculated based on the duration of
time during which the flame is detected by the thermocouple (or flame
detector) installed in the open flare
Flare efficiency in hour h is based on default values
0 if the flame detected for not more than 20 minutes during the
hour h and
PROJECT DESIGN DOCUMENT FORM (CDM-SSC-PDD) - Version 03
CDM ndash Executive Board
40
50 if the flame detected for more than 20 minutes during the
hour h
A flame detector or thermocouple will be used
QAQC procedures to be
applied (if any) Data are logged hourly in a data log file (DLF)
Uncertainty level of data low
Any comment The only monitored parameter related to the flare is its efficiency Indeed
according to the clarification SSC_19927 of the methodology AMS IIIH
version 9 accepted by the SSC WG on the 3092008 ldquoIf a thermocouple
is used as a flame detection system it is sufficient to reach the given
minimum temperature from the manufacturer ldquo Hence it is not necessary
to monitor the temperature of the open type flares (Tflare)
Data Parameter ID14 ECPJjy
Data unit MWh
Description The yearly grid electricity consumption of the project activity for the year
bdquoy‟
Source of data Onsite instrument
Value of data ~749
Brief description of
measurement methods and
procedures to be applied
The grid electricity consumption of the project activity is measured
continuously with an energy meter (cumulative reading)
QAQC procedures to be
applied (if any) Data are monitored continuously and recorded periodically
(yearly or at shorter interval) in a data log file (DLF)
Uncertainty level of data low
Maintenance and calibration as per manufacturer‟s specifications
or at least once every three (3) years
Any comment
Data Parameter ID15 EGBLy
Data unit MWh
Description Quantity of net electricity generated and send to grid in year y
Source of data By project participant
Value of data ~ 6798
Brief description of
measurement methods and
procedures to be applied
The electricity generated and sent to grid is measured continuously with
an energy meter (cumulative readings)
QAQC procedures to be
applied (if any) Data are monitored continuously and recorded periodically
(yearly or at shorter interval) in a data log file (DLF)
Uncertainty level of data low
Maintenance and calibration as per manufacturer‟s specifications
or at least once every 3 years
Any comment As per AMS-ID
27 The clarification SSC_199 if available here (last access on the 24052011)
httpcdmunfcccintfilestorageAM_AM_CLAR_HIOZ5CS1PASC187C0JQ668L2E9RCRJResponse20WG20provided
20at20SSC20WG2017pdft=bU98MTMwNjIxNjY0OS4xMQ==|BOKHqtO94N6XF1N2N1vo8Ori-Rc=
PROJECT DESIGN DOCUMENT FORM (CDM-SSC-PDD) - Version 03
CDM ndash Executive Board
41
Or
Data Parameter ID16 EGmilly
Data unit MWh
Description Quantity of annual output of renewable energy sent to the mill in year y
Source of data By project participant
Value of data ~ 0
Brief description of
measurement methods and
procedures to be applied
The electricity generated and sent to mill to displace diesel use in diesel
gensets is measured continuously with an energy meter (cumulative
readings)
QAQC procedures to be
applied (if any) Data are monitored continuously and recorded periodically
(yearly or at shorter interval) in a data log file (DLF)
Uncertainty level of data low
Maintenance and calibration as per manufacturer‟s specifications
or at least once every 3 years
Any comment As per AMS-IA
Data Parameter ID17 Displacement of Biomass
Data unit Mt
Description Total amount of biomass (PKS) displaced from biomass boilers
Source of data Weighing bridge
Value of data Measurement at site
Brief description of
measurement methods and
procedures to be applied
Biomass (PKS) displaced due to the project activity will be weighed
using weighing bridge at the palm oil mill
QAQC procedures to be
applied (if any) Monthly calculation based on every single trip of trucks recorded
Data is recorded manually in a data log file based on the weighing
records
Maintenance and calibration as per manufacturer‟s specifications
Uncertainty level of data low
Any comment In the project activity the biomass (PKS) displaced will not be stored
under anaerobic conditions The conditions of onsite storage are identical
in the baseline as in the project activity The biomass will be sold to the
market on a regular basis PEbiomassy = 0
A final monitoring plan will be prepared prior the initial verification based on the as-built project activity
It will address the following aspects
MONITORING
The Project will be managed by CME with the involvement from Project Implementer CME will ensure
safety in operation of the plant as well as in the monitoring of emission reduction which is generated from
the project activity
CME will implement and be responsible for the monitoring plan Their responsibility covers operation of
the monitoring maintenance of the monitoring equipment data collection and archiving and
management of total scheme of the monitoring CME and Project Implementer will assign specific trained
PROJECT DESIGN DOCUMENT FORM (CDM-SSC-PDD) - Version 03
CDM ndash Executive Board
42
personnel during project implementation for the overall monitoring measurement and reporting of key
parameters as required in this PDD
DATA LOGGING AND STORAGE
The data measured by the instruments will be collected and stored in a data logging system The data will
be retrieved remotely by modem or directly on site
If data cannot be retrieved no emissions reductions will be claimed for the period of data failure The
data collected will be recorded in a central data base Access to production data will be restricted All
records and data (hard copy and soft copy) will be archived up to two years after the end of the crediting
period or the last issuance of CERs for this project activity whichever occurs later
CALIBRATION AND MAINTENANCE PROCEDURES MALFUNCTION OF EQUIPMENT
Maintenance includes all preventive and corrective actions necessary for the good functioning of the
equipment such as
Visual control of the equipment state and real-time check of displayed parameters
Cleaning up the equipment and the sensors
Adding lubricant
Replacement and change of defective parts
Calibration of equipment consists in verifying by comparison with a standard the accuracy of a
measuring instrument
Measuring instruments will be periodically and appropriately calibrated according to the procedures
timing and methods recommended by the manufacturer or nationalinternational standards as available
General malfunction of equipment
Daily inspections of the equipment will allow controlling equipment failure If equipment fails the
supplier will be notified and repairs will be carried out If the damaged equipment cannot be repaired it
will be replaced at the earliest In some cases portable tools will be used in order to carry out daily
monitoring of the missing parameter(s) In such case this data will be recorded manually
Discrepancies
To avoid discrepancies between projected data in the PDD and actual data (eg due to deferred starting
date malfunction of equipment) cross-checks between internal meter readings and external sources (eg
electricity invoices) will be carried out Any source of inconsistencies will be clarified
Case of emergency
For the case of emergency (earthquakes explosions fires etc) an emergency preparedness plan will be
adapted to the project activity All employees involved in the project on-site will be trained in the code of
conduct and required actions at time of commissioning of the plant
PROJECT DESIGN DOCUMENT FORM (CDM-SSC-PDD) - Version 03
CDM ndash Executive Board
43
OPERATIONAL AND MANAGEMENT STRUCTURE
The CDM monitoring team will be composed by the following staff
Position Report to
Operators
Project owner Supervisors (technicalmaintenance)
Operation Engineer
CDM monitoring project manager External CDM consultant
TRAINING OF MONITORING PERSONNEL
The maintenance will be conducted in-house by staff employed and trained by the Project Participants
Employees involved in the monitoring will be trained internally andor externally Training may include
inter alia
a) Review of equipment and captors
b) Calibration requirement
c) Configuration of monitoring equipment
d) Maintenance requirement
C1 Please indicate the level at which environmental analysis as per requirements of the CDM
modalities and procedures is undertaken Justify the choice of level at which the environmental
analysis is undertaken
radic Please tick if this information is provided at the PoA level In this case sections C2 and C3
need not be completed in this form
C2 Documentation on the analysis of the environmental impacts including transboundary
impacts
The host country does not require an analysis of environmental impacts As the project involves reduction
of GHG through recovery and controlled combustion which improves the quality of air therefore there
are no significant environmental impacts identified
C3 Please state whether an environmental impact assessment is required for a typical CPA
included in the programme of activities (PoA) in accordance with the host Party lawsregulations
In accordance with Malaysia environmental regulations Environmental Quality (Prescribed Activities
Environmental Impact Assessment) Order 1987 an Environmental Impact Assessment (EIA) is not
required for this CPA
PROJECT DESIGN DOCUMENT FORM (CDM-SSC-PDD) - Version 03
CDM ndash Executive Board
44
SECTION D Stakeholdersrsquo comments
D1 Please indicate the level at which local stakeholder comments are invited Justify the
choice
Please tick if this information is provided at the PoA level In this case sections D2 to D4 need
not be completed in this form
D2 Brief description how comments by local stakeholders have been invited and compiled
The stakeholder meeting was conducted at the office of Kilang Sawit Felda Triang on 05032012 There
were 37 stakeholders attending the consultation Posters were pasted at the guard house and at the
entrance to office 1 week before the stakeholder consultation to inform the locals stakeholders which
comprise mostly the workers of the mill 20 stakeholders out of the 37 who attended the consultation are
2nd generation of the Felda settlers who live in the vicinity to the project activity and adequately represent
the local community composed entirely of Felda settlers (no other people live in the vicinity of this
remote plantation) Continuous input of ideascomments were allowed to all stakeholders who could
either send their input though an email account especially setup for the biogas project or directly inform
the project proponents
During the meeting presentations were made by the project owner to outline the proposed project activity
in a non-technical manner (including environmental social and technological considerations) climate
change and the role of the CDM Attendees were given opportunity to raise their concern and opinion
about the proposed project activity during the question and answer session
D3 Summary of the comments received
PROJECT DESIGN DOCUMENT FORM (CDM-SSC-PDD) - Version 03
CDM ndash Executive Board
45
Below are the questions raised during the stakeholder meeting
NAME QUESTION
Mohd Tarmizi Bin Mat
Daud What is CDM in Bahasa Malaysia
Mohd Tarmizi Bin Mat
Daud What is DoE‟s standard for treated water released into river
Mohd Azizi Bin Abdul
Aziz
Would the biogas be captured from the existing effluent treatment ponds or a
new structure
Azhar Bin Abdul What to do with the captured biogas from the bioreactor
D4 Report on how due account was taken of any comments received
Below are the answers to the questions asked during the stakeholder meeting
QUESTION ANSWER
What is CDM in Bahasa Malaysia
The meaning of CDM in Bahasa Malaysia is Mekanisme
Pembangunan Bersih or in English is Clean Development
Mechanism
By Abd Karim Bin Mohd Zin
What is DoE‟s standard for treated
water released into river
The discharge standard for BOD into river is less than 100ppm
By Abd Karim Bin Mohd Zin
Would the biogas be captured from
the existing effluent treatment
ponds or a new structure
New bioreactor will be constructed to replace the existing anaerobic
lagoon treatment system The new bioreactor will capture the
biogas produced from this anaerobic treatment process
By Abd Karim Bin Mohd Zin
What to do with the captured
biogas from the bioreactor
The biogas recovered from the bioreactor will mainly contain
methane (approximately 60) and the rest are CO2 H2 and H2S
Currently the biogas is just released to the atmosphere from the
existing open lagoons system During the project activity captured
biogas will be combusted thus will improve the air quality
By Abd Karim Bin Mohd Zin
PROJECT DESIGN DOCUMENT FORM (CDM-SSC-PDD) - Version 03
CDM ndash Executive Board
46
Annex 1
CONTACT INFORMATION ON ENTITYINDIVIDUAL RESPONSIBLE FOR THE SMALL-
SCALE CPA
Organization Felda Palm Industries Sdn Bhd (359584-V)
StreetPOBox Jalan Gurney 1
Building Balai Felda 4th Floor
City Kuala Lumpur
StateRegion Wilayah Persekutuan
PostfixZIP 54000
Country Malaysia
Telephone (03) 2692 8066
FAX (03) 2693 4148
URL wwwfeldanetmy
Represented by
Title Head of Department
Salutation Mr
Last Name Busu
Middle Name
First Name Zainuri
Department Biomass
Mobile
Direct FAX
Direct tel
Personal E-Mail zainuribfeldanetmy
Organization Ably Carbon Sdn Bhd
StreetPOBox Jalan Ipoh Kecil
Building No 17
City Kuala Lumpur
StateRegion
PostfixZIP 50350
Country Malaysia
Telephone +60 3 4042 1177
FAX +60 3 4044 4166
E-Mail stephanevidailletably-carboncom
URL
Represented by Stephane Vidaillet
Title Chairman
Salutation Mr
Last Name Vidaillet
Middle Name
First Name Steacutephane
Department
Mobile +33 6 59111 5600
Direct FAX
PROJECT DESIGN DOCUMENT FORM (CDM-SSC-PDD) - Version 03
CDM ndash Executive Board
47
Direct tel
Personal E-Mail stephanevidailletably-carboncom
PROJECT DESIGN DOCUMENT FORM (CDM-SSC-PDD) - Version 03
CDM ndash Executive Board
48
Annex 2
INFORMATION REGARDING PUBLIC FUNDING
The project activity is not receiving any funding from parties included in Annex 1 of the Kyoto Protocol
SMALL-SCALE CDM PROGRAMME ACTIVITY DESIGN DOCUMENT FORM (CDM-SSC-CPA-DD) - Version 01
NAME TITLE OF THE PoA Biogas Recovery and Utilization PoA Projects in
Malaysia
CDM ndash Executive Board page 49
This template shall not be altered It shall be completed without modifyingadding headings or logo format or font
Annex 3
BASELINE INFORMATION
1 2
Year 2009 2010 2011 2012 2013 2014
FFB (mtyr) 343720 345910 310250 333293 333293 333293
POME Volume
(cumyr)[1] 343720 345910 310250 333293 333293 333293
Mill Opearing hour (hryr) 68865 69225 6209 6673 6673 6673
PKS (mtyr) 18905 19025 17064 18331 18331 18331
3 4 5 6 7 8 9 10
2015 2016 2017 2018 2019 2020 2021 2022
333293 333293 333293 333293 333293 333293 333293 333293
333293 333293 333293 333293 333293 333293 333293 333293
6673 6673 6673 6673 6673 6673 6673 6673
18331 18331 18331 18331 18331 18331 18331 18331
SMALL-SCALE CDM PROGRAMME ACTIVITY DESIGN DOCUMENT FORM (CDM-SSC-CPA-DD) - Version 01
NAME TITLE OF THE PoA Biogas Recovery and Utilization PoA Projects in
Malaysia
CDM ndash Executive Board page 50
This template shall not be altered It shall be completed without modifyingadding headings or logo format or font
10 days measurement campaign for baseline wastewater treatment system
Day Date
ETP
Inlet
Anaerobic
system (mgl)
Outlet
Anaerobic
system (mgl)
Outlet Algae
System (mgl)
Final
Discharge to
River (mgl)
1 23-Feb-12 35693 3120 811 603
2 25-Feb-12 19511 2559 1186 83
3 26-Feb-12 32864 2767 749 437
4 27-Feb-12 30195 2330 1210 404
5 28-Feb-12 32436 1927 1188 941
6 29-Feb-12 38259 4256 896 717
7 1-Mar-12 28717 3584 1232 695
8 3-Mar-12 31002 4660 1658 1210
9 4-Mar-12 22400 4346 1389 963
10 5-Mar-12 31226 4301 1971 1165
Average 30230 3385 1229 722
ETP
COD removal efficiency (anaerobic system) 8880
COD removal efficiency (Facultativealgae system) 6369
COD removal efficiency (Bio-polishing system) 4127
Total COD removal efficiency of the treatment system 9761
The COD of the raw effluent during ex-post may vary from the one year historical records depending on
the improvement of the production process (outside of project boundary) thus ERex-post may vary from the
estimated ERex-ante
SMALL-SCALE CDM PROGRAMME ACTIVITY DESIGN DOCUMENT FORM (CDM-SSC-CPA-DD) - Version 01
NAME TITLE OF THE PoA Biogas Recovery and Utilization PoA Projects in
Malaysia
CDM ndash Executive Board page 51
This template shall not be altered It shall be completed without modifyingadding headings or logo format or font
Annex 4
MONITORING INFORMATION
General information
Monitoring refers to the collection and archiving of all relevant data necessary for determining the
baseline measuring anthropogenic emissions by sources of greenhouse gases (GHG) within the project
boundary of a CDM project activity and leakage It includes developing suitable data collection methods
and data interpretation techniques for monitoring and verification of GHG emissions
On-line monitoring system
Most key meters required to determine GHG emissions and emission reductions will be monitored from a
central control point which will record meter readings at a pre-determined interval
Ensuring adequate maintenance and calibration of monitoring instruments
Specific maintenance repair or replacement of monitoring equipment will be recorded dated and
described
The calibration will occur at intervals determined on the basis of instrument manufacturers
recommendations stability purpose usage and history of repeatability Recalibration should be
performed whenever an event occurs that places the accuracy of the instrument in doubt
Calibration will take place at least once every three (3) years to ensure that the monitoring
equipments are properly installed and functioning properly
Calibration will be performed according to national or international standards
Last calibration certificates will be provided during periodic verification
Sampling procedure
Wherever a statistical sample is used for monitoring the ldquogeneral guidelines for sampling and surveys for
SSC project activitiesrdquo shall be used COD shall be measured from a composite sample to obtain a
representative value
Data archiving
The monitored data will be kept for a minimum of 2 years after the end of the crediting years by using
paper documents or electronic files
Identification of non-conformities
A verification of inconsistencies of the data recorded will be performed based for example on
The comparison of the calculated quantities of methane versus expected
Spot checks of field instruments (local reading) and data in the log file
Any discrepancies (completeness calculation errors transcription errors instrument calibration issues)
will be analyzed and actions taken to correct the problem
Ensuring adequate training of staff
All new staff members will undergo bdquoon job training‟ covering the monitoring requirements
The monitoring plan will be made available to staff member involved in the monitoring
A copy will be located in the control room at the site
SMALL-SCALE CDM PROGRAMME ACTIVITY DESIGN DOCUMENT FORM (CDM-SSC-CPA-DD) - Version 01
NAME TITLE OF THE PoA Biogas Recovery and Utilization PoA Projects in
Malaysia
CDM ndash Executive Board page 52
This template shall not be altered It shall be completed without modifyingadding headings or logo format or font
During the training the employees will sign a training attendance list All training records shall
be documented inclusive of training attendance training memo and training material if any
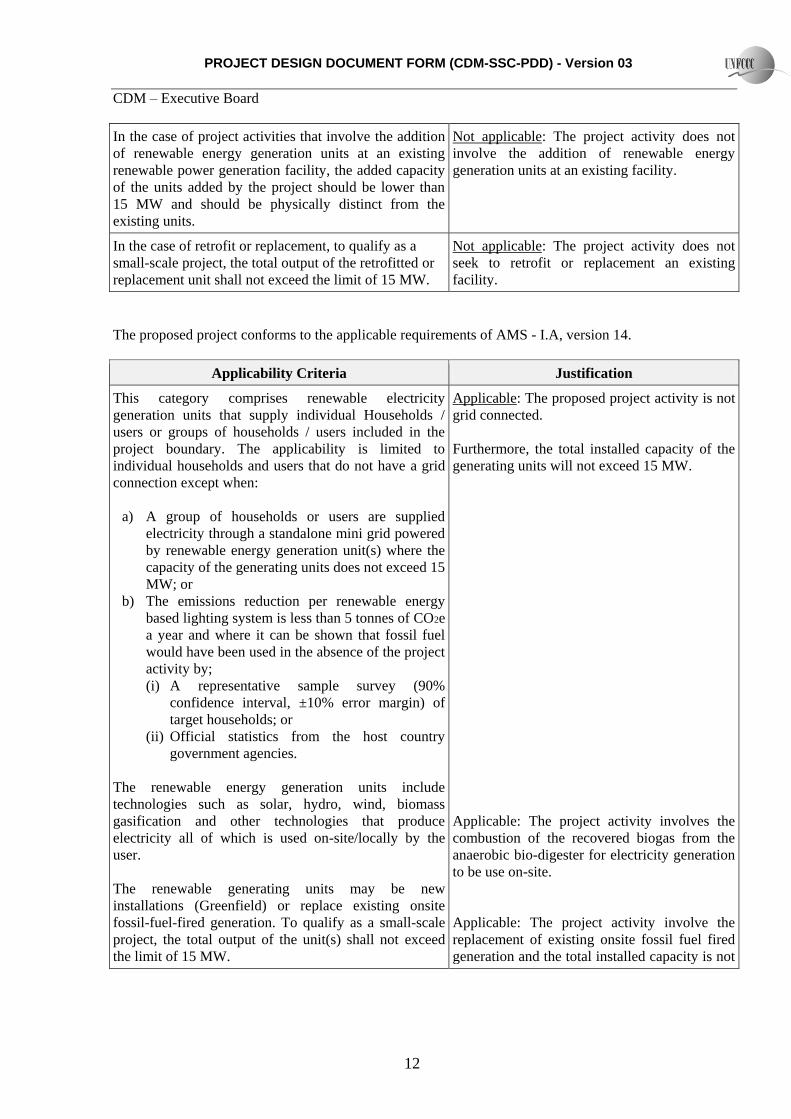
PROJECT DESIGN DOCUMENT FORM (CDM-SSC-PDD) - Version 03
CDM ndash Executive Board
12
In the case of project activities that involve the addition
of renewable energy generation units at an existing
renewable power generation facility the added capacity
of the units added by the project should be lower than
15 MW and should be physically distinct from the
existing units
Not applicable The project activity does not
involve the addition of renewable energy
generation units at an existing facility
In the case of retrofit or replacement to qualify as a
small-scale project the total output of the retrofitted or
replacement unit shall not exceed the limit of 15 MW
Not applicable The project activity does not
seek to retrofit or replacement an existing
facility
The proposed project conforms to the applicable requirements of AMS - IA version 14
Applicability Criteria Justification
This category comprises renewable electricity
generation units that supply individual Households
users or groups of households users included in the
project boundary The applicability is limited to
individual households and users that do not have a grid
connection except when
a) A group of households or users are supplied
electricity through a standalone mini grid powered
by renewable energy generation unit(s) where the
capacity of the generating units does not exceed 15
MW or
b) The emissions reduction per renewable energy
based lighting system is less than 5 tonnes of CO2e
a year and where it can be shown that fossil fuel
would have been used in the absence of the project
activity by
(i) A representative sample survey (90
confidence interval plusmn10 error margin) of
target households or
(ii) Official statistics from the host country
government agencies
The renewable energy generation units include
technologies such as solar hydro wind biomass
gasification and other technologies that produce
electricity all of which is used on-sitelocally by the
user
The renewable generating units may be new
installations (Greenfield) or replace existing onsite
fossil-fuel-fired generation To qualify as a small-scale
project the total output of the unit(s) shall not exceed
the limit of 15 MW
Applicable The proposed project activity is not
grid connected
Furthermore the total installed capacity of the
generating units will not exceed 15 MW
Applicable The project activity involves the
combustion of the recovered biogas from the
anaerobic bio-digester for electricity generation
to be use on-site
Applicable The project activity involve the
replacement of existing onsite fossil fuel fired
generation and the total installed capacity is not
PROJECT DESIGN DOCUMENT FORM (CDM-SSC-PDD) - Version 03
CDM ndash Executive Board
13
exceed 15 MW
Hydro power plants with reservoirs that satisfy at least
one of the following conditions are eligible to apply this
methodology
The project activity is implemented in an existing
reservoir with no change in the volume of
reservoir
The project activity is implemented in an existing
reservoir where the volume of reservoir is
increased and the power density of the project
activity as per definitions given in the Project
Emissions section is greater than 4 Wm2
The project activity results in new reservoirs and
the power density of the power plant as per
definitions given in the Project Emissions section
is greater than 4 Wm2
Not applicable The project activity is not a
hydro power plant
Combined heat and power (co-generation) systems are
not eligible under this category
Applicable There is no combined heat and
power component in the project activity
If the unit added has both renewable and non-renewable
components (eg a winddiesel unit) the eligibility
limit of 15 MW for a small-scale CDM project activity
applies only to the renewable component If the unit
added co-fires fossil fuel the capacity of the entire unit
shall not exceed the limit of 15 MW
Not applicable The project does not
incorporate a mix of renewable and non-
renewable components
Project activities that involves retrofit or replacement of
an existing facility for renewable energy generation are
included in this category To qualify as a small-scale
project the total output of the modified or retrofitted
unit shall not exceed the limit of 15 MW
Not applicable The project activity does not
seek to retrofit or replacement an existing
facility
In the case of project activities that involve the addition
of renewable energy generation units at an existing
renewable power generation facility the added capacity
of the units added by the project should be lower than
15 MW and should be physically distinct3 from the
existing units
Not applicable The project activity does not
involve the addition of renewable energy
generation units at an existing facility
B3 Assessment and demonstration of additionality of the small-scale CPA as per eligibility
criteria listed in the Registered PoA
In Malaysia Environmental Quality (Prescribed Premises) (Crude Palm Oil) Regulation 1977 governs
environmental considerations including the wastewater treatment and discharge at palm oil mills The
regulation stipulates the discharge standards for water discharge or land application The regulation
however does not specify the required treatment technologies for wastewater or GHG emissions from
wastewater treatment operations
PROJECT DESIGN DOCUMENT FORM (CDM-SSC-PDD) - Version 03
CDM ndash Executive Board
14
More than 85 of palm oil mills are utilizing open based anaerobic ponds and it is considered the
prevailing practice for oil palm industry to treat the POME The open anaerobic ponds system is an
effective and low-tech solution that can easily meet the water discharge limits applicable to the palm oil
industry9 10
There is no financial incentive for the palm oil mill owners to invest into methane capture projects
particularly when there is no requirement under existing pending or planned national state or local
regulatory This is partly related to the fact that there are a lot of attractive and competing investments in
the sector However the PP has undertaken to set up this project in order to reduce the GHG emissions
and contribute his mite to the global GHG emission reduction
The project is a small scale project activity As such the provisions of Attachment A to Appendix B of
the simplified modalities and procedures for small-scale CDM project activities will apply to this project
The bdquoindicative simplified baseline and monitoring methodologies for selected small-scale CDM project
activity categories‟ require the project proponents to demonstrate that the project activity would not have
occurred anyway due to at least one of the following barriers
a) Investment barrier a financially more viable alternative to the project activity would have led to
higher emissions
b) Technological barrier a less technologically advanced alternative to the project activity involves
lower risks due to the performance uncertainty or low market share of the new technology
adopted for the project activity and so would have led to higher emissions
c) Barrier due to prevailing practice prevailing practice or existing regulatory or policy
requirements would have led to the implementation of a technology with higher emissions
d) Other barriers without the project activity for another specific reason identified by the project
participant such as institutional barriers or limited information managerial resources
organizational capacity financial resources or capacity to absorb new technologies emissions
would have been higher
Subsequently in its 35th Meeting the EB had issued bdquoNon-binding best practice examples to demonstrate
additionality for SSC project activities‟ wherein EB had given best practice examples of each of the
aforementioned category of barriers
The project participant has chosen Investment Barrier to demonstrate the additionality which is discussed
in the following paragraphs
Investment barrier
The most important of all the barriers faced by the company is the investment barrier The investment
analysis reveals that the project is not financially attractive The additionality tool permits the use of
simple cost analysis or investment comparison analysis or benchmark analysis to demonstrate the
additionality of the project
9 SD 05 ndash Yeoh B G 2004 A Technical and Economic Analysis of Heat and Power Generation from Biomethanation of
Palm Oil Mill Effluent Electrcity Supply Industry in Transition Issues and Prospect for Asia 10 SD 06 ndash Eco-Ideal Consulting Sdn Bhd (Eco-Ideal) 2004 MEWCPTMDANIDA Study on Clean Development
Mechanism Potential in the Waste Sectors in Malaysia Unpublished
PROJECT DESIGN DOCUMENT FORM (CDM-SSC-PDD) - Version 03
CDM ndash Executive Board
15
As the project activity generates revenue (other than CDM revenue) by exporting the electricity to the
grid and from the likely sale of biomass andor saving from diesel usage at the mill which is being
displaced by biogas simple cost analysis cannot be used Of the remaining PP has chosen the benchmark
analysis to demonstrate the financial unattractiveness of the project activity without carbon credits
There is a national policy on Feed-In-Tariff (FiT) gazetted in June 201111
that gives comparative
advantages to less emissions-intensive technologies over more emissions-intensive technologies (E-
policy as national andor sectoral policies or regulations that give comparative advantages to less
emissions-intensive technologies over more emissions-intensive technologies)
This is very conservative as paragraph 7 6 (b) EB22 Annex 3 states that ldquoNational andor sectoral
policies or regulations hellip that have been implemented since the adoption by the COP of the CDM MampP
(decision 17CP7 11 November 2001) need not be taken into account in developing a baseline scenario
(ie the baseline scenario could refer to a hypothetical situation without the national andor sectoral
policies or regulations being in place) In absence of the FiT the prevailing electricity sales tariff to
consumers is RM 021 per kWh
Project IRR has been chosen as the financial indicator for the financial analysis of the project activity
The project IRR has to be compared with a benchmark rate of return to demonstrate the additionality of
the project The Guidelines on the Assessment of Investment Analysis (Version 05 point 12) states ldquoIn
cases where a benchmark approach is used the applied benchmark shall be appropriate to the type of IRR
calculated Local commercial lending rates or weighted average costs of capital (WACC) are appropriate
benchmarks for a project IRR Requiredexpected returns on equity are appropriate benchmarks for an
equity IRR Benchmarks supplied by relevant national authorities are also appropriate if the DOE can
validate that they are applicable to the project activity and the type of IRR calculation presentedrdquo
In line with the Guidelines on the Assessment of Investment Analysis (Version 05) a default value
for the expected returns on equity is selected as the benchmark with 1090 The logic of choosing this
rate as benchmark is that the project should yield a return at least equivalent to the expected returns of
equity to merit consideration
For making the investment analysis the following assumptions have been made
Table B2 Investment Analysis
Sl No Description Value
1
Budgeted CAPEX
- Bioreactor amp accessories
- Flaring system
- Boiler adaptation cost for burners
- Gas engine(s)
- KPSR consultancy cost
4350000
140670
205000
4630000
220000
Total 9545670
2
Annual maintenance costs are estimated based on a of CAPEX12
Bioreactor (3 of CAPEX) = MYR 130500
Gas engine(s) (5 of CAPEX) = MYR 231500
3 Corporate tax ()13 25
11 httpwwwmbipvnetmydloadFiT20Handbook20Englishpdf 12 SD 05 ndash Maintenance cost (SIRIM Environmental and Bioprocess Technology Centre of Malaysia)
PROJECT DESIGN DOCUMENT FORM (CDM-SSC-PDD) - Version 03
CDM ndash Executive Board
16
Since losses can be carried forward indefinitely (so long as the ownership
remains unchanged) the incidence of taxation does not arise in the case of
this project activity
4
Manpower cost has been estimated based on 1 supervisor 2 operators 1
chargeman envisaged to be appointed and the ruling wagesalary structure
of the company14
182588 MYR yr
5 Salary increment rate has been applied based on the average expected
salary increment rate for year 20101115 40
6 Price of Biomass ex-factory (PKS) 156 MYRmt
7 Price of diesel 220 MYRliter
8 RE tariff export to grid (MYRkWh) 021
9
Laboratory Cost is estimated based on the quotations from accredited
laboratory anticipated number of tests and samples to be carried out and
transportation cost during the running and operating of the biogas plant for
maintaining optimum operating conditions
1920 MYR yr
10 Insurance premium per year ( of CAPEX)16 0412
11 Estimate of CER price (EUR) 8
12
Depreciation of equipment (years) has been provided as per the Inland
Revenue Authority regulations17 Since the project consists of only
environmental protection equipment it is entitled to initial capital
allowance of 40 and annual capital allowance of 20 as per the Inland
Revenue Authority notifications
4 years
13 Project life time for IRR calculation18 20 years
14
Residual value a fair value (5) of the project activity assets at the end of
the assessment period as per the Guidelines on The Assessment of
Investment Analysis version 05 EB 62
MYR 466284
Based on the above assumption the project IRR works out to be ndash 085 in contrast to the benchmark
rate of 1090 Thus the analysis proves that the project is not financially attractive
Sensitivity Analysis
A sensitivity analysis has also been conducted to test the robustness of the conclusions drawn Four (4)
factors have been identified as critical to IRR of the project viz project cost maintenance costs RE
tariff The results of sensitivity analysis are given below
13 SD 08 ndash Malaysian Tax and Business Booklet 201011 Page 12
httpwwwpwccomen_MYmyassetspublicationstaxbooklet1011pdf 14 SD 3 - Salary structure (biogas plant) 15 SD 09 - Salary increment rate (201011) 16 SD 2 - Biogas plant insurance policy 17 SD 08 ndash Malaysian Tax and Business Booklet 201011 Page 21
httpwwwpwccomen_MYmyassetspublicationstaxbooklet1011pdf 18 As per the Guidelines on the Assessment of Investment Analysis version 05 (Annex 5 EB 62 point 3) ldquoIn general a
minimum period of 10 years and a maximum of 20 years will be appropriaterdquo PP has chosen 20 years for financial
assessment as it is conservative
PROJECT DESIGN DOCUMENT FORM (CDM-SSC-PDD) - Version 03
CDM ndash Executive Board
17
Table B3 Sensitivity Analysis
FACTORS PROJECT IRR
-10 0 +10
Project cost -185 -085 033
Maintenance cost -491 -085 189
RE tariff 112 -085 -354
It could be seen from the above that even under the most optimistic conditions the project activity would
not yield a positive IRR let alone crossing the benchmark Therefore the project is not a business-as-
usual scenario and it is additional
Prior Consideration of CDM
As per the guidance of EB Meeting Report 49 Annex 22 the project proponent notified the UNFCCC and
the DNA of the intent to implement the project as a CDM project activity
Conclusion
The conclusion of the investment analysis remains identical to reasonable variations of the critical
assumptions (sensitivity analysis) Therefore the project activity IRR remains lower than the benchmark
In the above background it is proved that the project faces an investment barrier that establishes the
additionality
B4 Description of the sources and gases included in the project boundary and proof that the
small-scale CPA is located within the geographical boundary of the registered PoA
The emission sources and type of GHG which are included or excluded within the project boundary are
shown in the following table
Table B4 Emission Sources and Type of GHG
Source Gas Included Justification Explanation
Ba
seli
ne
Direct emissions
from the
wastewater
treatment processes
CO2 No Neutral CO2 emissions from biomass decaying
CH4 Yes Methane emissions from open lagoons treatment
process
N2O No Not significant Excluded for simplification and
conservativeness
Diesel usage in
diesel genset at mill
CO2 Yes CO2 emissions from combustion of diesel fuel
CH4 No Not significant Excluded for simplification and
conservativeness
N2O No Not significant Excluded for simplification and
conservativeness
Pro
ject
Act
ivit
y
Bio-digester
CO2 No Neutral CO2 emissions from biomass decaying
CH4 Yes Methane emissions from anaerobic treatment process
N2O No Not significant Excluded for simplification and
conservativeness
Existing
wastewater
treatment lagoons
CO2 No Neutral CO2 emissions from biomass decaying
CH4 Yes Methane emissions from poorly managed treatment
process (without aerators)
PROJECT DESIGN DOCUMENT FORM (CDM-SSC-PDD) - Version 03
CDM ndash Executive Board
18
(Facultative amp
algae system) N2O No
Not significant Excluded for simplification and
conservativeness
Gas engine(s)
(biogas
combustion)
CO2 No Neutral CO2 emissions from biogas combustion
CH4 No Not significant and excluded from calculation
Biogas combustion efficiency is considered 10019
N2O No Not significant Excluded for simplification and
conservativeness
Biomass Boiler(s)
(Biogas
combustion)
CO2 No Neutral CO2 emissions from biogas combustion
CH4 No Not significant and excluded from calculation
Biogas combustion efficiency is considered 10020
N2O No Not significant Excluded for simplification and
conservativeness
Grid electricity
consumption from
national grid
CO2 Yes CO2 emissions from grid energy
CH4 No Not significant Excluded for simplification and
conservativeness
N2O No Not significant Excluded for simplification and
conservativeness
Enclosed or Open
flaring system
CO2 No Neutral CO2 emissions from biogas combustion
CH4 Yes CH4 emissions due to incomplete combustion in
enclosed flare
N2O No Not significant Excluded for simplification and
conservativeness
The CPA is implemented at the address below
Kilang Sawit Felda Triang Triang Pahang Malaysia
The site is located at state of Pahang Malaysia with GPS coordinates 3 16152 N 102 34567 E or
32692 1025761 (refer also Section A412) and thus is located within the geographical boundary of the
PoA
B5 Emission reductions
B51 Data and parameters that are available at validation
Data Parameter GWPCH4
Data unit tCO2tCH4
Description Global Warming Potential the equivalent in CO2 of the effect of methane
gas to the atmosphere
Source of data used IPCC 2006
Value applied 21
Justification of the choice of
data or description of
measurement methods and
procedures actually applied
Global warming potential for methane gas since this is a methane
capture project
19 AMS-IIIH para 35 20 AMS-IIIH para 35
PROJECT DESIGN DOCUMENT FORM (CDM-SSC-PDD) - Version 03
CDM ndash Executive Board
19
Any comment
Data Parameter MCFwwtreatmentBL1
Data unit Fraction
Description Methane correction factor for baseline wastewater anaerobic treatment
systems
Source of data used Table IIIH1 AMS IIIH version 16
Value applied 08
Justification of the choice of
data or description of
measurement methods and
procedures actually applied
Table IIIH1 for baseline emission The lagoons depth are more than 2m
MCF value of 08 for anaerobic deep lagoon (depth gt 2 m)
Any comment
Data Parameter MCFwwtreatmentBL2
Data unit Fraction
Description Methane correction factor for baseline wastewater aerobic treatment
systems
Source of data used Methane correction factor for baseline aerobic wastewater treatment
system (poorly managed)
Value applied Table IIIH1 AMS IIIH version 16
Justification of the choice of
data or description of
measurement methods and
procedures actually applied
03
Any comment No aerators installed
Data Parameter MCFwwBLdischarge
Data unit Fraction
Description Methane correction factor based on discharge pathway in the baseline
situation
Source of data used Table IIIH1 AMS IIIH version 16
Value applied 01
Justification of the choice of
data or description of
measurement methods and
procedures actually applied
Table IIIH1 for baseline emission The final discharge of treated
effluent into river MCF value of 01 for river discharge
Any comment
Data Parameter Bo ww
Data unit kgCH4 kgCOD
Description Methane generation capacity of treated wastewater
Source of data used IPCC 2006
Value applied 025
Justification of the choice of
data or description of
measurement methods and
procedures actually applied
Default value as prescribed in the methodology
Any comment
PROJECT DESIGN DOCUMENT FORM (CDM-SSC-PDD) - Version 03
CDM ndash Executive Board
20
Data Parameter UFBL
Data unit -
Description Model correction factor to account for model uncertainties (baseline)
Source of data used AMS IIIH version 16
Value applied 089
Justification of the choice of
data or description of
measurement methods and
procedures actually applied
As per methodology AMS-IIIH point 24
Any comment -
Data Parameter UFPJ
Data unit -
Description Model correction factor to account for model uncertainties (project
activity)
Source of data used AMS IIIH version 16
Value applied 112
Justification of the choice of
data or description of
measurement methods and
procedures actually applied
As per methodology AMS-IIIH point 30(a)
Any comment -
Data Parameter CFEww
Data unit Fraction
Description Capture efficiency of the biogas recovery equipment in the wastewater
treatment system
Source of data used AMS IIIH version 16
Value applied 09
Justification of the choice of
data or description of
measurement methods and
procedures actually applied
A default value of 09 has been used as per the guidance in the
methodology
Any comment
Data Parameter MCF ww treatmentPJ1
Data unit Fraction
Description Methane correction factor for the project wastewater anaerobic treatment
system equipped with biogas recovery equipment
Source of data used Table IIIH1 AMS IIIH version 16
Value applied 08
Justification of the choice of
data or description of
measurement methods and
procedures actually applied
The lagoons depth are more than 2 m MCF values in table IIIH1 has
been used as per the guidance in the methodology (depth gt 2 m)
Any comment
Data Parameter MCF ww treatmentPJ2
PROJECT DESIGN DOCUMENT FORM (CDM-SSC-PDD) - Version 03
CDM ndash Executive Board
21
Data unit Fraction
Description Methane correction factor for the project wastewater aerobic treatment
system not equipped with biogas recovery equipment
Source of data used Table IIIH1 AMS IIIH version 16
Value applied 03
Justification of the choice of
data or description of
measurement methods and
procedures actually applied
Aerobic treatment poorly managed
Any comment
Data Parameter MCFwwPJdischarge
Data unit Fraction
Description Methane correction factor based on discharge pathway in the project
activity
Source of data used Table IIIH1 AMS IIIH version 16
Value applied 01
Justification of the choice of
data or description of
measurement methods and
procedures actually applied
Table IIIH1 for project emission The final discharge of treated effluent
into river MCF value of 01 for river discharge
Any comment Same discharge pathway as in the baseline
Data Parameter CODBL1
Data unit
Description COD removal efficiency of the baseline system (anaerobic treatment
system)
Source of data used 10 days measurement campaign
Value applied Anaerobic Treatment system 8880
Justification of the choice of
data or description of
measurement methods and
procedures actually applied
One year historical data not available
Any comment This data will be used for ex post emission reduction calculation
Data Parameter CODBL2
Data unit
Description COD removal efficiency of the baseline system (aerobic treatment
system)
Source of data used 10 days measurement campaign
Value applied Aerobic Treatment system 6369
Justification of the choice of
data or description of
measurement methods and
procedures actually applied
One year historical data not available
Any comment This data will be used for ex post emission reduction calculation
Data Parameter NCVCH4
Data unit MJkg
PROJECT DESIGN DOCUMENT FORM (CDM-SSC-PDD) - Version 03
CDM ndash Executive Board
22
Description Net Calorific Value of methane
Source of data used IPCC 2006 Default Value
Value applied 504
Justification of the choice of
data or description of
measurement methods and
procedures actually applied
IPCC 2006 value is used Volume 2 Chapter 1 Table 12
Any comment
Data Parameter NCVFF
Data unit MJkg
Description Net Calorific Value of diesel
Source of data used IPCC 2006 Default Value
Value applied 430
Justification of the choice of
data or description of
measurement methods and
procedures actually applied
IPCC 2006 value is used Volume 2 Chapter 1 Table 12
Any comment
Data Parameter EFCO2diesel
Data unit tCO2MWh
Description CO2 emission factor diesel genset
Source of data used AMS-IA version 14 point 14
Value applied 08
Justification of the choice of
data or description of
measurement methods and
procedures actually applied
Default value for diesel generation unit
Any comment
Data Parameter Grid Emission Factor
Data unit kgCO2ekWh
Description Emission factor for grid electricity in Peninsular Malaysia
Source of data used Pusat Tenaga Malaysia March 2010
Value applied 0672
Justification of the choice of
data or description of
measurement methods and
procedures actually applied
As per AMS-ID point 12
Any comment Study on Grid Connected Electricity Baselines in Malaysia 2008
B52 Ex-ante calculation of emission reductions
The ex ante emission reductions are calculated based on AMS-IIIH version 16 as per equations
explained in section E62 of PoA-DD Biogas PoA in Malaysia
PROJECT DESIGN DOCUMENT FORM (CDM-SSC-PDD) - Version 03
CDM ndash Executive Board
23
Calculation for AMS-IIIH
Baseline emissions
Source of baseline emissions Reference Applicable
(YN)
Comments
Wastewater and sludge treatment
systems equipped with a biogas
recovery facility shall be excluded
from the baseline
AMS-IIIH
Point 17
N No biogas recovery in the
baseline
Emissions on account of electricity or
fossil fuel used (BEpowery)
AMS-IIIH
Point 18 (i)
N For conservativeness no
emissions due to electricity or
fossil fuel will be claimed
BEpowery = 0
Methane emissions from baseline
wastewater treatment systems
(BEwwtreatmenty)
AMS-IIIH
Point 18 (ii)
Y Baseline includes anaerobic and
aerobic treatment conditions with
different MCF values selected as
per Table IIIH1
Methane emissions from baseline
sludge treatment systems (BEstreatmenty)
= 0
AMS-IIIH
Point 18 (iii)
N The baseline plant corresponds to
scenario Para 1(f) without sludge
treatment BEstreatmenty = 0
Methane emissions on account of
inefficiencies in the baseline
wastewater treatment systems and
presence of degradable organic carbon
in the treated wastewater discharged
into river (BEwwdischargey)
AMS-IIIH
Point 18 (iv)
Y Treated effluent is currently
discharged into the river
Methane emissions from the decay of
the final sludge generated by the
baseline treatment systems (BEsfinaly)
AMS-IIIH
Point 18 (v)
N Zero because in the baseline final
sludge used for soil application
BEsfinaly = 0
A) Calculation of baseline emissions
BEy = BEwwtreatmenty + BEwwdischargey
Abbreviation Description Value Source
BEy Baseline emissions in year y (tCO2e) 30762 Calculated
BEpowery Baseline emissions of diesel genset in year
y tCO2eyear 0 Calculated
BEwwtreatmenty Baseline emissions of the wastewater
treatment systems tCO2eyear 30663 Equation 2
BEwwdischargey
The methane emissions from degradable
organic carbon in treated wastewater
discharged tCO2eyear
100 Equation 6
A1) Baseline emissions
PROJECT DESIGN DOCUMENT FORM (CDM-SSC-PDD) - Version 03
CDM ndash Executive Board
24
Equation 2 BEwwtreatmenty = Qwwy (CODinflow1 y CODBL1 MCFwwtreatmentBL1) +
(CODinflow2y CODBL2 MCFwwtreatmentBL2) Boww UFBL GWPCH4
Abbreviation Description Value Source
BEwwtreatmenty Baseline emissions of the wastewater
treatment systems (tCO2eyear) 30663 Calculated
Qwwy Volume of wastewater treated in baseline
wastewater treatment system i in year y
(m3year)
333293
Volume based on 10 m3mt
FFB21 amp FFB historical data
(2009 ndash 2011)
CODinflow1y Chemical oxygen demand of the
wastewater inflow to the baseline treatment
system (anaerobic) in year y (tCOD m3)
0026905 10 days measurement
campaign
CODBL1 COD removal efficiency of the baseline
treatment system (anaerobic) () 8880
10 days measurement
campaign
CODinflow2y Chemical oxygen demand of the
wastewater inflow to the baseline treatment
system (aerobic) in year y (tCOD m3)
0003013 10 days measurement
campaign
CODBL2 COD removal efficiency of the baseline
treatment system (aerobic) () 6369
10 days measurement
campaign
MCFwwtreatmentBL 1 Methane correction factor for baseline
wastewater anaerobic treatment systems 08
MCF values as per table
IIIH1 anaerobic gt 2m
MCFwwtreatmentBL2 Methane correction factor for baseline
wastewater aerobic treatment systems 03
MCF values as per table
IIIH1 ndash poorly managed
Boww Methane producing capacity of the
wastewater (kg CH4kg COD) 025
IPCC 2006
UFBL Model correction factor to account for
model uncertainties 089
IPCC 2006
GWPCH4 Global Warming Potential for methane 21 IPCC 2006
A2) The methane emissions from degradable organic carbon in treated wastewater discharged
Equation 6 BEwwdischargey = Qwwy GWPCH4 Boww UFBL CODwwdischarge BLyMCFww BLdischarge
Abbreviation Description Value Source
BEwwdischargey
The methane emissions from degradable
organic carbon in treated wastewater
discharged (tCO2eyear)
100 Calculated
Qwwy Volume of treated wastewater discharged
in year y (m3year) 333293
Volume based on 10 m3mt
FFB22 amp FFB historical data
(2009 ndash 2011)
GWPCH4 Global warming potential of methane 21 IPCC 2006
Boww Methane producing capacity of the treated
wastewater (kgCH4 kgCOD) 025 IPCC 2006
21 Mill designed data for baseline effluent treatment plant 22 Mill designed data for baseline effluent treatment plant
PROJECT DESIGN DOCUMENT FORM (CDM-SSC-PDD) - Version 03
CDM ndash Executive Board
25
UFBL Model correction factor to account for
model uncertainties 089 IPCC 2006
CODwwdischarge BLy Chemical oxygen demand of the treated
wastewater discharged into sea river or
lake in the baseline situation in the year y
(tonnesm3)
0000642 10 days measurement
campaign
MCFwwBLdischarge Methane correction factor based on
discharge pathway in the baseline situation
(eg into sea river or lake) of the
wastewater (fraction)
01 MCF values as per table
IIIH1 version 16
Project activity emissions
The project activity emission sources as per the methodology and their relevance with respect to the
proposed CDM project activity are given below in a tabular format
Source of project activity
emission Reference
Applicable
(YN) Comments
CO2 emissions on account of
power and fossil fuel used by
the project activity facilities
(PEpowery)
AMS-IIIH
point 29(i)
Y The project activity uses the electricity
imported from the national grid
Methane emissions from
wastewater treatment systems
affected by the project
activity and not equipped with
biogas recovery in the project
situation (PEwwtreatmenty)
AMS-IIIH
point 29 (ii)
Y CH4 emissions from the poorly managed
aerobic lagoons
Methane emissions from
sludge treatment systems
affected by the project
activity and not equipped with
biogas recovery in the project
situation (PEstreatmenty)
AMS-IIIH
point 29 (iii)
N The project activity corresponds to
scenario (vi) without sludge treatment
PEystreatmenty = 0
Methane emissions on account
of inefficiency of the project
activity wastewater treatment
systems and presence of
degradable organic carbon in
treated wastewater
(PEwwdischargey)
AMS-IIIH
point 29 (iv)
Y Treated effluent from ETP will be
discharged into river
Methane emissions from the
decay of the final sludge
generated by the project
activity treatment systems
(PEsfinaly)
AMS-IIIH
point 29 (v)
N In the proposed CDM project activity
final sludge is used for soil application in
the same manner as in the baseline
PEsfinaly = 0
PROJECT DESIGN DOCUMENT FORM (CDM-SSC-PDD) - Version 03
CDM ndash Executive Board
26
Methane fugitive emissions on
account of inefficiencies in
capture systems (PEfugitivey)
AMS-IIIH
point 29 (vi)
Y Applicable to PEfugitivewwy
N The project activity corresponds to
scenario (vi) without sludge treatment
PEfugitivesy = 0
Methane emissions due to
incomplete flaring (PEflaringy)
AMS-IIIH
point 29 (vii)
Y Enclosed flaring system installed
Methane emissions from
biomass stored under
anaerobic conditions which
does not take place in the
baseline situation (PEbiomassy)
AMS-IIIH
point 29
(viii)
N In the project activity the biomass (PKS
+ mesocarp fibres) displaced will not be
stored under anaerobic conditions The
conditions of onsite storage are identical
in the baseline as in the project activity
The biomass will be sold to the market
on a regular basis PEbiomassy = 0
B) Calculation of project emissions
PEy = PEpowery + PEwwtreatmenty + PEww discharge y + PEfugitive y + PEflaring y
Abbreviation Description Value Source
PEy Project activity emissions in the year y
(tCO2eyr) 6050 Equation 8
PEpowery CO2 emissions on account of power used
by the project activity facilities (tCO2eyr) 604 -
PEwwtreatmenty Methane emissions from wastewater
treatment systems affected by the project
activity and not equipped with biogas
recovery in year y (tCO2eyr)
1523 Equation 9
PEwwdischargey
Methane emissions on account of
inefficiency of the project activity
wastewater treatment systems and presence
of degradable organic carbon in treated
wastewater (tCO2eyr)
126 Equation 12
PEfugitivey Methane fugitive emissions on account of
inefficiencies in capture systems (tCO2eyr) 3796 Equation 15
PEflaringy Methane emissions due to incomplete
flaring (tCO2eyr) 0 Equation 19
B1) Project emissions from CO2 emissions on account of power and fuel used by the project activity
facilities in year ldquoyrdquo in tCO2eyear
PEpowery = ECPJjy EFgridy
Abbreviation Description Value Source
PEpowery Project emissions from electricity
consumption in the year y (tCO2eyr) 604 Calculated
ECPJjy Internal power consumption from the grid 749 100 kW is the effective
PROJECT DESIGN DOCUMENT FORM (CDM-SSC-PDD) - Version 03
CDM ndash Executive Board
27
(MWh year) power based on the
equipments installed at the
site
EFgridy Grid Emission factor in Peninsular
Malaysia 2008 (tCO2 MWh) 0672
Study on Grid Connected
Electricity Baselines in
Malaysia 2008 published in
2010 by PTM
B2) Methane emissions from wastewater treatment systems affected by the project activity and not
equipped with biogas recovery in the project situation in year ldquoyrdquo in tCO2e
Equation 9 PEwwtreatment y = Qwwky CODinflowk y PJky MCFwwtreatmentPJk) Boww UFPJ GWPCH4
Abbreviation Description Value Source
PEwwtreatmenty
Methane emissions from wastewater
treatment systems affected by the project
activity and not equipped with biogas
recovery in the project situation (tCO2eyr)
1523 Calculated
Qwwky Volume of wastewater treated in project
activity wastewater treatment system k in
year y (m3year)
333293
Volume based on 10 m3mt
FFB23 amp FFB historical data
(2009 ndash 2011)
CODinflowky Chemical oxygen demand of the
wastewater inflow to the project activity
treatment system k in year y (tonnes COD
m3)
0002690 10 days measurement
campaign
PJky Chemical oxygen demand removal
efficiency of the project wastewater
treatment system k in year y (tm3)
measured based on inflow COD and
outflow COD in system k
90 Based on bio-digester COD
removal efficiency of 90
MCFwwtreatmentPJk Methane correction factor for project
wastewater treatment system k (MCF
values as per table IIIH1)
03
MCF values table IIIH1
Version 16 ndash aerobic poorly
managed (conservative)
Boww Methane generation capacity of the treated
wastewater (kg CH4kg COD) 025 IPCC 2006
UFPJ Model correction factor to account for
model uncertainties 112
IPCC 2006
GWPCH4 Global warming potential of methane 21 IPCC 2006
23 Mill designed data for baseline effluent treatment plant
PROJECT DESIGN DOCUMENT FORM (CDM-SSC-PDD) - Version 03
CDM ndash Executive Board
28
B3) Methane emissions on account of inefficiency of the project activity wastewater treatment
systems and presence of degradable organic carbon in treated wastewater in the year ldquoyrdquo (tonnes)
Equation 12 PEwwdischarge y = Qwwy GWPCH4 Boww UFPJ CODwwdischargePJy MCFwwPJdischarge
Abbreviation Description Value Source
PEwwdischargey
Methane emissions from degradable
organic carbon in treated wastewater
(tCO2eyr)
126 Calculated
Qwwy Quantity of wastewater treated in year y
(m3year) 333293
Volume based on 10 m3mt
FFB24 amp FFB historical data
(2009 ndash 2011)
CODwwdischargedPJ
y
Chemical oxygen demand of the treated
wastewater discharged into river in the
project situation in year y (tCOD m3)
0000642 10 days measurement
campaign
MCFwwPJ discharge
Methane correction factor based on
discharge pathway in the project situation
(river) of the wastewater (fraction)
01 MCF values as per table
IIIH1 Version 16
Boww Methane generation capacity of the treated
wastewater (kg CH4kg COD) 025 IPCC 2006
UFPJ Model correction factor to account for
model uncertainties 112 IPCC 2006
GWPCH4 Global warming potential of methane 21 IPCC 2006
B41) Methane fugitive emissions on account of inefficiencies in capture systems in the year ldquoyrdquo
(tonnes)
Equation 15 PEfugitivewwy = (1 ndash CFEww ) MEPywwtreatment GWPCH4
Abbreviation Description Value Source
PEfugitivey Methane fugitive emissions on account of
inefficiencies in capture systems (tCO2eyr) 3796 Calculated
CFEww Capture efficiency of the biogas recovery
equipment in the wastewater treatment
systems
09 AMS IIIH Version 16
MEPywwtreatment Methane emission potential of wastewater
treatment systems equipped with biogas
recovery system in year y (tCH4yr)
1808 Refer Equation 11 of AMS
IIIH version 16
GWPCH4 Global warming potential of methane 21 IPCC 2006
B42) Methane emission potential of wastewater treatment plant in the year ldquoyrdquo (tonnes)
Equation 16 MEPwwtreatmenty = Qwwy Boww UFPJ (CODremovedPJky MCFwwtreatmentPJk)
24 Mill designed data for baseline effluent treatment plant
PROJECT DESIGN DOCUMENT FORM (CDM-SSC-PDD) - Version 03
CDM ndash Executive Board
29
Abbreviation Description Value Source
MEPwwtreatmenty Methane emission potential of wastewater
treatment systems equipped with biogas
recovery system in year y (tonnes CH4yr)
1808 Calculated
Qyww Quantity of wastewater treated in year y
(m3year) 333293
Volume based on 10 m3mt
FFB25 amp FFB historical data
(2009 ndash 2011)
Boww Methane generation capacity of the treated
wastewater (kg CH4kg COD) 025 IPCC 2006
CODremovedPJy
The chemical oxygen demand removed by
the treatment anaerobic system of the
project activity equipped with biogas
recovery in the year y (tCOD m3)
0024214
10 days measurement
campaign amp bio-digester
design parameter
MCFwwtreatmentPJ
Methane correction factor for the project
wastewater treatment system k equipped
with biogas recovery equipment
08 MCF values as per table
IIIH1 Version 16
UFPJ Model correction factor to account for
model uncertainties 112 IPCC 2006
B5) Methane emissions due to incomplete flaring in the year ldquoyrdquo (tonnes)
Equation 13a PEflaringy = TMflaredy (1 - ηflarey) GWPCH4
Abbreviation Description Value Source
PEflaringy Methane emissions due to incomplete
flaring (tCO2eyr) 0 Calculated
TMflaredh Mass flow rate of methane flared in dry
basis in the hour h (tCH4 yr) 0 Calculated
ηflarey Flare efficiency in hour h based on default
values 50
Tools for methane flaring
(open flare) for conservative
GWPCH4 Global warming potential of methane 21 IPCC 2006
Leakage emissions
No leakage emission will occur in the project activity
LEy1 = 0
Emission reductions
Equation 22 ERy ex ante = BEy ex ante ndash (PEy ex ante + LEy ex ante)
25 Mill designed data for baseline effluent treatment plant
PROJECT DESIGN DOCUMENT FORM (CDM-SSC-PDD) - Version 03
CDM ndash Executive Board
30
Abbreviation Description Value Source
ERy1 ex ante Ex ante emission reduction in year y
(tCO2e) 24712 Equation 22
BEy1 ex ante Ex ante baseline emissions in year y
(tCO2e) 30762 Equation 1
PEy1 ex ante Ex ante project emissions in year y (tCO2e) 6050 Equation 8
LEy1 ex ante Ex ante Leakage emissions in year y
(tCO2e) 0 -
Calculation for AMS-ID
Baseline emissions
Electricity generated from biogas engines will be exported to the Peninsular Malaysia National Grid The
baseline emissions are described in AMS-ID (Version 17 EB 61) as the ldquoproduct of electrical energy
baseline expressed in kWh of electricity produced by the renewable energy generating unit multiplied by
an emission factorrdquo
Baseline emissions due to electricity exported to the grid in the year ldquoyrdquo (tonnes)
BEEGy = EGBLy EFCO2gridy
Abbreviation Description Value Source
BEEGy Baseline emissions in year y (tCO2eyr) 4568 Calculated
EGBLy
Quantity of net electricity supplied to the
grid as a result of the implementation of the
project activity in year y (kWh yr)
6797625 Calculated
EFCO2gridy
CO2 emission factor of the grid in year
(tCO2kWh) 0672
Study on Grid Connected
Electricity Baselines in
Malaysia 2008 published in
2010 by PTM
Project Activity Emissions
As per AMS-ID (Version 17 EB 61) project emissions for renewable energy project activities are zero
PEEGy = 0
Leakage
If the energy generating equipment is transferred from another activity leakage is to be considered
No leakage emission will occur in the project activity LEy = 0
PROJECT DESIGN DOCUMENT FORM (CDM-SSC-PDD) - Version 03
CDM ndash Executive Board
31
Emission reductions
ERy = BEy ndash PEy - LEy
Abbreviation Description Value Source
ERy Emission reduction in year y (tCO2ey) 4568 -
BEy Baseline emissions in year y (tCO2ey) 4568 -
PEy Project emissions in year y (tCO2ey) 0 -
LEy Leakage emissions in year y (tCO2ey) 0 -
Calculation for AMS-IA
Baseline emissions
The energy baseline is the fuel consumption of the technology in use or that would have been used in the
absence of the project activity to generate the equivalent quantity of energy Option 2 is applied This
methodology is only apply shall the recovered is in excess after export to the grid
Annual electricity sent to the mill for FF displacement in the year ldquoyrdquo (kWh)
EBLy = ΣEGiy (1 ndash l)
Abbreviation Description Value Source
EBLy Annual energy baseline (kWhyr) Calculated
EGiy
The estimated annual output of the
renewable energy technologies of the group
of i renewable energy technologies
installed (kWhyr)
0 Estimated
l
Average technical distribution losses that
would have been observed in diesel
powered mini-grids installed by public
programmes or distribution companies in
isolated areas expressed as a fraction
0 Conservative by applying
Zero (0)
Baseline electricity sent to the mill for FF displacement in the year ldquoyrdquo (tonnes)
BECO2y = EBLy EFCO2
Abbreviation Description Value Source
BECO2y Baseline emission in the year y (tCO2yr) 0 Calculated
EBLy Annual energy baseline (kWhyr) 0 Calculated
EFCO2 CO2 emission factor (tCO2kWh) 08
Default value which is
derived from diesel
generation units is used
PROJECT DESIGN DOCUMENT FORM (CDM-SSC-PDD) - Version 03
CDM ndash Executive Board
32
Project Activity Emissions
As per AMS-IA (Version 14 EB 54) project emissions for renewable energy project activities are zero
PEy = 0
Leakage
If the energy generating equipment is transferred from another activity or if the existing equipment is
transferred to another activity leakage is to be considered
No leakage emission will occur in the project activity LEy = 0
B53 Summary of the ex-ante estimation of emission reductions
Estimated emission reductions (total project activity)
Year
Estimation of
project activity
emissions (tCO2e)
Estimation of
baseline emissions
(tCO2e)
Estimation of
leakage (tCO2e)
Estimation of
overall emission
reductions (tCO2e)
2012 504 2944 0 2440
2013 6050 35330 0 29280
2014 6050 35330 0 29280
2015 6050 35330 0 29280
2016 6050 35330 0 29280
2017 6050 35330 0 29280
2018 6050 35330 0 29280
2019 5546 32386 0 26840
Total (tCO2) 42350 247310 0 204960
The starting date of the crediting period is 01122012 or the date of registration whichever is later
Estimated emission reductions for AMS-IIIH
Year
Estimation of
project activity
emissions (tCO2e)
Estimation of
baseline emissions
(tCO2e)
Estimation of
leakage (tCO2e)
Estimation of
overall emission
reductions (tCO2e)
2012 504 2563 0 2059
2013 6050 30762 0 24712
PROJECT DESIGN DOCUMENT FORM (CDM-SSC-PDD) - Version 03
CDM ndash Executive Board
33
2014 6050 30762 0 24712
2015 6050 30762 0 24712
2016 6050 30762 0 24712
2017 6050 30762 0 24712
2018 6050 30762 0 24712
2019 5546 28199 0 22653
Total (tCO2) 42350 215334 0 172984
The starting date of the crediting period is 01122012 or the date of registration whichever is later
Estimated emission reductions for AMS-ID
Year
Estimation of
project activity
emissions (tCO2e)
Estimation of
baseline emissions
(tCO2e)
Estimation of
leakage (tCO2e)
Estimation of
overall emission
reductions (tCO2e)
2012 0 381 0 381
2013 0 4568 0 4568
2014 0 4568 0 4568
2015 0 4568 0 4568
2016 0 4568 0 4568
2017 0 4568 0 4568
2018 0 4568 0 4568
2019 0 4187 0 4187
Total (tCO2) 0 31976 0 31976
The starting date of the crediting period is 01122012 or the date of registration whichever is later
Estimated emission reductions for AMS-IA
Year
Estimation of
project activity
emissions (tCO2e)
Estimation of
baseline emissions
(tCO2e)
Estimation of
leakage (tCO2e)
Estimation of
overall emission
reductions (tCO2e)
2012 0 0 0 0
2013 0 0 0 0
2014 0 0 0 0
2015 0 0 0 0
2016 0 0 0 0
PROJECT DESIGN DOCUMENT FORM (CDM-SSC-PDD) - Version 03
CDM ndash Executive Board
34
2017 0 0 0 0
2018 0 0 0 0
2019 0 0 0 0
Total (tCO2) 0 0 0 0
The starting date of the crediting period is 01122012 or the date of registration whichever is later
B6 Application of the monitoring methodology and description of the monitoring plan
B61 Description of the monitoring plan
The parameters to be monitored are
Please note that the amount of methane recovered and fuelled or flared (MDy ) is calculated as follows
MDy = TMfuelledy + TMflaredy Equation A
Where Description Units
MDy Quantity of methane recovered and fuelled or flared in the year y tonnes CH4year
TMfuelledy Quantity of methane fuelled in the year y tonnes CH4year
TMflaredy Quantity of methane flared in year y tonnes CH4year
Where
TMfuelledy = FVfuelledh fvCH4h ηfuelledh ρCH4n) 1000 Equation B
Where Description Units
TMfuelledy Quantity of methane fuelled in the year y tonnes CH4year
FVfuelledh Volumetric flow rate of the fuelled biogas gas at normal conditions in
hour h
Nm3 biogashour
ηfuelledh 100 for gainful purpose26
fvCH4h Volumetric fraction of methane in the biogas gas in the hour h
ρCH4n Density of methane at normal conditions kgCH4Nm3CH4
And
TMflaredy = FVflaredh fvCH4h ηflareh ρCH4n) 1000 Equation C
Where Description Units
TMflaredy Quantity of methane flared in year y tonnes CH4year
FVflaredh Volumetric flow rate of the flared biogas gas at normal conditions in
hour h
Nm3 biogashour
26 AMS-IIIH point 35
PROJECT DESIGN DOCUMENT FORM (CDM-SSC-PDD) - Version 03
CDM ndash Executive Board
35
ηflareh Flare efficiency in the hour h
fvCH4h Volumetric fraction of methane in the biogas gas in the hour h
ρCH4n Density of methane at normal conditions kgCH4Nm3CH4
Data Parameter ID1 Qwwy
Data unit m3 month
Description The flow of wastewater entering the bio-digester
Source of data Measurement by project participant by using a flowmeter
Value of data ~ 28000
Brief description of
measurement methods and
procedures to be applied
The flow is measured with an online flow meter or equivalent
QAQC procedures to be
applied (if any) Data are monitored continuously and recorded periodically
(monthly or at shorter interval) in a data log file (DLF)
Uncertainty level of data low
Maintenance and calibration as per manufacturer‟s specifications
or at least once every three (3) years
Any comment
Data Parameter ID2 CODwwuntreatedy
Data unit tCOD m3
Description Raw COD of wastewater entering the bio-digester
Source of data Laboratory (internal and external)
Value of data ~ 0030230
Brief description of
measurement methods and
procedures to be applied
Measure of COD according to national or international standards
COD is measure through representative sampling
QAQC procedures to be
applied (if any) Minimum once a month COD sampling to ensure a 9010
confidenceprecision level
COD reports are recorded manually
Uncertainty level of data low
Maintenance and calibration as per manufacturer‟s specifications
or at least once every three (3) years for internal laboratory
equipment
Any comment
Data Parameter ID3 CODwwtreatedy
Data unit tCOD m3
Description COD of treated wastewater leaving the bio-digester
Source of data Laboratory (internal and external)
Value of data ~ 0003023
Brief description of
measurement methods and
procedures to be applied
Measure of COD according to national or international standards
COD is measure through representative sampling
QAQC procedures to be
applied (if any) Minimum once a month COD sampling to ensure a 9010
confidenceprecision level
COD reports are recorded manually
Uncertainty level of data low
PROJECT DESIGN DOCUMENT FORM (CDM-SSC-PDD) - Version 03
CDM ndash Executive Board
36
Maintenance and calibration as per manufacturer‟s specifications
or at least once every three (3) years for internal laboratory
equipment
Any comment
Data Parameter ID5 End-use of the final sludge
Data unit ndash
Description The final sludge generated by the project activity will be sent to control
landfill site if any
Source of data By project participant
Value of data ndash
Brief description of
measurement methods and
procedures to be applied
The final disposal of the sludge will be monitored during the crediting
period if any For each disposal of the sludge the following will be
recorded disposal site and date of disposal
QAQC procedures to be
applied (if any)
Any comment
Data Parameter ID6 FVflaredh
Data unit Nm3 hour
Description Volumetric flow of biogas recovered and flared at normal conditions in
the hour h
Source of data By project participant
Value of data 0
Brief description of
measurement methods and
procedures to be applied
The volume of biogas will be measured with a normalised flow meter or
calculated from the volumetric flow pressure temperature
Biogas volume and methane content measurements shall be on the same
basis (wet or dry)
QAQC procedures to be
applied (if any) The biogas flow is monitored continuously recorded and stored
electronically in a data log file (DLF) (monthly or at shorter
interval)
Data Parameter ID4 CODww dischargey
Data unit tCOD m3
Description COD of treated wastewater discharge into river by treatment system
Source of data Laboratory (internal and external)
Value of data ~ 0000100
Brief description of
measurement methods and
procedures to be applied
Measure of COD according to national or international standards
COD is measure through representative sampling
QAQC procedures to be
applied (if any) Minimum once a month COD sampling to ensure a 9010
confidenceprecision level
COD reports are recorded manually
Uncertainty level of data low
Maintenance and calibration as per manufacturer‟s specifications
or at least once every three (3) years for internal laboratory
equipment
Any comment
PROJECT DESIGN DOCUMENT FORM (CDM-SSC-PDD) - Version 03
CDM ndash Executive Board
37
Uncertainty level of data low
Maintenance and calibration as per manufacturer‟s specifications
or at least once every 3 years
Any comment
Data Parameter ID7 FVfuelledgas engineh
Data unit Nm3 hour
Description Volumetric flow of biogas recovered and fuelled (gas engine) at normal
conditions in the hour h
Source of data By project participant
Value of data ~ 509
Brief description of
measurement methods and
procedures to be applied
The volume of biogas will be measured with a normalised flow meter or
calculated from the volumetric flow of biogas pressure temperature
Biogas volume and methane content measurements shall be on the same
basis (wet or dry)
QAQC procedures to be
applied (if any) The biogas flow is monitored continuously recorded and stored
electronically in a data log file (DLF) (monthly or at shorter
interval)
Uncertainty level of data low
Maintenance and calibration as per manufacturer‟s specifications
or at least once every 3 years
Any comment
Data Parameter ID8 FVfuelledboilerh
Data unit Nm3 hour
Description Volumetric flow of biogas recovered and fuelled (boilers) at normal
conditions in the hour h
Source of data By project participant
Value of data ~ 0
Brief description of
measurement methods and
procedures to be applied
The volume of biogas will be measured with a normalised flow meter or
calculated from the volumetric flow of biogas pressure temperature
Biogas volume and methane content measurements shall be on the same
basis (wet or dry)
QAQC procedures to be
applied (if any) The biogas flow is monitored continuously recorded and stored
electronically in a data log file (DLF) (monthly or at shorter
interval)
Uncertainty level of data low
Maintenance and calibration as per manufacturer‟s specifications
or at least once every 3 years
Any comment
Data Parameter ID9 wCH4h
Data unit
Description Methane content in biogas in same basis (wetdry) as the biogas flows in
year y
Source of data By project participant using a gas analyzer
Value of data ~ 60
PROJECT DESIGN DOCUMENT FORM (CDM-SSC-PDD) - Version 03
CDM ndash Executive Board
38
Brief description of
measurement methods and
procedures to be applied
Using calibrated gas analyzer either continuous or periodical
measurement at confidenceprecision level of 9010
QAQC procedures to be
applied (if any) In case a continuous gas analyser is used data will be recorded
and stored electronically in a data log file (DLF) every hour or at
shorter interval
Uncertainty level of data low
Maintenance and calibration as per manufacturer‟s specifications
or at least once every 3 years
Any comment See also clarification by EB Meth Panel 30102009 ndash SSC_360
httpcdmunfcccintUserManagementFileStorageAM_CLAR_
QS83SX5B7WM6UGZE31JYQEQ4F65F6V
The biogas flow and the methane content measurements shall be
carried out close to each others
Data Parameter ID10 Tbiogas
Data unit ordmC
Description Temperature of biogas
Source of data Temperature probe
Value of data 20 ndash 65
Brief description of
measurement methods and
procedures to be applied
By project participant
QAQC procedures to be
applied (if any) Shall be measured and recorded at the same time when methane
content in biogas (ID8) is measured
Uncertainty level of data low
Maintenance and calibration as per manufacturer‟s specifications
or at least once every 3 years
Any comment Pressure and temperature are required to determine the density of
the methane If the biogas flow meter employed measures flow
pressure and temperature and displaysoutputs normalised flow of
biogas there is no need to separate monitoring of pressure and
temperature of the biogas
Data Parameter ID11 Pbiogas
Data unit Bar(g)
Description Pressure of biogas
Source of data By project participant
Value of data 50 ndash 200 mbar
Brief description of
measurement methods and
procedures to be applied
Pressure measurement device
QAQC procedures to be
applied (if any) Shall be measured and recorded at the same time when methane
content in biogas (ID8) is measured
Uncertainty level of data low
Maintenance and calibration as per manufacturer‟s specifications
or at least once every three (3) years
Any comment Pressure and temperature are required to determine the density of
the methane If the biogas flow meter employed measures flow
PROJECT DESIGN DOCUMENT FORM (CDM-SSC-PDD) - Version 03
CDM ndash Executive Board
39
pressure and temperature and displaysoutputs normalised flow of
biogas there is no need to separate monitoring of pressure and
temperature of the biogas
Shall be measured at the same time when methane content in
biogas (ID9) is measured
Parameter ID12 ηflareh (enclosed flare)
Unit
Description Enclosed flare efficiency in the hour h
Source of data Calculated
Value of data 0 or 50 or 90
Brief description of
measurement methods and
procedures to be applied
This yearly efficiency will be based on hourly flare efficiencies calculated
as per the provisions in the ldquoTool to determine project emissions from
flaring gases containing methanerdquo
The hourly flare efficiency will be calculated based on
0 if the temperature in the exhaust gas of the flare (Tflare) is
below 500 degC for more than 20 minutes during the hour h
50 if the temperature in the exhaust gas of the flare (Tflare) is
above 500 degC for more than 40 minutes during the hour h but the
manufacturer‟s specifications on proper operation of the flare are
not met at any point in time during the hour h
90 if the temperature in the exhaust gas of the flare (Tflare) is
above 500 degC for more than 40 minutes during the hour h and the
manufacturer‟s specifications on proper operation of the flare are
met continuously during the hour h
QAQC procedures to be
applied (if any) Data are logged hourly in a data log file (DLF)
Uncertainty level of data low
Any comment For enclosed flare
Or
Parameter ID13 ηflareh (open flare)
Unit
Description Flare efficiency in the hour h
Source of data Calculated
Value of data 0 or 50
Brief description of
measurement methods and
procedures to be applied
This yearly efficiency will be based on hourly flare efficiencies calculated
as per the provisions in the ldquoTool to determine project emissions from
flaring gases containing methanerdquo
The hourly flare efficiency will be calculated based on the duration of
time during which the flame is detected by the thermocouple (or flame
detector) installed in the open flare
Flare efficiency in hour h is based on default values
0 if the flame detected for not more than 20 minutes during the
hour h and
PROJECT DESIGN DOCUMENT FORM (CDM-SSC-PDD) - Version 03
CDM ndash Executive Board
40
50 if the flame detected for more than 20 minutes during the
hour h
A flame detector or thermocouple will be used
QAQC procedures to be
applied (if any) Data are logged hourly in a data log file (DLF)
Uncertainty level of data low
Any comment The only monitored parameter related to the flare is its efficiency Indeed
according to the clarification SSC_19927 of the methodology AMS IIIH
version 9 accepted by the SSC WG on the 3092008 ldquoIf a thermocouple
is used as a flame detection system it is sufficient to reach the given
minimum temperature from the manufacturer ldquo Hence it is not necessary
to monitor the temperature of the open type flares (Tflare)
Data Parameter ID14 ECPJjy
Data unit MWh
Description The yearly grid electricity consumption of the project activity for the year
bdquoy‟
Source of data Onsite instrument
Value of data ~749
Brief description of
measurement methods and
procedures to be applied
The grid electricity consumption of the project activity is measured
continuously with an energy meter (cumulative reading)
QAQC procedures to be
applied (if any) Data are monitored continuously and recorded periodically
(yearly or at shorter interval) in a data log file (DLF)
Uncertainty level of data low
Maintenance and calibration as per manufacturer‟s specifications
or at least once every three (3) years
Any comment
Data Parameter ID15 EGBLy
Data unit MWh
Description Quantity of net electricity generated and send to grid in year y
Source of data By project participant
Value of data ~ 6798
Brief description of
measurement methods and
procedures to be applied
The electricity generated and sent to grid is measured continuously with
an energy meter (cumulative readings)
QAQC procedures to be
applied (if any) Data are monitored continuously and recorded periodically
(yearly or at shorter interval) in a data log file (DLF)
Uncertainty level of data low
Maintenance and calibration as per manufacturer‟s specifications
or at least once every 3 years
Any comment As per AMS-ID
27 The clarification SSC_199 if available here (last access on the 24052011)
httpcdmunfcccintfilestorageAM_AM_CLAR_HIOZ5CS1PASC187C0JQ668L2E9RCRJResponse20WG20provided
20at20SSC20WG2017pdft=bU98MTMwNjIxNjY0OS4xMQ==|BOKHqtO94N6XF1N2N1vo8Ori-Rc=
PROJECT DESIGN DOCUMENT FORM (CDM-SSC-PDD) - Version 03
CDM ndash Executive Board
41
Or
Data Parameter ID16 EGmilly
Data unit MWh
Description Quantity of annual output of renewable energy sent to the mill in year y
Source of data By project participant
Value of data ~ 0
Brief description of
measurement methods and
procedures to be applied
The electricity generated and sent to mill to displace diesel use in diesel
gensets is measured continuously with an energy meter (cumulative
readings)
QAQC procedures to be
applied (if any) Data are monitored continuously and recorded periodically
(yearly or at shorter interval) in a data log file (DLF)
Uncertainty level of data low
Maintenance and calibration as per manufacturer‟s specifications
or at least once every 3 years
Any comment As per AMS-IA
Data Parameter ID17 Displacement of Biomass
Data unit Mt
Description Total amount of biomass (PKS) displaced from biomass boilers
Source of data Weighing bridge
Value of data Measurement at site
Brief description of
measurement methods and
procedures to be applied
Biomass (PKS) displaced due to the project activity will be weighed
using weighing bridge at the palm oil mill
QAQC procedures to be
applied (if any) Monthly calculation based on every single trip of trucks recorded
Data is recorded manually in a data log file based on the weighing
records
Maintenance and calibration as per manufacturer‟s specifications
Uncertainty level of data low
Any comment In the project activity the biomass (PKS) displaced will not be stored
under anaerobic conditions The conditions of onsite storage are identical
in the baseline as in the project activity The biomass will be sold to the
market on a regular basis PEbiomassy = 0
A final monitoring plan will be prepared prior the initial verification based on the as-built project activity
It will address the following aspects
MONITORING
The Project will be managed by CME with the involvement from Project Implementer CME will ensure
safety in operation of the plant as well as in the monitoring of emission reduction which is generated from
the project activity
CME will implement and be responsible for the monitoring plan Their responsibility covers operation of
the monitoring maintenance of the monitoring equipment data collection and archiving and
management of total scheme of the monitoring CME and Project Implementer will assign specific trained
PROJECT DESIGN DOCUMENT FORM (CDM-SSC-PDD) - Version 03
CDM ndash Executive Board
42
personnel during project implementation for the overall monitoring measurement and reporting of key
parameters as required in this PDD
DATA LOGGING AND STORAGE
The data measured by the instruments will be collected and stored in a data logging system The data will
be retrieved remotely by modem or directly on site
If data cannot be retrieved no emissions reductions will be claimed for the period of data failure The
data collected will be recorded in a central data base Access to production data will be restricted All
records and data (hard copy and soft copy) will be archived up to two years after the end of the crediting
period or the last issuance of CERs for this project activity whichever occurs later
CALIBRATION AND MAINTENANCE PROCEDURES MALFUNCTION OF EQUIPMENT
Maintenance includes all preventive and corrective actions necessary for the good functioning of the
equipment such as
Visual control of the equipment state and real-time check of displayed parameters
Cleaning up the equipment and the sensors
Adding lubricant
Replacement and change of defective parts
Calibration of equipment consists in verifying by comparison with a standard the accuracy of a
measuring instrument
Measuring instruments will be periodically and appropriately calibrated according to the procedures
timing and methods recommended by the manufacturer or nationalinternational standards as available
General malfunction of equipment
Daily inspections of the equipment will allow controlling equipment failure If equipment fails the
supplier will be notified and repairs will be carried out If the damaged equipment cannot be repaired it
will be replaced at the earliest In some cases portable tools will be used in order to carry out daily
monitoring of the missing parameter(s) In such case this data will be recorded manually
Discrepancies
To avoid discrepancies between projected data in the PDD and actual data (eg due to deferred starting
date malfunction of equipment) cross-checks between internal meter readings and external sources (eg
electricity invoices) will be carried out Any source of inconsistencies will be clarified
Case of emergency
For the case of emergency (earthquakes explosions fires etc) an emergency preparedness plan will be
adapted to the project activity All employees involved in the project on-site will be trained in the code of
conduct and required actions at time of commissioning of the plant
PROJECT DESIGN DOCUMENT FORM (CDM-SSC-PDD) - Version 03
CDM ndash Executive Board
43
OPERATIONAL AND MANAGEMENT STRUCTURE
The CDM monitoring team will be composed by the following staff
Position Report to
Operators
Project owner Supervisors (technicalmaintenance)
Operation Engineer
CDM monitoring project manager External CDM consultant
TRAINING OF MONITORING PERSONNEL
The maintenance will be conducted in-house by staff employed and trained by the Project Participants
Employees involved in the monitoring will be trained internally andor externally Training may include
inter alia
a) Review of equipment and captors
b) Calibration requirement
c) Configuration of monitoring equipment
d) Maintenance requirement
C1 Please indicate the level at which environmental analysis as per requirements of the CDM
modalities and procedures is undertaken Justify the choice of level at which the environmental
analysis is undertaken
radic Please tick if this information is provided at the PoA level In this case sections C2 and C3
need not be completed in this form
C2 Documentation on the analysis of the environmental impacts including transboundary
impacts
The host country does not require an analysis of environmental impacts As the project involves reduction
of GHG through recovery and controlled combustion which improves the quality of air therefore there
are no significant environmental impacts identified
C3 Please state whether an environmental impact assessment is required for a typical CPA
included in the programme of activities (PoA) in accordance with the host Party lawsregulations
In accordance with Malaysia environmental regulations Environmental Quality (Prescribed Activities
Environmental Impact Assessment) Order 1987 an Environmental Impact Assessment (EIA) is not
required for this CPA
PROJECT DESIGN DOCUMENT FORM (CDM-SSC-PDD) - Version 03
CDM ndash Executive Board
44
SECTION D Stakeholdersrsquo comments
D1 Please indicate the level at which local stakeholder comments are invited Justify the
choice
Please tick if this information is provided at the PoA level In this case sections D2 to D4 need
not be completed in this form
D2 Brief description how comments by local stakeholders have been invited and compiled
The stakeholder meeting was conducted at the office of Kilang Sawit Felda Triang on 05032012 There
were 37 stakeholders attending the consultation Posters were pasted at the guard house and at the
entrance to office 1 week before the stakeholder consultation to inform the locals stakeholders which
comprise mostly the workers of the mill 20 stakeholders out of the 37 who attended the consultation are
2nd generation of the Felda settlers who live in the vicinity to the project activity and adequately represent
the local community composed entirely of Felda settlers (no other people live in the vicinity of this
remote plantation) Continuous input of ideascomments were allowed to all stakeholders who could
either send their input though an email account especially setup for the biogas project or directly inform
the project proponents
During the meeting presentations were made by the project owner to outline the proposed project activity
in a non-technical manner (including environmental social and technological considerations) climate
change and the role of the CDM Attendees were given opportunity to raise their concern and opinion
about the proposed project activity during the question and answer session
D3 Summary of the comments received
PROJECT DESIGN DOCUMENT FORM (CDM-SSC-PDD) - Version 03
CDM ndash Executive Board
45
Below are the questions raised during the stakeholder meeting
NAME QUESTION
Mohd Tarmizi Bin Mat
Daud What is CDM in Bahasa Malaysia
Mohd Tarmizi Bin Mat
Daud What is DoE‟s standard for treated water released into river
Mohd Azizi Bin Abdul
Aziz
Would the biogas be captured from the existing effluent treatment ponds or a
new structure
Azhar Bin Abdul What to do with the captured biogas from the bioreactor
D4 Report on how due account was taken of any comments received
Below are the answers to the questions asked during the stakeholder meeting
QUESTION ANSWER
What is CDM in Bahasa Malaysia
The meaning of CDM in Bahasa Malaysia is Mekanisme
Pembangunan Bersih or in English is Clean Development
Mechanism
By Abd Karim Bin Mohd Zin
What is DoE‟s standard for treated
water released into river
The discharge standard for BOD into river is less than 100ppm
By Abd Karim Bin Mohd Zin
Would the biogas be captured from
the existing effluent treatment
ponds or a new structure
New bioreactor will be constructed to replace the existing anaerobic
lagoon treatment system The new bioreactor will capture the
biogas produced from this anaerobic treatment process
By Abd Karim Bin Mohd Zin
What to do with the captured
biogas from the bioreactor
The biogas recovered from the bioreactor will mainly contain
methane (approximately 60) and the rest are CO2 H2 and H2S
Currently the biogas is just released to the atmosphere from the
existing open lagoons system During the project activity captured
biogas will be combusted thus will improve the air quality
By Abd Karim Bin Mohd Zin
PROJECT DESIGN DOCUMENT FORM (CDM-SSC-PDD) - Version 03
CDM ndash Executive Board
46
Annex 1
CONTACT INFORMATION ON ENTITYINDIVIDUAL RESPONSIBLE FOR THE SMALL-
SCALE CPA
Organization Felda Palm Industries Sdn Bhd (359584-V)
StreetPOBox Jalan Gurney 1
Building Balai Felda 4th Floor
City Kuala Lumpur
StateRegion Wilayah Persekutuan
PostfixZIP 54000
Country Malaysia
Telephone (03) 2692 8066
FAX (03) 2693 4148
URL wwwfeldanetmy
Represented by
Title Head of Department
Salutation Mr
Last Name Busu
Middle Name
First Name Zainuri
Department Biomass
Mobile
Direct FAX
Direct tel
Personal E-Mail zainuribfeldanetmy
Organization Ably Carbon Sdn Bhd
StreetPOBox Jalan Ipoh Kecil
Building No 17
City Kuala Lumpur
StateRegion
PostfixZIP 50350
Country Malaysia
Telephone +60 3 4042 1177
FAX +60 3 4044 4166
E-Mail stephanevidailletably-carboncom
URL
Represented by Stephane Vidaillet
Title Chairman
Salutation Mr
Last Name Vidaillet
Middle Name
First Name Steacutephane
Department
Mobile +33 6 59111 5600
Direct FAX
PROJECT DESIGN DOCUMENT FORM (CDM-SSC-PDD) - Version 03
CDM ndash Executive Board
47
Direct tel
Personal E-Mail stephanevidailletably-carboncom
PROJECT DESIGN DOCUMENT FORM (CDM-SSC-PDD) - Version 03
CDM ndash Executive Board
48
Annex 2
INFORMATION REGARDING PUBLIC FUNDING
The project activity is not receiving any funding from parties included in Annex 1 of the Kyoto Protocol
SMALL-SCALE CDM PROGRAMME ACTIVITY DESIGN DOCUMENT FORM (CDM-SSC-CPA-DD) - Version 01
NAME TITLE OF THE PoA Biogas Recovery and Utilization PoA Projects in
Malaysia
CDM ndash Executive Board page 49
This template shall not be altered It shall be completed without modifyingadding headings or logo format or font
Annex 3
BASELINE INFORMATION
1 2
Year 2009 2010 2011 2012 2013 2014
FFB (mtyr) 343720 345910 310250 333293 333293 333293
POME Volume
(cumyr)[1] 343720 345910 310250 333293 333293 333293
Mill Opearing hour (hryr) 68865 69225 6209 6673 6673 6673
PKS (mtyr) 18905 19025 17064 18331 18331 18331
3 4 5 6 7 8 9 10
2015 2016 2017 2018 2019 2020 2021 2022
333293 333293 333293 333293 333293 333293 333293 333293
333293 333293 333293 333293 333293 333293 333293 333293
6673 6673 6673 6673 6673 6673 6673 6673
18331 18331 18331 18331 18331 18331 18331 18331
SMALL-SCALE CDM PROGRAMME ACTIVITY DESIGN DOCUMENT FORM (CDM-SSC-CPA-DD) - Version 01
NAME TITLE OF THE PoA Biogas Recovery and Utilization PoA Projects in
Malaysia
CDM ndash Executive Board page 50
This template shall not be altered It shall be completed without modifyingadding headings or logo format or font
10 days measurement campaign for baseline wastewater treatment system
Day Date
ETP
Inlet
Anaerobic
system (mgl)
Outlet
Anaerobic
system (mgl)
Outlet Algae
System (mgl)
Final
Discharge to
River (mgl)
1 23-Feb-12 35693 3120 811 603
2 25-Feb-12 19511 2559 1186 83
3 26-Feb-12 32864 2767 749 437
4 27-Feb-12 30195 2330 1210 404
5 28-Feb-12 32436 1927 1188 941
6 29-Feb-12 38259 4256 896 717
7 1-Mar-12 28717 3584 1232 695
8 3-Mar-12 31002 4660 1658 1210
9 4-Mar-12 22400 4346 1389 963
10 5-Mar-12 31226 4301 1971 1165
Average 30230 3385 1229 722
ETP
COD removal efficiency (anaerobic system) 8880
COD removal efficiency (Facultativealgae system) 6369
COD removal efficiency (Bio-polishing system) 4127
Total COD removal efficiency of the treatment system 9761
The COD of the raw effluent during ex-post may vary from the one year historical records depending on
the improvement of the production process (outside of project boundary) thus ERex-post may vary from the
estimated ERex-ante
SMALL-SCALE CDM PROGRAMME ACTIVITY DESIGN DOCUMENT FORM (CDM-SSC-CPA-DD) - Version 01
NAME TITLE OF THE PoA Biogas Recovery and Utilization PoA Projects in
Malaysia
CDM ndash Executive Board page 51
This template shall not be altered It shall be completed without modifyingadding headings or logo format or font
Annex 4
MONITORING INFORMATION
General information
Monitoring refers to the collection and archiving of all relevant data necessary for determining the
baseline measuring anthropogenic emissions by sources of greenhouse gases (GHG) within the project
boundary of a CDM project activity and leakage It includes developing suitable data collection methods
and data interpretation techniques for monitoring and verification of GHG emissions
On-line monitoring system
Most key meters required to determine GHG emissions and emission reductions will be monitored from a
central control point which will record meter readings at a pre-determined interval
Ensuring adequate maintenance and calibration of monitoring instruments
Specific maintenance repair or replacement of monitoring equipment will be recorded dated and
described
The calibration will occur at intervals determined on the basis of instrument manufacturers
recommendations stability purpose usage and history of repeatability Recalibration should be
performed whenever an event occurs that places the accuracy of the instrument in doubt
Calibration will take place at least once every three (3) years to ensure that the monitoring
equipments are properly installed and functioning properly
Calibration will be performed according to national or international standards
Last calibration certificates will be provided during periodic verification
Sampling procedure
Wherever a statistical sample is used for monitoring the ldquogeneral guidelines for sampling and surveys for
SSC project activitiesrdquo shall be used COD shall be measured from a composite sample to obtain a
representative value
Data archiving
The monitored data will be kept for a minimum of 2 years after the end of the crediting years by using
paper documents or electronic files
Identification of non-conformities
A verification of inconsistencies of the data recorded will be performed based for example on
The comparison of the calculated quantities of methane versus expected
Spot checks of field instruments (local reading) and data in the log file
Any discrepancies (completeness calculation errors transcription errors instrument calibration issues)
will be analyzed and actions taken to correct the problem
Ensuring adequate training of staff
All new staff members will undergo bdquoon job training‟ covering the monitoring requirements
The monitoring plan will be made available to staff member involved in the monitoring
A copy will be located in the control room at the site
SMALL-SCALE CDM PROGRAMME ACTIVITY DESIGN DOCUMENT FORM (CDM-SSC-CPA-DD) - Version 01
NAME TITLE OF THE PoA Biogas Recovery and Utilization PoA Projects in
Malaysia
CDM ndash Executive Board page 52
This template shall not be altered It shall be completed without modifyingadding headings or logo format or font
During the training the employees will sign a training attendance list All training records shall
be documented inclusive of training attendance training memo and training material if any

PROJECT DESIGN DOCUMENT FORM (CDM-SSC-PDD) - Version 03
CDM ndash Executive Board
14
More than 85 of palm oil mills are utilizing open based anaerobic ponds and it is considered the
prevailing practice for oil palm industry to treat the POME The open anaerobic ponds system is an
effective and low-tech solution that can easily meet the water discharge limits applicable to the palm oil
industry9 10
There is no financial incentive for the palm oil mill owners to invest into methane capture projects
particularly when there is no requirement under existing pending or planned national state or local
regulatory This is partly related to the fact that there are a lot of attractive and competing investments in
the sector However the PP has undertaken to set up this project in order to reduce the GHG emissions
and contribute his mite to the global GHG emission reduction
The project is a small scale project activity As such the provisions of Attachment A to Appendix B of
the simplified modalities and procedures for small-scale CDM project activities will apply to this project
The bdquoindicative simplified baseline and monitoring methodologies for selected small-scale CDM project
activity categories‟ require the project proponents to demonstrate that the project activity would not have
occurred anyway due to at least one of the following barriers
a) Investment barrier a financially more viable alternative to the project activity would have led to
higher emissions
b) Technological barrier a less technologically advanced alternative to the project activity involves
lower risks due to the performance uncertainty or low market share of the new technology
adopted for the project activity and so would have led to higher emissions
c) Barrier due to prevailing practice prevailing practice or existing regulatory or policy
requirements would have led to the implementation of a technology with higher emissions
d) Other barriers without the project activity for another specific reason identified by the project
participant such as institutional barriers or limited information managerial resources
organizational capacity financial resources or capacity to absorb new technologies emissions
would have been higher
Subsequently in its 35th Meeting the EB had issued bdquoNon-binding best practice examples to demonstrate
additionality for SSC project activities‟ wherein EB had given best practice examples of each of the
aforementioned category of barriers
The project participant has chosen Investment Barrier to demonstrate the additionality which is discussed
in the following paragraphs
Investment barrier
The most important of all the barriers faced by the company is the investment barrier The investment
analysis reveals that the project is not financially attractive The additionality tool permits the use of
simple cost analysis or investment comparison analysis or benchmark analysis to demonstrate the
additionality of the project
9 SD 05 ndash Yeoh B G 2004 A Technical and Economic Analysis of Heat and Power Generation from Biomethanation of
Palm Oil Mill Effluent Electrcity Supply Industry in Transition Issues and Prospect for Asia 10 SD 06 ndash Eco-Ideal Consulting Sdn Bhd (Eco-Ideal) 2004 MEWCPTMDANIDA Study on Clean Development
Mechanism Potential in the Waste Sectors in Malaysia Unpublished
PROJECT DESIGN DOCUMENT FORM (CDM-SSC-PDD) - Version 03
CDM ndash Executive Board
15
As the project activity generates revenue (other than CDM revenue) by exporting the electricity to the
grid and from the likely sale of biomass andor saving from diesel usage at the mill which is being
displaced by biogas simple cost analysis cannot be used Of the remaining PP has chosen the benchmark
analysis to demonstrate the financial unattractiveness of the project activity without carbon credits
There is a national policy on Feed-In-Tariff (FiT) gazetted in June 201111
that gives comparative
advantages to less emissions-intensive technologies over more emissions-intensive technologies (E-
policy as national andor sectoral policies or regulations that give comparative advantages to less
emissions-intensive technologies over more emissions-intensive technologies)
This is very conservative as paragraph 7 6 (b) EB22 Annex 3 states that ldquoNational andor sectoral
policies or regulations hellip that have been implemented since the adoption by the COP of the CDM MampP
(decision 17CP7 11 November 2001) need not be taken into account in developing a baseline scenario
(ie the baseline scenario could refer to a hypothetical situation without the national andor sectoral
policies or regulations being in place) In absence of the FiT the prevailing electricity sales tariff to
consumers is RM 021 per kWh
Project IRR has been chosen as the financial indicator for the financial analysis of the project activity
The project IRR has to be compared with a benchmark rate of return to demonstrate the additionality of
the project The Guidelines on the Assessment of Investment Analysis (Version 05 point 12) states ldquoIn
cases where a benchmark approach is used the applied benchmark shall be appropriate to the type of IRR
calculated Local commercial lending rates or weighted average costs of capital (WACC) are appropriate
benchmarks for a project IRR Requiredexpected returns on equity are appropriate benchmarks for an
equity IRR Benchmarks supplied by relevant national authorities are also appropriate if the DOE can
validate that they are applicable to the project activity and the type of IRR calculation presentedrdquo
In line with the Guidelines on the Assessment of Investment Analysis (Version 05) a default value
for the expected returns on equity is selected as the benchmark with 1090 The logic of choosing this
rate as benchmark is that the project should yield a return at least equivalent to the expected returns of
equity to merit consideration
For making the investment analysis the following assumptions have been made
Table B2 Investment Analysis
Sl No Description Value
1
Budgeted CAPEX
- Bioreactor amp accessories
- Flaring system
- Boiler adaptation cost for burners
- Gas engine(s)
- KPSR consultancy cost
4350000
140670
205000
4630000
220000
Total 9545670
2
Annual maintenance costs are estimated based on a of CAPEX12
Bioreactor (3 of CAPEX) = MYR 130500
Gas engine(s) (5 of CAPEX) = MYR 231500
3 Corporate tax ()13 25
11 httpwwwmbipvnetmydloadFiT20Handbook20Englishpdf 12 SD 05 ndash Maintenance cost (SIRIM Environmental and Bioprocess Technology Centre of Malaysia)
PROJECT DESIGN DOCUMENT FORM (CDM-SSC-PDD) - Version 03
CDM ndash Executive Board
16
Since losses can be carried forward indefinitely (so long as the ownership
remains unchanged) the incidence of taxation does not arise in the case of
this project activity
4
Manpower cost has been estimated based on 1 supervisor 2 operators 1
chargeman envisaged to be appointed and the ruling wagesalary structure
of the company14
182588 MYR yr
5 Salary increment rate has been applied based on the average expected
salary increment rate for year 20101115 40
6 Price of Biomass ex-factory (PKS) 156 MYRmt
7 Price of diesel 220 MYRliter
8 RE tariff export to grid (MYRkWh) 021
9
Laboratory Cost is estimated based on the quotations from accredited
laboratory anticipated number of tests and samples to be carried out and
transportation cost during the running and operating of the biogas plant for
maintaining optimum operating conditions
1920 MYR yr
10 Insurance premium per year ( of CAPEX)16 0412
11 Estimate of CER price (EUR) 8
12
Depreciation of equipment (years) has been provided as per the Inland
Revenue Authority regulations17 Since the project consists of only
environmental protection equipment it is entitled to initial capital
allowance of 40 and annual capital allowance of 20 as per the Inland
Revenue Authority notifications
4 years
13 Project life time for IRR calculation18 20 years
14
Residual value a fair value (5) of the project activity assets at the end of
the assessment period as per the Guidelines on The Assessment of
Investment Analysis version 05 EB 62
MYR 466284
Based on the above assumption the project IRR works out to be ndash 085 in contrast to the benchmark
rate of 1090 Thus the analysis proves that the project is not financially attractive
Sensitivity Analysis
A sensitivity analysis has also been conducted to test the robustness of the conclusions drawn Four (4)
factors have been identified as critical to IRR of the project viz project cost maintenance costs RE
tariff The results of sensitivity analysis are given below
13 SD 08 ndash Malaysian Tax and Business Booklet 201011 Page 12
httpwwwpwccomen_MYmyassetspublicationstaxbooklet1011pdf 14 SD 3 - Salary structure (biogas plant) 15 SD 09 - Salary increment rate (201011) 16 SD 2 - Biogas plant insurance policy 17 SD 08 ndash Malaysian Tax and Business Booklet 201011 Page 21
httpwwwpwccomen_MYmyassetspublicationstaxbooklet1011pdf 18 As per the Guidelines on the Assessment of Investment Analysis version 05 (Annex 5 EB 62 point 3) ldquoIn general a
minimum period of 10 years and a maximum of 20 years will be appropriaterdquo PP has chosen 20 years for financial
assessment as it is conservative
PROJECT DESIGN DOCUMENT FORM (CDM-SSC-PDD) - Version 03
CDM ndash Executive Board
17
Table B3 Sensitivity Analysis
FACTORS PROJECT IRR
-10 0 +10
Project cost -185 -085 033
Maintenance cost -491 -085 189
RE tariff 112 -085 -354
It could be seen from the above that even under the most optimistic conditions the project activity would
not yield a positive IRR let alone crossing the benchmark Therefore the project is not a business-as-
usual scenario and it is additional
Prior Consideration of CDM
As per the guidance of EB Meeting Report 49 Annex 22 the project proponent notified the UNFCCC and
the DNA of the intent to implement the project as a CDM project activity
Conclusion
The conclusion of the investment analysis remains identical to reasonable variations of the critical
assumptions (sensitivity analysis) Therefore the project activity IRR remains lower than the benchmark
In the above background it is proved that the project faces an investment barrier that establishes the
additionality
B4 Description of the sources and gases included in the project boundary and proof that the
small-scale CPA is located within the geographical boundary of the registered PoA
The emission sources and type of GHG which are included or excluded within the project boundary are
shown in the following table
Table B4 Emission Sources and Type of GHG
Source Gas Included Justification Explanation
Ba
seli
ne
Direct emissions
from the
wastewater
treatment processes
CO2 No Neutral CO2 emissions from biomass decaying
CH4 Yes Methane emissions from open lagoons treatment
process
N2O No Not significant Excluded for simplification and
conservativeness
Diesel usage in
diesel genset at mill
CO2 Yes CO2 emissions from combustion of diesel fuel
CH4 No Not significant Excluded for simplification and
conservativeness
N2O No Not significant Excluded for simplification and
conservativeness
Pro
ject
Act
ivit
y
Bio-digester
CO2 No Neutral CO2 emissions from biomass decaying
CH4 Yes Methane emissions from anaerobic treatment process
N2O No Not significant Excluded for simplification and
conservativeness
Existing
wastewater
treatment lagoons
CO2 No Neutral CO2 emissions from biomass decaying
CH4 Yes Methane emissions from poorly managed treatment
process (without aerators)
PROJECT DESIGN DOCUMENT FORM (CDM-SSC-PDD) - Version 03
CDM ndash Executive Board
18
(Facultative amp
algae system) N2O No
Not significant Excluded for simplification and
conservativeness
Gas engine(s)
(biogas
combustion)
CO2 No Neutral CO2 emissions from biogas combustion
CH4 No Not significant and excluded from calculation
Biogas combustion efficiency is considered 10019
N2O No Not significant Excluded for simplification and
conservativeness
Biomass Boiler(s)
(Biogas
combustion)
CO2 No Neutral CO2 emissions from biogas combustion
CH4 No Not significant and excluded from calculation
Biogas combustion efficiency is considered 10020
N2O No Not significant Excluded for simplification and
conservativeness
Grid electricity
consumption from
national grid
CO2 Yes CO2 emissions from grid energy
CH4 No Not significant Excluded for simplification and
conservativeness
N2O No Not significant Excluded for simplification and
conservativeness
Enclosed or Open
flaring system
CO2 No Neutral CO2 emissions from biogas combustion
CH4 Yes CH4 emissions due to incomplete combustion in
enclosed flare
N2O No Not significant Excluded for simplification and
conservativeness
The CPA is implemented at the address below
Kilang Sawit Felda Triang Triang Pahang Malaysia
The site is located at state of Pahang Malaysia with GPS coordinates 3 16152 N 102 34567 E or
32692 1025761 (refer also Section A412) and thus is located within the geographical boundary of the
PoA
B5 Emission reductions
B51 Data and parameters that are available at validation
Data Parameter GWPCH4
Data unit tCO2tCH4
Description Global Warming Potential the equivalent in CO2 of the effect of methane
gas to the atmosphere
Source of data used IPCC 2006
Value applied 21
Justification of the choice of
data or description of
measurement methods and
procedures actually applied
Global warming potential for methane gas since this is a methane
capture project
19 AMS-IIIH para 35 20 AMS-IIIH para 35
PROJECT DESIGN DOCUMENT FORM (CDM-SSC-PDD) - Version 03
CDM ndash Executive Board
19
Any comment
Data Parameter MCFwwtreatmentBL1
Data unit Fraction
Description Methane correction factor for baseline wastewater anaerobic treatment
systems
Source of data used Table IIIH1 AMS IIIH version 16
Value applied 08
Justification of the choice of
data or description of
measurement methods and
procedures actually applied
Table IIIH1 for baseline emission The lagoons depth are more than 2m
MCF value of 08 for anaerobic deep lagoon (depth gt 2 m)
Any comment
Data Parameter MCFwwtreatmentBL2
Data unit Fraction
Description Methane correction factor for baseline wastewater aerobic treatment
systems
Source of data used Methane correction factor for baseline aerobic wastewater treatment
system (poorly managed)
Value applied Table IIIH1 AMS IIIH version 16
Justification of the choice of
data or description of
measurement methods and
procedures actually applied
03
Any comment No aerators installed
Data Parameter MCFwwBLdischarge
Data unit Fraction
Description Methane correction factor based on discharge pathway in the baseline
situation
Source of data used Table IIIH1 AMS IIIH version 16
Value applied 01
Justification of the choice of
data or description of
measurement methods and
procedures actually applied
Table IIIH1 for baseline emission The final discharge of treated
effluent into river MCF value of 01 for river discharge
Any comment
Data Parameter Bo ww
Data unit kgCH4 kgCOD
Description Methane generation capacity of treated wastewater
Source of data used IPCC 2006
Value applied 025
Justification of the choice of
data or description of
measurement methods and
procedures actually applied
Default value as prescribed in the methodology
Any comment
PROJECT DESIGN DOCUMENT FORM (CDM-SSC-PDD) - Version 03
CDM ndash Executive Board
20
Data Parameter UFBL
Data unit -
Description Model correction factor to account for model uncertainties (baseline)
Source of data used AMS IIIH version 16
Value applied 089
Justification of the choice of
data or description of
measurement methods and
procedures actually applied
As per methodology AMS-IIIH point 24
Any comment -
Data Parameter UFPJ
Data unit -
Description Model correction factor to account for model uncertainties (project
activity)
Source of data used AMS IIIH version 16
Value applied 112
Justification of the choice of
data or description of
measurement methods and
procedures actually applied
As per methodology AMS-IIIH point 30(a)
Any comment -
Data Parameter CFEww
Data unit Fraction
Description Capture efficiency of the biogas recovery equipment in the wastewater
treatment system
Source of data used AMS IIIH version 16
Value applied 09
Justification of the choice of
data or description of
measurement methods and
procedures actually applied
A default value of 09 has been used as per the guidance in the
methodology
Any comment
Data Parameter MCF ww treatmentPJ1
Data unit Fraction
Description Methane correction factor for the project wastewater anaerobic treatment
system equipped with biogas recovery equipment
Source of data used Table IIIH1 AMS IIIH version 16
Value applied 08
Justification of the choice of
data or description of
measurement methods and
procedures actually applied
The lagoons depth are more than 2 m MCF values in table IIIH1 has
been used as per the guidance in the methodology (depth gt 2 m)
Any comment
Data Parameter MCF ww treatmentPJ2
PROJECT DESIGN DOCUMENT FORM (CDM-SSC-PDD) - Version 03
CDM ndash Executive Board
21
Data unit Fraction
Description Methane correction factor for the project wastewater aerobic treatment
system not equipped with biogas recovery equipment
Source of data used Table IIIH1 AMS IIIH version 16
Value applied 03
Justification of the choice of
data or description of
measurement methods and
procedures actually applied
Aerobic treatment poorly managed
Any comment
Data Parameter MCFwwPJdischarge
Data unit Fraction
Description Methane correction factor based on discharge pathway in the project
activity
Source of data used Table IIIH1 AMS IIIH version 16
Value applied 01
Justification of the choice of
data or description of
measurement methods and
procedures actually applied
Table IIIH1 for project emission The final discharge of treated effluent
into river MCF value of 01 for river discharge
Any comment Same discharge pathway as in the baseline
Data Parameter CODBL1
Data unit
Description COD removal efficiency of the baseline system (anaerobic treatment
system)
Source of data used 10 days measurement campaign
Value applied Anaerobic Treatment system 8880
Justification of the choice of
data or description of
measurement methods and
procedures actually applied
One year historical data not available
Any comment This data will be used for ex post emission reduction calculation
Data Parameter CODBL2
Data unit
Description COD removal efficiency of the baseline system (aerobic treatment
system)
Source of data used 10 days measurement campaign
Value applied Aerobic Treatment system 6369
Justification of the choice of
data or description of
measurement methods and
procedures actually applied
One year historical data not available
Any comment This data will be used for ex post emission reduction calculation
Data Parameter NCVCH4
Data unit MJkg
PROJECT DESIGN DOCUMENT FORM (CDM-SSC-PDD) - Version 03
CDM ndash Executive Board
22
Description Net Calorific Value of methane
Source of data used IPCC 2006 Default Value
Value applied 504
Justification of the choice of
data or description of
measurement methods and
procedures actually applied
IPCC 2006 value is used Volume 2 Chapter 1 Table 12
Any comment
Data Parameter NCVFF
Data unit MJkg
Description Net Calorific Value of diesel
Source of data used IPCC 2006 Default Value
Value applied 430
Justification of the choice of
data or description of
measurement methods and
procedures actually applied
IPCC 2006 value is used Volume 2 Chapter 1 Table 12
Any comment
Data Parameter EFCO2diesel
Data unit tCO2MWh
Description CO2 emission factor diesel genset
Source of data used AMS-IA version 14 point 14
Value applied 08
Justification of the choice of
data or description of
measurement methods and
procedures actually applied
Default value for diesel generation unit
Any comment
Data Parameter Grid Emission Factor
Data unit kgCO2ekWh
Description Emission factor for grid electricity in Peninsular Malaysia
Source of data used Pusat Tenaga Malaysia March 2010
Value applied 0672
Justification of the choice of
data or description of
measurement methods and
procedures actually applied
As per AMS-ID point 12
Any comment Study on Grid Connected Electricity Baselines in Malaysia 2008
B52 Ex-ante calculation of emission reductions
The ex ante emission reductions are calculated based on AMS-IIIH version 16 as per equations
explained in section E62 of PoA-DD Biogas PoA in Malaysia
PROJECT DESIGN DOCUMENT FORM (CDM-SSC-PDD) - Version 03
CDM ndash Executive Board
23
Calculation for AMS-IIIH
Baseline emissions
Source of baseline emissions Reference Applicable
(YN)
Comments
Wastewater and sludge treatment
systems equipped with a biogas
recovery facility shall be excluded
from the baseline
AMS-IIIH
Point 17
N No biogas recovery in the
baseline
Emissions on account of electricity or
fossil fuel used (BEpowery)
AMS-IIIH
Point 18 (i)
N For conservativeness no
emissions due to electricity or
fossil fuel will be claimed
BEpowery = 0
Methane emissions from baseline
wastewater treatment systems
(BEwwtreatmenty)
AMS-IIIH
Point 18 (ii)
Y Baseline includes anaerobic and
aerobic treatment conditions with
different MCF values selected as
per Table IIIH1
Methane emissions from baseline
sludge treatment systems (BEstreatmenty)
= 0
AMS-IIIH
Point 18 (iii)
N The baseline plant corresponds to
scenario Para 1(f) without sludge
treatment BEstreatmenty = 0
Methane emissions on account of
inefficiencies in the baseline
wastewater treatment systems and
presence of degradable organic carbon
in the treated wastewater discharged
into river (BEwwdischargey)
AMS-IIIH
Point 18 (iv)
Y Treated effluent is currently
discharged into the river
Methane emissions from the decay of
the final sludge generated by the
baseline treatment systems (BEsfinaly)
AMS-IIIH
Point 18 (v)
N Zero because in the baseline final
sludge used for soil application
BEsfinaly = 0
A) Calculation of baseline emissions
BEy = BEwwtreatmenty + BEwwdischargey
Abbreviation Description Value Source
BEy Baseline emissions in year y (tCO2e) 30762 Calculated
BEpowery Baseline emissions of diesel genset in year
y tCO2eyear 0 Calculated
BEwwtreatmenty Baseline emissions of the wastewater
treatment systems tCO2eyear 30663 Equation 2
BEwwdischargey
The methane emissions from degradable
organic carbon in treated wastewater
discharged tCO2eyear
100 Equation 6
A1) Baseline emissions
PROJECT DESIGN DOCUMENT FORM (CDM-SSC-PDD) - Version 03
CDM ndash Executive Board
24
Equation 2 BEwwtreatmenty = Qwwy (CODinflow1 y CODBL1 MCFwwtreatmentBL1) +
(CODinflow2y CODBL2 MCFwwtreatmentBL2) Boww UFBL GWPCH4
Abbreviation Description Value Source
BEwwtreatmenty Baseline emissions of the wastewater
treatment systems (tCO2eyear) 30663 Calculated
Qwwy Volume of wastewater treated in baseline
wastewater treatment system i in year y
(m3year)
333293
Volume based on 10 m3mt
FFB21 amp FFB historical data
(2009 ndash 2011)
CODinflow1y Chemical oxygen demand of the
wastewater inflow to the baseline treatment
system (anaerobic) in year y (tCOD m3)
0026905 10 days measurement
campaign
CODBL1 COD removal efficiency of the baseline
treatment system (anaerobic) () 8880
10 days measurement
campaign
CODinflow2y Chemical oxygen demand of the
wastewater inflow to the baseline treatment
system (aerobic) in year y (tCOD m3)
0003013 10 days measurement
campaign
CODBL2 COD removal efficiency of the baseline
treatment system (aerobic) () 6369
10 days measurement
campaign
MCFwwtreatmentBL 1 Methane correction factor for baseline
wastewater anaerobic treatment systems 08
MCF values as per table
IIIH1 anaerobic gt 2m
MCFwwtreatmentBL2 Methane correction factor for baseline
wastewater aerobic treatment systems 03
MCF values as per table
IIIH1 ndash poorly managed
Boww Methane producing capacity of the
wastewater (kg CH4kg COD) 025
IPCC 2006
UFBL Model correction factor to account for
model uncertainties 089
IPCC 2006
GWPCH4 Global Warming Potential for methane 21 IPCC 2006
A2) The methane emissions from degradable organic carbon in treated wastewater discharged
Equation 6 BEwwdischargey = Qwwy GWPCH4 Boww UFBL CODwwdischarge BLyMCFww BLdischarge
Abbreviation Description Value Source
BEwwdischargey
The methane emissions from degradable
organic carbon in treated wastewater
discharged (tCO2eyear)
100 Calculated
Qwwy Volume of treated wastewater discharged
in year y (m3year) 333293
Volume based on 10 m3mt
FFB22 amp FFB historical data
(2009 ndash 2011)
GWPCH4 Global warming potential of methane 21 IPCC 2006
Boww Methane producing capacity of the treated
wastewater (kgCH4 kgCOD) 025 IPCC 2006
21 Mill designed data for baseline effluent treatment plant 22 Mill designed data for baseline effluent treatment plant
PROJECT DESIGN DOCUMENT FORM (CDM-SSC-PDD) - Version 03
CDM ndash Executive Board
25
UFBL Model correction factor to account for
model uncertainties 089 IPCC 2006
CODwwdischarge BLy Chemical oxygen demand of the treated
wastewater discharged into sea river or
lake in the baseline situation in the year y
(tonnesm3)
0000642 10 days measurement
campaign
MCFwwBLdischarge Methane correction factor based on
discharge pathway in the baseline situation
(eg into sea river or lake) of the
wastewater (fraction)
01 MCF values as per table
IIIH1 version 16
Project activity emissions
The project activity emission sources as per the methodology and their relevance with respect to the
proposed CDM project activity are given below in a tabular format
Source of project activity
emission Reference
Applicable
(YN) Comments
CO2 emissions on account of
power and fossil fuel used by
the project activity facilities
(PEpowery)
AMS-IIIH
point 29(i)
Y The project activity uses the electricity
imported from the national grid
Methane emissions from
wastewater treatment systems
affected by the project
activity and not equipped with
biogas recovery in the project
situation (PEwwtreatmenty)
AMS-IIIH
point 29 (ii)
Y CH4 emissions from the poorly managed
aerobic lagoons
Methane emissions from
sludge treatment systems
affected by the project
activity and not equipped with
biogas recovery in the project
situation (PEstreatmenty)
AMS-IIIH
point 29 (iii)
N The project activity corresponds to
scenario (vi) without sludge treatment
PEystreatmenty = 0
Methane emissions on account
of inefficiency of the project
activity wastewater treatment
systems and presence of
degradable organic carbon in
treated wastewater
(PEwwdischargey)
AMS-IIIH
point 29 (iv)
Y Treated effluent from ETP will be
discharged into river
Methane emissions from the
decay of the final sludge
generated by the project
activity treatment systems
(PEsfinaly)
AMS-IIIH
point 29 (v)
N In the proposed CDM project activity
final sludge is used for soil application in
the same manner as in the baseline
PEsfinaly = 0
PROJECT DESIGN DOCUMENT FORM (CDM-SSC-PDD) - Version 03
CDM ndash Executive Board
26
Methane fugitive emissions on
account of inefficiencies in
capture systems (PEfugitivey)
AMS-IIIH
point 29 (vi)
Y Applicable to PEfugitivewwy
N The project activity corresponds to
scenario (vi) without sludge treatment
PEfugitivesy = 0
Methane emissions due to
incomplete flaring (PEflaringy)
AMS-IIIH
point 29 (vii)
Y Enclosed flaring system installed
Methane emissions from
biomass stored under
anaerobic conditions which
does not take place in the
baseline situation (PEbiomassy)
AMS-IIIH
point 29
(viii)
N In the project activity the biomass (PKS
+ mesocarp fibres) displaced will not be
stored under anaerobic conditions The
conditions of onsite storage are identical
in the baseline as in the project activity
The biomass will be sold to the market
on a regular basis PEbiomassy = 0
B) Calculation of project emissions
PEy = PEpowery + PEwwtreatmenty + PEww discharge y + PEfugitive y + PEflaring y
Abbreviation Description Value Source
PEy Project activity emissions in the year y
(tCO2eyr) 6050 Equation 8
PEpowery CO2 emissions on account of power used
by the project activity facilities (tCO2eyr) 604 -
PEwwtreatmenty Methane emissions from wastewater
treatment systems affected by the project
activity and not equipped with biogas
recovery in year y (tCO2eyr)
1523 Equation 9
PEwwdischargey
Methane emissions on account of
inefficiency of the project activity
wastewater treatment systems and presence
of degradable organic carbon in treated
wastewater (tCO2eyr)
126 Equation 12
PEfugitivey Methane fugitive emissions on account of
inefficiencies in capture systems (tCO2eyr) 3796 Equation 15
PEflaringy Methane emissions due to incomplete
flaring (tCO2eyr) 0 Equation 19
B1) Project emissions from CO2 emissions on account of power and fuel used by the project activity
facilities in year ldquoyrdquo in tCO2eyear
PEpowery = ECPJjy EFgridy
Abbreviation Description Value Source
PEpowery Project emissions from electricity
consumption in the year y (tCO2eyr) 604 Calculated
ECPJjy Internal power consumption from the grid 749 100 kW is the effective
PROJECT DESIGN DOCUMENT FORM (CDM-SSC-PDD) - Version 03
CDM ndash Executive Board
27
(MWh year) power based on the
equipments installed at the
site
EFgridy Grid Emission factor in Peninsular
Malaysia 2008 (tCO2 MWh) 0672
Study on Grid Connected
Electricity Baselines in
Malaysia 2008 published in
2010 by PTM
B2) Methane emissions from wastewater treatment systems affected by the project activity and not
equipped with biogas recovery in the project situation in year ldquoyrdquo in tCO2e
Equation 9 PEwwtreatment y = Qwwky CODinflowk y PJky MCFwwtreatmentPJk) Boww UFPJ GWPCH4
Abbreviation Description Value Source
PEwwtreatmenty
Methane emissions from wastewater
treatment systems affected by the project
activity and not equipped with biogas
recovery in the project situation (tCO2eyr)
1523 Calculated
Qwwky Volume of wastewater treated in project
activity wastewater treatment system k in
year y (m3year)
333293
Volume based on 10 m3mt
FFB23 amp FFB historical data
(2009 ndash 2011)
CODinflowky Chemical oxygen demand of the
wastewater inflow to the project activity
treatment system k in year y (tonnes COD
m3)
0002690 10 days measurement
campaign
PJky Chemical oxygen demand removal
efficiency of the project wastewater
treatment system k in year y (tm3)
measured based on inflow COD and
outflow COD in system k
90 Based on bio-digester COD
removal efficiency of 90
MCFwwtreatmentPJk Methane correction factor for project
wastewater treatment system k (MCF
values as per table IIIH1)
03
MCF values table IIIH1
Version 16 ndash aerobic poorly
managed (conservative)
Boww Methane generation capacity of the treated
wastewater (kg CH4kg COD) 025 IPCC 2006
UFPJ Model correction factor to account for
model uncertainties 112
IPCC 2006
GWPCH4 Global warming potential of methane 21 IPCC 2006
23 Mill designed data for baseline effluent treatment plant
PROJECT DESIGN DOCUMENT FORM (CDM-SSC-PDD) - Version 03
CDM ndash Executive Board
28
B3) Methane emissions on account of inefficiency of the project activity wastewater treatment
systems and presence of degradable organic carbon in treated wastewater in the year ldquoyrdquo (tonnes)
Equation 12 PEwwdischarge y = Qwwy GWPCH4 Boww UFPJ CODwwdischargePJy MCFwwPJdischarge
Abbreviation Description Value Source
PEwwdischargey
Methane emissions from degradable
organic carbon in treated wastewater
(tCO2eyr)
126 Calculated
Qwwy Quantity of wastewater treated in year y
(m3year) 333293
Volume based on 10 m3mt
FFB24 amp FFB historical data
(2009 ndash 2011)
CODwwdischargedPJ
y
Chemical oxygen demand of the treated
wastewater discharged into river in the
project situation in year y (tCOD m3)
0000642 10 days measurement
campaign
MCFwwPJ discharge
Methane correction factor based on
discharge pathway in the project situation
(river) of the wastewater (fraction)
01 MCF values as per table
IIIH1 Version 16
Boww Methane generation capacity of the treated
wastewater (kg CH4kg COD) 025 IPCC 2006
UFPJ Model correction factor to account for
model uncertainties 112 IPCC 2006
GWPCH4 Global warming potential of methane 21 IPCC 2006
B41) Methane fugitive emissions on account of inefficiencies in capture systems in the year ldquoyrdquo
(tonnes)
Equation 15 PEfugitivewwy = (1 ndash CFEww ) MEPywwtreatment GWPCH4
Abbreviation Description Value Source
PEfugitivey Methane fugitive emissions on account of
inefficiencies in capture systems (tCO2eyr) 3796 Calculated
CFEww Capture efficiency of the biogas recovery
equipment in the wastewater treatment
systems
09 AMS IIIH Version 16
MEPywwtreatment Methane emission potential of wastewater
treatment systems equipped with biogas
recovery system in year y (tCH4yr)
1808 Refer Equation 11 of AMS
IIIH version 16
GWPCH4 Global warming potential of methane 21 IPCC 2006
B42) Methane emission potential of wastewater treatment plant in the year ldquoyrdquo (tonnes)
Equation 16 MEPwwtreatmenty = Qwwy Boww UFPJ (CODremovedPJky MCFwwtreatmentPJk)
24 Mill designed data for baseline effluent treatment plant
PROJECT DESIGN DOCUMENT FORM (CDM-SSC-PDD) - Version 03
CDM ndash Executive Board
29
Abbreviation Description Value Source
MEPwwtreatmenty Methane emission potential of wastewater
treatment systems equipped with biogas
recovery system in year y (tonnes CH4yr)
1808 Calculated
Qyww Quantity of wastewater treated in year y
(m3year) 333293
Volume based on 10 m3mt
FFB25 amp FFB historical data
(2009 ndash 2011)
Boww Methane generation capacity of the treated
wastewater (kg CH4kg COD) 025 IPCC 2006
CODremovedPJy
The chemical oxygen demand removed by
the treatment anaerobic system of the
project activity equipped with biogas
recovery in the year y (tCOD m3)
0024214
10 days measurement
campaign amp bio-digester
design parameter
MCFwwtreatmentPJ
Methane correction factor for the project
wastewater treatment system k equipped
with biogas recovery equipment
08 MCF values as per table
IIIH1 Version 16
UFPJ Model correction factor to account for
model uncertainties 112 IPCC 2006
B5) Methane emissions due to incomplete flaring in the year ldquoyrdquo (tonnes)
Equation 13a PEflaringy = TMflaredy (1 - ηflarey) GWPCH4
Abbreviation Description Value Source
PEflaringy Methane emissions due to incomplete
flaring (tCO2eyr) 0 Calculated
TMflaredh Mass flow rate of methane flared in dry
basis in the hour h (tCH4 yr) 0 Calculated
ηflarey Flare efficiency in hour h based on default
values 50
Tools for methane flaring
(open flare) for conservative
GWPCH4 Global warming potential of methane 21 IPCC 2006
Leakage emissions
No leakage emission will occur in the project activity
LEy1 = 0
Emission reductions
Equation 22 ERy ex ante = BEy ex ante ndash (PEy ex ante + LEy ex ante)
25 Mill designed data for baseline effluent treatment plant
PROJECT DESIGN DOCUMENT FORM (CDM-SSC-PDD) - Version 03
CDM ndash Executive Board
30
Abbreviation Description Value Source
ERy1 ex ante Ex ante emission reduction in year y
(tCO2e) 24712 Equation 22
BEy1 ex ante Ex ante baseline emissions in year y
(tCO2e) 30762 Equation 1
PEy1 ex ante Ex ante project emissions in year y (tCO2e) 6050 Equation 8
LEy1 ex ante Ex ante Leakage emissions in year y
(tCO2e) 0 -
Calculation for AMS-ID
Baseline emissions
Electricity generated from biogas engines will be exported to the Peninsular Malaysia National Grid The
baseline emissions are described in AMS-ID (Version 17 EB 61) as the ldquoproduct of electrical energy
baseline expressed in kWh of electricity produced by the renewable energy generating unit multiplied by
an emission factorrdquo
Baseline emissions due to electricity exported to the grid in the year ldquoyrdquo (tonnes)
BEEGy = EGBLy EFCO2gridy
Abbreviation Description Value Source
BEEGy Baseline emissions in year y (tCO2eyr) 4568 Calculated
EGBLy
Quantity of net electricity supplied to the
grid as a result of the implementation of the
project activity in year y (kWh yr)
6797625 Calculated
EFCO2gridy
CO2 emission factor of the grid in year
(tCO2kWh) 0672
Study on Grid Connected
Electricity Baselines in
Malaysia 2008 published in
2010 by PTM
Project Activity Emissions
As per AMS-ID (Version 17 EB 61) project emissions for renewable energy project activities are zero
PEEGy = 0
Leakage
If the energy generating equipment is transferred from another activity leakage is to be considered
No leakage emission will occur in the project activity LEy = 0
PROJECT DESIGN DOCUMENT FORM (CDM-SSC-PDD) - Version 03
CDM ndash Executive Board
31
Emission reductions
ERy = BEy ndash PEy - LEy
Abbreviation Description Value Source
ERy Emission reduction in year y (tCO2ey) 4568 -
BEy Baseline emissions in year y (tCO2ey) 4568 -
PEy Project emissions in year y (tCO2ey) 0 -
LEy Leakage emissions in year y (tCO2ey) 0 -
Calculation for AMS-IA
Baseline emissions
The energy baseline is the fuel consumption of the technology in use or that would have been used in the
absence of the project activity to generate the equivalent quantity of energy Option 2 is applied This
methodology is only apply shall the recovered is in excess after export to the grid
Annual electricity sent to the mill for FF displacement in the year ldquoyrdquo (kWh)
EBLy = ΣEGiy (1 ndash l)
Abbreviation Description Value Source
EBLy Annual energy baseline (kWhyr) Calculated
EGiy
The estimated annual output of the
renewable energy technologies of the group
of i renewable energy technologies
installed (kWhyr)
0 Estimated
l
Average technical distribution losses that
would have been observed in diesel
powered mini-grids installed by public
programmes or distribution companies in
isolated areas expressed as a fraction
0 Conservative by applying
Zero (0)
Baseline electricity sent to the mill for FF displacement in the year ldquoyrdquo (tonnes)
BECO2y = EBLy EFCO2
Abbreviation Description Value Source
BECO2y Baseline emission in the year y (tCO2yr) 0 Calculated
EBLy Annual energy baseline (kWhyr) 0 Calculated
EFCO2 CO2 emission factor (tCO2kWh) 08
Default value which is
derived from diesel
generation units is used
PROJECT DESIGN DOCUMENT FORM (CDM-SSC-PDD) - Version 03
CDM ndash Executive Board
32
Project Activity Emissions
As per AMS-IA (Version 14 EB 54) project emissions for renewable energy project activities are zero
PEy = 0
Leakage
If the energy generating equipment is transferred from another activity or if the existing equipment is
transferred to another activity leakage is to be considered
No leakage emission will occur in the project activity LEy = 0
B53 Summary of the ex-ante estimation of emission reductions
Estimated emission reductions (total project activity)
Year
Estimation of
project activity
emissions (tCO2e)
Estimation of
baseline emissions
(tCO2e)
Estimation of
leakage (tCO2e)
Estimation of
overall emission
reductions (tCO2e)
2012 504 2944 0 2440
2013 6050 35330 0 29280
2014 6050 35330 0 29280
2015 6050 35330 0 29280
2016 6050 35330 0 29280
2017 6050 35330 0 29280
2018 6050 35330 0 29280
2019 5546 32386 0 26840
Total (tCO2) 42350 247310 0 204960
The starting date of the crediting period is 01122012 or the date of registration whichever is later
Estimated emission reductions for AMS-IIIH
Year
Estimation of
project activity
emissions (tCO2e)
Estimation of
baseline emissions
(tCO2e)
Estimation of
leakage (tCO2e)
Estimation of
overall emission
reductions (tCO2e)
2012 504 2563 0 2059
2013 6050 30762 0 24712
PROJECT DESIGN DOCUMENT FORM (CDM-SSC-PDD) - Version 03
CDM ndash Executive Board
33
2014 6050 30762 0 24712
2015 6050 30762 0 24712
2016 6050 30762 0 24712
2017 6050 30762 0 24712
2018 6050 30762 0 24712
2019 5546 28199 0 22653
Total (tCO2) 42350 215334 0 172984
The starting date of the crediting period is 01122012 or the date of registration whichever is later
Estimated emission reductions for AMS-ID
Year
Estimation of
project activity
emissions (tCO2e)
Estimation of
baseline emissions
(tCO2e)
Estimation of
leakage (tCO2e)
Estimation of
overall emission
reductions (tCO2e)
2012 0 381 0 381
2013 0 4568 0 4568
2014 0 4568 0 4568
2015 0 4568 0 4568
2016 0 4568 0 4568
2017 0 4568 0 4568
2018 0 4568 0 4568
2019 0 4187 0 4187
Total (tCO2) 0 31976 0 31976
The starting date of the crediting period is 01122012 or the date of registration whichever is later
Estimated emission reductions for AMS-IA
Year
Estimation of
project activity
emissions (tCO2e)
Estimation of
baseline emissions
(tCO2e)
Estimation of
leakage (tCO2e)
Estimation of
overall emission
reductions (tCO2e)
2012 0 0 0 0
2013 0 0 0 0
2014 0 0 0 0
2015 0 0 0 0
2016 0 0 0 0
PROJECT DESIGN DOCUMENT FORM (CDM-SSC-PDD) - Version 03
CDM ndash Executive Board
34
2017 0 0 0 0
2018 0 0 0 0
2019 0 0 0 0
Total (tCO2) 0 0 0 0
The starting date of the crediting period is 01122012 or the date of registration whichever is later
B6 Application of the monitoring methodology and description of the monitoring plan
B61 Description of the monitoring plan
The parameters to be monitored are
Please note that the amount of methane recovered and fuelled or flared (MDy ) is calculated as follows
MDy = TMfuelledy + TMflaredy Equation A
Where Description Units
MDy Quantity of methane recovered and fuelled or flared in the year y tonnes CH4year
TMfuelledy Quantity of methane fuelled in the year y tonnes CH4year
TMflaredy Quantity of methane flared in year y tonnes CH4year
Where
TMfuelledy = FVfuelledh fvCH4h ηfuelledh ρCH4n) 1000 Equation B
Where Description Units
TMfuelledy Quantity of methane fuelled in the year y tonnes CH4year
FVfuelledh Volumetric flow rate of the fuelled biogas gas at normal conditions in
hour h
Nm3 biogashour
ηfuelledh 100 for gainful purpose26
fvCH4h Volumetric fraction of methane in the biogas gas in the hour h
ρCH4n Density of methane at normal conditions kgCH4Nm3CH4
And
TMflaredy = FVflaredh fvCH4h ηflareh ρCH4n) 1000 Equation C
Where Description Units
TMflaredy Quantity of methane flared in year y tonnes CH4year
FVflaredh Volumetric flow rate of the flared biogas gas at normal conditions in
hour h
Nm3 biogashour
26 AMS-IIIH point 35
PROJECT DESIGN DOCUMENT FORM (CDM-SSC-PDD) - Version 03
CDM ndash Executive Board
35
ηflareh Flare efficiency in the hour h
fvCH4h Volumetric fraction of methane in the biogas gas in the hour h
ρCH4n Density of methane at normal conditions kgCH4Nm3CH4
Data Parameter ID1 Qwwy
Data unit m3 month
Description The flow of wastewater entering the bio-digester
Source of data Measurement by project participant by using a flowmeter
Value of data ~ 28000
Brief description of
measurement methods and
procedures to be applied
The flow is measured with an online flow meter or equivalent
QAQC procedures to be
applied (if any) Data are monitored continuously and recorded periodically
(monthly or at shorter interval) in a data log file (DLF)
Uncertainty level of data low
Maintenance and calibration as per manufacturer‟s specifications
or at least once every three (3) years
Any comment
Data Parameter ID2 CODwwuntreatedy
Data unit tCOD m3
Description Raw COD of wastewater entering the bio-digester
Source of data Laboratory (internal and external)
Value of data ~ 0030230
Brief description of
measurement methods and
procedures to be applied
Measure of COD according to national or international standards
COD is measure through representative sampling
QAQC procedures to be
applied (if any) Minimum once a month COD sampling to ensure a 9010
confidenceprecision level
COD reports are recorded manually
Uncertainty level of data low
Maintenance and calibration as per manufacturer‟s specifications
or at least once every three (3) years for internal laboratory
equipment
Any comment
Data Parameter ID3 CODwwtreatedy
Data unit tCOD m3
Description COD of treated wastewater leaving the bio-digester
Source of data Laboratory (internal and external)
Value of data ~ 0003023
Brief description of
measurement methods and
procedures to be applied
Measure of COD according to national or international standards
COD is measure through representative sampling
QAQC procedures to be
applied (if any) Minimum once a month COD sampling to ensure a 9010
confidenceprecision level
COD reports are recorded manually
Uncertainty level of data low
PROJECT DESIGN DOCUMENT FORM (CDM-SSC-PDD) - Version 03
CDM ndash Executive Board
36
Maintenance and calibration as per manufacturer‟s specifications
or at least once every three (3) years for internal laboratory
equipment
Any comment
Data Parameter ID5 End-use of the final sludge
Data unit ndash
Description The final sludge generated by the project activity will be sent to control
landfill site if any
Source of data By project participant
Value of data ndash
Brief description of
measurement methods and
procedures to be applied
The final disposal of the sludge will be monitored during the crediting
period if any For each disposal of the sludge the following will be
recorded disposal site and date of disposal
QAQC procedures to be
applied (if any)
Any comment
Data Parameter ID6 FVflaredh
Data unit Nm3 hour
Description Volumetric flow of biogas recovered and flared at normal conditions in
the hour h
Source of data By project participant
Value of data 0
Brief description of
measurement methods and
procedures to be applied
The volume of biogas will be measured with a normalised flow meter or
calculated from the volumetric flow pressure temperature
Biogas volume and methane content measurements shall be on the same
basis (wet or dry)
QAQC procedures to be
applied (if any) The biogas flow is monitored continuously recorded and stored
electronically in a data log file (DLF) (monthly or at shorter
interval)
Data Parameter ID4 CODww dischargey
Data unit tCOD m3
Description COD of treated wastewater discharge into river by treatment system
Source of data Laboratory (internal and external)
Value of data ~ 0000100
Brief description of
measurement methods and
procedures to be applied
Measure of COD according to national or international standards
COD is measure through representative sampling
QAQC procedures to be
applied (if any) Minimum once a month COD sampling to ensure a 9010
confidenceprecision level
COD reports are recorded manually
Uncertainty level of data low
Maintenance and calibration as per manufacturer‟s specifications
or at least once every three (3) years for internal laboratory
equipment
Any comment
PROJECT DESIGN DOCUMENT FORM (CDM-SSC-PDD) - Version 03
CDM ndash Executive Board
37
Uncertainty level of data low
Maintenance and calibration as per manufacturer‟s specifications
or at least once every 3 years
Any comment
Data Parameter ID7 FVfuelledgas engineh
Data unit Nm3 hour
Description Volumetric flow of biogas recovered and fuelled (gas engine) at normal
conditions in the hour h
Source of data By project participant
Value of data ~ 509
Brief description of
measurement methods and
procedures to be applied
The volume of biogas will be measured with a normalised flow meter or
calculated from the volumetric flow of biogas pressure temperature
Biogas volume and methane content measurements shall be on the same
basis (wet or dry)
QAQC procedures to be
applied (if any) The biogas flow is monitored continuously recorded and stored
electronically in a data log file (DLF) (monthly or at shorter
interval)
Uncertainty level of data low
Maintenance and calibration as per manufacturer‟s specifications
or at least once every 3 years
Any comment
Data Parameter ID8 FVfuelledboilerh
Data unit Nm3 hour
Description Volumetric flow of biogas recovered and fuelled (boilers) at normal
conditions in the hour h
Source of data By project participant
Value of data ~ 0
Brief description of
measurement methods and
procedures to be applied
The volume of biogas will be measured with a normalised flow meter or
calculated from the volumetric flow of biogas pressure temperature
Biogas volume and methane content measurements shall be on the same
basis (wet or dry)
QAQC procedures to be
applied (if any) The biogas flow is monitored continuously recorded and stored
electronically in a data log file (DLF) (monthly or at shorter
interval)
Uncertainty level of data low
Maintenance and calibration as per manufacturer‟s specifications
or at least once every 3 years
Any comment
Data Parameter ID9 wCH4h
Data unit
Description Methane content in biogas in same basis (wetdry) as the biogas flows in
year y
Source of data By project participant using a gas analyzer
Value of data ~ 60
PROJECT DESIGN DOCUMENT FORM (CDM-SSC-PDD) - Version 03
CDM ndash Executive Board
38
Brief description of
measurement methods and
procedures to be applied
Using calibrated gas analyzer either continuous or periodical
measurement at confidenceprecision level of 9010
QAQC procedures to be
applied (if any) In case a continuous gas analyser is used data will be recorded
and stored electronically in a data log file (DLF) every hour or at
shorter interval
Uncertainty level of data low
Maintenance and calibration as per manufacturer‟s specifications
or at least once every 3 years
Any comment See also clarification by EB Meth Panel 30102009 ndash SSC_360
httpcdmunfcccintUserManagementFileStorageAM_CLAR_
QS83SX5B7WM6UGZE31JYQEQ4F65F6V
The biogas flow and the methane content measurements shall be
carried out close to each others
Data Parameter ID10 Tbiogas
Data unit ordmC
Description Temperature of biogas
Source of data Temperature probe
Value of data 20 ndash 65
Brief description of
measurement methods and
procedures to be applied
By project participant
QAQC procedures to be
applied (if any) Shall be measured and recorded at the same time when methane
content in biogas (ID8) is measured
Uncertainty level of data low
Maintenance and calibration as per manufacturer‟s specifications
or at least once every 3 years
Any comment Pressure and temperature are required to determine the density of
the methane If the biogas flow meter employed measures flow
pressure and temperature and displaysoutputs normalised flow of
biogas there is no need to separate monitoring of pressure and
temperature of the biogas
Data Parameter ID11 Pbiogas
Data unit Bar(g)
Description Pressure of biogas
Source of data By project participant
Value of data 50 ndash 200 mbar
Brief description of
measurement methods and
procedures to be applied
Pressure measurement device
QAQC procedures to be
applied (if any) Shall be measured and recorded at the same time when methane
content in biogas (ID8) is measured
Uncertainty level of data low
Maintenance and calibration as per manufacturer‟s specifications
or at least once every three (3) years
Any comment Pressure and temperature are required to determine the density of
the methane If the biogas flow meter employed measures flow
PROJECT DESIGN DOCUMENT FORM (CDM-SSC-PDD) - Version 03
CDM ndash Executive Board
39
pressure and temperature and displaysoutputs normalised flow of
biogas there is no need to separate monitoring of pressure and
temperature of the biogas
Shall be measured at the same time when methane content in
biogas (ID9) is measured
Parameter ID12 ηflareh (enclosed flare)
Unit
Description Enclosed flare efficiency in the hour h
Source of data Calculated
Value of data 0 or 50 or 90
Brief description of
measurement methods and
procedures to be applied
This yearly efficiency will be based on hourly flare efficiencies calculated
as per the provisions in the ldquoTool to determine project emissions from
flaring gases containing methanerdquo
The hourly flare efficiency will be calculated based on
0 if the temperature in the exhaust gas of the flare (Tflare) is
below 500 degC for more than 20 minutes during the hour h
50 if the temperature in the exhaust gas of the flare (Tflare) is
above 500 degC for more than 40 minutes during the hour h but the
manufacturer‟s specifications on proper operation of the flare are
not met at any point in time during the hour h
90 if the temperature in the exhaust gas of the flare (Tflare) is
above 500 degC for more than 40 minutes during the hour h and the
manufacturer‟s specifications on proper operation of the flare are
met continuously during the hour h
QAQC procedures to be
applied (if any) Data are logged hourly in a data log file (DLF)
Uncertainty level of data low
Any comment For enclosed flare
Or
Parameter ID13 ηflareh (open flare)
Unit
Description Flare efficiency in the hour h
Source of data Calculated
Value of data 0 or 50
Brief description of
measurement methods and
procedures to be applied
This yearly efficiency will be based on hourly flare efficiencies calculated
as per the provisions in the ldquoTool to determine project emissions from
flaring gases containing methanerdquo
The hourly flare efficiency will be calculated based on the duration of
time during which the flame is detected by the thermocouple (or flame
detector) installed in the open flare
Flare efficiency in hour h is based on default values
0 if the flame detected for not more than 20 minutes during the
hour h and
PROJECT DESIGN DOCUMENT FORM (CDM-SSC-PDD) - Version 03
CDM ndash Executive Board
40
50 if the flame detected for more than 20 minutes during the
hour h
A flame detector or thermocouple will be used
QAQC procedures to be
applied (if any) Data are logged hourly in a data log file (DLF)
Uncertainty level of data low
Any comment The only monitored parameter related to the flare is its efficiency Indeed
according to the clarification SSC_19927 of the methodology AMS IIIH
version 9 accepted by the SSC WG on the 3092008 ldquoIf a thermocouple
is used as a flame detection system it is sufficient to reach the given
minimum temperature from the manufacturer ldquo Hence it is not necessary
to monitor the temperature of the open type flares (Tflare)
Data Parameter ID14 ECPJjy
Data unit MWh
Description The yearly grid electricity consumption of the project activity for the year
bdquoy‟
Source of data Onsite instrument
Value of data ~749
Brief description of
measurement methods and
procedures to be applied
The grid electricity consumption of the project activity is measured
continuously with an energy meter (cumulative reading)
QAQC procedures to be
applied (if any) Data are monitored continuously and recorded periodically
(yearly or at shorter interval) in a data log file (DLF)
Uncertainty level of data low
Maintenance and calibration as per manufacturer‟s specifications
or at least once every three (3) years
Any comment
Data Parameter ID15 EGBLy
Data unit MWh
Description Quantity of net electricity generated and send to grid in year y
Source of data By project participant
Value of data ~ 6798
Brief description of
measurement methods and
procedures to be applied
The electricity generated and sent to grid is measured continuously with
an energy meter (cumulative readings)
QAQC procedures to be
applied (if any) Data are monitored continuously and recorded periodically
(yearly or at shorter interval) in a data log file (DLF)
Uncertainty level of data low
Maintenance and calibration as per manufacturer‟s specifications
or at least once every 3 years
Any comment As per AMS-ID
27 The clarification SSC_199 if available here (last access on the 24052011)
httpcdmunfcccintfilestorageAM_AM_CLAR_HIOZ5CS1PASC187C0JQ668L2E9RCRJResponse20WG20provided
20at20SSC20WG2017pdft=bU98MTMwNjIxNjY0OS4xMQ==|BOKHqtO94N6XF1N2N1vo8Ori-Rc=
PROJECT DESIGN DOCUMENT FORM (CDM-SSC-PDD) - Version 03
CDM ndash Executive Board
41
Or
Data Parameter ID16 EGmilly
Data unit MWh
Description Quantity of annual output of renewable energy sent to the mill in year y
Source of data By project participant
Value of data ~ 0
Brief description of
measurement methods and
procedures to be applied
The electricity generated and sent to mill to displace diesel use in diesel
gensets is measured continuously with an energy meter (cumulative
readings)
QAQC procedures to be
applied (if any) Data are monitored continuously and recorded periodically
(yearly or at shorter interval) in a data log file (DLF)
Uncertainty level of data low
Maintenance and calibration as per manufacturer‟s specifications
or at least once every 3 years
Any comment As per AMS-IA
Data Parameter ID17 Displacement of Biomass
Data unit Mt
Description Total amount of biomass (PKS) displaced from biomass boilers
Source of data Weighing bridge
Value of data Measurement at site
Brief description of
measurement methods and
procedures to be applied
Biomass (PKS) displaced due to the project activity will be weighed
using weighing bridge at the palm oil mill
QAQC procedures to be
applied (if any) Monthly calculation based on every single trip of trucks recorded
Data is recorded manually in a data log file based on the weighing
records
Maintenance and calibration as per manufacturer‟s specifications
Uncertainty level of data low
Any comment In the project activity the biomass (PKS) displaced will not be stored
under anaerobic conditions The conditions of onsite storage are identical
in the baseline as in the project activity The biomass will be sold to the
market on a regular basis PEbiomassy = 0
A final monitoring plan will be prepared prior the initial verification based on the as-built project activity
It will address the following aspects
MONITORING
The Project will be managed by CME with the involvement from Project Implementer CME will ensure
safety in operation of the plant as well as in the monitoring of emission reduction which is generated from
the project activity
CME will implement and be responsible for the monitoring plan Their responsibility covers operation of
the monitoring maintenance of the monitoring equipment data collection and archiving and
management of total scheme of the monitoring CME and Project Implementer will assign specific trained
PROJECT DESIGN DOCUMENT FORM (CDM-SSC-PDD) - Version 03
CDM ndash Executive Board
42
personnel during project implementation for the overall monitoring measurement and reporting of key
parameters as required in this PDD
DATA LOGGING AND STORAGE
The data measured by the instruments will be collected and stored in a data logging system The data will
be retrieved remotely by modem or directly on site
If data cannot be retrieved no emissions reductions will be claimed for the period of data failure The
data collected will be recorded in a central data base Access to production data will be restricted All
records and data (hard copy and soft copy) will be archived up to two years after the end of the crediting
period or the last issuance of CERs for this project activity whichever occurs later
CALIBRATION AND MAINTENANCE PROCEDURES MALFUNCTION OF EQUIPMENT
Maintenance includes all preventive and corrective actions necessary for the good functioning of the
equipment such as
Visual control of the equipment state and real-time check of displayed parameters
Cleaning up the equipment and the sensors
Adding lubricant
Replacement and change of defective parts
Calibration of equipment consists in verifying by comparison with a standard the accuracy of a
measuring instrument
Measuring instruments will be periodically and appropriately calibrated according to the procedures
timing and methods recommended by the manufacturer or nationalinternational standards as available
General malfunction of equipment
Daily inspections of the equipment will allow controlling equipment failure If equipment fails the
supplier will be notified and repairs will be carried out If the damaged equipment cannot be repaired it
will be replaced at the earliest In some cases portable tools will be used in order to carry out daily
monitoring of the missing parameter(s) In such case this data will be recorded manually
Discrepancies
To avoid discrepancies between projected data in the PDD and actual data (eg due to deferred starting
date malfunction of equipment) cross-checks between internal meter readings and external sources (eg
electricity invoices) will be carried out Any source of inconsistencies will be clarified
Case of emergency
For the case of emergency (earthquakes explosions fires etc) an emergency preparedness plan will be
adapted to the project activity All employees involved in the project on-site will be trained in the code of
conduct and required actions at time of commissioning of the plant
PROJECT DESIGN DOCUMENT FORM (CDM-SSC-PDD) - Version 03
CDM ndash Executive Board
43
OPERATIONAL AND MANAGEMENT STRUCTURE
The CDM monitoring team will be composed by the following staff
Position Report to
Operators
Project owner Supervisors (technicalmaintenance)
Operation Engineer
CDM monitoring project manager External CDM consultant
TRAINING OF MONITORING PERSONNEL
The maintenance will be conducted in-house by staff employed and trained by the Project Participants
Employees involved in the monitoring will be trained internally andor externally Training may include
inter alia
a) Review of equipment and captors
b) Calibration requirement
c) Configuration of monitoring equipment
d) Maintenance requirement
C1 Please indicate the level at which environmental analysis as per requirements of the CDM
modalities and procedures is undertaken Justify the choice of level at which the environmental
analysis is undertaken
radic Please tick if this information is provided at the PoA level In this case sections C2 and C3
need not be completed in this form
C2 Documentation on the analysis of the environmental impacts including transboundary
impacts
The host country does not require an analysis of environmental impacts As the project involves reduction
of GHG through recovery and controlled combustion which improves the quality of air therefore there
are no significant environmental impacts identified
C3 Please state whether an environmental impact assessment is required for a typical CPA
included in the programme of activities (PoA) in accordance with the host Party lawsregulations
In accordance with Malaysia environmental regulations Environmental Quality (Prescribed Activities
Environmental Impact Assessment) Order 1987 an Environmental Impact Assessment (EIA) is not
required for this CPA
PROJECT DESIGN DOCUMENT FORM (CDM-SSC-PDD) - Version 03
CDM ndash Executive Board
44
SECTION D Stakeholdersrsquo comments
D1 Please indicate the level at which local stakeholder comments are invited Justify the
choice
Please tick if this information is provided at the PoA level In this case sections D2 to D4 need
not be completed in this form
D2 Brief description how comments by local stakeholders have been invited and compiled
The stakeholder meeting was conducted at the office of Kilang Sawit Felda Triang on 05032012 There
were 37 stakeholders attending the consultation Posters were pasted at the guard house and at the
entrance to office 1 week before the stakeholder consultation to inform the locals stakeholders which
comprise mostly the workers of the mill 20 stakeholders out of the 37 who attended the consultation are
2nd generation of the Felda settlers who live in the vicinity to the project activity and adequately represent
the local community composed entirely of Felda settlers (no other people live in the vicinity of this
remote plantation) Continuous input of ideascomments were allowed to all stakeholders who could
either send their input though an email account especially setup for the biogas project or directly inform
the project proponents
During the meeting presentations were made by the project owner to outline the proposed project activity
in a non-technical manner (including environmental social and technological considerations) climate
change and the role of the CDM Attendees were given opportunity to raise their concern and opinion
about the proposed project activity during the question and answer session
D3 Summary of the comments received
PROJECT DESIGN DOCUMENT FORM (CDM-SSC-PDD) - Version 03
CDM ndash Executive Board
45
Below are the questions raised during the stakeholder meeting
NAME QUESTION
Mohd Tarmizi Bin Mat
Daud What is CDM in Bahasa Malaysia
Mohd Tarmizi Bin Mat
Daud What is DoE‟s standard for treated water released into river
Mohd Azizi Bin Abdul
Aziz
Would the biogas be captured from the existing effluent treatment ponds or a
new structure
Azhar Bin Abdul What to do with the captured biogas from the bioreactor
D4 Report on how due account was taken of any comments received
Below are the answers to the questions asked during the stakeholder meeting
QUESTION ANSWER
What is CDM in Bahasa Malaysia
The meaning of CDM in Bahasa Malaysia is Mekanisme
Pembangunan Bersih or in English is Clean Development
Mechanism
By Abd Karim Bin Mohd Zin
What is DoE‟s standard for treated
water released into river
The discharge standard for BOD into river is less than 100ppm
By Abd Karim Bin Mohd Zin
Would the biogas be captured from
the existing effluent treatment
ponds or a new structure
New bioreactor will be constructed to replace the existing anaerobic
lagoon treatment system The new bioreactor will capture the
biogas produced from this anaerobic treatment process
By Abd Karim Bin Mohd Zin
What to do with the captured
biogas from the bioreactor
The biogas recovered from the bioreactor will mainly contain
methane (approximately 60) and the rest are CO2 H2 and H2S
Currently the biogas is just released to the atmosphere from the
existing open lagoons system During the project activity captured
biogas will be combusted thus will improve the air quality
By Abd Karim Bin Mohd Zin
PROJECT DESIGN DOCUMENT FORM (CDM-SSC-PDD) - Version 03
CDM ndash Executive Board
46
Annex 1
CONTACT INFORMATION ON ENTITYINDIVIDUAL RESPONSIBLE FOR THE SMALL-
SCALE CPA
Organization Felda Palm Industries Sdn Bhd (359584-V)
StreetPOBox Jalan Gurney 1
Building Balai Felda 4th Floor
City Kuala Lumpur
StateRegion Wilayah Persekutuan
PostfixZIP 54000
Country Malaysia
Telephone (03) 2692 8066
FAX (03) 2693 4148
URL wwwfeldanetmy
Represented by
Title Head of Department
Salutation Mr
Last Name Busu
Middle Name
First Name Zainuri
Department Biomass
Mobile
Direct FAX
Direct tel
Personal E-Mail zainuribfeldanetmy
Organization Ably Carbon Sdn Bhd
StreetPOBox Jalan Ipoh Kecil
Building No 17
City Kuala Lumpur
StateRegion
PostfixZIP 50350
Country Malaysia
Telephone +60 3 4042 1177
FAX +60 3 4044 4166
E-Mail stephanevidailletably-carboncom
URL
Represented by Stephane Vidaillet
Title Chairman
Salutation Mr
Last Name Vidaillet
Middle Name
First Name Steacutephane
Department
Mobile +33 6 59111 5600
Direct FAX
PROJECT DESIGN DOCUMENT FORM (CDM-SSC-PDD) - Version 03
CDM ndash Executive Board
47
Direct tel
Personal E-Mail stephanevidailletably-carboncom
PROJECT DESIGN DOCUMENT FORM (CDM-SSC-PDD) - Version 03
CDM ndash Executive Board
48
Annex 2
INFORMATION REGARDING PUBLIC FUNDING
The project activity is not receiving any funding from parties included in Annex 1 of the Kyoto Protocol
SMALL-SCALE CDM PROGRAMME ACTIVITY DESIGN DOCUMENT FORM (CDM-SSC-CPA-DD) - Version 01
NAME TITLE OF THE PoA Biogas Recovery and Utilization PoA Projects in
Malaysia
CDM ndash Executive Board page 49
This template shall not be altered It shall be completed without modifyingadding headings or logo format or font
Annex 3
BASELINE INFORMATION
1 2
Year 2009 2010 2011 2012 2013 2014
FFB (mtyr) 343720 345910 310250 333293 333293 333293
POME Volume
(cumyr)[1] 343720 345910 310250 333293 333293 333293
Mill Opearing hour (hryr) 68865 69225 6209 6673 6673 6673
PKS (mtyr) 18905 19025 17064 18331 18331 18331
3 4 5 6 7 8 9 10
2015 2016 2017 2018 2019 2020 2021 2022
333293 333293 333293 333293 333293 333293 333293 333293
333293 333293 333293 333293 333293 333293 333293 333293
6673 6673 6673 6673 6673 6673 6673 6673
18331 18331 18331 18331 18331 18331 18331 18331
SMALL-SCALE CDM PROGRAMME ACTIVITY DESIGN DOCUMENT FORM (CDM-SSC-CPA-DD) - Version 01
NAME TITLE OF THE PoA Biogas Recovery and Utilization PoA Projects in
Malaysia
CDM ndash Executive Board page 50
This template shall not be altered It shall be completed without modifyingadding headings or logo format or font
10 days measurement campaign for baseline wastewater treatment system
Day Date
ETP
Inlet
Anaerobic
system (mgl)
Outlet
Anaerobic
system (mgl)
Outlet Algae
System (mgl)
Final
Discharge to
River (mgl)
1 23-Feb-12 35693 3120 811 603
2 25-Feb-12 19511 2559 1186 83
3 26-Feb-12 32864 2767 749 437
4 27-Feb-12 30195 2330 1210 404
5 28-Feb-12 32436 1927 1188 941
6 29-Feb-12 38259 4256 896 717
7 1-Mar-12 28717 3584 1232 695
8 3-Mar-12 31002 4660 1658 1210
9 4-Mar-12 22400 4346 1389 963
10 5-Mar-12 31226 4301 1971 1165
Average 30230 3385 1229 722
ETP
COD removal efficiency (anaerobic system) 8880
COD removal efficiency (Facultativealgae system) 6369
COD removal efficiency (Bio-polishing system) 4127
Total COD removal efficiency of the treatment system 9761
The COD of the raw effluent during ex-post may vary from the one year historical records depending on
the improvement of the production process (outside of project boundary) thus ERex-post may vary from the
estimated ERex-ante
SMALL-SCALE CDM PROGRAMME ACTIVITY DESIGN DOCUMENT FORM (CDM-SSC-CPA-DD) - Version 01
NAME TITLE OF THE PoA Biogas Recovery and Utilization PoA Projects in
Malaysia
CDM ndash Executive Board page 51
This template shall not be altered It shall be completed without modifyingadding headings or logo format or font
Annex 4
MONITORING INFORMATION
General information
Monitoring refers to the collection and archiving of all relevant data necessary for determining the
baseline measuring anthropogenic emissions by sources of greenhouse gases (GHG) within the project
boundary of a CDM project activity and leakage It includes developing suitable data collection methods
and data interpretation techniques for monitoring and verification of GHG emissions
On-line monitoring system
Most key meters required to determine GHG emissions and emission reductions will be monitored from a
central control point which will record meter readings at a pre-determined interval
Ensuring adequate maintenance and calibration of monitoring instruments
Specific maintenance repair or replacement of monitoring equipment will be recorded dated and
described
The calibration will occur at intervals determined on the basis of instrument manufacturers
recommendations stability purpose usage and history of repeatability Recalibration should be
performed whenever an event occurs that places the accuracy of the instrument in doubt
Calibration will take place at least once every three (3) years to ensure that the monitoring
equipments are properly installed and functioning properly
Calibration will be performed according to national or international standards
Last calibration certificates will be provided during periodic verification
Sampling procedure
Wherever a statistical sample is used for monitoring the ldquogeneral guidelines for sampling and surveys for
SSC project activitiesrdquo shall be used COD shall be measured from a composite sample to obtain a
representative value
Data archiving
The monitored data will be kept for a minimum of 2 years after the end of the crediting years by using
paper documents or electronic files
Identification of non-conformities
A verification of inconsistencies of the data recorded will be performed based for example on
The comparison of the calculated quantities of methane versus expected
Spot checks of field instruments (local reading) and data in the log file
Any discrepancies (completeness calculation errors transcription errors instrument calibration issues)
will be analyzed and actions taken to correct the problem
Ensuring adequate training of staff
All new staff members will undergo bdquoon job training‟ covering the monitoring requirements
The monitoring plan will be made available to staff member involved in the monitoring
A copy will be located in the control room at the site
SMALL-SCALE CDM PROGRAMME ACTIVITY DESIGN DOCUMENT FORM (CDM-SSC-CPA-DD) - Version 01
NAME TITLE OF THE PoA Biogas Recovery and Utilization PoA Projects in
Malaysia
CDM ndash Executive Board page 52
This template shall not be altered It shall be completed without modifyingadding headings or logo format or font
During the training the employees will sign a training attendance list All training records shall
be documented inclusive of training attendance training memo and training material if any
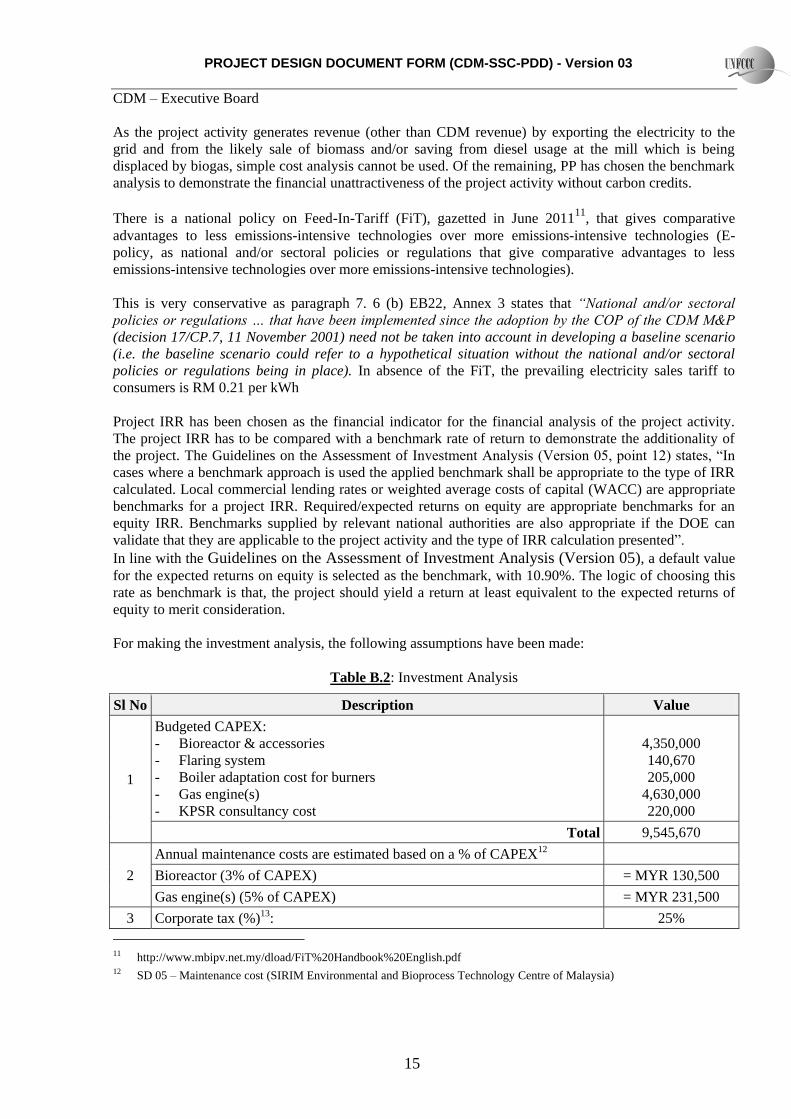
PROJECT DESIGN DOCUMENT FORM (CDM-SSC-PDD) - Version 03
CDM ndash Executive Board
16
Since losses can be carried forward indefinitely (so long as the ownership
remains unchanged) the incidence of taxation does not arise in the case of
this project activity
4
Manpower cost has been estimated based on 1 supervisor 2 operators 1
chargeman envisaged to be appointed and the ruling wagesalary structure
of the company14
182588 MYR yr
5 Salary increment rate has been applied based on the average expected
salary increment rate for year 20101115 40
6 Price of Biomass ex-factory (PKS) 156 MYRmt
7 Price of diesel 220 MYRliter
8 RE tariff export to grid (MYRkWh) 021
9
Laboratory Cost is estimated based on the quotations from accredited
laboratory anticipated number of tests and samples to be carried out and
transportation cost during the running and operating of the biogas plant for
maintaining optimum operating conditions
1920 MYR yr
10 Insurance premium per year ( of CAPEX)16 0412
11 Estimate of CER price (EUR) 8
12
Depreciation of equipment (years) has been provided as per the Inland
Revenue Authority regulations17 Since the project consists of only
environmental protection equipment it is entitled to initial capital
allowance of 40 and annual capital allowance of 20 as per the Inland
Revenue Authority notifications
4 years
13 Project life time for IRR calculation18 20 years
14
Residual value a fair value (5) of the project activity assets at the end of
the assessment period as per the Guidelines on The Assessment of
Investment Analysis version 05 EB 62
MYR 466284
Based on the above assumption the project IRR works out to be ndash 085 in contrast to the benchmark
rate of 1090 Thus the analysis proves that the project is not financially attractive
Sensitivity Analysis
A sensitivity analysis has also been conducted to test the robustness of the conclusions drawn Four (4)
factors have been identified as critical to IRR of the project viz project cost maintenance costs RE
tariff The results of sensitivity analysis are given below
13 SD 08 ndash Malaysian Tax and Business Booklet 201011 Page 12
httpwwwpwccomen_MYmyassetspublicationstaxbooklet1011pdf 14 SD 3 - Salary structure (biogas plant) 15 SD 09 - Salary increment rate (201011) 16 SD 2 - Biogas plant insurance policy 17 SD 08 ndash Malaysian Tax and Business Booklet 201011 Page 21
httpwwwpwccomen_MYmyassetspublicationstaxbooklet1011pdf 18 As per the Guidelines on the Assessment of Investment Analysis version 05 (Annex 5 EB 62 point 3) ldquoIn general a
minimum period of 10 years and a maximum of 20 years will be appropriaterdquo PP has chosen 20 years for financial
assessment as it is conservative
PROJECT DESIGN DOCUMENT FORM (CDM-SSC-PDD) - Version 03
CDM ndash Executive Board
17
Table B3 Sensitivity Analysis
FACTORS PROJECT IRR
-10 0 +10
Project cost -185 -085 033
Maintenance cost -491 -085 189
RE tariff 112 -085 -354
It could be seen from the above that even under the most optimistic conditions the project activity would
not yield a positive IRR let alone crossing the benchmark Therefore the project is not a business-as-
usual scenario and it is additional
Prior Consideration of CDM
As per the guidance of EB Meeting Report 49 Annex 22 the project proponent notified the UNFCCC and
the DNA of the intent to implement the project as a CDM project activity
Conclusion
The conclusion of the investment analysis remains identical to reasonable variations of the critical
assumptions (sensitivity analysis) Therefore the project activity IRR remains lower than the benchmark
In the above background it is proved that the project faces an investment barrier that establishes the
additionality
B4 Description of the sources and gases included in the project boundary and proof that the
small-scale CPA is located within the geographical boundary of the registered PoA
The emission sources and type of GHG which are included or excluded within the project boundary are
shown in the following table
Table B4 Emission Sources and Type of GHG
Source Gas Included Justification Explanation
Ba
seli
ne
Direct emissions
from the
wastewater
treatment processes
CO2 No Neutral CO2 emissions from biomass decaying
CH4 Yes Methane emissions from open lagoons treatment
process
N2O No Not significant Excluded for simplification and
conservativeness
Diesel usage in
diesel genset at mill
CO2 Yes CO2 emissions from combustion of diesel fuel
CH4 No Not significant Excluded for simplification and
conservativeness
N2O No Not significant Excluded for simplification and
conservativeness
Pro
ject
Act
ivit
y
Bio-digester
CO2 No Neutral CO2 emissions from biomass decaying
CH4 Yes Methane emissions from anaerobic treatment process
N2O No Not significant Excluded for simplification and
conservativeness
Existing
wastewater
treatment lagoons
CO2 No Neutral CO2 emissions from biomass decaying
CH4 Yes Methane emissions from poorly managed treatment
process (without aerators)
PROJECT DESIGN DOCUMENT FORM (CDM-SSC-PDD) - Version 03
CDM ndash Executive Board
18
(Facultative amp
algae system) N2O No
Not significant Excluded for simplification and
conservativeness
Gas engine(s)
(biogas
combustion)
CO2 No Neutral CO2 emissions from biogas combustion
CH4 No Not significant and excluded from calculation
Biogas combustion efficiency is considered 10019
N2O No Not significant Excluded for simplification and
conservativeness
Biomass Boiler(s)
(Biogas
combustion)
CO2 No Neutral CO2 emissions from biogas combustion
CH4 No Not significant and excluded from calculation
Biogas combustion efficiency is considered 10020
N2O No Not significant Excluded for simplification and
conservativeness
Grid electricity
consumption from
national grid
CO2 Yes CO2 emissions from grid energy
CH4 No Not significant Excluded for simplification and
conservativeness
N2O No Not significant Excluded for simplification and
conservativeness
Enclosed or Open
flaring system
CO2 No Neutral CO2 emissions from biogas combustion
CH4 Yes CH4 emissions due to incomplete combustion in
enclosed flare
N2O No Not significant Excluded for simplification and
conservativeness
The CPA is implemented at the address below
Kilang Sawit Felda Triang Triang Pahang Malaysia
The site is located at state of Pahang Malaysia with GPS coordinates 3 16152 N 102 34567 E or
32692 1025761 (refer also Section A412) and thus is located within the geographical boundary of the
PoA
B5 Emission reductions
B51 Data and parameters that are available at validation
Data Parameter GWPCH4
Data unit tCO2tCH4
Description Global Warming Potential the equivalent in CO2 of the effect of methane
gas to the atmosphere
Source of data used IPCC 2006
Value applied 21
Justification of the choice of
data or description of
measurement methods and
procedures actually applied
Global warming potential for methane gas since this is a methane
capture project
19 AMS-IIIH para 35 20 AMS-IIIH para 35
PROJECT DESIGN DOCUMENT FORM (CDM-SSC-PDD) - Version 03
CDM ndash Executive Board
19
Any comment
Data Parameter MCFwwtreatmentBL1
Data unit Fraction
Description Methane correction factor for baseline wastewater anaerobic treatment
systems
Source of data used Table IIIH1 AMS IIIH version 16
Value applied 08
Justification of the choice of
data or description of
measurement methods and
procedures actually applied
Table IIIH1 for baseline emission The lagoons depth are more than 2m
MCF value of 08 for anaerobic deep lagoon (depth gt 2 m)
Any comment
Data Parameter MCFwwtreatmentBL2
Data unit Fraction
Description Methane correction factor for baseline wastewater aerobic treatment
systems
Source of data used Methane correction factor for baseline aerobic wastewater treatment
system (poorly managed)
Value applied Table IIIH1 AMS IIIH version 16
Justification of the choice of
data or description of
measurement methods and
procedures actually applied
03
Any comment No aerators installed
Data Parameter MCFwwBLdischarge
Data unit Fraction
Description Methane correction factor based on discharge pathway in the baseline
situation
Source of data used Table IIIH1 AMS IIIH version 16
Value applied 01
Justification of the choice of
data or description of
measurement methods and
procedures actually applied
Table IIIH1 for baseline emission The final discharge of treated
effluent into river MCF value of 01 for river discharge
Any comment
Data Parameter Bo ww
Data unit kgCH4 kgCOD
Description Methane generation capacity of treated wastewater
Source of data used IPCC 2006
Value applied 025
Justification of the choice of
data or description of
measurement methods and
procedures actually applied
Default value as prescribed in the methodology
Any comment
PROJECT DESIGN DOCUMENT FORM (CDM-SSC-PDD) - Version 03
CDM ndash Executive Board
20
Data Parameter UFBL
Data unit -
Description Model correction factor to account for model uncertainties (baseline)
Source of data used AMS IIIH version 16
Value applied 089
Justification of the choice of
data or description of
measurement methods and
procedures actually applied
As per methodology AMS-IIIH point 24
Any comment -
Data Parameter UFPJ
Data unit -
Description Model correction factor to account for model uncertainties (project
activity)
Source of data used AMS IIIH version 16
Value applied 112
Justification of the choice of
data or description of
measurement methods and
procedures actually applied
As per methodology AMS-IIIH point 30(a)
Any comment -
Data Parameter CFEww
Data unit Fraction
Description Capture efficiency of the biogas recovery equipment in the wastewater
treatment system
Source of data used AMS IIIH version 16
Value applied 09
Justification of the choice of
data or description of
measurement methods and
procedures actually applied
A default value of 09 has been used as per the guidance in the
methodology
Any comment
Data Parameter MCF ww treatmentPJ1
Data unit Fraction
Description Methane correction factor for the project wastewater anaerobic treatment
system equipped with biogas recovery equipment
Source of data used Table IIIH1 AMS IIIH version 16
Value applied 08
Justification of the choice of
data or description of
measurement methods and
procedures actually applied
The lagoons depth are more than 2 m MCF values in table IIIH1 has
been used as per the guidance in the methodology (depth gt 2 m)
Any comment
Data Parameter MCF ww treatmentPJ2
PROJECT DESIGN DOCUMENT FORM (CDM-SSC-PDD) - Version 03
CDM ndash Executive Board
21
Data unit Fraction
Description Methane correction factor for the project wastewater aerobic treatment
system not equipped with biogas recovery equipment
Source of data used Table IIIH1 AMS IIIH version 16
Value applied 03
Justification of the choice of
data or description of
measurement methods and
procedures actually applied
Aerobic treatment poorly managed
Any comment
Data Parameter MCFwwPJdischarge
Data unit Fraction
Description Methane correction factor based on discharge pathway in the project
activity
Source of data used Table IIIH1 AMS IIIH version 16
Value applied 01
Justification of the choice of
data or description of
measurement methods and
procedures actually applied
Table IIIH1 for project emission The final discharge of treated effluent
into river MCF value of 01 for river discharge
Any comment Same discharge pathway as in the baseline
Data Parameter CODBL1
Data unit
Description COD removal efficiency of the baseline system (anaerobic treatment
system)
Source of data used 10 days measurement campaign
Value applied Anaerobic Treatment system 8880
Justification of the choice of
data or description of
measurement methods and
procedures actually applied
One year historical data not available
Any comment This data will be used for ex post emission reduction calculation
Data Parameter CODBL2
Data unit
Description COD removal efficiency of the baseline system (aerobic treatment
system)
Source of data used 10 days measurement campaign
Value applied Aerobic Treatment system 6369
Justification of the choice of
data or description of
measurement methods and
procedures actually applied
One year historical data not available
Any comment This data will be used for ex post emission reduction calculation
Data Parameter NCVCH4
Data unit MJkg
PROJECT DESIGN DOCUMENT FORM (CDM-SSC-PDD) - Version 03
CDM ndash Executive Board
22
Description Net Calorific Value of methane
Source of data used IPCC 2006 Default Value
Value applied 504
Justification of the choice of
data or description of
measurement methods and
procedures actually applied
IPCC 2006 value is used Volume 2 Chapter 1 Table 12
Any comment
Data Parameter NCVFF
Data unit MJkg
Description Net Calorific Value of diesel
Source of data used IPCC 2006 Default Value
Value applied 430
Justification of the choice of
data or description of
measurement methods and
procedures actually applied
IPCC 2006 value is used Volume 2 Chapter 1 Table 12
Any comment
Data Parameter EFCO2diesel
Data unit tCO2MWh
Description CO2 emission factor diesel genset
Source of data used AMS-IA version 14 point 14
Value applied 08
Justification of the choice of
data or description of
measurement methods and
procedures actually applied
Default value for diesel generation unit
Any comment
Data Parameter Grid Emission Factor
Data unit kgCO2ekWh
Description Emission factor for grid electricity in Peninsular Malaysia
Source of data used Pusat Tenaga Malaysia March 2010
Value applied 0672
Justification of the choice of
data or description of
measurement methods and
procedures actually applied
As per AMS-ID point 12
Any comment Study on Grid Connected Electricity Baselines in Malaysia 2008
B52 Ex-ante calculation of emission reductions
The ex ante emission reductions are calculated based on AMS-IIIH version 16 as per equations
explained in section E62 of PoA-DD Biogas PoA in Malaysia
PROJECT DESIGN DOCUMENT FORM (CDM-SSC-PDD) - Version 03
CDM ndash Executive Board
23
Calculation for AMS-IIIH
Baseline emissions
Source of baseline emissions Reference Applicable
(YN)
Comments
Wastewater and sludge treatment
systems equipped with a biogas
recovery facility shall be excluded
from the baseline
AMS-IIIH
Point 17
N No biogas recovery in the
baseline
Emissions on account of electricity or
fossil fuel used (BEpowery)
AMS-IIIH
Point 18 (i)
N For conservativeness no
emissions due to electricity or
fossil fuel will be claimed
BEpowery = 0
Methane emissions from baseline
wastewater treatment systems
(BEwwtreatmenty)
AMS-IIIH
Point 18 (ii)
Y Baseline includes anaerobic and
aerobic treatment conditions with
different MCF values selected as
per Table IIIH1
Methane emissions from baseline
sludge treatment systems (BEstreatmenty)
= 0
AMS-IIIH
Point 18 (iii)
N The baseline plant corresponds to
scenario Para 1(f) without sludge
treatment BEstreatmenty = 0
Methane emissions on account of
inefficiencies in the baseline
wastewater treatment systems and
presence of degradable organic carbon
in the treated wastewater discharged
into river (BEwwdischargey)
AMS-IIIH
Point 18 (iv)
Y Treated effluent is currently
discharged into the river
Methane emissions from the decay of
the final sludge generated by the
baseline treatment systems (BEsfinaly)
AMS-IIIH
Point 18 (v)
N Zero because in the baseline final
sludge used for soil application
BEsfinaly = 0
A) Calculation of baseline emissions
BEy = BEwwtreatmenty + BEwwdischargey
Abbreviation Description Value Source
BEy Baseline emissions in year y (tCO2e) 30762 Calculated
BEpowery Baseline emissions of diesel genset in year
y tCO2eyear 0 Calculated
BEwwtreatmenty Baseline emissions of the wastewater
treatment systems tCO2eyear 30663 Equation 2
BEwwdischargey
The methane emissions from degradable
organic carbon in treated wastewater
discharged tCO2eyear
100 Equation 6
A1) Baseline emissions
PROJECT DESIGN DOCUMENT FORM (CDM-SSC-PDD) - Version 03
CDM ndash Executive Board
24
Equation 2 BEwwtreatmenty = Qwwy (CODinflow1 y CODBL1 MCFwwtreatmentBL1) +
(CODinflow2y CODBL2 MCFwwtreatmentBL2) Boww UFBL GWPCH4
Abbreviation Description Value Source
BEwwtreatmenty Baseline emissions of the wastewater
treatment systems (tCO2eyear) 30663 Calculated
Qwwy Volume of wastewater treated in baseline
wastewater treatment system i in year y
(m3year)
333293
Volume based on 10 m3mt
FFB21 amp FFB historical data
(2009 ndash 2011)
CODinflow1y Chemical oxygen demand of the
wastewater inflow to the baseline treatment
system (anaerobic) in year y (tCOD m3)
0026905 10 days measurement
campaign
CODBL1 COD removal efficiency of the baseline
treatment system (anaerobic) () 8880
10 days measurement
campaign
CODinflow2y Chemical oxygen demand of the
wastewater inflow to the baseline treatment
system (aerobic) in year y (tCOD m3)
0003013 10 days measurement
campaign
CODBL2 COD removal efficiency of the baseline
treatment system (aerobic) () 6369
10 days measurement
campaign
MCFwwtreatmentBL 1 Methane correction factor for baseline
wastewater anaerobic treatment systems 08
MCF values as per table
IIIH1 anaerobic gt 2m
MCFwwtreatmentBL2 Methane correction factor for baseline
wastewater aerobic treatment systems 03
MCF values as per table
IIIH1 ndash poorly managed
Boww Methane producing capacity of the
wastewater (kg CH4kg COD) 025
IPCC 2006
UFBL Model correction factor to account for
model uncertainties 089
IPCC 2006
GWPCH4 Global Warming Potential for methane 21 IPCC 2006
A2) The methane emissions from degradable organic carbon in treated wastewater discharged
Equation 6 BEwwdischargey = Qwwy GWPCH4 Boww UFBL CODwwdischarge BLyMCFww BLdischarge
Abbreviation Description Value Source
BEwwdischargey
The methane emissions from degradable
organic carbon in treated wastewater
discharged (tCO2eyear)
100 Calculated
Qwwy Volume of treated wastewater discharged
in year y (m3year) 333293
Volume based on 10 m3mt
FFB22 amp FFB historical data
(2009 ndash 2011)
GWPCH4 Global warming potential of methane 21 IPCC 2006
Boww Methane producing capacity of the treated
wastewater (kgCH4 kgCOD) 025 IPCC 2006
21 Mill designed data for baseline effluent treatment plant 22 Mill designed data for baseline effluent treatment plant
PROJECT DESIGN DOCUMENT FORM (CDM-SSC-PDD) - Version 03
CDM ndash Executive Board
25
UFBL Model correction factor to account for
model uncertainties 089 IPCC 2006
CODwwdischarge BLy Chemical oxygen demand of the treated
wastewater discharged into sea river or
lake in the baseline situation in the year y
(tonnesm3)
0000642 10 days measurement
campaign
MCFwwBLdischarge Methane correction factor based on
discharge pathway in the baseline situation
(eg into sea river or lake) of the
wastewater (fraction)
01 MCF values as per table
IIIH1 version 16
Project activity emissions
The project activity emission sources as per the methodology and their relevance with respect to the
proposed CDM project activity are given below in a tabular format
Source of project activity
emission Reference
Applicable
(YN) Comments
CO2 emissions on account of
power and fossil fuel used by
the project activity facilities
(PEpowery)
AMS-IIIH
point 29(i)
Y The project activity uses the electricity
imported from the national grid
Methane emissions from
wastewater treatment systems
affected by the project
activity and not equipped with
biogas recovery in the project
situation (PEwwtreatmenty)
AMS-IIIH
point 29 (ii)
Y CH4 emissions from the poorly managed
aerobic lagoons
Methane emissions from
sludge treatment systems
affected by the project
activity and not equipped with
biogas recovery in the project
situation (PEstreatmenty)
AMS-IIIH
point 29 (iii)
N The project activity corresponds to
scenario (vi) without sludge treatment
PEystreatmenty = 0
Methane emissions on account
of inefficiency of the project
activity wastewater treatment
systems and presence of
degradable organic carbon in
treated wastewater
(PEwwdischargey)
AMS-IIIH
point 29 (iv)
Y Treated effluent from ETP will be
discharged into river
Methane emissions from the
decay of the final sludge
generated by the project
activity treatment systems
(PEsfinaly)
AMS-IIIH
point 29 (v)
N In the proposed CDM project activity
final sludge is used for soil application in
the same manner as in the baseline
PEsfinaly = 0
PROJECT DESIGN DOCUMENT FORM (CDM-SSC-PDD) - Version 03
CDM ndash Executive Board
26
Methane fugitive emissions on
account of inefficiencies in
capture systems (PEfugitivey)
AMS-IIIH
point 29 (vi)
Y Applicable to PEfugitivewwy
N The project activity corresponds to
scenario (vi) without sludge treatment
PEfugitivesy = 0
Methane emissions due to
incomplete flaring (PEflaringy)
AMS-IIIH
point 29 (vii)
Y Enclosed flaring system installed
Methane emissions from
biomass stored under
anaerobic conditions which
does not take place in the
baseline situation (PEbiomassy)
AMS-IIIH
point 29
(viii)
N In the project activity the biomass (PKS
+ mesocarp fibres) displaced will not be
stored under anaerobic conditions The
conditions of onsite storage are identical
in the baseline as in the project activity
The biomass will be sold to the market
on a regular basis PEbiomassy = 0
B) Calculation of project emissions
PEy = PEpowery + PEwwtreatmenty + PEww discharge y + PEfugitive y + PEflaring y
Abbreviation Description Value Source
PEy Project activity emissions in the year y
(tCO2eyr) 6050 Equation 8
PEpowery CO2 emissions on account of power used
by the project activity facilities (tCO2eyr) 604 -
PEwwtreatmenty Methane emissions from wastewater
treatment systems affected by the project
activity and not equipped with biogas
recovery in year y (tCO2eyr)
1523 Equation 9
PEwwdischargey
Methane emissions on account of
inefficiency of the project activity
wastewater treatment systems and presence
of degradable organic carbon in treated
wastewater (tCO2eyr)
126 Equation 12
PEfugitivey Methane fugitive emissions on account of
inefficiencies in capture systems (tCO2eyr) 3796 Equation 15
PEflaringy Methane emissions due to incomplete
flaring (tCO2eyr) 0 Equation 19
B1) Project emissions from CO2 emissions on account of power and fuel used by the project activity
facilities in year ldquoyrdquo in tCO2eyear
PEpowery = ECPJjy EFgridy
Abbreviation Description Value Source
PEpowery Project emissions from electricity
consumption in the year y (tCO2eyr) 604 Calculated
ECPJjy Internal power consumption from the grid 749 100 kW is the effective
PROJECT DESIGN DOCUMENT FORM (CDM-SSC-PDD) - Version 03
CDM ndash Executive Board
27
(MWh year) power based on the
equipments installed at the
site
EFgridy Grid Emission factor in Peninsular
Malaysia 2008 (tCO2 MWh) 0672
Study on Grid Connected
Electricity Baselines in
Malaysia 2008 published in
2010 by PTM
B2) Methane emissions from wastewater treatment systems affected by the project activity and not
equipped with biogas recovery in the project situation in year ldquoyrdquo in tCO2e
Equation 9 PEwwtreatment y = Qwwky CODinflowk y PJky MCFwwtreatmentPJk) Boww UFPJ GWPCH4
Abbreviation Description Value Source
PEwwtreatmenty
Methane emissions from wastewater
treatment systems affected by the project
activity and not equipped with biogas
recovery in the project situation (tCO2eyr)
1523 Calculated
Qwwky Volume of wastewater treated in project
activity wastewater treatment system k in
year y (m3year)
333293
Volume based on 10 m3mt
FFB23 amp FFB historical data
(2009 ndash 2011)
CODinflowky Chemical oxygen demand of the
wastewater inflow to the project activity
treatment system k in year y (tonnes COD
m3)
0002690 10 days measurement
campaign
PJky Chemical oxygen demand removal
efficiency of the project wastewater
treatment system k in year y (tm3)
measured based on inflow COD and
outflow COD in system k
90 Based on bio-digester COD
removal efficiency of 90
MCFwwtreatmentPJk Methane correction factor for project
wastewater treatment system k (MCF
values as per table IIIH1)
03
MCF values table IIIH1
Version 16 ndash aerobic poorly
managed (conservative)
Boww Methane generation capacity of the treated
wastewater (kg CH4kg COD) 025 IPCC 2006
UFPJ Model correction factor to account for
model uncertainties 112
IPCC 2006
GWPCH4 Global warming potential of methane 21 IPCC 2006
23 Mill designed data for baseline effluent treatment plant
PROJECT DESIGN DOCUMENT FORM (CDM-SSC-PDD) - Version 03
CDM ndash Executive Board
28
B3) Methane emissions on account of inefficiency of the project activity wastewater treatment
systems and presence of degradable organic carbon in treated wastewater in the year ldquoyrdquo (tonnes)
Equation 12 PEwwdischarge y = Qwwy GWPCH4 Boww UFPJ CODwwdischargePJy MCFwwPJdischarge
Abbreviation Description Value Source
PEwwdischargey
Methane emissions from degradable
organic carbon in treated wastewater
(tCO2eyr)
126 Calculated
Qwwy Quantity of wastewater treated in year y
(m3year) 333293
Volume based on 10 m3mt
FFB24 amp FFB historical data
(2009 ndash 2011)
CODwwdischargedPJ
y
Chemical oxygen demand of the treated
wastewater discharged into river in the
project situation in year y (tCOD m3)
0000642 10 days measurement
campaign
MCFwwPJ discharge
Methane correction factor based on
discharge pathway in the project situation
(river) of the wastewater (fraction)
01 MCF values as per table
IIIH1 Version 16
Boww Methane generation capacity of the treated
wastewater (kg CH4kg COD) 025 IPCC 2006
UFPJ Model correction factor to account for
model uncertainties 112 IPCC 2006
GWPCH4 Global warming potential of methane 21 IPCC 2006
B41) Methane fugitive emissions on account of inefficiencies in capture systems in the year ldquoyrdquo
(tonnes)
Equation 15 PEfugitivewwy = (1 ndash CFEww ) MEPywwtreatment GWPCH4
Abbreviation Description Value Source
PEfugitivey Methane fugitive emissions on account of
inefficiencies in capture systems (tCO2eyr) 3796 Calculated
CFEww Capture efficiency of the biogas recovery
equipment in the wastewater treatment
systems
09 AMS IIIH Version 16
MEPywwtreatment Methane emission potential of wastewater
treatment systems equipped with biogas
recovery system in year y (tCH4yr)
1808 Refer Equation 11 of AMS
IIIH version 16
GWPCH4 Global warming potential of methane 21 IPCC 2006
B42) Methane emission potential of wastewater treatment plant in the year ldquoyrdquo (tonnes)
Equation 16 MEPwwtreatmenty = Qwwy Boww UFPJ (CODremovedPJky MCFwwtreatmentPJk)
24 Mill designed data for baseline effluent treatment plant
PROJECT DESIGN DOCUMENT FORM (CDM-SSC-PDD) - Version 03
CDM ndash Executive Board
29
Abbreviation Description Value Source
MEPwwtreatmenty Methane emission potential of wastewater
treatment systems equipped with biogas
recovery system in year y (tonnes CH4yr)
1808 Calculated
Qyww Quantity of wastewater treated in year y
(m3year) 333293
Volume based on 10 m3mt
FFB25 amp FFB historical data
(2009 ndash 2011)
Boww Methane generation capacity of the treated
wastewater (kg CH4kg COD) 025 IPCC 2006
CODremovedPJy
The chemical oxygen demand removed by
the treatment anaerobic system of the
project activity equipped with biogas
recovery in the year y (tCOD m3)
0024214
10 days measurement
campaign amp bio-digester
design parameter
MCFwwtreatmentPJ
Methane correction factor for the project
wastewater treatment system k equipped
with biogas recovery equipment
08 MCF values as per table
IIIH1 Version 16
UFPJ Model correction factor to account for
model uncertainties 112 IPCC 2006
B5) Methane emissions due to incomplete flaring in the year ldquoyrdquo (tonnes)
Equation 13a PEflaringy = TMflaredy (1 - ηflarey) GWPCH4
Abbreviation Description Value Source
PEflaringy Methane emissions due to incomplete
flaring (tCO2eyr) 0 Calculated
TMflaredh Mass flow rate of methane flared in dry
basis in the hour h (tCH4 yr) 0 Calculated
ηflarey Flare efficiency in hour h based on default
values 50
Tools for methane flaring
(open flare) for conservative
GWPCH4 Global warming potential of methane 21 IPCC 2006
Leakage emissions
No leakage emission will occur in the project activity
LEy1 = 0
Emission reductions
Equation 22 ERy ex ante = BEy ex ante ndash (PEy ex ante + LEy ex ante)
25 Mill designed data for baseline effluent treatment plant
PROJECT DESIGN DOCUMENT FORM (CDM-SSC-PDD) - Version 03
CDM ndash Executive Board
30
Abbreviation Description Value Source
ERy1 ex ante Ex ante emission reduction in year y
(tCO2e) 24712 Equation 22
BEy1 ex ante Ex ante baseline emissions in year y
(tCO2e) 30762 Equation 1
PEy1 ex ante Ex ante project emissions in year y (tCO2e) 6050 Equation 8
LEy1 ex ante Ex ante Leakage emissions in year y
(tCO2e) 0 -
Calculation for AMS-ID
Baseline emissions
Electricity generated from biogas engines will be exported to the Peninsular Malaysia National Grid The
baseline emissions are described in AMS-ID (Version 17 EB 61) as the ldquoproduct of electrical energy
baseline expressed in kWh of electricity produced by the renewable energy generating unit multiplied by
an emission factorrdquo
Baseline emissions due to electricity exported to the grid in the year ldquoyrdquo (tonnes)
BEEGy = EGBLy EFCO2gridy
Abbreviation Description Value Source
BEEGy Baseline emissions in year y (tCO2eyr) 4568 Calculated
EGBLy
Quantity of net electricity supplied to the
grid as a result of the implementation of the
project activity in year y (kWh yr)
6797625 Calculated
EFCO2gridy
CO2 emission factor of the grid in year
(tCO2kWh) 0672
Study on Grid Connected
Electricity Baselines in
Malaysia 2008 published in
2010 by PTM
Project Activity Emissions
As per AMS-ID (Version 17 EB 61) project emissions for renewable energy project activities are zero
PEEGy = 0
Leakage
If the energy generating equipment is transferred from another activity leakage is to be considered
No leakage emission will occur in the project activity LEy = 0
PROJECT DESIGN DOCUMENT FORM (CDM-SSC-PDD) - Version 03
CDM ndash Executive Board
31
Emission reductions
ERy = BEy ndash PEy - LEy
Abbreviation Description Value Source
ERy Emission reduction in year y (tCO2ey) 4568 -
BEy Baseline emissions in year y (tCO2ey) 4568 -
PEy Project emissions in year y (tCO2ey) 0 -
LEy Leakage emissions in year y (tCO2ey) 0 -
Calculation for AMS-IA
Baseline emissions
The energy baseline is the fuel consumption of the technology in use or that would have been used in the
absence of the project activity to generate the equivalent quantity of energy Option 2 is applied This
methodology is only apply shall the recovered is in excess after export to the grid
Annual electricity sent to the mill for FF displacement in the year ldquoyrdquo (kWh)
EBLy = ΣEGiy (1 ndash l)
Abbreviation Description Value Source
EBLy Annual energy baseline (kWhyr) Calculated
EGiy
The estimated annual output of the
renewable energy technologies of the group
of i renewable energy technologies
installed (kWhyr)
0 Estimated
l
Average technical distribution losses that
would have been observed in diesel
powered mini-grids installed by public
programmes or distribution companies in
isolated areas expressed as a fraction
0 Conservative by applying
Zero (0)
Baseline electricity sent to the mill for FF displacement in the year ldquoyrdquo (tonnes)
BECO2y = EBLy EFCO2
Abbreviation Description Value Source
BECO2y Baseline emission in the year y (tCO2yr) 0 Calculated
EBLy Annual energy baseline (kWhyr) 0 Calculated
EFCO2 CO2 emission factor (tCO2kWh) 08
Default value which is
derived from diesel
generation units is used
PROJECT DESIGN DOCUMENT FORM (CDM-SSC-PDD) - Version 03
CDM ndash Executive Board
32
Project Activity Emissions
As per AMS-IA (Version 14 EB 54) project emissions for renewable energy project activities are zero
PEy = 0
Leakage
If the energy generating equipment is transferred from another activity or if the existing equipment is
transferred to another activity leakage is to be considered
No leakage emission will occur in the project activity LEy = 0
B53 Summary of the ex-ante estimation of emission reductions
Estimated emission reductions (total project activity)
Year
Estimation of
project activity
emissions (tCO2e)
Estimation of
baseline emissions
(tCO2e)
Estimation of
leakage (tCO2e)
Estimation of
overall emission
reductions (tCO2e)
2012 504 2944 0 2440
2013 6050 35330 0 29280
2014 6050 35330 0 29280
2015 6050 35330 0 29280
2016 6050 35330 0 29280
2017 6050 35330 0 29280
2018 6050 35330 0 29280
2019 5546 32386 0 26840
Total (tCO2) 42350 247310 0 204960
The starting date of the crediting period is 01122012 or the date of registration whichever is later
Estimated emission reductions for AMS-IIIH
Year
Estimation of
project activity
emissions (tCO2e)
Estimation of
baseline emissions
(tCO2e)
Estimation of
leakage (tCO2e)
Estimation of
overall emission
reductions (tCO2e)
2012 504 2563 0 2059
2013 6050 30762 0 24712
PROJECT DESIGN DOCUMENT FORM (CDM-SSC-PDD) - Version 03
CDM ndash Executive Board
33
2014 6050 30762 0 24712
2015 6050 30762 0 24712
2016 6050 30762 0 24712
2017 6050 30762 0 24712
2018 6050 30762 0 24712
2019 5546 28199 0 22653
Total (tCO2) 42350 215334 0 172984
The starting date of the crediting period is 01122012 or the date of registration whichever is later
Estimated emission reductions for AMS-ID
Year
Estimation of
project activity
emissions (tCO2e)
Estimation of
baseline emissions
(tCO2e)
Estimation of
leakage (tCO2e)
Estimation of
overall emission
reductions (tCO2e)
2012 0 381 0 381
2013 0 4568 0 4568
2014 0 4568 0 4568
2015 0 4568 0 4568
2016 0 4568 0 4568
2017 0 4568 0 4568
2018 0 4568 0 4568
2019 0 4187 0 4187
Total (tCO2) 0 31976 0 31976
The starting date of the crediting period is 01122012 or the date of registration whichever is later
Estimated emission reductions for AMS-IA
Year
Estimation of
project activity
emissions (tCO2e)
Estimation of
baseline emissions
(tCO2e)
Estimation of
leakage (tCO2e)
Estimation of
overall emission
reductions (tCO2e)
2012 0 0 0 0
2013 0 0 0 0
2014 0 0 0 0
2015 0 0 0 0
2016 0 0 0 0
PROJECT DESIGN DOCUMENT FORM (CDM-SSC-PDD) - Version 03
CDM ndash Executive Board
34
2017 0 0 0 0
2018 0 0 0 0
2019 0 0 0 0
Total (tCO2) 0 0 0 0
The starting date of the crediting period is 01122012 or the date of registration whichever is later
B6 Application of the monitoring methodology and description of the monitoring plan
B61 Description of the monitoring plan
The parameters to be monitored are
Please note that the amount of methane recovered and fuelled or flared (MDy ) is calculated as follows
MDy = TMfuelledy + TMflaredy Equation A
Where Description Units
MDy Quantity of methane recovered and fuelled or flared in the year y tonnes CH4year
TMfuelledy Quantity of methane fuelled in the year y tonnes CH4year
TMflaredy Quantity of methane flared in year y tonnes CH4year
Where
TMfuelledy = FVfuelledh fvCH4h ηfuelledh ρCH4n) 1000 Equation B
Where Description Units
TMfuelledy Quantity of methane fuelled in the year y tonnes CH4year
FVfuelledh Volumetric flow rate of the fuelled biogas gas at normal conditions in
hour h
Nm3 biogashour
ηfuelledh 100 for gainful purpose26
fvCH4h Volumetric fraction of methane in the biogas gas in the hour h
ρCH4n Density of methane at normal conditions kgCH4Nm3CH4
And
TMflaredy = FVflaredh fvCH4h ηflareh ρCH4n) 1000 Equation C
Where Description Units
TMflaredy Quantity of methane flared in year y tonnes CH4year
FVflaredh Volumetric flow rate of the flared biogas gas at normal conditions in
hour h
Nm3 biogashour
26 AMS-IIIH point 35
PROJECT DESIGN DOCUMENT FORM (CDM-SSC-PDD) - Version 03
CDM ndash Executive Board
35
ηflareh Flare efficiency in the hour h
fvCH4h Volumetric fraction of methane in the biogas gas in the hour h
ρCH4n Density of methane at normal conditions kgCH4Nm3CH4
Data Parameter ID1 Qwwy
Data unit m3 month
Description The flow of wastewater entering the bio-digester
Source of data Measurement by project participant by using a flowmeter
Value of data ~ 28000
Brief description of
measurement methods and
procedures to be applied
The flow is measured with an online flow meter or equivalent
QAQC procedures to be
applied (if any) Data are monitored continuously and recorded periodically
(monthly or at shorter interval) in a data log file (DLF)
Uncertainty level of data low
Maintenance and calibration as per manufacturer‟s specifications
or at least once every three (3) years
Any comment
Data Parameter ID2 CODwwuntreatedy
Data unit tCOD m3
Description Raw COD of wastewater entering the bio-digester
Source of data Laboratory (internal and external)
Value of data ~ 0030230
Brief description of
measurement methods and
procedures to be applied
Measure of COD according to national or international standards
COD is measure through representative sampling
QAQC procedures to be
applied (if any) Minimum once a month COD sampling to ensure a 9010
confidenceprecision level
COD reports are recorded manually
Uncertainty level of data low
Maintenance and calibration as per manufacturer‟s specifications
or at least once every three (3) years for internal laboratory
equipment
Any comment
Data Parameter ID3 CODwwtreatedy
Data unit tCOD m3
Description COD of treated wastewater leaving the bio-digester
Source of data Laboratory (internal and external)
Value of data ~ 0003023
Brief description of
measurement methods and
procedures to be applied
Measure of COD according to national or international standards
COD is measure through representative sampling
QAQC procedures to be
applied (if any) Minimum once a month COD sampling to ensure a 9010
confidenceprecision level
COD reports are recorded manually
Uncertainty level of data low
PROJECT DESIGN DOCUMENT FORM (CDM-SSC-PDD) - Version 03
CDM ndash Executive Board
36
Maintenance and calibration as per manufacturer‟s specifications
or at least once every three (3) years for internal laboratory
equipment
Any comment
Data Parameter ID5 End-use of the final sludge
Data unit ndash
Description The final sludge generated by the project activity will be sent to control
landfill site if any
Source of data By project participant
Value of data ndash
Brief description of
measurement methods and
procedures to be applied
The final disposal of the sludge will be monitored during the crediting
period if any For each disposal of the sludge the following will be
recorded disposal site and date of disposal
QAQC procedures to be
applied (if any)
Any comment
Data Parameter ID6 FVflaredh
Data unit Nm3 hour
Description Volumetric flow of biogas recovered and flared at normal conditions in
the hour h
Source of data By project participant
Value of data 0
Brief description of
measurement methods and
procedures to be applied
The volume of biogas will be measured with a normalised flow meter or
calculated from the volumetric flow pressure temperature
Biogas volume and methane content measurements shall be on the same
basis (wet or dry)
QAQC procedures to be
applied (if any) The biogas flow is monitored continuously recorded and stored
electronically in a data log file (DLF) (monthly or at shorter
interval)
Data Parameter ID4 CODww dischargey
Data unit tCOD m3
Description COD of treated wastewater discharge into river by treatment system
Source of data Laboratory (internal and external)
Value of data ~ 0000100
Brief description of
measurement methods and
procedures to be applied
Measure of COD according to national or international standards
COD is measure through representative sampling
QAQC procedures to be
applied (if any) Minimum once a month COD sampling to ensure a 9010
confidenceprecision level
COD reports are recorded manually
Uncertainty level of data low
Maintenance and calibration as per manufacturer‟s specifications
or at least once every three (3) years for internal laboratory
equipment
Any comment
PROJECT DESIGN DOCUMENT FORM (CDM-SSC-PDD) - Version 03
CDM ndash Executive Board
37
Uncertainty level of data low
Maintenance and calibration as per manufacturer‟s specifications
or at least once every 3 years
Any comment
Data Parameter ID7 FVfuelledgas engineh
Data unit Nm3 hour
Description Volumetric flow of biogas recovered and fuelled (gas engine) at normal
conditions in the hour h
Source of data By project participant
Value of data ~ 509
Brief description of
measurement methods and
procedures to be applied
The volume of biogas will be measured with a normalised flow meter or
calculated from the volumetric flow of biogas pressure temperature
Biogas volume and methane content measurements shall be on the same
basis (wet or dry)
QAQC procedures to be
applied (if any) The biogas flow is monitored continuously recorded and stored
electronically in a data log file (DLF) (monthly or at shorter
interval)
Uncertainty level of data low
Maintenance and calibration as per manufacturer‟s specifications
or at least once every 3 years
Any comment
Data Parameter ID8 FVfuelledboilerh
Data unit Nm3 hour
Description Volumetric flow of biogas recovered and fuelled (boilers) at normal
conditions in the hour h
Source of data By project participant
Value of data ~ 0
Brief description of
measurement methods and
procedures to be applied
The volume of biogas will be measured with a normalised flow meter or
calculated from the volumetric flow of biogas pressure temperature
Biogas volume and methane content measurements shall be on the same
basis (wet or dry)
QAQC procedures to be
applied (if any) The biogas flow is monitored continuously recorded and stored
electronically in a data log file (DLF) (monthly or at shorter
interval)
Uncertainty level of data low
Maintenance and calibration as per manufacturer‟s specifications
or at least once every 3 years
Any comment
Data Parameter ID9 wCH4h
Data unit
Description Methane content in biogas in same basis (wetdry) as the biogas flows in
year y
Source of data By project participant using a gas analyzer
Value of data ~ 60
PROJECT DESIGN DOCUMENT FORM (CDM-SSC-PDD) - Version 03
CDM ndash Executive Board
38
Brief description of
measurement methods and
procedures to be applied
Using calibrated gas analyzer either continuous or periodical
measurement at confidenceprecision level of 9010
QAQC procedures to be
applied (if any) In case a continuous gas analyser is used data will be recorded
and stored electronically in a data log file (DLF) every hour or at
shorter interval
Uncertainty level of data low
Maintenance and calibration as per manufacturer‟s specifications
or at least once every 3 years
Any comment See also clarification by EB Meth Panel 30102009 ndash SSC_360
httpcdmunfcccintUserManagementFileStorageAM_CLAR_
QS83SX5B7WM6UGZE31JYQEQ4F65F6V
The biogas flow and the methane content measurements shall be
carried out close to each others
Data Parameter ID10 Tbiogas
Data unit ordmC
Description Temperature of biogas
Source of data Temperature probe
Value of data 20 ndash 65
Brief description of
measurement methods and
procedures to be applied
By project participant
QAQC procedures to be
applied (if any) Shall be measured and recorded at the same time when methane
content in biogas (ID8) is measured
Uncertainty level of data low
Maintenance and calibration as per manufacturer‟s specifications
or at least once every 3 years
Any comment Pressure and temperature are required to determine the density of
the methane If the biogas flow meter employed measures flow
pressure and temperature and displaysoutputs normalised flow of
biogas there is no need to separate monitoring of pressure and
temperature of the biogas
Data Parameter ID11 Pbiogas
Data unit Bar(g)
Description Pressure of biogas
Source of data By project participant
Value of data 50 ndash 200 mbar
Brief description of
measurement methods and
procedures to be applied
Pressure measurement device
QAQC procedures to be
applied (if any) Shall be measured and recorded at the same time when methane
content in biogas (ID8) is measured
Uncertainty level of data low
Maintenance and calibration as per manufacturer‟s specifications
or at least once every three (3) years
Any comment Pressure and temperature are required to determine the density of
the methane If the biogas flow meter employed measures flow
PROJECT DESIGN DOCUMENT FORM (CDM-SSC-PDD) - Version 03
CDM ndash Executive Board
39
pressure and temperature and displaysoutputs normalised flow of
biogas there is no need to separate monitoring of pressure and
temperature of the biogas
Shall be measured at the same time when methane content in
biogas (ID9) is measured
Parameter ID12 ηflareh (enclosed flare)
Unit
Description Enclosed flare efficiency in the hour h
Source of data Calculated
Value of data 0 or 50 or 90
Brief description of
measurement methods and
procedures to be applied
This yearly efficiency will be based on hourly flare efficiencies calculated
as per the provisions in the ldquoTool to determine project emissions from
flaring gases containing methanerdquo
The hourly flare efficiency will be calculated based on
0 if the temperature in the exhaust gas of the flare (Tflare) is
below 500 degC for more than 20 minutes during the hour h
50 if the temperature in the exhaust gas of the flare (Tflare) is
above 500 degC for more than 40 minutes during the hour h but the
manufacturer‟s specifications on proper operation of the flare are
not met at any point in time during the hour h
90 if the temperature in the exhaust gas of the flare (Tflare) is
above 500 degC for more than 40 minutes during the hour h and the
manufacturer‟s specifications on proper operation of the flare are
met continuously during the hour h
QAQC procedures to be
applied (if any) Data are logged hourly in a data log file (DLF)
Uncertainty level of data low
Any comment For enclosed flare
Or
Parameter ID13 ηflareh (open flare)
Unit
Description Flare efficiency in the hour h
Source of data Calculated
Value of data 0 or 50
Brief description of
measurement methods and
procedures to be applied
This yearly efficiency will be based on hourly flare efficiencies calculated
as per the provisions in the ldquoTool to determine project emissions from
flaring gases containing methanerdquo
The hourly flare efficiency will be calculated based on the duration of
time during which the flame is detected by the thermocouple (or flame
detector) installed in the open flare
Flare efficiency in hour h is based on default values
0 if the flame detected for not more than 20 minutes during the
hour h and
PROJECT DESIGN DOCUMENT FORM (CDM-SSC-PDD) - Version 03
CDM ndash Executive Board
40
50 if the flame detected for more than 20 minutes during the
hour h
A flame detector or thermocouple will be used
QAQC procedures to be
applied (if any) Data are logged hourly in a data log file (DLF)
Uncertainty level of data low
Any comment The only monitored parameter related to the flare is its efficiency Indeed
according to the clarification SSC_19927 of the methodology AMS IIIH
version 9 accepted by the SSC WG on the 3092008 ldquoIf a thermocouple
is used as a flame detection system it is sufficient to reach the given
minimum temperature from the manufacturer ldquo Hence it is not necessary
to monitor the temperature of the open type flares (Tflare)
Data Parameter ID14 ECPJjy
Data unit MWh
Description The yearly grid electricity consumption of the project activity for the year
bdquoy‟
Source of data Onsite instrument
Value of data ~749
Brief description of
measurement methods and
procedures to be applied
The grid electricity consumption of the project activity is measured
continuously with an energy meter (cumulative reading)
QAQC procedures to be
applied (if any) Data are monitored continuously and recorded periodically
(yearly or at shorter interval) in a data log file (DLF)
Uncertainty level of data low
Maintenance and calibration as per manufacturer‟s specifications
or at least once every three (3) years
Any comment
Data Parameter ID15 EGBLy
Data unit MWh
Description Quantity of net electricity generated and send to grid in year y
Source of data By project participant
Value of data ~ 6798
Brief description of
measurement methods and
procedures to be applied
The electricity generated and sent to grid is measured continuously with
an energy meter (cumulative readings)
QAQC procedures to be
applied (if any) Data are monitored continuously and recorded periodically
(yearly or at shorter interval) in a data log file (DLF)
Uncertainty level of data low
Maintenance and calibration as per manufacturer‟s specifications
or at least once every 3 years
Any comment As per AMS-ID
27 The clarification SSC_199 if available here (last access on the 24052011)
httpcdmunfcccintfilestorageAM_AM_CLAR_HIOZ5CS1PASC187C0JQ668L2E9RCRJResponse20WG20provided
20at20SSC20WG2017pdft=bU98MTMwNjIxNjY0OS4xMQ==|BOKHqtO94N6XF1N2N1vo8Ori-Rc=
PROJECT DESIGN DOCUMENT FORM (CDM-SSC-PDD) - Version 03
CDM ndash Executive Board
41
Or
Data Parameter ID16 EGmilly
Data unit MWh
Description Quantity of annual output of renewable energy sent to the mill in year y
Source of data By project participant
Value of data ~ 0
Brief description of
measurement methods and
procedures to be applied
The electricity generated and sent to mill to displace diesel use in diesel
gensets is measured continuously with an energy meter (cumulative
readings)
QAQC procedures to be
applied (if any) Data are monitored continuously and recorded periodically
(yearly or at shorter interval) in a data log file (DLF)
Uncertainty level of data low
Maintenance and calibration as per manufacturer‟s specifications
or at least once every 3 years
Any comment As per AMS-IA
Data Parameter ID17 Displacement of Biomass
Data unit Mt
Description Total amount of biomass (PKS) displaced from biomass boilers
Source of data Weighing bridge
Value of data Measurement at site
Brief description of
measurement methods and
procedures to be applied
Biomass (PKS) displaced due to the project activity will be weighed
using weighing bridge at the palm oil mill
QAQC procedures to be
applied (if any) Monthly calculation based on every single trip of trucks recorded
Data is recorded manually in a data log file based on the weighing
records
Maintenance and calibration as per manufacturer‟s specifications
Uncertainty level of data low
Any comment In the project activity the biomass (PKS) displaced will not be stored
under anaerobic conditions The conditions of onsite storage are identical
in the baseline as in the project activity The biomass will be sold to the
market on a regular basis PEbiomassy = 0
A final monitoring plan will be prepared prior the initial verification based on the as-built project activity
It will address the following aspects
MONITORING
The Project will be managed by CME with the involvement from Project Implementer CME will ensure
safety in operation of the plant as well as in the monitoring of emission reduction which is generated from
the project activity
CME will implement and be responsible for the monitoring plan Their responsibility covers operation of
the monitoring maintenance of the monitoring equipment data collection and archiving and
management of total scheme of the monitoring CME and Project Implementer will assign specific trained
PROJECT DESIGN DOCUMENT FORM (CDM-SSC-PDD) - Version 03
CDM ndash Executive Board
42
personnel during project implementation for the overall monitoring measurement and reporting of key
parameters as required in this PDD
DATA LOGGING AND STORAGE
The data measured by the instruments will be collected and stored in a data logging system The data will
be retrieved remotely by modem or directly on site
If data cannot be retrieved no emissions reductions will be claimed for the period of data failure The
data collected will be recorded in a central data base Access to production data will be restricted All
records and data (hard copy and soft copy) will be archived up to two years after the end of the crediting
period or the last issuance of CERs for this project activity whichever occurs later
CALIBRATION AND MAINTENANCE PROCEDURES MALFUNCTION OF EQUIPMENT
Maintenance includes all preventive and corrective actions necessary for the good functioning of the
equipment such as
Visual control of the equipment state and real-time check of displayed parameters
Cleaning up the equipment and the sensors
Adding lubricant
Replacement and change of defective parts
Calibration of equipment consists in verifying by comparison with a standard the accuracy of a
measuring instrument
Measuring instruments will be periodically and appropriately calibrated according to the procedures
timing and methods recommended by the manufacturer or nationalinternational standards as available
General malfunction of equipment
Daily inspections of the equipment will allow controlling equipment failure If equipment fails the
supplier will be notified and repairs will be carried out If the damaged equipment cannot be repaired it
will be replaced at the earliest In some cases portable tools will be used in order to carry out daily
monitoring of the missing parameter(s) In such case this data will be recorded manually
Discrepancies
To avoid discrepancies between projected data in the PDD and actual data (eg due to deferred starting
date malfunction of equipment) cross-checks between internal meter readings and external sources (eg
electricity invoices) will be carried out Any source of inconsistencies will be clarified
Case of emergency
For the case of emergency (earthquakes explosions fires etc) an emergency preparedness plan will be
adapted to the project activity All employees involved in the project on-site will be trained in the code of
conduct and required actions at time of commissioning of the plant
PROJECT DESIGN DOCUMENT FORM (CDM-SSC-PDD) - Version 03
CDM ndash Executive Board
43
OPERATIONAL AND MANAGEMENT STRUCTURE
The CDM monitoring team will be composed by the following staff
Position Report to
Operators
Project owner Supervisors (technicalmaintenance)
Operation Engineer
CDM monitoring project manager External CDM consultant
TRAINING OF MONITORING PERSONNEL
The maintenance will be conducted in-house by staff employed and trained by the Project Participants
Employees involved in the monitoring will be trained internally andor externally Training may include
inter alia
a) Review of equipment and captors
b) Calibration requirement
c) Configuration of monitoring equipment
d) Maintenance requirement
C1 Please indicate the level at which environmental analysis as per requirements of the CDM
modalities and procedures is undertaken Justify the choice of level at which the environmental
analysis is undertaken
radic Please tick if this information is provided at the PoA level In this case sections C2 and C3
need not be completed in this form
C2 Documentation on the analysis of the environmental impacts including transboundary
impacts
The host country does not require an analysis of environmental impacts As the project involves reduction
of GHG through recovery and controlled combustion which improves the quality of air therefore there
are no significant environmental impacts identified
C3 Please state whether an environmental impact assessment is required for a typical CPA
included in the programme of activities (PoA) in accordance with the host Party lawsregulations
In accordance with Malaysia environmental regulations Environmental Quality (Prescribed Activities
Environmental Impact Assessment) Order 1987 an Environmental Impact Assessment (EIA) is not
required for this CPA
PROJECT DESIGN DOCUMENT FORM (CDM-SSC-PDD) - Version 03
CDM ndash Executive Board
44
SECTION D Stakeholdersrsquo comments
D1 Please indicate the level at which local stakeholder comments are invited Justify the
choice
Please tick if this information is provided at the PoA level In this case sections D2 to D4 need
not be completed in this form
D2 Brief description how comments by local stakeholders have been invited and compiled
The stakeholder meeting was conducted at the office of Kilang Sawit Felda Triang on 05032012 There
were 37 stakeholders attending the consultation Posters were pasted at the guard house and at the
entrance to office 1 week before the stakeholder consultation to inform the locals stakeholders which
comprise mostly the workers of the mill 20 stakeholders out of the 37 who attended the consultation are
2nd generation of the Felda settlers who live in the vicinity to the project activity and adequately represent
the local community composed entirely of Felda settlers (no other people live in the vicinity of this
remote plantation) Continuous input of ideascomments were allowed to all stakeholders who could
either send their input though an email account especially setup for the biogas project or directly inform
the project proponents
During the meeting presentations were made by the project owner to outline the proposed project activity
in a non-technical manner (including environmental social and technological considerations) climate
change and the role of the CDM Attendees were given opportunity to raise their concern and opinion
about the proposed project activity during the question and answer session
D3 Summary of the comments received
PROJECT DESIGN DOCUMENT FORM (CDM-SSC-PDD) - Version 03
CDM ndash Executive Board
45
Below are the questions raised during the stakeholder meeting
NAME QUESTION
Mohd Tarmizi Bin Mat
Daud What is CDM in Bahasa Malaysia
Mohd Tarmizi Bin Mat
Daud What is DoE‟s standard for treated water released into river
Mohd Azizi Bin Abdul
Aziz
Would the biogas be captured from the existing effluent treatment ponds or a
new structure
Azhar Bin Abdul What to do with the captured biogas from the bioreactor
D4 Report on how due account was taken of any comments received
Below are the answers to the questions asked during the stakeholder meeting
QUESTION ANSWER
What is CDM in Bahasa Malaysia
The meaning of CDM in Bahasa Malaysia is Mekanisme
Pembangunan Bersih or in English is Clean Development
Mechanism
By Abd Karim Bin Mohd Zin
What is DoE‟s standard for treated
water released into river
The discharge standard for BOD into river is less than 100ppm
By Abd Karim Bin Mohd Zin
Would the biogas be captured from
the existing effluent treatment
ponds or a new structure
New bioreactor will be constructed to replace the existing anaerobic
lagoon treatment system The new bioreactor will capture the
biogas produced from this anaerobic treatment process
By Abd Karim Bin Mohd Zin
What to do with the captured
biogas from the bioreactor
The biogas recovered from the bioreactor will mainly contain
methane (approximately 60) and the rest are CO2 H2 and H2S
Currently the biogas is just released to the atmosphere from the
existing open lagoons system During the project activity captured
biogas will be combusted thus will improve the air quality
By Abd Karim Bin Mohd Zin
PROJECT DESIGN DOCUMENT FORM (CDM-SSC-PDD) - Version 03
CDM ndash Executive Board
46
Annex 1
CONTACT INFORMATION ON ENTITYINDIVIDUAL RESPONSIBLE FOR THE SMALL-
SCALE CPA
Organization Felda Palm Industries Sdn Bhd (359584-V)
StreetPOBox Jalan Gurney 1
Building Balai Felda 4th Floor
City Kuala Lumpur
StateRegion Wilayah Persekutuan
PostfixZIP 54000
Country Malaysia
Telephone (03) 2692 8066
FAX (03) 2693 4148
URL wwwfeldanetmy
Represented by
Title Head of Department
Salutation Mr
Last Name Busu
Middle Name
First Name Zainuri
Department Biomass
Mobile
Direct FAX
Direct tel
Personal E-Mail zainuribfeldanetmy
Organization Ably Carbon Sdn Bhd
StreetPOBox Jalan Ipoh Kecil
Building No 17
City Kuala Lumpur
StateRegion
PostfixZIP 50350
Country Malaysia
Telephone +60 3 4042 1177
FAX +60 3 4044 4166
E-Mail stephanevidailletably-carboncom
URL
Represented by Stephane Vidaillet
Title Chairman
Salutation Mr
Last Name Vidaillet
Middle Name
First Name Steacutephane
Department
Mobile +33 6 59111 5600
Direct FAX
PROJECT DESIGN DOCUMENT FORM (CDM-SSC-PDD) - Version 03
CDM ndash Executive Board
47
Direct tel
Personal E-Mail stephanevidailletably-carboncom
PROJECT DESIGN DOCUMENT FORM (CDM-SSC-PDD) - Version 03
CDM ndash Executive Board
48
Annex 2
INFORMATION REGARDING PUBLIC FUNDING
The project activity is not receiving any funding from parties included in Annex 1 of the Kyoto Protocol
SMALL-SCALE CDM PROGRAMME ACTIVITY DESIGN DOCUMENT FORM (CDM-SSC-CPA-DD) - Version 01
NAME TITLE OF THE PoA Biogas Recovery and Utilization PoA Projects in
Malaysia
CDM ndash Executive Board page 49
This template shall not be altered It shall be completed without modifyingadding headings or logo format or font
Annex 3
BASELINE INFORMATION
1 2
Year 2009 2010 2011 2012 2013 2014
FFB (mtyr) 343720 345910 310250 333293 333293 333293
POME Volume
(cumyr)[1] 343720 345910 310250 333293 333293 333293
Mill Opearing hour (hryr) 68865 69225 6209 6673 6673 6673
PKS (mtyr) 18905 19025 17064 18331 18331 18331
3 4 5 6 7 8 9 10
2015 2016 2017 2018 2019 2020 2021 2022
333293 333293 333293 333293 333293 333293 333293 333293
333293 333293 333293 333293 333293 333293 333293 333293
6673 6673 6673 6673 6673 6673 6673 6673
18331 18331 18331 18331 18331 18331 18331 18331
SMALL-SCALE CDM PROGRAMME ACTIVITY DESIGN DOCUMENT FORM (CDM-SSC-CPA-DD) - Version 01
NAME TITLE OF THE PoA Biogas Recovery and Utilization PoA Projects in
Malaysia
CDM ndash Executive Board page 50
This template shall not be altered It shall be completed without modifyingadding headings or logo format or font
10 days measurement campaign for baseline wastewater treatment system
Day Date
ETP
Inlet
Anaerobic
system (mgl)
Outlet
Anaerobic
system (mgl)
Outlet Algae
System (mgl)
Final
Discharge to
River (mgl)
1 23-Feb-12 35693 3120 811 603
2 25-Feb-12 19511 2559 1186 83
3 26-Feb-12 32864 2767 749 437
4 27-Feb-12 30195 2330 1210 404
5 28-Feb-12 32436 1927 1188 941
6 29-Feb-12 38259 4256 896 717
7 1-Mar-12 28717 3584 1232 695
8 3-Mar-12 31002 4660 1658 1210
9 4-Mar-12 22400 4346 1389 963
10 5-Mar-12 31226 4301 1971 1165
Average 30230 3385 1229 722
ETP
COD removal efficiency (anaerobic system) 8880
COD removal efficiency (Facultativealgae system) 6369
COD removal efficiency (Bio-polishing system) 4127
Total COD removal efficiency of the treatment system 9761
The COD of the raw effluent during ex-post may vary from the one year historical records depending on
the improvement of the production process (outside of project boundary) thus ERex-post may vary from the
estimated ERex-ante
SMALL-SCALE CDM PROGRAMME ACTIVITY DESIGN DOCUMENT FORM (CDM-SSC-CPA-DD) - Version 01
NAME TITLE OF THE PoA Biogas Recovery and Utilization PoA Projects in
Malaysia
CDM ndash Executive Board page 51
This template shall not be altered It shall be completed without modifyingadding headings or logo format or font
Annex 4
MONITORING INFORMATION
General information
Monitoring refers to the collection and archiving of all relevant data necessary for determining the
baseline measuring anthropogenic emissions by sources of greenhouse gases (GHG) within the project
boundary of a CDM project activity and leakage It includes developing suitable data collection methods
and data interpretation techniques for monitoring and verification of GHG emissions
On-line monitoring system
Most key meters required to determine GHG emissions and emission reductions will be monitored from a
central control point which will record meter readings at a pre-determined interval
Ensuring adequate maintenance and calibration of monitoring instruments
Specific maintenance repair or replacement of monitoring equipment will be recorded dated and
described
The calibration will occur at intervals determined on the basis of instrument manufacturers
recommendations stability purpose usage and history of repeatability Recalibration should be
performed whenever an event occurs that places the accuracy of the instrument in doubt
Calibration will take place at least once every three (3) years to ensure that the monitoring
equipments are properly installed and functioning properly
Calibration will be performed according to national or international standards
Last calibration certificates will be provided during periodic verification
Sampling procedure
Wherever a statistical sample is used for monitoring the ldquogeneral guidelines for sampling and surveys for
SSC project activitiesrdquo shall be used COD shall be measured from a composite sample to obtain a
representative value
Data archiving
The monitored data will be kept for a minimum of 2 years after the end of the crediting years by using
paper documents or electronic files
Identification of non-conformities
A verification of inconsistencies of the data recorded will be performed based for example on
The comparison of the calculated quantities of methane versus expected
Spot checks of field instruments (local reading) and data in the log file
Any discrepancies (completeness calculation errors transcription errors instrument calibration issues)
will be analyzed and actions taken to correct the problem
Ensuring adequate training of staff
All new staff members will undergo bdquoon job training‟ covering the monitoring requirements
The monitoring plan will be made available to staff member involved in the monitoring
A copy will be located in the control room at the site
SMALL-SCALE CDM PROGRAMME ACTIVITY DESIGN DOCUMENT FORM (CDM-SSC-CPA-DD) - Version 01
NAME TITLE OF THE PoA Biogas Recovery and Utilization PoA Projects in
Malaysia
CDM ndash Executive Board page 52
This template shall not be altered It shall be completed without modifyingadding headings or logo format or font
During the training the employees will sign a training attendance list All training records shall
be documented inclusive of training attendance training memo and training material if any
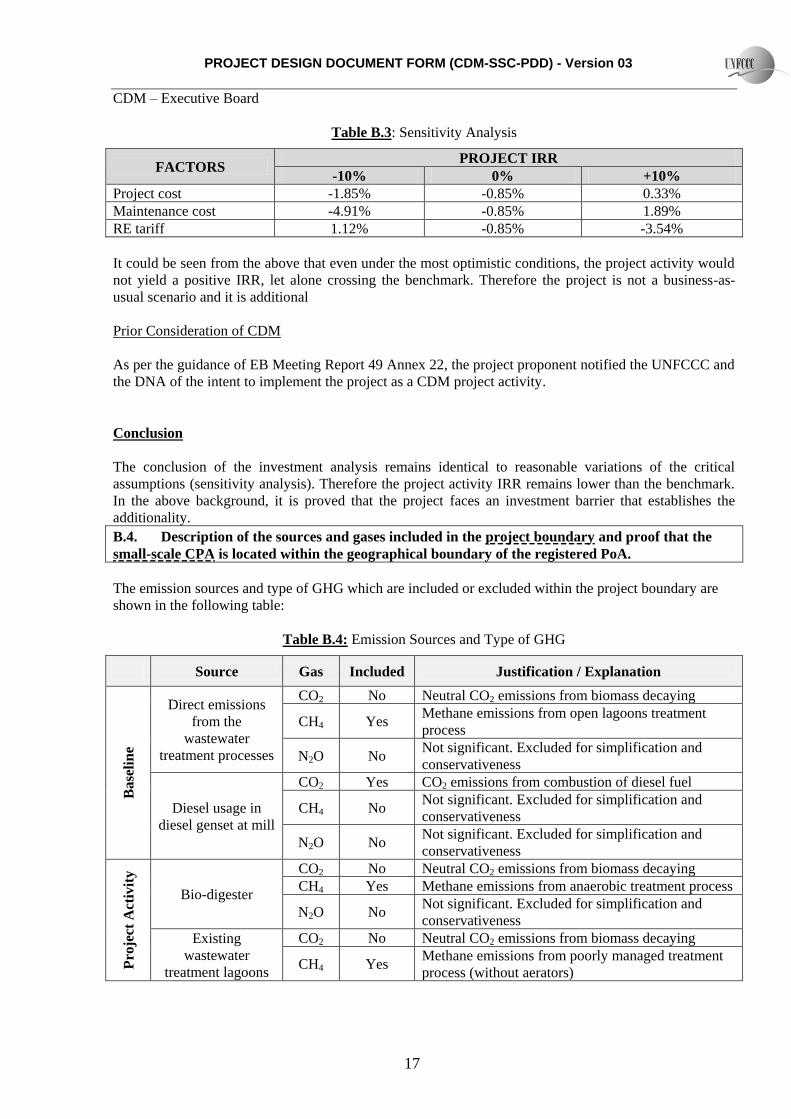
PROJECT DESIGN DOCUMENT FORM (CDM-SSC-PDD) - Version 03
CDM ndash Executive Board
17
Table B3 Sensitivity Analysis
FACTORS PROJECT IRR
-10 0 +10
Project cost -185 -085 033
Maintenance cost -491 -085 189
RE tariff 112 -085 -354
It could be seen from the above that even under the most optimistic conditions the project activity would
not yield a positive IRR let alone crossing the benchmark Therefore the project is not a business-as-
usual scenario and it is additional
Prior Consideration of CDM
As per the guidance of EB Meeting Report 49 Annex 22 the project proponent notified the UNFCCC and
the DNA of the intent to implement the project as a CDM project activity
Conclusion
The conclusion of the investment analysis remains identical to reasonable variations of the critical
assumptions (sensitivity analysis) Therefore the project activity IRR remains lower than the benchmark
In the above background it is proved that the project faces an investment barrier that establishes the
additionality
B4 Description of the sources and gases included in the project boundary and proof that the
small-scale CPA is located within the geographical boundary of the registered PoA
The emission sources and type of GHG which are included or excluded within the project boundary are
shown in the following table
Table B4 Emission Sources and Type of GHG
Source Gas Included Justification Explanation
Ba
seli
ne
Direct emissions
from the
wastewater
treatment processes
CO2 No Neutral CO2 emissions from biomass decaying
CH4 Yes Methane emissions from open lagoons treatment
process
N2O No Not significant Excluded for simplification and
conservativeness
Diesel usage in
diesel genset at mill
CO2 Yes CO2 emissions from combustion of diesel fuel
CH4 No Not significant Excluded for simplification and
conservativeness
N2O No Not significant Excluded for simplification and
conservativeness
Pro
ject
Act
ivit
y
Bio-digester
CO2 No Neutral CO2 emissions from biomass decaying
CH4 Yes Methane emissions from anaerobic treatment process
N2O No Not significant Excluded for simplification and
conservativeness
Existing
wastewater
treatment lagoons
CO2 No Neutral CO2 emissions from biomass decaying
CH4 Yes Methane emissions from poorly managed treatment
process (without aerators)
PROJECT DESIGN DOCUMENT FORM (CDM-SSC-PDD) - Version 03
CDM ndash Executive Board
18
(Facultative amp
algae system) N2O No
Not significant Excluded for simplification and
conservativeness
Gas engine(s)
(biogas
combustion)
CO2 No Neutral CO2 emissions from biogas combustion
CH4 No Not significant and excluded from calculation
Biogas combustion efficiency is considered 10019
N2O No Not significant Excluded for simplification and
conservativeness
Biomass Boiler(s)
(Biogas
combustion)
CO2 No Neutral CO2 emissions from biogas combustion
CH4 No Not significant and excluded from calculation
Biogas combustion efficiency is considered 10020
N2O No Not significant Excluded for simplification and
conservativeness
Grid electricity
consumption from
national grid
CO2 Yes CO2 emissions from grid energy
CH4 No Not significant Excluded for simplification and
conservativeness
N2O No Not significant Excluded for simplification and
conservativeness
Enclosed or Open
flaring system
CO2 No Neutral CO2 emissions from biogas combustion
CH4 Yes CH4 emissions due to incomplete combustion in
enclosed flare
N2O No Not significant Excluded for simplification and
conservativeness
The CPA is implemented at the address below
Kilang Sawit Felda Triang Triang Pahang Malaysia
The site is located at state of Pahang Malaysia with GPS coordinates 3 16152 N 102 34567 E or
32692 1025761 (refer also Section A412) and thus is located within the geographical boundary of the
PoA
B5 Emission reductions
B51 Data and parameters that are available at validation
Data Parameter GWPCH4
Data unit tCO2tCH4
Description Global Warming Potential the equivalent in CO2 of the effect of methane
gas to the atmosphere
Source of data used IPCC 2006
Value applied 21
Justification of the choice of
data or description of
measurement methods and
procedures actually applied
Global warming potential for methane gas since this is a methane
capture project
19 AMS-IIIH para 35 20 AMS-IIIH para 35
PROJECT DESIGN DOCUMENT FORM (CDM-SSC-PDD) - Version 03
CDM ndash Executive Board
19
Any comment
Data Parameter MCFwwtreatmentBL1
Data unit Fraction
Description Methane correction factor for baseline wastewater anaerobic treatment
systems
Source of data used Table IIIH1 AMS IIIH version 16
Value applied 08
Justification of the choice of
data or description of
measurement methods and
procedures actually applied
Table IIIH1 for baseline emission The lagoons depth are more than 2m
MCF value of 08 for anaerobic deep lagoon (depth gt 2 m)
Any comment
Data Parameter MCFwwtreatmentBL2
Data unit Fraction
Description Methane correction factor for baseline wastewater aerobic treatment
systems
Source of data used Methane correction factor for baseline aerobic wastewater treatment
system (poorly managed)
Value applied Table IIIH1 AMS IIIH version 16
Justification of the choice of
data or description of
measurement methods and
procedures actually applied
03
Any comment No aerators installed
Data Parameter MCFwwBLdischarge
Data unit Fraction
Description Methane correction factor based on discharge pathway in the baseline
situation
Source of data used Table IIIH1 AMS IIIH version 16
Value applied 01
Justification of the choice of
data or description of
measurement methods and
procedures actually applied
Table IIIH1 for baseline emission The final discharge of treated
effluent into river MCF value of 01 for river discharge
Any comment
Data Parameter Bo ww
Data unit kgCH4 kgCOD
Description Methane generation capacity of treated wastewater
Source of data used IPCC 2006
Value applied 025
Justification of the choice of
data or description of
measurement methods and
procedures actually applied
Default value as prescribed in the methodology
Any comment
PROJECT DESIGN DOCUMENT FORM (CDM-SSC-PDD) - Version 03
CDM ndash Executive Board
20
Data Parameter UFBL
Data unit -
Description Model correction factor to account for model uncertainties (baseline)
Source of data used AMS IIIH version 16
Value applied 089
Justification of the choice of
data or description of
measurement methods and
procedures actually applied
As per methodology AMS-IIIH point 24
Any comment -
Data Parameter UFPJ
Data unit -
Description Model correction factor to account for model uncertainties (project
activity)
Source of data used AMS IIIH version 16
Value applied 112
Justification of the choice of
data or description of
measurement methods and
procedures actually applied
As per methodology AMS-IIIH point 30(a)
Any comment -
Data Parameter CFEww
Data unit Fraction
Description Capture efficiency of the biogas recovery equipment in the wastewater
treatment system
Source of data used AMS IIIH version 16
Value applied 09
Justification of the choice of
data or description of
measurement methods and
procedures actually applied
A default value of 09 has been used as per the guidance in the
methodology
Any comment
Data Parameter MCF ww treatmentPJ1
Data unit Fraction
Description Methane correction factor for the project wastewater anaerobic treatment
system equipped with biogas recovery equipment
Source of data used Table IIIH1 AMS IIIH version 16
Value applied 08
Justification of the choice of
data or description of
measurement methods and
procedures actually applied
The lagoons depth are more than 2 m MCF values in table IIIH1 has
been used as per the guidance in the methodology (depth gt 2 m)
Any comment
Data Parameter MCF ww treatmentPJ2
PROJECT DESIGN DOCUMENT FORM (CDM-SSC-PDD) - Version 03
CDM ndash Executive Board
21
Data unit Fraction
Description Methane correction factor for the project wastewater aerobic treatment
system not equipped with biogas recovery equipment
Source of data used Table IIIH1 AMS IIIH version 16
Value applied 03
Justification of the choice of
data or description of
measurement methods and
procedures actually applied
Aerobic treatment poorly managed
Any comment
Data Parameter MCFwwPJdischarge
Data unit Fraction
Description Methane correction factor based on discharge pathway in the project
activity
Source of data used Table IIIH1 AMS IIIH version 16
Value applied 01
Justification of the choice of
data or description of
measurement methods and
procedures actually applied
Table IIIH1 for project emission The final discharge of treated effluent
into river MCF value of 01 for river discharge
Any comment Same discharge pathway as in the baseline
Data Parameter CODBL1
Data unit
Description COD removal efficiency of the baseline system (anaerobic treatment
system)
Source of data used 10 days measurement campaign
Value applied Anaerobic Treatment system 8880
Justification of the choice of
data or description of
measurement methods and
procedures actually applied
One year historical data not available
Any comment This data will be used for ex post emission reduction calculation
Data Parameter CODBL2
Data unit
Description COD removal efficiency of the baseline system (aerobic treatment
system)
Source of data used 10 days measurement campaign
Value applied Aerobic Treatment system 6369
Justification of the choice of
data or description of
measurement methods and
procedures actually applied
One year historical data not available
Any comment This data will be used for ex post emission reduction calculation
Data Parameter NCVCH4
Data unit MJkg
PROJECT DESIGN DOCUMENT FORM (CDM-SSC-PDD) - Version 03
CDM ndash Executive Board
22
Description Net Calorific Value of methane
Source of data used IPCC 2006 Default Value
Value applied 504
Justification of the choice of
data or description of
measurement methods and
procedures actually applied
IPCC 2006 value is used Volume 2 Chapter 1 Table 12
Any comment
Data Parameter NCVFF
Data unit MJkg
Description Net Calorific Value of diesel
Source of data used IPCC 2006 Default Value
Value applied 430
Justification of the choice of
data or description of
measurement methods and
procedures actually applied
IPCC 2006 value is used Volume 2 Chapter 1 Table 12
Any comment
Data Parameter EFCO2diesel
Data unit tCO2MWh
Description CO2 emission factor diesel genset
Source of data used AMS-IA version 14 point 14
Value applied 08
Justification of the choice of
data or description of
measurement methods and
procedures actually applied
Default value for diesel generation unit
Any comment
Data Parameter Grid Emission Factor
Data unit kgCO2ekWh
Description Emission factor for grid electricity in Peninsular Malaysia
Source of data used Pusat Tenaga Malaysia March 2010
Value applied 0672
Justification of the choice of
data or description of
measurement methods and
procedures actually applied
As per AMS-ID point 12
Any comment Study on Grid Connected Electricity Baselines in Malaysia 2008
B52 Ex-ante calculation of emission reductions
The ex ante emission reductions are calculated based on AMS-IIIH version 16 as per equations
explained in section E62 of PoA-DD Biogas PoA in Malaysia
PROJECT DESIGN DOCUMENT FORM (CDM-SSC-PDD) - Version 03
CDM ndash Executive Board
23
Calculation for AMS-IIIH
Baseline emissions
Source of baseline emissions Reference Applicable
(YN)
Comments
Wastewater and sludge treatment
systems equipped with a biogas
recovery facility shall be excluded
from the baseline
AMS-IIIH
Point 17
N No biogas recovery in the
baseline
Emissions on account of electricity or
fossil fuel used (BEpowery)
AMS-IIIH
Point 18 (i)
N For conservativeness no
emissions due to electricity or
fossil fuel will be claimed
BEpowery = 0
Methane emissions from baseline
wastewater treatment systems
(BEwwtreatmenty)
AMS-IIIH
Point 18 (ii)
Y Baseline includes anaerobic and
aerobic treatment conditions with
different MCF values selected as
per Table IIIH1
Methane emissions from baseline
sludge treatment systems (BEstreatmenty)
= 0
AMS-IIIH
Point 18 (iii)
N The baseline plant corresponds to
scenario Para 1(f) without sludge
treatment BEstreatmenty = 0
Methane emissions on account of
inefficiencies in the baseline
wastewater treatment systems and
presence of degradable organic carbon
in the treated wastewater discharged
into river (BEwwdischargey)
AMS-IIIH
Point 18 (iv)
Y Treated effluent is currently
discharged into the river
Methane emissions from the decay of
the final sludge generated by the
baseline treatment systems (BEsfinaly)
AMS-IIIH
Point 18 (v)
N Zero because in the baseline final
sludge used for soil application
BEsfinaly = 0
A) Calculation of baseline emissions
BEy = BEwwtreatmenty + BEwwdischargey
Abbreviation Description Value Source
BEy Baseline emissions in year y (tCO2e) 30762 Calculated
BEpowery Baseline emissions of diesel genset in year
y tCO2eyear 0 Calculated
BEwwtreatmenty Baseline emissions of the wastewater
treatment systems tCO2eyear 30663 Equation 2
BEwwdischargey
The methane emissions from degradable
organic carbon in treated wastewater
discharged tCO2eyear
100 Equation 6
A1) Baseline emissions
PROJECT DESIGN DOCUMENT FORM (CDM-SSC-PDD) - Version 03
CDM ndash Executive Board
24
Equation 2 BEwwtreatmenty = Qwwy (CODinflow1 y CODBL1 MCFwwtreatmentBL1) +
(CODinflow2y CODBL2 MCFwwtreatmentBL2) Boww UFBL GWPCH4
Abbreviation Description Value Source
BEwwtreatmenty Baseline emissions of the wastewater
treatment systems (tCO2eyear) 30663 Calculated
Qwwy Volume of wastewater treated in baseline
wastewater treatment system i in year y
(m3year)
333293
Volume based on 10 m3mt
FFB21 amp FFB historical data
(2009 ndash 2011)
CODinflow1y Chemical oxygen demand of the
wastewater inflow to the baseline treatment
system (anaerobic) in year y (tCOD m3)
0026905 10 days measurement
campaign
CODBL1 COD removal efficiency of the baseline
treatment system (anaerobic) () 8880
10 days measurement
campaign
CODinflow2y Chemical oxygen demand of the
wastewater inflow to the baseline treatment
system (aerobic) in year y (tCOD m3)
0003013 10 days measurement
campaign
CODBL2 COD removal efficiency of the baseline
treatment system (aerobic) () 6369
10 days measurement
campaign
MCFwwtreatmentBL 1 Methane correction factor for baseline
wastewater anaerobic treatment systems 08
MCF values as per table
IIIH1 anaerobic gt 2m
MCFwwtreatmentBL2 Methane correction factor for baseline
wastewater aerobic treatment systems 03
MCF values as per table
IIIH1 ndash poorly managed
Boww Methane producing capacity of the
wastewater (kg CH4kg COD) 025
IPCC 2006
UFBL Model correction factor to account for
model uncertainties 089
IPCC 2006
GWPCH4 Global Warming Potential for methane 21 IPCC 2006
A2) The methane emissions from degradable organic carbon in treated wastewater discharged
Equation 6 BEwwdischargey = Qwwy GWPCH4 Boww UFBL CODwwdischarge BLyMCFww BLdischarge
Abbreviation Description Value Source
BEwwdischargey
The methane emissions from degradable
organic carbon in treated wastewater
discharged (tCO2eyear)
100 Calculated
Qwwy Volume of treated wastewater discharged
in year y (m3year) 333293
Volume based on 10 m3mt
FFB22 amp FFB historical data
(2009 ndash 2011)
GWPCH4 Global warming potential of methane 21 IPCC 2006
Boww Methane producing capacity of the treated
wastewater (kgCH4 kgCOD) 025 IPCC 2006
21 Mill designed data for baseline effluent treatment plant 22 Mill designed data for baseline effluent treatment plant
PROJECT DESIGN DOCUMENT FORM (CDM-SSC-PDD) - Version 03
CDM ndash Executive Board
25
UFBL Model correction factor to account for
model uncertainties 089 IPCC 2006
CODwwdischarge BLy Chemical oxygen demand of the treated
wastewater discharged into sea river or
lake in the baseline situation in the year y
(tonnesm3)
0000642 10 days measurement
campaign
MCFwwBLdischarge Methane correction factor based on
discharge pathway in the baseline situation
(eg into sea river or lake) of the
wastewater (fraction)
01 MCF values as per table
IIIH1 version 16
Project activity emissions
The project activity emission sources as per the methodology and their relevance with respect to the
proposed CDM project activity are given below in a tabular format
Source of project activity
emission Reference
Applicable
(YN) Comments
CO2 emissions on account of
power and fossil fuel used by
the project activity facilities
(PEpowery)
AMS-IIIH
point 29(i)
Y The project activity uses the electricity
imported from the national grid
Methane emissions from
wastewater treatment systems
affected by the project
activity and not equipped with
biogas recovery in the project
situation (PEwwtreatmenty)
AMS-IIIH
point 29 (ii)
Y CH4 emissions from the poorly managed
aerobic lagoons
Methane emissions from
sludge treatment systems
affected by the project
activity and not equipped with
biogas recovery in the project
situation (PEstreatmenty)
AMS-IIIH
point 29 (iii)
N The project activity corresponds to
scenario (vi) without sludge treatment
PEystreatmenty = 0
Methane emissions on account
of inefficiency of the project
activity wastewater treatment
systems and presence of
degradable organic carbon in
treated wastewater
(PEwwdischargey)
AMS-IIIH
point 29 (iv)
Y Treated effluent from ETP will be
discharged into river
Methane emissions from the
decay of the final sludge
generated by the project
activity treatment systems
(PEsfinaly)
AMS-IIIH
point 29 (v)
N In the proposed CDM project activity
final sludge is used for soil application in
the same manner as in the baseline
PEsfinaly = 0
PROJECT DESIGN DOCUMENT FORM (CDM-SSC-PDD) - Version 03
CDM ndash Executive Board
26
Methane fugitive emissions on
account of inefficiencies in
capture systems (PEfugitivey)
AMS-IIIH
point 29 (vi)
Y Applicable to PEfugitivewwy
N The project activity corresponds to
scenario (vi) without sludge treatment
PEfugitivesy = 0
Methane emissions due to
incomplete flaring (PEflaringy)
AMS-IIIH
point 29 (vii)
Y Enclosed flaring system installed
Methane emissions from
biomass stored under
anaerobic conditions which
does not take place in the
baseline situation (PEbiomassy)
AMS-IIIH
point 29
(viii)
N In the project activity the biomass (PKS
+ mesocarp fibres) displaced will not be
stored under anaerobic conditions The
conditions of onsite storage are identical
in the baseline as in the project activity
The biomass will be sold to the market
on a regular basis PEbiomassy = 0
B) Calculation of project emissions
PEy = PEpowery + PEwwtreatmenty + PEww discharge y + PEfugitive y + PEflaring y
Abbreviation Description Value Source
PEy Project activity emissions in the year y
(tCO2eyr) 6050 Equation 8
PEpowery CO2 emissions on account of power used
by the project activity facilities (tCO2eyr) 604 -
PEwwtreatmenty Methane emissions from wastewater
treatment systems affected by the project
activity and not equipped with biogas
recovery in year y (tCO2eyr)
1523 Equation 9
PEwwdischargey
Methane emissions on account of
inefficiency of the project activity
wastewater treatment systems and presence
of degradable organic carbon in treated
wastewater (tCO2eyr)
126 Equation 12
PEfugitivey Methane fugitive emissions on account of
inefficiencies in capture systems (tCO2eyr) 3796 Equation 15
PEflaringy Methane emissions due to incomplete
flaring (tCO2eyr) 0 Equation 19
B1) Project emissions from CO2 emissions on account of power and fuel used by the project activity
facilities in year ldquoyrdquo in tCO2eyear
PEpowery = ECPJjy EFgridy
Abbreviation Description Value Source
PEpowery Project emissions from electricity
consumption in the year y (tCO2eyr) 604 Calculated
ECPJjy Internal power consumption from the grid 749 100 kW is the effective
PROJECT DESIGN DOCUMENT FORM (CDM-SSC-PDD) - Version 03
CDM ndash Executive Board
27
(MWh year) power based on the
equipments installed at the
site
EFgridy Grid Emission factor in Peninsular
Malaysia 2008 (tCO2 MWh) 0672
Study on Grid Connected
Electricity Baselines in
Malaysia 2008 published in
2010 by PTM
B2) Methane emissions from wastewater treatment systems affected by the project activity and not
equipped with biogas recovery in the project situation in year ldquoyrdquo in tCO2e
Equation 9 PEwwtreatment y = Qwwky CODinflowk y PJky MCFwwtreatmentPJk) Boww UFPJ GWPCH4
Abbreviation Description Value Source
PEwwtreatmenty
Methane emissions from wastewater
treatment systems affected by the project
activity and not equipped with biogas
recovery in the project situation (tCO2eyr)
1523 Calculated
Qwwky Volume of wastewater treated in project
activity wastewater treatment system k in
year y (m3year)
333293
Volume based on 10 m3mt
FFB23 amp FFB historical data
(2009 ndash 2011)
CODinflowky Chemical oxygen demand of the
wastewater inflow to the project activity
treatment system k in year y (tonnes COD
m3)
0002690 10 days measurement
campaign
PJky Chemical oxygen demand removal
efficiency of the project wastewater
treatment system k in year y (tm3)
measured based on inflow COD and
outflow COD in system k
90 Based on bio-digester COD
removal efficiency of 90
MCFwwtreatmentPJk Methane correction factor for project
wastewater treatment system k (MCF
values as per table IIIH1)
03
MCF values table IIIH1
Version 16 ndash aerobic poorly
managed (conservative)
Boww Methane generation capacity of the treated
wastewater (kg CH4kg COD) 025 IPCC 2006
UFPJ Model correction factor to account for
model uncertainties 112
IPCC 2006
GWPCH4 Global warming potential of methane 21 IPCC 2006
23 Mill designed data for baseline effluent treatment plant
PROJECT DESIGN DOCUMENT FORM (CDM-SSC-PDD) - Version 03
CDM ndash Executive Board
28
B3) Methane emissions on account of inefficiency of the project activity wastewater treatment
systems and presence of degradable organic carbon in treated wastewater in the year ldquoyrdquo (tonnes)
Equation 12 PEwwdischarge y = Qwwy GWPCH4 Boww UFPJ CODwwdischargePJy MCFwwPJdischarge
Abbreviation Description Value Source
PEwwdischargey
Methane emissions from degradable
organic carbon in treated wastewater
(tCO2eyr)
126 Calculated
Qwwy Quantity of wastewater treated in year y
(m3year) 333293
Volume based on 10 m3mt
FFB24 amp FFB historical data
(2009 ndash 2011)
CODwwdischargedPJ
y
Chemical oxygen demand of the treated
wastewater discharged into river in the
project situation in year y (tCOD m3)
0000642 10 days measurement
campaign
MCFwwPJ discharge
Methane correction factor based on
discharge pathway in the project situation
(river) of the wastewater (fraction)
01 MCF values as per table
IIIH1 Version 16
Boww Methane generation capacity of the treated
wastewater (kg CH4kg COD) 025 IPCC 2006
UFPJ Model correction factor to account for
model uncertainties 112 IPCC 2006
GWPCH4 Global warming potential of methane 21 IPCC 2006
B41) Methane fugitive emissions on account of inefficiencies in capture systems in the year ldquoyrdquo
(tonnes)
Equation 15 PEfugitivewwy = (1 ndash CFEww ) MEPywwtreatment GWPCH4
Abbreviation Description Value Source
PEfugitivey Methane fugitive emissions on account of
inefficiencies in capture systems (tCO2eyr) 3796 Calculated
CFEww Capture efficiency of the biogas recovery
equipment in the wastewater treatment
systems
09 AMS IIIH Version 16
MEPywwtreatment Methane emission potential of wastewater
treatment systems equipped with biogas
recovery system in year y (tCH4yr)
1808 Refer Equation 11 of AMS
IIIH version 16
GWPCH4 Global warming potential of methane 21 IPCC 2006
B42) Methane emission potential of wastewater treatment plant in the year ldquoyrdquo (tonnes)
Equation 16 MEPwwtreatmenty = Qwwy Boww UFPJ (CODremovedPJky MCFwwtreatmentPJk)
24 Mill designed data for baseline effluent treatment plant
PROJECT DESIGN DOCUMENT FORM (CDM-SSC-PDD) - Version 03
CDM ndash Executive Board
29
Abbreviation Description Value Source
MEPwwtreatmenty Methane emission potential of wastewater
treatment systems equipped with biogas
recovery system in year y (tonnes CH4yr)
1808 Calculated
Qyww Quantity of wastewater treated in year y
(m3year) 333293
Volume based on 10 m3mt
FFB25 amp FFB historical data
(2009 ndash 2011)
Boww Methane generation capacity of the treated
wastewater (kg CH4kg COD) 025 IPCC 2006
CODremovedPJy
The chemical oxygen demand removed by
the treatment anaerobic system of the
project activity equipped with biogas
recovery in the year y (tCOD m3)
0024214
10 days measurement
campaign amp bio-digester
design parameter
MCFwwtreatmentPJ
Methane correction factor for the project
wastewater treatment system k equipped
with biogas recovery equipment
08 MCF values as per table
IIIH1 Version 16
UFPJ Model correction factor to account for
model uncertainties 112 IPCC 2006
B5) Methane emissions due to incomplete flaring in the year ldquoyrdquo (tonnes)
Equation 13a PEflaringy = TMflaredy (1 - ηflarey) GWPCH4
Abbreviation Description Value Source
PEflaringy Methane emissions due to incomplete
flaring (tCO2eyr) 0 Calculated
TMflaredh Mass flow rate of methane flared in dry
basis in the hour h (tCH4 yr) 0 Calculated
ηflarey Flare efficiency in hour h based on default
values 50
Tools for methane flaring
(open flare) for conservative
GWPCH4 Global warming potential of methane 21 IPCC 2006
Leakage emissions
No leakage emission will occur in the project activity
LEy1 = 0
Emission reductions
Equation 22 ERy ex ante = BEy ex ante ndash (PEy ex ante + LEy ex ante)
25 Mill designed data for baseline effluent treatment plant
PROJECT DESIGN DOCUMENT FORM (CDM-SSC-PDD) - Version 03
CDM ndash Executive Board
30
Abbreviation Description Value Source
ERy1 ex ante Ex ante emission reduction in year y
(tCO2e) 24712 Equation 22
BEy1 ex ante Ex ante baseline emissions in year y
(tCO2e) 30762 Equation 1
PEy1 ex ante Ex ante project emissions in year y (tCO2e) 6050 Equation 8
LEy1 ex ante Ex ante Leakage emissions in year y
(tCO2e) 0 -
Calculation for AMS-ID
Baseline emissions
Electricity generated from biogas engines will be exported to the Peninsular Malaysia National Grid The
baseline emissions are described in AMS-ID (Version 17 EB 61) as the ldquoproduct of electrical energy
baseline expressed in kWh of electricity produced by the renewable energy generating unit multiplied by
an emission factorrdquo
Baseline emissions due to electricity exported to the grid in the year ldquoyrdquo (tonnes)
BEEGy = EGBLy EFCO2gridy
Abbreviation Description Value Source
BEEGy Baseline emissions in year y (tCO2eyr) 4568 Calculated
EGBLy
Quantity of net electricity supplied to the
grid as a result of the implementation of the
project activity in year y (kWh yr)
6797625 Calculated
EFCO2gridy
CO2 emission factor of the grid in year
(tCO2kWh) 0672
Study on Grid Connected
Electricity Baselines in
Malaysia 2008 published in
2010 by PTM
Project Activity Emissions
As per AMS-ID (Version 17 EB 61) project emissions for renewable energy project activities are zero
PEEGy = 0
Leakage
If the energy generating equipment is transferred from another activity leakage is to be considered
No leakage emission will occur in the project activity LEy = 0
PROJECT DESIGN DOCUMENT FORM (CDM-SSC-PDD) - Version 03
CDM ndash Executive Board
31
Emission reductions
ERy = BEy ndash PEy - LEy
Abbreviation Description Value Source
ERy Emission reduction in year y (tCO2ey) 4568 -
BEy Baseline emissions in year y (tCO2ey) 4568 -
PEy Project emissions in year y (tCO2ey) 0 -
LEy Leakage emissions in year y (tCO2ey) 0 -
Calculation for AMS-IA
Baseline emissions
The energy baseline is the fuel consumption of the technology in use or that would have been used in the
absence of the project activity to generate the equivalent quantity of energy Option 2 is applied This
methodology is only apply shall the recovered is in excess after export to the grid
Annual electricity sent to the mill for FF displacement in the year ldquoyrdquo (kWh)
EBLy = ΣEGiy (1 ndash l)
Abbreviation Description Value Source
EBLy Annual energy baseline (kWhyr) Calculated
EGiy
The estimated annual output of the
renewable energy technologies of the group
of i renewable energy technologies
installed (kWhyr)
0 Estimated
l
Average technical distribution losses that
would have been observed in diesel
powered mini-grids installed by public
programmes or distribution companies in
isolated areas expressed as a fraction
0 Conservative by applying
Zero (0)
Baseline electricity sent to the mill for FF displacement in the year ldquoyrdquo (tonnes)
BECO2y = EBLy EFCO2
Abbreviation Description Value Source
BECO2y Baseline emission in the year y (tCO2yr) 0 Calculated
EBLy Annual energy baseline (kWhyr) 0 Calculated
EFCO2 CO2 emission factor (tCO2kWh) 08
Default value which is
derived from diesel
generation units is used
PROJECT DESIGN DOCUMENT FORM (CDM-SSC-PDD) - Version 03
CDM ndash Executive Board
32
Project Activity Emissions
As per AMS-IA (Version 14 EB 54) project emissions for renewable energy project activities are zero
PEy = 0
Leakage
If the energy generating equipment is transferred from another activity or if the existing equipment is
transferred to another activity leakage is to be considered
No leakage emission will occur in the project activity LEy = 0
B53 Summary of the ex-ante estimation of emission reductions
Estimated emission reductions (total project activity)
Year
Estimation of
project activity
emissions (tCO2e)
Estimation of
baseline emissions
(tCO2e)
Estimation of
leakage (tCO2e)
Estimation of
overall emission
reductions (tCO2e)
2012 504 2944 0 2440
2013 6050 35330 0 29280
2014 6050 35330 0 29280
2015 6050 35330 0 29280
2016 6050 35330 0 29280
2017 6050 35330 0 29280
2018 6050 35330 0 29280
2019 5546 32386 0 26840
Total (tCO2) 42350 247310 0 204960
The starting date of the crediting period is 01122012 or the date of registration whichever is later
Estimated emission reductions for AMS-IIIH
Year
Estimation of
project activity
emissions (tCO2e)
Estimation of
baseline emissions
(tCO2e)
Estimation of
leakage (tCO2e)
Estimation of
overall emission
reductions (tCO2e)
2012 504 2563 0 2059
2013 6050 30762 0 24712
PROJECT DESIGN DOCUMENT FORM (CDM-SSC-PDD) - Version 03
CDM ndash Executive Board
33
2014 6050 30762 0 24712
2015 6050 30762 0 24712
2016 6050 30762 0 24712
2017 6050 30762 0 24712
2018 6050 30762 0 24712
2019 5546 28199 0 22653
Total (tCO2) 42350 215334 0 172984
The starting date of the crediting period is 01122012 or the date of registration whichever is later
Estimated emission reductions for AMS-ID
Year
Estimation of
project activity
emissions (tCO2e)
Estimation of
baseline emissions
(tCO2e)
Estimation of
leakage (tCO2e)
Estimation of
overall emission
reductions (tCO2e)
2012 0 381 0 381
2013 0 4568 0 4568
2014 0 4568 0 4568
2015 0 4568 0 4568
2016 0 4568 0 4568
2017 0 4568 0 4568
2018 0 4568 0 4568
2019 0 4187 0 4187
Total (tCO2) 0 31976 0 31976
The starting date of the crediting period is 01122012 or the date of registration whichever is later
Estimated emission reductions for AMS-IA
Year
Estimation of
project activity
emissions (tCO2e)
Estimation of
baseline emissions
(tCO2e)
Estimation of
leakage (tCO2e)
Estimation of
overall emission
reductions (tCO2e)
2012 0 0 0 0
2013 0 0 0 0
2014 0 0 0 0
2015 0 0 0 0
2016 0 0 0 0
PROJECT DESIGN DOCUMENT FORM (CDM-SSC-PDD) - Version 03
CDM ndash Executive Board
34
2017 0 0 0 0
2018 0 0 0 0
2019 0 0 0 0
Total (tCO2) 0 0 0 0
The starting date of the crediting period is 01122012 or the date of registration whichever is later
B6 Application of the monitoring methodology and description of the monitoring plan
B61 Description of the monitoring plan
The parameters to be monitored are
Please note that the amount of methane recovered and fuelled or flared (MDy ) is calculated as follows
MDy = TMfuelledy + TMflaredy Equation A
Where Description Units
MDy Quantity of methane recovered and fuelled or flared in the year y tonnes CH4year
TMfuelledy Quantity of methane fuelled in the year y tonnes CH4year
TMflaredy Quantity of methane flared in year y tonnes CH4year
Where
TMfuelledy = FVfuelledh fvCH4h ηfuelledh ρCH4n) 1000 Equation B
Where Description Units
TMfuelledy Quantity of methane fuelled in the year y tonnes CH4year
FVfuelledh Volumetric flow rate of the fuelled biogas gas at normal conditions in
hour h
Nm3 biogashour
ηfuelledh 100 for gainful purpose26
fvCH4h Volumetric fraction of methane in the biogas gas in the hour h
ρCH4n Density of methane at normal conditions kgCH4Nm3CH4
And
TMflaredy = FVflaredh fvCH4h ηflareh ρCH4n) 1000 Equation C
Where Description Units
TMflaredy Quantity of methane flared in year y tonnes CH4year
FVflaredh Volumetric flow rate of the flared biogas gas at normal conditions in
hour h
Nm3 biogashour
26 AMS-IIIH point 35
PROJECT DESIGN DOCUMENT FORM (CDM-SSC-PDD) - Version 03
CDM ndash Executive Board
35
ηflareh Flare efficiency in the hour h
fvCH4h Volumetric fraction of methane in the biogas gas in the hour h
ρCH4n Density of methane at normal conditions kgCH4Nm3CH4
Data Parameter ID1 Qwwy
Data unit m3 month
Description The flow of wastewater entering the bio-digester
Source of data Measurement by project participant by using a flowmeter
Value of data ~ 28000
Brief description of
measurement methods and
procedures to be applied
The flow is measured with an online flow meter or equivalent
QAQC procedures to be
applied (if any) Data are monitored continuously and recorded periodically
(monthly or at shorter interval) in a data log file (DLF)
Uncertainty level of data low
Maintenance and calibration as per manufacturer‟s specifications
or at least once every three (3) years
Any comment
Data Parameter ID2 CODwwuntreatedy
Data unit tCOD m3
Description Raw COD of wastewater entering the bio-digester
Source of data Laboratory (internal and external)
Value of data ~ 0030230
Brief description of
measurement methods and
procedures to be applied
Measure of COD according to national or international standards
COD is measure through representative sampling
QAQC procedures to be
applied (if any) Minimum once a month COD sampling to ensure a 9010
confidenceprecision level
COD reports are recorded manually
Uncertainty level of data low
Maintenance and calibration as per manufacturer‟s specifications
or at least once every three (3) years for internal laboratory
equipment
Any comment
Data Parameter ID3 CODwwtreatedy
Data unit tCOD m3
Description COD of treated wastewater leaving the bio-digester
Source of data Laboratory (internal and external)
Value of data ~ 0003023
Brief description of
measurement methods and
procedures to be applied
Measure of COD according to national or international standards
COD is measure through representative sampling
QAQC procedures to be
applied (if any) Minimum once a month COD sampling to ensure a 9010
confidenceprecision level
COD reports are recorded manually
Uncertainty level of data low
PROJECT DESIGN DOCUMENT FORM (CDM-SSC-PDD) - Version 03
CDM ndash Executive Board
36
Maintenance and calibration as per manufacturer‟s specifications
or at least once every three (3) years for internal laboratory
equipment
Any comment
Data Parameter ID5 End-use of the final sludge
Data unit ndash
Description The final sludge generated by the project activity will be sent to control
landfill site if any
Source of data By project participant
Value of data ndash
Brief description of
measurement methods and
procedures to be applied
The final disposal of the sludge will be monitored during the crediting
period if any For each disposal of the sludge the following will be
recorded disposal site and date of disposal
QAQC procedures to be
applied (if any)
Any comment
Data Parameter ID6 FVflaredh
Data unit Nm3 hour
Description Volumetric flow of biogas recovered and flared at normal conditions in
the hour h
Source of data By project participant
Value of data 0
Brief description of
measurement methods and
procedures to be applied
The volume of biogas will be measured with a normalised flow meter or
calculated from the volumetric flow pressure temperature
Biogas volume and methane content measurements shall be on the same
basis (wet or dry)
QAQC procedures to be
applied (if any) The biogas flow is monitored continuously recorded and stored
electronically in a data log file (DLF) (monthly or at shorter
interval)
Data Parameter ID4 CODww dischargey
Data unit tCOD m3
Description COD of treated wastewater discharge into river by treatment system
Source of data Laboratory (internal and external)
Value of data ~ 0000100
Brief description of
measurement methods and
procedures to be applied
Measure of COD according to national or international standards
COD is measure through representative sampling
QAQC procedures to be
applied (if any) Minimum once a month COD sampling to ensure a 9010
confidenceprecision level
COD reports are recorded manually
Uncertainty level of data low
Maintenance and calibration as per manufacturer‟s specifications
or at least once every three (3) years for internal laboratory
equipment
Any comment
PROJECT DESIGN DOCUMENT FORM (CDM-SSC-PDD) - Version 03
CDM ndash Executive Board
37
Uncertainty level of data low
Maintenance and calibration as per manufacturer‟s specifications
or at least once every 3 years
Any comment
Data Parameter ID7 FVfuelledgas engineh
Data unit Nm3 hour
Description Volumetric flow of biogas recovered and fuelled (gas engine) at normal
conditions in the hour h
Source of data By project participant
Value of data ~ 509
Brief description of
measurement methods and
procedures to be applied
The volume of biogas will be measured with a normalised flow meter or
calculated from the volumetric flow of biogas pressure temperature
Biogas volume and methane content measurements shall be on the same
basis (wet or dry)
QAQC procedures to be
applied (if any) The biogas flow is monitored continuously recorded and stored
electronically in a data log file (DLF) (monthly or at shorter
interval)
Uncertainty level of data low
Maintenance and calibration as per manufacturer‟s specifications
or at least once every 3 years
Any comment
Data Parameter ID8 FVfuelledboilerh
Data unit Nm3 hour
Description Volumetric flow of biogas recovered and fuelled (boilers) at normal
conditions in the hour h
Source of data By project participant
Value of data ~ 0
Brief description of
measurement methods and
procedures to be applied
The volume of biogas will be measured with a normalised flow meter or
calculated from the volumetric flow of biogas pressure temperature
Biogas volume and methane content measurements shall be on the same
basis (wet or dry)
QAQC procedures to be
applied (if any) The biogas flow is monitored continuously recorded and stored
electronically in a data log file (DLF) (monthly or at shorter
interval)
Uncertainty level of data low
Maintenance and calibration as per manufacturer‟s specifications
or at least once every 3 years
Any comment
Data Parameter ID9 wCH4h
Data unit
Description Methane content in biogas in same basis (wetdry) as the biogas flows in
year y
Source of data By project participant using a gas analyzer
Value of data ~ 60
PROJECT DESIGN DOCUMENT FORM (CDM-SSC-PDD) - Version 03
CDM ndash Executive Board
38
Brief description of
measurement methods and
procedures to be applied
Using calibrated gas analyzer either continuous or periodical
measurement at confidenceprecision level of 9010
QAQC procedures to be
applied (if any) In case a continuous gas analyser is used data will be recorded
and stored electronically in a data log file (DLF) every hour or at
shorter interval
Uncertainty level of data low
Maintenance and calibration as per manufacturer‟s specifications
or at least once every 3 years
Any comment See also clarification by EB Meth Panel 30102009 ndash SSC_360
httpcdmunfcccintUserManagementFileStorageAM_CLAR_
QS83SX5B7WM6UGZE31JYQEQ4F65F6V
The biogas flow and the methane content measurements shall be
carried out close to each others
Data Parameter ID10 Tbiogas
Data unit ordmC
Description Temperature of biogas
Source of data Temperature probe
Value of data 20 ndash 65
Brief description of
measurement methods and
procedures to be applied
By project participant
QAQC procedures to be
applied (if any) Shall be measured and recorded at the same time when methane
content in biogas (ID8) is measured
Uncertainty level of data low
Maintenance and calibration as per manufacturer‟s specifications
or at least once every 3 years
Any comment Pressure and temperature are required to determine the density of
the methane If the biogas flow meter employed measures flow
pressure and temperature and displaysoutputs normalised flow of
biogas there is no need to separate monitoring of pressure and
temperature of the biogas
Data Parameter ID11 Pbiogas
Data unit Bar(g)
Description Pressure of biogas
Source of data By project participant
Value of data 50 ndash 200 mbar
Brief description of
measurement methods and
procedures to be applied
Pressure measurement device
QAQC procedures to be
applied (if any) Shall be measured and recorded at the same time when methane
content in biogas (ID8) is measured
Uncertainty level of data low
Maintenance and calibration as per manufacturer‟s specifications
or at least once every three (3) years
Any comment Pressure and temperature are required to determine the density of
the methane If the biogas flow meter employed measures flow
PROJECT DESIGN DOCUMENT FORM (CDM-SSC-PDD) - Version 03
CDM ndash Executive Board
39
pressure and temperature and displaysoutputs normalised flow of
biogas there is no need to separate monitoring of pressure and
temperature of the biogas
Shall be measured at the same time when methane content in
biogas (ID9) is measured
Parameter ID12 ηflareh (enclosed flare)
Unit
Description Enclosed flare efficiency in the hour h
Source of data Calculated
Value of data 0 or 50 or 90
Brief description of
measurement methods and
procedures to be applied
This yearly efficiency will be based on hourly flare efficiencies calculated
as per the provisions in the ldquoTool to determine project emissions from
flaring gases containing methanerdquo
The hourly flare efficiency will be calculated based on
0 if the temperature in the exhaust gas of the flare (Tflare) is
below 500 degC for more than 20 minutes during the hour h
50 if the temperature in the exhaust gas of the flare (Tflare) is
above 500 degC for more than 40 minutes during the hour h but the
manufacturer‟s specifications on proper operation of the flare are
not met at any point in time during the hour h
90 if the temperature in the exhaust gas of the flare (Tflare) is
above 500 degC for more than 40 minutes during the hour h and the
manufacturer‟s specifications on proper operation of the flare are
met continuously during the hour h
QAQC procedures to be
applied (if any) Data are logged hourly in a data log file (DLF)
Uncertainty level of data low
Any comment For enclosed flare
Or
Parameter ID13 ηflareh (open flare)
Unit
Description Flare efficiency in the hour h
Source of data Calculated
Value of data 0 or 50
Brief description of
measurement methods and
procedures to be applied
This yearly efficiency will be based on hourly flare efficiencies calculated
as per the provisions in the ldquoTool to determine project emissions from
flaring gases containing methanerdquo
The hourly flare efficiency will be calculated based on the duration of
time during which the flame is detected by the thermocouple (or flame
detector) installed in the open flare
Flare efficiency in hour h is based on default values
0 if the flame detected for not more than 20 minutes during the
hour h and
PROJECT DESIGN DOCUMENT FORM (CDM-SSC-PDD) - Version 03
CDM ndash Executive Board
40
50 if the flame detected for more than 20 minutes during the
hour h
A flame detector or thermocouple will be used
QAQC procedures to be
applied (if any) Data are logged hourly in a data log file (DLF)
Uncertainty level of data low
Any comment The only monitored parameter related to the flare is its efficiency Indeed
according to the clarification SSC_19927 of the methodology AMS IIIH
version 9 accepted by the SSC WG on the 3092008 ldquoIf a thermocouple
is used as a flame detection system it is sufficient to reach the given
minimum temperature from the manufacturer ldquo Hence it is not necessary
to monitor the temperature of the open type flares (Tflare)
Data Parameter ID14 ECPJjy
Data unit MWh
Description The yearly grid electricity consumption of the project activity for the year
bdquoy‟
Source of data Onsite instrument
Value of data ~749
Brief description of
measurement methods and
procedures to be applied
The grid electricity consumption of the project activity is measured
continuously with an energy meter (cumulative reading)
QAQC procedures to be
applied (if any) Data are monitored continuously and recorded periodically
(yearly or at shorter interval) in a data log file (DLF)
Uncertainty level of data low
Maintenance and calibration as per manufacturer‟s specifications
or at least once every three (3) years
Any comment
Data Parameter ID15 EGBLy
Data unit MWh
Description Quantity of net electricity generated and send to grid in year y
Source of data By project participant
Value of data ~ 6798
Brief description of
measurement methods and
procedures to be applied
The electricity generated and sent to grid is measured continuously with
an energy meter (cumulative readings)
QAQC procedures to be
applied (if any) Data are monitored continuously and recorded periodically
(yearly or at shorter interval) in a data log file (DLF)
Uncertainty level of data low
Maintenance and calibration as per manufacturer‟s specifications
or at least once every 3 years
Any comment As per AMS-ID
27 The clarification SSC_199 if available here (last access on the 24052011)
httpcdmunfcccintfilestorageAM_AM_CLAR_HIOZ5CS1PASC187C0JQ668L2E9RCRJResponse20WG20provided
20at20SSC20WG2017pdft=bU98MTMwNjIxNjY0OS4xMQ==|BOKHqtO94N6XF1N2N1vo8Ori-Rc=
PROJECT DESIGN DOCUMENT FORM (CDM-SSC-PDD) - Version 03
CDM ndash Executive Board
41
Or
Data Parameter ID16 EGmilly
Data unit MWh
Description Quantity of annual output of renewable energy sent to the mill in year y
Source of data By project participant
Value of data ~ 0
Brief description of
measurement methods and
procedures to be applied
The electricity generated and sent to mill to displace diesel use in diesel
gensets is measured continuously with an energy meter (cumulative
readings)
QAQC procedures to be
applied (if any) Data are monitored continuously and recorded periodically
(yearly or at shorter interval) in a data log file (DLF)
Uncertainty level of data low
Maintenance and calibration as per manufacturer‟s specifications
or at least once every 3 years
Any comment As per AMS-IA
Data Parameter ID17 Displacement of Biomass
Data unit Mt
Description Total amount of biomass (PKS) displaced from biomass boilers
Source of data Weighing bridge
Value of data Measurement at site
Brief description of
measurement methods and
procedures to be applied
Biomass (PKS) displaced due to the project activity will be weighed
using weighing bridge at the palm oil mill
QAQC procedures to be
applied (if any) Monthly calculation based on every single trip of trucks recorded
Data is recorded manually in a data log file based on the weighing
records
Maintenance and calibration as per manufacturer‟s specifications
Uncertainty level of data low
Any comment In the project activity the biomass (PKS) displaced will not be stored
under anaerobic conditions The conditions of onsite storage are identical
in the baseline as in the project activity The biomass will be sold to the
market on a regular basis PEbiomassy = 0
A final monitoring plan will be prepared prior the initial verification based on the as-built project activity
It will address the following aspects
MONITORING
The Project will be managed by CME with the involvement from Project Implementer CME will ensure
safety in operation of the plant as well as in the monitoring of emission reduction which is generated from
the project activity
CME will implement and be responsible for the monitoring plan Their responsibility covers operation of
the monitoring maintenance of the monitoring equipment data collection and archiving and
management of total scheme of the monitoring CME and Project Implementer will assign specific trained
PROJECT DESIGN DOCUMENT FORM (CDM-SSC-PDD) - Version 03
CDM ndash Executive Board
42
personnel during project implementation for the overall monitoring measurement and reporting of key
parameters as required in this PDD
DATA LOGGING AND STORAGE
The data measured by the instruments will be collected and stored in a data logging system The data will
be retrieved remotely by modem or directly on site
If data cannot be retrieved no emissions reductions will be claimed for the period of data failure The
data collected will be recorded in a central data base Access to production data will be restricted All
records and data (hard copy and soft copy) will be archived up to two years after the end of the crediting
period or the last issuance of CERs for this project activity whichever occurs later
CALIBRATION AND MAINTENANCE PROCEDURES MALFUNCTION OF EQUIPMENT
Maintenance includes all preventive and corrective actions necessary for the good functioning of the
equipment such as
Visual control of the equipment state and real-time check of displayed parameters
Cleaning up the equipment and the sensors
Adding lubricant
Replacement and change of defective parts
Calibration of equipment consists in verifying by comparison with a standard the accuracy of a
measuring instrument
Measuring instruments will be periodically and appropriately calibrated according to the procedures
timing and methods recommended by the manufacturer or nationalinternational standards as available
General malfunction of equipment
Daily inspections of the equipment will allow controlling equipment failure If equipment fails the
supplier will be notified and repairs will be carried out If the damaged equipment cannot be repaired it
will be replaced at the earliest In some cases portable tools will be used in order to carry out daily
monitoring of the missing parameter(s) In such case this data will be recorded manually
Discrepancies
To avoid discrepancies between projected data in the PDD and actual data (eg due to deferred starting
date malfunction of equipment) cross-checks between internal meter readings and external sources (eg
electricity invoices) will be carried out Any source of inconsistencies will be clarified
Case of emergency
For the case of emergency (earthquakes explosions fires etc) an emergency preparedness plan will be
adapted to the project activity All employees involved in the project on-site will be trained in the code of
conduct and required actions at time of commissioning of the plant
PROJECT DESIGN DOCUMENT FORM (CDM-SSC-PDD) - Version 03
CDM ndash Executive Board
43
OPERATIONAL AND MANAGEMENT STRUCTURE
The CDM monitoring team will be composed by the following staff
Position Report to
Operators
Project owner Supervisors (technicalmaintenance)
Operation Engineer
CDM monitoring project manager External CDM consultant
TRAINING OF MONITORING PERSONNEL
The maintenance will be conducted in-house by staff employed and trained by the Project Participants
Employees involved in the monitoring will be trained internally andor externally Training may include
inter alia
a) Review of equipment and captors
b) Calibration requirement
c) Configuration of monitoring equipment
d) Maintenance requirement
C1 Please indicate the level at which environmental analysis as per requirements of the CDM
modalities and procedures is undertaken Justify the choice of level at which the environmental
analysis is undertaken
radic Please tick if this information is provided at the PoA level In this case sections C2 and C3
need not be completed in this form
C2 Documentation on the analysis of the environmental impacts including transboundary
impacts
The host country does not require an analysis of environmental impacts As the project involves reduction
of GHG through recovery and controlled combustion which improves the quality of air therefore there
are no significant environmental impacts identified
C3 Please state whether an environmental impact assessment is required for a typical CPA
included in the programme of activities (PoA) in accordance with the host Party lawsregulations
In accordance with Malaysia environmental regulations Environmental Quality (Prescribed Activities
Environmental Impact Assessment) Order 1987 an Environmental Impact Assessment (EIA) is not
required for this CPA
PROJECT DESIGN DOCUMENT FORM (CDM-SSC-PDD) - Version 03
CDM ndash Executive Board
44
SECTION D Stakeholdersrsquo comments
D1 Please indicate the level at which local stakeholder comments are invited Justify the
choice
Please tick if this information is provided at the PoA level In this case sections D2 to D4 need
not be completed in this form
D2 Brief description how comments by local stakeholders have been invited and compiled
The stakeholder meeting was conducted at the office of Kilang Sawit Felda Triang on 05032012 There
were 37 stakeholders attending the consultation Posters were pasted at the guard house and at the
entrance to office 1 week before the stakeholder consultation to inform the locals stakeholders which
comprise mostly the workers of the mill 20 stakeholders out of the 37 who attended the consultation are
2nd generation of the Felda settlers who live in the vicinity to the project activity and adequately represent
the local community composed entirely of Felda settlers (no other people live in the vicinity of this
remote plantation) Continuous input of ideascomments were allowed to all stakeholders who could
either send their input though an email account especially setup for the biogas project or directly inform
the project proponents
During the meeting presentations were made by the project owner to outline the proposed project activity
in a non-technical manner (including environmental social and technological considerations) climate
change and the role of the CDM Attendees were given opportunity to raise their concern and opinion
about the proposed project activity during the question and answer session
D3 Summary of the comments received
PROJECT DESIGN DOCUMENT FORM (CDM-SSC-PDD) - Version 03
CDM ndash Executive Board
45
Below are the questions raised during the stakeholder meeting
NAME QUESTION
Mohd Tarmizi Bin Mat
Daud What is CDM in Bahasa Malaysia
Mohd Tarmizi Bin Mat
Daud What is DoE‟s standard for treated water released into river
Mohd Azizi Bin Abdul
Aziz
Would the biogas be captured from the existing effluent treatment ponds or a
new structure
Azhar Bin Abdul What to do with the captured biogas from the bioreactor
D4 Report on how due account was taken of any comments received
Below are the answers to the questions asked during the stakeholder meeting
QUESTION ANSWER
What is CDM in Bahasa Malaysia
The meaning of CDM in Bahasa Malaysia is Mekanisme
Pembangunan Bersih or in English is Clean Development
Mechanism
By Abd Karim Bin Mohd Zin
What is DoE‟s standard for treated
water released into river
The discharge standard for BOD into river is less than 100ppm
By Abd Karim Bin Mohd Zin
Would the biogas be captured from
the existing effluent treatment
ponds or a new structure
New bioreactor will be constructed to replace the existing anaerobic
lagoon treatment system The new bioreactor will capture the
biogas produced from this anaerobic treatment process
By Abd Karim Bin Mohd Zin
What to do with the captured
biogas from the bioreactor
The biogas recovered from the bioreactor will mainly contain
methane (approximately 60) and the rest are CO2 H2 and H2S
Currently the biogas is just released to the atmosphere from the
existing open lagoons system During the project activity captured
biogas will be combusted thus will improve the air quality
By Abd Karim Bin Mohd Zin
PROJECT DESIGN DOCUMENT FORM (CDM-SSC-PDD) - Version 03
CDM ndash Executive Board
46
Annex 1
CONTACT INFORMATION ON ENTITYINDIVIDUAL RESPONSIBLE FOR THE SMALL-
SCALE CPA
Organization Felda Palm Industries Sdn Bhd (359584-V)
StreetPOBox Jalan Gurney 1
Building Balai Felda 4th Floor
City Kuala Lumpur
StateRegion Wilayah Persekutuan
PostfixZIP 54000
Country Malaysia
Telephone (03) 2692 8066
FAX (03) 2693 4148
URL wwwfeldanetmy
Represented by
Title Head of Department
Salutation Mr
Last Name Busu
Middle Name
First Name Zainuri
Department Biomass
Mobile
Direct FAX
Direct tel
Personal E-Mail zainuribfeldanetmy
Organization Ably Carbon Sdn Bhd
StreetPOBox Jalan Ipoh Kecil
Building No 17
City Kuala Lumpur
StateRegion
PostfixZIP 50350
Country Malaysia
Telephone +60 3 4042 1177
FAX +60 3 4044 4166
E-Mail stephanevidailletably-carboncom
URL
Represented by Stephane Vidaillet
Title Chairman
Salutation Mr
Last Name Vidaillet
Middle Name
First Name Steacutephane
Department
Mobile +33 6 59111 5600
Direct FAX
PROJECT DESIGN DOCUMENT FORM (CDM-SSC-PDD) - Version 03
CDM ndash Executive Board
47
Direct tel
Personal E-Mail stephanevidailletably-carboncom
PROJECT DESIGN DOCUMENT FORM (CDM-SSC-PDD) - Version 03
CDM ndash Executive Board
48
Annex 2
INFORMATION REGARDING PUBLIC FUNDING
The project activity is not receiving any funding from parties included in Annex 1 of the Kyoto Protocol
SMALL-SCALE CDM PROGRAMME ACTIVITY DESIGN DOCUMENT FORM (CDM-SSC-CPA-DD) - Version 01
NAME TITLE OF THE PoA Biogas Recovery and Utilization PoA Projects in
Malaysia
CDM ndash Executive Board page 49
This template shall not be altered It shall be completed without modifyingadding headings or logo format or font
Annex 3
BASELINE INFORMATION
1 2
Year 2009 2010 2011 2012 2013 2014
FFB (mtyr) 343720 345910 310250 333293 333293 333293
POME Volume
(cumyr)[1] 343720 345910 310250 333293 333293 333293
Mill Opearing hour (hryr) 68865 69225 6209 6673 6673 6673
PKS (mtyr) 18905 19025 17064 18331 18331 18331
3 4 5 6 7 8 9 10
2015 2016 2017 2018 2019 2020 2021 2022
333293 333293 333293 333293 333293 333293 333293 333293
333293 333293 333293 333293 333293 333293 333293 333293
6673 6673 6673 6673 6673 6673 6673 6673
18331 18331 18331 18331 18331 18331 18331 18331
SMALL-SCALE CDM PROGRAMME ACTIVITY DESIGN DOCUMENT FORM (CDM-SSC-CPA-DD) - Version 01
NAME TITLE OF THE PoA Biogas Recovery and Utilization PoA Projects in
Malaysia
CDM ndash Executive Board page 50
This template shall not be altered It shall be completed without modifyingadding headings or logo format or font
10 days measurement campaign for baseline wastewater treatment system
Day Date
ETP
Inlet
Anaerobic
system (mgl)
Outlet
Anaerobic
system (mgl)
Outlet Algae
System (mgl)
Final
Discharge to
River (mgl)
1 23-Feb-12 35693 3120 811 603
2 25-Feb-12 19511 2559 1186 83
3 26-Feb-12 32864 2767 749 437
4 27-Feb-12 30195 2330 1210 404
5 28-Feb-12 32436 1927 1188 941
6 29-Feb-12 38259 4256 896 717
7 1-Mar-12 28717 3584 1232 695
8 3-Mar-12 31002 4660 1658 1210
9 4-Mar-12 22400 4346 1389 963
10 5-Mar-12 31226 4301 1971 1165
Average 30230 3385 1229 722
ETP
COD removal efficiency (anaerobic system) 8880
COD removal efficiency (Facultativealgae system) 6369
COD removal efficiency (Bio-polishing system) 4127
Total COD removal efficiency of the treatment system 9761
The COD of the raw effluent during ex-post may vary from the one year historical records depending on
the improvement of the production process (outside of project boundary) thus ERex-post may vary from the
estimated ERex-ante
SMALL-SCALE CDM PROGRAMME ACTIVITY DESIGN DOCUMENT FORM (CDM-SSC-CPA-DD) - Version 01
NAME TITLE OF THE PoA Biogas Recovery and Utilization PoA Projects in
Malaysia
CDM ndash Executive Board page 51
This template shall not be altered It shall be completed without modifyingadding headings or logo format or font
Annex 4
MONITORING INFORMATION
General information
Monitoring refers to the collection and archiving of all relevant data necessary for determining the
baseline measuring anthropogenic emissions by sources of greenhouse gases (GHG) within the project
boundary of a CDM project activity and leakage It includes developing suitable data collection methods
and data interpretation techniques for monitoring and verification of GHG emissions
On-line monitoring system
Most key meters required to determine GHG emissions and emission reductions will be monitored from a
central control point which will record meter readings at a pre-determined interval
Ensuring adequate maintenance and calibration of monitoring instruments
Specific maintenance repair or replacement of monitoring equipment will be recorded dated and
described
The calibration will occur at intervals determined on the basis of instrument manufacturers
recommendations stability purpose usage and history of repeatability Recalibration should be
performed whenever an event occurs that places the accuracy of the instrument in doubt
Calibration will take place at least once every three (3) years to ensure that the monitoring
equipments are properly installed and functioning properly
Calibration will be performed according to national or international standards
Last calibration certificates will be provided during periodic verification
Sampling procedure
Wherever a statistical sample is used for monitoring the ldquogeneral guidelines for sampling and surveys for
SSC project activitiesrdquo shall be used COD shall be measured from a composite sample to obtain a
representative value
Data archiving
The monitored data will be kept for a minimum of 2 years after the end of the crediting years by using
paper documents or electronic files
Identification of non-conformities
A verification of inconsistencies of the data recorded will be performed based for example on
The comparison of the calculated quantities of methane versus expected
Spot checks of field instruments (local reading) and data in the log file
Any discrepancies (completeness calculation errors transcription errors instrument calibration issues)
will be analyzed and actions taken to correct the problem
Ensuring adequate training of staff
All new staff members will undergo bdquoon job training‟ covering the monitoring requirements
The monitoring plan will be made available to staff member involved in the monitoring
A copy will be located in the control room at the site
SMALL-SCALE CDM PROGRAMME ACTIVITY DESIGN DOCUMENT FORM (CDM-SSC-CPA-DD) - Version 01
NAME TITLE OF THE PoA Biogas Recovery and Utilization PoA Projects in
Malaysia
CDM ndash Executive Board page 52
This template shall not be altered It shall be completed without modifyingadding headings or logo format or font
During the training the employees will sign a training attendance list All training records shall
be documented inclusive of training attendance training memo and training material if any
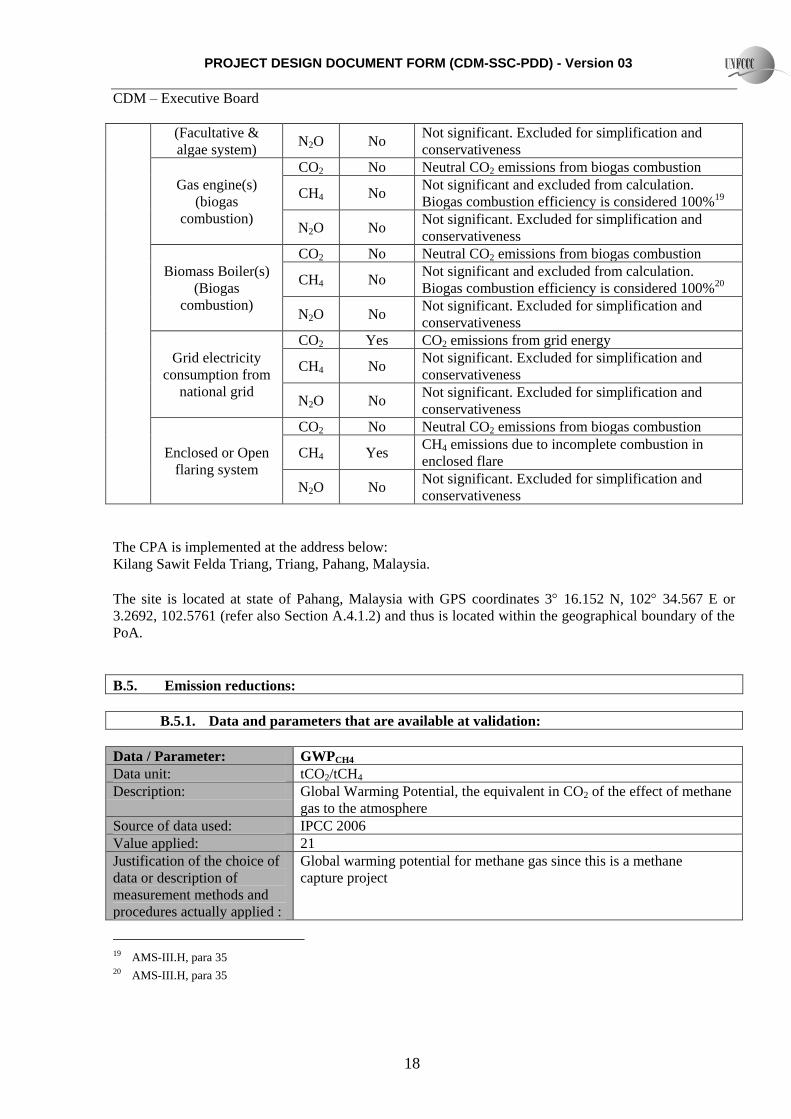
PROJECT DESIGN DOCUMENT FORM (CDM-SSC-PDD) - Version 03
CDM ndash Executive Board
20
Data Parameter UFBL
Data unit -
Description Model correction factor to account for model uncertainties (baseline)
Source of data used AMS IIIH version 16
Value applied 089
Justification of the choice of
data or description of
measurement methods and
procedures actually applied
As per methodology AMS-IIIH point 24
Any comment -
Data Parameter UFPJ
Data unit -
Description Model correction factor to account for model uncertainties (project
activity)
Source of data used AMS IIIH version 16
Value applied 112
Justification of the choice of
data or description of
measurement methods and
procedures actually applied
As per methodology AMS-IIIH point 30(a)
Any comment -
Data Parameter CFEww
Data unit Fraction
Description Capture efficiency of the biogas recovery equipment in the wastewater
treatment system
Source of data used AMS IIIH version 16
Value applied 09
Justification of the choice of
data or description of
measurement methods and
procedures actually applied
A default value of 09 has been used as per the guidance in the
methodology
Any comment
Data Parameter MCF ww treatmentPJ1
Data unit Fraction
Description Methane correction factor for the project wastewater anaerobic treatment
system equipped with biogas recovery equipment
Source of data used Table IIIH1 AMS IIIH version 16
Value applied 08
Justification of the choice of
data or description of
measurement methods and
procedures actually applied
The lagoons depth are more than 2 m MCF values in table IIIH1 has
been used as per the guidance in the methodology (depth gt 2 m)
Any comment
Data Parameter MCF ww treatmentPJ2
PROJECT DESIGN DOCUMENT FORM (CDM-SSC-PDD) - Version 03
CDM ndash Executive Board
21
Data unit Fraction
Description Methane correction factor for the project wastewater aerobic treatment
system not equipped with biogas recovery equipment
Source of data used Table IIIH1 AMS IIIH version 16
Value applied 03
Justification of the choice of
data or description of
measurement methods and
procedures actually applied
Aerobic treatment poorly managed
Any comment
Data Parameter MCFwwPJdischarge
Data unit Fraction
Description Methane correction factor based on discharge pathway in the project
activity
Source of data used Table IIIH1 AMS IIIH version 16
Value applied 01
Justification of the choice of
data or description of
measurement methods and
procedures actually applied
Table IIIH1 for project emission The final discharge of treated effluent
into river MCF value of 01 for river discharge
Any comment Same discharge pathway as in the baseline
Data Parameter CODBL1
Data unit
Description COD removal efficiency of the baseline system (anaerobic treatment
system)
Source of data used 10 days measurement campaign
Value applied Anaerobic Treatment system 8880
Justification of the choice of
data or description of
measurement methods and
procedures actually applied
One year historical data not available
Any comment This data will be used for ex post emission reduction calculation
Data Parameter CODBL2
Data unit
Description COD removal efficiency of the baseline system (aerobic treatment
system)
Source of data used 10 days measurement campaign
Value applied Aerobic Treatment system 6369
Justification of the choice of
data or description of
measurement methods and
procedures actually applied
One year historical data not available
Any comment This data will be used for ex post emission reduction calculation
Data Parameter NCVCH4
Data unit MJkg
PROJECT DESIGN DOCUMENT FORM (CDM-SSC-PDD) - Version 03
CDM ndash Executive Board
22
Description Net Calorific Value of methane
Source of data used IPCC 2006 Default Value
Value applied 504
Justification of the choice of
data or description of
measurement methods and
procedures actually applied
IPCC 2006 value is used Volume 2 Chapter 1 Table 12
Any comment
Data Parameter NCVFF
Data unit MJkg
Description Net Calorific Value of diesel
Source of data used IPCC 2006 Default Value
Value applied 430
Justification of the choice of
data or description of
measurement methods and
procedures actually applied
IPCC 2006 value is used Volume 2 Chapter 1 Table 12
Any comment
Data Parameter EFCO2diesel
Data unit tCO2MWh
Description CO2 emission factor diesel genset
Source of data used AMS-IA version 14 point 14
Value applied 08
Justification of the choice of
data or description of
measurement methods and
procedures actually applied
Default value for diesel generation unit
Any comment
Data Parameter Grid Emission Factor
Data unit kgCO2ekWh
Description Emission factor for grid electricity in Peninsular Malaysia
Source of data used Pusat Tenaga Malaysia March 2010
Value applied 0672
Justification of the choice of
data or description of
measurement methods and
procedures actually applied
As per AMS-ID point 12
Any comment Study on Grid Connected Electricity Baselines in Malaysia 2008
B52 Ex-ante calculation of emission reductions
The ex ante emission reductions are calculated based on AMS-IIIH version 16 as per equations
explained in section E62 of PoA-DD Biogas PoA in Malaysia
PROJECT DESIGN DOCUMENT FORM (CDM-SSC-PDD) - Version 03
CDM ndash Executive Board
23
Calculation for AMS-IIIH
Baseline emissions
Source of baseline emissions Reference Applicable
(YN)
Comments
Wastewater and sludge treatment
systems equipped with a biogas
recovery facility shall be excluded
from the baseline
AMS-IIIH
Point 17
N No biogas recovery in the
baseline
Emissions on account of electricity or
fossil fuel used (BEpowery)
AMS-IIIH
Point 18 (i)
N For conservativeness no
emissions due to electricity or
fossil fuel will be claimed
BEpowery = 0
Methane emissions from baseline
wastewater treatment systems
(BEwwtreatmenty)
AMS-IIIH
Point 18 (ii)
Y Baseline includes anaerobic and
aerobic treatment conditions with
different MCF values selected as
per Table IIIH1
Methane emissions from baseline
sludge treatment systems (BEstreatmenty)
= 0
AMS-IIIH
Point 18 (iii)
N The baseline plant corresponds to
scenario Para 1(f) without sludge
treatment BEstreatmenty = 0
Methane emissions on account of
inefficiencies in the baseline
wastewater treatment systems and
presence of degradable organic carbon
in the treated wastewater discharged
into river (BEwwdischargey)
AMS-IIIH
Point 18 (iv)
Y Treated effluent is currently
discharged into the river
Methane emissions from the decay of
the final sludge generated by the
baseline treatment systems (BEsfinaly)
AMS-IIIH
Point 18 (v)
N Zero because in the baseline final
sludge used for soil application
BEsfinaly = 0
A) Calculation of baseline emissions
BEy = BEwwtreatmenty + BEwwdischargey
Abbreviation Description Value Source
BEy Baseline emissions in year y (tCO2e) 30762 Calculated
BEpowery Baseline emissions of diesel genset in year
y tCO2eyear 0 Calculated
BEwwtreatmenty Baseline emissions of the wastewater
treatment systems tCO2eyear 30663 Equation 2
BEwwdischargey
The methane emissions from degradable
organic carbon in treated wastewater
discharged tCO2eyear
100 Equation 6
A1) Baseline emissions
PROJECT DESIGN DOCUMENT FORM (CDM-SSC-PDD) - Version 03
CDM ndash Executive Board
24
Equation 2 BEwwtreatmenty = Qwwy (CODinflow1 y CODBL1 MCFwwtreatmentBL1) +
(CODinflow2y CODBL2 MCFwwtreatmentBL2) Boww UFBL GWPCH4
Abbreviation Description Value Source
BEwwtreatmenty Baseline emissions of the wastewater
treatment systems (tCO2eyear) 30663 Calculated
Qwwy Volume of wastewater treated in baseline
wastewater treatment system i in year y
(m3year)
333293
Volume based on 10 m3mt
FFB21 amp FFB historical data
(2009 ndash 2011)
CODinflow1y Chemical oxygen demand of the
wastewater inflow to the baseline treatment
system (anaerobic) in year y (tCOD m3)
0026905 10 days measurement
campaign
CODBL1 COD removal efficiency of the baseline
treatment system (anaerobic) () 8880
10 days measurement
campaign
CODinflow2y Chemical oxygen demand of the
wastewater inflow to the baseline treatment
system (aerobic) in year y (tCOD m3)
0003013 10 days measurement
campaign
CODBL2 COD removal efficiency of the baseline
treatment system (aerobic) () 6369
10 days measurement
campaign
MCFwwtreatmentBL 1 Methane correction factor for baseline
wastewater anaerobic treatment systems 08
MCF values as per table
IIIH1 anaerobic gt 2m
MCFwwtreatmentBL2 Methane correction factor for baseline
wastewater aerobic treatment systems 03
MCF values as per table
IIIH1 ndash poorly managed
Boww Methane producing capacity of the
wastewater (kg CH4kg COD) 025
IPCC 2006
UFBL Model correction factor to account for
model uncertainties 089
IPCC 2006
GWPCH4 Global Warming Potential for methane 21 IPCC 2006
A2) The methane emissions from degradable organic carbon in treated wastewater discharged
Equation 6 BEwwdischargey = Qwwy GWPCH4 Boww UFBL CODwwdischarge BLyMCFww BLdischarge
Abbreviation Description Value Source
BEwwdischargey
The methane emissions from degradable
organic carbon in treated wastewater
discharged (tCO2eyear)
100 Calculated
Qwwy Volume of treated wastewater discharged
in year y (m3year) 333293
Volume based on 10 m3mt
FFB22 amp FFB historical data
(2009 ndash 2011)
GWPCH4 Global warming potential of methane 21 IPCC 2006
Boww Methane producing capacity of the treated
wastewater (kgCH4 kgCOD) 025 IPCC 2006
21 Mill designed data for baseline effluent treatment plant 22 Mill designed data for baseline effluent treatment plant
PROJECT DESIGN DOCUMENT FORM (CDM-SSC-PDD) - Version 03
CDM ndash Executive Board
25
UFBL Model correction factor to account for
model uncertainties 089 IPCC 2006
CODwwdischarge BLy Chemical oxygen demand of the treated
wastewater discharged into sea river or
lake in the baseline situation in the year y
(tonnesm3)
0000642 10 days measurement
campaign
MCFwwBLdischarge Methane correction factor based on
discharge pathway in the baseline situation
(eg into sea river or lake) of the
wastewater (fraction)
01 MCF values as per table
IIIH1 version 16
Project activity emissions
The project activity emission sources as per the methodology and their relevance with respect to the
proposed CDM project activity are given below in a tabular format
Source of project activity
emission Reference
Applicable
(YN) Comments
CO2 emissions on account of
power and fossil fuel used by
the project activity facilities
(PEpowery)
AMS-IIIH
point 29(i)
Y The project activity uses the electricity
imported from the national grid
Methane emissions from
wastewater treatment systems
affected by the project
activity and not equipped with
biogas recovery in the project
situation (PEwwtreatmenty)
AMS-IIIH
point 29 (ii)
Y CH4 emissions from the poorly managed
aerobic lagoons
Methane emissions from
sludge treatment systems
affected by the project
activity and not equipped with
biogas recovery in the project
situation (PEstreatmenty)
AMS-IIIH
point 29 (iii)
N The project activity corresponds to
scenario (vi) without sludge treatment
PEystreatmenty = 0
Methane emissions on account
of inefficiency of the project
activity wastewater treatment
systems and presence of
degradable organic carbon in
treated wastewater
(PEwwdischargey)
AMS-IIIH
point 29 (iv)
Y Treated effluent from ETP will be
discharged into river
Methane emissions from the
decay of the final sludge
generated by the project
activity treatment systems
(PEsfinaly)
AMS-IIIH
point 29 (v)
N In the proposed CDM project activity
final sludge is used for soil application in
the same manner as in the baseline
PEsfinaly = 0
PROJECT DESIGN DOCUMENT FORM (CDM-SSC-PDD) - Version 03
CDM ndash Executive Board
26
Methane fugitive emissions on
account of inefficiencies in
capture systems (PEfugitivey)
AMS-IIIH
point 29 (vi)
Y Applicable to PEfugitivewwy
N The project activity corresponds to
scenario (vi) without sludge treatment
PEfugitivesy = 0
Methane emissions due to
incomplete flaring (PEflaringy)
AMS-IIIH
point 29 (vii)
Y Enclosed flaring system installed
Methane emissions from
biomass stored under
anaerobic conditions which
does not take place in the
baseline situation (PEbiomassy)
AMS-IIIH
point 29
(viii)
N In the project activity the biomass (PKS
+ mesocarp fibres) displaced will not be
stored under anaerobic conditions The
conditions of onsite storage are identical
in the baseline as in the project activity
The biomass will be sold to the market
on a regular basis PEbiomassy = 0
B) Calculation of project emissions
PEy = PEpowery + PEwwtreatmenty + PEww discharge y + PEfugitive y + PEflaring y
Abbreviation Description Value Source
PEy Project activity emissions in the year y
(tCO2eyr) 6050 Equation 8
PEpowery CO2 emissions on account of power used
by the project activity facilities (tCO2eyr) 604 -
PEwwtreatmenty Methane emissions from wastewater
treatment systems affected by the project
activity and not equipped with biogas
recovery in year y (tCO2eyr)
1523 Equation 9
PEwwdischargey
Methane emissions on account of
inefficiency of the project activity
wastewater treatment systems and presence
of degradable organic carbon in treated
wastewater (tCO2eyr)
126 Equation 12
PEfugitivey Methane fugitive emissions on account of
inefficiencies in capture systems (tCO2eyr) 3796 Equation 15
PEflaringy Methane emissions due to incomplete
flaring (tCO2eyr) 0 Equation 19
B1) Project emissions from CO2 emissions on account of power and fuel used by the project activity
facilities in year ldquoyrdquo in tCO2eyear
PEpowery = ECPJjy EFgridy
Abbreviation Description Value Source
PEpowery Project emissions from electricity
consumption in the year y (tCO2eyr) 604 Calculated
ECPJjy Internal power consumption from the grid 749 100 kW is the effective
PROJECT DESIGN DOCUMENT FORM (CDM-SSC-PDD) - Version 03
CDM ndash Executive Board
27
(MWh year) power based on the
equipments installed at the
site
EFgridy Grid Emission factor in Peninsular
Malaysia 2008 (tCO2 MWh) 0672
Study on Grid Connected
Electricity Baselines in
Malaysia 2008 published in
2010 by PTM
B2) Methane emissions from wastewater treatment systems affected by the project activity and not
equipped with biogas recovery in the project situation in year ldquoyrdquo in tCO2e
Equation 9 PEwwtreatment y = Qwwky CODinflowk y PJky MCFwwtreatmentPJk) Boww UFPJ GWPCH4
Abbreviation Description Value Source
PEwwtreatmenty
Methane emissions from wastewater
treatment systems affected by the project
activity and not equipped with biogas
recovery in the project situation (tCO2eyr)
1523 Calculated
Qwwky Volume of wastewater treated in project
activity wastewater treatment system k in
year y (m3year)
333293
Volume based on 10 m3mt
FFB23 amp FFB historical data
(2009 ndash 2011)
CODinflowky Chemical oxygen demand of the
wastewater inflow to the project activity
treatment system k in year y (tonnes COD
m3)
0002690 10 days measurement
campaign
PJky Chemical oxygen demand removal
efficiency of the project wastewater
treatment system k in year y (tm3)
measured based on inflow COD and
outflow COD in system k
90 Based on bio-digester COD
removal efficiency of 90
MCFwwtreatmentPJk Methane correction factor for project
wastewater treatment system k (MCF
values as per table IIIH1)
03
MCF values table IIIH1
Version 16 ndash aerobic poorly
managed (conservative)
Boww Methane generation capacity of the treated
wastewater (kg CH4kg COD) 025 IPCC 2006
UFPJ Model correction factor to account for
model uncertainties 112
IPCC 2006
GWPCH4 Global warming potential of methane 21 IPCC 2006
23 Mill designed data for baseline effluent treatment plant
PROJECT DESIGN DOCUMENT FORM (CDM-SSC-PDD) - Version 03
CDM ndash Executive Board
28
B3) Methane emissions on account of inefficiency of the project activity wastewater treatment
systems and presence of degradable organic carbon in treated wastewater in the year ldquoyrdquo (tonnes)
Equation 12 PEwwdischarge y = Qwwy GWPCH4 Boww UFPJ CODwwdischargePJy MCFwwPJdischarge
Abbreviation Description Value Source
PEwwdischargey
Methane emissions from degradable
organic carbon in treated wastewater
(tCO2eyr)
126 Calculated
Qwwy Quantity of wastewater treated in year y
(m3year) 333293
Volume based on 10 m3mt
FFB24 amp FFB historical data
(2009 ndash 2011)
CODwwdischargedPJ
y
Chemical oxygen demand of the treated
wastewater discharged into river in the
project situation in year y (tCOD m3)
0000642 10 days measurement
campaign
MCFwwPJ discharge
Methane correction factor based on
discharge pathway in the project situation
(river) of the wastewater (fraction)
01 MCF values as per table
IIIH1 Version 16
Boww Methane generation capacity of the treated
wastewater (kg CH4kg COD) 025 IPCC 2006
UFPJ Model correction factor to account for
model uncertainties 112 IPCC 2006
GWPCH4 Global warming potential of methane 21 IPCC 2006
B41) Methane fugitive emissions on account of inefficiencies in capture systems in the year ldquoyrdquo
(tonnes)
Equation 15 PEfugitivewwy = (1 ndash CFEww ) MEPywwtreatment GWPCH4
Abbreviation Description Value Source
PEfugitivey Methane fugitive emissions on account of
inefficiencies in capture systems (tCO2eyr) 3796 Calculated
CFEww Capture efficiency of the biogas recovery
equipment in the wastewater treatment
systems
09 AMS IIIH Version 16
MEPywwtreatment Methane emission potential of wastewater
treatment systems equipped with biogas
recovery system in year y (tCH4yr)
1808 Refer Equation 11 of AMS
IIIH version 16
GWPCH4 Global warming potential of methane 21 IPCC 2006
B42) Methane emission potential of wastewater treatment plant in the year ldquoyrdquo (tonnes)
Equation 16 MEPwwtreatmenty = Qwwy Boww UFPJ (CODremovedPJky MCFwwtreatmentPJk)
24 Mill designed data for baseline effluent treatment plant
PROJECT DESIGN DOCUMENT FORM (CDM-SSC-PDD) - Version 03
CDM ndash Executive Board
29
Abbreviation Description Value Source
MEPwwtreatmenty Methane emission potential of wastewater
treatment systems equipped with biogas
recovery system in year y (tonnes CH4yr)
1808 Calculated
Qyww Quantity of wastewater treated in year y
(m3year) 333293
Volume based on 10 m3mt
FFB25 amp FFB historical data
(2009 ndash 2011)
Boww Methane generation capacity of the treated
wastewater (kg CH4kg COD) 025 IPCC 2006
CODremovedPJy
The chemical oxygen demand removed by
the treatment anaerobic system of the
project activity equipped with biogas
recovery in the year y (tCOD m3)
0024214
10 days measurement
campaign amp bio-digester
design parameter
MCFwwtreatmentPJ
Methane correction factor for the project
wastewater treatment system k equipped
with biogas recovery equipment
08 MCF values as per table
IIIH1 Version 16
UFPJ Model correction factor to account for
model uncertainties 112 IPCC 2006
B5) Methane emissions due to incomplete flaring in the year ldquoyrdquo (tonnes)
Equation 13a PEflaringy = TMflaredy (1 - ηflarey) GWPCH4
Abbreviation Description Value Source
PEflaringy Methane emissions due to incomplete
flaring (tCO2eyr) 0 Calculated
TMflaredh Mass flow rate of methane flared in dry
basis in the hour h (tCH4 yr) 0 Calculated
ηflarey Flare efficiency in hour h based on default
values 50
Tools for methane flaring
(open flare) for conservative
GWPCH4 Global warming potential of methane 21 IPCC 2006
Leakage emissions
No leakage emission will occur in the project activity
LEy1 = 0
Emission reductions
Equation 22 ERy ex ante = BEy ex ante ndash (PEy ex ante + LEy ex ante)
25 Mill designed data for baseline effluent treatment plant
PROJECT DESIGN DOCUMENT FORM (CDM-SSC-PDD) - Version 03
CDM ndash Executive Board
30
Abbreviation Description Value Source
ERy1 ex ante Ex ante emission reduction in year y
(tCO2e) 24712 Equation 22
BEy1 ex ante Ex ante baseline emissions in year y
(tCO2e) 30762 Equation 1
PEy1 ex ante Ex ante project emissions in year y (tCO2e) 6050 Equation 8
LEy1 ex ante Ex ante Leakage emissions in year y
(tCO2e) 0 -
Calculation for AMS-ID
Baseline emissions
Electricity generated from biogas engines will be exported to the Peninsular Malaysia National Grid The
baseline emissions are described in AMS-ID (Version 17 EB 61) as the ldquoproduct of electrical energy
baseline expressed in kWh of electricity produced by the renewable energy generating unit multiplied by
an emission factorrdquo
Baseline emissions due to electricity exported to the grid in the year ldquoyrdquo (tonnes)
BEEGy = EGBLy EFCO2gridy
Abbreviation Description Value Source
BEEGy Baseline emissions in year y (tCO2eyr) 4568 Calculated
EGBLy
Quantity of net electricity supplied to the
grid as a result of the implementation of the
project activity in year y (kWh yr)
6797625 Calculated
EFCO2gridy
CO2 emission factor of the grid in year
(tCO2kWh) 0672
Study on Grid Connected
Electricity Baselines in
Malaysia 2008 published in
2010 by PTM
Project Activity Emissions
As per AMS-ID (Version 17 EB 61) project emissions for renewable energy project activities are zero
PEEGy = 0
Leakage
If the energy generating equipment is transferred from another activity leakage is to be considered
No leakage emission will occur in the project activity LEy = 0
PROJECT DESIGN DOCUMENT FORM (CDM-SSC-PDD) - Version 03
CDM ndash Executive Board
31
Emission reductions
ERy = BEy ndash PEy - LEy
Abbreviation Description Value Source
ERy Emission reduction in year y (tCO2ey) 4568 -
BEy Baseline emissions in year y (tCO2ey) 4568 -
PEy Project emissions in year y (tCO2ey) 0 -
LEy Leakage emissions in year y (tCO2ey) 0 -
Calculation for AMS-IA
Baseline emissions
The energy baseline is the fuel consumption of the technology in use or that would have been used in the
absence of the project activity to generate the equivalent quantity of energy Option 2 is applied This
methodology is only apply shall the recovered is in excess after export to the grid
Annual electricity sent to the mill for FF displacement in the year ldquoyrdquo (kWh)
EBLy = ΣEGiy (1 ndash l)
Abbreviation Description Value Source
EBLy Annual energy baseline (kWhyr) Calculated
EGiy
The estimated annual output of the
renewable energy technologies of the group
of i renewable energy technologies
installed (kWhyr)
0 Estimated
l
Average technical distribution losses that
would have been observed in diesel
powered mini-grids installed by public
programmes or distribution companies in
isolated areas expressed as a fraction
0 Conservative by applying
Zero (0)
Baseline electricity sent to the mill for FF displacement in the year ldquoyrdquo (tonnes)
BECO2y = EBLy EFCO2
Abbreviation Description Value Source
BECO2y Baseline emission in the year y (tCO2yr) 0 Calculated
EBLy Annual energy baseline (kWhyr) 0 Calculated
EFCO2 CO2 emission factor (tCO2kWh) 08
Default value which is
derived from diesel
generation units is used
PROJECT DESIGN DOCUMENT FORM (CDM-SSC-PDD) - Version 03
CDM ndash Executive Board
32
Project Activity Emissions
As per AMS-IA (Version 14 EB 54) project emissions for renewable energy project activities are zero
PEy = 0
Leakage
If the energy generating equipment is transferred from another activity or if the existing equipment is
transferred to another activity leakage is to be considered
No leakage emission will occur in the project activity LEy = 0
B53 Summary of the ex-ante estimation of emission reductions
Estimated emission reductions (total project activity)
Year
Estimation of
project activity
emissions (tCO2e)
Estimation of
baseline emissions
(tCO2e)
Estimation of
leakage (tCO2e)
Estimation of
overall emission
reductions (tCO2e)
2012 504 2944 0 2440
2013 6050 35330 0 29280
2014 6050 35330 0 29280
2015 6050 35330 0 29280
2016 6050 35330 0 29280
2017 6050 35330 0 29280
2018 6050 35330 0 29280
2019 5546 32386 0 26840
Total (tCO2) 42350 247310 0 204960
The starting date of the crediting period is 01122012 or the date of registration whichever is later
Estimated emission reductions for AMS-IIIH
Year
Estimation of
project activity
emissions (tCO2e)
Estimation of
baseline emissions
(tCO2e)
Estimation of
leakage (tCO2e)
Estimation of
overall emission
reductions (tCO2e)
2012 504 2563 0 2059
2013 6050 30762 0 24712
PROJECT DESIGN DOCUMENT FORM (CDM-SSC-PDD) - Version 03
CDM ndash Executive Board
33
2014 6050 30762 0 24712
2015 6050 30762 0 24712
2016 6050 30762 0 24712
2017 6050 30762 0 24712
2018 6050 30762 0 24712
2019 5546 28199 0 22653
Total (tCO2) 42350 215334 0 172984
The starting date of the crediting period is 01122012 or the date of registration whichever is later
Estimated emission reductions for AMS-ID
Year
Estimation of
project activity
emissions (tCO2e)
Estimation of
baseline emissions
(tCO2e)
Estimation of
leakage (tCO2e)
Estimation of
overall emission
reductions (tCO2e)
2012 0 381 0 381
2013 0 4568 0 4568
2014 0 4568 0 4568
2015 0 4568 0 4568
2016 0 4568 0 4568
2017 0 4568 0 4568
2018 0 4568 0 4568
2019 0 4187 0 4187
Total (tCO2) 0 31976 0 31976
The starting date of the crediting period is 01122012 or the date of registration whichever is later
Estimated emission reductions for AMS-IA
Year
Estimation of
project activity
emissions (tCO2e)
Estimation of
baseline emissions
(tCO2e)
Estimation of
leakage (tCO2e)
Estimation of
overall emission
reductions (tCO2e)
2012 0 0 0 0
2013 0 0 0 0
2014 0 0 0 0
2015 0 0 0 0
2016 0 0 0 0
PROJECT DESIGN DOCUMENT FORM (CDM-SSC-PDD) - Version 03
CDM ndash Executive Board
34
2017 0 0 0 0
2018 0 0 0 0
2019 0 0 0 0
Total (tCO2) 0 0 0 0
The starting date of the crediting period is 01122012 or the date of registration whichever is later
B6 Application of the monitoring methodology and description of the monitoring plan
B61 Description of the monitoring plan
The parameters to be monitored are
Please note that the amount of methane recovered and fuelled or flared (MDy ) is calculated as follows
MDy = TMfuelledy + TMflaredy Equation A
Where Description Units
MDy Quantity of methane recovered and fuelled or flared in the year y tonnes CH4year
TMfuelledy Quantity of methane fuelled in the year y tonnes CH4year
TMflaredy Quantity of methane flared in year y tonnes CH4year
Where
TMfuelledy = FVfuelledh fvCH4h ηfuelledh ρCH4n) 1000 Equation B
Where Description Units
TMfuelledy Quantity of methane fuelled in the year y tonnes CH4year
FVfuelledh Volumetric flow rate of the fuelled biogas gas at normal conditions in
hour h
Nm3 biogashour
ηfuelledh 100 for gainful purpose26
fvCH4h Volumetric fraction of methane in the biogas gas in the hour h
ρCH4n Density of methane at normal conditions kgCH4Nm3CH4
And
TMflaredy = FVflaredh fvCH4h ηflareh ρCH4n) 1000 Equation C
Where Description Units
TMflaredy Quantity of methane flared in year y tonnes CH4year
FVflaredh Volumetric flow rate of the flared biogas gas at normal conditions in
hour h
Nm3 biogashour
26 AMS-IIIH point 35
PROJECT DESIGN DOCUMENT FORM (CDM-SSC-PDD) - Version 03
CDM ndash Executive Board
35
ηflareh Flare efficiency in the hour h
fvCH4h Volumetric fraction of methane in the biogas gas in the hour h
ρCH4n Density of methane at normal conditions kgCH4Nm3CH4
Data Parameter ID1 Qwwy
Data unit m3 month
Description The flow of wastewater entering the bio-digester
Source of data Measurement by project participant by using a flowmeter
Value of data ~ 28000
Brief description of
measurement methods and
procedures to be applied
The flow is measured with an online flow meter or equivalent
QAQC procedures to be
applied (if any) Data are monitored continuously and recorded periodically
(monthly or at shorter interval) in a data log file (DLF)
Uncertainty level of data low
Maintenance and calibration as per manufacturer‟s specifications
or at least once every three (3) years
Any comment
Data Parameter ID2 CODwwuntreatedy
Data unit tCOD m3
Description Raw COD of wastewater entering the bio-digester
Source of data Laboratory (internal and external)
Value of data ~ 0030230
Brief description of
measurement methods and
procedures to be applied
Measure of COD according to national or international standards
COD is measure through representative sampling
QAQC procedures to be
applied (if any) Minimum once a month COD sampling to ensure a 9010
confidenceprecision level
COD reports are recorded manually
Uncertainty level of data low
Maintenance and calibration as per manufacturer‟s specifications
or at least once every three (3) years for internal laboratory
equipment
Any comment
Data Parameter ID3 CODwwtreatedy
Data unit tCOD m3
Description COD of treated wastewater leaving the bio-digester
Source of data Laboratory (internal and external)
Value of data ~ 0003023
Brief description of
measurement methods and
procedures to be applied
Measure of COD according to national or international standards
COD is measure through representative sampling
QAQC procedures to be
applied (if any) Minimum once a month COD sampling to ensure a 9010
confidenceprecision level
COD reports are recorded manually
Uncertainty level of data low
PROJECT DESIGN DOCUMENT FORM (CDM-SSC-PDD) - Version 03
CDM ndash Executive Board
36
Maintenance and calibration as per manufacturer‟s specifications
or at least once every three (3) years for internal laboratory
equipment
Any comment
Data Parameter ID5 End-use of the final sludge
Data unit ndash
Description The final sludge generated by the project activity will be sent to control
landfill site if any
Source of data By project participant
Value of data ndash
Brief description of
measurement methods and
procedures to be applied
The final disposal of the sludge will be monitored during the crediting
period if any For each disposal of the sludge the following will be
recorded disposal site and date of disposal
QAQC procedures to be
applied (if any)
Any comment
Data Parameter ID6 FVflaredh
Data unit Nm3 hour
Description Volumetric flow of biogas recovered and flared at normal conditions in
the hour h
Source of data By project participant
Value of data 0
Brief description of
measurement methods and
procedures to be applied
The volume of biogas will be measured with a normalised flow meter or
calculated from the volumetric flow pressure temperature
Biogas volume and methane content measurements shall be on the same
basis (wet or dry)
QAQC procedures to be
applied (if any) The biogas flow is monitored continuously recorded and stored
electronically in a data log file (DLF) (monthly or at shorter
interval)
Data Parameter ID4 CODww dischargey
Data unit tCOD m3
Description COD of treated wastewater discharge into river by treatment system
Source of data Laboratory (internal and external)
Value of data ~ 0000100
Brief description of
measurement methods and
procedures to be applied
Measure of COD according to national or international standards
COD is measure through representative sampling
QAQC procedures to be
applied (if any) Minimum once a month COD sampling to ensure a 9010
confidenceprecision level
COD reports are recorded manually
Uncertainty level of data low
Maintenance and calibration as per manufacturer‟s specifications
or at least once every three (3) years for internal laboratory
equipment
Any comment
PROJECT DESIGN DOCUMENT FORM (CDM-SSC-PDD) - Version 03
CDM ndash Executive Board
37
Uncertainty level of data low
Maintenance and calibration as per manufacturer‟s specifications
or at least once every 3 years
Any comment
Data Parameter ID7 FVfuelledgas engineh
Data unit Nm3 hour
Description Volumetric flow of biogas recovered and fuelled (gas engine) at normal
conditions in the hour h
Source of data By project participant
Value of data ~ 509
Brief description of
measurement methods and
procedures to be applied
The volume of biogas will be measured with a normalised flow meter or
calculated from the volumetric flow of biogas pressure temperature
Biogas volume and methane content measurements shall be on the same
basis (wet or dry)
QAQC procedures to be
applied (if any) The biogas flow is monitored continuously recorded and stored
electronically in a data log file (DLF) (monthly or at shorter
interval)
Uncertainty level of data low
Maintenance and calibration as per manufacturer‟s specifications
or at least once every 3 years
Any comment
Data Parameter ID8 FVfuelledboilerh
Data unit Nm3 hour
Description Volumetric flow of biogas recovered and fuelled (boilers) at normal
conditions in the hour h
Source of data By project participant
Value of data ~ 0
Brief description of
measurement methods and
procedures to be applied
The volume of biogas will be measured with a normalised flow meter or
calculated from the volumetric flow of biogas pressure temperature
Biogas volume and methane content measurements shall be on the same
basis (wet or dry)
QAQC procedures to be
applied (if any) The biogas flow is monitored continuously recorded and stored
electronically in a data log file (DLF) (monthly or at shorter
interval)
Uncertainty level of data low
Maintenance and calibration as per manufacturer‟s specifications
or at least once every 3 years
Any comment
Data Parameter ID9 wCH4h
Data unit
Description Methane content in biogas in same basis (wetdry) as the biogas flows in
year y
Source of data By project participant using a gas analyzer
Value of data ~ 60
PROJECT DESIGN DOCUMENT FORM (CDM-SSC-PDD) - Version 03
CDM ndash Executive Board
38
Brief description of
measurement methods and
procedures to be applied
Using calibrated gas analyzer either continuous or periodical
measurement at confidenceprecision level of 9010
QAQC procedures to be
applied (if any) In case a continuous gas analyser is used data will be recorded
and stored electronically in a data log file (DLF) every hour or at
shorter interval
Uncertainty level of data low
Maintenance and calibration as per manufacturer‟s specifications
or at least once every 3 years
Any comment See also clarification by EB Meth Panel 30102009 ndash SSC_360
httpcdmunfcccintUserManagementFileStorageAM_CLAR_
QS83SX5B7WM6UGZE31JYQEQ4F65F6V
The biogas flow and the methane content measurements shall be
carried out close to each others
Data Parameter ID10 Tbiogas
Data unit ordmC
Description Temperature of biogas
Source of data Temperature probe
Value of data 20 ndash 65
Brief description of
measurement methods and
procedures to be applied
By project participant
QAQC procedures to be
applied (if any) Shall be measured and recorded at the same time when methane
content in biogas (ID8) is measured
Uncertainty level of data low
Maintenance and calibration as per manufacturer‟s specifications
or at least once every 3 years
Any comment Pressure and temperature are required to determine the density of
the methane If the biogas flow meter employed measures flow
pressure and temperature and displaysoutputs normalised flow of
biogas there is no need to separate monitoring of pressure and
temperature of the biogas
Data Parameter ID11 Pbiogas
Data unit Bar(g)
Description Pressure of biogas
Source of data By project participant
Value of data 50 ndash 200 mbar
Brief description of
measurement methods and
procedures to be applied
Pressure measurement device
QAQC procedures to be
applied (if any) Shall be measured and recorded at the same time when methane
content in biogas (ID8) is measured
Uncertainty level of data low
Maintenance and calibration as per manufacturer‟s specifications
or at least once every three (3) years
Any comment Pressure and temperature are required to determine the density of
the methane If the biogas flow meter employed measures flow
PROJECT DESIGN DOCUMENT FORM (CDM-SSC-PDD) - Version 03
CDM ndash Executive Board
39
pressure and temperature and displaysoutputs normalised flow of
biogas there is no need to separate monitoring of pressure and
temperature of the biogas
Shall be measured at the same time when methane content in
biogas (ID9) is measured
Parameter ID12 ηflareh (enclosed flare)
Unit
Description Enclosed flare efficiency in the hour h
Source of data Calculated
Value of data 0 or 50 or 90
Brief description of
measurement methods and
procedures to be applied
This yearly efficiency will be based on hourly flare efficiencies calculated
as per the provisions in the ldquoTool to determine project emissions from
flaring gases containing methanerdquo
The hourly flare efficiency will be calculated based on
0 if the temperature in the exhaust gas of the flare (Tflare) is
below 500 degC for more than 20 minutes during the hour h
50 if the temperature in the exhaust gas of the flare (Tflare) is
above 500 degC for more than 40 minutes during the hour h but the
manufacturer‟s specifications on proper operation of the flare are
not met at any point in time during the hour h
90 if the temperature in the exhaust gas of the flare (Tflare) is
above 500 degC for more than 40 minutes during the hour h and the
manufacturer‟s specifications on proper operation of the flare are
met continuously during the hour h
QAQC procedures to be
applied (if any) Data are logged hourly in a data log file (DLF)
Uncertainty level of data low
Any comment For enclosed flare
Or
Parameter ID13 ηflareh (open flare)
Unit
Description Flare efficiency in the hour h
Source of data Calculated
Value of data 0 or 50
Brief description of
measurement methods and
procedures to be applied
This yearly efficiency will be based on hourly flare efficiencies calculated
as per the provisions in the ldquoTool to determine project emissions from
flaring gases containing methanerdquo
The hourly flare efficiency will be calculated based on the duration of
time during which the flame is detected by the thermocouple (or flame
detector) installed in the open flare
Flare efficiency in hour h is based on default values
0 if the flame detected for not more than 20 minutes during the
hour h and
PROJECT DESIGN DOCUMENT FORM (CDM-SSC-PDD) - Version 03
CDM ndash Executive Board
40
50 if the flame detected for more than 20 minutes during the
hour h
A flame detector or thermocouple will be used
QAQC procedures to be
applied (if any) Data are logged hourly in a data log file (DLF)
Uncertainty level of data low
Any comment The only monitored parameter related to the flare is its efficiency Indeed
according to the clarification SSC_19927 of the methodology AMS IIIH
version 9 accepted by the SSC WG on the 3092008 ldquoIf a thermocouple
is used as a flame detection system it is sufficient to reach the given
minimum temperature from the manufacturer ldquo Hence it is not necessary
to monitor the temperature of the open type flares (Tflare)
Data Parameter ID14 ECPJjy
Data unit MWh
Description The yearly grid electricity consumption of the project activity for the year
bdquoy‟
Source of data Onsite instrument
Value of data ~749
Brief description of
measurement methods and
procedures to be applied
The grid electricity consumption of the project activity is measured
continuously with an energy meter (cumulative reading)
QAQC procedures to be
applied (if any) Data are monitored continuously and recorded periodically
(yearly or at shorter interval) in a data log file (DLF)
Uncertainty level of data low
Maintenance and calibration as per manufacturer‟s specifications
or at least once every three (3) years
Any comment
Data Parameter ID15 EGBLy
Data unit MWh
Description Quantity of net electricity generated and send to grid in year y
Source of data By project participant
Value of data ~ 6798
Brief description of
measurement methods and
procedures to be applied
The electricity generated and sent to grid is measured continuously with
an energy meter (cumulative readings)
QAQC procedures to be
applied (if any) Data are monitored continuously and recorded periodically
(yearly or at shorter interval) in a data log file (DLF)
Uncertainty level of data low
Maintenance and calibration as per manufacturer‟s specifications
or at least once every 3 years
Any comment As per AMS-ID
27 The clarification SSC_199 if available here (last access on the 24052011)
httpcdmunfcccintfilestorageAM_AM_CLAR_HIOZ5CS1PASC187C0JQ668L2E9RCRJResponse20WG20provided
20at20SSC20WG2017pdft=bU98MTMwNjIxNjY0OS4xMQ==|BOKHqtO94N6XF1N2N1vo8Ori-Rc=
PROJECT DESIGN DOCUMENT FORM (CDM-SSC-PDD) - Version 03
CDM ndash Executive Board
41
Or
Data Parameter ID16 EGmilly
Data unit MWh
Description Quantity of annual output of renewable energy sent to the mill in year y
Source of data By project participant
Value of data ~ 0
Brief description of
measurement methods and
procedures to be applied
The electricity generated and sent to mill to displace diesel use in diesel
gensets is measured continuously with an energy meter (cumulative
readings)
QAQC procedures to be
applied (if any) Data are monitored continuously and recorded periodically
(yearly or at shorter interval) in a data log file (DLF)
Uncertainty level of data low
Maintenance and calibration as per manufacturer‟s specifications
or at least once every 3 years
Any comment As per AMS-IA
Data Parameter ID17 Displacement of Biomass
Data unit Mt
Description Total amount of biomass (PKS) displaced from biomass boilers
Source of data Weighing bridge
Value of data Measurement at site
Brief description of
measurement methods and
procedures to be applied
Biomass (PKS) displaced due to the project activity will be weighed
using weighing bridge at the palm oil mill
QAQC procedures to be
applied (if any) Monthly calculation based on every single trip of trucks recorded
Data is recorded manually in a data log file based on the weighing
records
Maintenance and calibration as per manufacturer‟s specifications
Uncertainty level of data low
Any comment In the project activity the biomass (PKS) displaced will not be stored
under anaerobic conditions The conditions of onsite storage are identical
in the baseline as in the project activity The biomass will be sold to the
market on a regular basis PEbiomassy = 0
A final monitoring plan will be prepared prior the initial verification based on the as-built project activity
It will address the following aspects
MONITORING
The Project will be managed by CME with the involvement from Project Implementer CME will ensure
safety in operation of the plant as well as in the monitoring of emission reduction which is generated from
the project activity
CME will implement and be responsible for the monitoring plan Their responsibility covers operation of
the monitoring maintenance of the monitoring equipment data collection and archiving and
management of total scheme of the monitoring CME and Project Implementer will assign specific trained
PROJECT DESIGN DOCUMENT FORM (CDM-SSC-PDD) - Version 03
CDM ndash Executive Board
42
personnel during project implementation for the overall monitoring measurement and reporting of key
parameters as required in this PDD
DATA LOGGING AND STORAGE
The data measured by the instruments will be collected and stored in a data logging system The data will
be retrieved remotely by modem or directly on site
If data cannot be retrieved no emissions reductions will be claimed for the period of data failure The
data collected will be recorded in a central data base Access to production data will be restricted All
records and data (hard copy and soft copy) will be archived up to two years after the end of the crediting
period or the last issuance of CERs for this project activity whichever occurs later
CALIBRATION AND MAINTENANCE PROCEDURES MALFUNCTION OF EQUIPMENT
Maintenance includes all preventive and corrective actions necessary for the good functioning of the
equipment such as
Visual control of the equipment state and real-time check of displayed parameters
Cleaning up the equipment and the sensors
Adding lubricant
Replacement and change of defective parts
Calibration of equipment consists in verifying by comparison with a standard the accuracy of a
measuring instrument
Measuring instruments will be periodically and appropriately calibrated according to the procedures
timing and methods recommended by the manufacturer or nationalinternational standards as available
General malfunction of equipment
Daily inspections of the equipment will allow controlling equipment failure If equipment fails the
supplier will be notified and repairs will be carried out If the damaged equipment cannot be repaired it
will be replaced at the earliest In some cases portable tools will be used in order to carry out daily
monitoring of the missing parameter(s) In such case this data will be recorded manually
Discrepancies
To avoid discrepancies between projected data in the PDD and actual data (eg due to deferred starting
date malfunction of equipment) cross-checks between internal meter readings and external sources (eg
electricity invoices) will be carried out Any source of inconsistencies will be clarified
Case of emergency
For the case of emergency (earthquakes explosions fires etc) an emergency preparedness plan will be
adapted to the project activity All employees involved in the project on-site will be trained in the code of
conduct and required actions at time of commissioning of the plant
PROJECT DESIGN DOCUMENT FORM (CDM-SSC-PDD) - Version 03
CDM ndash Executive Board
43
OPERATIONAL AND MANAGEMENT STRUCTURE
The CDM monitoring team will be composed by the following staff
Position Report to
Operators
Project owner Supervisors (technicalmaintenance)
Operation Engineer
CDM monitoring project manager External CDM consultant
TRAINING OF MONITORING PERSONNEL
The maintenance will be conducted in-house by staff employed and trained by the Project Participants
Employees involved in the monitoring will be trained internally andor externally Training may include
inter alia
a) Review of equipment and captors
b) Calibration requirement
c) Configuration of monitoring equipment
d) Maintenance requirement
C1 Please indicate the level at which environmental analysis as per requirements of the CDM
modalities and procedures is undertaken Justify the choice of level at which the environmental
analysis is undertaken
radic Please tick if this information is provided at the PoA level In this case sections C2 and C3
need not be completed in this form
C2 Documentation on the analysis of the environmental impacts including transboundary
impacts
The host country does not require an analysis of environmental impacts As the project involves reduction
of GHG through recovery and controlled combustion which improves the quality of air therefore there
are no significant environmental impacts identified
C3 Please state whether an environmental impact assessment is required for a typical CPA
included in the programme of activities (PoA) in accordance with the host Party lawsregulations
In accordance with Malaysia environmental regulations Environmental Quality (Prescribed Activities
Environmental Impact Assessment) Order 1987 an Environmental Impact Assessment (EIA) is not
required for this CPA
PROJECT DESIGN DOCUMENT FORM (CDM-SSC-PDD) - Version 03
CDM ndash Executive Board
44
SECTION D Stakeholdersrsquo comments
D1 Please indicate the level at which local stakeholder comments are invited Justify the
choice
Please tick if this information is provided at the PoA level In this case sections D2 to D4 need
not be completed in this form
D2 Brief description how comments by local stakeholders have been invited and compiled
The stakeholder meeting was conducted at the office of Kilang Sawit Felda Triang on 05032012 There
were 37 stakeholders attending the consultation Posters were pasted at the guard house and at the
entrance to office 1 week before the stakeholder consultation to inform the locals stakeholders which
comprise mostly the workers of the mill 20 stakeholders out of the 37 who attended the consultation are
2nd generation of the Felda settlers who live in the vicinity to the project activity and adequately represent
the local community composed entirely of Felda settlers (no other people live in the vicinity of this
remote plantation) Continuous input of ideascomments were allowed to all stakeholders who could
either send their input though an email account especially setup for the biogas project or directly inform
the project proponents
During the meeting presentations were made by the project owner to outline the proposed project activity
in a non-technical manner (including environmental social and technological considerations) climate
change and the role of the CDM Attendees were given opportunity to raise their concern and opinion
about the proposed project activity during the question and answer session
D3 Summary of the comments received
PROJECT DESIGN DOCUMENT FORM (CDM-SSC-PDD) - Version 03
CDM ndash Executive Board
45
Below are the questions raised during the stakeholder meeting
NAME QUESTION
Mohd Tarmizi Bin Mat
Daud What is CDM in Bahasa Malaysia
Mohd Tarmizi Bin Mat
Daud What is DoE‟s standard for treated water released into river
Mohd Azizi Bin Abdul
Aziz
Would the biogas be captured from the existing effluent treatment ponds or a
new structure
Azhar Bin Abdul What to do with the captured biogas from the bioreactor
D4 Report on how due account was taken of any comments received
Below are the answers to the questions asked during the stakeholder meeting
QUESTION ANSWER
What is CDM in Bahasa Malaysia
The meaning of CDM in Bahasa Malaysia is Mekanisme
Pembangunan Bersih or in English is Clean Development
Mechanism
By Abd Karim Bin Mohd Zin
What is DoE‟s standard for treated
water released into river
The discharge standard for BOD into river is less than 100ppm
By Abd Karim Bin Mohd Zin
Would the biogas be captured from
the existing effluent treatment
ponds or a new structure
New bioreactor will be constructed to replace the existing anaerobic
lagoon treatment system The new bioreactor will capture the
biogas produced from this anaerobic treatment process
By Abd Karim Bin Mohd Zin
What to do with the captured
biogas from the bioreactor
The biogas recovered from the bioreactor will mainly contain
methane (approximately 60) and the rest are CO2 H2 and H2S
Currently the biogas is just released to the atmosphere from the
existing open lagoons system During the project activity captured
biogas will be combusted thus will improve the air quality
By Abd Karim Bin Mohd Zin
PROJECT DESIGN DOCUMENT FORM (CDM-SSC-PDD) - Version 03
CDM ndash Executive Board
46
Annex 1
CONTACT INFORMATION ON ENTITYINDIVIDUAL RESPONSIBLE FOR THE SMALL-
SCALE CPA
Organization Felda Palm Industries Sdn Bhd (359584-V)
StreetPOBox Jalan Gurney 1
Building Balai Felda 4th Floor
City Kuala Lumpur
StateRegion Wilayah Persekutuan
PostfixZIP 54000
Country Malaysia
Telephone (03) 2692 8066
FAX (03) 2693 4148
URL wwwfeldanetmy
Represented by
Title Head of Department
Salutation Mr
Last Name Busu
Middle Name
First Name Zainuri
Department Biomass
Mobile
Direct FAX
Direct tel
Personal E-Mail zainuribfeldanetmy
Organization Ably Carbon Sdn Bhd
StreetPOBox Jalan Ipoh Kecil
Building No 17
City Kuala Lumpur
StateRegion
PostfixZIP 50350
Country Malaysia
Telephone +60 3 4042 1177
FAX +60 3 4044 4166
E-Mail stephanevidailletably-carboncom
URL
Represented by Stephane Vidaillet
Title Chairman
Salutation Mr
Last Name Vidaillet
Middle Name
First Name Steacutephane
Department
Mobile +33 6 59111 5600
Direct FAX
PROJECT DESIGN DOCUMENT FORM (CDM-SSC-PDD) - Version 03
CDM ndash Executive Board
47
Direct tel
Personal E-Mail stephanevidailletably-carboncom
PROJECT DESIGN DOCUMENT FORM (CDM-SSC-PDD) - Version 03
CDM ndash Executive Board
48
Annex 2
INFORMATION REGARDING PUBLIC FUNDING
The project activity is not receiving any funding from parties included in Annex 1 of the Kyoto Protocol
SMALL-SCALE CDM PROGRAMME ACTIVITY DESIGN DOCUMENT FORM (CDM-SSC-CPA-DD) - Version 01
NAME TITLE OF THE PoA Biogas Recovery and Utilization PoA Projects in
Malaysia
CDM ndash Executive Board page 49
This template shall not be altered It shall be completed without modifyingadding headings or logo format or font
Annex 3
BASELINE INFORMATION
1 2
Year 2009 2010 2011 2012 2013 2014
FFB (mtyr) 343720 345910 310250 333293 333293 333293
POME Volume
(cumyr)[1] 343720 345910 310250 333293 333293 333293
Mill Opearing hour (hryr) 68865 69225 6209 6673 6673 6673
PKS (mtyr) 18905 19025 17064 18331 18331 18331
3 4 5 6 7 8 9 10
2015 2016 2017 2018 2019 2020 2021 2022
333293 333293 333293 333293 333293 333293 333293 333293
333293 333293 333293 333293 333293 333293 333293 333293
6673 6673 6673 6673 6673 6673 6673 6673
18331 18331 18331 18331 18331 18331 18331 18331
SMALL-SCALE CDM PROGRAMME ACTIVITY DESIGN DOCUMENT FORM (CDM-SSC-CPA-DD) - Version 01
NAME TITLE OF THE PoA Biogas Recovery and Utilization PoA Projects in
Malaysia
CDM ndash Executive Board page 50
This template shall not be altered It shall be completed without modifyingadding headings or logo format or font
10 days measurement campaign for baseline wastewater treatment system
Day Date
ETP
Inlet
Anaerobic
system (mgl)
Outlet
Anaerobic
system (mgl)
Outlet Algae
System (mgl)
Final
Discharge to
River (mgl)
1 23-Feb-12 35693 3120 811 603
2 25-Feb-12 19511 2559 1186 83
3 26-Feb-12 32864 2767 749 437
4 27-Feb-12 30195 2330 1210 404
5 28-Feb-12 32436 1927 1188 941
6 29-Feb-12 38259 4256 896 717
7 1-Mar-12 28717 3584 1232 695
8 3-Mar-12 31002 4660 1658 1210
9 4-Mar-12 22400 4346 1389 963
10 5-Mar-12 31226 4301 1971 1165
Average 30230 3385 1229 722
ETP
COD removal efficiency (anaerobic system) 8880
COD removal efficiency (Facultativealgae system) 6369
COD removal efficiency (Bio-polishing system) 4127
Total COD removal efficiency of the treatment system 9761
The COD of the raw effluent during ex-post may vary from the one year historical records depending on
the improvement of the production process (outside of project boundary) thus ERex-post may vary from the
estimated ERex-ante
SMALL-SCALE CDM PROGRAMME ACTIVITY DESIGN DOCUMENT FORM (CDM-SSC-CPA-DD) - Version 01
NAME TITLE OF THE PoA Biogas Recovery and Utilization PoA Projects in
Malaysia
CDM ndash Executive Board page 51
This template shall not be altered It shall be completed without modifyingadding headings or logo format or font
Annex 4
MONITORING INFORMATION
General information
Monitoring refers to the collection and archiving of all relevant data necessary for determining the
baseline measuring anthropogenic emissions by sources of greenhouse gases (GHG) within the project
boundary of a CDM project activity and leakage It includes developing suitable data collection methods
and data interpretation techniques for monitoring and verification of GHG emissions
On-line monitoring system
Most key meters required to determine GHG emissions and emission reductions will be monitored from a
central control point which will record meter readings at a pre-determined interval
Ensuring adequate maintenance and calibration of monitoring instruments
Specific maintenance repair or replacement of monitoring equipment will be recorded dated and
described
The calibration will occur at intervals determined on the basis of instrument manufacturers
recommendations stability purpose usage and history of repeatability Recalibration should be
performed whenever an event occurs that places the accuracy of the instrument in doubt
Calibration will take place at least once every three (3) years to ensure that the monitoring
equipments are properly installed and functioning properly
Calibration will be performed according to national or international standards
Last calibration certificates will be provided during periodic verification
Sampling procedure
Wherever a statistical sample is used for monitoring the ldquogeneral guidelines for sampling and surveys for
SSC project activitiesrdquo shall be used COD shall be measured from a composite sample to obtain a
representative value
Data archiving
The monitored data will be kept for a minimum of 2 years after the end of the crediting years by using
paper documents or electronic files
Identification of non-conformities
A verification of inconsistencies of the data recorded will be performed based for example on
The comparison of the calculated quantities of methane versus expected
Spot checks of field instruments (local reading) and data in the log file
Any discrepancies (completeness calculation errors transcription errors instrument calibration issues)
will be analyzed and actions taken to correct the problem
Ensuring adequate training of staff
All new staff members will undergo bdquoon job training‟ covering the monitoring requirements
The monitoring plan will be made available to staff member involved in the monitoring
A copy will be located in the control room at the site
SMALL-SCALE CDM PROGRAMME ACTIVITY DESIGN DOCUMENT FORM (CDM-SSC-CPA-DD) - Version 01
NAME TITLE OF THE PoA Biogas Recovery and Utilization PoA Projects in
Malaysia
CDM ndash Executive Board page 52
This template shall not be altered It shall be completed without modifyingadding headings or logo format or font
During the training the employees will sign a training attendance list All training records shall
be documented inclusive of training attendance training memo and training material if any
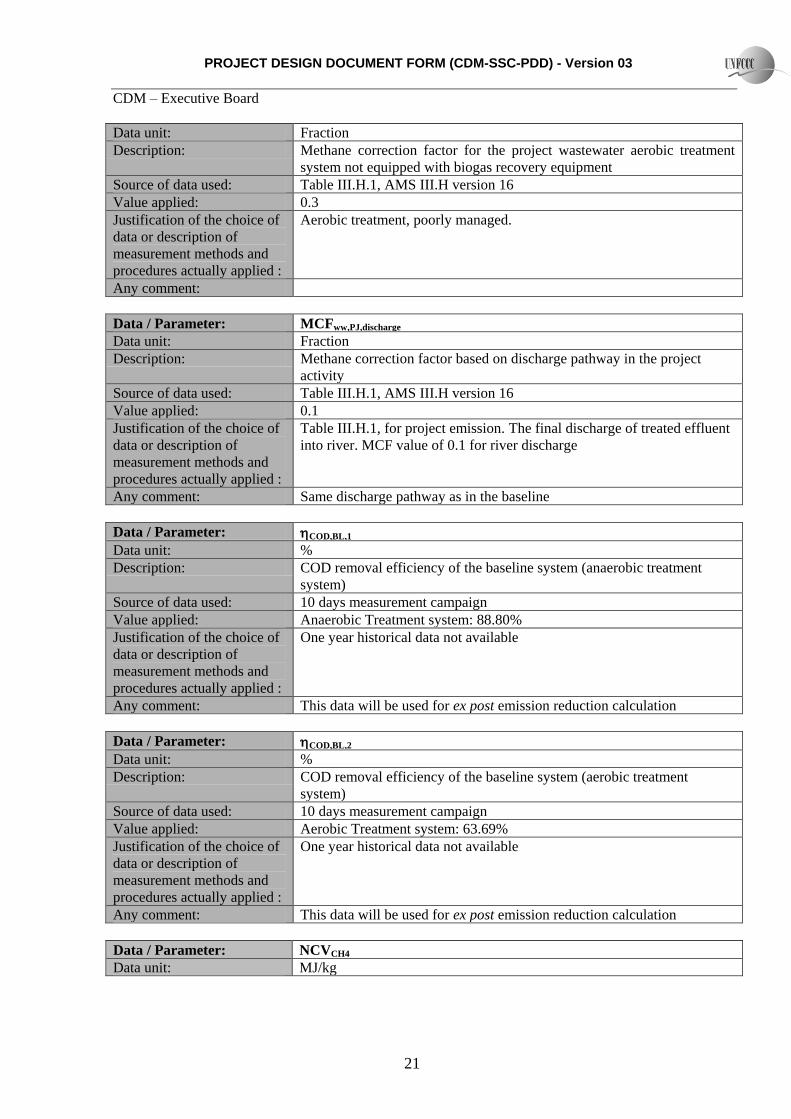
PROJECT DESIGN DOCUMENT FORM (CDM-SSC-PDD) - Version 03
CDM ndash Executive Board
22
Description Net Calorific Value of methane
Source of data used IPCC 2006 Default Value
Value applied 504
Justification of the choice of
data or description of
measurement methods and
procedures actually applied
IPCC 2006 value is used Volume 2 Chapter 1 Table 12
Any comment
Data Parameter NCVFF
Data unit MJkg
Description Net Calorific Value of diesel
Source of data used IPCC 2006 Default Value
Value applied 430
Justification of the choice of
data or description of
measurement methods and
procedures actually applied
IPCC 2006 value is used Volume 2 Chapter 1 Table 12
Any comment
Data Parameter EFCO2diesel
Data unit tCO2MWh
Description CO2 emission factor diesel genset
Source of data used AMS-IA version 14 point 14
Value applied 08
Justification of the choice of
data or description of
measurement methods and
procedures actually applied
Default value for diesel generation unit
Any comment
Data Parameter Grid Emission Factor
Data unit kgCO2ekWh
Description Emission factor for grid electricity in Peninsular Malaysia
Source of data used Pusat Tenaga Malaysia March 2010
Value applied 0672
Justification of the choice of
data or description of
measurement methods and
procedures actually applied
As per AMS-ID point 12
Any comment Study on Grid Connected Electricity Baselines in Malaysia 2008
B52 Ex-ante calculation of emission reductions
The ex ante emission reductions are calculated based on AMS-IIIH version 16 as per equations
explained in section E62 of PoA-DD Biogas PoA in Malaysia
PROJECT DESIGN DOCUMENT FORM (CDM-SSC-PDD) - Version 03
CDM ndash Executive Board
23
Calculation for AMS-IIIH
Baseline emissions
Source of baseline emissions Reference Applicable
(YN)
Comments
Wastewater and sludge treatment
systems equipped with a biogas
recovery facility shall be excluded
from the baseline
AMS-IIIH
Point 17
N No biogas recovery in the
baseline
Emissions on account of electricity or
fossil fuel used (BEpowery)
AMS-IIIH
Point 18 (i)
N For conservativeness no
emissions due to electricity or
fossil fuel will be claimed
BEpowery = 0
Methane emissions from baseline
wastewater treatment systems
(BEwwtreatmenty)
AMS-IIIH
Point 18 (ii)
Y Baseline includes anaerobic and
aerobic treatment conditions with
different MCF values selected as
per Table IIIH1
Methane emissions from baseline
sludge treatment systems (BEstreatmenty)
= 0
AMS-IIIH
Point 18 (iii)
N The baseline plant corresponds to
scenario Para 1(f) without sludge
treatment BEstreatmenty = 0
Methane emissions on account of
inefficiencies in the baseline
wastewater treatment systems and
presence of degradable organic carbon
in the treated wastewater discharged
into river (BEwwdischargey)
AMS-IIIH
Point 18 (iv)
Y Treated effluent is currently
discharged into the river
Methane emissions from the decay of
the final sludge generated by the
baseline treatment systems (BEsfinaly)
AMS-IIIH
Point 18 (v)
N Zero because in the baseline final
sludge used for soil application
BEsfinaly = 0
A) Calculation of baseline emissions
BEy = BEwwtreatmenty + BEwwdischargey
Abbreviation Description Value Source
BEy Baseline emissions in year y (tCO2e) 30762 Calculated
BEpowery Baseline emissions of diesel genset in year
y tCO2eyear 0 Calculated
BEwwtreatmenty Baseline emissions of the wastewater
treatment systems tCO2eyear 30663 Equation 2
BEwwdischargey
The methane emissions from degradable
organic carbon in treated wastewater
discharged tCO2eyear
100 Equation 6
A1) Baseline emissions
PROJECT DESIGN DOCUMENT FORM (CDM-SSC-PDD) - Version 03
CDM ndash Executive Board
24
Equation 2 BEwwtreatmenty = Qwwy (CODinflow1 y CODBL1 MCFwwtreatmentBL1) +
(CODinflow2y CODBL2 MCFwwtreatmentBL2) Boww UFBL GWPCH4
Abbreviation Description Value Source
BEwwtreatmenty Baseline emissions of the wastewater
treatment systems (tCO2eyear) 30663 Calculated
Qwwy Volume of wastewater treated in baseline
wastewater treatment system i in year y
(m3year)
333293
Volume based on 10 m3mt
FFB21 amp FFB historical data
(2009 ndash 2011)
CODinflow1y Chemical oxygen demand of the
wastewater inflow to the baseline treatment
system (anaerobic) in year y (tCOD m3)
0026905 10 days measurement
campaign
CODBL1 COD removal efficiency of the baseline
treatment system (anaerobic) () 8880
10 days measurement
campaign
CODinflow2y Chemical oxygen demand of the
wastewater inflow to the baseline treatment
system (aerobic) in year y (tCOD m3)
0003013 10 days measurement
campaign
CODBL2 COD removal efficiency of the baseline
treatment system (aerobic) () 6369
10 days measurement
campaign
MCFwwtreatmentBL 1 Methane correction factor for baseline
wastewater anaerobic treatment systems 08
MCF values as per table
IIIH1 anaerobic gt 2m
MCFwwtreatmentBL2 Methane correction factor for baseline
wastewater aerobic treatment systems 03
MCF values as per table
IIIH1 ndash poorly managed
Boww Methane producing capacity of the
wastewater (kg CH4kg COD) 025
IPCC 2006
UFBL Model correction factor to account for
model uncertainties 089
IPCC 2006
GWPCH4 Global Warming Potential for methane 21 IPCC 2006
A2) The methane emissions from degradable organic carbon in treated wastewater discharged
Equation 6 BEwwdischargey = Qwwy GWPCH4 Boww UFBL CODwwdischarge BLyMCFww BLdischarge
Abbreviation Description Value Source
BEwwdischargey
The methane emissions from degradable
organic carbon in treated wastewater
discharged (tCO2eyear)
100 Calculated
Qwwy Volume of treated wastewater discharged
in year y (m3year) 333293
Volume based on 10 m3mt
FFB22 amp FFB historical data
(2009 ndash 2011)
GWPCH4 Global warming potential of methane 21 IPCC 2006
Boww Methane producing capacity of the treated
wastewater (kgCH4 kgCOD) 025 IPCC 2006
21 Mill designed data for baseline effluent treatment plant 22 Mill designed data for baseline effluent treatment plant
PROJECT DESIGN DOCUMENT FORM (CDM-SSC-PDD) - Version 03
CDM ndash Executive Board
25
UFBL Model correction factor to account for
model uncertainties 089 IPCC 2006
CODwwdischarge BLy Chemical oxygen demand of the treated
wastewater discharged into sea river or
lake in the baseline situation in the year y
(tonnesm3)
0000642 10 days measurement
campaign
MCFwwBLdischarge Methane correction factor based on
discharge pathway in the baseline situation
(eg into sea river or lake) of the
wastewater (fraction)
01 MCF values as per table
IIIH1 version 16
Project activity emissions
The project activity emission sources as per the methodology and their relevance with respect to the
proposed CDM project activity are given below in a tabular format
Source of project activity
emission Reference
Applicable
(YN) Comments
CO2 emissions on account of
power and fossil fuel used by
the project activity facilities
(PEpowery)
AMS-IIIH
point 29(i)
Y The project activity uses the electricity
imported from the national grid
Methane emissions from
wastewater treatment systems
affected by the project
activity and not equipped with
biogas recovery in the project
situation (PEwwtreatmenty)
AMS-IIIH
point 29 (ii)
Y CH4 emissions from the poorly managed
aerobic lagoons
Methane emissions from
sludge treatment systems
affected by the project
activity and not equipped with
biogas recovery in the project
situation (PEstreatmenty)
AMS-IIIH
point 29 (iii)
N The project activity corresponds to
scenario (vi) without sludge treatment
PEystreatmenty = 0
Methane emissions on account
of inefficiency of the project
activity wastewater treatment
systems and presence of
degradable organic carbon in
treated wastewater
(PEwwdischargey)
AMS-IIIH
point 29 (iv)
Y Treated effluent from ETP will be
discharged into river
Methane emissions from the
decay of the final sludge
generated by the project
activity treatment systems
(PEsfinaly)
AMS-IIIH
point 29 (v)
N In the proposed CDM project activity
final sludge is used for soil application in
the same manner as in the baseline
PEsfinaly = 0
PROJECT DESIGN DOCUMENT FORM (CDM-SSC-PDD) - Version 03
CDM ndash Executive Board
26
Methane fugitive emissions on
account of inefficiencies in
capture systems (PEfugitivey)
AMS-IIIH
point 29 (vi)
Y Applicable to PEfugitivewwy
N The project activity corresponds to
scenario (vi) without sludge treatment
PEfugitivesy = 0
Methane emissions due to
incomplete flaring (PEflaringy)
AMS-IIIH
point 29 (vii)
Y Enclosed flaring system installed
Methane emissions from
biomass stored under
anaerobic conditions which
does not take place in the
baseline situation (PEbiomassy)
AMS-IIIH
point 29
(viii)
N In the project activity the biomass (PKS
+ mesocarp fibres) displaced will not be
stored under anaerobic conditions The
conditions of onsite storage are identical
in the baseline as in the project activity
The biomass will be sold to the market
on a regular basis PEbiomassy = 0
B) Calculation of project emissions
PEy = PEpowery + PEwwtreatmenty + PEww discharge y + PEfugitive y + PEflaring y
Abbreviation Description Value Source
PEy Project activity emissions in the year y
(tCO2eyr) 6050 Equation 8
PEpowery CO2 emissions on account of power used
by the project activity facilities (tCO2eyr) 604 -
PEwwtreatmenty Methane emissions from wastewater
treatment systems affected by the project
activity and not equipped with biogas
recovery in year y (tCO2eyr)
1523 Equation 9
PEwwdischargey
Methane emissions on account of
inefficiency of the project activity
wastewater treatment systems and presence
of degradable organic carbon in treated
wastewater (tCO2eyr)
126 Equation 12
PEfugitivey Methane fugitive emissions on account of
inefficiencies in capture systems (tCO2eyr) 3796 Equation 15
PEflaringy Methane emissions due to incomplete
flaring (tCO2eyr) 0 Equation 19
B1) Project emissions from CO2 emissions on account of power and fuel used by the project activity
facilities in year ldquoyrdquo in tCO2eyear
PEpowery = ECPJjy EFgridy
Abbreviation Description Value Source
PEpowery Project emissions from electricity
consumption in the year y (tCO2eyr) 604 Calculated
ECPJjy Internal power consumption from the grid 749 100 kW is the effective
PROJECT DESIGN DOCUMENT FORM (CDM-SSC-PDD) - Version 03
CDM ndash Executive Board
27
(MWh year) power based on the
equipments installed at the
site
EFgridy Grid Emission factor in Peninsular
Malaysia 2008 (tCO2 MWh) 0672
Study on Grid Connected
Electricity Baselines in
Malaysia 2008 published in
2010 by PTM
B2) Methane emissions from wastewater treatment systems affected by the project activity and not
equipped with biogas recovery in the project situation in year ldquoyrdquo in tCO2e
Equation 9 PEwwtreatment y = Qwwky CODinflowk y PJky MCFwwtreatmentPJk) Boww UFPJ GWPCH4
Abbreviation Description Value Source
PEwwtreatmenty
Methane emissions from wastewater
treatment systems affected by the project
activity and not equipped with biogas
recovery in the project situation (tCO2eyr)
1523 Calculated
Qwwky Volume of wastewater treated in project
activity wastewater treatment system k in
year y (m3year)
333293
Volume based on 10 m3mt
FFB23 amp FFB historical data
(2009 ndash 2011)
CODinflowky Chemical oxygen demand of the
wastewater inflow to the project activity
treatment system k in year y (tonnes COD
m3)
0002690 10 days measurement
campaign
PJky Chemical oxygen demand removal
efficiency of the project wastewater
treatment system k in year y (tm3)
measured based on inflow COD and
outflow COD in system k
90 Based on bio-digester COD
removal efficiency of 90
MCFwwtreatmentPJk Methane correction factor for project
wastewater treatment system k (MCF
values as per table IIIH1)
03
MCF values table IIIH1
Version 16 ndash aerobic poorly
managed (conservative)
Boww Methane generation capacity of the treated
wastewater (kg CH4kg COD) 025 IPCC 2006
UFPJ Model correction factor to account for
model uncertainties 112
IPCC 2006
GWPCH4 Global warming potential of methane 21 IPCC 2006
23 Mill designed data for baseline effluent treatment plant
PROJECT DESIGN DOCUMENT FORM (CDM-SSC-PDD) - Version 03
CDM ndash Executive Board
28
B3) Methane emissions on account of inefficiency of the project activity wastewater treatment
systems and presence of degradable organic carbon in treated wastewater in the year ldquoyrdquo (tonnes)
Equation 12 PEwwdischarge y = Qwwy GWPCH4 Boww UFPJ CODwwdischargePJy MCFwwPJdischarge
Abbreviation Description Value Source
PEwwdischargey
Methane emissions from degradable
organic carbon in treated wastewater
(tCO2eyr)
126 Calculated
Qwwy Quantity of wastewater treated in year y
(m3year) 333293
Volume based on 10 m3mt
FFB24 amp FFB historical data
(2009 ndash 2011)
CODwwdischargedPJ
y
Chemical oxygen demand of the treated
wastewater discharged into river in the
project situation in year y (tCOD m3)
0000642 10 days measurement
campaign
MCFwwPJ discharge
Methane correction factor based on
discharge pathway in the project situation
(river) of the wastewater (fraction)
01 MCF values as per table
IIIH1 Version 16
Boww Methane generation capacity of the treated
wastewater (kg CH4kg COD) 025 IPCC 2006
UFPJ Model correction factor to account for
model uncertainties 112 IPCC 2006
GWPCH4 Global warming potential of methane 21 IPCC 2006
B41) Methane fugitive emissions on account of inefficiencies in capture systems in the year ldquoyrdquo
(tonnes)
Equation 15 PEfugitivewwy = (1 ndash CFEww ) MEPywwtreatment GWPCH4
Abbreviation Description Value Source
PEfugitivey Methane fugitive emissions on account of
inefficiencies in capture systems (tCO2eyr) 3796 Calculated
CFEww Capture efficiency of the biogas recovery
equipment in the wastewater treatment
systems
09 AMS IIIH Version 16
MEPywwtreatment Methane emission potential of wastewater
treatment systems equipped with biogas
recovery system in year y (tCH4yr)
1808 Refer Equation 11 of AMS
IIIH version 16
GWPCH4 Global warming potential of methane 21 IPCC 2006
B42) Methane emission potential of wastewater treatment plant in the year ldquoyrdquo (tonnes)
Equation 16 MEPwwtreatmenty = Qwwy Boww UFPJ (CODremovedPJky MCFwwtreatmentPJk)
24 Mill designed data for baseline effluent treatment plant
PROJECT DESIGN DOCUMENT FORM (CDM-SSC-PDD) - Version 03
CDM ndash Executive Board
29
Abbreviation Description Value Source
MEPwwtreatmenty Methane emission potential of wastewater
treatment systems equipped with biogas
recovery system in year y (tonnes CH4yr)
1808 Calculated
Qyww Quantity of wastewater treated in year y
(m3year) 333293
Volume based on 10 m3mt
FFB25 amp FFB historical data
(2009 ndash 2011)
Boww Methane generation capacity of the treated
wastewater (kg CH4kg COD) 025 IPCC 2006
CODremovedPJy
The chemical oxygen demand removed by
the treatment anaerobic system of the
project activity equipped with biogas
recovery in the year y (tCOD m3)
0024214
10 days measurement
campaign amp bio-digester
design parameter
MCFwwtreatmentPJ
Methane correction factor for the project
wastewater treatment system k equipped
with biogas recovery equipment
08 MCF values as per table
IIIH1 Version 16
UFPJ Model correction factor to account for
model uncertainties 112 IPCC 2006
B5) Methane emissions due to incomplete flaring in the year ldquoyrdquo (tonnes)
Equation 13a PEflaringy = TMflaredy (1 - ηflarey) GWPCH4
Abbreviation Description Value Source
PEflaringy Methane emissions due to incomplete
flaring (tCO2eyr) 0 Calculated
TMflaredh Mass flow rate of methane flared in dry
basis in the hour h (tCH4 yr) 0 Calculated
ηflarey Flare efficiency in hour h based on default
values 50
Tools for methane flaring
(open flare) for conservative
GWPCH4 Global warming potential of methane 21 IPCC 2006
Leakage emissions
No leakage emission will occur in the project activity
LEy1 = 0
Emission reductions
Equation 22 ERy ex ante = BEy ex ante ndash (PEy ex ante + LEy ex ante)
25 Mill designed data for baseline effluent treatment plant
PROJECT DESIGN DOCUMENT FORM (CDM-SSC-PDD) - Version 03
CDM ndash Executive Board
30
Abbreviation Description Value Source
ERy1 ex ante Ex ante emission reduction in year y
(tCO2e) 24712 Equation 22
BEy1 ex ante Ex ante baseline emissions in year y
(tCO2e) 30762 Equation 1
PEy1 ex ante Ex ante project emissions in year y (tCO2e) 6050 Equation 8
LEy1 ex ante Ex ante Leakage emissions in year y
(tCO2e) 0 -
Calculation for AMS-ID
Baseline emissions
Electricity generated from biogas engines will be exported to the Peninsular Malaysia National Grid The
baseline emissions are described in AMS-ID (Version 17 EB 61) as the ldquoproduct of electrical energy
baseline expressed in kWh of electricity produced by the renewable energy generating unit multiplied by
an emission factorrdquo
Baseline emissions due to electricity exported to the grid in the year ldquoyrdquo (tonnes)
BEEGy = EGBLy EFCO2gridy
Abbreviation Description Value Source
BEEGy Baseline emissions in year y (tCO2eyr) 4568 Calculated
EGBLy
Quantity of net electricity supplied to the
grid as a result of the implementation of the
project activity in year y (kWh yr)
6797625 Calculated
EFCO2gridy
CO2 emission factor of the grid in year
(tCO2kWh) 0672
Study on Grid Connected
Electricity Baselines in
Malaysia 2008 published in
2010 by PTM
Project Activity Emissions
As per AMS-ID (Version 17 EB 61) project emissions for renewable energy project activities are zero
PEEGy = 0
Leakage
If the energy generating equipment is transferred from another activity leakage is to be considered
No leakage emission will occur in the project activity LEy = 0
PROJECT DESIGN DOCUMENT FORM (CDM-SSC-PDD) - Version 03
CDM ndash Executive Board
31
Emission reductions
ERy = BEy ndash PEy - LEy
Abbreviation Description Value Source
ERy Emission reduction in year y (tCO2ey) 4568 -
BEy Baseline emissions in year y (tCO2ey) 4568 -
PEy Project emissions in year y (tCO2ey) 0 -
LEy Leakage emissions in year y (tCO2ey) 0 -
Calculation for AMS-IA
Baseline emissions
The energy baseline is the fuel consumption of the technology in use or that would have been used in the
absence of the project activity to generate the equivalent quantity of energy Option 2 is applied This
methodology is only apply shall the recovered is in excess after export to the grid
Annual electricity sent to the mill for FF displacement in the year ldquoyrdquo (kWh)
EBLy = ΣEGiy (1 ndash l)
Abbreviation Description Value Source
EBLy Annual energy baseline (kWhyr) Calculated
EGiy
The estimated annual output of the
renewable energy technologies of the group
of i renewable energy technologies
installed (kWhyr)
0 Estimated
l
Average technical distribution losses that
would have been observed in diesel
powered mini-grids installed by public
programmes or distribution companies in
isolated areas expressed as a fraction
0 Conservative by applying
Zero (0)
Baseline electricity sent to the mill for FF displacement in the year ldquoyrdquo (tonnes)
BECO2y = EBLy EFCO2
Abbreviation Description Value Source
BECO2y Baseline emission in the year y (tCO2yr) 0 Calculated
EBLy Annual energy baseline (kWhyr) 0 Calculated
EFCO2 CO2 emission factor (tCO2kWh) 08
Default value which is
derived from diesel
generation units is used
PROJECT DESIGN DOCUMENT FORM (CDM-SSC-PDD) - Version 03
CDM ndash Executive Board
32
Project Activity Emissions
As per AMS-IA (Version 14 EB 54) project emissions for renewable energy project activities are zero
PEy = 0
Leakage
If the energy generating equipment is transferred from another activity or if the existing equipment is
transferred to another activity leakage is to be considered
No leakage emission will occur in the project activity LEy = 0
B53 Summary of the ex-ante estimation of emission reductions
Estimated emission reductions (total project activity)
Year
Estimation of
project activity
emissions (tCO2e)
Estimation of
baseline emissions
(tCO2e)
Estimation of
leakage (tCO2e)
Estimation of
overall emission
reductions (tCO2e)
2012 504 2944 0 2440
2013 6050 35330 0 29280
2014 6050 35330 0 29280
2015 6050 35330 0 29280
2016 6050 35330 0 29280
2017 6050 35330 0 29280
2018 6050 35330 0 29280
2019 5546 32386 0 26840
Total (tCO2) 42350 247310 0 204960
The starting date of the crediting period is 01122012 or the date of registration whichever is later
Estimated emission reductions for AMS-IIIH
Year
Estimation of
project activity
emissions (tCO2e)
Estimation of
baseline emissions
(tCO2e)
Estimation of
leakage (tCO2e)
Estimation of
overall emission
reductions (tCO2e)
2012 504 2563 0 2059
2013 6050 30762 0 24712
PROJECT DESIGN DOCUMENT FORM (CDM-SSC-PDD) - Version 03
CDM ndash Executive Board
33
2014 6050 30762 0 24712
2015 6050 30762 0 24712
2016 6050 30762 0 24712
2017 6050 30762 0 24712
2018 6050 30762 0 24712
2019 5546 28199 0 22653
Total (tCO2) 42350 215334 0 172984
The starting date of the crediting period is 01122012 or the date of registration whichever is later
Estimated emission reductions for AMS-ID
Year
Estimation of
project activity
emissions (tCO2e)
Estimation of
baseline emissions
(tCO2e)
Estimation of
leakage (tCO2e)
Estimation of
overall emission
reductions (tCO2e)
2012 0 381 0 381
2013 0 4568 0 4568
2014 0 4568 0 4568
2015 0 4568 0 4568
2016 0 4568 0 4568
2017 0 4568 0 4568
2018 0 4568 0 4568
2019 0 4187 0 4187
Total (tCO2) 0 31976 0 31976
The starting date of the crediting period is 01122012 or the date of registration whichever is later
Estimated emission reductions for AMS-IA
Year
Estimation of
project activity
emissions (tCO2e)
Estimation of
baseline emissions
(tCO2e)
Estimation of
leakage (tCO2e)
Estimation of
overall emission
reductions (tCO2e)
2012 0 0 0 0
2013 0 0 0 0
2014 0 0 0 0
2015 0 0 0 0
2016 0 0 0 0
PROJECT DESIGN DOCUMENT FORM (CDM-SSC-PDD) - Version 03
CDM ndash Executive Board
34
2017 0 0 0 0
2018 0 0 0 0
2019 0 0 0 0
Total (tCO2) 0 0 0 0
The starting date of the crediting period is 01122012 or the date of registration whichever is later
B6 Application of the monitoring methodology and description of the monitoring plan
B61 Description of the monitoring plan
The parameters to be monitored are
Please note that the amount of methane recovered and fuelled or flared (MDy ) is calculated as follows
MDy = TMfuelledy + TMflaredy Equation A
Where Description Units
MDy Quantity of methane recovered and fuelled or flared in the year y tonnes CH4year
TMfuelledy Quantity of methane fuelled in the year y tonnes CH4year
TMflaredy Quantity of methane flared in year y tonnes CH4year
Where
TMfuelledy = FVfuelledh fvCH4h ηfuelledh ρCH4n) 1000 Equation B
Where Description Units
TMfuelledy Quantity of methane fuelled in the year y tonnes CH4year
FVfuelledh Volumetric flow rate of the fuelled biogas gas at normal conditions in
hour h
Nm3 biogashour
ηfuelledh 100 for gainful purpose26
fvCH4h Volumetric fraction of methane in the biogas gas in the hour h
ρCH4n Density of methane at normal conditions kgCH4Nm3CH4
And
TMflaredy = FVflaredh fvCH4h ηflareh ρCH4n) 1000 Equation C
Where Description Units
TMflaredy Quantity of methane flared in year y tonnes CH4year
FVflaredh Volumetric flow rate of the flared biogas gas at normal conditions in
hour h
Nm3 biogashour
26 AMS-IIIH point 35
PROJECT DESIGN DOCUMENT FORM (CDM-SSC-PDD) - Version 03
CDM ndash Executive Board
35
ηflareh Flare efficiency in the hour h
fvCH4h Volumetric fraction of methane in the biogas gas in the hour h
ρCH4n Density of methane at normal conditions kgCH4Nm3CH4
Data Parameter ID1 Qwwy
Data unit m3 month
Description The flow of wastewater entering the bio-digester
Source of data Measurement by project participant by using a flowmeter
Value of data ~ 28000
Brief description of
measurement methods and
procedures to be applied
The flow is measured with an online flow meter or equivalent
QAQC procedures to be
applied (if any) Data are monitored continuously and recorded periodically
(monthly or at shorter interval) in a data log file (DLF)
Uncertainty level of data low
Maintenance and calibration as per manufacturer‟s specifications
or at least once every three (3) years
Any comment
Data Parameter ID2 CODwwuntreatedy
Data unit tCOD m3
Description Raw COD of wastewater entering the bio-digester
Source of data Laboratory (internal and external)
Value of data ~ 0030230
Brief description of
measurement methods and
procedures to be applied
Measure of COD according to national or international standards
COD is measure through representative sampling
QAQC procedures to be
applied (if any) Minimum once a month COD sampling to ensure a 9010
confidenceprecision level
COD reports are recorded manually
Uncertainty level of data low
Maintenance and calibration as per manufacturer‟s specifications
or at least once every three (3) years for internal laboratory
equipment
Any comment
Data Parameter ID3 CODwwtreatedy
Data unit tCOD m3
Description COD of treated wastewater leaving the bio-digester
Source of data Laboratory (internal and external)
Value of data ~ 0003023
Brief description of
measurement methods and
procedures to be applied
Measure of COD according to national or international standards
COD is measure through representative sampling
QAQC procedures to be
applied (if any) Minimum once a month COD sampling to ensure a 9010
confidenceprecision level
COD reports are recorded manually
Uncertainty level of data low
PROJECT DESIGN DOCUMENT FORM (CDM-SSC-PDD) - Version 03
CDM ndash Executive Board
36
Maintenance and calibration as per manufacturer‟s specifications
or at least once every three (3) years for internal laboratory
equipment
Any comment
Data Parameter ID5 End-use of the final sludge
Data unit ndash
Description The final sludge generated by the project activity will be sent to control
landfill site if any
Source of data By project participant
Value of data ndash
Brief description of
measurement methods and
procedures to be applied
The final disposal of the sludge will be monitored during the crediting
period if any For each disposal of the sludge the following will be
recorded disposal site and date of disposal
QAQC procedures to be
applied (if any)
Any comment
Data Parameter ID6 FVflaredh
Data unit Nm3 hour
Description Volumetric flow of biogas recovered and flared at normal conditions in
the hour h
Source of data By project participant
Value of data 0
Brief description of
measurement methods and
procedures to be applied
The volume of biogas will be measured with a normalised flow meter or
calculated from the volumetric flow pressure temperature
Biogas volume and methane content measurements shall be on the same
basis (wet or dry)
QAQC procedures to be
applied (if any) The biogas flow is monitored continuously recorded and stored
electronically in a data log file (DLF) (monthly or at shorter
interval)
Data Parameter ID4 CODww dischargey
Data unit tCOD m3
Description COD of treated wastewater discharge into river by treatment system
Source of data Laboratory (internal and external)
Value of data ~ 0000100
Brief description of
measurement methods and
procedures to be applied
Measure of COD according to national or international standards
COD is measure through representative sampling
QAQC procedures to be
applied (if any) Minimum once a month COD sampling to ensure a 9010
confidenceprecision level
COD reports are recorded manually
Uncertainty level of data low
Maintenance and calibration as per manufacturer‟s specifications
or at least once every three (3) years for internal laboratory
equipment
Any comment
PROJECT DESIGN DOCUMENT FORM (CDM-SSC-PDD) - Version 03
CDM ndash Executive Board
37
Uncertainty level of data low
Maintenance and calibration as per manufacturer‟s specifications
or at least once every 3 years
Any comment
Data Parameter ID7 FVfuelledgas engineh
Data unit Nm3 hour
Description Volumetric flow of biogas recovered and fuelled (gas engine) at normal
conditions in the hour h
Source of data By project participant
Value of data ~ 509
Brief description of
measurement methods and
procedures to be applied
The volume of biogas will be measured with a normalised flow meter or
calculated from the volumetric flow of biogas pressure temperature
Biogas volume and methane content measurements shall be on the same
basis (wet or dry)
QAQC procedures to be
applied (if any) The biogas flow is monitored continuously recorded and stored
electronically in a data log file (DLF) (monthly or at shorter
interval)
Uncertainty level of data low
Maintenance and calibration as per manufacturer‟s specifications
or at least once every 3 years
Any comment
Data Parameter ID8 FVfuelledboilerh
Data unit Nm3 hour
Description Volumetric flow of biogas recovered and fuelled (boilers) at normal
conditions in the hour h
Source of data By project participant
Value of data ~ 0
Brief description of
measurement methods and
procedures to be applied
The volume of biogas will be measured with a normalised flow meter or
calculated from the volumetric flow of biogas pressure temperature
Biogas volume and methane content measurements shall be on the same
basis (wet or dry)
QAQC procedures to be
applied (if any) The biogas flow is monitored continuously recorded and stored
electronically in a data log file (DLF) (monthly or at shorter
interval)
Uncertainty level of data low
Maintenance and calibration as per manufacturer‟s specifications
or at least once every 3 years
Any comment
Data Parameter ID9 wCH4h
Data unit
Description Methane content in biogas in same basis (wetdry) as the biogas flows in
year y
Source of data By project participant using a gas analyzer
Value of data ~ 60
PROJECT DESIGN DOCUMENT FORM (CDM-SSC-PDD) - Version 03
CDM ndash Executive Board
38
Brief description of
measurement methods and
procedures to be applied
Using calibrated gas analyzer either continuous or periodical
measurement at confidenceprecision level of 9010
QAQC procedures to be
applied (if any) In case a continuous gas analyser is used data will be recorded
and stored electronically in a data log file (DLF) every hour or at
shorter interval
Uncertainty level of data low
Maintenance and calibration as per manufacturer‟s specifications
or at least once every 3 years
Any comment See also clarification by EB Meth Panel 30102009 ndash SSC_360
httpcdmunfcccintUserManagementFileStorageAM_CLAR_
QS83SX5B7WM6UGZE31JYQEQ4F65F6V
The biogas flow and the methane content measurements shall be
carried out close to each others
Data Parameter ID10 Tbiogas
Data unit ordmC
Description Temperature of biogas
Source of data Temperature probe
Value of data 20 ndash 65
Brief description of
measurement methods and
procedures to be applied
By project participant
QAQC procedures to be
applied (if any) Shall be measured and recorded at the same time when methane
content in biogas (ID8) is measured
Uncertainty level of data low
Maintenance and calibration as per manufacturer‟s specifications
or at least once every 3 years
Any comment Pressure and temperature are required to determine the density of
the methane If the biogas flow meter employed measures flow
pressure and temperature and displaysoutputs normalised flow of
biogas there is no need to separate monitoring of pressure and
temperature of the biogas
Data Parameter ID11 Pbiogas
Data unit Bar(g)
Description Pressure of biogas
Source of data By project participant
Value of data 50 ndash 200 mbar
Brief description of
measurement methods and
procedures to be applied
Pressure measurement device
QAQC procedures to be
applied (if any) Shall be measured and recorded at the same time when methane
content in biogas (ID8) is measured
Uncertainty level of data low
Maintenance and calibration as per manufacturer‟s specifications
or at least once every three (3) years
Any comment Pressure and temperature are required to determine the density of
the methane If the biogas flow meter employed measures flow
PROJECT DESIGN DOCUMENT FORM (CDM-SSC-PDD) - Version 03
CDM ndash Executive Board
39
pressure and temperature and displaysoutputs normalised flow of
biogas there is no need to separate monitoring of pressure and
temperature of the biogas
Shall be measured at the same time when methane content in
biogas (ID9) is measured
Parameter ID12 ηflareh (enclosed flare)
Unit
Description Enclosed flare efficiency in the hour h
Source of data Calculated
Value of data 0 or 50 or 90
Brief description of
measurement methods and
procedures to be applied
This yearly efficiency will be based on hourly flare efficiencies calculated
as per the provisions in the ldquoTool to determine project emissions from
flaring gases containing methanerdquo
The hourly flare efficiency will be calculated based on
0 if the temperature in the exhaust gas of the flare (Tflare) is
below 500 degC for more than 20 minutes during the hour h
50 if the temperature in the exhaust gas of the flare (Tflare) is
above 500 degC for more than 40 minutes during the hour h but the
manufacturer‟s specifications on proper operation of the flare are
not met at any point in time during the hour h
90 if the temperature in the exhaust gas of the flare (Tflare) is
above 500 degC for more than 40 minutes during the hour h and the
manufacturer‟s specifications on proper operation of the flare are
met continuously during the hour h
QAQC procedures to be
applied (if any) Data are logged hourly in a data log file (DLF)
Uncertainty level of data low
Any comment For enclosed flare
Or
Parameter ID13 ηflareh (open flare)
Unit
Description Flare efficiency in the hour h
Source of data Calculated
Value of data 0 or 50
Brief description of
measurement methods and
procedures to be applied
This yearly efficiency will be based on hourly flare efficiencies calculated
as per the provisions in the ldquoTool to determine project emissions from
flaring gases containing methanerdquo
The hourly flare efficiency will be calculated based on the duration of
time during which the flame is detected by the thermocouple (or flame
detector) installed in the open flare
Flare efficiency in hour h is based on default values
0 if the flame detected for not more than 20 minutes during the
hour h and
PROJECT DESIGN DOCUMENT FORM (CDM-SSC-PDD) - Version 03
CDM ndash Executive Board
40
50 if the flame detected for more than 20 minutes during the
hour h
A flame detector or thermocouple will be used
QAQC procedures to be
applied (if any) Data are logged hourly in a data log file (DLF)
Uncertainty level of data low
Any comment The only monitored parameter related to the flare is its efficiency Indeed
according to the clarification SSC_19927 of the methodology AMS IIIH
version 9 accepted by the SSC WG on the 3092008 ldquoIf a thermocouple
is used as a flame detection system it is sufficient to reach the given
minimum temperature from the manufacturer ldquo Hence it is not necessary
to monitor the temperature of the open type flares (Tflare)
Data Parameter ID14 ECPJjy
Data unit MWh
Description The yearly grid electricity consumption of the project activity for the year
bdquoy‟
Source of data Onsite instrument
Value of data ~749
Brief description of
measurement methods and
procedures to be applied
The grid electricity consumption of the project activity is measured
continuously with an energy meter (cumulative reading)
QAQC procedures to be
applied (if any) Data are monitored continuously and recorded periodically
(yearly or at shorter interval) in a data log file (DLF)
Uncertainty level of data low
Maintenance and calibration as per manufacturer‟s specifications
or at least once every three (3) years
Any comment
Data Parameter ID15 EGBLy
Data unit MWh
Description Quantity of net electricity generated and send to grid in year y
Source of data By project participant
Value of data ~ 6798
Brief description of
measurement methods and
procedures to be applied
The electricity generated and sent to grid is measured continuously with
an energy meter (cumulative readings)
QAQC procedures to be
applied (if any) Data are monitored continuously and recorded periodically
(yearly or at shorter interval) in a data log file (DLF)
Uncertainty level of data low
Maintenance and calibration as per manufacturer‟s specifications
or at least once every 3 years
Any comment As per AMS-ID
27 The clarification SSC_199 if available here (last access on the 24052011)
httpcdmunfcccintfilestorageAM_AM_CLAR_HIOZ5CS1PASC187C0JQ668L2E9RCRJResponse20WG20provided
20at20SSC20WG2017pdft=bU98MTMwNjIxNjY0OS4xMQ==|BOKHqtO94N6XF1N2N1vo8Ori-Rc=
PROJECT DESIGN DOCUMENT FORM (CDM-SSC-PDD) - Version 03
CDM ndash Executive Board
41
Or
Data Parameter ID16 EGmilly
Data unit MWh
Description Quantity of annual output of renewable energy sent to the mill in year y
Source of data By project participant
Value of data ~ 0
Brief description of
measurement methods and
procedures to be applied
The electricity generated and sent to mill to displace diesel use in diesel
gensets is measured continuously with an energy meter (cumulative
readings)
QAQC procedures to be
applied (if any) Data are monitored continuously and recorded periodically
(yearly or at shorter interval) in a data log file (DLF)
Uncertainty level of data low
Maintenance and calibration as per manufacturer‟s specifications
or at least once every 3 years
Any comment As per AMS-IA
Data Parameter ID17 Displacement of Biomass
Data unit Mt
Description Total amount of biomass (PKS) displaced from biomass boilers
Source of data Weighing bridge
Value of data Measurement at site
Brief description of
measurement methods and
procedures to be applied
Biomass (PKS) displaced due to the project activity will be weighed
using weighing bridge at the palm oil mill
QAQC procedures to be
applied (if any) Monthly calculation based on every single trip of trucks recorded
Data is recorded manually in a data log file based on the weighing
records
Maintenance and calibration as per manufacturer‟s specifications
Uncertainty level of data low
Any comment In the project activity the biomass (PKS) displaced will not be stored
under anaerobic conditions The conditions of onsite storage are identical
in the baseline as in the project activity The biomass will be sold to the
market on a regular basis PEbiomassy = 0
A final monitoring plan will be prepared prior the initial verification based on the as-built project activity
It will address the following aspects
MONITORING
The Project will be managed by CME with the involvement from Project Implementer CME will ensure
safety in operation of the plant as well as in the monitoring of emission reduction which is generated from
the project activity
CME will implement and be responsible for the monitoring plan Their responsibility covers operation of
the monitoring maintenance of the monitoring equipment data collection and archiving and
management of total scheme of the monitoring CME and Project Implementer will assign specific trained
PROJECT DESIGN DOCUMENT FORM (CDM-SSC-PDD) - Version 03
CDM ndash Executive Board
42
personnel during project implementation for the overall monitoring measurement and reporting of key
parameters as required in this PDD
DATA LOGGING AND STORAGE
The data measured by the instruments will be collected and stored in a data logging system The data will
be retrieved remotely by modem or directly on site
If data cannot be retrieved no emissions reductions will be claimed for the period of data failure The
data collected will be recorded in a central data base Access to production data will be restricted All
records and data (hard copy and soft copy) will be archived up to two years after the end of the crediting
period or the last issuance of CERs for this project activity whichever occurs later
CALIBRATION AND MAINTENANCE PROCEDURES MALFUNCTION OF EQUIPMENT
Maintenance includes all preventive and corrective actions necessary for the good functioning of the
equipment such as
Visual control of the equipment state and real-time check of displayed parameters
Cleaning up the equipment and the sensors
Adding lubricant
Replacement and change of defective parts
Calibration of equipment consists in verifying by comparison with a standard the accuracy of a
measuring instrument
Measuring instruments will be periodically and appropriately calibrated according to the procedures
timing and methods recommended by the manufacturer or nationalinternational standards as available
General malfunction of equipment
Daily inspections of the equipment will allow controlling equipment failure If equipment fails the
supplier will be notified and repairs will be carried out If the damaged equipment cannot be repaired it
will be replaced at the earliest In some cases portable tools will be used in order to carry out daily
monitoring of the missing parameter(s) In such case this data will be recorded manually
Discrepancies
To avoid discrepancies between projected data in the PDD and actual data (eg due to deferred starting
date malfunction of equipment) cross-checks between internal meter readings and external sources (eg
electricity invoices) will be carried out Any source of inconsistencies will be clarified
Case of emergency
For the case of emergency (earthquakes explosions fires etc) an emergency preparedness plan will be
adapted to the project activity All employees involved in the project on-site will be trained in the code of
conduct and required actions at time of commissioning of the plant
PROJECT DESIGN DOCUMENT FORM (CDM-SSC-PDD) - Version 03
CDM ndash Executive Board
43
OPERATIONAL AND MANAGEMENT STRUCTURE
The CDM monitoring team will be composed by the following staff
Position Report to
Operators
Project owner Supervisors (technicalmaintenance)
Operation Engineer
CDM monitoring project manager External CDM consultant
TRAINING OF MONITORING PERSONNEL
The maintenance will be conducted in-house by staff employed and trained by the Project Participants
Employees involved in the monitoring will be trained internally andor externally Training may include
inter alia
a) Review of equipment and captors
b) Calibration requirement
c) Configuration of monitoring equipment
d) Maintenance requirement
C1 Please indicate the level at which environmental analysis as per requirements of the CDM
modalities and procedures is undertaken Justify the choice of level at which the environmental
analysis is undertaken
radic Please tick if this information is provided at the PoA level In this case sections C2 and C3
need not be completed in this form
C2 Documentation on the analysis of the environmental impacts including transboundary
impacts
The host country does not require an analysis of environmental impacts As the project involves reduction
of GHG through recovery and controlled combustion which improves the quality of air therefore there
are no significant environmental impacts identified
C3 Please state whether an environmental impact assessment is required for a typical CPA
included in the programme of activities (PoA) in accordance with the host Party lawsregulations
In accordance with Malaysia environmental regulations Environmental Quality (Prescribed Activities
Environmental Impact Assessment) Order 1987 an Environmental Impact Assessment (EIA) is not
required for this CPA
PROJECT DESIGN DOCUMENT FORM (CDM-SSC-PDD) - Version 03
CDM ndash Executive Board
44
SECTION D Stakeholdersrsquo comments
D1 Please indicate the level at which local stakeholder comments are invited Justify the
choice
Please tick if this information is provided at the PoA level In this case sections D2 to D4 need
not be completed in this form
D2 Brief description how comments by local stakeholders have been invited and compiled
The stakeholder meeting was conducted at the office of Kilang Sawit Felda Triang on 05032012 There
were 37 stakeholders attending the consultation Posters were pasted at the guard house and at the
entrance to office 1 week before the stakeholder consultation to inform the locals stakeholders which
comprise mostly the workers of the mill 20 stakeholders out of the 37 who attended the consultation are
2nd generation of the Felda settlers who live in the vicinity to the project activity and adequately represent
the local community composed entirely of Felda settlers (no other people live in the vicinity of this
remote plantation) Continuous input of ideascomments were allowed to all stakeholders who could
either send their input though an email account especially setup for the biogas project or directly inform
the project proponents
During the meeting presentations were made by the project owner to outline the proposed project activity
in a non-technical manner (including environmental social and technological considerations) climate
change and the role of the CDM Attendees were given opportunity to raise their concern and opinion
about the proposed project activity during the question and answer session
D3 Summary of the comments received
PROJECT DESIGN DOCUMENT FORM (CDM-SSC-PDD) - Version 03
CDM ndash Executive Board
45
Below are the questions raised during the stakeholder meeting
NAME QUESTION
Mohd Tarmizi Bin Mat
Daud What is CDM in Bahasa Malaysia
Mohd Tarmizi Bin Mat
Daud What is DoE‟s standard for treated water released into river
Mohd Azizi Bin Abdul
Aziz
Would the biogas be captured from the existing effluent treatment ponds or a
new structure
Azhar Bin Abdul What to do with the captured biogas from the bioreactor
D4 Report on how due account was taken of any comments received
Below are the answers to the questions asked during the stakeholder meeting
QUESTION ANSWER
What is CDM in Bahasa Malaysia
The meaning of CDM in Bahasa Malaysia is Mekanisme
Pembangunan Bersih or in English is Clean Development
Mechanism
By Abd Karim Bin Mohd Zin
What is DoE‟s standard for treated
water released into river
The discharge standard for BOD into river is less than 100ppm
By Abd Karim Bin Mohd Zin
Would the biogas be captured from
the existing effluent treatment
ponds or a new structure
New bioreactor will be constructed to replace the existing anaerobic
lagoon treatment system The new bioreactor will capture the
biogas produced from this anaerobic treatment process
By Abd Karim Bin Mohd Zin
What to do with the captured
biogas from the bioreactor
The biogas recovered from the bioreactor will mainly contain
methane (approximately 60) and the rest are CO2 H2 and H2S
Currently the biogas is just released to the atmosphere from the
existing open lagoons system During the project activity captured
biogas will be combusted thus will improve the air quality
By Abd Karim Bin Mohd Zin
PROJECT DESIGN DOCUMENT FORM (CDM-SSC-PDD) - Version 03
CDM ndash Executive Board
46
Annex 1
CONTACT INFORMATION ON ENTITYINDIVIDUAL RESPONSIBLE FOR THE SMALL-
SCALE CPA
Organization Felda Palm Industries Sdn Bhd (359584-V)
StreetPOBox Jalan Gurney 1
Building Balai Felda 4th Floor
City Kuala Lumpur
StateRegion Wilayah Persekutuan
PostfixZIP 54000
Country Malaysia
Telephone (03) 2692 8066
FAX (03) 2693 4148
URL wwwfeldanetmy
Represented by
Title Head of Department
Salutation Mr
Last Name Busu
Middle Name
First Name Zainuri
Department Biomass
Mobile
Direct FAX
Direct tel
Personal E-Mail zainuribfeldanetmy
Organization Ably Carbon Sdn Bhd
StreetPOBox Jalan Ipoh Kecil
Building No 17
City Kuala Lumpur
StateRegion
PostfixZIP 50350
Country Malaysia
Telephone +60 3 4042 1177
FAX +60 3 4044 4166
E-Mail stephanevidailletably-carboncom
URL
Represented by Stephane Vidaillet
Title Chairman
Salutation Mr
Last Name Vidaillet
Middle Name
First Name Steacutephane
Department
Mobile +33 6 59111 5600
Direct FAX
PROJECT DESIGN DOCUMENT FORM (CDM-SSC-PDD) - Version 03
CDM ndash Executive Board
47
Direct tel
Personal E-Mail stephanevidailletably-carboncom
PROJECT DESIGN DOCUMENT FORM (CDM-SSC-PDD) - Version 03
CDM ndash Executive Board
48
Annex 2
INFORMATION REGARDING PUBLIC FUNDING
The project activity is not receiving any funding from parties included in Annex 1 of the Kyoto Protocol
SMALL-SCALE CDM PROGRAMME ACTIVITY DESIGN DOCUMENT FORM (CDM-SSC-CPA-DD) - Version 01
NAME TITLE OF THE PoA Biogas Recovery and Utilization PoA Projects in
Malaysia
CDM ndash Executive Board page 49
This template shall not be altered It shall be completed without modifyingadding headings or logo format or font
Annex 3
BASELINE INFORMATION
1 2
Year 2009 2010 2011 2012 2013 2014
FFB (mtyr) 343720 345910 310250 333293 333293 333293
POME Volume
(cumyr)[1] 343720 345910 310250 333293 333293 333293
Mill Opearing hour (hryr) 68865 69225 6209 6673 6673 6673
PKS (mtyr) 18905 19025 17064 18331 18331 18331
3 4 5 6 7 8 9 10
2015 2016 2017 2018 2019 2020 2021 2022
333293 333293 333293 333293 333293 333293 333293 333293
333293 333293 333293 333293 333293 333293 333293 333293
6673 6673 6673 6673 6673 6673 6673 6673
18331 18331 18331 18331 18331 18331 18331 18331
SMALL-SCALE CDM PROGRAMME ACTIVITY DESIGN DOCUMENT FORM (CDM-SSC-CPA-DD) - Version 01
NAME TITLE OF THE PoA Biogas Recovery and Utilization PoA Projects in
Malaysia
CDM ndash Executive Board page 50
This template shall not be altered It shall be completed without modifyingadding headings or logo format or font
10 days measurement campaign for baseline wastewater treatment system
Day Date
ETP
Inlet
Anaerobic
system (mgl)
Outlet
Anaerobic
system (mgl)
Outlet Algae
System (mgl)
Final
Discharge to
River (mgl)
1 23-Feb-12 35693 3120 811 603
2 25-Feb-12 19511 2559 1186 83
3 26-Feb-12 32864 2767 749 437
4 27-Feb-12 30195 2330 1210 404
5 28-Feb-12 32436 1927 1188 941
6 29-Feb-12 38259 4256 896 717
7 1-Mar-12 28717 3584 1232 695
8 3-Mar-12 31002 4660 1658 1210
9 4-Mar-12 22400 4346 1389 963
10 5-Mar-12 31226 4301 1971 1165
Average 30230 3385 1229 722
ETP
COD removal efficiency (anaerobic system) 8880
COD removal efficiency (Facultativealgae system) 6369
COD removal efficiency (Bio-polishing system) 4127
Total COD removal efficiency of the treatment system 9761
The COD of the raw effluent during ex-post may vary from the one year historical records depending on
the improvement of the production process (outside of project boundary) thus ERex-post may vary from the
estimated ERex-ante
SMALL-SCALE CDM PROGRAMME ACTIVITY DESIGN DOCUMENT FORM (CDM-SSC-CPA-DD) - Version 01
NAME TITLE OF THE PoA Biogas Recovery and Utilization PoA Projects in
Malaysia
CDM ndash Executive Board page 51
This template shall not be altered It shall be completed without modifyingadding headings or logo format or font
Annex 4
MONITORING INFORMATION
General information
Monitoring refers to the collection and archiving of all relevant data necessary for determining the
baseline measuring anthropogenic emissions by sources of greenhouse gases (GHG) within the project
boundary of a CDM project activity and leakage It includes developing suitable data collection methods
and data interpretation techniques for monitoring and verification of GHG emissions
On-line monitoring system
Most key meters required to determine GHG emissions and emission reductions will be monitored from a
central control point which will record meter readings at a pre-determined interval
Ensuring adequate maintenance and calibration of monitoring instruments
Specific maintenance repair or replacement of monitoring equipment will be recorded dated and
described
The calibration will occur at intervals determined on the basis of instrument manufacturers
recommendations stability purpose usage and history of repeatability Recalibration should be
performed whenever an event occurs that places the accuracy of the instrument in doubt
Calibration will take place at least once every three (3) years to ensure that the monitoring
equipments are properly installed and functioning properly
Calibration will be performed according to national or international standards
Last calibration certificates will be provided during periodic verification
Sampling procedure
Wherever a statistical sample is used for monitoring the ldquogeneral guidelines for sampling and surveys for
SSC project activitiesrdquo shall be used COD shall be measured from a composite sample to obtain a
representative value
Data archiving
The monitored data will be kept for a minimum of 2 years after the end of the crediting years by using
paper documents or electronic files
Identification of non-conformities
A verification of inconsistencies of the data recorded will be performed based for example on
The comparison of the calculated quantities of methane versus expected
Spot checks of field instruments (local reading) and data in the log file
Any discrepancies (completeness calculation errors transcription errors instrument calibration issues)
will be analyzed and actions taken to correct the problem
Ensuring adequate training of staff
All new staff members will undergo bdquoon job training‟ covering the monitoring requirements
The monitoring plan will be made available to staff member involved in the monitoring
A copy will be located in the control room at the site
SMALL-SCALE CDM PROGRAMME ACTIVITY DESIGN DOCUMENT FORM (CDM-SSC-CPA-DD) - Version 01
NAME TITLE OF THE PoA Biogas Recovery and Utilization PoA Projects in
Malaysia
CDM ndash Executive Board page 52
This template shall not be altered It shall be completed without modifyingadding headings or logo format or font
During the training the employees will sign a training attendance list All training records shall
be documented inclusive of training attendance training memo and training material if any
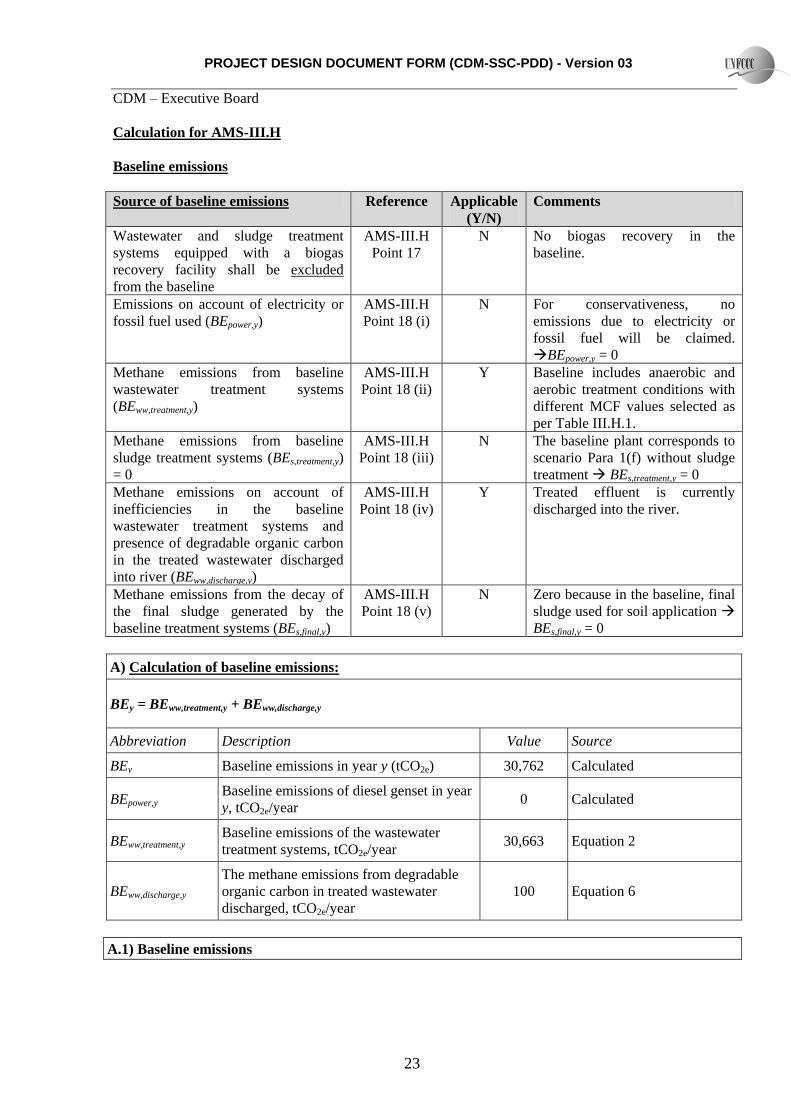
PROJECT DESIGN DOCUMENT FORM (CDM-SSC-PDD) - Version 03
CDM ndash Executive Board
25
UFBL Model correction factor to account for
model uncertainties 089 IPCC 2006
CODwwdischarge BLy Chemical oxygen demand of the treated
wastewater discharged into sea river or
lake in the baseline situation in the year y
(tonnesm3)
0000642 10 days measurement
campaign
MCFwwBLdischarge Methane correction factor based on
discharge pathway in the baseline situation
(eg into sea river or lake) of the
wastewater (fraction)
01 MCF values as per table
IIIH1 version 16
Project activity emissions
The project activity emission sources as per the methodology and their relevance with respect to the
proposed CDM project activity are given below in a tabular format
Source of project activity
emission Reference
Applicable
(YN) Comments
CO2 emissions on account of
power and fossil fuel used by
the project activity facilities
(PEpowery)
AMS-IIIH
point 29(i)
Y The project activity uses the electricity
imported from the national grid
Methane emissions from
wastewater treatment systems
affected by the project
activity and not equipped with
biogas recovery in the project
situation (PEwwtreatmenty)
AMS-IIIH
point 29 (ii)
Y CH4 emissions from the poorly managed
aerobic lagoons
Methane emissions from
sludge treatment systems
affected by the project
activity and not equipped with
biogas recovery in the project
situation (PEstreatmenty)
AMS-IIIH
point 29 (iii)
N The project activity corresponds to
scenario (vi) without sludge treatment
PEystreatmenty = 0
Methane emissions on account
of inefficiency of the project
activity wastewater treatment
systems and presence of
degradable organic carbon in
treated wastewater
(PEwwdischargey)
AMS-IIIH
point 29 (iv)
Y Treated effluent from ETP will be
discharged into river
Methane emissions from the
decay of the final sludge
generated by the project
activity treatment systems
(PEsfinaly)
AMS-IIIH
point 29 (v)
N In the proposed CDM project activity
final sludge is used for soil application in
the same manner as in the baseline
PEsfinaly = 0
PROJECT DESIGN DOCUMENT FORM (CDM-SSC-PDD) - Version 03
CDM ndash Executive Board
26
Methane fugitive emissions on
account of inefficiencies in
capture systems (PEfugitivey)
AMS-IIIH
point 29 (vi)
Y Applicable to PEfugitivewwy
N The project activity corresponds to
scenario (vi) without sludge treatment
PEfugitivesy = 0
Methane emissions due to
incomplete flaring (PEflaringy)
AMS-IIIH
point 29 (vii)
Y Enclosed flaring system installed
Methane emissions from
biomass stored under
anaerobic conditions which
does not take place in the
baseline situation (PEbiomassy)
AMS-IIIH
point 29
(viii)
N In the project activity the biomass (PKS
+ mesocarp fibres) displaced will not be
stored under anaerobic conditions The
conditions of onsite storage are identical
in the baseline as in the project activity
The biomass will be sold to the market
on a regular basis PEbiomassy = 0
B) Calculation of project emissions
PEy = PEpowery + PEwwtreatmenty + PEww discharge y + PEfugitive y + PEflaring y
Abbreviation Description Value Source
PEy Project activity emissions in the year y
(tCO2eyr) 6050 Equation 8
PEpowery CO2 emissions on account of power used
by the project activity facilities (tCO2eyr) 604 -
PEwwtreatmenty Methane emissions from wastewater
treatment systems affected by the project
activity and not equipped with biogas
recovery in year y (tCO2eyr)
1523 Equation 9
PEwwdischargey
Methane emissions on account of
inefficiency of the project activity
wastewater treatment systems and presence
of degradable organic carbon in treated
wastewater (tCO2eyr)
126 Equation 12
PEfugitivey Methane fugitive emissions on account of
inefficiencies in capture systems (tCO2eyr) 3796 Equation 15
PEflaringy Methane emissions due to incomplete
flaring (tCO2eyr) 0 Equation 19
B1) Project emissions from CO2 emissions on account of power and fuel used by the project activity
facilities in year ldquoyrdquo in tCO2eyear
PEpowery = ECPJjy EFgridy
Abbreviation Description Value Source
PEpowery Project emissions from electricity
consumption in the year y (tCO2eyr) 604 Calculated
ECPJjy Internal power consumption from the grid 749 100 kW is the effective
PROJECT DESIGN DOCUMENT FORM (CDM-SSC-PDD) - Version 03
CDM ndash Executive Board
27
(MWh year) power based on the
equipments installed at the
site
EFgridy Grid Emission factor in Peninsular
Malaysia 2008 (tCO2 MWh) 0672
Study on Grid Connected
Electricity Baselines in
Malaysia 2008 published in
2010 by PTM
B2) Methane emissions from wastewater treatment systems affected by the project activity and not
equipped with biogas recovery in the project situation in year ldquoyrdquo in tCO2e
Equation 9 PEwwtreatment y = Qwwky CODinflowk y PJky MCFwwtreatmentPJk) Boww UFPJ GWPCH4
Abbreviation Description Value Source
PEwwtreatmenty
Methane emissions from wastewater
treatment systems affected by the project
activity and not equipped with biogas
recovery in the project situation (tCO2eyr)
1523 Calculated
Qwwky Volume of wastewater treated in project
activity wastewater treatment system k in
year y (m3year)
333293
Volume based on 10 m3mt
FFB23 amp FFB historical data
(2009 ndash 2011)
CODinflowky Chemical oxygen demand of the
wastewater inflow to the project activity
treatment system k in year y (tonnes COD
m3)
0002690 10 days measurement
campaign
PJky Chemical oxygen demand removal
efficiency of the project wastewater
treatment system k in year y (tm3)
measured based on inflow COD and
outflow COD in system k
90 Based on bio-digester COD
removal efficiency of 90
MCFwwtreatmentPJk Methane correction factor for project
wastewater treatment system k (MCF
values as per table IIIH1)
03
MCF values table IIIH1
Version 16 ndash aerobic poorly
managed (conservative)
Boww Methane generation capacity of the treated
wastewater (kg CH4kg COD) 025 IPCC 2006
UFPJ Model correction factor to account for
model uncertainties 112
IPCC 2006
GWPCH4 Global warming potential of methane 21 IPCC 2006
23 Mill designed data for baseline effluent treatment plant
PROJECT DESIGN DOCUMENT FORM (CDM-SSC-PDD) - Version 03
CDM ndash Executive Board
28
B3) Methane emissions on account of inefficiency of the project activity wastewater treatment
systems and presence of degradable organic carbon in treated wastewater in the year ldquoyrdquo (tonnes)
Equation 12 PEwwdischarge y = Qwwy GWPCH4 Boww UFPJ CODwwdischargePJy MCFwwPJdischarge
Abbreviation Description Value Source
PEwwdischargey
Methane emissions from degradable
organic carbon in treated wastewater
(tCO2eyr)
126 Calculated
Qwwy Quantity of wastewater treated in year y
(m3year) 333293
Volume based on 10 m3mt
FFB24 amp FFB historical data
(2009 ndash 2011)
CODwwdischargedPJ
y
Chemical oxygen demand of the treated
wastewater discharged into river in the
project situation in year y (tCOD m3)
0000642 10 days measurement
campaign
MCFwwPJ discharge
Methane correction factor based on
discharge pathway in the project situation
(river) of the wastewater (fraction)
01 MCF values as per table
IIIH1 Version 16
Boww Methane generation capacity of the treated
wastewater (kg CH4kg COD) 025 IPCC 2006
UFPJ Model correction factor to account for
model uncertainties 112 IPCC 2006
GWPCH4 Global warming potential of methane 21 IPCC 2006
B41) Methane fugitive emissions on account of inefficiencies in capture systems in the year ldquoyrdquo
(tonnes)
Equation 15 PEfugitivewwy = (1 ndash CFEww ) MEPywwtreatment GWPCH4
Abbreviation Description Value Source
PEfugitivey Methane fugitive emissions on account of
inefficiencies in capture systems (tCO2eyr) 3796 Calculated
CFEww Capture efficiency of the biogas recovery
equipment in the wastewater treatment
systems
09 AMS IIIH Version 16
MEPywwtreatment Methane emission potential of wastewater
treatment systems equipped with biogas
recovery system in year y (tCH4yr)
1808 Refer Equation 11 of AMS
IIIH version 16
GWPCH4 Global warming potential of methane 21 IPCC 2006
B42) Methane emission potential of wastewater treatment plant in the year ldquoyrdquo (tonnes)
Equation 16 MEPwwtreatmenty = Qwwy Boww UFPJ (CODremovedPJky MCFwwtreatmentPJk)
24 Mill designed data for baseline effluent treatment plant
PROJECT DESIGN DOCUMENT FORM (CDM-SSC-PDD) - Version 03
CDM ndash Executive Board
29
Abbreviation Description Value Source
MEPwwtreatmenty Methane emission potential of wastewater
treatment systems equipped with biogas
recovery system in year y (tonnes CH4yr)
1808 Calculated
Qyww Quantity of wastewater treated in year y
(m3year) 333293
Volume based on 10 m3mt
FFB25 amp FFB historical data
(2009 ndash 2011)
Boww Methane generation capacity of the treated
wastewater (kg CH4kg COD) 025 IPCC 2006
CODremovedPJy
The chemical oxygen demand removed by
the treatment anaerobic system of the
project activity equipped with biogas
recovery in the year y (tCOD m3)
0024214
10 days measurement
campaign amp bio-digester
design parameter
MCFwwtreatmentPJ
Methane correction factor for the project
wastewater treatment system k equipped
with biogas recovery equipment
08 MCF values as per table
IIIH1 Version 16
UFPJ Model correction factor to account for
model uncertainties 112 IPCC 2006
B5) Methane emissions due to incomplete flaring in the year ldquoyrdquo (tonnes)
Equation 13a PEflaringy = TMflaredy (1 - ηflarey) GWPCH4
Abbreviation Description Value Source
PEflaringy Methane emissions due to incomplete
flaring (tCO2eyr) 0 Calculated
TMflaredh Mass flow rate of methane flared in dry
basis in the hour h (tCH4 yr) 0 Calculated
ηflarey Flare efficiency in hour h based on default
values 50
Tools for methane flaring
(open flare) for conservative
GWPCH4 Global warming potential of methane 21 IPCC 2006
Leakage emissions
No leakage emission will occur in the project activity
LEy1 = 0
Emission reductions
Equation 22 ERy ex ante = BEy ex ante ndash (PEy ex ante + LEy ex ante)
25 Mill designed data for baseline effluent treatment plant
PROJECT DESIGN DOCUMENT FORM (CDM-SSC-PDD) - Version 03
CDM ndash Executive Board
30
Abbreviation Description Value Source
ERy1 ex ante Ex ante emission reduction in year y
(tCO2e) 24712 Equation 22
BEy1 ex ante Ex ante baseline emissions in year y
(tCO2e) 30762 Equation 1
PEy1 ex ante Ex ante project emissions in year y (tCO2e) 6050 Equation 8
LEy1 ex ante Ex ante Leakage emissions in year y
(tCO2e) 0 -
Calculation for AMS-ID
Baseline emissions
Electricity generated from biogas engines will be exported to the Peninsular Malaysia National Grid The
baseline emissions are described in AMS-ID (Version 17 EB 61) as the ldquoproduct of electrical energy
baseline expressed in kWh of electricity produced by the renewable energy generating unit multiplied by
an emission factorrdquo
Baseline emissions due to electricity exported to the grid in the year ldquoyrdquo (tonnes)
BEEGy = EGBLy EFCO2gridy
Abbreviation Description Value Source
BEEGy Baseline emissions in year y (tCO2eyr) 4568 Calculated
EGBLy
Quantity of net electricity supplied to the
grid as a result of the implementation of the
project activity in year y (kWh yr)
6797625 Calculated
EFCO2gridy
CO2 emission factor of the grid in year
(tCO2kWh) 0672
Study on Grid Connected
Electricity Baselines in
Malaysia 2008 published in
2010 by PTM
Project Activity Emissions
As per AMS-ID (Version 17 EB 61) project emissions for renewable energy project activities are zero
PEEGy = 0
Leakage
If the energy generating equipment is transferred from another activity leakage is to be considered
No leakage emission will occur in the project activity LEy = 0
PROJECT DESIGN DOCUMENT FORM (CDM-SSC-PDD) - Version 03
CDM ndash Executive Board
31
Emission reductions
ERy = BEy ndash PEy - LEy
Abbreviation Description Value Source
ERy Emission reduction in year y (tCO2ey) 4568 -
BEy Baseline emissions in year y (tCO2ey) 4568 -
PEy Project emissions in year y (tCO2ey) 0 -
LEy Leakage emissions in year y (tCO2ey) 0 -
Calculation for AMS-IA
Baseline emissions
The energy baseline is the fuel consumption of the technology in use or that would have been used in the
absence of the project activity to generate the equivalent quantity of energy Option 2 is applied This
methodology is only apply shall the recovered is in excess after export to the grid
Annual electricity sent to the mill for FF displacement in the year ldquoyrdquo (kWh)
EBLy = ΣEGiy (1 ndash l)
Abbreviation Description Value Source
EBLy Annual energy baseline (kWhyr) Calculated
EGiy
The estimated annual output of the
renewable energy technologies of the group
of i renewable energy technologies
installed (kWhyr)
0 Estimated
l
Average technical distribution losses that
would have been observed in diesel
powered mini-grids installed by public
programmes or distribution companies in
isolated areas expressed as a fraction
0 Conservative by applying
Zero (0)
Baseline electricity sent to the mill for FF displacement in the year ldquoyrdquo (tonnes)
BECO2y = EBLy EFCO2
Abbreviation Description Value Source
BECO2y Baseline emission in the year y (tCO2yr) 0 Calculated
EBLy Annual energy baseline (kWhyr) 0 Calculated
EFCO2 CO2 emission factor (tCO2kWh) 08
Default value which is
derived from diesel
generation units is used
PROJECT DESIGN DOCUMENT FORM (CDM-SSC-PDD) - Version 03
CDM ndash Executive Board
32
Project Activity Emissions
As per AMS-IA (Version 14 EB 54) project emissions for renewable energy project activities are zero
PEy = 0
Leakage
If the energy generating equipment is transferred from another activity or if the existing equipment is
transferred to another activity leakage is to be considered
No leakage emission will occur in the project activity LEy = 0
B53 Summary of the ex-ante estimation of emission reductions
Estimated emission reductions (total project activity)
Year
Estimation of
project activity
emissions (tCO2e)
Estimation of
baseline emissions
(tCO2e)
Estimation of
leakage (tCO2e)
Estimation of
overall emission
reductions (tCO2e)
2012 504 2944 0 2440
2013 6050 35330 0 29280
2014 6050 35330 0 29280
2015 6050 35330 0 29280
2016 6050 35330 0 29280
2017 6050 35330 0 29280
2018 6050 35330 0 29280
2019 5546 32386 0 26840
Total (tCO2) 42350 247310 0 204960
The starting date of the crediting period is 01122012 or the date of registration whichever is later
Estimated emission reductions for AMS-IIIH
Year
Estimation of
project activity
emissions (tCO2e)
Estimation of
baseline emissions
(tCO2e)
Estimation of
leakage (tCO2e)
Estimation of
overall emission
reductions (tCO2e)
2012 504 2563 0 2059
2013 6050 30762 0 24712
PROJECT DESIGN DOCUMENT FORM (CDM-SSC-PDD) - Version 03
CDM ndash Executive Board
33
2014 6050 30762 0 24712
2015 6050 30762 0 24712
2016 6050 30762 0 24712
2017 6050 30762 0 24712
2018 6050 30762 0 24712
2019 5546 28199 0 22653
Total (tCO2) 42350 215334 0 172984
The starting date of the crediting period is 01122012 or the date of registration whichever is later
Estimated emission reductions for AMS-ID
Year
Estimation of
project activity
emissions (tCO2e)
Estimation of
baseline emissions
(tCO2e)
Estimation of
leakage (tCO2e)
Estimation of
overall emission
reductions (tCO2e)
2012 0 381 0 381
2013 0 4568 0 4568
2014 0 4568 0 4568
2015 0 4568 0 4568
2016 0 4568 0 4568
2017 0 4568 0 4568
2018 0 4568 0 4568
2019 0 4187 0 4187
Total (tCO2) 0 31976 0 31976
The starting date of the crediting period is 01122012 or the date of registration whichever is later
Estimated emission reductions for AMS-IA
Year
Estimation of
project activity
emissions (tCO2e)
Estimation of
baseline emissions
(tCO2e)
Estimation of
leakage (tCO2e)
Estimation of
overall emission
reductions (tCO2e)
2012 0 0 0 0
2013 0 0 0 0
2014 0 0 0 0
2015 0 0 0 0
2016 0 0 0 0
PROJECT DESIGN DOCUMENT FORM (CDM-SSC-PDD) - Version 03
CDM ndash Executive Board
34
2017 0 0 0 0
2018 0 0 0 0
2019 0 0 0 0
Total (tCO2) 0 0 0 0
The starting date of the crediting period is 01122012 or the date of registration whichever is later
B6 Application of the monitoring methodology and description of the monitoring plan
B61 Description of the monitoring plan
The parameters to be monitored are
Please note that the amount of methane recovered and fuelled or flared (MDy ) is calculated as follows
MDy = TMfuelledy + TMflaredy Equation A
Where Description Units
MDy Quantity of methane recovered and fuelled or flared in the year y tonnes CH4year
TMfuelledy Quantity of methane fuelled in the year y tonnes CH4year
TMflaredy Quantity of methane flared in year y tonnes CH4year
Where
TMfuelledy = FVfuelledh fvCH4h ηfuelledh ρCH4n) 1000 Equation B
Where Description Units
TMfuelledy Quantity of methane fuelled in the year y tonnes CH4year
FVfuelledh Volumetric flow rate of the fuelled biogas gas at normal conditions in
hour h
Nm3 biogashour
ηfuelledh 100 for gainful purpose26
fvCH4h Volumetric fraction of methane in the biogas gas in the hour h
ρCH4n Density of methane at normal conditions kgCH4Nm3CH4
And
TMflaredy = FVflaredh fvCH4h ηflareh ρCH4n) 1000 Equation C
Where Description Units
TMflaredy Quantity of methane flared in year y tonnes CH4year
FVflaredh Volumetric flow rate of the flared biogas gas at normal conditions in
hour h
Nm3 biogashour
26 AMS-IIIH point 35
PROJECT DESIGN DOCUMENT FORM (CDM-SSC-PDD) - Version 03
CDM ndash Executive Board
35
ηflareh Flare efficiency in the hour h
fvCH4h Volumetric fraction of methane in the biogas gas in the hour h
ρCH4n Density of methane at normal conditions kgCH4Nm3CH4
Data Parameter ID1 Qwwy
Data unit m3 month
Description The flow of wastewater entering the bio-digester
Source of data Measurement by project participant by using a flowmeter
Value of data ~ 28000
Brief description of
measurement methods and
procedures to be applied
The flow is measured with an online flow meter or equivalent
QAQC procedures to be
applied (if any) Data are monitored continuously and recorded periodically
(monthly or at shorter interval) in a data log file (DLF)
Uncertainty level of data low
Maintenance and calibration as per manufacturer‟s specifications
or at least once every three (3) years
Any comment
Data Parameter ID2 CODwwuntreatedy
Data unit tCOD m3
Description Raw COD of wastewater entering the bio-digester
Source of data Laboratory (internal and external)
Value of data ~ 0030230
Brief description of
measurement methods and
procedures to be applied
Measure of COD according to national or international standards
COD is measure through representative sampling
QAQC procedures to be
applied (if any) Minimum once a month COD sampling to ensure a 9010
confidenceprecision level
COD reports are recorded manually
Uncertainty level of data low
Maintenance and calibration as per manufacturer‟s specifications
or at least once every three (3) years for internal laboratory
equipment
Any comment
Data Parameter ID3 CODwwtreatedy
Data unit tCOD m3
Description COD of treated wastewater leaving the bio-digester
Source of data Laboratory (internal and external)
Value of data ~ 0003023
Brief description of
measurement methods and
procedures to be applied
Measure of COD according to national or international standards
COD is measure through representative sampling
QAQC procedures to be
applied (if any) Minimum once a month COD sampling to ensure a 9010
confidenceprecision level
COD reports are recorded manually
Uncertainty level of data low
PROJECT DESIGN DOCUMENT FORM (CDM-SSC-PDD) - Version 03
CDM ndash Executive Board
36
Maintenance and calibration as per manufacturer‟s specifications
or at least once every three (3) years for internal laboratory
equipment
Any comment
Data Parameter ID5 End-use of the final sludge
Data unit ndash
Description The final sludge generated by the project activity will be sent to control
landfill site if any
Source of data By project participant
Value of data ndash
Brief description of
measurement methods and
procedures to be applied
The final disposal of the sludge will be monitored during the crediting
period if any For each disposal of the sludge the following will be
recorded disposal site and date of disposal
QAQC procedures to be
applied (if any)
Any comment
Data Parameter ID6 FVflaredh
Data unit Nm3 hour
Description Volumetric flow of biogas recovered and flared at normal conditions in
the hour h
Source of data By project participant
Value of data 0
Brief description of
measurement methods and
procedures to be applied
The volume of biogas will be measured with a normalised flow meter or
calculated from the volumetric flow pressure temperature
Biogas volume and methane content measurements shall be on the same
basis (wet or dry)
QAQC procedures to be
applied (if any) The biogas flow is monitored continuously recorded and stored
electronically in a data log file (DLF) (monthly or at shorter
interval)
Data Parameter ID4 CODww dischargey
Data unit tCOD m3
Description COD of treated wastewater discharge into river by treatment system
Source of data Laboratory (internal and external)
Value of data ~ 0000100
Brief description of
measurement methods and
procedures to be applied
Measure of COD according to national or international standards
COD is measure through representative sampling
QAQC procedures to be
applied (if any) Minimum once a month COD sampling to ensure a 9010
confidenceprecision level
COD reports are recorded manually
Uncertainty level of data low
Maintenance and calibration as per manufacturer‟s specifications
or at least once every three (3) years for internal laboratory
equipment
Any comment
PROJECT DESIGN DOCUMENT FORM (CDM-SSC-PDD) - Version 03
CDM ndash Executive Board
37
Uncertainty level of data low
Maintenance and calibration as per manufacturer‟s specifications
or at least once every 3 years
Any comment
Data Parameter ID7 FVfuelledgas engineh
Data unit Nm3 hour
Description Volumetric flow of biogas recovered and fuelled (gas engine) at normal
conditions in the hour h
Source of data By project participant
Value of data ~ 509
Brief description of
measurement methods and
procedures to be applied
The volume of biogas will be measured with a normalised flow meter or
calculated from the volumetric flow of biogas pressure temperature
Biogas volume and methane content measurements shall be on the same
basis (wet or dry)
QAQC procedures to be
applied (if any) The biogas flow is monitored continuously recorded and stored
electronically in a data log file (DLF) (monthly or at shorter
interval)
Uncertainty level of data low
Maintenance and calibration as per manufacturer‟s specifications
or at least once every 3 years
Any comment
Data Parameter ID8 FVfuelledboilerh
Data unit Nm3 hour
Description Volumetric flow of biogas recovered and fuelled (boilers) at normal
conditions in the hour h
Source of data By project participant
Value of data ~ 0
Brief description of
measurement methods and
procedures to be applied
The volume of biogas will be measured with a normalised flow meter or
calculated from the volumetric flow of biogas pressure temperature
Biogas volume and methane content measurements shall be on the same
basis (wet or dry)
QAQC procedures to be
applied (if any) The biogas flow is monitored continuously recorded and stored
electronically in a data log file (DLF) (monthly or at shorter
interval)
Uncertainty level of data low
Maintenance and calibration as per manufacturer‟s specifications
or at least once every 3 years
Any comment
Data Parameter ID9 wCH4h
Data unit
Description Methane content in biogas in same basis (wetdry) as the biogas flows in
year y
Source of data By project participant using a gas analyzer
Value of data ~ 60
PROJECT DESIGN DOCUMENT FORM (CDM-SSC-PDD) - Version 03
CDM ndash Executive Board
38
Brief description of
measurement methods and
procedures to be applied
Using calibrated gas analyzer either continuous or periodical
measurement at confidenceprecision level of 9010
QAQC procedures to be
applied (if any) In case a continuous gas analyser is used data will be recorded
and stored electronically in a data log file (DLF) every hour or at
shorter interval
Uncertainty level of data low
Maintenance and calibration as per manufacturer‟s specifications
or at least once every 3 years
Any comment See also clarification by EB Meth Panel 30102009 ndash SSC_360
httpcdmunfcccintUserManagementFileStorageAM_CLAR_
QS83SX5B7WM6UGZE31JYQEQ4F65F6V
The biogas flow and the methane content measurements shall be
carried out close to each others
Data Parameter ID10 Tbiogas
Data unit ordmC
Description Temperature of biogas
Source of data Temperature probe
Value of data 20 ndash 65
Brief description of
measurement methods and
procedures to be applied
By project participant
QAQC procedures to be
applied (if any) Shall be measured and recorded at the same time when methane
content in biogas (ID8) is measured
Uncertainty level of data low
Maintenance and calibration as per manufacturer‟s specifications
or at least once every 3 years
Any comment Pressure and temperature are required to determine the density of
the methane If the biogas flow meter employed measures flow
pressure and temperature and displaysoutputs normalised flow of
biogas there is no need to separate monitoring of pressure and
temperature of the biogas
Data Parameter ID11 Pbiogas
Data unit Bar(g)
Description Pressure of biogas
Source of data By project participant
Value of data 50 ndash 200 mbar
Brief description of
measurement methods and
procedures to be applied
Pressure measurement device
QAQC procedures to be
applied (if any) Shall be measured and recorded at the same time when methane
content in biogas (ID8) is measured
Uncertainty level of data low
Maintenance and calibration as per manufacturer‟s specifications
or at least once every three (3) years
Any comment Pressure and temperature are required to determine the density of
the methane If the biogas flow meter employed measures flow
PROJECT DESIGN DOCUMENT FORM (CDM-SSC-PDD) - Version 03
CDM ndash Executive Board
39
pressure and temperature and displaysoutputs normalised flow of
biogas there is no need to separate monitoring of pressure and
temperature of the biogas
Shall be measured at the same time when methane content in
biogas (ID9) is measured
Parameter ID12 ηflareh (enclosed flare)
Unit
Description Enclosed flare efficiency in the hour h
Source of data Calculated
Value of data 0 or 50 or 90
Brief description of
measurement methods and
procedures to be applied
This yearly efficiency will be based on hourly flare efficiencies calculated
as per the provisions in the ldquoTool to determine project emissions from
flaring gases containing methanerdquo
The hourly flare efficiency will be calculated based on
0 if the temperature in the exhaust gas of the flare (Tflare) is
below 500 degC for more than 20 minutes during the hour h
50 if the temperature in the exhaust gas of the flare (Tflare) is
above 500 degC for more than 40 minutes during the hour h but the
manufacturer‟s specifications on proper operation of the flare are
not met at any point in time during the hour h
90 if the temperature in the exhaust gas of the flare (Tflare) is
above 500 degC for more than 40 minutes during the hour h and the
manufacturer‟s specifications on proper operation of the flare are
met continuously during the hour h
QAQC procedures to be
applied (if any) Data are logged hourly in a data log file (DLF)
Uncertainty level of data low
Any comment For enclosed flare
Or
Parameter ID13 ηflareh (open flare)
Unit
Description Flare efficiency in the hour h
Source of data Calculated
Value of data 0 or 50
Brief description of
measurement methods and
procedures to be applied
This yearly efficiency will be based on hourly flare efficiencies calculated
as per the provisions in the ldquoTool to determine project emissions from
flaring gases containing methanerdquo
The hourly flare efficiency will be calculated based on the duration of
time during which the flame is detected by the thermocouple (or flame
detector) installed in the open flare
Flare efficiency in hour h is based on default values
0 if the flame detected for not more than 20 minutes during the
hour h and
PROJECT DESIGN DOCUMENT FORM (CDM-SSC-PDD) - Version 03
CDM ndash Executive Board
40
50 if the flame detected for more than 20 minutes during the
hour h
A flame detector or thermocouple will be used
QAQC procedures to be
applied (if any) Data are logged hourly in a data log file (DLF)
Uncertainty level of data low
Any comment The only monitored parameter related to the flare is its efficiency Indeed
according to the clarification SSC_19927 of the methodology AMS IIIH
version 9 accepted by the SSC WG on the 3092008 ldquoIf a thermocouple
is used as a flame detection system it is sufficient to reach the given
minimum temperature from the manufacturer ldquo Hence it is not necessary
to monitor the temperature of the open type flares (Tflare)
Data Parameter ID14 ECPJjy
Data unit MWh
Description The yearly grid electricity consumption of the project activity for the year
bdquoy‟
Source of data Onsite instrument
Value of data ~749
Brief description of
measurement methods and
procedures to be applied
The grid electricity consumption of the project activity is measured
continuously with an energy meter (cumulative reading)
QAQC procedures to be
applied (if any) Data are monitored continuously and recorded periodically
(yearly or at shorter interval) in a data log file (DLF)
Uncertainty level of data low
Maintenance and calibration as per manufacturer‟s specifications
or at least once every three (3) years
Any comment
Data Parameter ID15 EGBLy
Data unit MWh
Description Quantity of net electricity generated and send to grid in year y
Source of data By project participant
Value of data ~ 6798
Brief description of
measurement methods and
procedures to be applied
The electricity generated and sent to grid is measured continuously with
an energy meter (cumulative readings)
QAQC procedures to be
applied (if any) Data are monitored continuously and recorded periodically
(yearly or at shorter interval) in a data log file (DLF)
Uncertainty level of data low
Maintenance and calibration as per manufacturer‟s specifications
or at least once every 3 years
Any comment As per AMS-ID
27 The clarification SSC_199 if available here (last access on the 24052011)
httpcdmunfcccintfilestorageAM_AM_CLAR_HIOZ5CS1PASC187C0JQ668L2E9RCRJResponse20WG20provided
20at20SSC20WG2017pdft=bU98MTMwNjIxNjY0OS4xMQ==|BOKHqtO94N6XF1N2N1vo8Ori-Rc=
PROJECT DESIGN DOCUMENT FORM (CDM-SSC-PDD) - Version 03
CDM ndash Executive Board
41
Or
Data Parameter ID16 EGmilly
Data unit MWh
Description Quantity of annual output of renewable energy sent to the mill in year y
Source of data By project participant
Value of data ~ 0
Brief description of
measurement methods and
procedures to be applied
The electricity generated and sent to mill to displace diesel use in diesel
gensets is measured continuously with an energy meter (cumulative
readings)
QAQC procedures to be
applied (if any) Data are monitored continuously and recorded periodically
(yearly or at shorter interval) in a data log file (DLF)
Uncertainty level of data low
Maintenance and calibration as per manufacturer‟s specifications
or at least once every 3 years
Any comment As per AMS-IA
Data Parameter ID17 Displacement of Biomass
Data unit Mt
Description Total amount of biomass (PKS) displaced from biomass boilers
Source of data Weighing bridge
Value of data Measurement at site
Brief description of
measurement methods and
procedures to be applied
Biomass (PKS) displaced due to the project activity will be weighed
using weighing bridge at the palm oil mill
QAQC procedures to be
applied (if any) Monthly calculation based on every single trip of trucks recorded
Data is recorded manually in a data log file based on the weighing
records
Maintenance and calibration as per manufacturer‟s specifications
Uncertainty level of data low
Any comment In the project activity the biomass (PKS) displaced will not be stored
under anaerobic conditions The conditions of onsite storage are identical
in the baseline as in the project activity The biomass will be sold to the
market on a regular basis PEbiomassy = 0
A final monitoring plan will be prepared prior the initial verification based on the as-built project activity
It will address the following aspects
MONITORING
The Project will be managed by CME with the involvement from Project Implementer CME will ensure
safety in operation of the plant as well as in the monitoring of emission reduction which is generated from
the project activity
CME will implement and be responsible for the monitoring plan Their responsibility covers operation of
the monitoring maintenance of the monitoring equipment data collection and archiving and
management of total scheme of the monitoring CME and Project Implementer will assign specific trained
PROJECT DESIGN DOCUMENT FORM (CDM-SSC-PDD) - Version 03
CDM ndash Executive Board
42
personnel during project implementation for the overall monitoring measurement and reporting of key
parameters as required in this PDD
DATA LOGGING AND STORAGE
The data measured by the instruments will be collected and stored in a data logging system The data will
be retrieved remotely by modem or directly on site
If data cannot be retrieved no emissions reductions will be claimed for the period of data failure The
data collected will be recorded in a central data base Access to production data will be restricted All
records and data (hard copy and soft copy) will be archived up to two years after the end of the crediting
period or the last issuance of CERs for this project activity whichever occurs later
CALIBRATION AND MAINTENANCE PROCEDURES MALFUNCTION OF EQUIPMENT
Maintenance includes all preventive and corrective actions necessary for the good functioning of the
equipment such as
Visual control of the equipment state and real-time check of displayed parameters
Cleaning up the equipment and the sensors
Adding lubricant
Replacement and change of defective parts
Calibration of equipment consists in verifying by comparison with a standard the accuracy of a
measuring instrument
Measuring instruments will be periodically and appropriately calibrated according to the procedures
timing and methods recommended by the manufacturer or nationalinternational standards as available
General malfunction of equipment
Daily inspections of the equipment will allow controlling equipment failure If equipment fails the
supplier will be notified and repairs will be carried out If the damaged equipment cannot be repaired it
will be replaced at the earliest In some cases portable tools will be used in order to carry out daily
monitoring of the missing parameter(s) In such case this data will be recorded manually
Discrepancies
To avoid discrepancies between projected data in the PDD and actual data (eg due to deferred starting
date malfunction of equipment) cross-checks between internal meter readings and external sources (eg
electricity invoices) will be carried out Any source of inconsistencies will be clarified
Case of emergency
For the case of emergency (earthquakes explosions fires etc) an emergency preparedness plan will be
adapted to the project activity All employees involved in the project on-site will be trained in the code of
conduct and required actions at time of commissioning of the plant
PROJECT DESIGN DOCUMENT FORM (CDM-SSC-PDD) - Version 03
CDM ndash Executive Board
43
OPERATIONAL AND MANAGEMENT STRUCTURE
The CDM monitoring team will be composed by the following staff
Position Report to
Operators
Project owner Supervisors (technicalmaintenance)
Operation Engineer
CDM monitoring project manager External CDM consultant
TRAINING OF MONITORING PERSONNEL
The maintenance will be conducted in-house by staff employed and trained by the Project Participants
Employees involved in the monitoring will be trained internally andor externally Training may include
inter alia
a) Review of equipment and captors
b) Calibration requirement
c) Configuration of monitoring equipment
d) Maintenance requirement
C1 Please indicate the level at which environmental analysis as per requirements of the CDM
modalities and procedures is undertaken Justify the choice of level at which the environmental
analysis is undertaken
radic Please tick if this information is provided at the PoA level In this case sections C2 and C3
need not be completed in this form
C2 Documentation on the analysis of the environmental impacts including transboundary
impacts
The host country does not require an analysis of environmental impacts As the project involves reduction
of GHG through recovery and controlled combustion which improves the quality of air therefore there
are no significant environmental impacts identified
C3 Please state whether an environmental impact assessment is required for a typical CPA
included in the programme of activities (PoA) in accordance with the host Party lawsregulations
In accordance with Malaysia environmental regulations Environmental Quality (Prescribed Activities
Environmental Impact Assessment) Order 1987 an Environmental Impact Assessment (EIA) is not
required for this CPA
PROJECT DESIGN DOCUMENT FORM (CDM-SSC-PDD) - Version 03
CDM ndash Executive Board
44
SECTION D Stakeholdersrsquo comments
D1 Please indicate the level at which local stakeholder comments are invited Justify the
choice
Please tick if this information is provided at the PoA level In this case sections D2 to D4 need
not be completed in this form
D2 Brief description how comments by local stakeholders have been invited and compiled
The stakeholder meeting was conducted at the office of Kilang Sawit Felda Triang on 05032012 There
were 37 stakeholders attending the consultation Posters were pasted at the guard house and at the
entrance to office 1 week before the stakeholder consultation to inform the locals stakeholders which
comprise mostly the workers of the mill 20 stakeholders out of the 37 who attended the consultation are
2nd generation of the Felda settlers who live in the vicinity to the project activity and adequately represent
the local community composed entirely of Felda settlers (no other people live in the vicinity of this
remote plantation) Continuous input of ideascomments were allowed to all stakeholders who could
either send their input though an email account especially setup for the biogas project or directly inform
the project proponents
During the meeting presentations were made by the project owner to outline the proposed project activity
in a non-technical manner (including environmental social and technological considerations) climate
change and the role of the CDM Attendees were given opportunity to raise their concern and opinion
about the proposed project activity during the question and answer session
D3 Summary of the comments received
PROJECT DESIGN DOCUMENT FORM (CDM-SSC-PDD) - Version 03
CDM ndash Executive Board
45
Below are the questions raised during the stakeholder meeting
NAME QUESTION
Mohd Tarmizi Bin Mat
Daud What is CDM in Bahasa Malaysia
Mohd Tarmizi Bin Mat
Daud What is DoE‟s standard for treated water released into river
Mohd Azizi Bin Abdul
Aziz
Would the biogas be captured from the existing effluent treatment ponds or a
new structure
Azhar Bin Abdul What to do with the captured biogas from the bioreactor
D4 Report on how due account was taken of any comments received
Below are the answers to the questions asked during the stakeholder meeting
QUESTION ANSWER
What is CDM in Bahasa Malaysia
The meaning of CDM in Bahasa Malaysia is Mekanisme
Pembangunan Bersih or in English is Clean Development
Mechanism
By Abd Karim Bin Mohd Zin
What is DoE‟s standard for treated
water released into river
The discharge standard for BOD into river is less than 100ppm
By Abd Karim Bin Mohd Zin
Would the biogas be captured from
the existing effluent treatment
ponds or a new structure
New bioreactor will be constructed to replace the existing anaerobic
lagoon treatment system The new bioreactor will capture the
biogas produced from this anaerobic treatment process
By Abd Karim Bin Mohd Zin
What to do with the captured
biogas from the bioreactor
The biogas recovered from the bioreactor will mainly contain
methane (approximately 60) and the rest are CO2 H2 and H2S
Currently the biogas is just released to the atmosphere from the
existing open lagoons system During the project activity captured
biogas will be combusted thus will improve the air quality
By Abd Karim Bin Mohd Zin
PROJECT DESIGN DOCUMENT FORM (CDM-SSC-PDD) - Version 03
CDM ndash Executive Board
46
Annex 1
CONTACT INFORMATION ON ENTITYINDIVIDUAL RESPONSIBLE FOR THE SMALL-
SCALE CPA
Organization Felda Palm Industries Sdn Bhd (359584-V)
StreetPOBox Jalan Gurney 1
Building Balai Felda 4th Floor
City Kuala Lumpur
StateRegion Wilayah Persekutuan
PostfixZIP 54000
Country Malaysia
Telephone (03) 2692 8066
FAX (03) 2693 4148
URL wwwfeldanetmy
Represented by
Title Head of Department
Salutation Mr
Last Name Busu
Middle Name
First Name Zainuri
Department Biomass
Mobile
Direct FAX
Direct tel
Personal E-Mail zainuribfeldanetmy
Organization Ably Carbon Sdn Bhd
StreetPOBox Jalan Ipoh Kecil
Building No 17
City Kuala Lumpur
StateRegion
PostfixZIP 50350
Country Malaysia
Telephone +60 3 4042 1177
FAX +60 3 4044 4166
E-Mail stephanevidailletably-carboncom
URL
Represented by Stephane Vidaillet
Title Chairman
Salutation Mr
Last Name Vidaillet
Middle Name
First Name Steacutephane
Department
Mobile +33 6 59111 5600
Direct FAX
PROJECT DESIGN DOCUMENT FORM (CDM-SSC-PDD) - Version 03
CDM ndash Executive Board
47
Direct tel
Personal E-Mail stephanevidailletably-carboncom
PROJECT DESIGN DOCUMENT FORM (CDM-SSC-PDD) - Version 03
CDM ndash Executive Board
48
Annex 2
INFORMATION REGARDING PUBLIC FUNDING
The project activity is not receiving any funding from parties included in Annex 1 of the Kyoto Protocol
SMALL-SCALE CDM PROGRAMME ACTIVITY DESIGN DOCUMENT FORM (CDM-SSC-CPA-DD) - Version 01
NAME TITLE OF THE PoA Biogas Recovery and Utilization PoA Projects in
Malaysia
CDM ndash Executive Board page 49
This template shall not be altered It shall be completed without modifyingadding headings or logo format or font
Annex 3
BASELINE INFORMATION
1 2
Year 2009 2010 2011 2012 2013 2014
FFB (mtyr) 343720 345910 310250 333293 333293 333293
POME Volume
(cumyr)[1] 343720 345910 310250 333293 333293 333293
Mill Opearing hour (hryr) 68865 69225 6209 6673 6673 6673
PKS (mtyr) 18905 19025 17064 18331 18331 18331
3 4 5 6 7 8 9 10
2015 2016 2017 2018 2019 2020 2021 2022
333293 333293 333293 333293 333293 333293 333293 333293
333293 333293 333293 333293 333293 333293 333293 333293
6673 6673 6673 6673 6673 6673 6673 6673
18331 18331 18331 18331 18331 18331 18331 18331
SMALL-SCALE CDM PROGRAMME ACTIVITY DESIGN DOCUMENT FORM (CDM-SSC-CPA-DD) - Version 01
NAME TITLE OF THE PoA Biogas Recovery and Utilization PoA Projects in
Malaysia
CDM ndash Executive Board page 50
This template shall not be altered It shall be completed without modifyingadding headings or logo format or font
10 days measurement campaign for baseline wastewater treatment system
Day Date
ETP
Inlet
Anaerobic
system (mgl)
Outlet
Anaerobic
system (mgl)
Outlet Algae
System (mgl)
Final
Discharge to
River (mgl)
1 23-Feb-12 35693 3120 811 603
2 25-Feb-12 19511 2559 1186 83
3 26-Feb-12 32864 2767 749 437
4 27-Feb-12 30195 2330 1210 404
5 28-Feb-12 32436 1927 1188 941
6 29-Feb-12 38259 4256 896 717
7 1-Mar-12 28717 3584 1232 695
8 3-Mar-12 31002 4660 1658 1210
9 4-Mar-12 22400 4346 1389 963
10 5-Mar-12 31226 4301 1971 1165
Average 30230 3385 1229 722
ETP
COD removal efficiency (anaerobic system) 8880
COD removal efficiency (Facultativealgae system) 6369
COD removal efficiency (Bio-polishing system) 4127
Total COD removal efficiency of the treatment system 9761
The COD of the raw effluent during ex-post may vary from the one year historical records depending on
the improvement of the production process (outside of project boundary) thus ERex-post may vary from the
estimated ERex-ante
SMALL-SCALE CDM PROGRAMME ACTIVITY DESIGN DOCUMENT FORM (CDM-SSC-CPA-DD) - Version 01
NAME TITLE OF THE PoA Biogas Recovery and Utilization PoA Projects in
Malaysia
CDM ndash Executive Board page 51
This template shall not be altered It shall be completed without modifyingadding headings or logo format or font
Annex 4
MONITORING INFORMATION
General information
Monitoring refers to the collection and archiving of all relevant data necessary for determining the
baseline measuring anthropogenic emissions by sources of greenhouse gases (GHG) within the project
boundary of a CDM project activity and leakage It includes developing suitable data collection methods
and data interpretation techniques for monitoring and verification of GHG emissions
On-line monitoring system
Most key meters required to determine GHG emissions and emission reductions will be monitored from a
central control point which will record meter readings at a pre-determined interval
Ensuring adequate maintenance and calibration of monitoring instruments
Specific maintenance repair or replacement of monitoring equipment will be recorded dated and
described
The calibration will occur at intervals determined on the basis of instrument manufacturers
recommendations stability purpose usage and history of repeatability Recalibration should be
performed whenever an event occurs that places the accuracy of the instrument in doubt
Calibration will take place at least once every three (3) years to ensure that the monitoring
equipments are properly installed and functioning properly
Calibration will be performed according to national or international standards
Last calibration certificates will be provided during periodic verification
Sampling procedure
Wherever a statistical sample is used for monitoring the ldquogeneral guidelines for sampling and surveys for
SSC project activitiesrdquo shall be used COD shall be measured from a composite sample to obtain a
representative value
Data archiving
The monitored data will be kept for a minimum of 2 years after the end of the crediting years by using
paper documents or electronic files
Identification of non-conformities
A verification of inconsistencies of the data recorded will be performed based for example on
The comparison of the calculated quantities of methane versus expected
Spot checks of field instruments (local reading) and data in the log file
Any discrepancies (completeness calculation errors transcription errors instrument calibration issues)
will be analyzed and actions taken to correct the problem
Ensuring adequate training of staff
All new staff members will undergo bdquoon job training‟ covering the monitoring requirements
The monitoring plan will be made available to staff member involved in the monitoring
A copy will be located in the control room at the site
SMALL-SCALE CDM PROGRAMME ACTIVITY DESIGN DOCUMENT FORM (CDM-SSC-CPA-DD) - Version 01
NAME TITLE OF THE PoA Biogas Recovery and Utilization PoA Projects in
Malaysia
CDM ndash Executive Board page 52
This template shall not be altered It shall be completed without modifyingadding headings or logo format or font
During the training the employees will sign a training attendance list All training records shall
be documented inclusive of training attendance training memo and training material if any
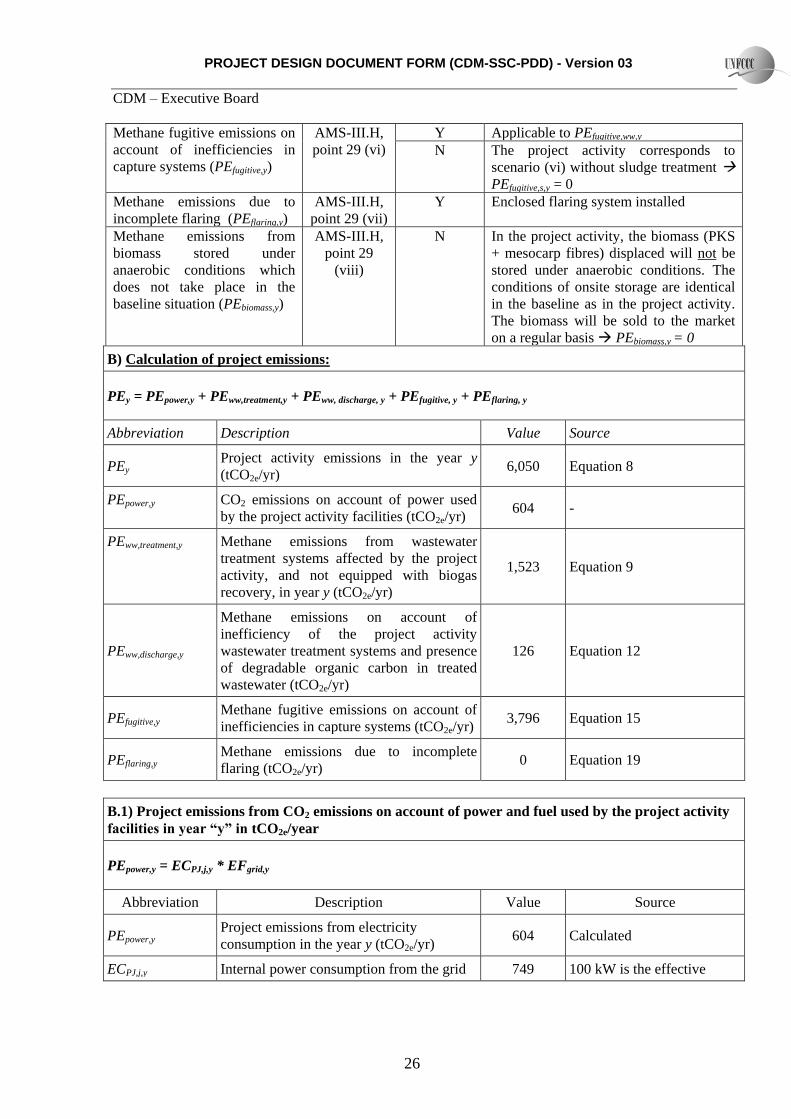
PROJECT DESIGN DOCUMENT FORM (CDM-SSC-PDD) - Version 03
CDM ndash Executive Board
30
Abbreviation Description Value Source
ERy1 ex ante Ex ante emission reduction in year y
(tCO2e) 24712 Equation 22
BEy1 ex ante Ex ante baseline emissions in year y
(tCO2e) 30762 Equation 1
PEy1 ex ante Ex ante project emissions in year y (tCO2e) 6050 Equation 8
LEy1 ex ante Ex ante Leakage emissions in year y
(tCO2e) 0 -
Calculation for AMS-ID
Baseline emissions
Electricity generated from biogas engines will be exported to the Peninsular Malaysia National Grid The
baseline emissions are described in AMS-ID (Version 17 EB 61) as the ldquoproduct of electrical energy
baseline expressed in kWh of electricity produced by the renewable energy generating unit multiplied by
an emission factorrdquo
Baseline emissions due to electricity exported to the grid in the year ldquoyrdquo (tonnes)
BEEGy = EGBLy EFCO2gridy
Abbreviation Description Value Source
BEEGy Baseline emissions in year y (tCO2eyr) 4568 Calculated
EGBLy
Quantity of net electricity supplied to the
grid as a result of the implementation of the
project activity in year y (kWh yr)
6797625 Calculated
EFCO2gridy
CO2 emission factor of the grid in year
(tCO2kWh) 0672
Study on Grid Connected
Electricity Baselines in
Malaysia 2008 published in
2010 by PTM
Project Activity Emissions
As per AMS-ID (Version 17 EB 61) project emissions for renewable energy project activities are zero
PEEGy = 0
Leakage
If the energy generating equipment is transferred from another activity leakage is to be considered
No leakage emission will occur in the project activity LEy = 0
PROJECT DESIGN DOCUMENT FORM (CDM-SSC-PDD) - Version 03
CDM ndash Executive Board
31
Emission reductions
ERy = BEy ndash PEy - LEy
Abbreviation Description Value Source
ERy Emission reduction in year y (tCO2ey) 4568 -
BEy Baseline emissions in year y (tCO2ey) 4568 -
PEy Project emissions in year y (tCO2ey) 0 -
LEy Leakage emissions in year y (tCO2ey) 0 -
Calculation for AMS-IA
Baseline emissions
The energy baseline is the fuel consumption of the technology in use or that would have been used in the
absence of the project activity to generate the equivalent quantity of energy Option 2 is applied This
methodology is only apply shall the recovered is in excess after export to the grid
Annual electricity sent to the mill for FF displacement in the year ldquoyrdquo (kWh)
EBLy = ΣEGiy (1 ndash l)
Abbreviation Description Value Source
EBLy Annual energy baseline (kWhyr) Calculated
EGiy
The estimated annual output of the
renewable energy technologies of the group
of i renewable energy technologies
installed (kWhyr)
0 Estimated
l
Average technical distribution losses that
would have been observed in diesel
powered mini-grids installed by public
programmes or distribution companies in
isolated areas expressed as a fraction
0 Conservative by applying
Zero (0)
Baseline electricity sent to the mill for FF displacement in the year ldquoyrdquo (tonnes)
BECO2y = EBLy EFCO2
Abbreviation Description Value Source
BECO2y Baseline emission in the year y (tCO2yr) 0 Calculated
EBLy Annual energy baseline (kWhyr) 0 Calculated
EFCO2 CO2 emission factor (tCO2kWh) 08
Default value which is
derived from diesel
generation units is used
PROJECT DESIGN DOCUMENT FORM (CDM-SSC-PDD) - Version 03
CDM ndash Executive Board
32
Project Activity Emissions
As per AMS-IA (Version 14 EB 54) project emissions for renewable energy project activities are zero
PEy = 0
Leakage
If the energy generating equipment is transferred from another activity or if the existing equipment is
transferred to another activity leakage is to be considered
No leakage emission will occur in the project activity LEy = 0
B53 Summary of the ex-ante estimation of emission reductions
Estimated emission reductions (total project activity)
Year
Estimation of
project activity
emissions (tCO2e)
Estimation of
baseline emissions
(tCO2e)
Estimation of
leakage (tCO2e)
Estimation of
overall emission
reductions (tCO2e)
2012 504 2944 0 2440
2013 6050 35330 0 29280
2014 6050 35330 0 29280
2015 6050 35330 0 29280
2016 6050 35330 0 29280
2017 6050 35330 0 29280
2018 6050 35330 0 29280
2019 5546 32386 0 26840
Total (tCO2) 42350 247310 0 204960
The starting date of the crediting period is 01122012 or the date of registration whichever is later
Estimated emission reductions for AMS-IIIH
Year
Estimation of
project activity
emissions (tCO2e)
Estimation of
baseline emissions
(tCO2e)
Estimation of
leakage (tCO2e)
Estimation of
overall emission
reductions (tCO2e)
2012 504 2563 0 2059
2013 6050 30762 0 24712
PROJECT DESIGN DOCUMENT FORM (CDM-SSC-PDD) - Version 03
CDM ndash Executive Board
33
2014 6050 30762 0 24712
2015 6050 30762 0 24712
2016 6050 30762 0 24712
2017 6050 30762 0 24712
2018 6050 30762 0 24712
2019 5546 28199 0 22653
Total (tCO2) 42350 215334 0 172984
The starting date of the crediting period is 01122012 or the date of registration whichever is later
Estimated emission reductions for AMS-ID
Year
Estimation of
project activity
emissions (tCO2e)
Estimation of
baseline emissions
(tCO2e)
Estimation of
leakage (tCO2e)
Estimation of
overall emission
reductions (tCO2e)
2012 0 381 0 381
2013 0 4568 0 4568
2014 0 4568 0 4568
2015 0 4568 0 4568
2016 0 4568 0 4568
2017 0 4568 0 4568
2018 0 4568 0 4568
2019 0 4187 0 4187
Total (tCO2) 0 31976 0 31976
The starting date of the crediting period is 01122012 or the date of registration whichever is later
Estimated emission reductions for AMS-IA
Year
Estimation of
project activity
emissions (tCO2e)
Estimation of
baseline emissions
(tCO2e)
Estimation of
leakage (tCO2e)
Estimation of
overall emission
reductions (tCO2e)
2012 0 0 0 0
2013 0 0 0 0
2014 0 0 0 0
2015 0 0 0 0
2016 0 0 0 0
PROJECT DESIGN DOCUMENT FORM (CDM-SSC-PDD) - Version 03
CDM ndash Executive Board
34
2017 0 0 0 0
2018 0 0 0 0
2019 0 0 0 0
Total (tCO2) 0 0 0 0
The starting date of the crediting period is 01122012 or the date of registration whichever is later
B6 Application of the monitoring methodology and description of the monitoring plan
B61 Description of the monitoring plan
The parameters to be monitored are
Please note that the amount of methane recovered and fuelled or flared (MDy ) is calculated as follows
MDy = TMfuelledy + TMflaredy Equation A
Where Description Units
MDy Quantity of methane recovered and fuelled or flared in the year y tonnes CH4year
TMfuelledy Quantity of methane fuelled in the year y tonnes CH4year
TMflaredy Quantity of methane flared in year y tonnes CH4year
Where
TMfuelledy = FVfuelledh fvCH4h ηfuelledh ρCH4n) 1000 Equation B
Where Description Units
TMfuelledy Quantity of methane fuelled in the year y tonnes CH4year
FVfuelledh Volumetric flow rate of the fuelled biogas gas at normal conditions in
hour h
Nm3 biogashour
ηfuelledh 100 for gainful purpose26
fvCH4h Volumetric fraction of methane in the biogas gas in the hour h
ρCH4n Density of methane at normal conditions kgCH4Nm3CH4
And
TMflaredy = FVflaredh fvCH4h ηflareh ρCH4n) 1000 Equation C
Where Description Units
TMflaredy Quantity of methane flared in year y tonnes CH4year
FVflaredh Volumetric flow rate of the flared biogas gas at normal conditions in
hour h
Nm3 biogashour
26 AMS-IIIH point 35
PROJECT DESIGN DOCUMENT FORM (CDM-SSC-PDD) - Version 03
CDM ndash Executive Board
35
ηflareh Flare efficiency in the hour h
fvCH4h Volumetric fraction of methane in the biogas gas in the hour h
ρCH4n Density of methane at normal conditions kgCH4Nm3CH4
Data Parameter ID1 Qwwy
Data unit m3 month
Description The flow of wastewater entering the bio-digester
Source of data Measurement by project participant by using a flowmeter
Value of data ~ 28000
Brief description of
measurement methods and
procedures to be applied
The flow is measured with an online flow meter or equivalent
QAQC procedures to be
applied (if any) Data are monitored continuously and recorded periodically
(monthly or at shorter interval) in a data log file (DLF)
Uncertainty level of data low
Maintenance and calibration as per manufacturer‟s specifications
or at least once every three (3) years
Any comment
Data Parameter ID2 CODwwuntreatedy
Data unit tCOD m3
Description Raw COD of wastewater entering the bio-digester
Source of data Laboratory (internal and external)
Value of data ~ 0030230
Brief description of
measurement methods and
procedures to be applied
Measure of COD according to national or international standards
COD is measure through representative sampling
QAQC procedures to be
applied (if any) Minimum once a month COD sampling to ensure a 9010
confidenceprecision level
COD reports are recorded manually
Uncertainty level of data low
Maintenance and calibration as per manufacturer‟s specifications
or at least once every three (3) years for internal laboratory
equipment
Any comment
Data Parameter ID3 CODwwtreatedy
Data unit tCOD m3
Description COD of treated wastewater leaving the bio-digester
Source of data Laboratory (internal and external)
Value of data ~ 0003023
Brief description of
measurement methods and
procedures to be applied
Measure of COD according to national or international standards
COD is measure through representative sampling
QAQC procedures to be
applied (if any) Minimum once a month COD sampling to ensure a 9010
confidenceprecision level
COD reports are recorded manually
Uncertainty level of data low
PROJECT DESIGN DOCUMENT FORM (CDM-SSC-PDD) - Version 03
CDM ndash Executive Board
36
Maintenance and calibration as per manufacturer‟s specifications
or at least once every three (3) years for internal laboratory
equipment
Any comment
Data Parameter ID5 End-use of the final sludge
Data unit ndash
Description The final sludge generated by the project activity will be sent to control
landfill site if any
Source of data By project participant
Value of data ndash
Brief description of
measurement methods and
procedures to be applied
The final disposal of the sludge will be monitored during the crediting
period if any For each disposal of the sludge the following will be
recorded disposal site and date of disposal
QAQC procedures to be
applied (if any)
Any comment
Data Parameter ID6 FVflaredh
Data unit Nm3 hour
Description Volumetric flow of biogas recovered and flared at normal conditions in
the hour h
Source of data By project participant
Value of data 0
Brief description of
measurement methods and
procedures to be applied
The volume of biogas will be measured with a normalised flow meter or
calculated from the volumetric flow pressure temperature
Biogas volume and methane content measurements shall be on the same
basis (wet or dry)
QAQC procedures to be
applied (if any) The biogas flow is monitored continuously recorded and stored
electronically in a data log file (DLF) (monthly or at shorter
interval)
Data Parameter ID4 CODww dischargey
Data unit tCOD m3
Description COD of treated wastewater discharge into river by treatment system
Source of data Laboratory (internal and external)
Value of data ~ 0000100
Brief description of
measurement methods and
procedures to be applied
Measure of COD according to national or international standards
COD is measure through representative sampling
QAQC procedures to be
applied (if any) Minimum once a month COD sampling to ensure a 9010
confidenceprecision level
COD reports are recorded manually
Uncertainty level of data low
Maintenance and calibration as per manufacturer‟s specifications
or at least once every three (3) years for internal laboratory
equipment
Any comment
PROJECT DESIGN DOCUMENT FORM (CDM-SSC-PDD) - Version 03
CDM ndash Executive Board
37
Uncertainty level of data low
Maintenance and calibration as per manufacturer‟s specifications
or at least once every 3 years
Any comment
Data Parameter ID7 FVfuelledgas engineh
Data unit Nm3 hour
Description Volumetric flow of biogas recovered and fuelled (gas engine) at normal
conditions in the hour h
Source of data By project participant
Value of data ~ 509
Brief description of
measurement methods and
procedures to be applied
The volume of biogas will be measured with a normalised flow meter or
calculated from the volumetric flow of biogas pressure temperature
Biogas volume and methane content measurements shall be on the same
basis (wet or dry)
QAQC procedures to be
applied (if any) The biogas flow is monitored continuously recorded and stored
electronically in a data log file (DLF) (monthly or at shorter
interval)
Uncertainty level of data low
Maintenance and calibration as per manufacturer‟s specifications
or at least once every 3 years
Any comment
Data Parameter ID8 FVfuelledboilerh
Data unit Nm3 hour
Description Volumetric flow of biogas recovered and fuelled (boilers) at normal
conditions in the hour h
Source of data By project participant
Value of data ~ 0
Brief description of
measurement methods and
procedures to be applied
The volume of biogas will be measured with a normalised flow meter or
calculated from the volumetric flow of biogas pressure temperature
Biogas volume and methane content measurements shall be on the same
basis (wet or dry)
QAQC procedures to be
applied (if any) The biogas flow is monitored continuously recorded and stored
electronically in a data log file (DLF) (monthly or at shorter
interval)
Uncertainty level of data low
Maintenance and calibration as per manufacturer‟s specifications
or at least once every 3 years
Any comment
Data Parameter ID9 wCH4h
Data unit
Description Methane content in biogas in same basis (wetdry) as the biogas flows in
year y
Source of data By project participant using a gas analyzer
Value of data ~ 60
PROJECT DESIGN DOCUMENT FORM (CDM-SSC-PDD) - Version 03
CDM ndash Executive Board
38
Brief description of
measurement methods and
procedures to be applied
Using calibrated gas analyzer either continuous or periodical
measurement at confidenceprecision level of 9010
QAQC procedures to be
applied (if any) In case a continuous gas analyser is used data will be recorded
and stored electronically in a data log file (DLF) every hour or at
shorter interval
Uncertainty level of data low
Maintenance and calibration as per manufacturer‟s specifications
or at least once every 3 years
Any comment See also clarification by EB Meth Panel 30102009 ndash SSC_360
httpcdmunfcccintUserManagementFileStorageAM_CLAR_
QS83SX5B7WM6UGZE31JYQEQ4F65F6V
The biogas flow and the methane content measurements shall be
carried out close to each others
Data Parameter ID10 Tbiogas
Data unit ordmC
Description Temperature of biogas
Source of data Temperature probe
Value of data 20 ndash 65
Brief description of
measurement methods and
procedures to be applied
By project participant
QAQC procedures to be
applied (if any) Shall be measured and recorded at the same time when methane
content in biogas (ID8) is measured
Uncertainty level of data low
Maintenance and calibration as per manufacturer‟s specifications
or at least once every 3 years
Any comment Pressure and temperature are required to determine the density of
the methane If the biogas flow meter employed measures flow
pressure and temperature and displaysoutputs normalised flow of
biogas there is no need to separate monitoring of pressure and
temperature of the biogas
Data Parameter ID11 Pbiogas
Data unit Bar(g)
Description Pressure of biogas
Source of data By project participant
Value of data 50 ndash 200 mbar
Brief description of
measurement methods and
procedures to be applied
Pressure measurement device
QAQC procedures to be
applied (if any) Shall be measured and recorded at the same time when methane
content in biogas (ID8) is measured
Uncertainty level of data low
Maintenance and calibration as per manufacturer‟s specifications
or at least once every three (3) years
Any comment Pressure and temperature are required to determine the density of
the methane If the biogas flow meter employed measures flow
PROJECT DESIGN DOCUMENT FORM (CDM-SSC-PDD) - Version 03
CDM ndash Executive Board
39
pressure and temperature and displaysoutputs normalised flow of
biogas there is no need to separate monitoring of pressure and
temperature of the biogas
Shall be measured at the same time when methane content in
biogas (ID9) is measured
Parameter ID12 ηflareh (enclosed flare)
Unit
Description Enclosed flare efficiency in the hour h
Source of data Calculated
Value of data 0 or 50 or 90
Brief description of
measurement methods and
procedures to be applied
This yearly efficiency will be based on hourly flare efficiencies calculated
as per the provisions in the ldquoTool to determine project emissions from
flaring gases containing methanerdquo
The hourly flare efficiency will be calculated based on
0 if the temperature in the exhaust gas of the flare (Tflare) is
below 500 degC for more than 20 minutes during the hour h
50 if the temperature in the exhaust gas of the flare (Tflare) is
above 500 degC for more than 40 minutes during the hour h but the
manufacturer‟s specifications on proper operation of the flare are
not met at any point in time during the hour h
90 if the temperature in the exhaust gas of the flare (Tflare) is
above 500 degC for more than 40 minutes during the hour h and the
manufacturer‟s specifications on proper operation of the flare are
met continuously during the hour h
QAQC procedures to be
applied (if any) Data are logged hourly in a data log file (DLF)
Uncertainty level of data low
Any comment For enclosed flare
Or
Parameter ID13 ηflareh (open flare)
Unit
Description Flare efficiency in the hour h
Source of data Calculated
Value of data 0 or 50
Brief description of
measurement methods and
procedures to be applied
This yearly efficiency will be based on hourly flare efficiencies calculated
as per the provisions in the ldquoTool to determine project emissions from
flaring gases containing methanerdquo
The hourly flare efficiency will be calculated based on the duration of
time during which the flame is detected by the thermocouple (or flame
detector) installed in the open flare
Flare efficiency in hour h is based on default values
0 if the flame detected for not more than 20 minutes during the
hour h and
PROJECT DESIGN DOCUMENT FORM (CDM-SSC-PDD) - Version 03
CDM ndash Executive Board
40
50 if the flame detected for more than 20 minutes during the
hour h
A flame detector or thermocouple will be used
QAQC procedures to be
applied (if any) Data are logged hourly in a data log file (DLF)
Uncertainty level of data low
Any comment The only monitored parameter related to the flare is its efficiency Indeed
according to the clarification SSC_19927 of the methodology AMS IIIH
version 9 accepted by the SSC WG on the 3092008 ldquoIf a thermocouple
is used as a flame detection system it is sufficient to reach the given
minimum temperature from the manufacturer ldquo Hence it is not necessary
to monitor the temperature of the open type flares (Tflare)
Data Parameter ID14 ECPJjy
Data unit MWh
Description The yearly grid electricity consumption of the project activity for the year
bdquoy‟
Source of data Onsite instrument
Value of data ~749
Brief description of
measurement methods and
procedures to be applied
The grid electricity consumption of the project activity is measured
continuously with an energy meter (cumulative reading)
QAQC procedures to be
applied (if any) Data are monitored continuously and recorded periodically
(yearly or at shorter interval) in a data log file (DLF)
Uncertainty level of data low
Maintenance and calibration as per manufacturer‟s specifications
or at least once every three (3) years
Any comment
Data Parameter ID15 EGBLy
Data unit MWh
Description Quantity of net electricity generated and send to grid in year y
Source of data By project participant
Value of data ~ 6798
Brief description of
measurement methods and
procedures to be applied
The electricity generated and sent to grid is measured continuously with
an energy meter (cumulative readings)
QAQC procedures to be
applied (if any) Data are monitored continuously and recorded periodically
(yearly or at shorter interval) in a data log file (DLF)
Uncertainty level of data low
Maintenance and calibration as per manufacturer‟s specifications
or at least once every 3 years
Any comment As per AMS-ID
27 The clarification SSC_199 if available here (last access on the 24052011)
httpcdmunfcccintfilestorageAM_AM_CLAR_HIOZ5CS1PASC187C0JQ668L2E9RCRJResponse20WG20provided
20at20SSC20WG2017pdft=bU98MTMwNjIxNjY0OS4xMQ==|BOKHqtO94N6XF1N2N1vo8Ori-Rc=
PROJECT DESIGN DOCUMENT FORM (CDM-SSC-PDD) - Version 03
CDM ndash Executive Board
41
Or
Data Parameter ID16 EGmilly
Data unit MWh
Description Quantity of annual output of renewable energy sent to the mill in year y
Source of data By project participant
Value of data ~ 0
Brief description of
measurement methods and
procedures to be applied
The electricity generated and sent to mill to displace diesel use in diesel
gensets is measured continuously with an energy meter (cumulative
readings)
QAQC procedures to be
applied (if any) Data are monitored continuously and recorded periodically
(yearly or at shorter interval) in a data log file (DLF)
Uncertainty level of data low
Maintenance and calibration as per manufacturer‟s specifications
or at least once every 3 years
Any comment As per AMS-IA
Data Parameter ID17 Displacement of Biomass
Data unit Mt
Description Total amount of biomass (PKS) displaced from biomass boilers
Source of data Weighing bridge
Value of data Measurement at site
Brief description of
measurement methods and
procedures to be applied
Biomass (PKS) displaced due to the project activity will be weighed
using weighing bridge at the palm oil mill
QAQC procedures to be
applied (if any) Monthly calculation based on every single trip of trucks recorded
Data is recorded manually in a data log file based on the weighing
records
Maintenance and calibration as per manufacturer‟s specifications
Uncertainty level of data low
Any comment In the project activity the biomass (PKS) displaced will not be stored
under anaerobic conditions The conditions of onsite storage are identical
in the baseline as in the project activity The biomass will be sold to the
market on a regular basis PEbiomassy = 0
A final monitoring plan will be prepared prior the initial verification based on the as-built project activity
It will address the following aspects
MONITORING
The Project will be managed by CME with the involvement from Project Implementer CME will ensure
safety in operation of the plant as well as in the monitoring of emission reduction which is generated from
the project activity
CME will implement and be responsible for the monitoring plan Their responsibility covers operation of
the monitoring maintenance of the monitoring equipment data collection and archiving and
management of total scheme of the monitoring CME and Project Implementer will assign specific trained
PROJECT DESIGN DOCUMENT FORM (CDM-SSC-PDD) - Version 03
CDM ndash Executive Board
42
personnel during project implementation for the overall monitoring measurement and reporting of key
parameters as required in this PDD
DATA LOGGING AND STORAGE
The data measured by the instruments will be collected and stored in a data logging system The data will
be retrieved remotely by modem or directly on site
If data cannot be retrieved no emissions reductions will be claimed for the period of data failure The
data collected will be recorded in a central data base Access to production data will be restricted All
records and data (hard copy and soft copy) will be archived up to two years after the end of the crediting
period or the last issuance of CERs for this project activity whichever occurs later
CALIBRATION AND MAINTENANCE PROCEDURES MALFUNCTION OF EQUIPMENT
Maintenance includes all preventive and corrective actions necessary for the good functioning of the
equipment such as
Visual control of the equipment state and real-time check of displayed parameters
Cleaning up the equipment and the sensors
Adding lubricant
Replacement and change of defective parts
Calibration of equipment consists in verifying by comparison with a standard the accuracy of a
measuring instrument
Measuring instruments will be periodically and appropriately calibrated according to the procedures
timing and methods recommended by the manufacturer or nationalinternational standards as available
General malfunction of equipment
Daily inspections of the equipment will allow controlling equipment failure If equipment fails the
supplier will be notified and repairs will be carried out If the damaged equipment cannot be repaired it
will be replaced at the earliest In some cases portable tools will be used in order to carry out daily
monitoring of the missing parameter(s) In such case this data will be recorded manually
Discrepancies
To avoid discrepancies between projected data in the PDD and actual data (eg due to deferred starting
date malfunction of equipment) cross-checks between internal meter readings and external sources (eg
electricity invoices) will be carried out Any source of inconsistencies will be clarified
Case of emergency
For the case of emergency (earthquakes explosions fires etc) an emergency preparedness plan will be
adapted to the project activity All employees involved in the project on-site will be trained in the code of
conduct and required actions at time of commissioning of the plant
PROJECT DESIGN DOCUMENT FORM (CDM-SSC-PDD) - Version 03
CDM ndash Executive Board
43
OPERATIONAL AND MANAGEMENT STRUCTURE
The CDM monitoring team will be composed by the following staff
Position Report to
Operators
Project owner Supervisors (technicalmaintenance)
Operation Engineer
CDM monitoring project manager External CDM consultant
TRAINING OF MONITORING PERSONNEL
The maintenance will be conducted in-house by staff employed and trained by the Project Participants
Employees involved in the monitoring will be trained internally andor externally Training may include
inter alia
a) Review of equipment and captors
b) Calibration requirement
c) Configuration of monitoring equipment
d) Maintenance requirement
C1 Please indicate the level at which environmental analysis as per requirements of the CDM
modalities and procedures is undertaken Justify the choice of level at which the environmental
analysis is undertaken
radic Please tick if this information is provided at the PoA level In this case sections C2 and C3
need not be completed in this form
C2 Documentation on the analysis of the environmental impacts including transboundary
impacts
The host country does not require an analysis of environmental impacts As the project involves reduction
of GHG through recovery and controlled combustion which improves the quality of air therefore there
are no significant environmental impacts identified
C3 Please state whether an environmental impact assessment is required for a typical CPA
included in the programme of activities (PoA) in accordance with the host Party lawsregulations
In accordance with Malaysia environmental regulations Environmental Quality (Prescribed Activities
Environmental Impact Assessment) Order 1987 an Environmental Impact Assessment (EIA) is not
required for this CPA
PROJECT DESIGN DOCUMENT FORM (CDM-SSC-PDD) - Version 03
CDM ndash Executive Board
44
SECTION D Stakeholdersrsquo comments
D1 Please indicate the level at which local stakeholder comments are invited Justify the
choice
Please tick if this information is provided at the PoA level In this case sections D2 to D4 need
not be completed in this form
D2 Brief description how comments by local stakeholders have been invited and compiled
The stakeholder meeting was conducted at the office of Kilang Sawit Felda Triang on 05032012 There
were 37 stakeholders attending the consultation Posters were pasted at the guard house and at the
entrance to office 1 week before the stakeholder consultation to inform the locals stakeholders which
comprise mostly the workers of the mill 20 stakeholders out of the 37 who attended the consultation are
2nd generation of the Felda settlers who live in the vicinity to the project activity and adequately represent
the local community composed entirely of Felda settlers (no other people live in the vicinity of this
remote plantation) Continuous input of ideascomments were allowed to all stakeholders who could
either send their input though an email account especially setup for the biogas project or directly inform
the project proponents
During the meeting presentations were made by the project owner to outline the proposed project activity
in a non-technical manner (including environmental social and technological considerations) climate
change and the role of the CDM Attendees were given opportunity to raise their concern and opinion
about the proposed project activity during the question and answer session
D3 Summary of the comments received
PROJECT DESIGN DOCUMENT FORM (CDM-SSC-PDD) - Version 03
CDM ndash Executive Board
45
Below are the questions raised during the stakeholder meeting
NAME QUESTION
Mohd Tarmizi Bin Mat
Daud What is CDM in Bahasa Malaysia
Mohd Tarmizi Bin Mat
Daud What is DoE‟s standard for treated water released into river
Mohd Azizi Bin Abdul
Aziz
Would the biogas be captured from the existing effluent treatment ponds or a
new structure
Azhar Bin Abdul What to do with the captured biogas from the bioreactor
D4 Report on how due account was taken of any comments received
Below are the answers to the questions asked during the stakeholder meeting
QUESTION ANSWER
What is CDM in Bahasa Malaysia
The meaning of CDM in Bahasa Malaysia is Mekanisme
Pembangunan Bersih or in English is Clean Development
Mechanism
By Abd Karim Bin Mohd Zin
What is DoE‟s standard for treated
water released into river
The discharge standard for BOD into river is less than 100ppm
By Abd Karim Bin Mohd Zin
Would the biogas be captured from
the existing effluent treatment
ponds or a new structure
New bioreactor will be constructed to replace the existing anaerobic
lagoon treatment system The new bioreactor will capture the
biogas produced from this anaerobic treatment process
By Abd Karim Bin Mohd Zin
What to do with the captured
biogas from the bioreactor
The biogas recovered from the bioreactor will mainly contain
methane (approximately 60) and the rest are CO2 H2 and H2S
Currently the biogas is just released to the atmosphere from the
existing open lagoons system During the project activity captured
biogas will be combusted thus will improve the air quality
By Abd Karim Bin Mohd Zin
PROJECT DESIGN DOCUMENT FORM (CDM-SSC-PDD) - Version 03
CDM ndash Executive Board
46
Annex 1
CONTACT INFORMATION ON ENTITYINDIVIDUAL RESPONSIBLE FOR THE SMALL-
SCALE CPA
Organization Felda Palm Industries Sdn Bhd (359584-V)
StreetPOBox Jalan Gurney 1
Building Balai Felda 4th Floor
City Kuala Lumpur
StateRegion Wilayah Persekutuan
PostfixZIP 54000
Country Malaysia
Telephone (03) 2692 8066
FAX (03) 2693 4148
URL wwwfeldanetmy
Represented by
Title Head of Department
Salutation Mr
Last Name Busu
Middle Name
First Name Zainuri
Department Biomass
Mobile
Direct FAX
Direct tel
Personal E-Mail zainuribfeldanetmy
Organization Ably Carbon Sdn Bhd
StreetPOBox Jalan Ipoh Kecil
Building No 17
City Kuala Lumpur
StateRegion
PostfixZIP 50350
Country Malaysia
Telephone +60 3 4042 1177
FAX +60 3 4044 4166
E-Mail stephanevidailletably-carboncom
URL
Represented by Stephane Vidaillet
Title Chairman
Salutation Mr
Last Name Vidaillet
Middle Name
First Name Steacutephane
Department
Mobile +33 6 59111 5600
Direct FAX
PROJECT DESIGN DOCUMENT FORM (CDM-SSC-PDD) - Version 03
CDM ndash Executive Board
47
Direct tel
Personal E-Mail stephanevidailletably-carboncom
PROJECT DESIGN DOCUMENT FORM (CDM-SSC-PDD) - Version 03
CDM ndash Executive Board
48
Annex 2
INFORMATION REGARDING PUBLIC FUNDING
The project activity is not receiving any funding from parties included in Annex 1 of the Kyoto Protocol
SMALL-SCALE CDM PROGRAMME ACTIVITY DESIGN DOCUMENT FORM (CDM-SSC-CPA-DD) - Version 01
NAME TITLE OF THE PoA Biogas Recovery and Utilization PoA Projects in
Malaysia
CDM ndash Executive Board page 49
This template shall not be altered It shall be completed without modifyingadding headings or logo format or font
Annex 3
BASELINE INFORMATION
1 2
Year 2009 2010 2011 2012 2013 2014
FFB (mtyr) 343720 345910 310250 333293 333293 333293
POME Volume
(cumyr)[1] 343720 345910 310250 333293 333293 333293
Mill Opearing hour (hryr) 68865 69225 6209 6673 6673 6673
PKS (mtyr) 18905 19025 17064 18331 18331 18331
3 4 5 6 7 8 9 10
2015 2016 2017 2018 2019 2020 2021 2022
333293 333293 333293 333293 333293 333293 333293 333293
333293 333293 333293 333293 333293 333293 333293 333293
6673 6673 6673 6673 6673 6673 6673 6673
18331 18331 18331 18331 18331 18331 18331 18331
SMALL-SCALE CDM PROGRAMME ACTIVITY DESIGN DOCUMENT FORM (CDM-SSC-CPA-DD) - Version 01
NAME TITLE OF THE PoA Biogas Recovery and Utilization PoA Projects in
Malaysia
CDM ndash Executive Board page 50
This template shall not be altered It shall be completed without modifyingadding headings or logo format or font
10 days measurement campaign for baseline wastewater treatment system
Day Date
ETP
Inlet
Anaerobic
system (mgl)
Outlet
Anaerobic
system (mgl)
Outlet Algae
System (mgl)
Final
Discharge to
River (mgl)
1 23-Feb-12 35693 3120 811 603
2 25-Feb-12 19511 2559 1186 83
3 26-Feb-12 32864 2767 749 437
4 27-Feb-12 30195 2330 1210 404
5 28-Feb-12 32436 1927 1188 941
6 29-Feb-12 38259 4256 896 717
7 1-Mar-12 28717 3584 1232 695
8 3-Mar-12 31002 4660 1658 1210
9 4-Mar-12 22400 4346 1389 963
10 5-Mar-12 31226 4301 1971 1165
Average 30230 3385 1229 722
ETP
COD removal efficiency (anaerobic system) 8880
COD removal efficiency (Facultativealgae system) 6369
COD removal efficiency (Bio-polishing system) 4127
Total COD removal efficiency of the treatment system 9761
The COD of the raw effluent during ex-post may vary from the one year historical records depending on
the improvement of the production process (outside of project boundary) thus ERex-post may vary from the
estimated ERex-ante
SMALL-SCALE CDM PROGRAMME ACTIVITY DESIGN DOCUMENT FORM (CDM-SSC-CPA-DD) - Version 01
NAME TITLE OF THE PoA Biogas Recovery and Utilization PoA Projects in
Malaysia
CDM ndash Executive Board page 51
This template shall not be altered It shall be completed without modifyingadding headings or logo format or font
Annex 4
MONITORING INFORMATION
General information
Monitoring refers to the collection and archiving of all relevant data necessary for determining the
baseline measuring anthropogenic emissions by sources of greenhouse gases (GHG) within the project
boundary of a CDM project activity and leakage It includes developing suitable data collection methods
and data interpretation techniques for monitoring and verification of GHG emissions
On-line monitoring system
Most key meters required to determine GHG emissions and emission reductions will be monitored from a
central control point which will record meter readings at a pre-determined interval
Ensuring adequate maintenance and calibration of monitoring instruments
Specific maintenance repair or replacement of monitoring equipment will be recorded dated and
described
The calibration will occur at intervals determined on the basis of instrument manufacturers
recommendations stability purpose usage and history of repeatability Recalibration should be
performed whenever an event occurs that places the accuracy of the instrument in doubt
Calibration will take place at least once every three (3) years to ensure that the monitoring
equipments are properly installed and functioning properly
Calibration will be performed according to national or international standards
Last calibration certificates will be provided during periodic verification
Sampling procedure
Wherever a statistical sample is used for monitoring the ldquogeneral guidelines for sampling and surveys for
SSC project activitiesrdquo shall be used COD shall be measured from a composite sample to obtain a
representative value
Data archiving
The monitored data will be kept for a minimum of 2 years after the end of the crediting years by using
paper documents or electronic files
Identification of non-conformities
A verification of inconsistencies of the data recorded will be performed based for example on
The comparison of the calculated quantities of methane versus expected
Spot checks of field instruments (local reading) and data in the log file
Any discrepancies (completeness calculation errors transcription errors instrument calibration issues)
will be analyzed and actions taken to correct the problem
Ensuring adequate training of staff
All new staff members will undergo bdquoon job training‟ covering the monitoring requirements
The monitoring plan will be made available to staff member involved in the monitoring
A copy will be located in the control room at the site
SMALL-SCALE CDM PROGRAMME ACTIVITY DESIGN DOCUMENT FORM (CDM-SSC-CPA-DD) - Version 01
NAME TITLE OF THE PoA Biogas Recovery and Utilization PoA Projects in
Malaysia
CDM ndash Executive Board page 52
This template shall not be altered It shall be completed without modifyingadding headings or logo format or font
During the training the employees will sign a training attendance list All training records shall
be documented inclusive of training attendance training memo and training material if any
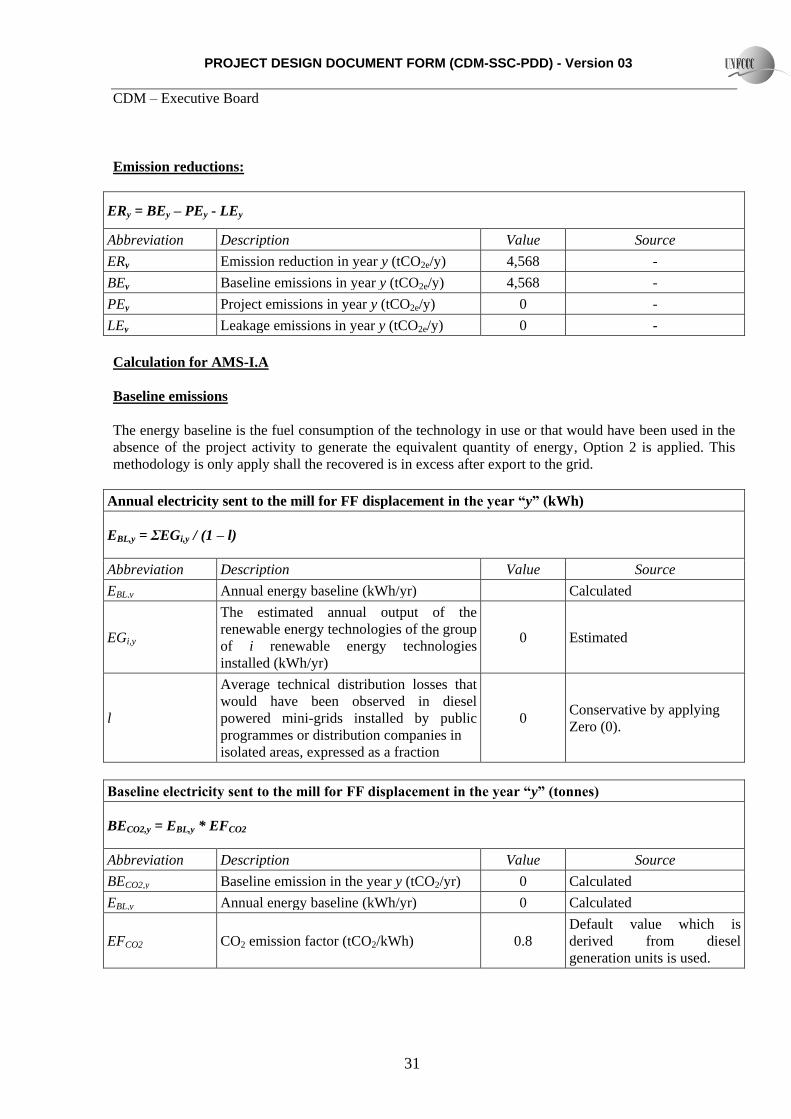
PROJECT DESIGN DOCUMENT FORM (CDM-SSC-PDD) - Version 03
CDM ndash Executive Board
31
Emission reductions
ERy = BEy ndash PEy - LEy
Abbreviation Description Value Source
ERy Emission reduction in year y (tCO2ey) 4568 -
BEy Baseline emissions in year y (tCO2ey) 4568 -
PEy Project emissions in year y (tCO2ey) 0 -
LEy Leakage emissions in year y (tCO2ey) 0 -
Calculation for AMS-IA
Baseline emissions
The energy baseline is the fuel consumption of the technology in use or that would have been used in the
absence of the project activity to generate the equivalent quantity of energy Option 2 is applied This
methodology is only apply shall the recovered is in excess after export to the grid
Annual electricity sent to the mill for FF displacement in the year ldquoyrdquo (kWh)
EBLy = ΣEGiy (1 ndash l)
Abbreviation Description Value Source
EBLy Annual energy baseline (kWhyr) Calculated
EGiy
The estimated annual output of the
renewable energy technologies of the group
of i renewable energy technologies
installed (kWhyr)
0 Estimated
l
Average technical distribution losses that
would have been observed in diesel
powered mini-grids installed by public
programmes or distribution companies in
isolated areas expressed as a fraction
0 Conservative by applying
Zero (0)
Baseline electricity sent to the mill for FF displacement in the year ldquoyrdquo (tonnes)
BECO2y = EBLy EFCO2
Abbreviation Description Value Source
BECO2y Baseline emission in the year y (tCO2yr) 0 Calculated
EBLy Annual energy baseline (kWhyr) 0 Calculated
EFCO2 CO2 emission factor (tCO2kWh) 08
Default value which is
derived from diesel
generation units is used
PROJECT DESIGN DOCUMENT FORM (CDM-SSC-PDD) - Version 03
CDM ndash Executive Board
32
Project Activity Emissions
As per AMS-IA (Version 14 EB 54) project emissions for renewable energy project activities are zero
PEy = 0
Leakage
If the energy generating equipment is transferred from another activity or if the existing equipment is
transferred to another activity leakage is to be considered
No leakage emission will occur in the project activity LEy = 0
B53 Summary of the ex-ante estimation of emission reductions
Estimated emission reductions (total project activity)
Year
Estimation of
project activity
emissions (tCO2e)
Estimation of
baseline emissions
(tCO2e)
Estimation of
leakage (tCO2e)
Estimation of
overall emission
reductions (tCO2e)
2012 504 2944 0 2440
2013 6050 35330 0 29280
2014 6050 35330 0 29280
2015 6050 35330 0 29280
2016 6050 35330 0 29280
2017 6050 35330 0 29280
2018 6050 35330 0 29280
2019 5546 32386 0 26840
Total (tCO2) 42350 247310 0 204960
The starting date of the crediting period is 01122012 or the date of registration whichever is later
Estimated emission reductions for AMS-IIIH
Year
Estimation of
project activity
emissions (tCO2e)
Estimation of
baseline emissions
(tCO2e)
Estimation of
leakage (tCO2e)
Estimation of
overall emission
reductions (tCO2e)
2012 504 2563 0 2059
2013 6050 30762 0 24712
PROJECT DESIGN DOCUMENT FORM (CDM-SSC-PDD) - Version 03
CDM ndash Executive Board
33
2014 6050 30762 0 24712
2015 6050 30762 0 24712
2016 6050 30762 0 24712
2017 6050 30762 0 24712
2018 6050 30762 0 24712
2019 5546 28199 0 22653
Total (tCO2) 42350 215334 0 172984
The starting date of the crediting period is 01122012 or the date of registration whichever is later
Estimated emission reductions for AMS-ID
Year
Estimation of
project activity
emissions (tCO2e)
Estimation of
baseline emissions
(tCO2e)
Estimation of
leakage (tCO2e)
Estimation of
overall emission
reductions (tCO2e)
2012 0 381 0 381
2013 0 4568 0 4568
2014 0 4568 0 4568
2015 0 4568 0 4568
2016 0 4568 0 4568
2017 0 4568 0 4568
2018 0 4568 0 4568
2019 0 4187 0 4187
Total (tCO2) 0 31976 0 31976
The starting date of the crediting period is 01122012 or the date of registration whichever is later
Estimated emission reductions for AMS-IA
Year
Estimation of
project activity
emissions (tCO2e)
Estimation of
baseline emissions
(tCO2e)
Estimation of
leakage (tCO2e)
Estimation of
overall emission
reductions (tCO2e)
2012 0 0 0 0
2013 0 0 0 0
2014 0 0 0 0
2015 0 0 0 0
2016 0 0 0 0
PROJECT DESIGN DOCUMENT FORM (CDM-SSC-PDD) - Version 03
CDM ndash Executive Board
34
2017 0 0 0 0
2018 0 0 0 0
2019 0 0 0 0
Total (tCO2) 0 0 0 0
The starting date of the crediting period is 01122012 or the date of registration whichever is later
B6 Application of the monitoring methodology and description of the monitoring plan
B61 Description of the monitoring plan
The parameters to be monitored are
Please note that the amount of methane recovered and fuelled or flared (MDy ) is calculated as follows
MDy = TMfuelledy + TMflaredy Equation A
Where Description Units
MDy Quantity of methane recovered and fuelled or flared in the year y tonnes CH4year
TMfuelledy Quantity of methane fuelled in the year y tonnes CH4year
TMflaredy Quantity of methane flared in year y tonnes CH4year
Where
TMfuelledy = FVfuelledh fvCH4h ηfuelledh ρCH4n) 1000 Equation B
Where Description Units
TMfuelledy Quantity of methane fuelled in the year y tonnes CH4year
FVfuelledh Volumetric flow rate of the fuelled biogas gas at normal conditions in
hour h
Nm3 biogashour
ηfuelledh 100 for gainful purpose26
fvCH4h Volumetric fraction of methane in the biogas gas in the hour h
ρCH4n Density of methane at normal conditions kgCH4Nm3CH4
And
TMflaredy = FVflaredh fvCH4h ηflareh ρCH4n) 1000 Equation C
Where Description Units
TMflaredy Quantity of methane flared in year y tonnes CH4year
FVflaredh Volumetric flow rate of the flared biogas gas at normal conditions in
hour h
Nm3 biogashour
26 AMS-IIIH point 35
PROJECT DESIGN DOCUMENT FORM (CDM-SSC-PDD) - Version 03
CDM ndash Executive Board
35
ηflareh Flare efficiency in the hour h
fvCH4h Volumetric fraction of methane in the biogas gas in the hour h
ρCH4n Density of methane at normal conditions kgCH4Nm3CH4
Data Parameter ID1 Qwwy
Data unit m3 month
Description The flow of wastewater entering the bio-digester
Source of data Measurement by project participant by using a flowmeter
Value of data ~ 28000
Brief description of
measurement methods and
procedures to be applied
The flow is measured with an online flow meter or equivalent
QAQC procedures to be
applied (if any) Data are monitored continuously and recorded periodically
(monthly or at shorter interval) in a data log file (DLF)
Uncertainty level of data low
Maintenance and calibration as per manufacturer‟s specifications
or at least once every three (3) years
Any comment
Data Parameter ID2 CODwwuntreatedy
Data unit tCOD m3
Description Raw COD of wastewater entering the bio-digester
Source of data Laboratory (internal and external)
Value of data ~ 0030230
Brief description of
measurement methods and
procedures to be applied
Measure of COD according to national or international standards
COD is measure through representative sampling
QAQC procedures to be
applied (if any) Minimum once a month COD sampling to ensure a 9010
confidenceprecision level
COD reports are recorded manually
Uncertainty level of data low
Maintenance and calibration as per manufacturer‟s specifications
or at least once every three (3) years for internal laboratory
equipment
Any comment
Data Parameter ID3 CODwwtreatedy
Data unit tCOD m3
Description COD of treated wastewater leaving the bio-digester
Source of data Laboratory (internal and external)
Value of data ~ 0003023
Brief description of
measurement methods and
procedures to be applied
Measure of COD according to national or international standards
COD is measure through representative sampling
QAQC procedures to be
applied (if any) Minimum once a month COD sampling to ensure a 9010
confidenceprecision level
COD reports are recorded manually
Uncertainty level of data low
PROJECT DESIGN DOCUMENT FORM (CDM-SSC-PDD) - Version 03
CDM ndash Executive Board
36
Maintenance and calibration as per manufacturer‟s specifications
or at least once every three (3) years for internal laboratory
equipment
Any comment
Data Parameter ID5 End-use of the final sludge
Data unit ndash
Description The final sludge generated by the project activity will be sent to control
landfill site if any
Source of data By project participant
Value of data ndash
Brief description of
measurement methods and
procedures to be applied
The final disposal of the sludge will be monitored during the crediting
period if any For each disposal of the sludge the following will be
recorded disposal site and date of disposal
QAQC procedures to be
applied (if any)
Any comment
Data Parameter ID6 FVflaredh
Data unit Nm3 hour
Description Volumetric flow of biogas recovered and flared at normal conditions in
the hour h
Source of data By project participant
Value of data 0
Brief description of
measurement methods and
procedures to be applied
The volume of biogas will be measured with a normalised flow meter or
calculated from the volumetric flow pressure temperature
Biogas volume and methane content measurements shall be on the same
basis (wet or dry)
QAQC procedures to be
applied (if any) The biogas flow is monitored continuously recorded and stored
electronically in a data log file (DLF) (monthly or at shorter
interval)
Data Parameter ID4 CODww dischargey
Data unit tCOD m3
Description COD of treated wastewater discharge into river by treatment system
Source of data Laboratory (internal and external)
Value of data ~ 0000100
Brief description of
measurement methods and
procedures to be applied
Measure of COD according to national or international standards
COD is measure through representative sampling
QAQC procedures to be
applied (if any) Minimum once a month COD sampling to ensure a 9010
confidenceprecision level
COD reports are recorded manually
Uncertainty level of data low
Maintenance and calibration as per manufacturer‟s specifications
or at least once every three (3) years for internal laboratory
equipment
Any comment
PROJECT DESIGN DOCUMENT FORM (CDM-SSC-PDD) - Version 03
CDM ndash Executive Board
37
Uncertainty level of data low
Maintenance and calibration as per manufacturer‟s specifications
or at least once every 3 years
Any comment
Data Parameter ID7 FVfuelledgas engineh
Data unit Nm3 hour
Description Volumetric flow of biogas recovered and fuelled (gas engine) at normal
conditions in the hour h
Source of data By project participant
Value of data ~ 509
Brief description of
measurement methods and
procedures to be applied
The volume of biogas will be measured with a normalised flow meter or
calculated from the volumetric flow of biogas pressure temperature
Biogas volume and methane content measurements shall be on the same
basis (wet or dry)
QAQC procedures to be
applied (if any) The biogas flow is monitored continuously recorded and stored
electronically in a data log file (DLF) (monthly or at shorter
interval)
Uncertainty level of data low
Maintenance and calibration as per manufacturer‟s specifications
or at least once every 3 years
Any comment
Data Parameter ID8 FVfuelledboilerh
Data unit Nm3 hour
Description Volumetric flow of biogas recovered and fuelled (boilers) at normal
conditions in the hour h
Source of data By project participant
Value of data ~ 0
Brief description of
measurement methods and
procedures to be applied
The volume of biogas will be measured with a normalised flow meter or
calculated from the volumetric flow of biogas pressure temperature
Biogas volume and methane content measurements shall be on the same
basis (wet or dry)
QAQC procedures to be
applied (if any) The biogas flow is monitored continuously recorded and stored
electronically in a data log file (DLF) (monthly or at shorter
interval)
Uncertainty level of data low
Maintenance and calibration as per manufacturer‟s specifications
or at least once every 3 years
Any comment
Data Parameter ID9 wCH4h
Data unit
Description Methane content in biogas in same basis (wetdry) as the biogas flows in
year y
Source of data By project participant using a gas analyzer
Value of data ~ 60
PROJECT DESIGN DOCUMENT FORM (CDM-SSC-PDD) - Version 03
CDM ndash Executive Board
38
Brief description of
measurement methods and
procedures to be applied
Using calibrated gas analyzer either continuous or periodical
measurement at confidenceprecision level of 9010
QAQC procedures to be
applied (if any) In case a continuous gas analyser is used data will be recorded
and stored electronically in a data log file (DLF) every hour or at
shorter interval
Uncertainty level of data low
Maintenance and calibration as per manufacturer‟s specifications
or at least once every 3 years
Any comment See also clarification by EB Meth Panel 30102009 ndash SSC_360
httpcdmunfcccintUserManagementFileStorageAM_CLAR_
QS83SX5B7WM6UGZE31JYQEQ4F65F6V
The biogas flow and the methane content measurements shall be
carried out close to each others
Data Parameter ID10 Tbiogas
Data unit ordmC
Description Temperature of biogas
Source of data Temperature probe
Value of data 20 ndash 65
Brief description of
measurement methods and
procedures to be applied
By project participant
QAQC procedures to be
applied (if any) Shall be measured and recorded at the same time when methane
content in biogas (ID8) is measured
Uncertainty level of data low
Maintenance and calibration as per manufacturer‟s specifications
or at least once every 3 years
Any comment Pressure and temperature are required to determine the density of
the methane If the biogas flow meter employed measures flow
pressure and temperature and displaysoutputs normalised flow of
biogas there is no need to separate monitoring of pressure and
temperature of the biogas
Data Parameter ID11 Pbiogas
Data unit Bar(g)
Description Pressure of biogas
Source of data By project participant
Value of data 50 ndash 200 mbar
Brief description of
measurement methods and
procedures to be applied
Pressure measurement device
QAQC procedures to be
applied (if any) Shall be measured and recorded at the same time when methane
content in biogas (ID8) is measured
Uncertainty level of data low
Maintenance and calibration as per manufacturer‟s specifications
or at least once every three (3) years
Any comment Pressure and temperature are required to determine the density of
the methane If the biogas flow meter employed measures flow
PROJECT DESIGN DOCUMENT FORM (CDM-SSC-PDD) - Version 03
CDM ndash Executive Board
39
pressure and temperature and displaysoutputs normalised flow of
biogas there is no need to separate monitoring of pressure and
temperature of the biogas
Shall be measured at the same time when methane content in
biogas (ID9) is measured
Parameter ID12 ηflareh (enclosed flare)
Unit
Description Enclosed flare efficiency in the hour h
Source of data Calculated
Value of data 0 or 50 or 90
Brief description of
measurement methods and
procedures to be applied
This yearly efficiency will be based on hourly flare efficiencies calculated
as per the provisions in the ldquoTool to determine project emissions from
flaring gases containing methanerdquo
The hourly flare efficiency will be calculated based on
0 if the temperature in the exhaust gas of the flare (Tflare) is
below 500 degC for more than 20 minutes during the hour h
50 if the temperature in the exhaust gas of the flare (Tflare) is
above 500 degC for more than 40 minutes during the hour h but the
manufacturer‟s specifications on proper operation of the flare are
not met at any point in time during the hour h
90 if the temperature in the exhaust gas of the flare (Tflare) is
above 500 degC for more than 40 minutes during the hour h and the
manufacturer‟s specifications on proper operation of the flare are
met continuously during the hour h
QAQC procedures to be
applied (if any) Data are logged hourly in a data log file (DLF)
Uncertainty level of data low
Any comment For enclosed flare
Or
Parameter ID13 ηflareh (open flare)
Unit
Description Flare efficiency in the hour h
Source of data Calculated
Value of data 0 or 50
Brief description of
measurement methods and
procedures to be applied
This yearly efficiency will be based on hourly flare efficiencies calculated
as per the provisions in the ldquoTool to determine project emissions from
flaring gases containing methanerdquo
The hourly flare efficiency will be calculated based on the duration of
time during which the flame is detected by the thermocouple (or flame
detector) installed in the open flare
Flare efficiency in hour h is based on default values
0 if the flame detected for not more than 20 minutes during the
hour h and
PROJECT DESIGN DOCUMENT FORM (CDM-SSC-PDD) - Version 03
CDM ndash Executive Board
40
50 if the flame detected for more than 20 minutes during the
hour h
A flame detector or thermocouple will be used
QAQC procedures to be
applied (if any) Data are logged hourly in a data log file (DLF)
Uncertainty level of data low
Any comment The only monitored parameter related to the flare is its efficiency Indeed
according to the clarification SSC_19927 of the methodology AMS IIIH
version 9 accepted by the SSC WG on the 3092008 ldquoIf a thermocouple
is used as a flame detection system it is sufficient to reach the given
minimum temperature from the manufacturer ldquo Hence it is not necessary
to monitor the temperature of the open type flares (Tflare)
Data Parameter ID14 ECPJjy
Data unit MWh
Description The yearly grid electricity consumption of the project activity for the year
bdquoy‟
Source of data Onsite instrument
Value of data ~749
Brief description of
measurement methods and
procedures to be applied
The grid electricity consumption of the project activity is measured
continuously with an energy meter (cumulative reading)
QAQC procedures to be
applied (if any) Data are monitored continuously and recorded periodically
(yearly or at shorter interval) in a data log file (DLF)
Uncertainty level of data low
Maintenance and calibration as per manufacturer‟s specifications
or at least once every three (3) years
Any comment
Data Parameter ID15 EGBLy
Data unit MWh
Description Quantity of net electricity generated and send to grid in year y
Source of data By project participant
Value of data ~ 6798
Brief description of
measurement methods and
procedures to be applied
The electricity generated and sent to grid is measured continuously with
an energy meter (cumulative readings)
QAQC procedures to be
applied (if any) Data are monitored continuously and recorded periodically
(yearly or at shorter interval) in a data log file (DLF)
Uncertainty level of data low
Maintenance and calibration as per manufacturer‟s specifications
or at least once every 3 years
Any comment As per AMS-ID
27 The clarification SSC_199 if available here (last access on the 24052011)
httpcdmunfcccintfilestorageAM_AM_CLAR_HIOZ5CS1PASC187C0JQ668L2E9RCRJResponse20WG20provided
20at20SSC20WG2017pdft=bU98MTMwNjIxNjY0OS4xMQ==|BOKHqtO94N6XF1N2N1vo8Ori-Rc=
PROJECT DESIGN DOCUMENT FORM (CDM-SSC-PDD) - Version 03
CDM ndash Executive Board
41
Or
Data Parameter ID16 EGmilly
Data unit MWh
Description Quantity of annual output of renewable energy sent to the mill in year y
Source of data By project participant
Value of data ~ 0
Brief description of
measurement methods and
procedures to be applied
The electricity generated and sent to mill to displace diesel use in diesel
gensets is measured continuously with an energy meter (cumulative
readings)
QAQC procedures to be
applied (if any) Data are monitored continuously and recorded periodically
(yearly or at shorter interval) in a data log file (DLF)
Uncertainty level of data low
Maintenance and calibration as per manufacturer‟s specifications
or at least once every 3 years
Any comment As per AMS-IA
Data Parameter ID17 Displacement of Biomass
Data unit Mt
Description Total amount of biomass (PKS) displaced from biomass boilers
Source of data Weighing bridge
Value of data Measurement at site
Brief description of
measurement methods and
procedures to be applied
Biomass (PKS) displaced due to the project activity will be weighed
using weighing bridge at the palm oil mill
QAQC procedures to be
applied (if any) Monthly calculation based on every single trip of trucks recorded
Data is recorded manually in a data log file based on the weighing
records
Maintenance and calibration as per manufacturer‟s specifications
Uncertainty level of data low
Any comment In the project activity the biomass (PKS) displaced will not be stored
under anaerobic conditions The conditions of onsite storage are identical
in the baseline as in the project activity The biomass will be sold to the
market on a regular basis PEbiomassy = 0
A final monitoring plan will be prepared prior the initial verification based on the as-built project activity
It will address the following aspects
MONITORING
The Project will be managed by CME with the involvement from Project Implementer CME will ensure
safety in operation of the plant as well as in the monitoring of emission reduction which is generated from
the project activity
CME will implement and be responsible for the monitoring plan Their responsibility covers operation of
the monitoring maintenance of the monitoring equipment data collection and archiving and
management of total scheme of the monitoring CME and Project Implementer will assign specific trained
PROJECT DESIGN DOCUMENT FORM (CDM-SSC-PDD) - Version 03
CDM ndash Executive Board
42
personnel during project implementation for the overall monitoring measurement and reporting of key
parameters as required in this PDD
DATA LOGGING AND STORAGE
The data measured by the instruments will be collected and stored in a data logging system The data will
be retrieved remotely by modem or directly on site
If data cannot be retrieved no emissions reductions will be claimed for the period of data failure The
data collected will be recorded in a central data base Access to production data will be restricted All
records and data (hard copy and soft copy) will be archived up to two years after the end of the crediting
period or the last issuance of CERs for this project activity whichever occurs later
CALIBRATION AND MAINTENANCE PROCEDURES MALFUNCTION OF EQUIPMENT
Maintenance includes all preventive and corrective actions necessary for the good functioning of the
equipment such as
Visual control of the equipment state and real-time check of displayed parameters
Cleaning up the equipment and the sensors
Adding lubricant
Replacement and change of defective parts
Calibration of equipment consists in verifying by comparison with a standard the accuracy of a
measuring instrument
Measuring instruments will be periodically and appropriately calibrated according to the procedures
timing and methods recommended by the manufacturer or nationalinternational standards as available
General malfunction of equipment
Daily inspections of the equipment will allow controlling equipment failure If equipment fails the
supplier will be notified and repairs will be carried out If the damaged equipment cannot be repaired it
will be replaced at the earliest In some cases portable tools will be used in order to carry out daily
monitoring of the missing parameter(s) In such case this data will be recorded manually
Discrepancies
To avoid discrepancies between projected data in the PDD and actual data (eg due to deferred starting
date malfunction of equipment) cross-checks between internal meter readings and external sources (eg
electricity invoices) will be carried out Any source of inconsistencies will be clarified
Case of emergency
For the case of emergency (earthquakes explosions fires etc) an emergency preparedness plan will be
adapted to the project activity All employees involved in the project on-site will be trained in the code of
conduct and required actions at time of commissioning of the plant
PROJECT DESIGN DOCUMENT FORM (CDM-SSC-PDD) - Version 03
CDM ndash Executive Board
43
OPERATIONAL AND MANAGEMENT STRUCTURE
The CDM monitoring team will be composed by the following staff
Position Report to
Operators
Project owner Supervisors (technicalmaintenance)
Operation Engineer
CDM monitoring project manager External CDM consultant
TRAINING OF MONITORING PERSONNEL
The maintenance will be conducted in-house by staff employed and trained by the Project Participants
Employees involved in the monitoring will be trained internally andor externally Training may include
inter alia
a) Review of equipment and captors
b) Calibration requirement
c) Configuration of monitoring equipment
d) Maintenance requirement
C1 Please indicate the level at which environmental analysis as per requirements of the CDM
modalities and procedures is undertaken Justify the choice of level at which the environmental
analysis is undertaken
radic Please tick if this information is provided at the PoA level In this case sections C2 and C3
need not be completed in this form
C2 Documentation on the analysis of the environmental impacts including transboundary
impacts
The host country does not require an analysis of environmental impacts As the project involves reduction
of GHG through recovery and controlled combustion which improves the quality of air therefore there
are no significant environmental impacts identified
C3 Please state whether an environmental impact assessment is required for a typical CPA
included in the programme of activities (PoA) in accordance with the host Party lawsregulations
In accordance with Malaysia environmental regulations Environmental Quality (Prescribed Activities
Environmental Impact Assessment) Order 1987 an Environmental Impact Assessment (EIA) is not
required for this CPA
PROJECT DESIGN DOCUMENT FORM (CDM-SSC-PDD) - Version 03
CDM ndash Executive Board
44
SECTION D Stakeholdersrsquo comments
D1 Please indicate the level at which local stakeholder comments are invited Justify the
choice
Please tick if this information is provided at the PoA level In this case sections D2 to D4 need
not be completed in this form
D2 Brief description how comments by local stakeholders have been invited and compiled
The stakeholder meeting was conducted at the office of Kilang Sawit Felda Triang on 05032012 There
were 37 stakeholders attending the consultation Posters were pasted at the guard house and at the
entrance to office 1 week before the stakeholder consultation to inform the locals stakeholders which
comprise mostly the workers of the mill 20 stakeholders out of the 37 who attended the consultation are
2nd generation of the Felda settlers who live in the vicinity to the project activity and adequately represent
the local community composed entirely of Felda settlers (no other people live in the vicinity of this
remote plantation) Continuous input of ideascomments were allowed to all stakeholders who could
either send their input though an email account especially setup for the biogas project or directly inform
the project proponents
During the meeting presentations were made by the project owner to outline the proposed project activity
in a non-technical manner (including environmental social and technological considerations) climate
change and the role of the CDM Attendees were given opportunity to raise their concern and opinion
about the proposed project activity during the question and answer session
D3 Summary of the comments received
PROJECT DESIGN DOCUMENT FORM (CDM-SSC-PDD) - Version 03
CDM ndash Executive Board
45
Below are the questions raised during the stakeholder meeting
NAME QUESTION
Mohd Tarmizi Bin Mat
Daud What is CDM in Bahasa Malaysia
Mohd Tarmizi Bin Mat
Daud What is DoE‟s standard for treated water released into river
Mohd Azizi Bin Abdul
Aziz
Would the biogas be captured from the existing effluent treatment ponds or a
new structure
Azhar Bin Abdul What to do with the captured biogas from the bioreactor
D4 Report on how due account was taken of any comments received
Below are the answers to the questions asked during the stakeholder meeting
QUESTION ANSWER
What is CDM in Bahasa Malaysia
The meaning of CDM in Bahasa Malaysia is Mekanisme
Pembangunan Bersih or in English is Clean Development
Mechanism
By Abd Karim Bin Mohd Zin
What is DoE‟s standard for treated
water released into river
The discharge standard for BOD into river is less than 100ppm
By Abd Karim Bin Mohd Zin
Would the biogas be captured from
the existing effluent treatment
ponds or a new structure
New bioreactor will be constructed to replace the existing anaerobic
lagoon treatment system The new bioreactor will capture the
biogas produced from this anaerobic treatment process
By Abd Karim Bin Mohd Zin
What to do with the captured
biogas from the bioreactor
The biogas recovered from the bioreactor will mainly contain
methane (approximately 60) and the rest are CO2 H2 and H2S
Currently the biogas is just released to the atmosphere from the
existing open lagoons system During the project activity captured
biogas will be combusted thus will improve the air quality
By Abd Karim Bin Mohd Zin
PROJECT DESIGN DOCUMENT FORM (CDM-SSC-PDD) - Version 03
CDM ndash Executive Board
46
Annex 1
CONTACT INFORMATION ON ENTITYINDIVIDUAL RESPONSIBLE FOR THE SMALL-
SCALE CPA
Organization Felda Palm Industries Sdn Bhd (359584-V)
StreetPOBox Jalan Gurney 1
Building Balai Felda 4th Floor
City Kuala Lumpur
StateRegion Wilayah Persekutuan
PostfixZIP 54000
Country Malaysia
Telephone (03) 2692 8066
FAX (03) 2693 4148
URL wwwfeldanetmy
Represented by
Title Head of Department
Salutation Mr
Last Name Busu
Middle Name
First Name Zainuri
Department Biomass
Mobile
Direct FAX
Direct tel
Personal E-Mail zainuribfeldanetmy
Organization Ably Carbon Sdn Bhd
StreetPOBox Jalan Ipoh Kecil
Building No 17
City Kuala Lumpur
StateRegion
PostfixZIP 50350
Country Malaysia
Telephone +60 3 4042 1177
FAX +60 3 4044 4166
E-Mail stephanevidailletably-carboncom
URL
Represented by Stephane Vidaillet
Title Chairman
Salutation Mr
Last Name Vidaillet
Middle Name
First Name Steacutephane
Department
Mobile +33 6 59111 5600
Direct FAX
PROJECT DESIGN DOCUMENT FORM (CDM-SSC-PDD) - Version 03
CDM ndash Executive Board
47
Direct tel
Personal E-Mail stephanevidailletably-carboncom
PROJECT DESIGN DOCUMENT FORM (CDM-SSC-PDD) - Version 03
CDM ndash Executive Board
48
Annex 2
INFORMATION REGARDING PUBLIC FUNDING
The project activity is not receiving any funding from parties included in Annex 1 of the Kyoto Protocol
SMALL-SCALE CDM PROGRAMME ACTIVITY DESIGN DOCUMENT FORM (CDM-SSC-CPA-DD) - Version 01
NAME TITLE OF THE PoA Biogas Recovery and Utilization PoA Projects in
Malaysia
CDM ndash Executive Board page 49
This template shall not be altered It shall be completed without modifyingadding headings or logo format or font
Annex 3
BASELINE INFORMATION
1 2
Year 2009 2010 2011 2012 2013 2014
FFB (mtyr) 343720 345910 310250 333293 333293 333293
POME Volume
(cumyr)[1] 343720 345910 310250 333293 333293 333293
Mill Opearing hour (hryr) 68865 69225 6209 6673 6673 6673
PKS (mtyr) 18905 19025 17064 18331 18331 18331
3 4 5 6 7 8 9 10
2015 2016 2017 2018 2019 2020 2021 2022
333293 333293 333293 333293 333293 333293 333293 333293
333293 333293 333293 333293 333293 333293 333293 333293
6673 6673 6673 6673 6673 6673 6673 6673
18331 18331 18331 18331 18331 18331 18331 18331
SMALL-SCALE CDM PROGRAMME ACTIVITY DESIGN DOCUMENT FORM (CDM-SSC-CPA-DD) - Version 01
NAME TITLE OF THE PoA Biogas Recovery and Utilization PoA Projects in
Malaysia
CDM ndash Executive Board page 50
This template shall not be altered It shall be completed without modifyingadding headings or logo format or font
10 days measurement campaign for baseline wastewater treatment system
Day Date
ETP
Inlet
Anaerobic
system (mgl)
Outlet
Anaerobic
system (mgl)
Outlet Algae
System (mgl)
Final
Discharge to
River (mgl)
1 23-Feb-12 35693 3120 811 603
2 25-Feb-12 19511 2559 1186 83
3 26-Feb-12 32864 2767 749 437
4 27-Feb-12 30195 2330 1210 404
5 28-Feb-12 32436 1927 1188 941
6 29-Feb-12 38259 4256 896 717
7 1-Mar-12 28717 3584 1232 695
8 3-Mar-12 31002 4660 1658 1210
9 4-Mar-12 22400 4346 1389 963
10 5-Mar-12 31226 4301 1971 1165
Average 30230 3385 1229 722
ETP
COD removal efficiency (anaerobic system) 8880
COD removal efficiency (Facultativealgae system) 6369
COD removal efficiency (Bio-polishing system) 4127
Total COD removal efficiency of the treatment system 9761
The COD of the raw effluent during ex-post may vary from the one year historical records depending on
the improvement of the production process (outside of project boundary) thus ERex-post may vary from the
estimated ERex-ante
SMALL-SCALE CDM PROGRAMME ACTIVITY DESIGN DOCUMENT FORM (CDM-SSC-CPA-DD) - Version 01
NAME TITLE OF THE PoA Biogas Recovery and Utilization PoA Projects in
Malaysia
CDM ndash Executive Board page 51
This template shall not be altered It shall be completed without modifyingadding headings or logo format or font
Annex 4
MONITORING INFORMATION
General information
Monitoring refers to the collection and archiving of all relevant data necessary for determining the
baseline measuring anthropogenic emissions by sources of greenhouse gases (GHG) within the project
boundary of a CDM project activity and leakage It includes developing suitable data collection methods
and data interpretation techniques for monitoring and verification of GHG emissions
On-line monitoring system
Most key meters required to determine GHG emissions and emission reductions will be monitored from a
central control point which will record meter readings at a pre-determined interval
Ensuring adequate maintenance and calibration of monitoring instruments
Specific maintenance repair or replacement of monitoring equipment will be recorded dated and
described
The calibration will occur at intervals determined on the basis of instrument manufacturers
recommendations stability purpose usage and history of repeatability Recalibration should be
performed whenever an event occurs that places the accuracy of the instrument in doubt
Calibration will take place at least once every three (3) years to ensure that the monitoring
equipments are properly installed and functioning properly
Calibration will be performed according to national or international standards
Last calibration certificates will be provided during periodic verification
Sampling procedure
Wherever a statistical sample is used for monitoring the ldquogeneral guidelines for sampling and surveys for
SSC project activitiesrdquo shall be used COD shall be measured from a composite sample to obtain a
representative value
Data archiving
The monitored data will be kept for a minimum of 2 years after the end of the crediting years by using
paper documents or electronic files
Identification of non-conformities
A verification of inconsistencies of the data recorded will be performed based for example on
The comparison of the calculated quantities of methane versus expected
Spot checks of field instruments (local reading) and data in the log file
Any discrepancies (completeness calculation errors transcription errors instrument calibration issues)
will be analyzed and actions taken to correct the problem
Ensuring adequate training of staff
All new staff members will undergo bdquoon job training‟ covering the monitoring requirements
The monitoring plan will be made available to staff member involved in the monitoring
A copy will be located in the control room at the site
SMALL-SCALE CDM PROGRAMME ACTIVITY DESIGN DOCUMENT FORM (CDM-SSC-CPA-DD) - Version 01
NAME TITLE OF THE PoA Biogas Recovery and Utilization PoA Projects in
Malaysia
CDM ndash Executive Board page 52
This template shall not be altered It shall be completed without modifyingadding headings or logo format or font
During the training the employees will sign a training attendance list All training records shall
be documented inclusive of training attendance training memo and training material if any
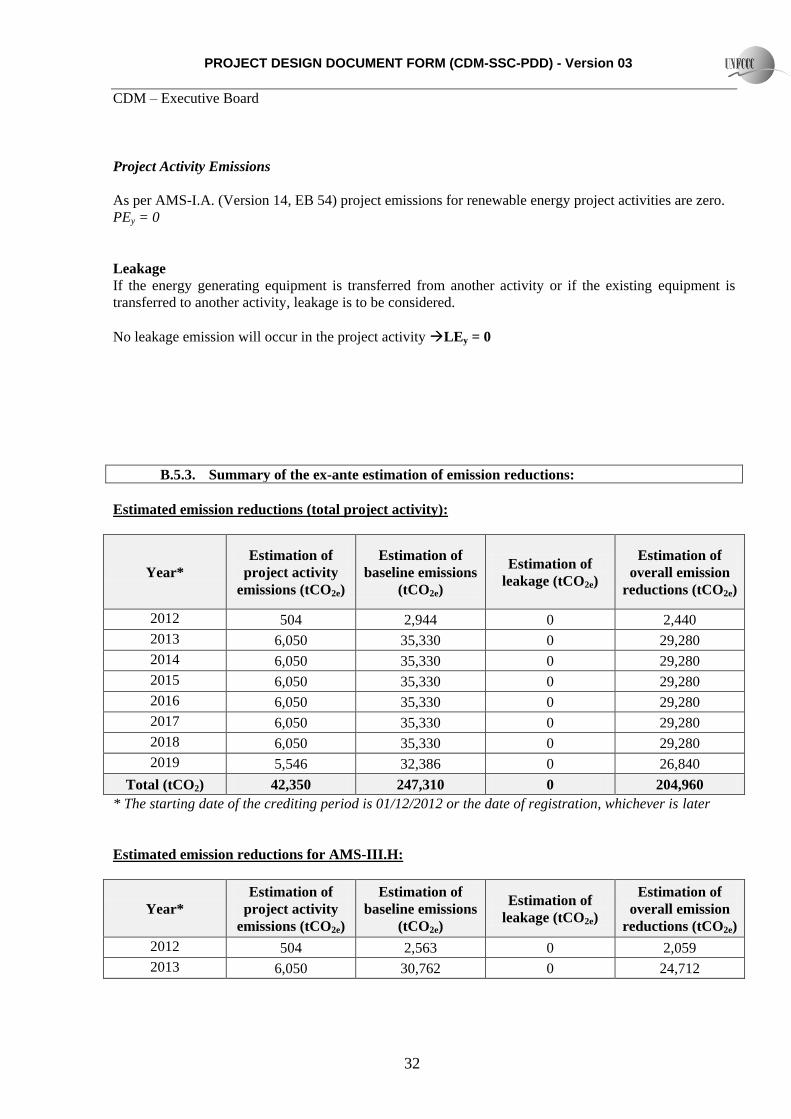
PROJECT DESIGN DOCUMENT FORM (CDM-SSC-PDD) - Version 03
CDM ndash Executive Board
32
Project Activity Emissions
As per AMS-IA (Version 14 EB 54) project emissions for renewable energy project activities are zero
PEy = 0
Leakage
If the energy generating equipment is transferred from another activity or if the existing equipment is
transferred to another activity leakage is to be considered
No leakage emission will occur in the project activity LEy = 0
B53 Summary of the ex-ante estimation of emission reductions
Estimated emission reductions (total project activity)
Year
Estimation of
project activity
emissions (tCO2e)
Estimation of
baseline emissions
(tCO2e)
Estimation of
leakage (tCO2e)
Estimation of
overall emission
reductions (tCO2e)
2012 504 2944 0 2440
2013 6050 35330 0 29280
2014 6050 35330 0 29280
2015 6050 35330 0 29280
2016 6050 35330 0 29280
2017 6050 35330 0 29280
2018 6050 35330 0 29280
2019 5546 32386 0 26840
Total (tCO2) 42350 247310 0 204960
The starting date of the crediting period is 01122012 or the date of registration whichever is later
Estimated emission reductions for AMS-IIIH
Year
Estimation of
project activity
emissions (tCO2e)
Estimation of
baseline emissions
(tCO2e)
Estimation of
leakage (tCO2e)
Estimation of
overall emission
reductions (tCO2e)
2012 504 2563 0 2059
2013 6050 30762 0 24712
PROJECT DESIGN DOCUMENT FORM (CDM-SSC-PDD) - Version 03
CDM ndash Executive Board
33
2014 6050 30762 0 24712
2015 6050 30762 0 24712
2016 6050 30762 0 24712
2017 6050 30762 0 24712
2018 6050 30762 0 24712
2019 5546 28199 0 22653
Total (tCO2) 42350 215334 0 172984
The starting date of the crediting period is 01122012 or the date of registration whichever is later
Estimated emission reductions for AMS-ID
Year
Estimation of
project activity
emissions (tCO2e)
Estimation of
baseline emissions
(tCO2e)
Estimation of
leakage (tCO2e)
Estimation of
overall emission
reductions (tCO2e)
2012 0 381 0 381
2013 0 4568 0 4568
2014 0 4568 0 4568
2015 0 4568 0 4568
2016 0 4568 0 4568
2017 0 4568 0 4568
2018 0 4568 0 4568
2019 0 4187 0 4187
Total (tCO2) 0 31976 0 31976
The starting date of the crediting period is 01122012 or the date of registration whichever is later
Estimated emission reductions for AMS-IA
Year
Estimation of
project activity
emissions (tCO2e)
Estimation of
baseline emissions
(tCO2e)
Estimation of
leakage (tCO2e)
Estimation of
overall emission
reductions (tCO2e)
2012 0 0 0 0
2013 0 0 0 0
2014 0 0 0 0
2015 0 0 0 0
2016 0 0 0 0
PROJECT DESIGN DOCUMENT FORM (CDM-SSC-PDD) - Version 03
CDM ndash Executive Board
34
2017 0 0 0 0
2018 0 0 0 0
2019 0 0 0 0
Total (tCO2) 0 0 0 0
The starting date of the crediting period is 01122012 or the date of registration whichever is later
B6 Application of the monitoring methodology and description of the monitoring plan
B61 Description of the monitoring plan
The parameters to be monitored are
Please note that the amount of methane recovered and fuelled or flared (MDy ) is calculated as follows
MDy = TMfuelledy + TMflaredy Equation A
Where Description Units
MDy Quantity of methane recovered and fuelled or flared in the year y tonnes CH4year
TMfuelledy Quantity of methane fuelled in the year y tonnes CH4year
TMflaredy Quantity of methane flared in year y tonnes CH4year
Where
TMfuelledy = FVfuelledh fvCH4h ηfuelledh ρCH4n) 1000 Equation B
Where Description Units
TMfuelledy Quantity of methane fuelled in the year y tonnes CH4year
FVfuelledh Volumetric flow rate of the fuelled biogas gas at normal conditions in
hour h
Nm3 biogashour
ηfuelledh 100 for gainful purpose26
fvCH4h Volumetric fraction of methane in the biogas gas in the hour h
ρCH4n Density of methane at normal conditions kgCH4Nm3CH4
And
TMflaredy = FVflaredh fvCH4h ηflareh ρCH4n) 1000 Equation C
Where Description Units
TMflaredy Quantity of methane flared in year y tonnes CH4year
FVflaredh Volumetric flow rate of the flared biogas gas at normal conditions in
hour h
Nm3 biogashour
26 AMS-IIIH point 35
PROJECT DESIGN DOCUMENT FORM (CDM-SSC-PDD) - Version 03
CDM ndash Executive Board
35
ηflareh Flare efficiency in the hour h
fvCH4h Volumetric fraction of methane in the biogas gas in the hour h
ρCH4n Density of methane at normal conditions kgCH4Nm3CH4
Data Parameter ID1 Qwwy
Data unit m3 month
Description The flow of wastewater entering the bio-digester
Source of data Measurement by project participant by using a flowmeter
Value of data ~ 28000
Brief description of
measurement methods and
procedures to be applied
The flow is measured with an online flow meter or equivalent
QAQC procedures to be
applied (if any) Data are monitored continuously and recorded periodically
(monthly or at shorter interval) in a data log file (DLF)
Uncertainty level of data low
Maintenance and calibration as per manufacturer‟s specifications
or at least once every three (3) years
Any comment
Data Parameter ID2 CODwwuntreatedy
Data unit tCOD m3
Description Raw COD of wastewater entering the bio-digester
Source of data Laboratory (internal and external)
Value of data ~ 0030230
Brief description of
measurement methods and
procedures to be applied
Measure of COD according to national or international standards
COD is measure through representative sampling
QAQC procedures to be
applied (if any) Minimum once a month COD sampling to ensure a 9010
confidenceprecision level
COD reports are recorded manually
Uncertainty level of data low
Maintenance and calibration as per manufacturer‟s specifications
or at least once every three (3) years for internal laboratory
equipment
Any comment
Data Parameter ID3 CODwwtreatedy
Data unit tCOD m3
Description COD of treated wastewater leaving the bio-digester
Source of data Laboratory (internal and external)
Value of data ~ 0003023
Brief description of
measurement methods and
procedures to be applied
Measure of COD according to national or international standards
COD is measure through representative sampling
QAQC procedures to be
applied (if any) Minimum once a month COD sampling to ensure a 9010
confidenceprecision level
COD reports are recorded manually
Uncertainty level of data low
PROJECT DESIGN DOCUMENT FORM (CDM-SSC-PDD) - Version 03
CDM ndash Executive Board
36
Maintenance and calibration as per manufacturer‟s specifications
or at least once every three (3) years for internal laboratory
equipment
Any comment
Data Parameter ID5 End-use of the final sludge
Data unit ndash
Description The final sludge generated by the project activity will be sent to control
landfill site if any
Source of data By project participant
Value of data ndash
Brief description of
measurement methods and
procedures to be applied
The final disposal of the sludge will be monitored during the crediting
period if any For each disposal of the sludge the following will be
recorded disposal site and date of disposal
QAQC procedures to be
applied (if any)
Any comment
Data Parameter ID6 FVflaredh
Data unit Nm3 hour
Description Volumetric flow of biogas recovered and flared at normal conditions in
the hour h
Source of data By project participant
Value of data 0
Brief description of
measurement methods and
procedures to be applied
The volume of biogas will be measured with a normalised flow meter or
calculated from the volumetric flow pressure temperature
Biogas volume and methane content measurements shall be on the same
basis (wet or dry)
QAQC procedures to be
applied (if any) The biogas flow is monitored continuously recorded and stored
electronically in a data log file (DLF) (monthly or at shorter
interval)
Data Parameter ID4 CODww dischargey
Data unit tCOD m3
Description COD of treated wastewater discharge into river by treatment system
Source of data Laboratory (internal and external)
Value of data ~ 0000100
Brief description of
measurement methods and
procedures to be applied
Measure of COD according to national or international standards
COD is measure through representative sampling
QAQC procedures to be
applied (if any) Minimum once a month COD sampling to ensure a 9010
confidenceprecision level
COD reports are recorded manually
Uncertainty level of data low
Maintenance and calibration as per manufacturer‟s specifications
or at least once every three (3) years for internal laboratory
equipment
Any comment
PROJECT DESIGN DOCUMENT FORM (CDM-SSC-PDD) - Version 03
CDM ndash Executive Board
37
Uncertainty level of data low
Maintenance and calibration as per manufacturer‟s specifications
or at least once every 3 years
Any comment
Data Parameter ID7 FVfuelledgas engineh
Data unit Nm3 hour
Description Volumetric flow of biogas recovered and fuelled (gas engine) at normal
conditions in the hour h
Source of data By project participant
Value of data ~ 509
Brief description of
measurement methods and
procedures to be applied
The volume of biogas will be measured with a normalised flow meter or
calculated from the volumetric flow of biogas pressure temperature
Biogas volume and methane content measurements shall be on the same
basis (wet or dry)
QAQC procedures to be
applied (if any) The biogas flow is monitored continuously recorded and stored
electronically in a data log file (DLF) (monthly or at shorter
interval)
Uncertainty level of data low
Maintenance and calibration as per manufacturer‟s specifications
or at least once every 3 years
Any comment
Data Parameter ID8 FVfuelledboilerh
Data unit Nm3 hour
Description Volumetric flow of biogas recovered and fuelled (boilers) at normal
conditions in the hour h
Source of data By project participant
Value of data ~ 0
Brief description of
measurement methods and
procedures to be applied
The volume of biogas will be measured with a normalised flow meter or
calculated from the volumetric flow of biogas pressure temperature
Biogas volume and methane content measurements shall be on the same
basis (wet or dry)
QAQC procedures to be
applied (if any) The biogas flow is monitored continuously recorded and stored
electronically in a data log file (DLF) (monthly or at shorter
interval)
Uncertainty level of data low
Maintenance and calibration as per manufacturer‟s specifications
or at least once every 3 years
Any comment
Data Parameter ID9 wCH4h
Data unit
Description Methane content in biogas in same basis (wetdry) as the biogas flows in
year y
Source of data By project participant using a gas analyzer
Value of data ~ 60
PROJECT DESIGN DOCUMENT FORM (CDM-SSC-PDD) - Version 03
CDM ndash Executive Board
38
Brief description of
measurement methods and
procedures to be applied
Using calibrated gas analyzer either continuous or periodical
measurement at confidenceprecision level of 9010
QAQC procedures to be
applied (if any) In case a continuous gas analyser is used data will be recorded
and stored electronically in a data log file (DLF) every hour or at
shorter interval
Uncertainty level of data low
Maintenance and calibration as per manufacturer‟s specifications
or at least once every 3 years
Any comment See also clarification by EB Meth Panel 30102009 ndash SSC_360
httpcdmunfcccintUserManagementFileStorageAM_CLAR_
QS83SX5B7WM6UGZE31JYQEQ4F65F6V
The biogas flow and the methane content measurements shall be
carried out close to each others
Data Parameter ID10 Tbiogas
Data unit ordmC
Description Temperature of biogas
Source of data Temperature probe
Value of data 20 ndash 65
Brief description of
measurement methods and
procedures to be applied
By project participant
QAQC procedures to be
applied (if any) Shall be measured and recorded at the same time when methane
content in biogas (ID8) is measured
Uncertainty level of data low
Maintenance and calibration as per manufacturer‟s specifications
or at least once every 3 years
Any comment Pressure and temperature are required to determine the density of
the methane If the biogas flow meter employed measures flow
pressure and temperature and displaysoutputs normalised flow of
biogas there is no need to separate monitoring of pressure and
temperature of the biogas
Data Parameter ID11 Pbiogas
Data unit Bar(g)
Description Pressure of biogas
Source of data By project participant
Value of data 50 ndash 200 mbar
Brief description of
measurement methods and
procedures to be applied
Pressure measurement device
QAQC procedures to be
applied (if any) Shall be measured and recorded at the same time when methane
content in biogas (ID8) is measured
Uncertainty level of data low
Maintenance and calibration as per manufacturer‟s specifications
or at least once every three (3) years
Any comment Pressure and temperature are required to determine the density of
the methane If the biogas flow meter employed measures flow
PROJECT DESIGN DOCUMENT FORM (CDM-SSC-PDD) - Version 03
CDM ndash Executive Board
39
pressure and temperature and displaysoutputs normalised flow of
biogas there is no need to separate monitoring of pressure and
temperature of the biogas
Shall be measured at the same time when methane content in
biogas (ID9) is measured
Parameter ID12 ηflareh (enclosed flare)
Unit
Description Enclosed flare efficiency in the hour h
Source of data Calculated
Value of data 0 or 50 or 90
Brief description of
measurement methods and
procedures to be applied
This yearly efficiency will be based on hourly flare efficiencies calculated
as per the provisions in the ldquoTool to determine project emissions from
flaring gases containing methanerdquo
The hourly flare efficiency will be calculated based on
0 if the temperature in the exhaust gas of the flare (Tflare) is
below 500 degC for more than 20 minutes during the hour h
50 if the temperature in the exhaust gas of the flare (Tflare) is
above 500 degC for more than 40 minutes during the hour h but the
manufacturer‟s specifications on proper operation of the flare are
not met at any point in time during the hour h
90 if the temperature in the exhaust gas of the flare (Tflare) is
above 500 degC for more than 40 minutes during the hour h and the
manufacturer‟s specifications on proper operation of the flare are
met continuously during the hour h
QAQC procedures to be
applied (if any) Data are logged hourly in a data log file (DLF)
Uncertainty level of data low
Any comment For enclosed flare
Or
Parameter ID13 ηflareh (open flare)
Unit
Description Flare efficiency in the hour h
Source of data Calculated
Value of data 0 or 50
Brief description of
measurement methods and
procedures to be applied
This yearly efficiency will be based on hourly flare efficiencies calculated
as per the provisions in the ldquoTool to determine project emissions from
flaring gases containing methanerdquo
The hourly flare efficiency will be calculated based on the duration of
time during which the flame is detected by the thermocouple (or flame
detector) installed in the open flare
Flare efficiency in hour h is based on default values
0 if the flame detected for not more than 20 minutes during the
hour h and
PROJECT DESIGN DOCUMENT FORM (CDM-SSC-PDD) - Version 03
CDM ndash Executive Board
40
50 if the flame detected for more than 20 minutes during the
hour h
A flame detector or thermocouple will be used
QAQC procedures to be
applied (if any) Data are logged hourly in a data log file (DLF)
Uncertainty level of data low
Any comment The only monitored parameter related to the flare is its efficiency Indeed
according to the clarification SSC_19927 of the methodology AMS IIIH
version 9 accepted by the SSC WG on the 3092008 ldquoIf a thermocouple
is used as a flame detection system it is sufficient to reach the given
minimum temperature from the manufacturer ldquo Hence it is not necessary
to monitor the temperature of the open type flares (Tflare)
Data Parameter ID14 ECPJjy
Data unit MWh
Description The yearly grid electricity consumption of the project activity for the year
bdquoy‟
Source of data Onsite instrument
Value of data ~749
Brief description of
measurement methods and
procedures to be applied
The grid electricity consumption of the project activity is measured
continuously with an energy meter (cumulative reading)
QAQC procedures to be
applied (if any) Data are monitored continuously and recorded periodically
(yearly or at shorter interval) in a data log file (DLF)
Uncertainty level of data low
Maintenance and calibration as per manufacturer‟s specifications
or at least once every three (3) years
Any comment
Data Parameter ID15 EGBLy
Data unit MWh
Description Quantity of net electricity generated and send to grid in year y
Source of data By project participant
Value of data ~ 6798
Brief description of
measurement methods and
procedures to be applied
The electricity generated and sent to grid is measured continuously with
an energy meter (cumulative readings)
QAQC procedures to be
applied (if any) Data are monitored continuously and recorded periodically
(yearly or at shorter interval) in a data log file (DLF)
Uncertainty level of data low
Maintenance and calibration as per manufacturer‟s specifications
or at least once every 3 years
Any comment As per AMS-ID
27 The clarification SSC_199 if available here (last access on the 24052011)
httpcdmunfcccintfilestorageAM_AM_CLAR_HIOZ5CS1PASC187C0JQ668L2E9RCRJResponse20WG20provided
20at20SSC20WG2017pdft=bU98MTMwNjIxNjY0OS4xMQ==|BOKHqtO94N6XF1N2N1vo8Ori-Rc=
PROJECT DESIGN DOCUMENT FORM (CDM-SSC-PDD) - Version 03
CDM ndash Executive Board
41
Or
Data Parameter ID16 EGmilly
Data unit MWh
Description Quantity of annual output of renewable energy sent to the mill in year y
Source of data By project participant
Value of data ~ 0
Brief description of
measurement methods and
procedures to be applied
The electricity generated and sent to mill to displace diesel use in diesel
gensets is measured continuously with an energy meter (cumulative
readings)
QAQC procedures to be
applied (if any) Data are monitored continuously and recorded periodically
(yearly or at shorter interval) in a data log file (DLF)
Uncertainty level of data low
Maintenance and calibration as per manufacturer‟s specifications
or at least once every 3 years
Any comment As per AMS-IA
Data Parameter ID17 Displacement of Biomass
Data unit Mt
Description Total amount of biomass (PKS) displaced from biomass boilers
Source of data Weighing bridge
Value of data Measurement at site
Brief description of
measurement methods and
procedures to be applied
Biomass (PKS) displaced due to the project activity will be weighed
using weighing bridge at the palm oil mill
QAQC procedures to be
applied (if any) Monthly calculation based on every single trip of trucks recorded
Data is recorded manually in a data log file based on the weighing
records
Maintenance and calibration as per manufacturer‟s specifications
Uncertainty level of data low
Any comment In the project activity the biomass (PKS) displaced will not be stored
under anaerobic conditions The conditions of onsite storage are identical
in the baseline as in the project activity The biomass will be sold to the
market on a regular basis PEbiomassy = 0
A final monitoring plan will be prepared prior the initial verification based on the as-built project activity
It will address the following aspects
MONITORING
The Project will be managed by CME with the involvement from Project Implementer CME will ensure
safety in operation of the plant as well as in the monitoring of emission reduction which is generated from
the project activity
CME will implement and be responsible for the monitoring plan Their responsibility covers operation of
the monitoring maintenance of the monitoring equipment data collection and archiving and
management of total scheme of the monitoring CME and Project Implementer will assign specific trained
PROJECT DESIGN DOCUMENT FORM (CDM-SSC-PDD) - Version 03
CDM ndash Executive Board
42
personnel during project implementation for the overall monitoring measurement and reporting of key
parameters as required in this PDD
DATA LOGGING AND STORAGE
The data measured by the instruments will be collected and stored in a data logging system The data will
be retrieved remotely by modem or directly on site
If data cannot be retrieved no emissions reductions will be claimed for the period of data failure The
data collected will be recorded in a central data base Access to production data will be restricted All
records and data (hard copy and soft copy) will be archived up to two years after the end of the crediting
period or the last issuance of CERs for this project activity whichever occurs later
CALIBRATION AND MAINTENANCE PROCEDURES MALFUNCTION OF EQUIPMENT
Maintenance includes all preventive and corrective actions necessary for the good functioning of the
equipment such as
Visual control of the equipment state and real-time check of displayed parameters
Cleaning up the equipment and the sensors
Adding lubricant
Replacement and change of defective parts
Calibration of equipment consists in verifying by comparison with a standard the accuracy of a
measuring instrument
Measuring instruments will be periodically and appropriately calibrated according to the procedures
timing and methods recommended by the manufacturer or nationalinternational standards as available
General malfunction of equipment
Daily inspections of the equipment will allow controlling equipment failure If equipment fails the
supplier will be notified and repairs will be carried out If the damaged equipment cannot be repaired it
will be replaced at the earliest In some cases portable tools will be used in order to carry out daily
monitoring of the missing parameter(s) In such case this data will be recorded manually
Discrepancies
To avoid discrepancies between projected data in the PDD and actual data (eg due to deferred starting
date malfunction of equipment) cross-checks between internal meter readings and external sources (eg
electricity invoices) will be carried out Any source of inconsistencies will be clarified
Case of emergency
For the case of emergency (earthquakes explosions fires etc) an emergency preparedness plan will be
adapted to the project activity All employees involved in the project on-site will be trained in the code of
conduct and required actions at time of commissioning of the plant
PROJECT DESIGN DOCUMENT FORM (CDM-SSC-PDD) - Version 03
CDM ndash Executive Board
43
OPERATIONAL AND MANAGEMENT STRUCTURE
The CDM monitoring team will be composed by the following staff
Position Report to
Operators
Project owner Supervisors (technicalmaintenance)
Operation Engineer
CDM monitoring project manager External CDM consultant
TRAINING OF MONITORING PERSONNEL
The maintenance will be conducted in-house by staff employed and trained by the Project Participants
Employees involved in the monitoring will be trained internally andor externally Training may include
inter alia
a) Review of equipment and captors
b) Calibration requirement
c) Configuration of monitoring equipment
d) Maintenance requirement
C1 Please indicate the level at which environmental analysis as per requirements of the CDM
modalities and procedures is undertaken Justify the choice of level at which the environmental
analysis is undertaken
radic Please tick if this information is provided at the PoA level In this case sections C2 and C3
need not be completed in this form
C2 Documentation on the analysis of the environmental impacts including transboundary
impacts
The host country does not require an analysis of environmental impacts As the project involves reduction
of GHG through recovery and controlled combustion which improves the quality of air therefore there
are no significant environmental impacts identified
C3 Please state whether an environmental impact assessment is required for a typical CPA
included in the programme of activities (PoA) in accordance with the host Party lawsregulations
In accordance with Malaysia environmental regulations Environmental Quality (Prescribed Activities
Environmental Impact Assessment) Order 1987 an Environmental Impact Assessment (EIA) is not
required for this CPA
PROJECT DESIGN DOCUMENT FORM (CDM-SSC-PDD) - Version 03
CDM ndash Executive Board
44
SECTION D Stakeholdersrsquo comments
D1 Please indicate the level at which local stakeholder comments are invited Justify the
choice
Please tick if this information is provided at the PoA level In this case sections D2 to D4 need
not be completed in this form
D2 Brief description how comments by local stakeholders have been invited and compiled
The stakeholder meeting was conducted at the office of Kilang Sawit Felda Triang on 05032012 There
were 37 stakeholders attending the consultation Posters were pasted at the guard house and at the
entrance to office 1 week before the stakeholder consultation to inform the locals stakeholders which
comprise mostly the workers of the mill 20 stakeholders out of the 37 who attended the consultation are
2nd generation of the Felda settlers who live in the vicinity to the project activity and adequately represent
the local community composed entirely of Felda settlers (no other people live in the vicinity of this
remote plantation) Continuous input of ideascomments were allowed to all stakeholders who could
either send their input though an email account especially setup for the biogas project or directly inform
the project proponents
During the meeting presentations were made by the project owner to outline the proposed project activity
in a non-technical manner (including environmental social and technological considerations) climate
change and the role of the CDM Attendees were given opportunity to raise their concern and opinion
about the proposed project activity during the question and answer session
D3 Summary of the comments received
PROJECT DESIGN DOCUMENT FORM (CDM-SSC-PDD) - Version 03
CDM ndash Executive Board
45
Below are the questions raised during the stakeholder meeting
NAME QUESTION
Mohd Tarmizi Bin Mat
Daud What is CDM in Bahasa Malaysia
Mohd Tarmizi Bin Mat
Daud What is DoE‟s standard for treated water released into river
Mohd Azizi Bin Abdul
Aziz
Would the biogas be captured from the existing effluent treatment ponds or a
new structure
Azhar Bin Abdul What to do with the captured biogas from the bioreactor
D4 Report on how due account was taken of any comments received
Below are the answers to the questions asked during the stakeholder meeting
QUESTION ANSWER
What is CDM in Bahasa Malaysia
The meaning of CDM in Bahasa Malaysia is Mekanisme
Pembangunan Bersih or in English is Clean Development
Mechanism
By Abd Karim Bin Mohd Zin
What is DoE‟s standard for treated
water released into river
The discharge standard for BOD into river is less than 100ppm
By Abd Karim Bin Mohd Zin
Would the biogas be captured from
the existing effluent treatment
ponds or a new structure
New bioreactor will be constructed to replace the existing anaerobic
lagoon treatment system The new bioreactor will capture the
biogas produced from this anaerobic treatment process
By Abd Karim Bin Mohd Zin
What to do with the captured
biogas from the bioreactor
The biogas recovered from the bioreactor will mainly contain
methane (approximately 60) and the rest are CO2 H2 and H2S
Currently the biogas is just released to the atmosphere from the
existing open lagoons system During the project activity captured
biogas will be combusted thus will improve the air quality
By Abd Karim Bin Mohd Zin
PROJECT DESIGN DOCUMENT FORM (CDM-SSC-PDD) - Version 03
CDM ndash Executive Board
46
Annex 1
CONTACT INFORMATION ON ENTITYINDIVIDUAL RESPONSIBLE FOR THE SMALL-
SCALE CPA
Organization Felda Palm Industries Sdn Bhd (359584-V)
StreetPOBox Jalan Gurney 1
Building Balai Felda 4th Floor
City Kuala Lumpur
StateRegion Wilayah Persekutuan
PostfixZIP 54000
Country Malaysia
Telephone (03) 2692 8066
FAX (03) 2693 4148
URL wwwfeldanetmy
Represented by
Title Head of Department
Salutation Mr
Last Name Busu
Middle Name
First Name Zainuri
Department Biomass
Mobile
Direct FAX
Direct tel
Personal E-Mail zainuribfeldanetmy
Organization Ably Carbon Sdn Bhd
StreetPOBox Jalan Ipoh Kecil
Building No 17
City Kuala Lumpur
StateRegion
PostfixZIP 50350
Country Malaysia
Telephone +60 3 4042 1177
FAX +60 3 4044 4166
E-Mail stephanevidailletably-carboncom
URL
Represented by Stephane Vidaillet
Title Chairman
Salutation Mr
Last Name Vidaillet
Middle Name
First Name Steacutephane
Department
Mobile +33 6 59111 5600
Direct FAX
PROJECT DESIGN DOCUMENT FORM (CDM-SSC-PDD) - Version 03
CDM ndash Executive Board
47
Direct tel
Personal E-Mail stephanevidailletably-carboncom
PROJECT DESIGN DOCUMENT FORM (CDM-SSC-PDD) - Version 03
CDM ndash Executive Board
48
Annex 2
INFORMATION REGARDING PUBLIC FUNDING
The project activity is not receiving any funding from parties included in Annex 1 of the Kyoto Protocol
SMALL-SCALE CDM PROGRAMME ACTIVITY DESIGN DOCUMENT FORM (CDM-SSC-CPA-DD) - Version 01
NAME TITLE OF THE PoA Biogas Recovery and Utilization PoA Projects in
Malaysia
CDM ndash Executive Board page 49
This template shall not be altered It shall be completed without modifyingadding headings or logo format or font
Annex 3
BASELINE INFORMATION
1 2
Year 2009 2010 2011 2012 2013 2014
FFB (mtyr) 343720 345910 310250 333293 333293 333293
POME Volume
(cumyr)[1] 343720 345910 310250 333293 333293 333293
Mill Opearing hour (hryr) 68865 69225 6209 6673 6673 6673
PKS (mtyr) 18905 19025 17064 18331 18331 18331
3 4 5 6 7 8 9 10
2015 2016 2017 2018 2019 2020 2021 2022
333293 333293 333293 333293 333293 333293 333293 333293
333293 333293 333293 333293 333293 333293 333293 333293
6673 6673 6673 6673 6673 6673 6673 6673
18331 18331 18331 18331 18331 18331 18331 18331
SMALL-SCALE CDM PROGRAMME ACTIVITY DESIGN DOCUMENT FORM (CDM-SSC-CPA-DD) - Version 01
NAME TITLE OF THE PoA Biogas Recovery and Utilization PoA Projects in
Malaysia
CDM ndash Executive Board page 50
This template shall not be altered It shall be completed without modifyingadding headings or logo format or font
10 days measurement campaign for baseline wastewater treatment system
Day Date
ETP
Inlet
Anaerobic
system (mgl)
Outlet
Anaerobic
system (mgl)
Outlet Algae
System (mgl)
Final
Discharge to
River (mgl)
1 23-Feb-12 35693 3120 811 603
2 25-Feb-12 19511 2559 1186 83
3 26-Feb-12 32864 2767 749 437
4 27-Feb-12 30195 2330 1210 404
5 28-Feb-12 32436 1927 1188 941
6 29-Feb-12 38259 4256 896 717
7 1-Mar-12 28717 3584 1232 695
8 3-Mar-12 31002 4660 1658 1210
9 4-Mar-12 22400 4346 1389 963
10 5-Mar-12 31226 4301 1971 1165
Average 30230 3385 1229 722
ETP
COD removal efficiency (anaerobic system) 8880
COD removal efficiency (Facultativealgae system) 6369
COD removal efficiency (Bio-polishing system) 4127
Total COD removal efficiency of the treatment system 9761
The COD of the raw effluent during ex-post may vary from the one year historical records depending on
the improvement of the production process (outside of project boundary) thus ERex-post may vary from the
estimated ERex-ante
SMALL-SCALE CDM PROGRAMME ACTIVITY DESIGN DOCUMENT FORM (CDM-SSC-CPA-DD) - Version 01
NAME TITLE OF THE PoA Biogas Recovery and Utilization PoA Projects in
Malaysia
CDM ndash Executive Board page 51
This template shall not be altered It shall be completed without modifyingadding headings or logo format or font
Annex 4
MONITORING INFORMATION
General information
Monitoring refers to the collection and archiving of all relevant data necessary for determining the
baseline measuring anthropogenic emissions by sources of greenhouse gases (GHG) within the project
boundary of a CDM project activity and leakage It includes developing suitable data collection methods
and data interpretation techniques for monitoring and verification of GHG emissions
On-line monitoring system
Most key meters required to determine GHG emissions and emission reductions will be monitored from a
central control point which will record meter readings at a pre-determined interval
Ensuring adequate maintenance and calibration of monitoring instruments
Specific maintenance repair or replacement of monitoring equipment will be recorded dated and
described
The calibration will occur at intervals determined on the basis of instrument manufacturers
recommendations stability purpose usage and history of repeatability Recalibration should be
performed whenever an event occurs that places the accuracy of the instrument in doubt
Calibration will take place at least once every three (3) years to ensure that the monitoring
equipments are properly installed and functioning properly
Calibration will be performed according to national or international standards
Last calibration certificates will be provided during periodic verification
Sampling procedure
Wherever a statistical sample is used for monitoring the ldquogeneral guidelines for sampling and surveys for
SSC project activitiesrdquo shall be used COD shall be measured from a composite sample to obtain a
representative value
Data archiving
The monitored data will be kept for a minimum of 2 years after the end of the crediting years by using
paper documents or electronic files
Identification of non-conformities
A verification of inconsistencies of the data recorded will be performed based for example on
The comparison of the calculated quantities of methane versus expected
Spot checks of field instruments (local reading) and data in the log file
Any discrepancies (completeness calculation errors transcription errors instrument calibration issues)
will be analyzed and actions taken to correct the problem
Ensuring adequate training of staff
All new staff members will undergo bdquoon job training‟ covering the monitoring requirements
The monitoring plan will be made available to staff member involved in the monitoring
A copy will be located in the control room at the site
SMALL-SCALE CDM PROGRAMME ACTIVITY DESIGN DOCUMENT FORM (CDM-SSC-CPA-DD) - Version 01
NAME TITLE OF THE PoA Biogas Recovery and Utilization PoA Projects in
Malaysia
CDM ndash Executive Board page 52
This template shall not be altered It shall be completed without modifyingadding headings or logo format or font
During the training the employees will sign a training attendance list All training records shall
be documented inclusive of training attendance training memo and training material if any
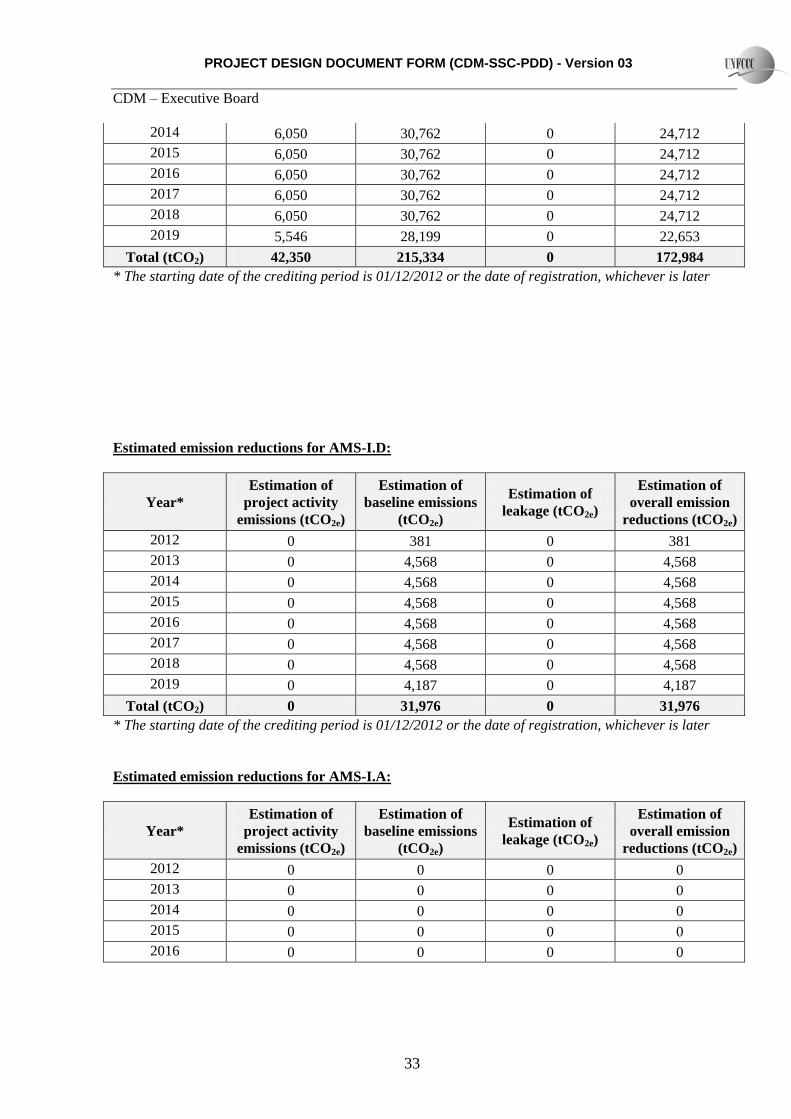
PROJECT DESIGN DOCUMENT FORM (CDM-SSC-PDD) - Version 03
CDM ndash Executive Board
34
2017 0 0 0 0
2018 0 0 0 0
2019 0 0 0 0
Total (tCO2) 0 0 0 0
The starting date of the crediting period is 01122012 or the date of registration whichever is later
B6 Application of the monitoring methodology and description of the monitoring plan
B61 Description of the monitoring plan
The parameters to be monitored are
Please note that the amount of methane recovered and fuelled or flared (MDy ) is calculated as follows
MDy = TMfuelledy + TMflaredy Equation A
Where Description Units
MDy Quantity of methane recovered and fuelled or flared in the year y tonnes CH4year
TMfuelledy Quantity of methane fuelled in the year y tonnes CH4year
TMflaredy Quantity of methane flared in year y tonnes CH4year
Where
TMfuelledy = FVfuelledh fvCH4h ηfuelledh ρCH4n) 1000 Equation B
Where Description Units
TMfuelledy Quantity of methane fuelled in the year y tonnes CH4year
FVfuelledh Volumetric flow rate of the fuelled biogas gas at normal conditions in
hour h
Nm3 biogashour
ηfuelledh 100 for gainful purpose26
fvCH4h Volumetric fraction of methane in the biogas gas in the hour h
ρCH4n Density of methane at normal conditions kgCH4Nm3CH4
And
TMflaredy = FVflaredh fvCH4h ηflareh ρCH4n) 1000 Equation C
Where Description Units
TMflaredy Quantity of methane flared in year y tonnes CH4year
FVflaredh Volumetric flow rate of the flared biogas gas at normal conditions in
hour h
Nm3 biogashour
26 AMS-IIIH point 35
PROJECT DESIGN DOCUMENT FORM (CDM-SSC-PDD) - Version 03
CDM ndash Executive Board
35
ηflareh Flare efficiency in the hour h
fvCH4h Volumetric fraction of methane in the biogas gas in the hour h
ρCH4n Density of methane at normal conditions kgCH4Nm3CH4
Data Parameter ID1 Qwwy
Data unit m3 month
Description The flow of wastewater entering the bio-digester
Source of data Measurement by project participant by using a flowmeter
Value of data ~ 28000
Brief description of
measurement methods and
procedures to be applied
The flow is measured with an online flow meter or equivalent
QAQC procedures to be
applied (if any) Data are monitored continuously and recorded periodically
(monthly or at shorter interval) in a data log file (DLF)
Uncertainty level of data low
Maintenance and calibration as per manufacturer‟s specifications
or at least once every three (3) years
Any comment
Data Parameter ID2 CODwwuntreatedy
Data unit tCOD m3
Description Raw COD of wastewater entering the bio-digester
Source of data Laboratory (internal and external)
Value of data ~ 0030230
Brief description of
measurement methods and
procedures to be applied
Measure of COD according to national or international standards
COD is measure through representative sampling
QAQC procedures to be
applied (if any) Minimum once a month COD sampling to ensure a 9010
confidenceprecision level
COD reports are recorded manually
Uncertainty level of data low
Maintenance and calibration as per manufacturer‟s specifications
or at least once every three (3) years for internal laboratory
equipment
Any comment
Data Parameter ID3 CODwwtreatedy
Data unit tCOD m3
Description COD of treated wastewater leaving the bio-digester
Source of data Laboratory (internal and external)
Value of data ~ 0003023
Brief description of
measurement methods and
procedures to be applied
Measure of COD according to national or international standards
COD is measure through representative sampling
QAQC procedures to be
applied (if any) Minimum once a month COD sampling to ensure a 9010
confidenceprecision level
COD reports are recorded manually
Uncertainty level of data low
PROJECT DESIGN DOCUMENT FORM (CDM-SSC-PDD) - Version 03
CDM ndash Executive Board
36
Maintenance and calibration as per manufacturer‟s specifications
or at least once every three (3) years for internal laboratory
equipment
Any comment
Data Parameter ID5 End-use of the final sludge
Data unit ndash
Description The final sludge generated by the project activity will be sent to control
landfill site if any
Source of data By project participant
Value of data ndash
Brief description of
measurement methods and
procedures to be applied
The final disposal of the sludge will be monitored during the crediting
period if any For each disposal of the sludge the following will be
recorded disposal site and date of disposal
QAQC procedures to be
applied (if any)
Any comment
Data Parameter ID6 FVflaredh
Data unit Nm3 hour
Description Volumetric flow of biogas recovered and flared at normal conditions in
the hour h
Source of data By project participant
Value of data 0
Brief description of
measurement methods and
procedures to be applied
The volume of biogas will be measured with a normalised flow meter or
calculated from the volumetric flow pressure temperature
Biogas volume and methane content measurements shall be on the same
basis (wet or dry)
QAQC procedures to be
applied (if any) The biogas flow is monitored continuously recorded and stored
electronically in a data log file (DLF) (monthly or at shorter
interval)
Data Parameter ID4 CODww dischargey
Data unit tCOD m3
Description COD of treated wastewater discharge into river by treatment system
Source of data Laboratory (internal and external)
Value of data ~ 0000100
Brief description of
measurement methods and
procedures to be applied
Measure of COD according to national or international standards
COD is measure through representative sampling
QAQC procedures to be
applied (if any) Minimum once a month COD sampling to ensure a 9010
confidenceprecision level
COD reports are recorded manually
Uncertainty level of data low
Maintenance and calibration as per manufacturer‟s specifications
or at least once every three (3) years for internal laboratory
equipment
Any comment
PROJECT DESIGN DOCUMENT FORM (CDM-SSC-PDD) - Version 03
CDM ndash Executive Board
37
Uncertainty level of data low
Maintenance and calibration as per manufacturer‟s specifications
or at least once every 3 years
Any comment
Data Parameter ID7 FVfuelledgas engineh
Data unit Nm3 hour
Description Volumetric flow of biogas recovered and fuelled (gas engine) at normal
conditions in the hour h
Source of data By project participant
Value of data ~ 509
Brief description of
measurement methods and
procedures to be applied
The volume of biogas will be measured with a normalised flow meter or
calculated from the volumetric flow of biogas pressure temperature
Biogas volume and methane content measurements shall be on the same
basis (wet or dry)
QAQC procedures to be
applied (if any) The biogas flow is monitored continuously recorded and stored
electronically in a data log file (DLF) (monthly or at shorter
interval)
Uncertainty level of data low
Maintenance and calibration as per manufacturer‟s specifications
or at least once every 3 years
Any comment
Data Parameter ID8 FVfuelledboilerh
Data unit Nm3 hour
Description Volumetric flow of biogas recovered and fuelled (boilers) at normal
conditions in the hour h
Source of data By project participant
Value of data ~ 0
Brief description of
measurement methods and
procedures to be applied
The volume of biogas will be measured with a normalised flow meter or
calculated from the volumetric flow of biogas pressure temperature
Biogas volume and methane content measurements shall be on the same
basis (wet or dry)
QAQC procedures to be
applied (if any) The biogas flow is monitored continuously recorded and stored
electronically in a data log file (DLF) (monthly or at shorter
interval)
Uncertainty level of data low
Maintenance and calibration as per manufacturer‟s specifications
or at least once every 3 years
Any comment
Data Parameter ID9 wCH4h
Data unit
Description Methane content in biogas in same basis (wetdry) as the biogas flows in
year y
Source of data By project participant using a gas analyzer
Value of data ~ 60
PROJECT DESIGN DOCUMENT FORM (CDM-SSC-PDD) - Version 03
CDM ndash Executive Board
38
Brief description of
measurement methods and
procedures to be applied
Using calibrated gas analyzer either continuous or periodical
measurement at confidenceprecision level of 9010
QAQC procedures to be
applied (if any) In case a continuous gas analyser is used data will be recorded
and stored electronically in a data log file (DLF) every hour or at
shorter interval
Uncertainty level of data low
Maintenance and calibration as per manufacturer‟s specifications
or at least once every 3 years
Any comment See also clarification by EB Meth Panel 30102009 ndash SSC_360
httpcdmunfcccintUserManagementFileStorageAM_CLAR_
QS83SX5B7WM6UGZE31JYQEQ4F65F6V
The biogas flow and the methane content measurements shall be
carried out close to each others
Data Parameter ID10 Tbiogas
Data unit ordmC
Description Temperature of biogas
Source of data Temperature probe
Value of data 20 ndash 65
Brief description of
measurement methods and
procedures to be applied
By project participant
QAQC procedures to be
applied (if any) Shall be measured and recorded at the same time when methane
content in biogas (ID8) is measured
Uncertainty level of data low
Maintenance and calibration as per manufacturer‟s specifications
or at least once every 3 years
Any comment Pressure and temperature are required to determine the density of
the methane If the biogas flow meter employed measures flow
pressure and temperature and displaysoutputs normalised flow of
biogas there is no need to separate monitoring of pressure and
temperature of the biogas
Data Parameter ID11 Pbiogas
Data unit Bar(g)
Description Pressure of biogas
Source of data By project participant
Value of data 50 ndash 200 mbar
Brief description of
measurement methods and
procedures to be applied
Pressure measurement device
QAQC procedures to be
applied (if any) Shall be measured and recorded at the same time when methane
content in biogas (ID8) is measured
Uncertainty level of data low
Maintenance and calibration as per manufacturer‟s specifications
or at least once every three (3) years
Any comment Pressure and temperature are required to determine the density of
the methane If the biogas flow meter employed measures flow
PROJECT DESIGN DOCUMENT FORM (CDM-SSC-PDD) - Version 03
CDM ndash Executive Board
39
pressure and temperature and displaysoutputs normalised flow of
biogas there is no need to separate monitoring of pressure and
temperature of the biogas
Shall be measured at the same time when methane content in
biogas (ID9) is measured
Parameter ID12 ηflareh (enclosed flare)
Unit
Description Enclosed flare efficiency in the hour h
Source of data Calculated
Value of data 0 or 50 or 90
Brief description of
measurement methods and
procedures to be applied
This yearly efficiency will be based on hourly flare efficiencies calculated
as per the provisions in the ldquoTool to determine project emissions from
flaring gases containing methanerdquo
The hourly flare efficiency will be calculated based on
0 if the temperature in the exhaust gas of the flare (Tflare) is
below 500 degC for more than 20 minutes during the hour h
50 if the temperature in the exhaust gas of the flare (Tflare) is
above 500 degC for more than 40 minutes during the hour h but the
manufacturer‟s specifications on proper operation of the flare are
not met at any point in time during the hour h
90 if the temperature in the exhaust gas of the flare (Tflare) is
above 500 degC for more than 40 minutes during the hour h and the
manufacturer‟s specifications on proper operation of the flare are
met continuously during the hour h
QAQC procedures to be
applied (if any) Data are logged hourly in a data log file (DLF)
Uncertainty level of data low
Any comment For enclosed flare
Or
Parameter ID13 ηflareh (open flare)
Unit
Description Flare efficiency in the hour h
Source of data Calculated
Value of data 0 or 50
Brief description of
measurement methods and
procedures to be applied
This yearly efficiency will be based on hourly flare efficiencies calculated
as per the provisions in the ldquoTool to determine project emissions from
flaring gases containing methanerdquo
The hourly flare efficiency will be calculated based on the duration of
time during which the flame is detected by the thermocouple (or flame
detector) installed in the open flare
Flare efficiency in hour h is based on default values
0 if the flame detected for not more than 20 minutes during the
hour h and
PROJECT DESIGN DOCUMENT FORM (CDM-SSC-PDD) - Version 03
CDM ndash Executive Board
40
50 if the flame detected for more than 20 minutes during the
hour h
A flame detector or thermocouple will be used
QAQC procedures to be
applied (if any) Data are logged hourly in a data log file (DLF)
Uncertainty level of data low
Any comment The only monitored parameter related to the flare is its efficiency Indeed
according to the clarification SSC_19927 of the methodology AMS IIIH
version 9 accepted by the SSC WG on the 3092008 ldquoIf a thermocouple
is used as a flame detection system it is sufficient to reach the given
minimum temperature from the manufacturer ldquo Hence it is not necessary
to monitor the temperature of the open type flares (Tflare)
Data Parameter ID14 ECPJjy
Data unit MWh
Description The yearly grid electricity consumption of the project activity for the year
bdquoy‟
Source of data Onsite instrument
Value of data ~749
Brief description of
measurement methods and
procedures to be applied
The grid electricity consumption of the project activity is measured
continuously with an energy meter (cumulative reading)
QAQC procedures to be
applied (if any) Data are monitored continuously and recorded periodically
(yearly or at shorter interval) in a data log file (DLF)
Uncertainty level of data low
Maintenance and calibration as per manufacturer‟s specifications
or at least once every three (3) years
Any comment
Data Parameter ID15 EGBLy
Data unit MWh
Description Quantity of net electricity generated and send to grid in year y
Source of data By project participant
Value of data ~ 6798
Brief description of
measurement methods and
procedures to be applied
The electricity generated and sent to grid is measured continuously with
an energy meter (cumulative readings)
QAQC procedures to be
applied (if any) Data are monitored continuously and recorded periodically
(yearly or at shorter interval) in a data log file (DLF)
Uncertainty level of data low
Maintenance and calibration as per manufacturer‟s specifications
or at least once every 3 years
Any comment As per AMS-ID
27 The clarification SSC_199 if available here (last access on the 24052011)
httpcdmunfcccintfilestorageAM_AM_CLAR_HIOZ5CS1PASC187C0JQ668L2E9RCRJResponse20WG20provided
20at20SSC20WG2017pdft=bU98MTMwNjIxNjY0OS4xMQ==|BOKHqtO94N6XF1N2N1vo8Ori-Rc=
PROJECT DESIGN DOCUMENT FORM (CDM-SSC-PDD) - Version 03
CDM ndash Executive Board
41
Or
Data Parameter ID16 EGmilly
Data unit MWh
Description Quantity of annual output of renewable energy sent to the mill in year y
Source of data By project participant
Value of data ~ 0
Brief description of
measurement methods and
procedures to be applied
The electricity generated and sent to mill to displace diesel use in diesel
gensets is measured continuously with an energy meter (cumulative
readings)
QAQC procedures to be
applied (if any) Data are monitored continuously and recorded periodically
(yearly or at shorter interval) in a data log file (DLF)
Uncertainty level of data low
Maintenance and calibration as per manufacturer‟s specifications
or at least once every 3 years
Any comment As per AMS-IA
Data Parameter ID17 Displacement of Biomass
Data unit Mt
Description Total amount of biomass (PKS) displaced from biomass boilers
Source of data Weighing bridge
Value of data Measurement at site
Brief description of
measurement methods and
procedures to be applied
Biomass (PKS) displaced due to the project activity will be weighed
using weighing bridge at the palm oil mill
QAQC procedures to be
applied (if any) Monthly calculation based on every single trip of trucks recorded
Data is recorded manually in a data log file based on the weighing
records
Maintenance and calibration as per manufacturer‟s specifications
Uncertainty level of data low
Any comment In the project activity the biomass (PKS) displaced will not be stored
under anaerobic conditions The conditions of onsite storage are identical
in the baseline as in the project activity The biomass will be sold to the
market on a regular basis PEbiomassy = 0
A final monitoring plan will be prepared prior the initial verification based on the as-built project activity
It will address the following aspects
MONITORING
The Project will be managed by CME with the involvement from Project Implementer CME will ensure
safety in operation of the plant as well as in the monitoring of emission reduction which is generated from
the project activity
CME will implement and be responsible for the monitoring plan Their responsibility covers operation of
the monitoring maintenance of the monitoring equipment data collection and archiving and
management of total scheme of the monitoring CME and Project Implementer will assign specific trained
PROJECT DESIGN DOCUMENT FORM (CDM-SSC-PDD) - Version 03
CDM ndash Executive Board
42
personnel during project implementation for the overall monitoring measurement and reporting of key
parameters as required in this PDD
DATA LOGGING AND STORAGE
The data measured by the instruments will be collected and stored in a data logging system The data will
be retrieved remotely by modem or directly on site
If data cannot be retrieved no emissions reductions will be claimed for the period of data failure The
data collected will be recorded in a central data base Access to production data will be restricted All
records and data (hard copy and soft copy) will be archived up to two years after the end of the crediting
period or the last issuance of CERs for this project activity whichever occurs later
CALIBRATION AND MAINTENANCE PROCEDURES MALFUNCTION OF EQUIPMENT
Maintenance includes all preventive and corrective actions necessary for the good functioning of the
equipment such as
Visual control of the equipment state and real-time check of displayed parameters
Cleaning up the equipment and the sensors
Adding lubricant
Replacement and change of defective parts
Calibration of equipment consists in verifying by comparison with a standard the accuracy of a
measuring instrument
Measuring instruments will be periodically and appropriately calibrated according to the procedures
timing and methods recommended by the manufacturer or nationalinternational standards as available
General malfunction of equipment
Daily inspections of the equipment will allow controlling equipment failure If equipment fails the
supplier will be notified and repairs will be carried out If the damaged equipment cannot be repaired it
will be replaced at the earliest In some cases portable tools will be used in order to carry out daily
monitoring of the missing parameter(s) In such case this data will be recorded manually
Discrepancies
To avoid discrepancies between projected data in the PDD and actual data (eg due to deferred starting
date malfunction of equipment) cross-checks between internal meter readings and external sources (eg
electricity invoices) will be carried out Any source of inconsistencies will be clarified
Case of emergency
For the case of emergency (earthquakes explosions fires etc) an emergency preparedness plan will be
adapted to the project activity All employees involved in the project on-site will be trained in the code of
conduct and required actions at time of commissioning of the plant
PROJECT DESIGN DOCUMENT FORM (CDM-SSC-PDD) - Version 03
CDM ndash Executive Board
43
OPERATIONAL AND MANAGEMENT STRUCTURE
The CDM monitoring team will be composed by the following staff
Position Report to
Operators
Project owner Supervisors (technicalmaintenance)
Operation Engineer
CDM monitoring project manager External CDM consultant
TRAINING OF MONITORING PERSONNEL
The maintenance will be conducted in-house by staff employed and trained by the Project Participants
Employees involved in the monitoring will be trained internally andor externally Training may include
inter alia
a) Review of equipment and captors
b) Calibration requirement
c) Configuration of monitoring equipment
d) Maintenance requirement
C1 Please indicate the level at which environmental analysis as per requirements of the CDM
modalities and procedures is undertaken Justify the choice of level at which the environmental
analysis is undertaken
radic Please tick if this information is provided at the PoA level In this case sections C2 and C3
need not be completed in this form
C2 Documentation on the analysis of the environmental impacts including transboundary
impacts
The host country does not require an analysis of environmental impacts As the project involves reduction
of GHG through recovery and controlled combustion which improves the quality of air therefore there
are no significant environmental impacts identified
C3 Please state whether an environmental impact assessment is required for a typical CPA
included in the programme of activities (PoA) in accordance with the host Party lawsregulations
In accordance with Malaysia environmental regulations Environmental Quality (Prescribed Activities
Environmental Impact Assessment) Order 1987 an Environmental Impact Assessment (EIA) is not
required for this CPA
PROJECT DESIGN DOCUMENT FORM (CDM-SSC-PDD) - Version 03
CDM ndash Executive Board
44
SECTION D Stakeholdersrsquo comments
D1 Please indicate the level at which local stakeholder comments are invited Justify the
choice
Please tick if this information is provided at the PoA level In this case sections D2 to D4 need
not be completed in this form
D2 Brief description how comments by local stakeholders have been invited and compiled
The stakeholder meeting was conducted at the office of Kilang Sawit Felda Triang on 05032012 There
were 37 stakeholders attending the consultation Posters were pasted at the guard house and at the
entrance to office 1 week before the stakeholder consultation to inform the locals stakeholders which
comprise mostly the workers of the mill 20 stakeholders out of the 37 who attended the consultation are
2nd generation of the Felda settlers who live in the vicinity to the project activity and adequately represent
the local community composed entirely of Felda settlers (no other people live in the vicinity of this
remote plantation) Continuous input of ideascomments were allowed to all stakeholders who could
either send their input though an email account especially setup for the biogas project or directly inform
the project proponents
During the meeting presentations were made by the project owner to outline the proposed project activity
in a non-technical manner (including environmental social and technological considerations) climate
change and the role of the CDM Attendees were given opportunity to raise their concern and opinion
about the proposed project activity during the question and answer session
D3 Summary of the comments received
PROJECT DESIGN DOCUMENT FORM (CDM-SSC-PDD) - Version 03
CDM ndash Executive Board
45
Below are the questions raised during the stakeholder meeting
NAME QUESTION
Mohd Tarmizi Bin Mat
Daud What is CDM in Bahasa Malaysia
Mohd Tarmizi Bin Mat
Daud What is DoE‟s standard for treated water released into river
Mohd Azizi Bin Abdul
Aziz
Would the biogas be captured from the existing effluent treatment ponds or a
new structure
Azhar Bin Abdul What to do with the captured biogas from the bioreactor
D4 Report on how due account was taken of any comments received
Below are the answers to the questions asked during the stakeholder meeting
QUESTION ANSWER
What is CDM in Bahasa Malaysia
The meaning of CDM in Bahasa Malaysia is Mekanisme
Pembangunan Bersih or in English is Clean Development
Mechanism
By Abd Karim Bin Mohd Zin
What is DoE‟s standard for treated
water released into river
The discharge standard for BOD into river is less than 100ppm
By Abd Karim Bin Mohd Zin
Would the biogas be captured from
the existing effluent treatment
ponds or a new structure
New bioreactor will be constructed to replace the existing anaerobic
lagoon treatment system The new bioreactor will capture the
biogas produced from this anaerobic treatment process
By Abd Karim Bin Mohd Zin
What to do with the captured
biogas from the bioreactor
The biogas recovered from the bioreactor will mainly contain
methane (approximately 60) and the rest are CO2 H2 and H2S
Currently the biogas is just released to the atmosphere from the
existing open lagoons system During the project activity captured
biogas will be combusted thus will improve the air quality
By Abd Karim Bin Mohd Zin
PROJECT DESIGN DOCUMENT FORM (CDM-SSC-PDD) - Version 03
CDM ndash Executive Board
46
Annex 1
CONTACT INFORMATION ON ENTITYINDIVIDUAL RESPONSIBLE FOR THE SMALL-
SCALE CPA
Organization Felda Palm Industries Sdn Bhd (359584-V)
StreetPOBox Jalan Gurney 1
Building Balai Felda 4th Floor
City Kuala Lumpur
StateRegion Wilayah Persekutuan
PostfixZIP 54000
Country Malaysia
Telephone (03) 2692 8066
FAX (03) 2693 4148
URL wwwfeldanetmy
Represented by
Title Head of Department
Salutation Mr
Last Name Busu
Middle Name
First Name Zainuri
Department Biomass
Mobile
Direct FAX
Direct tel
Personal E-Mail zainuribfeldanetmy
Organization Ably Carbon Sdn Bhd
StreetPOBox Jalan Ipoh Kecil
Building No 17
City Kuala Lumpur
StateRegion
PostfixZIP 50350
Country Malaysia
Telephone +60 3 4042 1177
FAX +60 3 4044 4166
E-Mail stephanevidailletably-carboncom
URL
Represented by Stephane Vidaillet
Title Chairman
Salutation Mr
Last Name Vidaillet
Middle Name
First Name Steacutephane
Department
Mobile +33 6 59111 5600
Direct FAX
PROJECT DESIGN DOCUMENT FORM (CDM-SSC-PDD) - Version 03
CDM ndash Executive Board
47
Direct tel
Personal E-Mail stephanevidailletably-carboncom
PROJECT DESIGN DOCUMENT FORM (CDM-SSC-PDD) - Version 03
CDM ndash Executive Board
48
Annex 2
INFORMATION REGARDING PUBLIC FUNDING
The project activity is not receiving any funding from parties included in Annex 1 of the Kyoto Protocol
SMALL-SCALE CDM PROGRAMME ACTIVITY DESIGN DOCUMENT FORM (CDM-SSC-CPA-DD) - Version 01
NAME TITLE OF THE PoA Biogas Recovery and Utilization PoA Projects in
Malaysia
CDM ndash Executive Board page 49
This template shall not be altered It shall be completed without modifyingadding headings or logo format or font
Annex 3
BASELINE INFORMATION
1 2
Year 2009 2010 2011 2012 2013 2014
FFB (mtyr) 343720 345910 310250 333293 333293 333293
POME Volume
(cumyr)[1] 343720 345910 310250 333293 333293 333293
Mill Opearing hour (hryr) 68865 69225 6209 6673 6673 6673
PKS (mtyr) 18905 19025 17064 18331 18331 18331
3 4 5 6 7 8 9 10
2015 2016 2017 2018 2019 2020 2021 2022
333293 333293 333293 333293 333293 333293 333293 333293
333293 333293 333293 333293 333293 333293 333293 333293
6673 6673 6673 6673 6673 6673 6673 6673
18331 18331 18331 18331 18331 18331 18331 18331
SMALL-SCALE CDM PROGRAMME ACTIVITY DESIGN DOCUMENT FORM (CDM-SSC-CPA-DD) - Version 01
NAME TITLE OF THE PoA Biogas Recovery and Utilization PoA Projects in
Malaysia
CDM ndash Executive Board page 50
This template shall not be altered It shall be completed without modifyingadding headings or logo format or font
10 days measurement campaign for baseline wastewater treatment system
Day Date
ETP
Inlet
Anaerobic
system (mgl)
Outlet
Anaerobic
system (mgl)
Outlet Algae
System (mgl)
Final
Discharge to
River (mgl)
1 23-Feb-12 35693 3120 811 603
2 25-Feb-12 19511 2559 1186 83
3 26-Feb-12 32864 2767 749 437
4 27-Feb-12 30195 2330 1210 404
5 28-Feb-12 32436 1927 1188 941
6 29-Feb-12 38259 4256 896 717
7 1-Mar-12 28717 3584 1232 695
8 3-Mar-12 31002 4660 1658 1210
9 4-Mar-12 22400 4346 1389 963
10 5-Mar-12 31226 4301 1971 1165
Average 30230 3385 1229 722
ETP
COD removal efficiency (anaerobic system) 8880
COD removal efficiency (Facultativealgae system) 6369
COD removal efficiency (Bio-polishing system) 4127
Total COD removal efficiency of the treatment system 9761
The COD of the raw effluent during ex-post may vary from the one year historical records depending on
the improvement of the production process (outside of project boundary) thus ERex-post may vary from the
estimated ERex-ante
SMALL-SCALE CDM PROGRAMME ACTIVITY DESIGN DOCUMENT FORM (CDM-SSC-CPA-DD) - Version 01
NAME TITLE OF THE PoA Biogas Recovery and Utilization PoA Projects in
Malaysia
CDM ndash Executive Board page 51
This template shall not be altered It shall be completed without modifyingadding headings or logo format or font
Annex 4
MONITORING INFORMATION
General information
Monitoring refers to the collection and archiving of all relevant data necessary for determining the
baseline measuring anthropogenic emissions by sources of greenhouse gases (GHG) within the project
boundary of a CDM project activity and leakage It includes developing suitable data collection methods
and data interpretation techniques for monitoring and verification of GHG emissions
On-line monitoring system
Most key meters required to determine GHG emissions and emission reductions will be monitored from a
central control point which will record meter readings at a pre-determined interval
Ensuring adequate maintenance and calibration of monitoring instruments
Specific maintenance repair or replacement of monitoring equipment will be recorded dated and
described
The calibration will occur at intervals determined on the basis of instrument manufacturers
recommendations stability purpose usage and history of repeatability Recalibration should be
performed whenever an event occurs that places the accuracy of the instrument in doubt
Calibration will take place at least once every three (3) years to ensure that the monitoring
equipments are properly installed and functioning properly
Calibration will be performed according to national or international standards
Last calibration certificates will be provided during periodic verification
Sampling procedure
Wherever a statistical sample is used for monitoring the ldquogeneral guidelines for sampling and surveys for
SSC project activitiesrdquo shall be used COD shall be measured from a composite sample to obtain a
representative value
Data archiving
The monitored data will be kept for a minimum of 2 years after the end of the crediting years by using
paper documents or electronic files
Identification of non-conformities
A verification of inconsistencies of the data recorded will be performed based for example on
The comparison of the calculated quantities of methane versus expected
Spot checks of field instruments (local reading) and data in the log file
Any discrepancies (completeness calculation errors transcription errors instrument calibration issues)
will be analyzed and actions taken to correct the problem
Ensuring adequate training of staff
All new staff members will undergo bdquoon job training‟ covering the monitoring requirements
The monitoring plan will be made available to staff member involved in the monitoring
A copy will be located in the control room at the site
SMALL-SCALE CDM PROGRAMME ACTIVITY DESIGN DOCUMENT FORM (CDM-SSC-CPA-DD) - Version 01
NAME TITLE OF THE PoA Biogas Recovery and Utilization PoA Projects in
Malaysia
CDM ndash Executive Board page 52
This template shall not be altered It shall be completed without modifyingadding headings or logo format or font
During the training the employees will sign a training attendance list All training records shall
be documented inclusive of training attendance training memo and training material if any
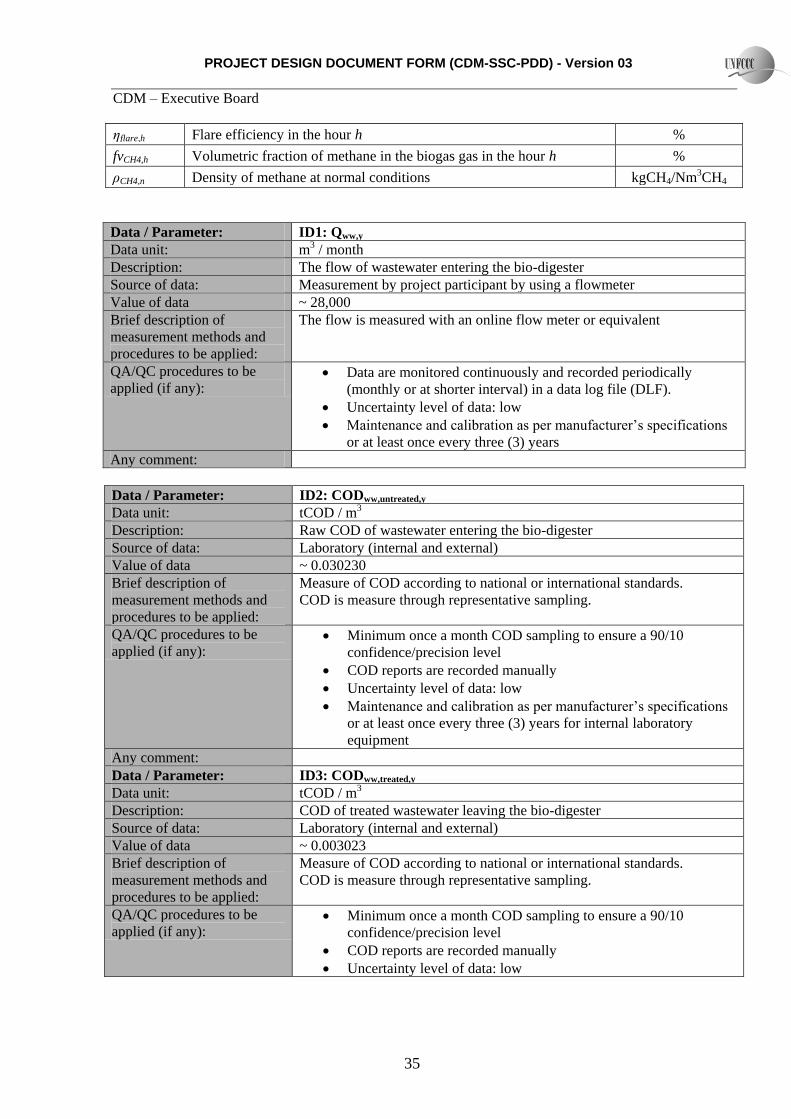
PROJECT DESIGN DOCUMENT FORM (CDM-SSC-PDD) - Version 03
CDM ndash Executive Board
36
Maintenance and calibration as per manufacturer‟s specifications
or at least once every three (3) years for internal laboratory
equipment
Any comment
Data Parameter ID5 End-use of the final sludge
Data unit ndash
Description The final sludge generated by the project activity will be sent to control
landfill site if any
Source of data By project participant
Value of data ndash
Brief description of
measurement methods and
procedures to be applied
The final disposal of the sludge will be monitored during the crediting
period if any For each disposal of the sludge the following will be
recorded disposal site and date of disposal
QAQC procedures to be
applied (if any)
Any comment
Data Parameter ID6 FVflaredh
Data unit Nm3 hour
Description Volumetric flow of biogas recovered and flared at normal conditions in
the hour h
Source of data By project participant
Value of data 0
Brief description of
measurement methods and
procedures to be applied
The volume of biogas will be measured with a normalised flow meter or
calculated from the volumetric flow pressure temperature
Biogas volume and methane content measurements shall be on the same
basis (wet or dry)
QAQC procedures to be
applied (if any) The biogas flow is monitored continuously recorded and stored
electronically in a data log file (DLF) (monthly or at shorter
interval)
Data Parameter ID4 CODww dischargey
Data unit tCOD m3
Description COD of treated wastewater discharge into river by treatment system
Source of data Laboratory (internal and external)
Value of data ~ 0000100
Brief description of
measurement methods and
procedures to be applied
Measure of COD according to national or international standards
COD is measure through representative sampling
QAQC procedures to be
applied (if any) Minimum once a month COD sampling to ensure a 9010
confidenceprecision level
COD reports are recorded manually
Uncertainty level of data low
Maintenance and calibration as per manufacturer‟s specifications
or at least once every three (3) years for internal laboratory
equipment
Any comment
PROJECT DESIGN DOCUMENT FORM (CDM-SSC-PDD) - Version 03
CDM ndash Executive Board
37
Uncertainty level of data low
Maintenance and calibration as per manufacturer‟s specifications
or at least once every 3 years
Any comment
Data Parameter ID7 FVfuelledgas engineh
Data unit Nm3 hour
Description Volumetric flow of biogas recovered and fuelled (gas engine) at normal
conditions in the hour h
Source of data By project participant
Value of data ~ 509
Brief description of
measurement methods and
procedures to be applied
The volume of biogas will be measured with a normalised flow meter or
calculated from the volumetric flow of biogas pressure temperature
Biogas volume and methane content measurements shall be on the same
basis (wet or dry)
QAQC procedures to be
applied (if any) The biogas flow is monitored continuously recorded and stored
electronically in a data log file (DLF) (monthly or at shorter
interval)
Uncertainty level of data low
Maintenance and calibration as per manufacturer‟s specifications
or at least once every 3 years
Any comment
Data Parameter ID8 FVfuelledboilerh
Data unit Nm3 hour
Description Volumetric flow of biogas recovered and fuelled (boilers) at normal
conditions in the hour h
Source of data By project participant
Value of data ~ 0
Brief description of
measurement methods and
procedures to be applied
The volume of biogas will be measured with a normalised flow meter or
calculated from the volumetric flow of biogas pressure temperature
Biogas volume and methane content measurements shall be on the same
basis (wet or dry)
QAQC procedures to be
applied (if any) The biogas flow is monitored continuously recorded and stored
electronically in a data log file (DLF) (monthly or at shorter
interval)
Uncertainty level of data low
Maintenance and calibration as per manufacturer‟s specifications
or at least once every 3 years
Any comment
Data Parameter ID9 wCH4h
Data unit
Description Methane content in biogas in same basis (wetdry) as the biogas flows in
year y
Source of data By project participant using a gas analyzer
Value of data ~ 60
PROJECT DESIGN DOCUMENT FORM (CDM-SSC-PDD) - Version 03
CDM ndash Executive Board
38
Brief description of
measurement methods and
procedures to be applied
Using calibrated gas analyzer either continuous or periodical
measurement at confidenceprecision level of 9010
QAQC procedures to be
applied (if any) In case a continuous gas analyser is used data will be recorded
and stored electronically in a data log file (DLF) every hour or at
shorter interval
Uncertainty level of data low
Maintenance and calibration as per manufacturer‟s specifications
or at least once every 3 years
Any comment See also clarification by EB Meth Panel 30102009 ndash SSC_360
httpcdmunfcccintUserManagementFileStorageAM_CLAR_
QS83SX5B7WM6UGZE31JYQEQ4F65F6V
The biogas flow and the methane content measurements shall be
carried out close to each others
Data Parameter ID10 Tbiogas
Data unit ordmC
Description Temperature of biogas
Source of data Temperature probe
Value of data 20 ndash 65
Brief description of
measurement methods and
procedures to be applied
By project participant
QAQC procedures to be
applied (if any) Shall be measured and recorded at the same time when methane
content in biogas (ID8) is measured
Uncertainty level of data low
Maintenance and calibration as per manufacturer‟s specifications
or at least once every 3 years
Any comment Pressure and temperature are required to determine the density of
the methane If the biogas flow meter employed measures flow
pressure and temperature and displaysoutputs normalised flow of
biogas there is no need to separate monitoring of pressure and
temperature of the biogas
Data Parameter ID11 Pbiogas
Data unit Bar(g)
Description Pressure of biogas
Source of data By project participant
Value of data 50 ndash 200 mbar
Brief description of
measurement methods and
procedures to be applied
Pressure measurement device
QAQC procedures to be
applied (if any) Shall be measured and recorded at the same time when methane
content in biogas (ID8) is measured
Uncertainty level of data low
Maintenance and calibration as per manufacturer‟s specifications
or at least once every three (3) years
Any comment Pressure and temperature are required to determine the density of
the methane If the biogas flow meter employed measures flow
PROJECT DESIGN DOCUMENT FORM (CDM-SSC-PDD) - Version 03
CDM ndash Executive Board
39
pressure and temperature and displaysoutputs normalised flow of
biogas there is no need to separate monitoring of pressure and
temperature of the biogas
Shall be measured at the same time when methane content in
biogas (ID9) is measured
Parameter ID12 ηflareh (enclosed flare)
Unit
Description Enclosed flare efficiency in the hour h
Source of data Calculated
Value of data 0 or 50 or 90
Brief description of
measurement methods and
procedures to be applied
This yearly efficiency will be based on hourly flare efficiencies calculated
as per the provisions in the ldquoTool to determine project emissions from
flaring gases containing methanerdquo
The hourly flare efficiency will be calculated based on
0 if the temperature in the exhaust gas of the flare (Tflare) is
below 500 degC for more than 20 minutes during the hour h
50 if the temperature in the exhaust gas of the flare (Tflare) is
above 500 degC for more than 40 minutes during the hour h but the
manufacturer‟s specifications on proper operation of the flare are
not met at any point in time during the hour h
90 if the temperature in the exhaust gas of the flare (Tflare) is
above 500 degC for more than 40 minutes during the hour h and the
manufacturer‟s specifications on proper operation of the flare are
met continuously during the hour h
QAQC procedures to be
applied (if any) Data are logged hourly in a data log file (DLF)
Uncertainty level of data low
Any comment For enclosed flare
Or
Parameter ID13 ηflareh (open flare)
Unit
Description Flare efficiency in the hour h
Source of data Calculated
Value of data 0 or 50
Brief description of
measurement methods and
procedures to be applied
This yearly efficiency will be based on hourly flare efficiencies calculated
as per the provisions in the ldquoTool to determine project emissions from
flaring gases containing methanerdquo
The hourly flare efficiency will be calculated based on the duration of
time during which the flame is detected by the thermocouple (or flame
detector) installed in the open flare
Flare efficiency in hour h is based on default values
0 if the flame detected for not more than 20 minutes during the
hour h and
PROJECT DESIGN DOCUMENT FORM (CDM-SSC-PDD) - Version 03
CDM ndash Executive Board
40
50 if the flame detected for more than 20 minutes during the
hour h
A flame detector or thermocouple will be used
QAQC procedures to be
applied (if any) Data are logged hourly in a data log file (DLF)
Uncertainty level of data low
Any comment The only monitored parameter related to the flare is its efficiency Indeed
according to the clarification SSC_19927 of the methodology AMS IIIH
version 9 accepted by the SSC WG on the 3092008 ldquoIf a thermocouple
is used as a flame detection system it is sufficient to reach the given
minimum temperature from the manufacturer ldquo Hence it is not necessary
to monitor the temperature of the open type flares (Tflare)
Data Parameter ID14 ECPJjy
Data unit MWh
Description The yearly grid electricity consumption of the project activity for the year
bdquoy‟
Source of data Onsite instrument
Value of data ~749
Brief description of
measurement methods and
procedures to be applied
The grid electricity consumption of the project activity is measured
continuously with an energy meter (cumulative reading)
QAQC procedures to be
applied (if any) Data are monitored continuously and recorded periodically
(yearly or at shorter interval) in a data log file (DLF)
Uncertainty level of data low
Maintenance and calibration as per manufacturer‟s specifications
or at least once every three (3) years
Any comment
Data Parameter ID15 EGBLy
Data unit MWh
Description Quantity of net electricity generated and send to grid in year y
Source of data By project participant
Value of data ~ 6798
Brief description of
measurement methods and
procedures to be applied
The electricity generated and sent to grid is measured continuously with
an energy meter (cumulative readings)
QAQC procedures to be
applied (if any) Data are monitored continuously and recorded periodically
(yearly or at shorter interval) in a data log file (DLF)
Uncertainty level of data low
Maintenance and calibration as per manufacturer‟s specifications
or at least once every 3 years
Any comment As per AMS-ID
27 The clarification SSC_199 if available here (last access on the 24052011)
httpcdmunfcccintfilestorageAM_AM_CLAR_HIOZ5CS1PASC187C0JQ668L2E9RCRJResponse20WG20provided
20at20SSC20WG2017pdft=bU98MTMwNjIxNjY0OS4xMQ==|BOKHqtO94N6XF1N2N1vo8Ori-Rc=
PROJECT DESIGN DOCUMENT FORM (CDM-SSC-PDD) - Version 03
CDM ndash Executive Board
41
Or
Data Parameter ID16 EGmilly
Data unit MWh
Description Quantity of annual output of renewable energy sent to the mill in year y
Source of data By project participant
Value of data ~ 0
Brief description of
measurement methods and
procedures to be applied
The electricity generated and sent to mill to displace diesel use in diesel
gensets is measured continuously with an energy meter (cumulative
readings)
QAQC procedures to be
applied (if any) Data are monitored continuously and recorded periodically
(yearly or at shorter interval) in a data log file (DLF)
Uncertainty level of data low
Maintenance and calibration as per manufacturer‟s specifications
or at least once every 3 years
Any comment As per AMS-IA
Data Parameter ID17 Displacement of Biomass
Data unit Mt
Description Total amount of biomass (PKS) displaced from biomass boilers
Source of data Weighing bridge
Value of data Measurement at site
Brief description of
measurement methods and
procedures to be applied
Biomass (PKS) displaced due to the project activity will be weighed
using weighing bridge at the palm oil mill
QAQC procedures to be
applied (if any) Monthly calculation based on every single trip of trucks recorded
Data is recorded manually in a data log file based on the weighing
records
Maintenance and calibration as per manufacturer‟s specifications
Uncertainty level of data low
Any comment In the project activity the biomass (PKS) displaced will not be stored
under anaerobic conditions The conditions of onsite storage are identical
in the baseline as in the project activity The biomass will be sold to the
market on a regular basis PEbiomassy = 0
A final monitoring plan will be prepared prior the initial verification based on the as-built project activity
It will address the following aspects
MONITORING
The Project will be managed by CME with the involvement from Project Implementer CME will ensure
safety in operation of the plant as well as in the monitoring of emission reduction which is generated from
the project activity
CME will implement and be responsible for the monitoring plan Their responsibility covers operation of
the monitoring maintenance of the monitoring equipment data collection and archiving and
management of total scheme of the monitoring CME and Project Implementer will assign specific trained
PROJECT DESIGN DOCUMENT FORM (CDM-SSC-PDD) - Version 03
CDM ndash Executive Board
42
personnel during project implementation for the overall monitoring measurement and reporting of key
parameters as required in this PDD
DATA LOGGING AND STORAGE
The data measured by the instruments will be collected and stored in a data logging system The data will
be retrieved remotely by modem or directly on site
If data cannot be retrieved no emissions reductions will be claimed for the period of data failure The
data collected will be recorded in a central data base Access to production data will be restricted All
records and data (hard copy and soft copy) will be archived up to two years after the end of the crediting
period or the last issuance of CERs for this project activity whichever occurs later
CALIBRATION AND MAINTENANCE PROCEDURES MALFUNCTION OF EQUIPMENT
Maintenance includes all preventive and corrective actions necessary for the good functioning of the
equipment such as
Visual control of the equipment state and real-time check of displayed parameters
Cleaning up the equipment and the sensors
Adding lubricant
Replacement and change of defective parts
Calibration of equipment consists in verifying by comparison with a standard the accuracy of a
measuring instrument
Measuring instruments will be periodically and appropriately calibrated according to the procedures
timing and methods recommended by the manufacturer or nationalinternational standards as available
General malfunction of equipment
Daily inspections of the equipment will allow controlling equipment failure If equipment fails the
supplier will be notified and repairs will be carried out If the damaged equipment cannot be repaired it
will be replaced at the earliest In some cases portable tools will be used in order to carry out daily
monitoring of the missing parameter(s) In such case this data will be recorded manually
Discrepancies
To avoid discrepancies between projected data in the PDD and actual data (eg due to deferred starting
date malfunction of equipment) cross-checks between internal meter readings and external sources (eg
electricity invoices) will be carried out Any source of inconsistencies will be clarified
Case of emergency
For the case of emergency (earthquakes explosions fires etc) an emergency preparedness plan will be
adapted to the project activity All employees involved in the project on-site will be trained in the code of
conduct and required actions at time of commissioning of the plant
PROJECT DESIGN DOCUMENT FORM (CDM-SSC-PDD) - Version 03
CDM ndash Executive Board
43
OPERATIONAL AND MANAGEMENT STRUCTURE
The CDM monitoring team will be composed by the following staff
Position Report to
Operators
Project owner Supervisors (technicalmaintenance)
Operation Engineer
CDM monitoring project manager External CDM consultant
TRAINING OF MONITORING PERSONNEL
The maintenance will be conducted in-house by staff employed and trained by the Project Participants
Employees involved in the monitoring will be trained internally andor externally Training may include
inter alia
a) Review of equipment and captors
b) Calibration requirement
c) Configuration of monitoring equipment
d) Maintenance requirement
C1 Please indicate the level at which environmental analysis as per requirements of the CDM
modalities and procedures is undertaken Justify the choice of level at which the environmental
analysis is undertaken
radic Please tick if this information is provided at the PoA level In this case sections C2 and C3
need not be completed in this form
C2 Documentation on the analysis of the environmental impacts including transboundary
impacts
The host country does not require an analysis of environmental impacts As the project involves reduction
of GHG through recovery and controlled combustion which improves the quality of air therefore there
are no significant environmental impacts identified
C3 Please state whether an environmental impact assessment is required for a typical CPA
included in the programme of activities (PoA) in accordance with the host Party lawsregulations
In accordance with Malaysia environmental regulations Environmental Quality (Prescribed Activities
Environmental Impact Assessment) Order 1987 an Environmental Impact Assessment (EIA) is not
required for this CPA
PROJECT DESIGN DOCUMENT FORM (CDM-SSC-PDD) - Version 03
CDM ndash Executive Board
44
SECTION D Stakeholdersrsquo comments
D1 Please indicate the level at which local stakeholder comments are invited Justify the
choice
Please tick if this information is provided at the PoA level In this case sections D2 to D4 need
not be completed in this form
D2 Brief description how comments by local stakeholders have been invited and compiled
The stakeholder meeting was conducted at the office of Kilang Sawit Felda Triang on 05032012 There
were 37 stakeholders attending the consultation Posters were pasted at the guard house and at the
entrance to office 1 week before the stakeholder consultation to inform the locals stakeholders which
comprise mostly the workers of the mill 20 stakeholders out of the 37 who attended the consultation are
2nd generation of the Felda settlers who live in the vicinity to the project activity and adequately represent
the local community composed entirely of Felda settlers (no other people live in the vicinity of this
remote plantation) Continuous input of ideascomments were allowed to all stakeholders who could
either send their input though an email account especially setup for the biogas project or directly inform
the project proponents
During the meeting presentations were made by the project owner to outline the proposed project activity
in a non-technical manner (including environmental social and technological considerations) climate
change and the role of the CDM Attendees were given opportunity to raise their concern and opinion
about the proposed project activity during the question and answer session
D3 Summary of the comments received
PROJECT DESIGN DOCUMENT FORM (CDM-SSC-PDD) - Version 03
CDM ndash Executive Board
45
Below are the questions raised during the stakeholder meeting
NAME QUESTION
Mohd Tarmizi Bin Mat
Daud What is CDM in Bahasa Malaysia
Mohd Tarmizi Bin Mat
Daud What is DoE‟s standard for treated water released into river
Mohd Azizi Bin Abdul
Aziz
Would the biogas be captured from the existing effluent treatment ponds or a
new structure
Azhar Bin Abdul What to do with the captured biogas from the bioreactor
D4 Report on how due account was taken of any comments received
Below are the answers to the questions asked during the stakeholder meeting
QUESTION ANSWER
What is CDM in Bahasa Malaysia
The meaning of CDM in Bahasa Malaysia is Mekanisme
Pembangunan Bersih or in English is Clean Development
Mechanism
By Abd Karim Bin Mohd Zin
What is DoE‟s standard for treated
water released into river
The discharge standard for BOD into river is less than 100ppm
By Abd Karim Bin Mohd Zin
Would the biogas be captured from
the existing effluent treatment
ponds or a new structure
New bioreactor will be constructed to replace the existing anaerobic
lagoon treatment system The new bioreactor will capture the
biogas produced from this anaerobic treatment process
By Abd Karim Bin Mohd Zin
What to do with the captured
biogas from the bioreactor
The biogas recovered from the bioreactor will mainly contain
methane (approximately 60) and the rest are CO2 H2 and H2S
Currently the biogas is just released to the atmosphere from the
existing open lagoons system During the project activity captured
biogas will be combusted thus will improve the air quality
By Abd Karim Bin Mohd Zin
PROJECT DESIGN DOCUMENT FORM (CDM-SSC-PDD) - Version 03
CDM ndash Executive Board
46
Annex 1
CONTACT INFORMATION ON ENTITYINDIVIDUAL RESPONSIBLE FOR THE SMALL-
SCALE CPA
Organization Felda Palm Industries Sdn Bhd (359584-V)
StreetPOBox Jalan Gurney 1
Building Balai Felda 4th Floor
City Kuala Lumpur
StateRegion Wilayah Persekutuan
PostfixZIP 54000
Country Malaysia
Telephone (03) 2692 8066
FAX (03) 2693 4148
URL wwwfeldanetmy
Represented by
Title Head of Department
Salutation Mr
Last Name Busu
Middle Name
First Name Zainuri
Department Biomass
Mobile
Direct FAX
Direct tel
Personal E-Mail zainuribfeldanetmy
Organization Ably Carbon Sdn Bhd
StreetPOBox Jalan Ipoh Kecil
Building No 17
City Kuala Lumpur
StateRegion
PostfixZIP 50350
Country Malaysia
Telephone +60 3 4042 1177
FAX +60 3 4044 4166
E-Mail stephanevidailletably-carboncom
URL
Represented by Stephane Vidaillet
Title Chairman
Salutation Mr
Last Name Vidaillet
Middle Name
First Name Steacutephane
Department
Mobile +33 6 59111 5600
Direct FAX
PROJECT DESIGN DOCUMENT FORM (CDM-SSC-PDD) - Version 03
CDM ndash Executive Board
47
Direct tel
Personal E-Mail stephanevidailletably-carboncom
PROJECT DESIGN DOCUMENT FORM (CDM-SSC-PDD) - Version 03
CDM ndash Executive Board
48
Annex 2
INFORMATION REGARDING PUBLIC FUNDING
The project activity is not receiving any funding from parties included in Annex 1 of the Kyoto Protocol
SMALL-SCALE CDM PROGRAMME ACTIVITY DESIGN DOCUMENT FORM (CDM-SSC-CPA-DD) - Version 01
NAME TITLE OF THE PoA Biogas Recovery and Utilization PoA Projects in
Malaysia
CDM ndash Executive Board page 49
This template shall not be altered It shall be completed without modifyingadding headings or logo format or font
Annex 3
BASELINE INFORMATION
1 2
Year 2009 2010 2011 2012 2013 2014
FFB (mtyr) 343720 345910 310250 333293 333293 333293
POME Volume
(cumyr)[1] 343720 345910 310250 333293 333293 333293
Mill Opearing hour (hryr) 68865 69225 6209 6673 6673 6673
PKS (mtyr) 18905 19025 17064 18331 18331 18331
3 4 5 6 7 8 9 10
2015 2016 2017 2018 2019 2020 2021 2022
333293 333293 333293 333293 333293 333293 333293 333293
333293 333293 333293 333293 333293 333293 333293 333293
6673 6673 6673 6673 6673 6673 6673 6673
18331 18331 18331 18331 18331 18331 18331 18331
SMALL-SCALE CDM PROGRAMME ACTIVITY DESIGN DOCUMENT FORM (CDM-SSC-CPA-DD) - Version 01
NAME TITLE OF THE PoA Biogas Recovery and Utilization PoA Projects in
Malaysia
CDM ndash Executive Board page 50
This template shall not be altered It shall be completed without modifyingadding headings or logo format or font
10 days measurement campaign for baseline wastewater treatment system
Day Date
ETP
Inlet
Anaerobic
system (mgl)
Outlet
Anaerobic
system (mgl)
Outlet Algae
System (mgl)
Final
Discharge to
River (mgl)
1 23-Feb-12 35693 3120 811 603
2 25-Feb-12 19511 2559 1186 83
3 26-Feb-12 32864 2767 749 437
4 27-Feb-12 30195 2330 1210 404
5 28-Feb-12 32436 1927 1188 941
6 29-Feb-12 38259 4256 896 717
7 1-Mar-12 28717 3584 1232 695
8 3-Mar-12 31002 4660 1658 1210
9 4-Mar-12 22400 4346 1389 963
10 5-Mar-12 31226 4301 1971 1165
Average 30230 3385 1229 722
ETP
COD removal efficiency (anaerobic system) 8880
COD removal efficiency (Facultativealgae system) 6369
COD removal efficiency (Bio-polishing system) 4127
Total COD removal efficiency of the treatment system 9761
The COD of the raw effluent during ex-post may vary from the one year historical records depending on
the improvement of the production process (outside of project boundary) thus ERex-post may vary from the
estimated ERex-ante
SMALL-SCALE CDM PROGRAMME ACTIVITY DESIGN DOCUMENT FORM (CDM-SSC-CPA-DD) - Version 01
NAME TITLE OF THE PoA Biogas Recovery and Utilization PoA Projects in
Malaysia
CDM ndash Executive Board page 51
This template shall not be altered It shall be completed without modifyingadding headings or logo format or font
Annex 4
MONITORING INFORMATION
General information
Monitoring refers to the collection and archiving of all relevant data necessary for determining the
baseline measuring anthropogenic emissions by sources of greenhouse gases (GHG) within the project
boundary of a CDM project activity and leakage It includes developing suitable data collection methods
and data interpretation techniques for monitoring and verification of GHG emissions
On-line monitoring system
Most key meters required to determine GHG emissions and emission reductions will be monitored from a
central control point which will record meter readings at a pre-determined interval
Ensuring adequate maintenance and calibration of monitoring instruments
Specific maintenance repair or replacement of monitoring equipment will be recorded dated and
described
The calibration will occur at intervals determined on the basis of instrument manufacturers
recommendations stability purpose usage and history of repeatability Recalibration should be
performed whenever an event occurs that places the accuracy of the instrument in doubt
Calibration will take place at least once every three (3) years to ensure that the monitoring
equipments are properly installed and functioning properly
Calibration will be performed according to national or international standards
Last calibration certificates will be provided during periodic verification
Sampling procedure
Wherever a statistical sample is used for monitoring the ldquogeneral guidelines for sampling and surveys for
SSC project activitiesrdquo shall be used COD shall be measured from a composite sample to obtain a
representative value
Data archiving
The monitored data will be kept for a minimum of 2 years after the end of the crediting years by using
paper documents or electronic files
Identification of non-conformities
A verification of inconsistencies of the data recorded will be performed based for example on
The comparison of the calculated quantities of methane versus expected
Spot checks of field instruments (local reading) and data in the log file
Any discrepancies (completeness calculation errors transcription errors instrument calibration issues)
will be analyzed and actions taken to correct the problem
Ensuring adequate training of staff
All new staff members will undergo bdquoon job training‟ covering the monitoring requirements
The monitoring plan will be made available to staff member involved in the monitoring
A copy will be located in the control room at the site
SMALL-SCALE CDM PROGRAMME ACTIVITY DESIGN DOCUMENT FORM (CDM-SSC-CPA-DD) - Version 01
NAME TITLE OF THE PoA Biogas Recovery and Utilization PoA Projects in
Malaysia
CDM ndash Executive Board page 52
This template shall not be altered It shall be completed without modifyingadding headings or logo format or font
During the training the employees will sign a training attendance list All training records shall
be documented inclusive of training attendance training memo and training material if any
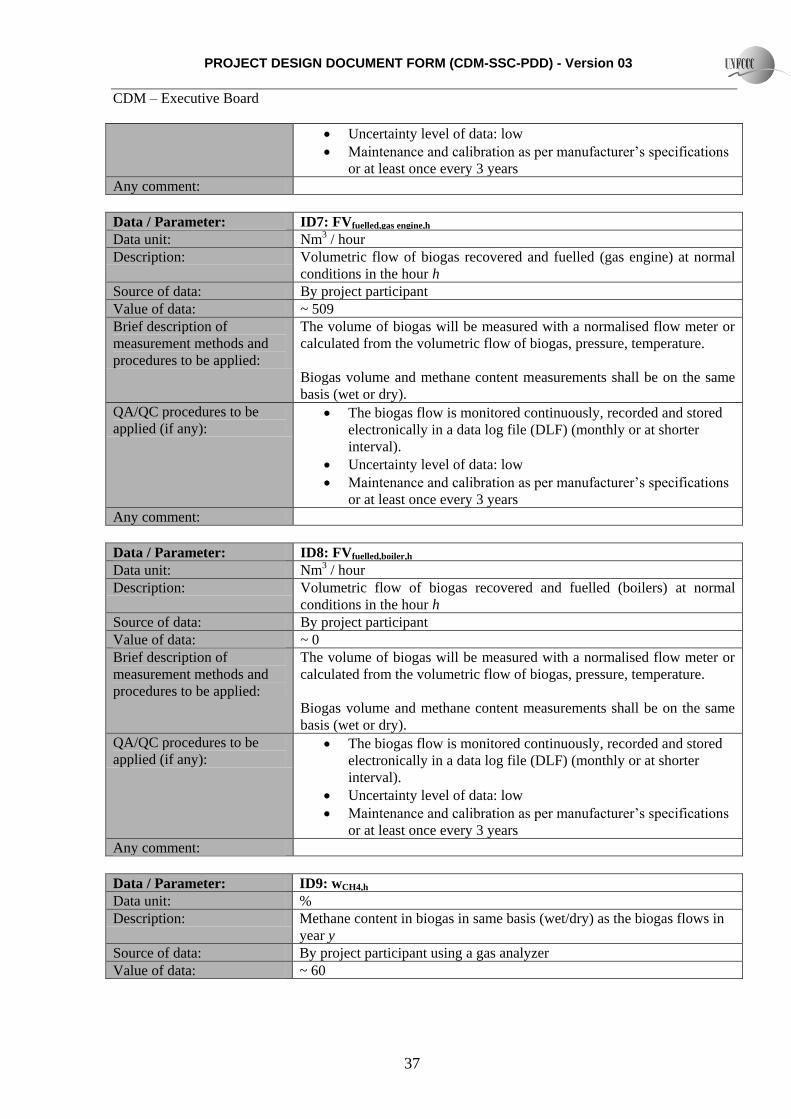
PROJECT DESIGN DOCUMENT FORM (CDM-SSC-PDD) - Version 03
CDM ndash Executive Board
37
Uncertainty level of data low
Maintenance and calibration as per manufacturer‟s specifications
or at least once every 3 years
Any comment
Data Parameter ID7 FVfuelledgas engineh
Data unit Nm3 hour
Description Volumetric flow of biogas recovered and fuelled (gas engine) at normal
conditions in the hour h
Source of data By project participant
Value of data ~ 509
Brief description of
measurement methods and
procedures to be applied
The volume of biogas will be measured with a normalised flow meter or
calculated from the volumetric flow of biogas pressure temperature
Biogas volume and methane content measurements shall be on the same
basis (wet or dry)
QAQC procedures to be
applied (if any) The biogas flow is monitored continuously recorded and stored
electronically in a data log file (DLF) (monthly or at shorter
interval)
Uncertainty level of data low
Maintenance and calibration as per manufacturer‟s specifications
or at least once every 3 years
Any comment
Data Parameter ID8 FVfuelledboilerh
Data unit Nm3 hour
Description Volumetric flow of biogas recovered and fuelled (boilers) at normal
conditions in the hour h
Source of data By project participant
Value of data ~ 0
Brief description of
measurement methods and
procedures to be applied
The volume of biogas will be measured with a normalised flow meter or
calculated from the volumetric flow of biogas pressure temperature
Biogas volume and methane content measurements shall be on the same
basis (wet or dry)
QAQC procedures to be
applied (if any) The biogas flow is monitored continuously recorded and stored
electronically in a data log file (DLF) (monthly or at shorter
interval)
Uncertainty level of data low
Maintenance and calibration as per manufacturer‟s specifications
or at least once every 3 years
Any comment
Data Parameter ID9 wCH4h
Data unit
Description Methane content in biogas in same basis (wetdry) as the biogas flows in
year y
Source of data By project participant using a gas analyzer
Value of data ~ 60
PROJECT DESIGN DOCUMENT FORM (CDM-SSC-PDD) - Version 03
CDM ndash Executive Board
38
Brief description of
measurement methods and
procedures to be applied
Using calibrated gas analyzer either continuous or periodical
measurement at confidenceprecision level of 9010
QAQC procedures to be
applied (if any) In case a continuous gas analyser is used data will be recorded
and stored electronically in a data log file (DLF) every hour or at
shorter interval
Uncertainty level of data low
Maintenance and calibration as per manufacturer‟s specifications
or at least once every 3 years
Any comment See also clarification by EB Meth Panel 30102009 ndash SSC_360
httpcdmunfcccintUserManagementFileStorageAM_CLAR_
QS83SX5B7WM6UGZE31JYQEQ4F65F6V
The biogas flow and the methane content measurements shall be
carried out close to each others
Data Parameter ID10 Tbiogas
Data unit ordmC
Description Temperature of biogas
Source of data Temperature probe
Value of data 20 ndash 65
Brief description of
measurement methods and
procedures to be applied
By project participant
QAQC procedures to be
applied (if any) Shall be measured and recorded at the same time when methane
content in biogas (ID8) is measured
Uncertainty level of data low
Maintenance and calibration as per manufacturer‟s specifications
or at least once every 3 years
Any comment Pressure and temperature are required to determine the density of
the methane If the biogas flow meter employed measures flow
pressure and temperature and displaysoutputs normalised flow of
biogas there is no need to separate monitoring of pressure and
temperature of the biogas
Data Parameter ID11 Pbiogas
Data unit Bar(g)
Description Pressure of biogas
Source of data By project participant
Value of data 50 ndash 200 mbar
Brief description of
measurement methods and
procedures to be applied
Pressure measurement device
QAQC procedures to be
applied (if any) Shall be measured and recorded at the same time when methane
content in biogas (ID8) is measured
Uncertainty level of data low
Maintenance and calibration as per manufacturer‟s specifications
or at least once every three (3) years
Any comment Pressure and temperature are required to determine the density of
the methane If the biogas flow meter employed measures flow
PROJECT DESIGN DOCUMENT FORM (CDM-SSC-PDD) - Version 03
CDM ndash Executive Board
39
pressure and temperature and displaysoutputs normalised flow of
biogas there is no need to separate monitoring of pressure and
temperature of the biogas
Shall be measured at the same time when methane content in
biogas (ID9) is measured
Parameter ID12 ηflareh (enclosed flare)
Unit
Description Enclosed flare efficiency in the hour h
Source of data Calculated
Value of data 0 or 50 or 90
Brief description of
measurement methods and
procedures to be applied
This yearly efficiency will be based on hourly flare efficiencies calculated
as per the provisions in the ldquoTool to determine project emissions from
flaring gases containing methanerdquo
The hourly flare efficiency will be calculated based on
0 if the temperature in the exhaust gas of the flare (Tflare) is
below 500 degC for more than 20 minutes during the hour h
50 if the temperature in the exhaust gas of the flare (Tflare) is
above 500 degC for more than 40 minutes during the hour h but the
manufacturer‟s specifications on proper operation of the flare are
not met at any point in time during the hour h
90 if the temperature in the exhaust gas of the flare (Tflare) is
above 500 degC for more than 40 minutes during the hour h and the
manufacturer‟s specifications on proper operation of the flare are
met continuously during the hour h
QAQC procedures to be
applied (if any) Data are logged hourly in a data log file (DLF)
Uncertainty level of data low
Any comment For enclosed flare
Or
Parameter ID13 ηflareh (open flare)
Unit
Description Flare efficiency in the hour h
Source of data Calculated
Value of data 0 or 50
Brief description of
measurement methods and
procedures to be applied
This yearly efficiency will be based on hourly flare efficiencies calculated
as per the provisions in the ldquoTool to determine project emissions from
flaring gases containing methanerdquo
The hourly flare efficiency will be calculated based on the duration of
time during which the flame is detected by the thermocouple (or flame
detector) installed in the open flare
Flare efficiency in hour h is based on default values
0 if the flame detected for not more than 20 minutes during the
hour h and
PROJECT DESIGN DOCUMENT FORM (CDM-SSC-PDD) - Version 03
CDM ndash Executive Board
40
50 if the flame detected for more than 20 minutes during the
hour h
A flame detector or thermocouple will be used
QAQC procedures to be
applied (if any) Data are logged hourly in a data log file (DLF)
Uncertainty level of data low
Any comment The only monitored parameter related to the flare is its efficiency Indeed
according to the clarification SSC_19927 of the methodology AMS IIIH
version 9 accepted by the SSC WG on the 3092008 ldquoIf a thermocouple
is used as a flame detection system it is sufficient to reach the given
minimum temperature from the manufacturer ldquo Hence it is not necessary
to monitor the temperature of the open type flares (Tflare)
Data Parameter ID14 ECPJjy
Data unit MWh
Description The yearly grid electricity consumption of the project activity for the year
bdquoy‟
Source of data Onsite instrument
Value of data ~749
Brief description of
measurement methods and
procedures to be applied
The grid electricity consumption of the project activity is measured
continuously with an energy meter (cumulative reading)
QAQC procedures to be
applied (if any) Data are monitored continuously and recorded periodically
(yearly or at shorter interval) in a data log file (DLF)
Uncertainty level of data low
Maintenance and calibration as per manufacturer‟s specifications
or at least once every three (3) years
Any comment
Data Parameter ID15 EGBLy
Data unit MWh
Description Quantity of net electricity generated and send to grid in year y
Source of data By project participant
Value of data ~ 6798
Brief description of
measurement methods and
procedures to be applied
The electricity generated and sent to grid is measured continuously with
an energy meter (cumulative readings)
QAQC procedures to be
applied (if any) Data are monitored continuously and recorded periodically
(yearly or at shorter interval) in a data log file (DLF)
Uncertainty level of data low
Maintenance and calibration as per manufacturer‟s specifications
or at least once every 3 years
Any comment As per AMS-ID
27 The clarification SSC_199 if available here (last access on the 24052011)
httpcdmunfcccintfilestorageAM_AM_CLAR_HIOZ5CS1PASC187C0JQ668L2E9RCRJResponse20WG20provided
20at20SSC20WG2017pdft=bU98MTMwNjIxNjY0OS4xMQ==|BOKHqtO94N6XF1N2N1vo8Ori-Rc=
PROJECT DESIGN DOCUMENT FORM (CDM-SSC-PDD) - Version 03
CDM ndash Executive Board
41
Or
Data Parameter ID16 EGmilly
Data unit MWh
Description Quantity of annual output of renewable energy sent to the mill in year y
Source of data By project participant
Value of data ~ 0
Brief description of
measurement methods and
procedures to be applied
The electricity generated and sent to mill to displace diesel use in diesel
gensets is measured continuously with an energy meter (cumulative
readings)
QAQC procedures to be
applied (if any) Data are monitored continuously and recorded periodically
(yearly or at shorter interval) in a data log file (DLF)
Uncertainty level of data low
Maintenance and calibration as per manufacturer‟s specifications
or at least once every 3 years
Any comment As per AMS-IA
Data Parameter ID17 Displacement of Biomass
Data unit Mt
Description Total amount of biomass (PKS) displaced from biomass boilers
Source of data Weighing bridge
Value of data Measurement at site
Brief description of
measurement methods and
procedures to be applied
Biomass (PKS) displaced due to the project activity will be weighed
using weighing bridge at the palm oil mill
QAQC procedures to be
applied (if any) Monthly calculation based on every single trip of trucks recorded
Data is recorded manually in a data log file based on the weighing
records
Maintenance and calibration as per manufacturer‟s specifications
Uncertainty level of data low
Any comment In the project activity the biomass (PKS) displaced will not be stored
under anaerobic conditions The conditions of onsite storage are identical
in the baseline as in the project activity The biomass will be sold to the
market on a regular basis PEbiomassy = 0
A final monitoring plan will be prepared prior the initial verification based on the as-built project activity
It will address the following aspects
MONITORING
The Project will be managed by CME with the involvement from Project Implementer CME will ensure
safety in operation of the plant as well as in the monitoring of emission reduction which is generated from
the project activity
CME will implement and be responsible for the monitoring plan Their responsibility covers operation of
the monitoring maintenance of the monitoring equipment data collection and archiving and
management of total scheme of the monitoring CME and Project Implementer will assign specific trained
PROJECT DESIGN DOCUMENT FORM (CDM-SSC-PDD) - Version 03
CDM ndash Executive Board
42
personnel during project implementation for the overall monitoring measurement and reporting of key
parameters as required in this PDD
DATA LOGGING AND STORAGE
The data measured by the instruments will be collected and stored in a data logging system The data will
be retrieved remotely by modem or directly on site
If data cannot be retrieved no emissions reductions will be claimed for the period of data failure The
data collected will be recorded in a central data base Access to production data will be restricted All
records and data (hard copy and soft copy) will be archived up to two years after the end of the crediting
period or the last issuance of CERs for this project activity whichever occurs later
CALIBRATION AND MAINTENANCE PROCEDURES MALFUNCTION OF EQUIPMENT
Maintenance includes all preventive and corrective actions necessary for the good functioning of the
equipment such as
Visual control of the equipment state and real-time check of displayed parameters
Cleaning up the equipment and the sensors
Adding lubricant
Replacement and change of defective parts
Calibration of equipment consists in verifying by comparison with a standard the accuracy of a
measuring instrument
Measuring instruments will be periodically and appropriately calibrated according to the procedures
timing and methods recommended by the manufacturer or nationalinternational standards as available
General malfunction of equipment
Daily inspections of the equipment will allow controlling equipment failure If equipment fails the
supplier will be notified and repairs will be carried out If the damaged equipment cannot be repaired it
will be replaced at the earliest In some cases portable tools will be used in order to carry out daily
monitoring of the missing parameter(s) In such case this data will be recorded manually
Discrepancies
To avoid discrepancies between projected data in the PDD and actual data (eg due to deferred starting
date malfunction of equipment) cross-checks between internal meter readings and external sources (eg
electricity invoices) will be carried out Any source of inconsistencies will be clarified
Case of emergency
For the case of emergency (earthquakes explosions fires etc) an emergency preparedness plan will be
adapted to the project activity All employees involved in the project on-site will be trained in the code of
conduct and required actions at time of commissioning of the plant
PROJECT DESIGN DOCUMENT FORM (CDM-SSC-PDD) - Version 03
CDM ndash Executive Board
43
OPERATIONAL AND MANAGEMENT STRUCTURE
The CDM monitoring team will be composed by the following staff
Position Report to
Operators
Project owner Supervisors (technicalmaintenance)
Operation Engineer
CDM monitoring project manager External CDM consultant
TRAINING OF MONITORING PERSONNEL
The maintenance will be conducted in-house by staff employed and trained by the Project Participants
Employees involved in the monitoring will be trained internally andor externally Training may include
inter alia
a) Review of equipment and captors
b) Calibration requirement
c) Configuration of monitoring equipment
d) Maintenance requirement
C1 Please indicate the level at which environmental analysis as per requirements of the CDM
modalities and procedures is undertaken Justify the choice of level at which the environmental
analysis is undertaken
radic Please tick if this information is provided at the PoA level In this case sections C2 and C3
need not be completed in this form
C2 Documentation on the analysis of the environmental impacts including transboundary
impacts
The host country does not require an analysis of environmental impacts As the project involves reduction
of GHG through recovery and controlled combustion which improves the quality of air therefore there
are no significant environmental impacts identified
C3 Please state whether an environmental impact assessment is required for a typical CPA
included in the programme of activities (PoA) in accordance with the host Party lawsregulations
In accordance with Malaysia environmental regulations Environmental Quality (Prescribed Activities
Environmental Impact Assessment) Order 1987 an Environmental Impact Assessment (EIA) is not
required for this CPA
PROJECT DESIGN DOCUMENT FORM (CDM-SSC-PDD) - Version 03
CDM ndash Executive Board
44
SECTION D Stakeholdersrsquo comments
D1 Please indicate the level at which local stakeholder comments are invited Justify the
choice
Please tick if this information is provided at the PoA level In this case sections D2 to D4 need
not be completed in this form
D2 Brief description how comments by local stakeholders have been invited and compiled
The stakeholder meeting was conducted at the office of Kilang Sawit Felda Triang on 05032012 There
were 37 stakeholders attending the consultation Posters were pasted at the guard house and at the
entrance to office 1 week before the stakeholder consultation to inform the locals stakeholders which
comprise mostly the workers of the mill 20 stakeholders out of the 37 who attended the consultation are
2nd generation of the Felda settlers who live in the vicinity to the project activity and adequately represent
the local community composed entirely of Felda settlers (no other people live in the vicinity of this
remote plantation) Continuous input of ideascomments were allowed to all stakeholders who could
either send their input though an email account especially setup for the biogas project or directly inform
the project proponents
During the meeting presentations were made by the project owner to outline the proposed project activity
in a non-technical manner (including environmental social and technological considerations) climate
change and the role of the CDM Attendees were given opportunity to raise their concern and opinion
about the proposed project activity during the question and answer session
D3 Summary of the comments received
PROJECT DESIGN DOCUMENT FORM (CDM-SSC-PDD) - Version 03
CDM ndash Executive Board
45
Below are the questions raised during the stakeholder meeting
NAME QUESTION
Mohd Tarmizi Bin Mat
Daud What is CDM in Bahasa Malaysia
Mohd Tarmizi Bin Mat
Daud What is DoE‟s standard for treated water released into river
Mohd Azizi Bin Abdul
Aziz
Would the biogas be captured from the existing effluent treatment ponds or a
new structure
Azhar Bin Abdul What to do with the captured biogas from the bioreactor
D4 Report on how due account was taken of any comments received
Below are the answers to the questions asked during the stakeholder meeting
QUESTION ANSWER
What is CDM in Bahasa Malaysia
The meaning of CDM in Bahasa Malaysia is Mekanisme
Pembangunan Bersih or in English is Clean Development
Mechanism
By Abd Karim Bin Mohd Zin
What is DoE‟s standard for treated
water released into river
The discharge standard for BOD into river is less than 100ppm
By Abd Karim Bin Mohd Zin
Would the biogas be captured from
the existing effluent treatment
ponds or a new structure
New bioreactor will be constructed to replace the existing anaerobic
lagoon treatment system The new bioreactor will capture the
biogas produced from this anaerobic treatment process
By Abd Karim Bin Mohd Zin
What to do with the captured
biogas from the bioreactor
The biogas recovered from the bioreactor will mainly contain
methane (approximately 60) and the rest are CO2 H2 and H2S
Currently the biogas is just released to the atmosphere from the
existing open lagoons system During the project activity captured
biogas will be combusted thus will improve the air quality
By Abd Karim Bin Mohd Zin
PROJECT DESIGN DOCUMENT FORM (CDM-SSC-PDD) - Version 03
CDM ndash Executive Board
46
Annex 1
CONTACT INFORMATION ON ENTITYINDIVIDUAL RESPONSIBLE FOR THE SMALL-
SCALE CPA
Organization Felda Palm Industries Sdn Bhd (359584-V)
StreetPOBox Jalan Gurney 1
Building Balai Felda 4th Floor
City Kuala Lumpur
StateRegion Wilayah Persekutuan
PostfixZIP 54000
Country Malaysia
Telephone (03) 2692 8066
FAX (03) 2693 4148
URL wwwfeldanetmy
Represented by
Title Head of Department
Salutation Mr
Last Name Busu
Middle Name
First Name Zainuri
Department Biomass
Mobile
Direct FAX
Direct tel
Personal E-Mail zainuribfeldanetmy
Organization Ably Carbon Sdn Bhd
StreetPOBox Jalan Ipoh Kecil
Building No 17
City Kuala Lumpur
StateRegion
PostfixZIP 50350
Country Malaysia
Telephone +60 3 4042 1177
FAX +60 3 4044 4166
E-Mail stephanevidailletably-carboncom
URL
Represented by Stephane Vidaillet
Title Chairman
Salutation Mr
Last Name Vidaillet
Middle Name
First Name Steacutephane
Department
Mobile +33 6 59111 5600
Direct FAX
PROJECT DESIGN DOCUMENT FORM (CDM-SSC-PDD) - Version 03
CDM ndash Executive Board
47
Direct tel
Personal E-Mail stephanevidailletably-carboncom
PROJECT DESIGN DOCUMENT FORM (CDM-SSC-PDD) - Version 03
CDM ndash Executive Board
48
Annex 2
INFORMATION REGARDING PUBLIC FUNDING
The project activity is not receiving any funding from parties included in Annex 1 of the Kyoto Protocol
SMALL-SCALE CDM PROGRAMME ACTIVITY DESIGN DOCUMENT FORM (CDM-SSC-CPA-DD) - Version 01
NAME TITLE OF THE PoA Biogas Recovery and Utilization PoA Projects in
Malaysia
CDM ndash Executive Board page 49
This template shall not be altered It shall be completed without modifyingadding headings or logo format or font
Annex 3
BASELINE INFORMATION
1 2
Year 2009 2010 2011 2012 2013 2014
FFB (mtyr) 343720 345910 310250 333293 333293 333293
POME Volume
(cumyr)[1] 343720 345910 310250 333293 333293 333293
Mill Opearing hour (hryr) 68865 69225 6209 6673 6673 6673
PKS (mtyr) 18905 19025 17064 18331 18331 18331
3 4 5 6 7 8 9 10
2015 2016 2017 2018 2019 2020 2021 2022
333293 333293 333293 333293 333293 333293 333293 333293
333293 333293 333293 333293 333293 333293 333293 333293
6673 6673 6673 6673 6673 6673 6673 6673
18331 18331 18331 18331 18331 18331 18331 18331
SMALL-SCALE CDM PROGRAMME ACTIVITY DESIGN DOCUMENT FORM (CDM-SSC-CPA-DD) - Version 01
NAME TITLE OF THE PoA Biogas Recovery and Utilization PoA Projects in
Malaysia
CDM ndash Executive Board page 50
This template shall not be altered It shall be completed without modifyingadding headings or logo format or font
10 days measurement campaign for baseline wastewater treatment system
Day Date
ETP
Inlet
Anaerobic
system (mgl)
Outlet
Anaerobic
system (mgl)
Outlet Algae
System (mgl)
Final
Discharge to
River (mgl)
1 23-Feb-12 35693 3120 811 603
2 25-Feb-12 19511 2559 1186 83
3 26-Feb-12 32864 2767 749 437
4 27-Feb-12 30195 2330 1210 404
5 28-Feb-12 32436 1927 1188 941
6 29-Feb-12 38259 4256 896 717
7 1-Mar-12 28717 3584 1232 695
8 3-Mar-12 31002 4660 1658 1210
9 4-Mar-12 22400 4346 1389 963
10 5-Mar-12 31226 4301 1971 1165
Average 30230 3385 1229 722
ETP
COD removal efficiency (anaerobic system) 8880
COD removal efficiency (Facultativealgae system) 6369
COD removal efficiency (Bio-polishing system) 4127
Total COD removal efficiency of the treatment system 9761
The COD of the raw effluent during ex-post may vary from the one year historical records depending on
the improvement of the production process (outside of project boundary) thus ERex-post may vary from the
estimated ERex-ante
SMALL-SCALE CDM PROGRAMME ACTIVITY DESIGN DOCUMENT FORM (CDM-SSC-CPA-DD) - Version 01
NAME TITLE OF THE PoA Biogas Recovery and Utilization PoA Projects in
Malaysia
CDM ndash Executive Board page 51
This template shall not be altered It shall be completed without modifyingadding headings or logo format or font
Annex 4
MONITORING INFORMATION
General information
Monitoring refers to the collection and archiving of all relevant data necessary for determining the
baseline measuring anthropogenic emissions by sources of greenhouse gases (GHG) within the project
boundary of a CDM project activity and leakage It includes developing suitable data collection methods
and data interpretation techniques for monitoring and verification of GHG emissions
On-line monitoring system
Most key meters required to determine GHG emissions and emission reductions will be monitored from a
central control point which will record meter readings at a pre-determined interval
Ensuring adequate maintenance and calibration of monitoring instruments
Specific maintenance repair or replacement of monitoring equipment will be recorded dated and
described
The calibration will occur at intervals determined on the basis of instrument manufacturers
recommendations stability purpose usage and history of repeatability Recalibration should be
performed whenever an event occurs that places the accuracy of the instrument in doubt
Calibration will take place at least once every three (3) years to ensure that the monitoring
equipments are properly installed and functioning properly
Calibration will be performed according to national or international standards
Last calibration certificates will be provided during periodic verification
Sampling procedure
Wherever a statistical sample is used for monitoring the ldquogeneral guidelines for sampling and surveys for
SSC project activitiesrdquo shall be used COD shall be measured from a composite sample to obtain a
representative value
Data archiving
The monitored data will be kept for a minimum of 2 years after the end of the crediting years by using
paper documents or electronic files
Identification of non-conformities
A verification of inconsistencies of the data recorded will be performed based for example on
The comparison of the calculated quantities of methane versus expected
Spot checks of field instruments (local reading) and data in the log file
Any discrepancies (completeness calculation errors transcription errors instrument calibration issues)
will be analyzed and actions taken to correct the problem
Ensuring adequate training of staff
All new staff members will undergo bdquoon job training‟ covering the monitoring requirements
The monitoring plan will be made available to staff member involved in the monitoring
A copy will be located in the control room at the site
SMALL-SCALE CDM PROGRAMME ACTIVITY DESIGN DOCUMENT FORM (CDM-SSC-CPA-DD) - Version 01
NAME TITLE OF THE PoA Biogas Recovery and Utilization PoA Projects in
Malaysia
CDM ndash Executive Board page 52
This template shall not be altered It shall be completed without modifyingadding headings or logo format or font
During the training the employees will sign a training attendance list All training records shall
be documented inclusive of training attendance training memo and training material if any
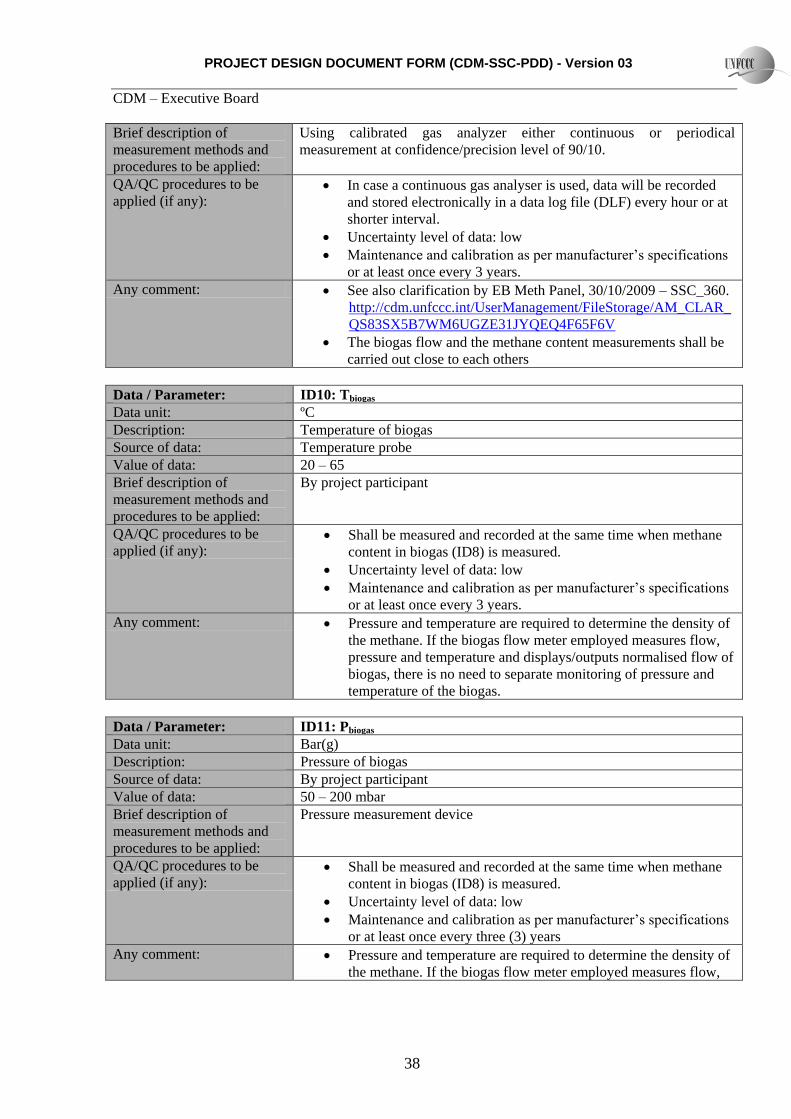
PROJECT DESIGN DOCUMENT FORM (CDM-SSC-PDD) - Version 03
CDM ndash Executive Board
38
Brief description of
measurement methods and
procedures to be applied
Using calibrated gas analyzer either continuous or periodical
measurement at confidenceprecision level of 9010
QAQC procedures to be
applied (if any) In case a continuous gas analyser is used data will be recorded
and stored electronically in a data log file (DLF) every hour or at
shorter interval
Uncertainty level of data low
Maintenance and calibration as per manufacturer‟s specifications
or at least once every 3 years
Any comment See also clarification by EB Meth Panel 30102009 ndash SSC_360
httpcdmunfcccintUserManagementFileStorageAM_CLAR_
QS83SX5B7WM6UGZE31JYQEQ4F65F6V
The biogas flow and the methane content measurements shall be
carried out close to each others
Data Parameter ID10 Tbiogas
Data unit ordmC
Description Temperature of biogas
Source of data Temperature probe
Value of data 20 ndash 65
Brief description of
measurement methods and
procedures to be applied
By project participant
QAQC procedures to be
applied (if any) Shall be measured and recorded at the same time when methane
content in biogas (ID8) is measured
Uncertainty level of data low
Maintenance and calibration as per manufacturer‟s specifications
or at least once every 3 years
Any comment Pressure and temperature are required to determine the density of
the methane If the biogas flow meter employed measures flow
pressure and temperature and displaysoutputs normalised flow of
biogas there is no need to separate monitoring of pressure and
temperature of the biogas
Data Parameter ID11 Pbiogas
Data unit Bar(g)
Description Pressure of biogas
Source of data By project participant
Value of data 50 ndash 200 mbar
Brief description of
measurement methods and
procedures to be applied
Pressure measurement device
QAQC procedures to be
applied (if any) Shall be measured and recorded at the same time when methane
content in biogas (ID8) is measured
Uncertainty level of data low
Maintenance and calibration as per manufacturer‟s specifications
or at least once every three (3) years
Any comment Pressure and temperature are required to determine the density of
the methane If the biogas flow meter employed measures flow
PROJECT DESIGN DOCUMENT FORM (CDM-SSC-PDD) - Version 03
CDM ndash Executive Board
39
pressure and temperature and displaysoutputs normalised flow of
biogas there is no need to separate monitoring of pressure and
temperature of the biogas
Shall be measured at the same time when methane content in
biogas (ID9) is measured
Parameter ID12 ηflareh (enclosed flare)
Unit
Description Enclosed flare efficiency in the hour h
Source of data Calculated
Value of data 0 or 50 or 90
Brief description of
measurement methods and
procedures to be applied
This yearly efficiency will be based on hourly flare efficiencies calculated
as per the provisions in the ldquoTool to determine project emissions from
flaring gases containing methanerdquo
The hourly flare efficiency will be calculated based on
0 if the temperature in the exhaust gas of the flare (Tflare) is
below 500 degC for more than 20 minutes during the hour h
50 if the temperature in the exhaust gas of the flare (Tflare) is
above 500 degC for more than 40 minutes during the hour h but the
manufacturer‟s specifications on proper operation of the flare are
not met at any point in time during the hour h
90 if the temperature in the exhaust gas of the flare (Tflare) is
above 500 degC for more than 40 minutes during the hour h and the
manufacturer‟s specifications on proper operation of the flare are
met continuously during the hour h
QAQC procedures to be
applied (if any) Data are logged hourly in a data log file (DLF)
Uncertainty level of data low
Any comment For enclosed flare
Or
Parameter ID13 ηflareh (open flare)
Unit
Description Flare efficiency in the hour h
Source of data Calculated
Value of data 0 or 50
Brief description of
measurement methods and
procedures to be applied
This yearly efficiency will be based on hourly flare efficiencies calculated
as per the provisions in the ldquoTool to determine project emissions from
flaring gases containing methanerdquo
The hourly flare efficiency will be calculated based on the duration of
time during which the flame is detected by the thermocouple (or flame
detector) installed in the open flare
Flare efficiency in hour h is based on default values
0 if the flame detected for not more than 20 minutes during the
hour h and
PROJECT DESIGN DOCUMENT FORM (CDM-SSC-PDD) - Version 03
CDM ndash Executive Board
40
50 if the flame detected for more than 20 minutes during the
hour h
A flame detector or thermocouple will be used
QAQC procedures to be
applied (if any) Data are logged hourly in a data log file (DLF)
Uncertainty level of data low
Any comment The only monitored parameter related to the flare is its efficiency Indeed
according to the clarification SSC_19927 of the methodology AMS IIIH
version 9 accepted by the SSC WG on the 3092008 ldquoIf a thermocouple
is used as a flame detection system it is sufficient to reach the given
minimum temperature from the manufacturer ldquo Hence it is not necessary
to monitor the temperature of the open type flares (Tflare)
Data Parameter ID14 ECPJjy
Data unit MWh
Description The yearly grid electricity consumption of the project activity for the year
bdquoy‟
Source of data Onsite instrument
Value of data ~749
Brief description of
measurement methods and
procedures to be applied
The grid electricity consumption of the project activity is measured
continuously with an energy meter (cumulative reading)
QAQC procedures to be
applied (if any) Data are monitored continuously and recorded periodically
(yearly or at shorter interval) in a data log file (DLF)
Uncertainty level of data low
Maintenance and calibration as per manufacturer‟s specifications
or at least once every three (3) years
Any comment
Data Parameter ID15 EGBLy
Data unit MWh
Description Quantity of net electricity generated and send to grid in year y
Source of data By project participant
Value of data ~ 6798
Brief description of
measurement methods and
procedures to be applied
The electricity generated and sent to grid is measured continuously with
an energy meter (cumulative readings)
QAQC procedures to be
applied (if any) Data are monitored continuously and recorded periodically
(yearly or at shorter interval) in a data log file (DLF)
Uncertainty level of data low
Maintenance and calibration as per manufacturer‟s specifications
or at least once every 3 years
Any comment As per AMS-ID
27 The clarification SSC_199 if available here (last access on the 24052011)
httpcdmunfcccintfilestorageAM_AM_CLAR_HIOZ5CS1PASC187C0JQ668L2E9RCRJResponse20WG20provided
20at20SSC20WG2017pdft=bU98MTMwNjIxNjY0OS4xMQ==|BOKHqtO94N6XF1N2N1vo8Ori-Rc=
PROJECT DESIGN DOCUMENT FORM (CDM-SSC-PDD) - Version 03
CDM ndash Executive Board
41
Or
Data Parameter ID16 EGmilly
Data unit MWh
Description Quantity of annual output of renewable energy sent to the mill in year y
Source of data By project participant
Value of data ~ 0
Brief description of
measurement methods and
procedures to be applied
The electricity generated and sent to mill to displace diesel use in diesel
gensets is measured continuously with an energy meter (cumulative
readings)
QAQC procedures to be
applied (if any) Data are monitored continuously and recorded periodically
(yearly or at shorter interval) in a data log file (DLF)
Uncertainty level of data low
Maintenance and calibration as per manufacturer‟s specifications
or at least once every 3 years
Any comment As per AMS-IA
Data Parameter ID17 Displacement of Biomass
Data unit Mt
Description Total amount of biomass (PKS) displaced from biomass boilers
Source of data Weighing bridge
Value of data Measurement at site
Brief description of
measurement methods and
procedures to be applied
Biomass (PKS) displaced due to the project activity will be weighed
using weighing bridge at the palm oil mill
QAQC procedures to be
applied (if any) Monthly calculation based on every single trip of trucks recorded
Data is recorded manually in a data log file based on the weighing
records
Maintenance and calibration as per manufacturer‟s specifications
Uncertainty level of data low
Any comment In the project activity the biomass (PKS) displaced will not be stored
under anaerobic conditions The conditions of onsite storage are identical
in the baseline as in the project activity The biomass will be sold to the
market on a regular basis PEbiomassy = 0
A final monitoring plan will be prepared prior the initial verification based on the as-built project activity
It will address the following aspects
MONITORING
The Project will be managed by CME with the involvement from Project Implementer CME will ensure
safety in operation of the plant as well as in the monitoring of emission reduction which is generated from
the project activity
CME will implement and be responsible for the monitoring plan Their responsibility covers operation of
the monitoring maintenance of the monitoring equipment data collection and archiving and
management of total scheme of the monitoring CME and Project Implementer will assign specific trained
PROJECT DESIGN DOCUMENT FORM (CDM-SSC-PDD) - Version 03
CDM ndash Executive Board
42
personnel during project implementation for the overall monitoring measurement and reporting of key
parameters as required in this PDD
DATA LOGGING AND STORAGE
The data measured by the instruments will be collected and stored in a data logging system The data will
be retrieved remotely by modem or directly on site
If data cannot be retrieved no emissions reductions will be claimed for the period of data failure The
data collected will be recorded in a central data base Access to production data will be restricted All
records and data (hard copy and soft copy) will be archived up to two years after the end of the crediting
period or the last issuance of CERs for this project activity whichever occurs later
CALIBRATION AND MAINTENANCE PROCEDURES MALFUNCTION OF EQUIPMENT
Maintenance includes all preventive and corrective actions necessary for the good functioning of the
equipment such as
Visual control of the equipment state and real-time check of displayed parameters
Cleaning up the equipment and the sensors
Adding lubricant
Replacement and change of defective parts
Calibration of equipment consists in verifying by comparison with a standard the accuracy of a
measuring instrument
Measuring instruments will be periodically and appropriately calibrated according to the procedures
timing and methods recommended by the manufacturer or nationalinternational standards as available
General malfunction of equipment
Daily inspections of the equipment will allow controlling equipment failure If equipment fails the
supplier will be notified and repairs will be carried out If the damaged equipment cannot be repaired it
will be replaced at the earliest In some cases portable tools will be used in order to carry out daily
monitoring of the missing parameter(s) In such case this data will be recorded manually
Discrepancies
To avoid discrepancies between projected data in the PDD and actual data (eg due to deferred starting
date malfunction of equipment) cross-checks between internal meter readings and external sources (eg
electricity invoices) will be carried out Any source of inconsistencies will be clarified
Case of emergency
For the case of emergency (earthquakes explosions fires etc) an emergency preparedness plan will be
adapted to the project activity All employees involved in the project on-site will be trained in the code of
conduct and required actions at time of commissioning of the plant
PROJECT DESIGN DOCUMENT FORM (CDM-SSC-PDD) - Version 03
CDM ndash Executive Board
43
OPERATIONAL AND MANAGEMENT STRUCTURE
The CDM monitoring team will be composed by the following staff
Position Report to
Operators
Project owner Supervisors (technicalmaintenance)
Operation Engineer
CDM monitoring project manager External CDM consultant
TRAINING OF MONITORING PERSONNEL
The maintenance will be conducted in-house by staff employed and trained by the Project Participants
Employees involved in the monitoring will be trained internally andor externally Training may include
inter alia
a) Review of equipment and captors
b) Calibration requirement
c) Configuration of monitoring equipment
d) Maintenance requirement
C1 Please indicate the level at which environmental analysis as per requirements of the CDM
modalities and procedures is undertaken Justify the choice of level at which the environmental
analysis is undertaken
radic Please tick if this information is provided at the PoA level In this case sections C2 and C3
need not be completed in this form
C2 Documentation on the analysis of the environmental impacts including transboundary
impacts
The host country does not require an analysis of environmental impacts As the project involves reduction
of GHG through recovery and controlled combustion which improves the quality of air therefore there
are no significant environmental impacts identified
C3 Please state whether an environmental impact assessment is required for a typical CPA
included in the programme of activities (PoA) in accordance with the host Party lawsregulations
In accordance with Malaysia environmental regulations Environmental Quality (Prescribed Activities
Environmental Impact Assessment) Order 1987 an Environmental Impact Assessment (EIA) is not
required for this CPA
PROJECT DESIGN DOCUMENT FORM (CDM-SSC-PDD) - Version 03
CDM ndash Executive Board
44
SECTION D Stakeholdersrsquo comments
D1 Please indicate the level at which local stakeholder comments are invited Justify the
choice
Please tick if this information is provided at the PoA level In this case sections D2 to D4 need
not be completed in this form
D2 Brief description how comments by local stakeholders have been invited and compiled
The stakeholder meeting was conducted at the office of Kilang Sawit Felda Triang on 05032012 There
were 37 stakeholders attending the consultation Posters were pasted at the guard house and at the
entrance to office 1 week before the stakeholder consultation to inform the locals stakeholders which
comprise mostly the workers of the mill 20 stakeholders out of the 37 who attended the consultation are
2nd generation of the Felda settlers who live in the vicinity to the project activity and adequately represent
the local community composed entirely of Felda settlers (no other people live in the vicinity of this
remote plantation) Continuous input of ideascomments were allowed to all stakeholders who could
either send their input though an email account especially setup for the biogas project or directly inform
the project proponents
During the meeting presentations were made by the project owner to outline the proposed project activity
in a non-technical manner (including environmental social and technological considerations) climate
change and the role of the CDM Attendees were given opportunity to raise their concern and opinion
about the proposed project activity during the question and answer session
D3 Summary of the comments received
PROJECT DESIGN DOCUMENT FORM (CDM-SSC-PDD) - Version 03
CDM ndash Executive Board
45
Below are the questions raised during the stakeholder meeting
NAME QUESTION
Mohd Tarmizi Bin Mat
Daud What is CDM in Bahasa Malaysia
Mohd Tarmizi Bin Mat
Daud What is DoE‟s standard for treated water released into river
Mohd Azizi Bin Abdul
Aziz
Would the biogas be captured from the existing effluent treatment ponds or a
new structure
Azhar Bin Abdul What to do with the captured biogas from the bioreactor
D4 Report on how due account was taken of any comments received
Below are the answers to the questions asked during the stakeholder meeting
QUESTION ANSWER
What is CDM in Bahasa Malaysia
The meaning of CDM in Bahasa Malaysia is Mekanisme
Pembangunan Bersih or in English is Clean Development
Mechanism
By Abd Karim Bin Mohd Zin
What is DoE‟s standard for treated
water released into river
The discharge standard for BOD into river is less than 100ppm
By Abd Karim Bin Mohd Zin
Would the biogas be captured from
the existing effluent treatment
ponds or a new structure
New bioreactor will be constructed to replace the existing anaerobic
lagoon treatment system The new bioreactor will capture the
biogas produced from this anaerobic treatment process
By Abd Karim Bin Mohd Zin
What to do with the captured
biogas from the bioreactor
The biogas recovered from the bioreactor will mainly contain
methane (approximately 60) and the rest are CO2 H2 and H2S
Currently the biogas is just released to the atmosphere from the
existing open lagoons system During the project activity captured
biogas will be combusted thus will improve the air quality
By Abd Karim Bin Mohd Zin
PROJECT DESIGN DOCUMENT FORM (CDM-SSC-PDD) - Version 03
CDM ndash Executive Board
46
Annex 1
CONTACT INFORMATION ON ENTITYINDIVIDUAL RESPONSIBLE FOR THE SMALL-
SCALE CPA
Organization Felda Palm Industries Sdn Bhd (359584-V)
StreetPOBox Jalan Gurney 1
Building Balai Felda 4th Floor
City Kuala Lumpur
StateRegion Wilayah Persekutuan
PostfixZIP 54000
Country Malaysia
Telephone (03) 2692 8066
FAX (03) 2693 4148
URL wwwfeldanetmy
Represented by
Title Head of Department
Salutation Mr
Last Name Busu
Middle Name
First Name Zainuri
Department Biomass
Mobile
Direct FAX
Direct tel
Personal E-Mail zainuribfeldanetmy
Organization Ably Carbon Sdn Bhd
StreetPOBox Jalan Ipoh Kecil
Building No 17
City Kuala Lumpur
StateRegion
PostfixZIP 50350
Country Malaysia
Telephone +60 3 4042 1177
FAX +60 3 4044 4166
E-Mail stephanevidailletably-carboncom
URL
Represented by Stephane Vidaillet
Title Chairman
Salutation Mr
Last Name Vidaillet
Middle Name
First Name Steacutephane
Department
Mobile +33 6 59111 5600
Direct FAX
PROJECT DESIGN DOCUMENT FORM (CDM-SSC-PDD) - Version 03
CDM ndash Executive Board
47
Direct tel
Personal E-Mail stephanevidailletably-carboncom
PROJECT DESIGN DOCUMENT FORM (CDM-SSC-PDD) - Version 03
CDM ndash Executive Board
48
Annex 2
INFORMATION REGARDING PUBLIC FUNDING
The project activity is not receiving any funding from parties included in Annex 1 of the Kyoto Protocol
SMALL-SCALE CDM PROGRAMME ACTIVITY DESIGN DOCUMENT FORM (CDM-SSC-CPA-DD) - Version 01
NAME TITLE OF THE PoA Biogas Recovery and Utilization PoA Projects in
Malaysia
CDM ndash Executive Board page 49
This template shall not be altered It shall be completed without modifyingadding headings or logo format or font
Annex 3
BASELINE INFORMATION
1 2
Year 2009 2010 2011 2012 2013 2014
FFB (mtyr) 343720 345910 310250 333293 333293 333293
POME Volume
(cumyr)[1] 343720 345910 310250 333293 333293 333293
Mill Opearing hour (hryr) 68865 69225 6209 6673 6673 6673
PKS (mtyr) 18905 19025 17064 18331 18331 18331
3 4 5 6 7 8 9 10
2015 2016 2017 2018 2019 2020 2021 2022
333293 333293 333293 333293 333293 333293 333293 333293
333293 333293 333293 333293 333293 333293 333293 333293
6673 6673 6673 6673 6673 6673 6673 6673
18331 18331 18331 18331 18331 18331 18331 18331
SMALL-SCALE CDM PROGRAMME ACTIVITY DESIGN DOCUMENT FORM (CDM-SSC-CPA-DD) - Version 01
NAME TITLE OF THE PoA Biogas Recovery and Utilization PoA Projects in
Malaysia
CDM ndash Executive Board page 50
This template shall not be altered It shall be completed without modifyingadding headings or logo format or font
10 days measurement campaign for baseline wastewater treatment system
Day Date
ETP
Inlet
Anaerobic
system (mgl)
Outlet
Anaerobic
system (mgl)
Outlet Algae
System (mgl)
Final
Discharge to
River (mgl)
1 23-Feb-12 35693 3120 811 603
2 25-Feb-12 19511 2559 1186 83
3 26-Feb-12 32864 2767 749 437
4 27-Feb-12 30195 2330 1210 404
5 28-Feb-12 32436 1927 1188 941
6 29-Feb-12 38259 4256 896 717
7 1-Mar-12 28717 3584 1232 695
8 3-Mar-12 31002 4660 1658 1210
9 4-Mar-12 22400 4346 1389 963
10 5-Mar-12 31226 4301 1971 1165
Average 30230 3385 1229 722
ETP
COD removal efficiency (anaerobic system) 8880
COD removal efficiency (Facultativealgae system) 6369
COD removal efficiency (Bio-polishing system) 4127
Total COD removal efficiency of the treatment system 9761
The COD of the raw effluent during ex-post may vary from the one year historical records depending on
the improvement of the production process (outside of project boundary) thus ERex-post may vary from the
estimated ERex-ante
SMALL-SCALE CDM PROGRAMME ACTIVITY DESIGN DOCUMENT FORM (CDM-SSC-CPA-DD) - Version 01
NAME TITLE OF THE PoA Biogas Recovery and Utilization PoA Projects in
Malaysia
CDM ndash Executive Board page 51
This template shall not be altered It shall be completed without modifyingadding headings or logo format or font
Annex 4
MONITORING INFORMATION
General information
Monitoring refers to the collection and archiving of all relevant data necessary for determining the
baseline measuring anthropogenic emissions by sources of greenhouse gases (GHG) within the project
boundary of a CDM project activity and leakage It includes developing suitable data collection methods
and data interpretation techniques for monitoring and verification of GHG emissions
On-line monitoring system
Most key meters required to determine GHG emissions and emission reductions will be monitored from a
central control point which will record meter readings at a pre-determined interval
Ensuring adequate maintenance and calibration of monitoring instruments
Specific maintenance repair or replacement of monitoring equipment will be recorded dated and
described
The calibration will occur at intervals determined on the basis of instrument manufacturers
recommendations stability purpose usage and history of repeatability Recalibration should be
performed whenever an event occurs that places the accuracy of the instrument in doubt
Calibration will take place at least once every three (3) years to ensure that the monitoring
equipments are properly installed and functioning properly
Calibration will be performed according to national or international standards
Last calibration certificates will be provided during periodic verification
Sampling procedure
Wherever a statistical sample is used for monitoring the ldquogeneral guidelines for sampling and surveys for
SSC project activitiesrdquo shall be used COD shall be measured from a composite sample to obtain a
representative value
Data archiving
The monitored data will be kept for a minimum of 2 years after the end of the crediting years by using
paper documents or electronic files
Identification of non-conformities
A verification of inconsistencies of the data recorded will be performed based for example on
The comparison of the calculated quantities of methane versus expected
Spot checks of field instruments (local reading) and data in the log file
Any discrepancies (completeness calculation errors transcription errors instrument calibration issues)
will be analyzed and actions taken to correct the problem
Ensuring adequate training of staff
All new staff members will undergo bdquoon job training‟ covering the monitoring requirements
The monitoring plan will be made available to staff member involved in the monitoring
A copy will be located in the control room at the site
SMALL-SCALE CDM PROGRAMME ACTIVITY DESIGN DOCUMENT FORM (CDM-SSC-CPA-DD) - Version 01
NAME TITLE OF THE PoA Biogas Recovery and Utilization PoA Projects in
Malaysia
CDM ndash Executive Board page 52
This template shall not be altered It shall be completed without modifyingadding headings or logo format or font
During the training the employees will sign a training attendance list All training records shall
be documented inclusive of training attendance training memo and training material if any
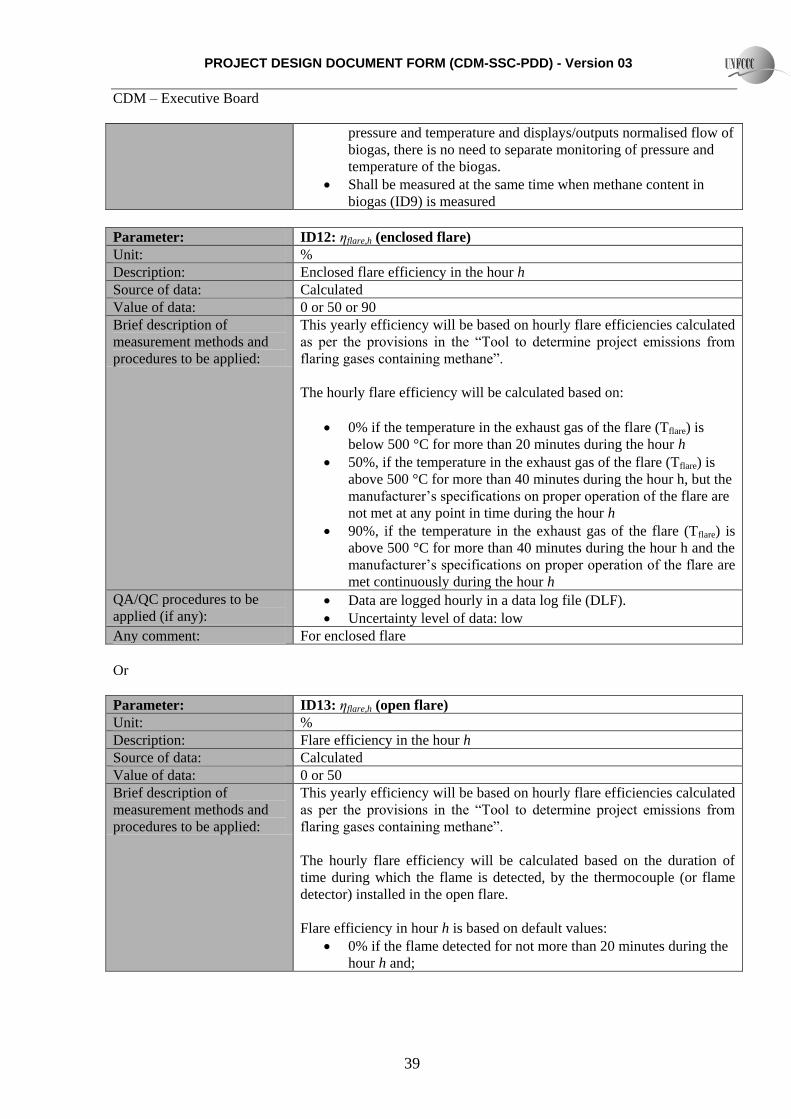
PROJECT DESIGN DOCUMENT FORM (CDM-SSC-PDD) - Version 03
CDM ndash Executive Board
41
Or
Data Parameter ID16 EGmilly
Data unit MWh
Description Quantity of annual output of renewable energy sent to the mill in year y
Source of data By project participant
Value of data ~ 0
Brief description of
measurement methods and
procedures to be applied
The electricity generated and sent to mill to displace diesel use in diesel
gensets is measured continuously with an energy meter (cumulative
readings)
QAQC procedures to be
applied (if any) Data are monitored continuously and recorded periodically
(yearly or at shorter interval) in a data log file (DLF)
Uncertainty level of data low
Maintenance and calibration as per manufacturer‟s specifications
or at least once every 3 years
Any comment As per AMS-IA
Data Parameter ID17 Displacement of Biomass
Data unit Mt
Description Total amount of biomass (PKS) displaced from biomass boilers
Source of data Weighing bridge
Value of data Measurement at site
Brief description of
measurement methods and
procedures to be applied
Biomass (PKS) displaced due to the project activity will be weighed
using weighing bridge at the palm oil mill
QAQC procedures to be
applied (if any) Monthly calculation based on every single trip of trucks recorded
Data is recorded manually in a data log file based on the weighing
records
Maintenance and calibration as per manufacturer‟s specifications
Uncertainty level of data low
Any comment In the project activity the biomass (PKS) displaced will not be stored
under anaerobic conditions The conditions of onsite storage are identical
in the baseline as in the project activity The biomass will be sold to the
market on a regular basis PEbiomassy = 0
A final monitoring plan will be prepared prior the initial verification based on the as-built project activity
It will address the following aspects
MONITORING
The Project will be managed by CME with the involvement from Project Implementer CME will ensure
safety in operation of the plant as well as in the monitoring of emission reduction which is generated from
the project activity
CME will implement and be responsible for the monitoring plan Their responsibility covers operation of
the monitoring maintenance of the monitoring equipment data collection and archiving and
management of total scheme of the monitoring CME and Project Implementer will assign specific trained
PROJECT DESIGN DOCUMENT FORM (CDM-SSC-PDD) - Version 03
CDM ndash Executive Board
42
personnel during project implementation for the overall monitoring measurement and reporting of key
parameters as required in this PDD
DATA LOGGING AND STORAGE
The data measured by the instruments will be collected and stored in a data logging system The data will
be retrieved remotely by modem or directly on site
If data cannot be retrieved no emissions reductions will be claimed for the period of data failure The
data collected will be recorded in a central data base Access to production data will be restricted All
records and data (hard copy and soft copy) will be archived up to two years after the end of the crediting
period or the last issuance of CERs for this project activity whichever occurs later
CALIBRATION AND MAINTENANCE PROCEDURES MALFUNCTION OF EQUIPMENT
Maintenance includes all preventive and corrective actions necessary for the good functioning of the
equipment such as
Visual control of the equipment state and real-time check of displayed parameters
Cleaning up the equipment and the sensors
Adding lubricant
Replacement and change of defective parts
Calibration of equipment consists in verifying by comparison with a standard the accuracy of a
measuring instrument
Measuring instruments will be periodically and appropriately calibrated according to the procedures
timing and methods recommended by the manufacturer or nationalinternational standards as available
General malfunction of equipment
Daily inspections of the equipment will allow controlling equipment failure If equipment fails the
supplier will be notified and repairs will be carried out If the damaged equipment cannot be repaired it
will be replaced at the earliest In some cases portable tools will be used in order to carry out daily
monitoring of the missing parameter(s) In such case this data will be recorded manually
Discrepancies
To avoid discrepancies between projected data in the PDD and actual data (eg due to deferred starting
date malfunction of equipment) cross-checks between internal meter readings and external sources (eg
electricity invoices) will be carried out Any source of inconsistencies will be clarified
Case of emergency
For the case of emergency (earthquakes explosions fires etc) an emergency preparedness plan will be
adapted to the project activity All employees involved in the project on-site will be trained in the code of
conduct and required actions at time of commissioning of the plant
PROJECT DESIGN DOCUMENT FORM (CDM-SSC-PDD) - Version 03
CDM ndash Executive Board
43
OPERATIONAL AND MANAGEMENT STRUCTURE
The CDM monitoring team will be composed by the following staff
Position Report to
Operators
Project owner Supervisors (technicalmaintenance)
Operation Engineer
CDM monitoring project manager External CDM consultant
TRAINING OF MONITORING PERSONNEL
The maintenance will be conducted in-house by staff employed and trained by the Project Participants
Employees involved in the monitoring will be trained internally andor externally Training may include
inter alia
a) Review of equipment and captors
b) Calibration requirement
c) Configuration of monitoring equipment
d) Maintenance requirement
C1 Please indicate the level at which environmental analysis as per requirements of the CDM
modalities and procedures is undertaken Justify the choice of level at which the environmental
analysis is undertaken
radic Please tick if this information is provided at the PoA level In this case sections C2 and C3
need not be completed in this form
C2 Documentation on the analysis of the environmental impacts including transboundary
impacts
The host country does not require an analysis of environmental impacts As the project involves reduction
of GHG through recovery and controlled combustion which improves the quality of air therefore there
are no significant environmental impacts identified
C3 Please state whether an environmental impact assessment is required for a typical CPA
included in the programme of activities (PoA) in accordance with the host Party lawsregulations
In accordance with Malaysia environmental regulations Environmental Quality (Prescribed Activities
Environmental Impact Assessment) Order 1987 an Environmental Impact Assessment (EIA) is not
required for this CPA
PROJECT DESIGN DOCUMENT FORM (CDM-SSC-PDD) - Version 03
CDM ndash Executive Board
44
SECTION D Stakeholdersrsquo comments
D1 Please indicate the level at which local stakeholder comments are invited Justify the
choice
Please tick if this information is provided at the PoA level In this case sections D2 to D4 need
not be completed in this form
D2 Brief description how comments by local stakeholders have been invited and compiled
The stakeholder meeting was conducted at the office of Kilang Sawit Felda Triang on 05032012 There
were 37 stakeholders attending the consultation Posters were pasted at the guard house and at the
entrance to office 1 week before the stakeholder consultation to inform the locals stakeholders which
comprise mostly the workers of the mill 20 stakeholders out of the 37 who attended the consultation are
2nd generation of the Felda settlers who live in the vicinity to the project activity and adequately represent
the local community composed entirely of Felda settlers (no other people live in the vicinity of this
remote plantation) Continuous input of ideascomments were allowed to all stakeholders who could
either send their input though an email account especially setup for the biogas project or directly inform
the project proponents
During the meeting presentations were made by the project owner to outline the proposed project activity
in a non-technical manner (including environmental social and technological considerations) climate
change and the role of the CDM Attendees were given opportunity to raise their concern and opinion
about the proposed project activity during the question and answer session
D3 Summary of the comments received
PROJECT DESIGN DOCUMENT FORM (CDM-SSC-PDD) - Version 03
CDM ndash Executive Board
45
Below are the questions raised during the stakeholder meeting
NAME QUESTION
Mohd Tarmizi Bin Mat
Daud What is CDM in Bahasa Malaysia
Mohd Tarmizi Bin Mat
Daud What is DoE‟s standard for treated water released into river
Mohd Azizi Bin Abdul
Aziz
Would the biogas be captured from the existing effluent treatment ponds or a
new structure
Azhar Bin Abdul What to do with the captured biogas from the bioreactor
D4 Report on how due account was taken of any comments received
Below are the answers to the questions asked during the stakeholder meeting
QUESTION ANSWER
What is CDM in Bahasa Malaysia
The meaning of CDM in Bahasa Malaysia is Mekanisme
Pembangunan Bersih or in English is Clean Development
Mechanism
By Abd Karim Bin Mohd Zin
What is DoE‟s standard for treated
water released into river
The discharge standard for BOD into river is less than 100ppm
By Abd Karim Bin Mohd Zin
Would the biogas be captured from
the existing effluent treatment
ponds or a new structure
New bioreactor will be constructed to replace the existing anaerobic
lagoon treatment system The new bioreactor will capture the
biogas produced from this anaerobic treatment process
By Abd Karim Bin Mohd Zin
What to do with the captured
biogas from the bioreactor
The biogas recovered from the bioreactor will mainly contain
methane (approximately 60) and the rest are CO2 H2 and H2S
Currently the biogas is just released to the atmosphere from the
existing open lagoons system During the project activity captured
biogas will be combusted thus will improve the air quality
By Abd Karim Bin Mohd Zin
PROJECT DESIGN DOCUMENT FORM (CDM-SSC-PDD) - Version 03
CDM ndash Executive Board
46
Annex 1
CONTACT INFORMATION ON ENTITYINDIVIDUAL RESPONSIBLE FOR THE SMALL-
SCALE CPA
Organization Felda Palm Industries Sdn Bhd (359584-V)
StreetPOBox Jalan Gurney 1
Building Balai Felda 4th Floor
City Kuala Lumpur
StateRegion Wilayah Persekutuan
PostfixZIP 54000
Country Malaysia
Telephone (03) 2692 8066
FAX (03) 2693 4148
URL wwwfeldanetmy
Represented by
Title Head of Department
Salutation Mr
Last Name Busu
Middle Name
First Name Zainuri
Department Biomass
Mobile
Direct FAX
Direct tel
Personal E-Mail zainuribfeldanetmy
Organization Ably Carbon Sdn Bhd
StreetPOBox Jalan Ipoh Kecil
Building No 17
City Kuala Lumpur
StateRegion
PostfixZIP 50350
Country Malaysia
Telephone +60 3 4042 1177
FAX +60 3 4044 4166
E-Mail stephanevidailletably-carboncom
URL
Represented by Stephane Vidaillet
Title Chairman
Salutation Mr
Last Name Vidaillet
Middle Name
First Name Steacutephane
Department
Mobile +33 6 59111 5600
Direct FAX
PROJECT DESIGN DOCUMENT FORM (CDM-SSC-PDD) - Version 03
CDM ndash Executive Board
47
Direct tel
Personal E-Mail stephanevidailletably-carboncom
PROJECT DESIGN DOCUMENT FORM (CDM-SSC-PDD) - Version 03
CDM ndash Executive Board
48
Annex 2
INFORMATION REGARDING PUBLIC FUNDING
The project activity is not receiving any funding from parties included in Annex 1 of the Kyoto Protocol
SMALL-SCALE CDM PROGRAMME ACTIVITY DESIGN DOCUMENT FORM (CDM-SSC-CPA-DD) - Version 01
NAME TITLE OF THE PoA Biogas Recovery and Utilization PoA Projects in
Malaysia
CDM ndash Executive Board page 49
This template shall not be altered It shall be completed without modifyingadding headings or logo format or font
Annex 3
BASELINE INFORMATION
1 2
Year 2009 2010 2011 2012 2013 2014
FFB (mtyr) 343720 345910 310250 333293 333293 333293
POME Volume
(cumyr)[1] 343720 345910 310250 333293 333293 333293
Mill Opearing hour (hryr) 68865 69225 6209 6673 6673 6673
PKS (mtyr) 18905 19025 17064 18331 18331 18331
3 4 5 6 7 8 9 10
2015 2016 2017 2018 2019 2020 2021 2022
333293 333293 333293 333293 333293 333293 333293 333293
333293 333293 333293 333293 333293 333293 333293 333293
6673 6673 6673 6673 6673 6673 6673 6673
18331 18331 18331 18331 18331 18331 18331 18331
SMALL-SCALE CDM PROGRAMME ACTIVITY DESIGN DOCUMENT FORM (CDM-SSC-CPA-DD) - Version 01
NAME TITLE OF THE PoA Biogas Recovery and Utilization PoA Projects in
Malaysia
CDM ndash Executive Board page 50
This template shall not be altered It shall be completed without modifyingadding headings or logo format or font
10 days measurement campaign for baseline wastewater treatment system
Day Date
ETP
Inlet
Anaerobic
system (mgl)
Outlet
Anaerobic
system (mgl)
Outlet Algae
System (mgl)
Final
Discharge to
River (mgl)
1 23-Feb-12 35693 3120 811 603
2 25-Feb-12 19511 2559 1186 83
3 26-Feb-12 32864 2767 749 437
4 27-Feb-12 30195 2330 1210 404
5 28-Feb-12 32436 1927 1188 941
6 29-Feb-12 38259 4256 896 717
7 1-Mar-12 28717 3584 1232 695
8 3-Mar-12 31002 4660 1658 1210
9 4-Mar-12 22400 4346 1389 963
10 5-Mar-12 31226 4301 1971 1165
Average 30230 3385 1229 722
ETP
COD removal efficiency (anaerobic system) 8880
COD removal efficiency (Facultativealgae system) 6369
COD removal efficiency (Bio-polishing system) 4127
Total COD removal efficiency of the treatment system 9761
The COD of the raw effluent during ex-post may vary from the one year historical records depending on
the improvement of the production process (outside of project boundary) thus ERex-post may vary from the
estimated ERex-ante
SMALL-SCALE CDM PROGRAMME ACTIVITY DESIGN DOCUMENT FORM (CDM-SSC-CPA-DD) - Version 01
NAME TITLE OF THE PoA Biogas Recovery and Utilization PoA Projects in
Malaysia
CDM ndash Executive Board page 51
This template shall not be altered It shall be completed without modifyingadding headings or logo format or font
Annex 4
MONITORING INFORMATION
General information
Monitoring refers to the collection and archiving of all relevant data necessary for determining the
baseline measuring anthropogenic emissions by sources of greenhouse gases (GHG) within the project
boundary of a CDM project activity and leakage It includes developing suitable data collection methods
and data interpretation techniques for monitoring and verification of GHG emissions
On-line monitoring system
Most key meters required to determine GHG emissions and emission reductions will be monitored from a
central control point which will record meter readings at a pre-determined interval
Ensuring adequate maintenance and calibration of monitoring instruments
Specific maintenance repair or replacement of monitoring equipment will be recorded dated and
described
The calibration will occur at intervals determined on the basis of instrument manufacturers
recommendations stability purpose usage and history of repeatability Recalibration should be
performed whenever an event occurs that places the accuracy of the instrument in doubt
Calibration will take place at least once every three (3) years to ensure that the monitoring
equipments are properly installed and functioning properly
Calibration will be performed according to national or international standards
Last calibration certificates will be provided during periodic verification
Sampling procedure
Wherever a statistical sample is used for monitoring the ldquogeneral guidelines for sampling and surveys for
SSC project activitiesrdquo shall be used COD shall be measured from a composite sample to obtain a
representative value
Data archiving
The monitored data will be kept for a minimum of 2 years after the end of the crediting years by using
paper documents or electronic files
Identification of non-conformities
A verification of inconsistencies of the data recorded will be performed based for example on
The comparison of the calculated quantities of methane versus expected
Spot checks of field instruments (local reading) and data in the log file
Any discrepancies (completeness calculation errors transcription errors instrument calibration issues)
will be analyzed and actions taken to correct the problem
Ensuring adequate training of staff
All new staff members will undergo bdquoon job training‟ covering the monitoring requirements
The monitoring plan will be made available to staff member involved in the monitoring
A copy will be located in the control room at the site
SMALL-SCALE CDM PROGRAMME ACTIVITY DESIGN DOCUMENT FORM (CDM-SSC-CPA-DD) - Version 01
NAME TITLE OF THE PoA Biogas Recovery and Utilization PoA Projects in
Malaysia
CDM ndash Executive Board page 52
This template shall not be altered It shall be completed without modifyingadding headings or logo format or font
During the training the employees will sign a training attendance list All training records shall
be documented inclusive of training attendance training memo and training material if any
PROJECT DESIGN DOCUMENT FORM (CDM-SSC-PDD) - Version 03
CDM ndash Executive Board
42
personnel during project implementation for the overall monitoring measurement and reporting of key
parameters as required in this PDD
DATA LOGGING AND STORAGE
The data measured by the instruments will be collected and stored in a data logging system The data will
be retrieved remotely by modem or directly on site
If data cannot be retrieved no emissions reductions will be claimed for the period of data failure The
data collected will be recorded in a central data base Access to production data will be restricted All
records and data (hard copy and soft copy) will be archived up to two years after the end of the crediting
period or the last issuance of CERs for this project activity whichever occurs later
CALIBRATION AND MAINTENANCE PROCEDURES MALFUNCTION OF EQUIPMENT
Maintenance includes all preventive and corrective actions necessary for the good functioning of the
equipment such as
Visual control of the equipment state and real-time check of displayed parameters
Cleaning up the equipment and the sensors
Adding lubricant
Replacement and change of defective parts
Calibration of equipment consists in verifying by comparison with a standard the accuracy of a
measuring instrument
Measuring instruments will be periodically and appropriately calibrated according to the procedures
timing and methods recommended by the manufacturer or nationalinternational standards as available
General malfunction of equipment
Daily inspections of the equipment will allow controlling equipment failure If equipment fails the
supplier will be notified and repairs will be carried out If the damaged equipment cannot be repaired it
will be replaced at the earliest In some cases portable tools will be used in order to carry out daily
monitoring of the missing parameter(s) In such case this data will be recorded manually
Discrepancies
To avoid discrepancies between projected data in the PDD and actual data (eg due to deferred starting
date malfunction of equipment) cross-checks between internal meter readings and external sources (eg
electricity invoices) will be carried out Any source of inconsistencies will be clarified
Case of emergency
For the case of emergency (earthquakes explosions fires etc) an emergency preparedness plan will be
adapted to the project activity All employees involved in the project on-site will be trained in the code of
conduct and required actions at time of commissioning of the plant
PROJECT DESIGN DOCUMENT FORM (CDM-SSC-PDD) - Version 03
CDM ndash Executive Board
43
OPERATIONAL AND MANAGEMENT STRUCTURE
The CDM monitoring team will be composed by the following staff
Position Report to
Operators
Project owner Supervisors (technicalmaintenance)
Operation Engineer
CDM monitoring project manager External CDM consultant
TRAINING OF MONITORING PERSONNEL
The maintenance will be conducted in-house by staff employed and trained by the Project Participants
Employees involved in the monitoring will be trained internally andor externally Training may include
inter alia
a) Review of equipment and captors
b) Calibration requirement
c) Configuration of monitoring equipment
d) Maintenance requirement
C1 Please indicate the level at which environmental analysis as per requirements of the CDM
modalities and procedures is undertaken Justify the choice of level at which the environmental
analysis is undertaken
radic Please tick if this information is provided at the PoA level In this case sections C2 and C3
need not be completed in this form
C2 Documentation on the analysis of the environmental impacts including transboundary
impacts
The host country does not require an analysis of environmental impacts As the project involves reduction
of GHG through recovery and controlled combustion which improves the quality of air therefore there
are no significant environmental impacts identified
C3 Please state whether an environmental impact assessment is required for a typical CPA
included in the programme of activities (PoA) in accordance with the host Party lawsregulations
In accordance with Malaysia environmental regulations Environmental Quality (Prescribed Activities
Environmental Impact Assessment) Order 1987 an Environmental Impact Assessment (EIA) is not
required for this CPA
PROJECT DESIGN DOCUMENT FORM (CDM-SSC-PDD) - Version 03
CDM ndash Executive Board
44
SECTION D Stakeholdersrsquo comments
D1 Please indicate the level at which local stakeholder comments are invited Justify the
choice
Please tick if this information is provided at the PoA level In this case sections D2 to D4 need
not be completed in this form
D2 Brief description how comments by local stakeholders have been invited and compiled
The stakeholder meeting was conducted at the office of Kilang Sawit Felda Triang on 05032012 There
were 37 stakeholders attending the consultation Posters were pasted at the guard house and at the
entrance to office 1 week before the stakeholder consultation to inform the locals stakeholders which
comprise mostly the workers of the mill 20 stakeholders out of the 37 who attended the consultation are
2nd generation of the Felda settlers who live in the vicinity to the project activity and adequately represent
the local community composed entirely of Felda settlers (no other people live in the vicinity of this
remote plantation) Continuous input of ideascomments were allowed to all stakeholders who could
either send their input though an email account especially setup for the biogas project or directly inform
the project proponents
During the meeting presentations were made by the project owner to outline the proposed project activity
in a non-technical manner (including environmental social and technological considerations) climate
change and the role of the CDM Attendees were given opportunity to raise their concern and opinion
about the proposed project activity during the question and answer session
D3 Summary of the comments received
PROJECT DESIGN DOCUMENT FORM (CDM-SSC-PDD) - Version 03
CDM ndash Executive Board
45
Below are the questions raised during the stakeholder meeting
NAME QUESTION
Mohd Tarmizi Bin Mat
Daud What is CDM in Bahasa Malaysia
Mohd Tarmizi Bin Mat
Daud What is DoE‟s standard for treated water released into river
Mohd Azizi Bin Abdul
Aziz
Would the biogas be captured from the existing effluent treatment ponds or a
new structure
Azhar Bin Abdul What to do with the captured biogas from the bioreactor
D4 Report on how due account was taken of any comments received
Below are the answers to the questions asked during the stakeholder meeting
QUESTION ANSWER
What is CDM in Bahasa Malaysia
The meaning of CDM in Bahasa Malaysia is Mekanisme
Pembangunan Bersih or in English is Clean Development
Mechanism
By Abd Karim Bin Mohd Zin
What is DoE‟s standard for treated
water released into river
The discharge standard for BOD into river is less than 100ppm
By Abd Karim Bin Mohd Zin
Would the biogas be captured from
the existing effluent treatment
ponds or a new structure
New bioreactor will be constructed to replace the existing anaerobic
lagoon treatment system The new bioreactor will capture the
biogas produced from this anaerobic treatment process
By Abd Karim Bin Mohd Zin
What to do with the captured
biogas from the bioreactor
The biogas recovered from the bioreactor will mainly contain
methane (approximately 60) and the rest are CO2 H2 and H2S
Currently the biogas is just released to the atmosphere from the
existing open lagoons system During the project activity captured
biogas will be combusted thus will improve the air quality
By Abd Karim Bin Mohd Zin
PROJECT DESIGN DOCUMENT FORM (CDM-SSC-PDD) - Version 03
CDM ndash Executive Board
46
Annex 1
CONTACT INFORMATION ON ENTITYINDIVIDUAL RESPONSIBLE FOR THE SMALL-
SCALE CPA
Organization Felda Palm Industries Sdn Bhd (359584-V)
StreetPOBox Jalan Gurney 1
Building Balai Felda 4th Floor
City Kuala Lumpur
StateRegion Wilayah Persekutuan
PostfixZIP 54000
Country Malaysia
Telephone (03) 2692 8066
FAX (03) 2693 4148
URL wwwfeldanetmy
Represented by
Title Head of Department
Salutation Mr
Last Name Busu
Middle Name
First Name Zainuri
Department Biomass
Mobile
Direct FAX
Direct tel
Personal E-Mail zainuribfeldanetmy
Organization Ably Carbon Sdn Bhd
StreetPOBox Jalan Ipoh Kecil
Building No 17
City Kuala Lumpur
StateRegion
PostfixZIP 50350
Country Malaysia
Telephone +60 3 4042 1177
FAX +60 3 4044 4166
E-Mail stephanevidailletably-carboncom
URL
Represented by Stephane Vidaillet
Title Chairman
Salutation Mr
Last Name Vidaillet
Middle Name
First Name Steacutephane
Department
Mobile +33 6 59111 5600
Direct FAX
PROJECT DESIGN DOCUMENT FORM (CDM-SSC-PDD) - Version 03
CDM ndash Executive Board
47
Direct tel
Personal E-Mail stephanevidailletably-carboncom
PROJECT DESIGN DOCUMENT FORM (CDM-SSC-PDD) - Version 03
CDM ndash Executive Board
48
Annex 2
INFORMATION REGARDING PUBLIC FUNDING
The project activity is not receiving any funding from parties included in Annex 1 of the Kyoto Protocol
SMALL-SCALE CDM PROGRAMME ACTIVITY DESIGN DOCUMENT FORM (CDM-SSC-CPA-DD) - Version 01
NAME TITLE OF THE PoA Biogas Recovery and Utilization PoA Projects in
Malaysia
CDM ndash Executive Board page 49
This template shall not be altered It shall be completed without modifyingadding headings or logo format or font
Annex 3
BASELINE INFORMATION
1 2
Year 2009 2010 2011 2012 2013 2014
FFB (mtyr) 343720 345910 310250 333293 333293 333293
POME Volume
(cumyr)[1] 343720 345910 310250 333293 333293 333293
Mill Opearing hour (hryr) 68865 69225 6209 6673 6673 6673
PKS (mtyr) 18905 19025 17064 18331 18331 18331
3 4 5 6 7 8 9 10
2015 2016 2017 2018 2019 2020 2021 2022
333293 333293 333293 333293 333293 333293 333293 333293
333293 333293 333293 333293 333293 333293 333293 333293
6673 6673 6673 6673 6673 6673 6673 6673
18331 18331 18331 18331 18331 18331 18331 18331
SMALL-SCALE CDM PROGRAMME ACTIVITY DESIGN DOCUMENT FORM (CDM-SSC-CPA-DD) - Version 01
NAME TITLE OF THE PoA Biogas Recovery and Utilization PoA Projects in
Malaysia
CDM ndash Executive Board page 50
This template shall not be altered It shall be completed without modifyingadding headings or logo format or font
10 days measurement campaign for baseline wastewater treatment system
Day Date
ETP
Inlet
Anaerobic
system (mgl)
Outlet
Anaerobic
system (mgl)
Outlet Algae
System (mgl)
Final
Discharge to
River (mgl)
1 23-Feb-12 35693 3120 811 603
2 25-Feb-12 19511 2559 1186 83
3 26-Feb-12 32864 2767 749 437
4 27-Feb-12 30195 2330 1210 404
5 28-Feb-12 32436 1927 1188 941
6 29-Feb-12 38259 4256 896 717
7 1-Mar-12 28717 3584 1232 695
8 3-Mar-12 31002 4660 1658 1210
9 4-Mar-12 22400 4346 1389 963
10 5-Mar-12 31226 4301 1971 1165
Average 30230 3385 1229 722
ETP
COD removal efficiency (anaerobic system) 8880
COD removal efficiency (Facultativealgae system) 6369
COD removal efficiency (Bio-polishing system) 4127
Total COD removal efficiency of the treatment system 9761
The COD of the raw effluent during ex-post may vary from the one year historical records depending on
the improvement of the production process (outside of project boundary) thus ERex-post may vary from the
estimated ERex-ante
SMALL-SCALE CDM PROGRAMME ACTIVITY DESIGN DOCUMENT FORM (CDM-SSC-CPA-DD) - Version 01
NAME TITLE OF THE PoA Biogas Recovery and Utilization PoA Projects in
Malaysia
CDM ndash Executive Board page 51
This template shall not be altered It shall be completed without modifyingadding headings or logo format or font
Annex 4
MONITORING INFORMATION
General information
Monitoring refers to the collection and archiving of all relevant data necessary for determining the
baseline measuring anthropogenic emissions by sources of greenhouse gases (GHG) within the project
boundary of a CDM project activity and leakage It includes developing suitable data collection methods
and data interpretation techniques for monitoring and verification of GHG emissions
On-line monitoring system
Most key meters required to determine GHG emissions and emission reductions will be monitored from a
central control point which will record meter readings at a pre-determined interval
Ensuring adequate maintenance and calibration of monitoring instruments
Specific maintenance repair or replacement of monitoring equipment will be recorded dated and
described
The calibration will occur at intervals determined on the basis of instrument manufacturers
recommendations stability purpose usage and history of repeatability Recalibration should be
performed whenever an event occurs that places the accuracy of the instrument in doubt
Calibration will take place at least once every three (3) years to ensure that the monitoring
equipments are properly installed and functioning properly
Calibration will be performed according to national or international standards
Last calibration certificates will be provided during periodic verification
Sampling procedure
Wherever a statistical sample is used for monitoring the ldquogeneral guidelines for sampling and surveys for
SSC project activitiesrdquo shall be used COD shall be measured from a composite sample to obtain a
representative value
Data archiving
The monitored data will be kept for a minimum of 2 years after the end of the crediting years by using
paper documents or electronic files
Identification of non-conformities
A verification of inconsistencies of the data recorded will be performed based for example on
The comparison of the calculated quantities of methane versus expected
Spot checks of field instruments (local reading) and data in the log file
Any discrepancies (completeness calculation errors transcription errors instrument calibration issues)
will be analyzed and actions taken to correct the problem
Ensuring adequate training of staff
All new staff members will undergo bdquoon job training‟ covering the monitoring requirements
The monitoring plan will be made available to staff member involved in the monitoring
A copy will be located in the control room at the site
SMALL-SCALE CDM PROGRAMME ACTIVITY DESIGN DOCUMENT FORM (CDM-SSC-CPA-DD) - Version 01
NAME TITLE OF THE PoA Biogas Recovery and Utilization PoA Projects in
Malaysia
CDM ndash Executive Board page 52
This template shall not be altered It shall be completed without modifyingadding headings or logo format or font
During the training the employees will sign a training attendance list All training records shall
be documented inclusive of training attendance training memo and training material if any

PROJECT DESIGN DOCUMENT FORM (CDM-SSC-PDD) - Version 03
CDM ndash Executive Board
48
Annex 2
INFORMATION REGARDING PUBLIC FUNDING
The project activity is not receiving any funding from parties included in Annex 1 of the Kyoto Protocol
SMALL-SCALE CDM PROGRAMME ACTIVITY DESIGN DOCUMENT FORM (CDM-SSC-CPA-DD) - Version 01
NAME TITLE OF THE PoA Biogas Recovery and Utilization PoA Projects in
Malaysia
CDM ndash Executive Board page 49
This template shall not be altered It shall be completed without modifyingadding headings or logo format or font
Annex 3
BASELINE INFORMATION
1 2
Year 2009 2010 2011 2012 2013 2014
FFB (mtyr) 343720 345910 310250 333293 333293 333293
POME Volume
(cumyr)[1] 343720 345910 310250 333293 333293 333293
Mill Opearing hour (hryr) 68865 69225 6209 6673 6673 6673
PKS (mtyr) 18905 19025 17064 18331 18331 18331
3 4 5 6 7 8 9 10
2015 2016 2017 2018 2019 2020 2021 2022
333293 333293 333293 333293 333293 333293 333293 333293
333293 333293 333293 333293 333293 333293 333293 333293
6673 6673 6673 6673 6673 6673 6673 6673
18331 18331 18331 18331 18331 18331 18331 18331
SMALL-SCALE CDM PROGRAMME ACTIVITY DESIGN DOCUMENT FORM (CDM-SSC-CPA-DD) - Version 01
NAME TITLE OF THE PoA Biogas Recovery and Utilization PoA Projects in
Malaysia
CDM ndash Executive Board page 50
This template shall not be altered It shall be completed without modifyingadding headings or logo format or font
10 days measurement campaign for baseline wastewater treatment system
Day Date
ETP
Inlet
Anaerobic
system (mgl)
Outlet
Anaerobic
system (mgl)
Outlet Algae
System (mgl)
Final
Discharge to
River (mgl)
1 23-Feb-12 35693 3120 811 603
2 25-Feb-12 19511 2559 1186 83
3 26-Feb-12 32864 2767 749 437
4 27-Feb-12 30195 2330 1210 404
5 28-Feb-12 32436 1927 1188 941
6 29-Feb-12 38259 4256 896 717
7 1-Mar-12 28717 3584 1232 695
8 3-Mar-12 31002 4660 1658 1210
9 4-Mar-12 22400 4346 1389 963
10 5-Mar-12 31226 4301 1971 1165
Average 30230 3385 1229 722
ETP
COD removal efficiency (anaerobic system) 8880
COD removal efficiency (Facultativealgae system) 6369
COD removal efficiency (Bio-polishing system) 4127
Total COD removal efficiency of the treatment system 9761
The COD of the raw effluent during ex-post may vary from the one year historical records depending on
the improvement of the production process (outside of project boundary) thus ERex-post may vary from the
estimated ERex-ante
SMALL-SCALE CDM PROGRAMME ACTIVITY DESIGN DOCUMENT FORM (CDM-SSC-CPA-DD) - Version 01
NAME TITLE OF THE PoA Biogas Recovery and Utilization PoA Projects in
Malaysia
CDM ndash Executive Board page 51
This template shall not be altered It shall be completed without modifyingadding headings or logo format or font
Annex 4
MONITORING INFORMATION
General information
Monitoring refers to the collection and archiving of all relevant data necessary for determining the
baseline measuring anthropogenic emissions by sources of greenhouse gases (GHG) within the project
boundary of a CDM project activity and leakage It includes developing suitable data collection methods
and data interpretation techniques for monitoring and verification of GHG emissions
On-line monitoring system
Most key meters required to determine GHG emissions and emission reductions will be monitored from a
central control point which will record meter readings at a pre-determined interval
Ensuring adequate maintenance and calibration of monitoring instruments
Specific maintenance repair or replacement of monitoring equipment will be recorded dated and
described
The calibration will occur at intervals determined on the basis of instrument manufacturers
recommendations stability purpose usage and history of repeatability Recalibration should be
performed whenever an event occurs that places the accuracy of the instrument in doubt
Calibration will take place at least once every three (3) years to ensure that the monitoring
equipments are properly installed and functioning properly
Calibration will be performed according to national or international standards
Last calibration certificates will be provided during periodic verification
Sampling procedure
Wherever a statistical sample is used for monitoring the ldquogeneral guidelines for sampling and surveys for
SSC project activitiesrdquo shall be used COD shall be measured from a composite sample to obtain a
representative value
Data archiving
The monitored data will be kept for a minimum of 2 years after the end of the crediting years by using
paper documents or electronic files
Identification of non-conformities
A verification of inconsistencies of the data recorded will be performed based for example on
The comparison of the calculated quantities of methane versus expected
Spot checks of field instruments (local reading) and data in the log file
Any discrepancies (completeness calculation errors transcription errors instrument calibration issues)
will be analyzed and actions taken to correct the problem
Ensuring adequate training of staff
All new staff members will undergo bdquoon job training‟ covering the monitoring requirements
The monitoring plan will be made available to staff member involved in the monitoring
A copy will be located in the control room at the site
SMALL-SCALE CDM PROGRAMME ACTIVITY DESIGN DOCUMENT FORM (CDM-SSC-CPA-DD) - Version 01
NAME TITLE OF THE PoA Biogas Recovery and Utilization PoA Projects in
Malaysia
CDM ndash Executive Board page 52
This template shall not be altered It shall be completed without modifyingadding headings or logo format or font
During the training the employees will sign a training attendance list All training records shall
be documented inclusive of training attendance training memo and training material if any

SMALL-SCALE CDM PROGRAMME ACTIVITY DESIGN DOCUMENT FORM (CDM-SSC-CPA-DD) - Version 01
NAME TITLE OF THE PoA Biogas Recovery and Utilization PoA Projects in
Malaysia
CDM ndash Executive Board page 52
This template shall not be altered It shall be completed without modifyingadding headings or logo format or font
During the training the employees will sign a training attendance list All training records shall
be documented inclusive of training attendance training memo and training material if any