
CLEAN DEVELOPMENT MECHANISM PROJECT DESIGN …...Rankine Cycle with the addition of the Regenerative...
39
PROJECT DESIGN DOCUMENT FORM (CDM-SSC-PDD) - Version 03 CDM – Executive Board 1 CLEAN DEVELOPMENT MECHANISM PROJECT DESIGN DOCUMENT FORM (CDM-SSC-PDD) Version 03 - in effect as of: 22 December 2006 CONTENTS A. General description of the small scale project activity B. Application of a baseline and monitoring methodology C. Duration of the project activity / crediting period D. Environmental impacts E. Stakeholders’ comments Annexes Annex 1: Contact information on participants in the proposed small scale project activity Annex 2: Information regarding public funding Annex 3: Baseline information Annex 4: Monitoring Information
Transcript of CLEAN DEVELOPMENT MECHANISM PROJECT DESIGN …...Rankine Cycle with the addition of the Regenerative...

PROJECT DESIGN DOCUMENT FORM (CDM-SSC-PDD) - Version 03 CDM – Executive Board
1
CLEAN DEVELOPMENT MECHANISM PROJECT DESIGN DOCUMENT FORM (CDM-SSC-PDD)
Version 03 - in effect as of: 22 December 2006
CONTENTS A. General description of the small scale project activity B. Application of a baseline and monitoring methodology C. Duration of the project activity / crediting period D. Environmental impacts E. Stakeholders’ comments
Annexes Annex 1: Contact information on participants in the proposed small scale project activity Annex 2: Information regarding public funding Annex 3: Baseline information
Annex 4: Monitoring Information

PROJECT DESIGN DOCUMENT FORM (CDM-SSC-PDD) - Version 03 CDM – Executive Board
2
Revision history of this document Version Number
Date Description and reason of revision
01 21 January 2003
Initial adoption
02 8 July 2005 • The Board agreed to revise the CDM SSC PDD to reflect guidance and clarifications provided by the Board since version 01 of this document.
• As a consequence, the guidelines for completing CDM SSC PDD have been revised accordingly to version 2. The latest version can be found at <http://cdm.unfccc.int/Reference/Documents>.
03 22 December 2006
• The Board agreed to revise the CDM project design document for small-scale activities (CDM-SSC-PDD), taking into account CDM-PDD and CDM-NM.

PROJECT DESIGN DOCUMENT FORM (CDM-SSC-PDD) - Version 03 CDM – Executive Board
3
SECTION A. General description of small-scale project activity A.1 Title of the small-scale project activity: >> Biomass Based Power Project of Balaji Agro Oils Ltd. Version – 01 Date – 21/02/2007 A.2. Description of the small-scale project activity: >> Purpose The purpose of the project activity is to utilize the available biomass fuels1 especially rice husk in the region effectively for generation of clean power. The generated clean and green power will be exported to the state grid for sustainable economic growth, conservation of environment through use of biomass fuels and for Green House Gas (GHG) emission reduction. The project will also help to reduce the already existing demand and supply gap of electricity to certain extent in the state of Andhra Pradesh. The following local benefits are also experienced due to the setting up of project:
• Proper utilization of surplus biomass; • Generation of eco-friendly green power; • Avoidance of burning of agriculture waste; • Reduction of CO2 emissions
Balaji Agro Oils Ltd. (BAOL) is utilizing the available fuel (rice husk) from the paddy rich areas in and around Vijayawada of Krishna district. A survey carried out by Non-Renewable Energy Development Corporation of Andhra Pradesh (NEDCAP), before the commencement of the plant construction indicates that the fuels to be used are available in abundance within a radius of 75 km from the plant site. Considering the adequate availability of biomass in the area, BAOL have chosen the location of power plant in Davuluru village, Krishna district of Andhra Pradesh. Contribution to Sustainable Development The project activity is a renewable energy power project for power generation and export of clean power to APTRANSCO. This generation of power will substitute the power generated and fed through conventional fossil fuels dominated grid. Since this project activity utilizes renewable energy source, it will positively
1 Sustainably grown renewable cyclic crops.

PROJECT DESIGN DOCUMENT FORM (CDM-SSC-PDD) - Version 03 CDM – Executive Board
4
contribute towards the reduction in (demand) use of finite natural resource like coal/gas/oil, minimizing depletion or else increasing its availability to other important processes. Government of India has stipulated the following indicators for sustainable development in the interim approval guidelines2 for CDM projects.
1. Social well being 2. Economic well being 3. Environmental well being 4. Technological well being
The location in a rural backward area will help alleviate poverty to certain extent by generating both direct and indirect employment in the area of skilled/unskilled jobs for regular operation and maintenance of the power plant. The productive use of an agro waste will bring in associated economic and social benefits. The project will also help to bridge the gap of electricity demand and supply at local and national level. The increase in demand of biomass exerted by the project will have a local effect on its price and will generate additional revenue for the regional biomass suppliers/ farmers. Generation of electricity using the same as fuel will evidently contribute to the economic well-being by generating revenue and inflow of funds. Local and central government will also be financially benefited from the project. The project activity is a renewable energy power project, which will use waste biomass generated in the local region as a fuel for power generation and export clean power to APTRANSCO grid. This electricity generation will substitute the power generation by APTRANSCO using conventional sources of energy (which also includes high carbon emissive fuel) or make power available for additional demand. Thus it will reduce the CO2 emissions which otherwise would have been emitted due to the generation of power by APTRANSCO grid generation mix. The plant will use efficient and environment friendly technology of renewable energy sector. The technology is new though established. It includes a modern FBC boiler designed to operate with co-firing of two fuels– biomass as major fuel and coal as supplementary fuel, in case of biomass shortage. In view of the above the project participant considers that the project activity profoundly contributes to the sustainable development. A.3. Project participants: >> Name of Party involved (*) ((host) indicates a host Party)
Private and/or public entity(ies) project participants (*) (as applicable)
Kindly indicate if the Party involved wishes to be considered as project participant (Yes/No)
India Balaji Agro Oils Limited (Private entity. Project developer. )
No
2 Ministry of Environment and Forest web site http://envfor.nic.in/cdm/host_approval_criteria.htm#
PROJECT DESIGN DOCUMENT FORM (CDM-SSC-PDD) - Version 03 CDM – Executive Board
5
See contact information in Annex-1 to this PDD A.4. Technical description of the small-scale project activity: The project activity is 4.5 MW capacity grid-connected biomass based renewable energy power plant with high-pressure steam turbine configuration. On an annual average basis, the project exports 3.725 MW power to the APTRANSCO by considering auxiliary power consumption of around 20%. The plant is operating at an annual average plant load factor of 80%. The Andhra Pradesh State Pollution Control Board (APPCB) has issued Consent for Establishment (CFE) to BAOL for using coal to a maximum of 20% in case of shortage of biomass. Further, no transmission and distribution losses are considered while calculating GHG emission reductions, since the project exports power to the Kankipadu Substation, which is located at about 5 km from the site. The power plant has one condensing steam generator unit with a fluidized bed technology capable of firing multi fuels with rice husk as the main fuels. All necessary auxiliary facilities of the power plant are provided. The boiler is sized to produce a maximum of 35 tons per hour of steam. The steam turbine is a extraction type machine with controlled bleeds for de-aerator feed water heating and as process steam to the units. The steam conditions at the boiler heat outlet are a pressure of 66 kg/cm2 and temperature of 4950C. The higher steam parameters result in higher annual savings of fuel per annum when compared to lesser steam operating parameters. All the steam based power plants operate under the Rankine cycle where it is the combination of the various process like the isentropic compression of water in the boiler feed water pumps, reversible heat addition to the working fluid through the liquid, two phase and superheat states, isentropic expansion of the working medium in the turbine and constant pressure heat rejection to the atmosphere through the condenser and the cooling water system. The cycle to be adopted for the project activity will be modified Rankine Cycle with the addition of the Regenerative feed water heating. To improve the efficiency of the cycle the feed water from the condenser is heated with the steam extracted from the turbine. Because of the size of the plant there are limitations in the use of the number of stages for heating the feed water, and for this project only one stage of heating is done in a deaerator. Thermodynamically, energy recovery from the Rankine cycle is more dependent on the steam inlet temperature than the pressure and the higher the inlet steam temperature, higher the cycle efficiency.

PROJECT DESIGN DOCUMENT FORM (CDM-SSC-PDD) - Version 03 CDM – Executive Board
6
A.4.1. Location of the small-scale project activity: >> A.4.1.1. Host Party(ies): >>
India A.4.1.2. Region/State/Province etc.: >>
Andhra Pradesh A.4.1.3. City/Town/Community etc: >>
Krishna District A.4.1.4. Details of physical location, including information allowing the unique identification of this small-scale project activity : >> The plant is located at Davuluru village, Krishna district of Andhra Pradesh. The site for the plant has been acquired and can be identified at the intersection of 16o31’ East and 80o31’North. The site is well connected by roads and railway line and the nearest railway station is at Vijayawada and airport is at Vijayawada. The plant’s water requirements will be met by drawl from borewells, with in the plant. Power generated from the plant at 11 kV is being evacuated to APTRANSCO grid through their 33 kV Kankipadu sub station which is about 5 km from the plant.

PROJECT DESIGN DOCUMENT FORM (CDM-SSC-PDD) - Version 03 CDM – Executive Board
7
A.4.2. Type and category(ies) and technology/measure of the small-scale project activity: >> As per Clause 2 & 3 of Type I.D of Appendix B of simplified modalities and procedures for small-scale CDM project activities (Version 10: 23 December 2006), If the unit added has both renewable and non-renewable components (e.g.. a wind/diesel unit), the eligibility limit of 15MW for a small-scale CDM project activity applies only to the renewable component. If the unit added co-fires fossil fuel, the capacity of the entire unit shall not exceed the limit of 15MW, and Biomass combined heat and power (co-generation) systems that supply electricity to and/or displace electricity from a grid are included in this category. To qualify under this category, the sum of all forms of energy output shall not exceed 45 MWthermal e.g. for a biomass based co-generating system the rating for all the boilers combined shall not exceed 45 MWthermal. for the project to qualify as a small-scale CDM project. Therefore, the project activity can be defined under Type I: Renewable Energy Project (Small Scale) Category: “D”, Grid connected Renewable Electricity Generation (Renewable Biomass based Power Project) Technology of the project The technology adopted for the project activity is a standard and widely accepted practice for power generation using renewable sources. No technology transfer is required though know how for the project technology was not well established during project implementation stage in the state. Steam is generated in a high pressure boiler which is sized to produce a maximum of 35 tons per hour of steam. High pressure steam is passed through a straight condensing type machine with uncontrolled bleeds for de-aerator feed water heating to generate power to export to grid.
A.4.3 Estimated amount of emission reductions over the chosen crediting period: >>
Years (January to December) Annual estimation of emission reductions in tonnes of CO2e 2007 - 2008 16963
2008 - 2009 16963
2009 - 2010 16963
2010 - 2011 16963
2011 – 2012 16963
2012 – 2013 16963
2013 – 2014 16963
2014 – 2015 16963
2015 – 2016 16963
2016 - 2017 16963
Total estimated reductions (tones of CO2e) 169,630

PROJECT DESIGN DOCUMENT FORM (CDM-SSC-PDD) - Version 03 CDM – Executive Board
8
Years (January to December) Annual estimation of emission reductions in tonnes of CO2e 2007 - 2008 16963
Total number of crediting years 10 Annual average over the crediting period of estimated reductions (tonnes of CO2 e)
16963
A.4.4. Public funding of the small-scale project activity: >> No Public funding . Project is implemented with equity of project proponent and long term debt by State Bank of India, Canara Bank and Andhra Bank. A.4.5. Confirmation that the small-scale project activity is not a debundled component of a large scale project activity: According to Appendix C of Simplified Modalities & Procedures for small scale CDM project activities, ‘Debundling’ is defined as the fragmentation of a large project activity into smaller parts. A small-scale project activity that is part of a large project activity is not eligible to use the simplified modalities and procedures for small-scale CDM project activities. A small-scale project activity shall be deemed to be a debundled component of a large project activity if there is a registered small-scale CDM project activity or an application to register another small-scale CDM project activity:
• With the same project participants; • In the same project category and technology/measure; • Registered within the previous 2 years; and • Whose project boundary is within 1 km of the project boundary of the small- scale activity at the
closest point.

PROJECT DESIGN DOCUMENT FORM (CDM-SSC-PDD) - Version 03 CDM – Executive Board
9
SECTION B. Application of a baseline and monitoring methodology B.1. Title and reference of the approved baseline and monitoring methodology applied to the small-scale project activity: >> Title: Grid connected Renewable electricity generation Reference: The project activity meets the eligibility criteria to use the simplified modalities and procedure for small-scale CDM project activities as set out in paragraph 6 (c) of decision 17/CP.7. Details of methodology for baseline calculations for CDM projects of capacity less than 15 MW are available in the “Appendix B of the simplified modalities and procedure for small scale CDM project activities”. Reference has been taken from indicative simplified baseline and monitoring methodologies for selected small scale (CDM projects less than 15 MW) project activity categories. Renewable technologies that supply electricity to the grid are covered in category I.D. The category comprises renewable such as small hydro, wind, geothermal and renewable biomass that supply electricity to and/or displace electricity from an electricity distribution system that is or would have been supplied by at least one fossil fuel fired generation unit. B.2 Justification of the choice of the project category: >> Type I: Renewable Energy Power project Category: ‘D’- Grid connected Renewable Electricity Generation As per the Kyoto Protocol (KP) baseline should be in accordance with the additionality criteria of article 12, paragraph 5(c), which states that the project activity must reduce emissions that are additional to any that, would occur in the absence of the certified project activity. Document Annex B to attachment 3 regarding indicative simplified baseline and monitoring methodologies for selected small scale CDM project activity categories, provides guidelines for preparation of Project Design Document (PDD) including baseline calculations. The category and the sub type of the activity are given above. Baseline methodology mentioned in the paragraph no. 9 of Type I. D. of Appendix B of the simplified modalities and procedures for small scale CDM project activities, states that the baseline is the kWh produced by the renewable generating unit multiplied by an emission coefficient (measured in kg CO2equ/kWh) calculated in transparent and conservative manner as under:

PROJECT DESIGN DOCUMENT FORM (CDM-SSC-PDD) - Version 03 CDM – Executive Board
10
a) A combined margin (CM), consisting of the combination of operating margin (OM) and built margin (BM) according to the procedures prescribed in the approved methodology ACM002. Any of the four procedures for calculating the operating margin can be chosen, but the restrictions to use the Simple OM and the Average OM must be considered;
OR b) The weighted average emissions (in kgCO2equ/kWh) of current generation mix. The data of
the year in which project generation occurs must be used.
Calculations must be based on data from an official source (where available) and made publicly available. Based on the above guidelines provided in Version 10 of AMS I.D, the baseline emission factor is estimated using the combined margin approach as per the procedures laid in paragraph 9 of AMS I.D of Version 10. As this methodology suggested adopting the procedures laid in ACM0002, the same has been considered for calculations. A complete analysis of Southern Regional grid has been carried out with the study of various related issues like technology scenario, policy matters, economic conditions, development of renewable energy projects etc. for preparation of baseline scenario and calculation of baseline emission factor of the grid. The project activity would displace an equivalent amount of electricity that would have been drawn from the grid generation mix. Since the displaced electricity generation is the element that is likely to affect both the operating margin in the short run and the build margin in the long run, electricity baselines should reflect a combination of these effects. Therefore the most appropriate approach for baseline methodology would be as descried in Paragraph no. 9 under category I.D of Appendix B of the simplified M&P for small scale CDM project activities of the UNFCCC. In this project case, the project is small scale only having generating capacity of 4.5 MW. Hence, this is an operating margin scenario where we can assume that the principal effect will be on the operation of current or future power plants. However in view of the predicted power deficit status in the state in future, a delay effect in future power plants may creep in due to the occurrence of this project although to a limited extent. Ideal baseline approach is envisaged as the one that combines both operating and build margin as prescribed in first alternative given in paragraph 9 under Category I.D of the UNFCCC M&P for small scale projects. However, the key information and data used to determine the baseline scenario (variables, parameters, data sources, etc.) are listed in the following table.

PROJECT DESIGN DOCUMENT FORM (CDM-SSC-PDD) - Version 03 CDM – Executive Board
11
Key Parameter Value Data Source Pwlc Power generation by all sources, excluding
hydro, biomass and nuclear All related authentic sources like APTRANSCO, TNEB, KPTCL, KEB, CEA etc
Pfuel Share of power generation by each fuel used Calculated for power plants in Southern Regional Grid
CMF Base line ”Combined Margin” emission factor calculated for grid electricity generation
Calculated for power plants in Southern Regional Grid
OMbef CO2 operating margin emission factor for grid Calculated for power plants in Southern Regional Grid
BMyr CO2 build margin emission factor for grid Calculated for power plants in Southern Regional Grid
TPgen Total power generated by the project activity Measured from the plant records
TPexp Power exported to the grid per annum From plant and APTRANSCO records
WAbef Weighted average emission factor of baseline calculated
Calculated for power plants in Southern Regional Grid
Text Identification of power source / plant for the OM
Text Identification of power source / plant for the BM
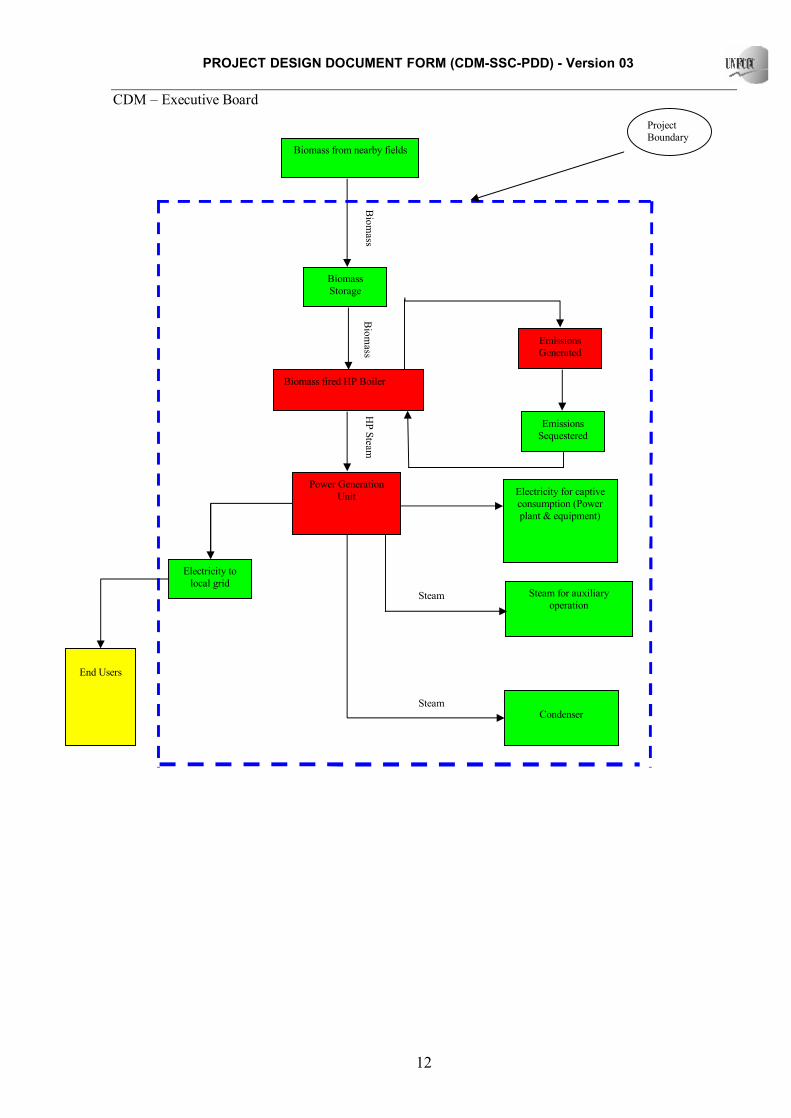
B.3. Description of the project boundary: >> As per the guidelines mentioned in Type I. D. of Annex B of the simplified modalities and procedures for small-scale CDM project activities, project boundary encompasses the physical and geographical site of the renewable generation source. Hence, the project boundary covers the physical boundary of the project activity. The system boundary covers the terminal point of electricity generation, transportation to APTRANSCO grid and for the purpose of calculation of baseline emissions, Southern Regional grid is also included in the project boundary. As the plant uses only biomass residues or wastes (Paddy husk), the area where the biomass is extracted or produced is not included in the boundary. Thus, boundary covers fuel storage and processing, boiler, Steam Turbine Generator (STG) and all other power generating equipments, auxiliary consumption units and electricity grid.
PROJECT DESIGN DOCUMENT FORM (CDM-SSC-PDD) - Version 03 CDM – Executive Board
12
Biomass from nearby fields
Biomass Storage
Biom
ass
Biomass fired HP Boiler
Biom
ass
Power Generation Unit
HP Steam
Electricity to local grid
Electricity for captive consumption (Power plant & equipment)
Steam for auxiliary operation
Condenser
End Users
Emissions Generated
Emissions Sequestered
Steam
Steam
Project Boundary

PROJECT DESIGN DOCUMENT FORM (CDM-SSC-PDD) - Version 03 CDM – Executive Board
13
B.4. Description of baseline and its development: >> The baseline methodology has followed the one specified under Project category I.D in Appendix B of the Simplified M&P for small scale CDM project activities. As per the latest guidelines in I.D to estimate the baseline emissions, the emission factor is calculated as per the procedures laid in paragraph 9 (a) & (b). As this methodology suggested to adopt the procedures laid in ACM0002, the same has been considered for calculations. The baseline emissions and the emission reductions from project activity are estimated based on the quantum of electricity to be exported by the project activity to the grid and the Baseline Emission Factor (BEF) of the southern regional grid calculated as a combined margin (CM), consisting of the combination of operating margin (OM) and built margin (BM) factors. The project proponent wishes to use the BEF calculated Ex-ante, and has fixed the same for the entire crediting period. The detailed calculation procedures are provided in Annex 3 in line with the procedures explained above and with necessary inputs from ACM0002. B.5. Description of how the anthropogenic emissions of GHG by sources are reduced below those that would have occurred in the absence of the registered small-scale CDM project activity: The project activity meets the eligibility criteria to use simplified modalities and procedure for small-scale CDM project activities as set out in paragraph 6 (c) of decision 17/CP.7. As per the decision 17/cp.7 Para 43, a CDM project activity is additional if anthropogenic emissions of greenhouse gases by sources are reduced below those that would have occurred in the absence of the registered CDM project activity. Further referring to Appendix A to Annex B document of indicative simplified baseline and monitoring methodologies for selected small scale CDM project activity categories, project participants shall provide a qualitative explanation to show that the project activity would not have occurred anyway, at least one of the listed elements should be identified in concrete terms to show that the activity is either beyond the regulatory and policy requirement or improves compliance to the requirement by removing barrier(s) ; 1. Other Barriers (Financial Resources)
The CDM fund for the project was initially considered to cover the project risk related to the fuel (biomass) price increase in the future. The CDM fund is critical considering biomass availability and prices are seasonal, which depends on many external factors whereas the earnings for the power plant are at long term fixed rate. Therefore, the revenue from CDM could prove to be vital, as they would significantly improve the sustainability of the project, as the project can be rendered financially

PROJECT DESIGN DOCUMENT FORM (CDM-SSC-PDD) - Version 03 CDM – Executive Board
14
unstable due to
a. The increase in cost of fuel ; and b. The change in tariff by virtue of revised tariff by the off taker
The above factors are true for the project activity and in absence of CDM funds it is very likely that project activity would have used (or may use) more financially viable option such as coal as fuel. In addition to the above, the financial analysis of the project activity has been done with and with out CDM revenue. The IRR of the company with out CDM revenues is 13.49% and with CDM revenue is 16.67%. Raw material cost per metric tonne since the time of operation of the plant has increased substantially as shown below. The increase has been due to the continuous increase in the fuel collection, handling, storage and transportation cost.
Fuel 2003-04 2004-05 2005-06 2006-07 (Present)
Rice Husk 1289 1133 1250 1500 Groundnut Shells 850 1008 1036 1170 Coconut Waste - 581 500 645 Cotton Waste - - - 500
The cost of generation per unit since the operation of the plant has been increasing and the details of the cost of production since the commercial operation of the plant have been provided below. As can be seen from the table, the total cost of generation is on an average of Rs. 3.60/kWh. The revenue on the export of power to the grid is Rs. 3.16/kWh which is a loss of approximately Rs. 0.40/kWh generation.
2003-04 2004-05 2005-06 2006 (sep) Raw Material 60675486 62659832 45420879 30799222 Salaries 1215455 1134764 1564001 833391 O&M 5314864 6238052 8718409 3174060 Interest 15244673 14113984 10447177 4727315 Depreciation 14647349 17740928 17863147 9045281 Total 97097827 101887560 84013613 48579269 Capital Cost of Project 185000000 185000000 185000000 185000000 Total Generation 30181200 32750700 29656200 16138400 Cost of Generation

PROJECT DESIGN DOCUMENT FORM (CDM-SSC-PDD) - Version 03 CDM – Executive Board
15
Raw Material 2.0 1.9 1.5 1.9 Salaries 0.0 0.0 0.1 0.1
O&M 0.2 0.2 0.3 0.2 Interest 0.5 0.4 0.4 0.3
Depreciation 0.5 0.5 0.6 0.6
Variable Cost3 3.20 3.10 2.80 3.00 Fixed Cost4 0.61 0.56 0.62 1.15 Total Cost of Generation 3.81 3.66 3.42 4.15
CDM Benefits for 10 years
CERs Rate (Euros) Exchange rate Million INR Million Units
replaced Cost benefit per
unit (Rs.)
BAOL 169630 8 56 75.99 250 0.32 The CDM benefit per unit (kWh) of power replaced is about Rs. 0.32. This CDM benefit per unit of power would definitely help the plant to operate in sustainable manner. It is envisaged that the raw material cost would further increase, which would lead to further increase in the cost of generation. Thus the project justifies the need of CDM funds for the project activity, which will help in significantly improving the project competitiveness and financial sustainability due to reduction in tariffs and increase in raw material cost.
3. Other Barriers (Policy Related) BAOL has a power purchase agreement with APTRANSCO (the state power company) to purchase 100% of the power that can be exported. BAOL will be paid the tariff for the energy delivered at the interconnection point for sale to APTRANSCO at Rs. 2.25 paise per unit with escalation at 5% per annum with 1994-95 as the base year and to be revised on 1st April of every year up to the year 2003-04. However, in a landmark decision APERC reduced the power tariffs from Rs. 3.48/- to Rs. 2.88/- per unit. As per the new proposal the tariff rates will be of two parts – fixed and variable. The fixed cost is based on the year of commissioning and it will come down gradually over a period of 10 years, whereas variable cost will go up by 5% every year up to a control period of 5 years.
3 Variable Cost includes O & M cost and Fuel Cost 4 Fixed Cost includes Captial Cost

PROJECT DESIGN DOCUMENT FORM (CDM-SSC-PDD) - Version 03 CDM – Executive Board
16
The year wise (for credit period) effect of tariff changes with respect to fixed and variable price & cost5 Fixed cost tariff: Variable cost Year of operation fixed cost Financial year Variable cost (Rs./unit) (Rs./unit) 1st 1.61 2004-05 1.27 2nd 1.57 2005-06 1.33 3rd 1.53 2006-07 1.40 4th 1.49 2007-08 1.47 5th 1.45 2008-09 1.54 6th 1.41 7th 1.37 8th 1.33 9th 1.26 10th 0.87 As per the new policy initiative, plants operating with 80% PLF will be paid a fixed rate as per the PPA and the additional units generated at the additional PLF will be paid at a variable cost of Rs 1.20 and an increment of 21.50 paise (Rs. 0.215) per unit. Thus it is imperative that present incentive is not sufficient and the sustainability of the project will be at risk. To generate renewable power in excess of 80% PLF, the CDM funds can contribute towards viability of generation of the balance 20%, which will indirectly help in reduction of CO2 emission, if not generated. Also, the PPA will be under revision every 5 years instead of 10 years as per the new proposal from APERC. The existing APTRANSCO generation mix6 comprises of (as on 31st July 2005):
ü 50% thermal power plants; ü 12% Gas power plants; ü 32% hydro projects; and ü 6% Nuclear, renewable and other projects
This illustrates that biomass plants are still considered as rather financially risky proposition and with changing scenario, the CDM revenue will contribute to their financial stability. This discussion suggests that there are clear policy related threats and barrier to the project activity, which can be mitigated to certain7 extent from CDM benefit.
5 APERC tariff order, R.P. No.84 / 2003 in OP No 1075 / 2000 dated 20.03.2004 6 http://aptranscorp.com/pact01.html 7 Uncertainty related to carbon market and cash flows is also a deterrent.

PROJECT DESIGN DOCUMENT FORM (CDM-SSC-PDD) - Version 03 CDM – Executive Board
17
B.6. Emission reductions:
B.6.1. Explanation of methodological choices: >> Monitoring methodologies / guidelines mentioned in the UNFCCC document of “Annex B of the simplified modalities and procedures for small scale CDM project activities” for small scale projects (Type I: D) is considered as basis for monitoring methodology for the activity. The document states that the monitoring shall consist of metering the electricity generated by the renewable technology. The project activity meets the eligibility criteria to use simplified modalities and procedure for small-scale CDM project activities as set out in paragraph 6 (c) of decision 17/CP.7. Details of approved methodology for baseline calculations for CDM projects of capacity less than 15 MW are available in the “Appendix B of the simplified modalities and procedure for small scale CDM project activities”. As the power plant is of 4.5 MW capacity, reference has been taken from indicative simplified baseline and monitoring methodologies for selected small scale (CDM projects less than 15 MW) project activity categories. Southern Regional grid is considered for baseline analysis and calculation of anthropogenic emissions by fossil fuels during power generation. It is observed that, in the southern regional grid generation mix, coal, diesel and gas based power projects are responsible for GHG emissions. The data published by Central Electricity Authority (CEA) has been used as the baseline emission factor. The baseline emission factor for southern grid as published by CEA is 0.8608.
Leakage As per the latest general guidance on leakage in biomass projects, for small scale energy CDM project activities involving renewable biomass, there are three types of emission sources that are potentially significant (>10% of emission reductions) and attributable to the project activities. These emission sources may be project emissions (if under the control of project participants, i.e. if the land area where the biomass is grown is included in the project boundary) or sources of leakage (if the source is not under control of project participants). The following table summarises for different types of biomass, the cases where the emission source is relevant and the cases where it is not.
8 Source: CEA, www.cea.nic.in

PROJECT DESIGN DOCUMENT FORM (CDM-SSC-PDD) - Version 03 CDM – Executive Board
18
Biomass Type Activity/Source Shift of pre-project activities
Emissions from biomass generation / cultivation
Competing use of biomass
Existing forests - - X Biomass from forests New forests X X -
In the absence of the project the land would be used as cropland/wetland
X X - Biomass from croplands or grasslands (woody or non woody)
In the absence of the project the land would be abandoned
- X -
Biomass residues or wastes
Biomass residues or wastes are collected and used
- - X
For the project activity, the following are considered to calculate the possible emissions due to leakage:
1. As the project activity uses only biomass residues and wastes, the implementation of activity did not lead to shift of pre project activities.
2. Also, the biomass that is being used in the plant is waste that is generated from various crops. This waste will anyhow be generated even in the absence of the project activity and would have burnt without using for any other purpose. The plant uses the waste generated and does not need application of fertilizer and clearance of lands. Hence, there are no emissions due to the same.
3. There is sufficient biomass available in the region and the same is revealed in Biomass assessment reports by Administrative Staff College of India (ASCI), Hyderabad. The availability of biomass material (Rice Husk, cotton, chilies, maize, etc) in the Krishna district where plant is located is around 27.35 lakh tones per annum. The total surplus biomass available after usage is estimated at 3.72 lakh tones per annum9 which are 25% more than the present requirement including the project activity. The quantity of biomass that is available in the region is more than the quantity of biomass that is utilized including the project activity and hence the leakage can be neglected.
From the above analysis, it can be concluded that the project activity does not have any sources of leakage due to type of biomass utilised.
9 Source: ‘Socio Economic Impact Assessment of Biomass Power plants in India’ – ASCI, Hyderabad

PROJECT DESIGN DOCUMENT FORM (CDM-SSC-PDD) - Version 03 CDM – Executive Board
19
B.6.2. Data and parameters that are available at validation: (Copy this table for each data and parameter) Data / Parameter BEF Data Unit: tCO2/GWh Description: Baseline Emission Factor for Southern Grid Source of data used: CEA Value Applied: 0.860 Justification of the choice of data or description of measurement methods and procedures actually applied.
Combined Margin data for southern grid
Any Comments Details of the calculation provided in Annex - 3
Data / Parameter EF Data Unit: tCO2e/TJ Description: CO2 emission factor for each type of fuel Source of data used: IPCC Default Value Value Applied: Coal: 96.1 tC/TJ (Source: IPCC)
Diesel: 20.2 (Source: IPCC) Justification of the choice of data or description of measurement methods and procedures actually applied.
IPCC value has been used as no country specific value is available.
Any Comments
Data / Parameter OFDiesel Data Unit: Not Applicable (Constant) Description: Oxidation Factor of each fuel type, i Source of data used: IPCC default values Value Applied: Coal: 0.98
Diesel: 0.99 Justification of the choice of data or description of measurement methods and procedures actually applied.
IPCC value has been used as no country specific value is available.
Any Comments

PROJECT DESIGN DOCUMENT FORM (CDM-SSC-PDD) - Version 03 CDM – Executive Board
20
B.6.3 Ex-ante calculation of emission reductions: >>
Baseline Emissions (Emission Reductions due to displacement of electricity or ERelectricity,y) The basic assumptions for calculating baseline emissions of the project activity are due to the displacement of grid electricity. Hence, the following formula is applied for estimation of baseline emissions. ERelectricity,y = EFelectricity,y * EGy The anticipated electricity export from the project activity during the year y, multiplied with emission factor as published by CEA (Combined Margin) for southern region grid 860 tCO2/GWh. Project Emissions The project proponent uses biomass as fuel. APPCB has issued Consent for Establishment to the project proponent allowing the use of coal upto a maximum of 20% as an alternate fuel during exigencies. Based on the coal consumption details of the plant, the average consumption over the last 4 years has been 15%. The same has been considered for calculation of the project emission. However, during the verification stage the CERs will be based on the actuals. HSD is used for the stand by DG sets only in case of emergency and complete blackout. The project emissions due to use of coal will be calculated using the following formulae: To have an estimate of the project CO2 emission quantity due to combustion of coal along with the biomass, total carbon content of the coal should be known. Combustion reaction for CO2 emission is as under.
C + O2 = CO2 Assuming complete combustion of coal, following formula can be used for conservative estimation of CO2 emissions.
PEtCO2 = (EF * G)*1000
where, PE - Project Emission due to coal burning at project, tCO2 EF - Emission Factor for Coal, kgCO2/kWh G – Generation of Electricity using coal, % The project emission due to consumption of HSD will be calculated as follows:
PE HSD = HSDCONS * Density Diesel * CV Diesel * EFtCO2 Diesel * OF Diesel

PROJECT DESIGN DOCUMENT FORM (CDM-SSC-PDD) - Version 03 CDM – Executive Board
21
Where PE HSD = Project Emission due to use of HSD HSDCONS = HSD Consumption in Liters Density Diesel = Density of HSD CV Diesel = Calorific Value of HSD EFtCO2 Diesel = IPCC Emission Factor for HSD OF Diesel = Oxidation Factor for HSD Leakage No leakage emissions would occur due to implementation of project activity as the quantity of available biomass residues in the region is 25% larger than the quantity of biomass residues that are utilized, including the project activity. The leakage activity identified, which contributes for GHG emissions outside the project boundary is transportation of biomass from biomass collection centers to biomass power project site. Calculation of leakage has been carried-out as under:
Biomass to be transported by trucks 49000 MT/year Capacity of each truck 10 MT Number of return trips 13 per day Distance of procurement (average) 75 Km Distance covered 1006.85 Km Mileage (Average) 3 Km/litre Total diesel consumption 335.62 litres/day No of days of operation 365 days/year Diesel consumption/year 122500 Litres Diesel consumption/year 109025 kg Density of diesel 0.89 kg/l Calorific value of diesel 10072 Kcal/Kg CO2 emissions from diesel considering IPCC's oxidation factor of diesel as 0.99 tCO2/TJ 74.1 TCO2/ TJ Annual GHG emissions 340 tonnes/ year
Since the leakage emission is less than 1% of the total emission reduction, the same has been neglected. In addition to above, project emissions also occur due to transportation of the fly ash for disposal. Plant generates around 10000 tons of fly ash per annum. Number of trips to dispose fly ash to destination is around 3 per day. However, the distance of transport of fly ash from the plant to brick manufacturers in the area is well below 25 km and number of truck trips per annum are less than 600, hence the emissions due to the same have also been neglected.

PROJECT DESIGN DOCUMENT FORM (CDM-SSC-PDD) - Version 03 CDM – Executive Board
22
B.6.4 Summary of the ex-ante estimation of emission reductions: >>
Operating
Years Project
Emissions (tonnes of CO2)
Baseline Emissions
(tonnes of CO2)
Estimation of leakage (tonnes of CO2)
Estimation of overall Emission Reductions
(tonnes of CO2) 2007-2008 4615 21578 0 16963
2008-2009 4615 21578 0 16963
2009-2010 4615 21578 0 16963
2010-2011 4615 21578 0 16963
2011-2012 4615 21578 0 16963
2012-2013 4615 21578 0 16963
2013-2014 4615 21578 0 16963
2014-2015 4615 21578 0 16963
2015-2016 4615 21578 0 16963
2016-2017 4615 21578 0 16963
Total (tonnes of CO2e)
46150 215780 0 169,630
Therefore, a conventional energy equivalent of 250 Million kWh for a period of 10 years in AP would be saved by exporting power from the 4.5 MW Biomass based power plant which in turn will reduce 169,630 tons of CO2 emissions considering baseline calculations. B.7 Application of a monitoring methodology and description of the monitoring plan:
B.7.1 Data and parameters monitored: Parameter EGen Unit: kWh Description: Electricity Generated Source of Data: Tri-vector Energy Meter Value of Data: 28.5 million kWh per annum Brief description of measurement methods and procedures to be applied:
The parameter is measured using a tri-vector energy meter available in the switch yard at BAOL.
QA/QC procedures to be applied (if any):
The data will be directly measured and monitored at the project site. All relevant records will be checked to ensure consistency. The meters will
PROJECT DESIGN DOCUMENT FORM (CDM-SSC-PDD) - Version 03 CDM – Executive Board
23
be calibrated as per the standards Any Comments
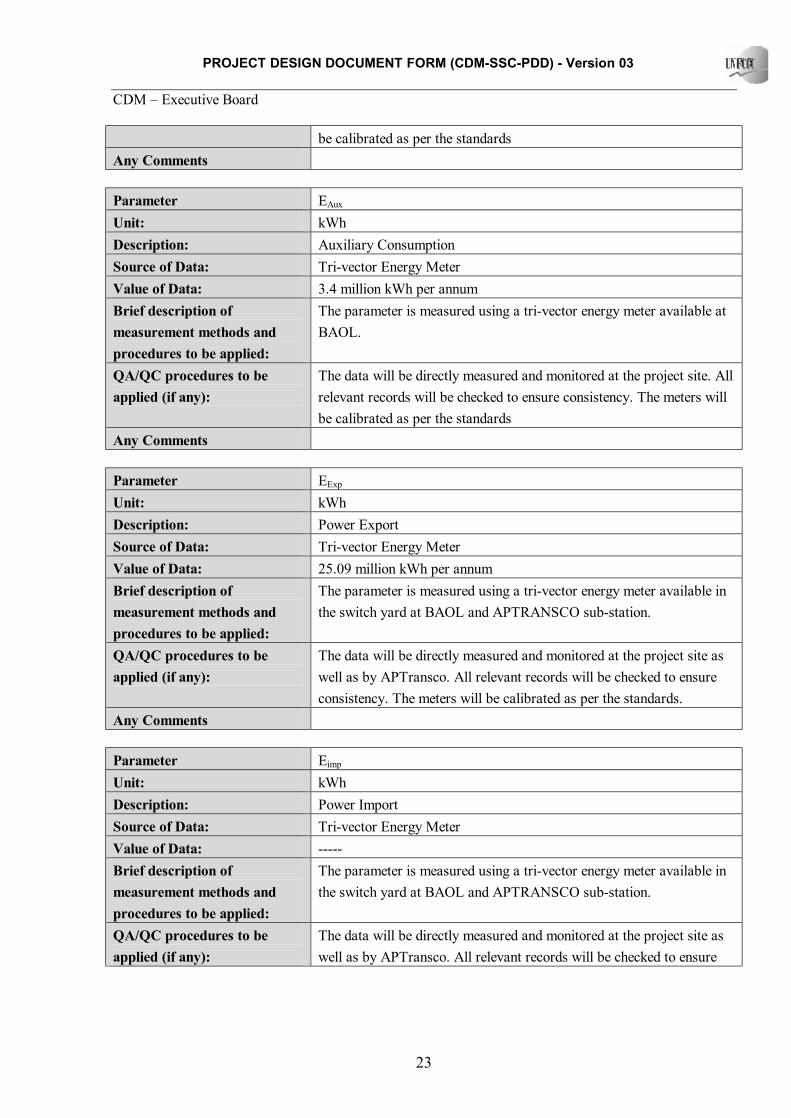
Parameter EAux Unit: kWh Description: Auxiliary Consumption Source of Data: Tri-vector Energy Meter Value of Data: 3.4 million kWh per annum Brief description of measurement methods and procedures to be applied:
The parameter is measured using a tri-vector energy meter available at BAOL.
QA/QC procedures to be applied (if any):
The data will be directly measured and monitored at the project site. All relevant records will be checked to ensure consistency. The meters will be calibrated as per the standards
Any Comments
Parameter EExp Unit: kWh Description: Power Export Source of Data: Tri-vector Energy Meter Value of Data: 25.09 million kWh per annum Brief description of measurement methods and procedures to be applied:
The parameter is measured using a tri-vector energy meter available in the switch yard at BAOL and APTRANSCO sub-station.
QA/QC procedures to be applied (if any):
The data will be directly measured and monitored at the project site as well as by APTransco. All relevant records will be checked to ensure consistency. The meters will be calibrated as per the standards.
Any Comments
Parameter Eimp Unit: kWh Description: Power Import Source of Data: Tri-vector Energy Meter Value of Data: ----- Brief description of measurement methods and procedures to be applied:
The parameter is measured using a tri-vector energy meter available in the switch yard at BAOL and APTRANSCO sub-station.
QA/QC procedures to be applied (if any):
The data will be directly measured and monitored at the project site as well as by APTransco. All relevant records will be checked to ensure

PROJECT DESIGN DOCUMENT FORM (CDM-SSC-PDD) - Version 03 CDM – Executive Board
24
consistency. The meters will be calibrated as per the standards. Any Comments
Parameter Qbio Unit: MT Description: Fuel Used (Biomass) Source of Data: Weigh Bride reading Value of Data: - Brief description of measurement methods and procedures to be applied:
The parameter is measured using a weigh bridge located at the project site. The truck carrying the fuel will be weighed twice upon entry and exit.
QA/QC procedures to be applied (if any):
The data will be directly measured and monitored at the project site. All relevant records will be checked to ensure consistency. The weigh bridge will be calibrated as per the standards.
Any Comments The data on quantity of fuel will be separate for all types of fuels
Parameter NCVbio Unit: Kcal Description: NCV (Biomass) Source of Data: Analysis reports Value of Data: - Brief description of measurement methods and procedures to be applied:
Through sample testing in lab which will be done weekly.
QA/QC procedures to be applied (if any):
The data will be based on the laboratory analysis. The instruments used for the analysis will be checked for their calibration.
Any Comments Based on the sample tests conducted.
Parameter Q Fossil, i Unit: MT Description: Fuel Used (Coal) Source of Data: Weigh Bride reading Value of Data: - Brief description of measurement methods and procedures to be applied:
The parameter is measured using a weigh bridge located at the project site. The truck carrying the fuel will be weighed twice upon entry and exit.
QA/QC procedures to be applied (if any):
The data will be directly measured and monitored at the project site. All relevant records will be checked to ensure consistency. The weigh bridge will be calibrated as per the standards.

PROJECT DESIGN DOCUMENT FORM (CDM-SSC-PDD) - Version 03 CDM – Executive Board
25
Any Comments The data on quantity of fuel will be separate for all types of fuels
Parameter NCV Fossil Unit: Kcal Description: Net Calorific Value of fossil fuel Source of Data: Coal: Lab Analysis
HSD: Test report by Indian Oil Corporation Limited Value of Data: Coal: 3900
Diesel: 10200 Brief description of measurement methods and procedures to be applied:
The lab analysis of the coal samples will be done weekly. IOCL value has been taken as the standard for diesel.
QA/QC procedures to be applied (if any):
The data will be directly measured and monitored at the project site. All relevant records will be checked to ensure consistency. The weigh bridge will be calibrated as per the standards.
Any Comments The data on quantity of fuel will be separate for all types of fuels B.7.2 Description of the monitoring plan:
>> Project proponent implemented the following operational and management structure in order to monitor emission reductions and any leakage effects, generated by the project activity Project proponent formed a CDM team/committee comprising of persons from relevant departments, which will be responsible for monitoring of all the parameters mentioned in this section. In the CDM team, a special group of operators will be formed who will be assigned responsibility of monitoring of different parameters and record keeping. On daily basis, the monitoring reports will be checked and discussed. On monthly basis, these reports will be forwarded at the management level. CDM Team S. No. Name Designation
1 Mr. V. Suraj Kumar Jt. Managing Director 2 Mr. Ch. R C. Murthy Director (Finance) 3 Mr. M. Banu Prasad Director (Technical) 4 Mr. Ch. Sai Prasad Manager (Purchase)

PROJECT DESIGN DOCUMENT FORM (CDM-SSC-PDD) - Version 03 CDM – Executive Board
26
B.8 Date of completion of the application of the baseline and monitoring methodology and the name of the responsible person(s)/entity(ies) >> Date of completing the final draft of this baseline section: DD/MM/YYYY 01/02/2007 Name of person/entity determining the baseline: Balaji Agro Oils Limited, who is also a project participant (as mentioned in Annex-I) SECTION C. Duration of the project activity / crediting period C.1 Duration of the project activity: C.1.1. Starting date of the project activity: >> Start date of the project is 19/12/2001 and is operational since 2nd June 2003. C.1.2. Expected operational lifetime of the project activity: >> Life time of the project: 20 years C.2 Choice of the crediting period and related information: C.2.1. Renewable crediting period C.2.1.1. Starting date of the first crediting period: >> Not applicable C.2.1.2. Length of the first crediting period: >> Not applicable C.2.2. Fixed crediting period: C.2.2.1. Starting date: >> 15/06/2007. The project participant will not commence the crediting period prior to the date of registration. C.2.2.2. Length: >> 10 years (10-y)

PROJECT DESIGN DOCUMENT FORM (CDM-SSC-PDD) - Version 03 CDM – Executive Board
27
SECTION D. Environmental impacts >> D.1. If required by the host Party, documentation on the analysis of the environmental impacts of the project activity: >> The project being a renewable energy biomass based power project it does not fall under the purview of the Environmental Impact Assessment (EIA) notification of the Ministry of Environment and Forest, Government of India. As per the government of India notification dated June 13, 2002 based on environment protection rule, 1986, public hearing and EIA is required for those industries/projects which are listed in the predefined list of ministry of environment and forest. Thermal power projects with investment of less than Rs. 100 crore have been excluded from the list. Hence, it is not required by the host party. However, detailed environmental management plan is in place in the project activity location. Brief description on the measures taken towards the environment protection in the plant is given below:
1. Stack height of 50 m is provided for effective dispersion of pollutants. 2. The effluent generated in the plant will be treated in the Effluent Treatment Plant (ETP). The
effluent characteristics after the treatment are in complying with the standards stipulated by Andhra Pradesh State Pollution Control Board.
3. The treated effluent is utilized for green belt development within the plant premises. 4. Electrostatic precipitator is provided to bring down the SPM emissions from boiler to 150 mg/Nm3. 5. Acidic and alkaline effluent streams coming from cation and anion units of DM plant are
neutralized in a neutralization tank. 6. The service water is passed through oil & grease trap to remove the oil content present in the
effluent. 7. The boiler blow down due to its higher pH is neutralized before mixing with other effluent streams. 8. The sanitary waste water is treated in septic tank followed by soak pit. 9. Reflected noise is reduced by the use of absorbent material on roofs, walls and floors. 10. Plantation of small and tall trees is done around the plant area for better environment. 11. The ash collected from the ESP is utilized for brick manufacturing/provided free to the farmers for
use as manure in the agricultural fields. D.2. If environmental impacts are considered significant by the project participants or the host Party, please provide conclusions and all references to support documentation of an environmental impact assessment undertaken in accordance with the procedures as required by the host Party: >> Not Applicable

PROJECT DESIGN DOCUMENT FORM (CDM-SSC-PDD) - Version 03 CDM – Executive Board
28
SECTION E. Stakeholders’ comments >> E.1. Brief description how comments by local stakeholders have been invited and compiled: >> The local stakeholder comment invitation and compilation process involved is as follows: The local stakeholders are those who face the immediate effect due to the project activities which involves effect on the local environment, social life and economics. They can be within the boundaries of the village, district, state or nation. On deciding above criteria for qualification of the stakeholders, the idea was to decide most appropriate representatives who are covering above. During interaction of the corporate headquarter and the plant management, the stakeholders were identified as:
• Office bearers of the neighbouring villages local bodies • Biomass suppliers • Customer (APTRANSCO) • Licensing and regulatory authorities like
o NEDCAP o APPCB
BAOL has been constantly in touch with other identified stakeholders like licensing and regulatory authorities. Their views are reflected in the form of permissions granted for the project. In this aspect, the permission by APPCB is indication of favorable impression for the project. BAOL had conducted the stakeholder consultation process on 23rd November 2006 at the plant site. Among the people present were the personnel APTRANSCO, APPCB, local villages, village administrator, temporary employees at the plant site, and biomass supplier. BAOL had invited the stakeholders to provide their general feedback on the project activity and specifically asked the villagers and their representative to give them information on how the project has helped them improve their livelihood. The biomass supplier/s was asked to provide them information on how they procure the biomass for the plant and also about the difficulties faced during the procurement. They were also asked whether there has been any improvement on the business opportunities in the area. Stakeholders Involvement The village Panchayat /local elected body of representatives are true representative of the local population in India. Hence, their consent / permission to set up the project are necessary. BAOL has already

PROJECT DESIGN DOCUMENT FORM (CDM-SSC-PDD) - Version 03 CDM – Executive Board
29
completed the necessary consultation and documented their approval for the project. Local population comprises of the people from the village/town in and around the project area. The role of the local population is as a beneficiary of the project. The local population will be involved in the supply of the biomass and hence the project would be a beneficial for the local population. In addition to this, the project activity would also lead to increased employment opportunities by employing local villagers working in the plant. Since, the project will provide good direct and indirect employment opportunities the local populace is encouraging the project. The project does not require rehabilitation/resettlement of any local population. In addition, the local population is also an indirect consumer of the power that is supplied from the power plants.
The distance between the electrical substation for power evacuation and the plant is less than 1km and installation of transmission lines will not create any inconvenience to the local population. APPCB has prescribed standards of environmental compliance and monitors the adherence to the standards. The project has already received Consent for Establishment (CFE) from APPCB to start the plant. Ministry of Non-Conventional Energy Sources (MNES) implements policies in respect of non-conventional renewable power projects in India and has accorded approval to the project. As a buyer of the power, the APTRANSCO is a major stakeholder in the project. They hold the key to the commercial success of the project. APTRANSCO has already cleared the project and BAOL has already signed Power Purchase Agreement (PPA) with APTRANSCO. The government of India, through Ministry of Non-conventional Energy Sources (MNES), has been promoting energy conservation, demand side management and viable renewable energy projects including wind, small hydro and bagasse cogeneration / bio-mass power. The project meets their requirements. E.2. Summary of the comments received: >> As mentioned above, BAOL has already received the approvals and clearances for their project from the following stakeholders:
• Consent order of Establishment from APPCB; • Power Purchase Agreement with APTRANSCO; • Clearance from the Gram Panchayat, Davuluru village
Although, for this project, public participation at any stage of project implementation is not required, being a CDM activity, project proponent has invited the local stakeholders including Sarpanch (head) of village,

PROJECT DESIGN DOCUMENT FORM (CDM-SSC-PDD) - Version 03 CDM – Executive Board
30
representative of local population and biomass suppliers to express their views on the project by sending letters to the concerned offices/persons and arranging a meeting at the project site. The summary of the feedback received is presented as below.
The Panchayat Office representative (Member of locally elected body) expressed his happiness about the implementation of project in his village since the project activity uses agricultural waste, it is giving the farmers additional revenue.
Representative biomass supplier also expressed their support to the project activity by BAOL in this area, which has provided them an opportunity of small business. Earlier the biomass supplier had to keep their truck idle as they did not have much business, with the implementation of the project, the suppliers not only run the existing trucks continuously, they have also bought new trucks to support their expanding business. In summary, every stakeholder expressed that the project activity is helping the socio-economic development of the village and nearby area without affecting the local environment adversely. E.3. Report on how due account was taken of any comments received: >> Not applicable. All positive comments received.

PROJECT DESIGN DOCUMENT FORM (CDM-SSC-PDD) - Version 03 CDM – Executive Board
31
Annex 1
CONTACT INFORMATION ON PARTICIPANTS IN THE PROJECT ACTIVITY Organization: Balaji Agro Oils Limited Street/P.O.Box: D. No. 74-2-19, Building: Krishna Nagar City: Vijayawada State/Region: Andhra Pradesh Postfix/ZIP: 520 007 Country: India Telephone: +91-866-2822673 FAX: +91-866-2823537 E-Mail: [email protected] URL: Represented by: Title: Director (Technical) Salutation: Mr. Last Name: Medabalimi Middle Name: - First Name: Banu Prasad Department: - Mobile: +91-9866077674 Direct FAX: +91-866-2823174 Direct tel: +91-866-2822673 Personal E-Mail: [email protected]

PROJECT DESIGN DOCUMENT FORM (CDM-SSC-PDD) - Version 03 CDM – Executive Board
32
Annex 2
INFORMATION REGARDING PUBLIC FUNDING No Public Funding is available to the project.

PROJECT DESIGN DOCUMENT FORM (CDM-SSC-PDD) - Version 03 CDM – Executive Board
33
Annex 3
BASELINE INFORMATION
Generation Data, Emission Data published by Central Electricity Authority, Government of India. Gross Generation Total (GWh)
2000-01 2001-02 2002-03 2003-04 2004-05 North 144,292 151,185 155,385 165,735 168,438 East 58,936 64,048 66,257 75,374 85,776 South 128,983 131,902 136,916 138,299 144,086 West 162,329 165,805 177,399 172,682 183,955 North-East 5,314 5,292 5,811 5,880 7,904 India 499,854 518,231 541,766 557,970 590,158
Net Generation Total (GWh)
2000-01 2001-02 2002-03 2003-04 2004-05 North 135,230 141,415 144,741 155,043 157,290 East 53,350 58,097 59,841 68,428 77,968 South 121,144 123,612 127,780 128,165 134,691 West 150,412 153,125 164,448 159,780 170,726 North-East 5,185 5,169 5,669 5,758 7,776 India 465,321 481,417 502,480 517,174 548,451
20% of Net Generation (GWh)
2000-01 2001-02 2002-03 2003-04 2004-05 North 27,046 28,283 28,948 31,009 31,458 East 10,670 11,619 11,968 13,686 15,594 South 24,229 24,722 25,556 25,633 26,938 West 30,082 30,625 32,890 31,956 34,145 North-East 1,037 1,034 1,134 1,152 1,555 India 93,064 96,283 100,496 103,435 109,690
Share of Must-Run (Hydro/Nuclear) (% of Net Generation)
2000-01 2001-02 2002-03 2003-04 2004-05 North 25.9% 25.7% 26.1% 28.1% 26.8% East 10.8% 13.4% 7.5% 10.3% 10.5% South 28.1% 25.5% 18.3% 16.2% 21.6% West 8.2% 8.5% 8.2% 9.1% 8.8% North-East 42.3% 42.1% 45.8% 41.8% 55.4% India 19.2% 18.9% 16.3% 17.1% 18.0%

PROJECT DESIGN DOCUMENT FORM (CDM-SSC-PDD) - Version 03 CDM – Executive Board
34
Net Generation in Operating Margin (GWh)
2000-01 2001-02 2002-03 2003-04 2004-05 North 100,189 105,076 106,940 111,449 115,151 East 47,570 50,308 55,377 61,378 69,746 South 87,100 92,085 104,441 107,396 105,584 West 138,071 140,173 150,889 145,264 155,731 North-East 2,992 2,995 3,071 3,350 3,469 India 375,923 390,638 420,718 428,838 449,681
Net Generation in Build Margin (GWh)
2000-01 2001-02 2002-03 2003-04 2004-05 North 32,067 East 15,818 South 27,195 West 34,587 North-East 2,052 India 111,718
Emission Data
Absolute Emissions Total (tCO2) 2000-01 2001-02 2002-03 2003-04 2004-05 North 97,863,848 102,743,113 106,777,065 109,980,786 112,199,697 East 58,025,890 61,436,757 66,595,529 75,515,998 83,956,860 South 88,728,956 92,484,478 104,180,940 108,406,007 105,960,087 West 135,147,507 141,597,621 148,313,340 144,127,175 157,781,065 North-East 2,009,681 1,976,535 2,090,087 2,088,985 2,294,430 India 381,775,882 400,238,503 427,956,961 440,118,951 462,192,140 Absolute Emissions OM (tCO2) 2000-01 2001-02 2002-03 2003-04 2004-05 North 97,863,848 102,743,113 106,777,065 109,980,786 112,199,697 East 58,025,890 61,436,757 66,595,529 75,515,998 83,956,860 South 88,728,956 92,484,478 104,180,940 108,406,007 105,960,087 West 135,147,507 141,597,621 148,313,340 144,127,175 157,781,065 North-East 2,009,681 1,976,535 2,090,087 2,088,985 2,294,430 India 381,775,882 400,238,503 427,956,961 440,118,951 462,192,140 Absolute Emissions BM (tCO2) 2000-01 2001-02 2002-03 2003-04 2004-05 North 17,108,583 East 14,303,611 South 19,525,581 West 26,881,491 North-East 206,514

PROJECT DESIGN DOCUMENT FORM (CDM-SSC-PDD) - Version 03 CDM – Executive Board
35
India 78,025,780 Emission Factor (The highlighted value has been used for the preparation of PDD)
Simple Operating Margin (tCO2/MWh) (incl. Imports) 2000-01 2001-02 2002-03 2003-04 2004-05 North 0.98 0.98 1.00 0.99 0.97 East 1.22 1.22 1.20 1.23 1.20 South 1.02 1.00 1.00 1.01 1.00 West 0.98 1.01 0.98 0.99 1.01 North-East 0.67 0.66 0.68 0.62 0.66 India 1.02 1.02 1.02 1.03 1.03 Build Margin (tCO2/MWh) (not adjusted for imports) 2000-01 2001-02 2002-03 2003-04 2004-05 North 0.53 East 0.90 South 0.72 West 0.78 North-East 0.10 India 0.70 Combined Margin in tCO2/MWh (incl. Imports) 2000-01 2001-02 2002-03 2003-04 2004-05 North 0.76 0.76 0.77 0.76 0.75 East 1.06 1.06 1.05 1.07 1.05 South 0.87 0.86 0.86 0.86 0.86 West 0.88 0.89 0.88 0.88 0.90 North-East 0.39 0.38 0.39 0.36 0.38 India 0.86 0.86 0.86 0.86 0.86

PROJECT DESIGN DOCUMENT FORM (CDM-SSC-PDD) - Version 03 CDM – Executive Board
36
Annex 4
MONITORING INFORMATION All the parameters mentioned in the monitoring plan have been monitoring in the plant but in other formats. The entire process of monitoring has been streamlined and will be made available in the required format during the verification process and for subsequent useful purposes. The Fuel Consumption data, etc are being maintained in different formats. The data formats for CDM have already been finalized and started monitoring accordingly to ensure and demonstrate existence of MVP in the plant. The calibration of monitoring equipment is being maintained as per the requirement of APTRANSCO and the same is being done regularly. Power Generation, Export & Auxiliary Consumption, fuel consumption are being recorded daily and the same is being verified and approved by Plant Manager. These records are being sent to Head Office for review by the Director and for corrective actions if necessary. Further, Internal Auditors also verify the monitoring data. As per the advices of the Internal Audit team, corrective actions will be taken up for more accurate future monitoring and reporting system. The Plant is equipped with energy meters/export meters for monitoring and control purpose. The energy meters shall be tested and calibrated utilizing a standard meter. The standard meter shall be calibrated once in a year at the approved laboratory of Govt. of India or Govt. of Andhra Pradesh as per terms and conditions of supply. The tests of meters shall be jointly conducted by authorised representatives of both the parties and the results and correction so arrived at mutually will be applicable and binding on both the parties. The energy meters shall not be interfered with, tested or checked except in the presence of representatives of company and APTRANSCO. If any of the meters is found to be registered inaccurately, the affected meter will be immediately replaced. The meters will be checked in presence of both the parties on mutually agreed periods. If during the test checks both the meters are found beyond permissible limits of error, both the meters shall be immediately replaced and the correction applied to the consumption registered by the main meter to arrive at the correct energy exported for billing purposes for the period of one month up to the time of test check, computation of exported energy for the period thereafter till next monthly reading shall be as per the replaced meter. Corrections in exported energy shall be applicable to the period between the two previous monthly reading and the sate and time of test calibration in the current month when error is observed. Power generation, export and auxiliary consumption are being recorded at the plant from the installed meters. However, for applying monthly bill to APTRANSCO the meter readings will be taken on 24th of every month by APTRANSCO officials in presence of company representatives and readings will be jointly certified.

PROJECT DESIGN DOCUMENT FORM (CDM-SSC-PDD) - Version 03 CDM – Executive Board
37
The following log sheets are being maintained for the critical equipment of the plant and readings are being recorded on day to day basis:
1. Turbine log 2. Boiler log 3. Electrical log If both the both and check meters fail to record or if any of the PT fuses are blown out, the export energy will be computed on a mutually agreeable basis for the point of defect. Power generation, export and auxiliary consumption, fuel consumption are being recorded at the plant daily and the same is being verified by Manager of the plant. These records sent to head office for review by the director and for corrective actions if necessary. Emission levels are being monitored as per the statutory requirement. Plant emission levels are being monitored and the results are being sent to APPCB. For this purpose, the service of external agency is being utilized.
- - - - -

PROJECT DESIGN DOCUMENT FORM (CDM-SSC-PDD) - Version 03 CDM – Executive Board
38
Appendix – A
CALCULATION OF BASELINE EMISSION FACTORS AND EMISSION REDUCTIONS DUE TO 4.5 MW BIOMASS BASED POWER PROJECT - BALAJI AGRO OILS LIMITED (BAOL)
Year of offer 2007-2008
2008-2009
2009-2010
2010-2011
2011-2012
2012-2013
2013-2014
2014-2015
2015-2016
2016-2017
On-Site Project Emission Reductions Generation capacity , KW 4500 4500 4500 4500 4500 4500 4500 4500 4500 4500 Plant load factor, % 80 80 80 80 80 80 80 80 80 80 No. of hours of plant operation per annum 7920 7920 7920 7920 7920 7920 7920 7920 7920 7920 No. of units generated in a year, millions 28.5 28.5 28.5 28.5 28.5 28.5 28.5 28.5 28.5 28.5 Auxiliary consumption per annum 3.4 3.4 3.4 3.4 3.4 3.4 3.4 3.4 3.4 3.4 No. of units exported to grid, millions 25.09 25.09 25.09 25.09 25.09 25.09 25.09 25.09 25.09 25.09 T&D losses considered on exportable power 0 0 0 0 0 0 0 0 0 0
No. of units replaced in the grid, millions units 250.91 25.09 25.09 25.09 25.09 25.09 25.09 25.09 25.09 25.09 25.09 Baseline emission factor considered, kgCO2/kWh 0.860 0.860 0.860 0.860 0.860 0.860 0.860 0.860 0.860 0.860 Baseline emissions, tones 21577.88 21577.88 21577.88 21577.88 21577.88 21577.88 21577.88 21577.88 21577.88 21577.88 Generation by coal as supplementary fuel (15%) 4.277 4.277 4.277 4.277 4.277 4.277 4.277 4.277 4.277 4.277 Emission factor considered for coal, kgCO2/kWh 1.079 1.079 1.079 1.079 1.079 1.079 1.079 1.079 1.079 1.079 Project emissions, tones 4614.67 4614.67 4614.67 4614.67 4614.67 4614.67 4614.67 4614.67 4614.67 4614.67 Net greenhouse gas emissions, tones 16963.21 16963.21 16963.21 16963.21 16963.21 16963.21 16963.21 16963.21 16963.21 16963.21 Actual green power to grid, millions units 250.91 Carbon emission reductions in a year 16963 16963 16963 16963 16963 16963 16963 16963 16963 16963 Commitment period No. of years of delivery of CERs 10 years Total number of CERs 169630 47.50

PROJECT DESIGN DOCUMENT FORM (CDM-SSC-PDD) - Version 03 CDM – Executive Board
39
Year 2007 2008 2009 2010 2011 2012 2013 2014 2015 2016 total Baseline emissions 21578 21578 21578 21578 21578 21578 21578 21578 21578 21578 215779 Project emissions 4615 4615 4615 4615 4615 4615 4615 4615 4615 4615 46147 Emission reductions 16963 16963 16963 16963 16963 16963 16963 16963 16963 16963 169630


