CLEAN DEVELOPMENT MECHANISM Catarina Wind... · CLEAN DEVELOPMENT MECHANISM PROJECT DESIGN DOCUMENT...
24
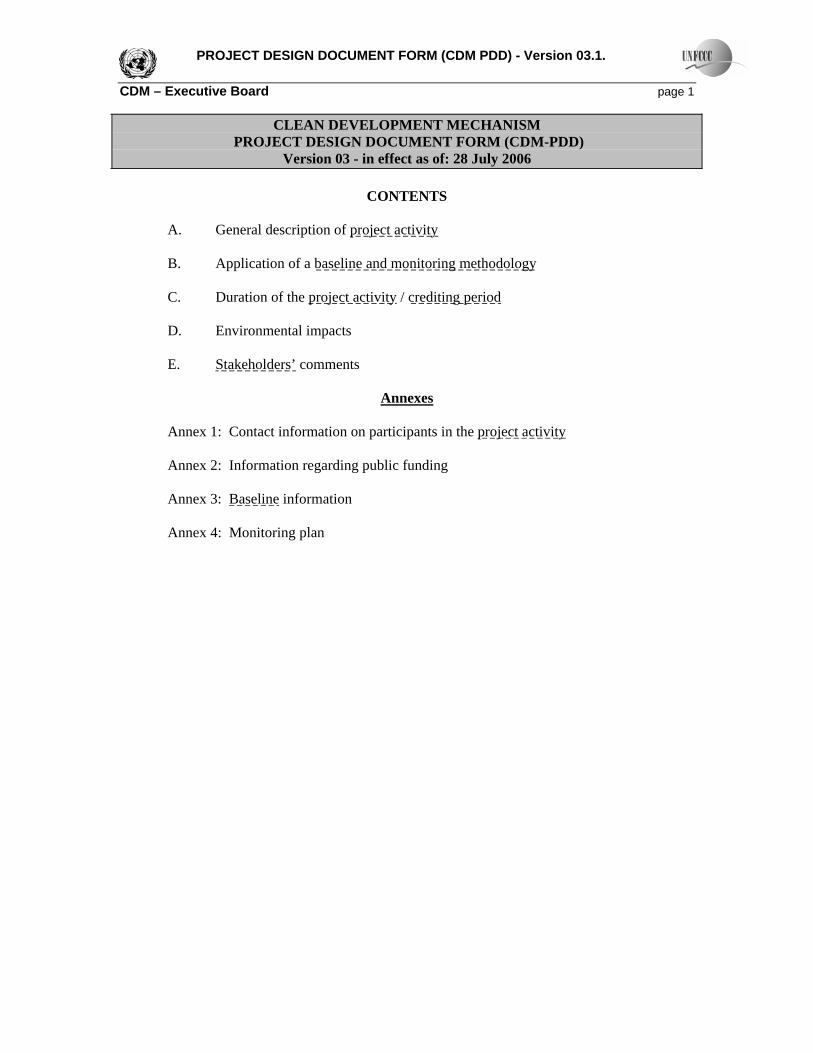
PROJECT DESIGN DOCUMENT FORM (CDM PDD) - Version 03.1. CDM – Executive Board page 1 CLEAN DEVELOPMENT MECHANISM PROJECT DESIGN DOCUMENT FORM (CDM-PDD) Version 03 - in effect as of: 28 July 2006 CONTENTS A. General description of project activity B. Application of a baseline and monitoring methodology C. Duration of the project activity / crediting period D. Environmental impacts E. Stakeholders’ comments Annexes Annex 1: Contact information on participants in the project activity Annex 2: Information regarding public funding Annex 3: Baseline information Annex 4: Monitoring plan
Transcript of CLEAN DEVELOPMENT MECHANISM Catarina Wind... · CLEAN DEVELOPMENT MECHANISM PROJECT DESIGN DOCUMENT...
PROJECT DESIGN DOCUMENT FORM (CDM PDD) - Version 03.1. CDM – Executive Board page 1
CLEAN DEVELOPMENT MECHANISM PROJECT DESIGN DOCUMENT FORM (CDM-PDD)
Version 03 - in effect as of: 28 July 2006
CONTENTS A. General description of project activity B. Application of a baseline and monitoring methodology C. Duration of the project activity / crediting period D. Environmental impacts E. Stakeholders’ comments
Annexes Annex 1: Contact information on participants in the project activity Annex 2: Information regarding public funding Annex 3: Baseline information
Annex 4: Monitoring plan
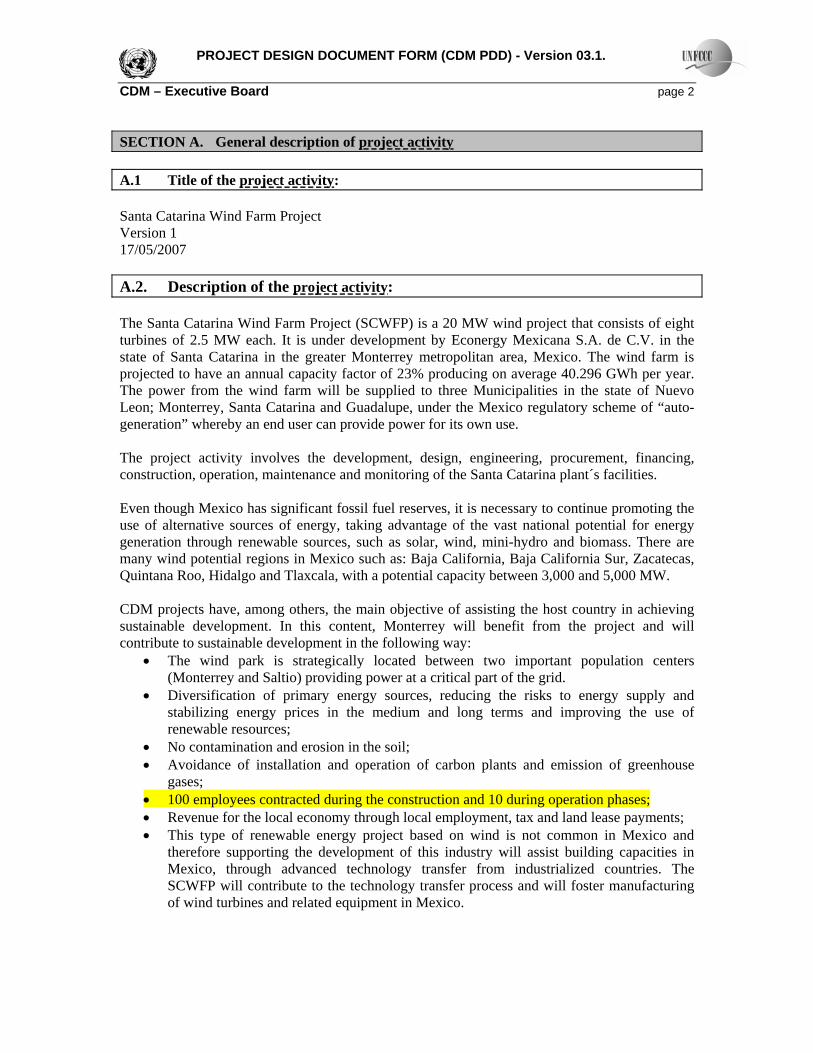
PROJECT DESIGN DOCUMENT FORM (CDM PDD) - Version 03.1. CDM – Executive Board page 2 SECTION A. General description of project activity A.1 Title of the project activity: Santa Catarina Wind Farm Project Version 1 17/05/2007 A.2. Description of the project activity: The Santa Catarina Wind Farm Project (SCWFP) is a 20 MW wind project that consists of eight turbines of 2.5 MW each. It is under development by Econergy Mexicana S.A. de C.V. in the state of Santa Catarina in the greater Monterrey metropolitan area, Mexico. The wind farm is projected to have an annual capacity factor of 23% producing on average 40.296 GWh per year. The power from the wind farm will be supplied to three Municipalities in the state of Nuevo Leon; Monterrey, Santa Catarina and Guadalupe, under the Mexico regulatory scheme of “auto-generation” whereby an end user can provide power for its own use. The project activity involves the development, design, engineering, procurement, financing, construction, operation, maintenance and monitoring of the Santa Catarina plant´s facilities. Even though Mexico has significant fossil fuel reserves, it is necessary to continue promoting the use of alternative sources of energy, taking advantage of the vast national potential for energy generation through renewable sources, such as solar, wind, mini-hydro and biomass. There are many wind potential regions in Mexico such as: Baja California, Baja California Sur, Zacatecas, Quintana Roo, Hidalgo and Tlaxcala, with a potential capacity between 3,000 and 5,000 MW. CDM projects have, among others, the main objective of assisting the host country in achieving sustainable development. In this content, Monterrey will benefit from the project and will contribute to sustainable development in the following way:
• The wind park is strategically located between two important population centers (Monterrey and Saltio) providing power at a critical part of the grid.
• Diversification of primary energy sources, reducing the risks to energy supply and stabilizing energy prices in the medium and long terms and improving the use of renewable resources;
• No contamination and erosion in the soil; • Avoidance of installation and operation of carbon plants and emission of greenhouse
gases; • 100 employees contracted during the construction and 10 during operation phases; • Revenue for the local economy through local employment, tax and land lease payments; • This type of renewable energy project based on wind is not common in Mexico and
therefore supporting the development of this industry will assist building capacities in Mexico, through advanced technology transfer from industrialized countries. The SCWFP will contribute to the technology transfer process and will foster manufacturing of wind turbines and related equipment in Mexico.
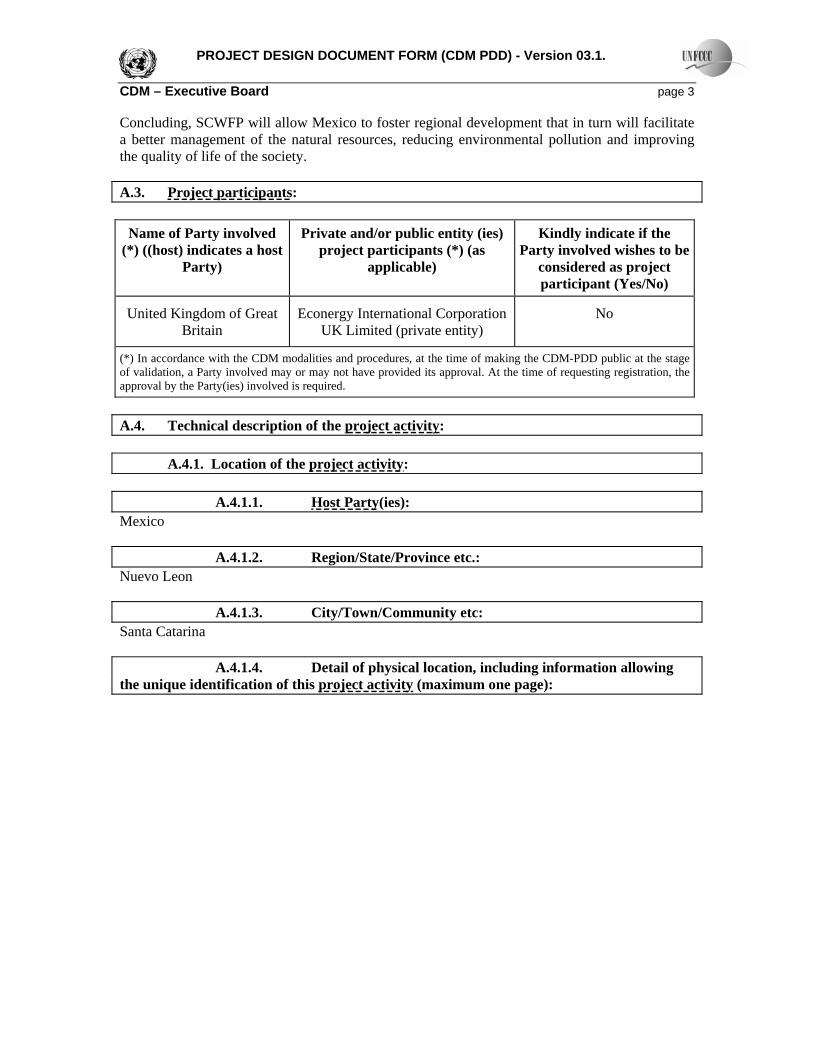
PROJECT DESIGN DOCUMENT FORM (CDM PDD) - Version 03.1. CDM – Executive Board page 3 Concluding, SCWFP will allow Mexico to foster regional development that in turn will facilitate a better management of the natural resources, reducing environmental pollution and improving the quality of life of the society. A.3. Project participants:
Name of Party involved (*) ((host) indicates a host
Party)
Private and/or public entity (ies) project participants (*) (as
applicable)
Kindly indicate if the Party involved wishes to be
considered as project participant (Yes/No)
United Kingdom of Great Britain
Econergy International Corporation UK Limited (private entity)
No
(*) In accordance with the CDM modalities and procedures, at the time of making the CDM-PDD public at the stage of validation, a Party involved may or may not have provided its approval. At the time of requesting registration, the approval by the Party(ies) involved is required. A.4. Technical description of the project activity: A.4.1. Location of the project activity: A.4.1.1. Host Party(ies): Mexico A.4.1.2. Region/State/Province etc.: Nuevo Leon A.4.1.3. City/Town/Community etc: Santa Catarina A.4.1.4. Detail of physical location, including information allowing the unique identification of this project activity (maximum one page):

PROJECT DESIGN DOCUMENT FORM (CDM PDD) - Version 03.1. CDM – Executive Board page 4 Figure 1: Geographic Map of Mexico with indication of Monterrey metropolitan region.
A.4.2. Category(ies) of project activity: Sectoral Scope 1: Energy Industries (renewable/non renewable sources). A.4.3. Technology to be employed by the project activity: Wind-driven power plants converts wind energy to electric power by wind turbine. It is based on making useful a dynamic flow of changing continuance and horizontal displacement. The amount of energy obtained is three times proportional to wind speed, which shows how important this factor is. Wind generators take advantage of wind speed going between 5 and 20 meters per second. With speeds lower to 5 meters per second, the wind generator will not operate, and with speeds over the higher limit it must stop in order to avoid equipment injury. The 8 wind turbines to be installed for the SCWFP project are manufactured by DeWind (Germany company), with a nominal power output of 2.5 MW, achieving a total installed capacity of 20 MW. The turbines make use steel towers of 80 meter height and 90 meter rotors. The project is expected to generate approximately 40.296 GWh per year. Also, approximately 11 km of 115 kV transmission lines will be installed between the substation and aero-generators.

PROJECT DESIGN DOCUMENT FORM (CDM PDD) - Version 03.1. CDM – Executive Board page 5 DeWind has proven in the past that it can design, manufacture, and operate wind turbines with good success. The most recent D8 model which is a 2MW has been successfully operating for 4 years with 41 machines in operation. This model has experienced zero gearbox failures which is fairly unique in the industry. The wind site where the project is operating has Class IV winds which are much lower than the design conditions of the turbine which will provide a forgiving operating environment, further favoring the conservative German engineering and design of the DeWind Turbine. The project will be signing an O&M agreement with DeWind for their 2-year warranty period which can be extended for up to 5 years at our option. DeWind related companies operate hundreds of MWs of wind turbines in Germany. The O&M agreement contains typical and appropriate guarantees from the operator. This includes a 97% availability guarantee and a 98% power curve performance guarantee. DeWind will be operating the turbines and providing maintenance and will have contractual responsibility for the equipment performance. The local employees will attend DeWind training seminars in Texas, in order to eventually take over the operation and maintenance of the equipments. DeWind will transfer the following skills to Loreto Bay Project: • Wind energy measurement and prediction, and electric energy output estimate; • Wind turbine assessment according to site conditions; • Wind farm construction and operation, environmental evaluation and monitoring of wind
farms. Wind Feasibility studies were performed by Jack Kline and 3Tier Environmental Forecast. Jack Kline and 3Tier are leaders in their field and have provided conservative estimates of the long-term wind resource and the performance of the DeWind turbines. The wind resource at the site is very consistent year to year and the estimates are based on the average wind resource. There is significant conservatism built into the DeWind performance curves (which is why they will guarantee 98%) and based on their previous turbine model, the D8, it is expected a 5% increase in performance which will help offset risk associated with the wind resource. TIC-The Industrial Company of Steamboat Springs, Colorado is fully capable of performing all construction aspects of a major wind farm, from foundations to turbine and tower erection, as well as the complete balance-of-plant installations and electrical collection systems. TIC has successfully installed more than 1,000 wind turbines units throughout the United States in various sizes. This will be the first wind project performed by the Mexico Division of TIC, MexTICa S.A. de C.V. They will be supervised by the experienced US staff. SACMAG de Mexico, S.A. de C.V. as a subcontractor will perform the final civil, electrical and mechanical engineering.
A.4.4 Estimated amount of emission reductions over the chosen crediting period: For the first crediting period the total estimation of emission reductions is:
Years Annual estimation of emission reductions in tonnes of CO2e
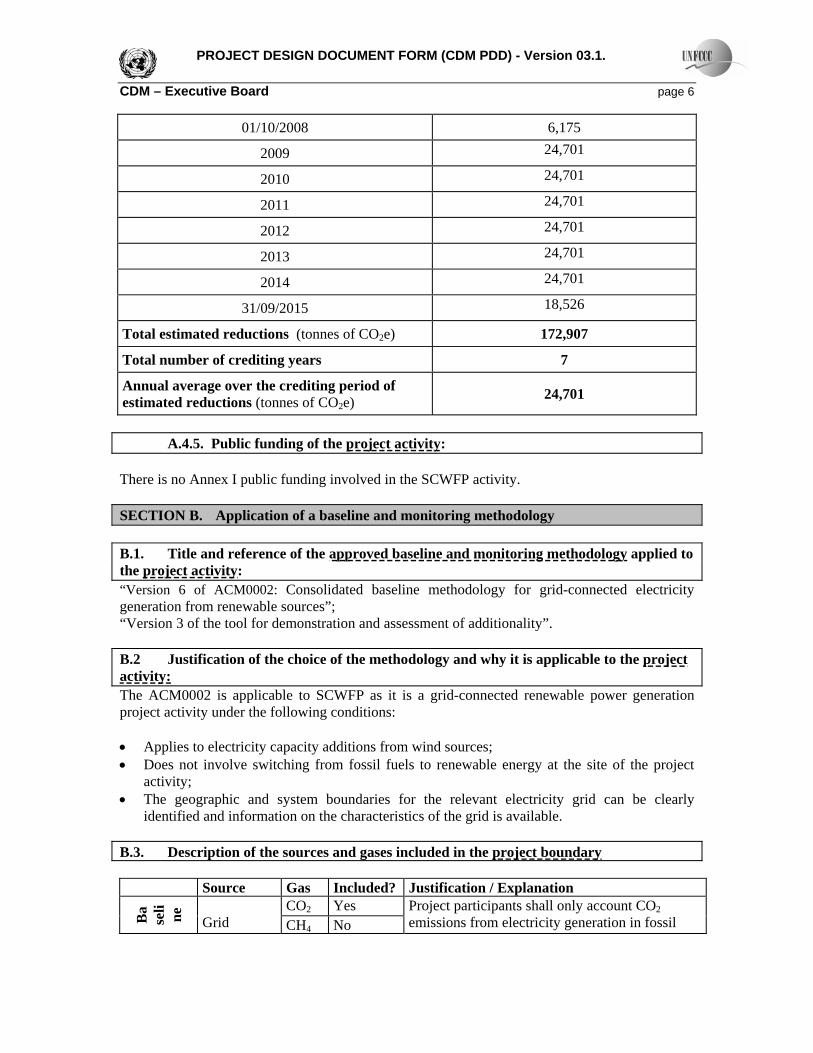
PROJECT DESIGN DOCUMENT FORM (CDM PDD) - Version 03.1. CDM – Executive Board page 6
01/10/2008 6,175
2009 24,701
2010 24,701
2011 24,701
2012 24,701
2013 24,701
2014 24,701
31/09/2015 18,526
Total estimated reductions (tonnes of CO2e) 172,907
Total number of crediting years 7
Annual average over the crediting period of estimated reductions (tonnes of CO2e) 24,701
A.4.5. Public funding of the project activity: There is no Annex I public funding involved in the SCWFP activity. SECTION B. Application of a baseline and monitoring methodology B.1. Title and reference of the approved baseline and monitoring methodology applied to the project activity: “Version 6 of ACM0002: Consolidated baseline methodology for grid-connected electricity generation from renewable sources”; “Version 3 of the tool for demonstration and assessment of additionality”. B.2 Justification of the choice of the methodology and why it is applicable to the project activity: The ACM0002 is applicable to SCWFP as it is a grid-connected renewable power generation project activity under the following conditions: • Applies to electricity capacity additions from wind sources; • Does not involve switching from fossil fuels to renewable energy at the site of the project
activity; • The geographic and system boundaries for the relevant electricity grid can be clearly
identified and information on the characteristics of the grid is available. B.3. Description of the sources and gases included in the project boundary
Source Gas Included? Justification / Explanation CO2 Yes
Ba
seli ne
Grid CH4 No Project participants shall only account CO2 emissions from electricity generation in fossil
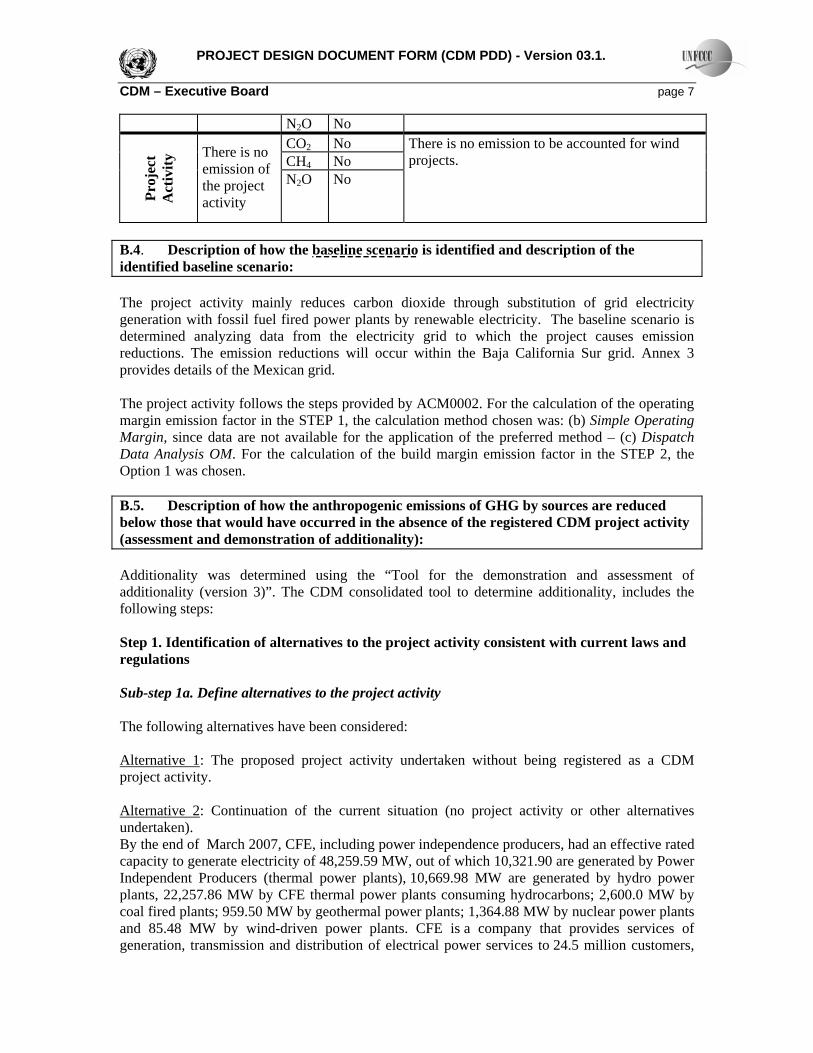
PROJECT DESIGN DOCUMENT FORM (CDM PDD) - Version 03.1. CDM – Executive Board page 7
N2O No CO2 No CH4 No
Proj
ect
Act
ivity
There is no emission of the project activity
N2O No
There is no emission to be accounted for wind projects.
B.4. Description of how the baseline scenario is identified and description of the identified baseline scenario: The project activity mainly reduces carbon dioxide through substitution of grid electricity generation with fossil fuel fired power plants by renewable electricity. The baseline scenario is determined analyzing data from the electricity grid to which the project causes emission reductions. The emission reductions will occur within the Baja California Sur grid. Annex 3 provides details of the Mexican grid. The project activity follows the steps provided by ACM0002. For the calculation of the operating margin emission factor in the STEP 1, the calculation method chosen was: (b) Simple Operating Margin, since data are not available for the application of the preferred method – (c) Dispatch Data Analysis OM. For the calculation of the build margin emission factor in the STEP 2, the Option 1 was chosen. B.5. Description of how the anthropogenic emissions of GHG by sources are reduced below those that would have occurred in the absence of the registered CDM project activity (assessment and demonstration of additionality): Additionality was determined using the “Tool for the demonstration and assessment of additionality (version 3)”. The CDM consolidated tool to determine additionality, includes the following steps: Step 1. Identification of alternatives to the project activity consistent with current laws and regulations Sub-step 1a. Define alternatives to the project activity The following alternatives have been considered: Alternative 1: The proposed project activity undertaken without being registered as a CDM project activity. Alternative 2: Continuation of the current situation (no project activity or other alternatives undertaken). By the end of March 2007, CFE, including power independence producers, had an effective rated capacity to generate electricity of 48,259.59 MW, out of which 10,321.90 are generated by Power Independent Producers (thermal power plants), 10,669.98 MW are generated by hydro power plants, 22,257.86 MW by CFE thermal power plants consuming hydrocarbons; 2,600.0 MW by coal fired plants; 959.50 MW by geothermal power plants; 1,364.88 MW by nuclear power plants and 85.48 MW by wind-driven power plants. CFE is a company that provides services of generation, transmission and distribution of electrical power services to 24.5 million customers,
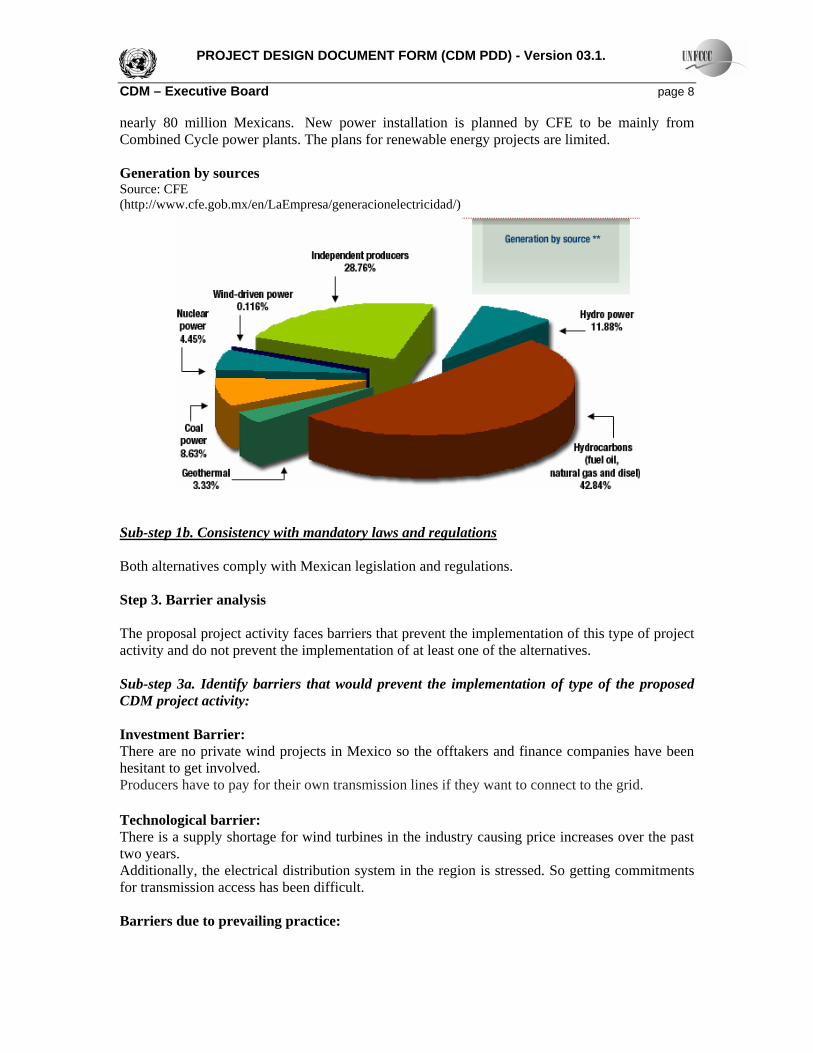
PROJECT DESIGN DOCUMENT FORM (CDM PDD) - Version 03.1. CDM – Executive Board page 8 nearly 80 million Mexicans. New power installation is planned by CFE to be mainly from Combined Cycle power plants. The plans for renewable energy projects are limited. Generation by sources Source: CFE (http://www.cfe.gob.mx/en/LaEmpresa/generacionelectricidad/)
Sub-step 1b. Consistency with mandatory laws and regulations Both alternatives comply with Mexican legislation and regulations. Step 3. Barrier analysis The proposal project activity faces barriers that prevent the implementation of this type of project activity and do not prevent the implementation of at least one of the alternatives. Sub-step 3a. Identify barriers that would prevent the implementation of type of the proposed CDM project activity: Investment Barrier: There are no private wind projects in Mexico so the offtakers and finance companies have been hesitant to get involved. Producers have to pay for their own transmission lines if they want to connect to the grid. Technological barrier: There is a supply shortage for wind turbines in the industry causing price increases over the past two years. Additionally, the electrical distribution system in the region is stressed. So getting commitments for transmission access has been difficult. Barriers due to prevailing practice:

PROJECT DESIGN DOCUMENT FORM (CDM PDD) - Version 03.1. CDM – Executive Board page 9 Mexico is rich in oil and gas reserves; this clearly explains why the prevailing practice in Mexico is fossil fuel-fired electricity generation as of today, and this path is envisaged to continue, as the country still has a vast gas potential unused for electricity generation, which is to be further explored in the coming years. Today, oil-fired power plants still account for almost 50% of Mexican electricity generation, compared to 11% gas-fired and 10% coal-fired plants. However, the government is encouraging brownfield private investments to convert the majority of these plants into natural gas. Official estimates for the year 2012 forecast the share of natural gas generation as 63% of the total power production in the country, while the use of fuel oil is expected to decrease by 25%. Moreover, the regulations for renewable energy projects in Mexico are evolving and have not been tested on many projects. Renewable-energy producers also are faced with certain wariness in the population at large, a problem that wind-power operators encounter in particular when they try to obtain land-use permits. Sub-step 3 b. Show that the identified barriers would not prevent the implementation of at least one of the alternatives (except the proposed project activity): In case of Alternative 2 (continuation of current situation), there will be no effect of the identified barriers, as this represents a continuation of current practices, development of thermal power plants, a well-established technology in Mexico. Step 4. Common practice analysis
Sub-step 4a. Analyze other activities similar to the proposed project activity: There are only two facilities generating from wind in Mexico which are not CDM projects:
• La Venta: located in Oaxaca and started operation in 10 November 1994 with an installed capacity of 1.58 MW;
• Guerrero Negro, located in Baja California Sur and started operation in 10 April 1982 with an installed capacity of 0.6 MW.
Then, the SCWFP is not comparable to these power plants. The main driver for other activities similar to the proposed project activity is the CDM mechanism that provides additional income and makes these projects viable. Sub-step 4b. Discuss any similar options that are occurring: As shown in Sub-step 4a, no similar activities are observed and commonly carried out in Mexico without the CERs revenue. B.6. Emission reductions:
B.6.1. Explanation of methodological choices: The emission reduction (ERy) by the project activity during a given year y is the difference between baseline emissions (BEy), project emissions (PEy) and emissions due to leakage (Ly), as follows:
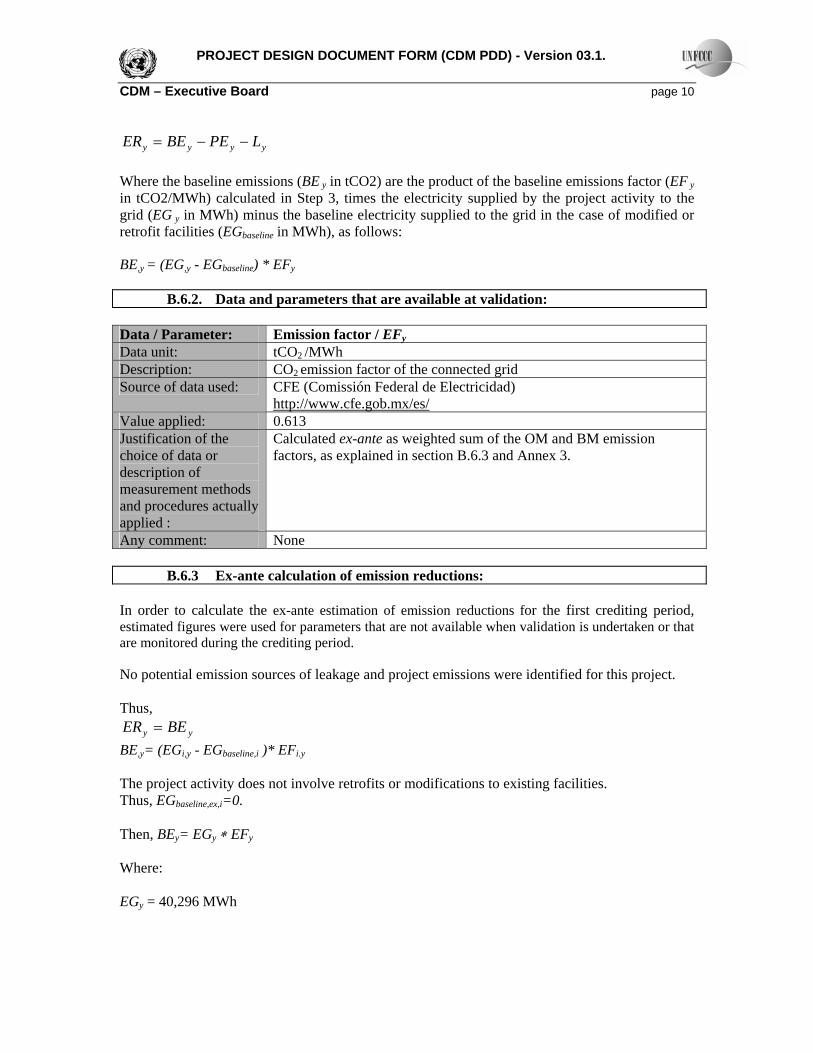
PROJECT DESIGN DOCUMENT FORM (CDM PDD) - Version 03.1. CDM – Executive Board page 10
yyyy LPEBEER −−= Where the baseline emissions (BE y in tCO2) are the product of the baseline emissions factor (EF y in tCO2/MWh) calculated in Step 3, times the electricity supplied by the project activity to the grid (EG y in MWh) minus the baseline electricity supplied to the grid in the case of modified or retrofit facilities (EGbaseline in MWh), as follows:
BE,y = (EG,y - EGbaseline) * EFy
B.6.2. Data and parameters that are available at validation: Data / Parameter: Emission factor / EFy
Data unit: tCO2 /MWh Description: CO2 emission factor of the connected grid Source of data used: CFE (Comissión Federal de Electricidad)
http://www.cfe.gob.mx/es/Value applied: 0.613 Justification of the choice of data or description of measurement methods and procedures actually applied :
Calculated ex-ante as weighted sum of the OM and BM emission factors, as explained in section B.6.3 and Annex 3.
Any comment: None
B.6.3 Ex-ante calculation of emission reductions: In order to calculate the ex-ante estimation of emission reductions for the first crediting period, estimated figures were used for parameters that are not available when validation is undertaken or that are monitored during the crediting period. No potential emission sources of leakage and project emissions were identified for this project. Thus,
yy BEER = BE,y= (EGi,y - EGbaseline,i )* EFi.y The project activity does not involve retrofits or modifications to existing facilities. Thus, EGbaseline,ex,i=0.
Then, BEy= EGy ∗ EFy Where: EGy = 40,296 MWh
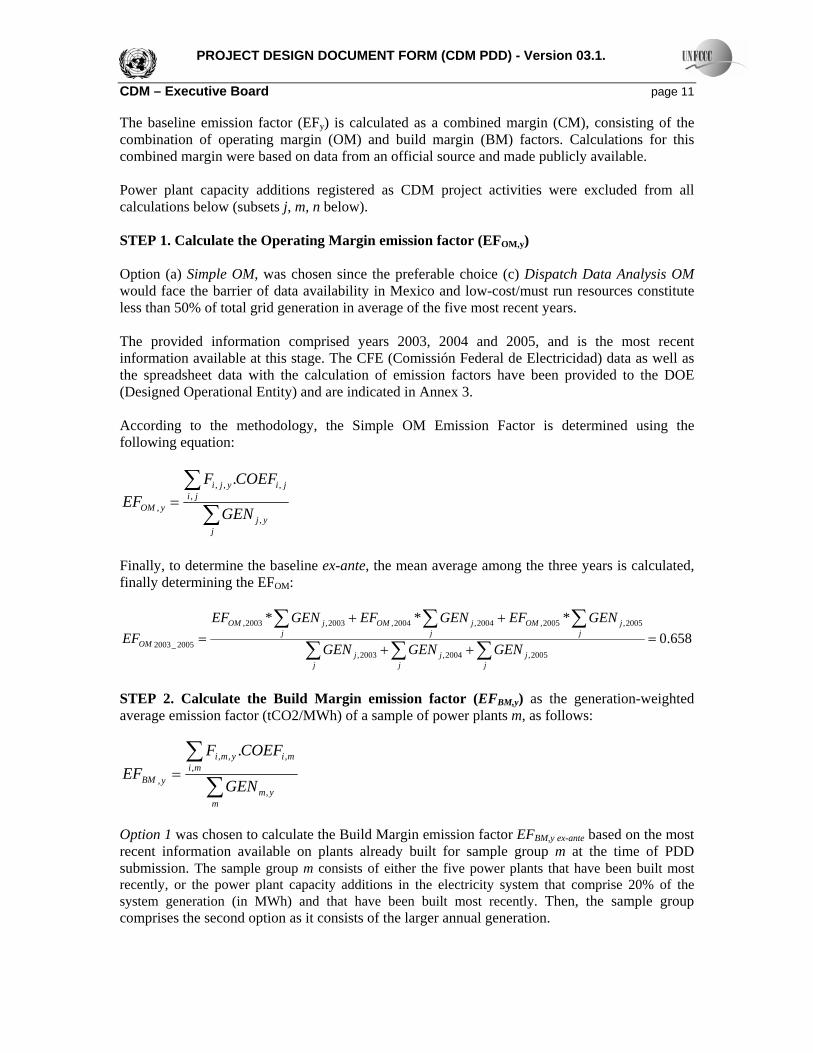
PROJECT DESIGN DOCUMENT FORM (CDM PDD) - Version 03.1. CDM – Executive Board page 11 The baseline emission factor (EFy) is calculated as a combined margin (CM), consisting of the combination of operating margin (OM) and build margin (BM) factors. Calculations for this combined margin were based on data from an official source and made publicly available. Power plant capacity additions registered as CDM project activities were excluded from all calculations below (subsets j, m, n below). STEP 1. Calculate the Operating Margin emission factor (EFOM,y) Option (a) Simple OM, was chosen since the preferable choice (c) Dispatch Data Analysis OM would face the barrier of data availability in Mexico and low-cost/must run resources constitute less than 50% of total grid generation in average of the five most recent years. The provided information comprised years 2003, 2004 and 2005, and is the most recent information available at this stage. The CFE (Comissión Federal de Electricidad) data as well as the spreadsheet data with the calculation of emission factors have been provided to the DOE (Designed Operational Entity) and are indicated in Annex 3. According to the methodology, the Simple OM Emission Factor is determined using the following equation:
∑∑
=
jyj
jijiyji
yOM GEN
COEFFEF
,
,,,,
,
.
Finally, to determine the baseline ex-ante, the mean average among the three years is calculated, finally determining the EFOM:
658.0***
2005,2004,2003,
2005,2005,2004,2004,2003,2003,
2005_2003 =++
++=
∑∑∑∑∑∑
jj
jj
jj
jjOM
jjOM
jjOM
OM GENGENGEN
GENEFGENEFGENEFEF
STEP 2. Calculate the Build Margin emission factor (EFBM,y) as the generation-weighted average emission factor (tCO2/MWh) of a sample of power plants m, as follows:
∑∑
=
mym
mimiymi
yBM GEN
COEFFEF
,
,,,,
,
.
Option 1 was chosen to calculate the Build Margin emission factor EFBM,y ex-ante based on the most recent information available on plants already built for sample group m at the time of PDD submission. The sample group m consists of either the five power plants that have been built most recently, or the power plant capacity additions in the electricity system that comprise 20% of the system generation (in MWh) and that have been built most recently. Then, the sample group comprises the second option as it consists of the larger annual generation.
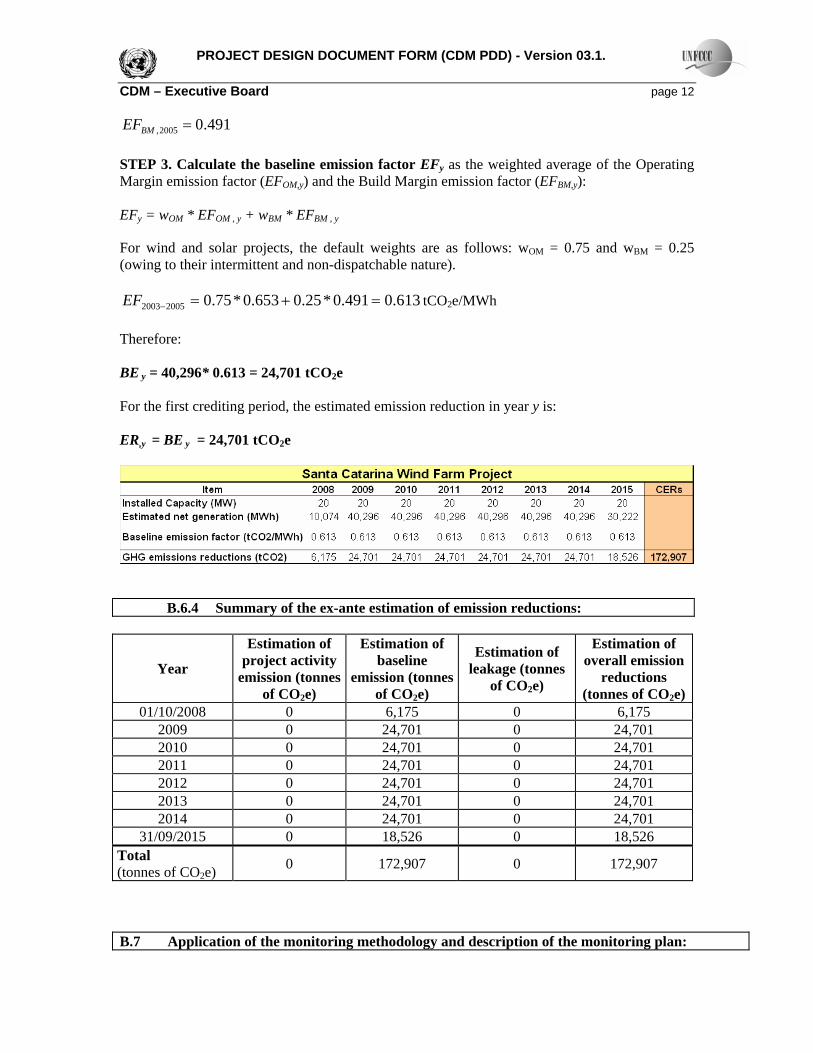
PROJECT DESIGN DOCUMENT FORM (CDM PDD) - Version 03.1. CDM – Executive Board page 12
491.02005, =BMEF STEP 3. Calculate the baseline emission factor EFy as the weighted average of the Operating Margin emission factor (EFOM,y) and the Build Margin emission factor (EFBM,y): EFy = wOM * EFOM , y + wBM * EFBM , y For wind and solar projects, the default weights are as follows: wOM = 0.75 and wBM = 0.25 (owing to their intermittent and non-dispatchable nature).
613.0491.0*25.0653.0*75.020052003 =+=−EF tCO2e/MWh Therefore: BE y = 40,296* 0.613 = 24,701 tCO2e For the first crediting period, the estimated emission reduction in year y is: ER,y = BE y = 24,701 tCO2e
B.6.4 Summary of the ex-ante estimation of emission reductions:
Year
Estimation of project activity
emission (tonnes of CO2e)
Estimation of baseline
emission (tonnes of CO2e)
Estimation of leakage (tonnes
of CO2e)
Estimation of overall emission
reductions (tonnes of CO2e)
01/10/2008 0 6,175 0 6,175 2009 0 24,701 0 24,701 2010 0 24,701 0 24,701 2011 0 24,701 0 24,701 2012 0 24,701 0 24,701 2013 0 24,701 0 24,701 2014 0 24,701 0 24,701
31/09/2015 0 18,526 0 18,526 Total (tonnes of CO2e) 0 172,907 0 172,907
B.7 Application of the monitoring methodology and description of the monitoring plan:

PROJECT DESIGN DOCUMENT FORM (CDM PDD) - Version 03.1. CDM – Executive Board page 13
B.7.1 Data and parameters monitored:
Data / Parameter: Electricity quantity / EG,y
Data unit: MWh Description: Electricity supplied to the connected grid by the project. Source of data to be used:
Econergy
Value of data applied for the purpose of calculating expected emission reductions in section B.5
40,296
Description of measurement methods and procedures to be applied:
Directly measured during the crediting period. This data will be archived electronically and according to internal procedures, until 2 years after the end of the crediting period.
QA/QC procedures to be applied:
This data will be directly used for calculation of emission reductions. Sales record to the grid and other records are used to ensure the consistency. Equipments will be calibrated as required by CFE.
Any comment: Electricity supplied by the project activity to the grid. Double check by receipt of sales.
B.7.2 Description of the monitoring plan:
The measurers of electricity dispatched will be installed at the Santa Catarina Wind Farm´s Substation which is the point of connection of the Santa Catarina Power Plant to the Mexican Interconnected Electric System. The meter equipments will be provided by the Utility CFE and calibrated by them according to their procedures. The project participant will install its own meter to check against the utility meter. Since no leakage nor any off-grid emissions change were identified in this project activity, there will be no need to monitor the variables for these cases. Data monitored and required for verification and issuance are to be kept for two years after the end of the crediting period or the last issuance of CERs for this project activity, whichever occurs later. B.8 Date of completion of the application of the baseline study and monitoring methodology and the name of the responsible person(s)/entity(ies) The date of completion the application of the methodology to the project activity study is 17/06/2007. The person/entity determining the baseline is as follows: Econergy Brasil Ltda, São Paulo, Brazil telephone: +55 (11) 3555-5700
PROJECT DESIGN DOCUMENT FORM (CDM PDD) - Version 03.1. CDM – Executive Board page 14 Contact person: Mrs. Francesca Maria Cerchia. SECTION C. Duration of the project activity / crediting period C.1 Duration of the project activity: C.1.1. Starting date of the project activity: 01/10/2008 C.1.2. Expected operational lifetime of the project activity: 21 years and 0 months C.2 Choice of the crediting period and related information: C.2.1. Renewable crediting period C.2.1.1. Starting date of the first crediting period: 01/10/2008 C.2.1.2. Length of the first crediting period: 7 years and 0 months C.2.2. Fixed crediting period: C.2.2.1. Starting date: Left blank on purpose C.2.2.2. Length: Left blank on purpose SECTION D. Environmental impacts D.1. Documentation on the analysis of the environmental impacts, including transboundary impacts: The Environmental Impact assessment has been performed and will be submitted to SEMARNAT (Secretaría de Medio Ambiente y Recursos Naturales). The environmental impact study has been completed and has not found any negative environmental issues. D.2. If environmental impacts are considered significant by the project participants or the host Party, please provide conclusions and all references to support documentation of an environmental impact assessment undertaken in accordance with the procedures as required by the host Party:

PROJECT DESIGN DOCUMENT FORM (CDM PDD) - Version 03.1. CDM – Executive Board page 15 The environmental impacts were not considered significant by the project participants, according to the EIA. There will be no transboundary impacts resulting from the Loreto Bay Wind Farm. All the relevant impacts occur within Mexican borders and have been mitigated to comply with the environmental requirements for project’s implementation. Therefore this project will not affect by any mean Mexico´s neighboring countries, except for the reduction of global emission of GHG. SECTION E. Stakeholders’ comments E.1. Brief description how comments by local stakeholders have been invited and compiled: E.2. Summary of the comments received: No comments have been received. E.3. Report on how due account was taken of any comments received: No comments have been received.
PROJECT DESIGN DOCUMENT FORM (CDM PDD) - Version 03.1. CDM – Executive Board page 16
Annex 1
CONTACT INFORMATION ON PARTICIPANTS IN THE PROJECT ACTIVITY Organization: Econergy International Corporation UK Limited Address/P.O. Box: 22 Billiter Street Building: - City: London State/Region: - Postfix/Zip: EC3M 2RY Country: United Kingdom of Great Britain Tel: +44 (0)20 7355 7816 FAX: + 44 (0) 20 3102 3401 E-Mail: [email protected]: http://www.econergy.comRepresented by: Mr. Philip Doyle Title: Managing Director Salutation: Mr. Last name: Doyle Middle name: - First name: Philip Department: - Mobile: - Direct FAX: +44 (0) 20 3102 3401 Direct tel: +44 (0)20 7355 7816 Personal E-Mail: [email protected]
Annex 2
INFORMATION REGARDING PUBLIC FUNDING
There is no Annex I public funding involved in the SCWFP activity.
PROJECT DESIGN DOCUMENT FORM (CDM PDD) - Version 03.1. CDM – Executive Board page 17
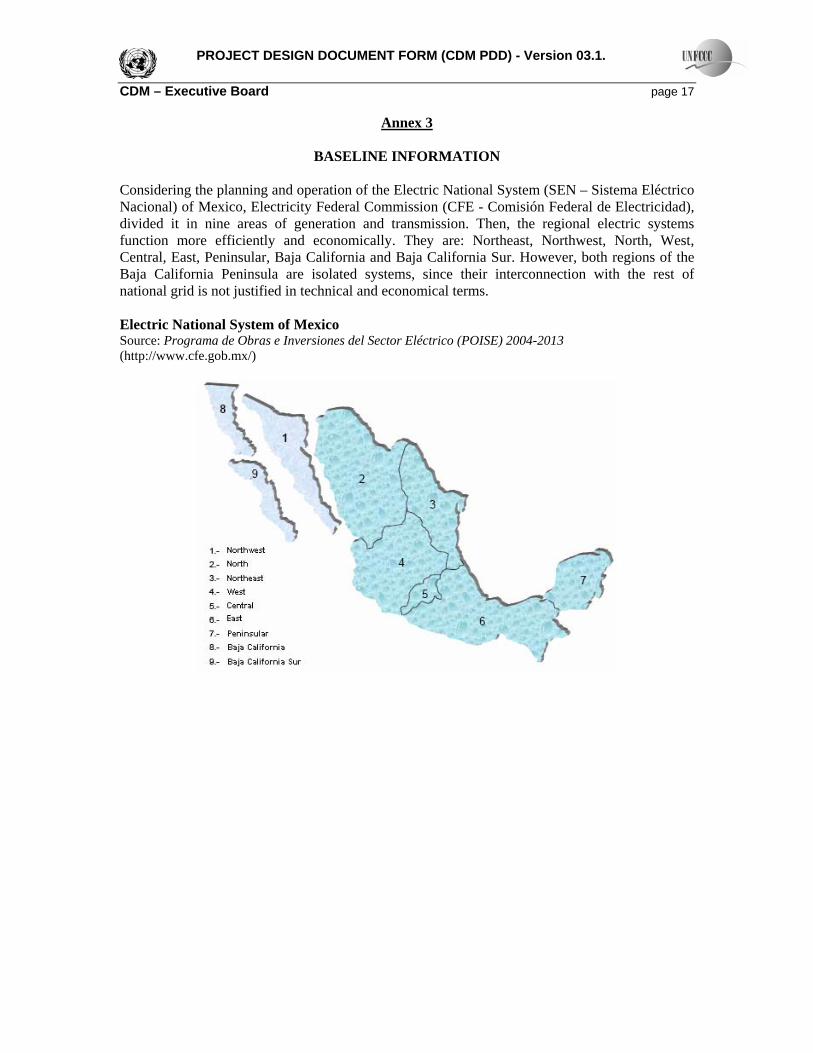
Annex 3
BASELINE INFORMATION Considering the planning and operation of the Electric National System (SEN – Sistema Eléctrico Nacional) of Mexico, Electricity Federal Commission (CFE - Comisión Federal de Electricidad), divided it in nine areas of generation and transmission. Then, the regional electric systems function more efficiently and economically. They are: Northeast, Northwest, North, West, Central, East, Peninsular, Baja California and Baja California Sur. However, both regions of the Baja California Peninsula are isolated systems, since their interconnection with the rest of national grid is not justified in technical and economical terms. Electric National System of Mexico Source: Programa de Obras e Inversiones del Sector Eléctrico (POISE) 2004-2013 (http://www.cfe.gob.mx/)
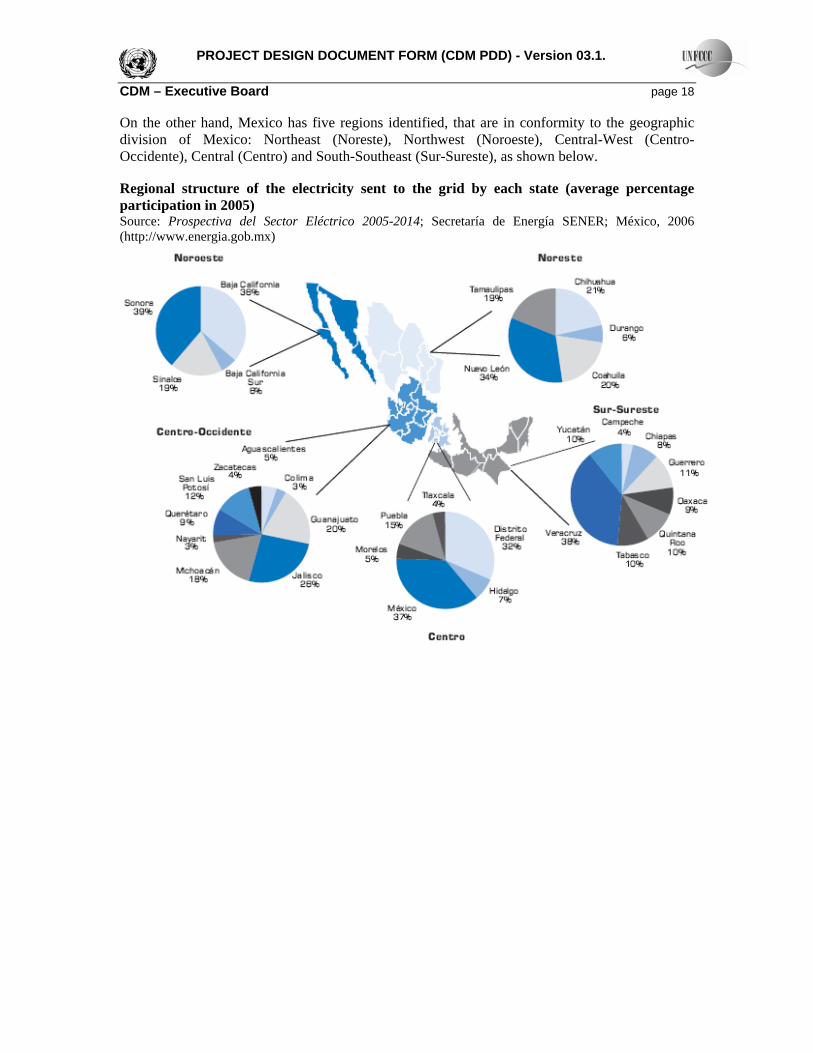
PROJECT DESIGN DOCUMENT FORM (CDM PDD) - Version 03.1. CDM – Executive Board page 18 On the other hand, Mexico has five regions identified, that are in conformity to the geographic division of Mexico: Northeast (Noreste), Northwest (Noroeste), Central-West (Centro-Occidente), Central (Centro) and South-Southeast (Sur-Sureste), as shown below. Regional structure of the electricity sent to the grid by each state (average percentage participation in 2005) Source: Prospectiva del Sector Eléctrico 2005-2014; Secretaría de Energía SENER; México, 2006 (http://www.energia.gob.mx)

PROJECT DESIGN DOCUMENT FORM (CDM PDD) - Version 03.1. CDM – Executive Board page 19 Emission factor for the Interconnected Electric System of Mexico according to ACM0002
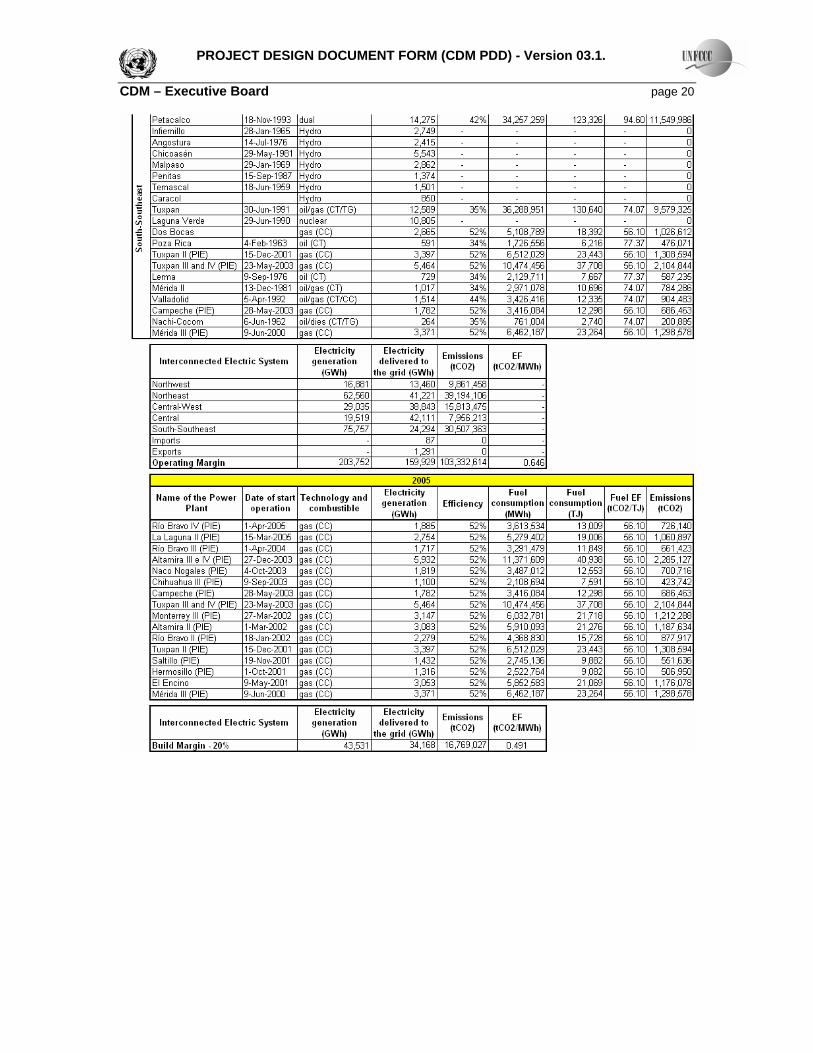
PROJECT DESIGN DOCUMENT FORM (CDM PDD) - Version 03.1. CDM – Executive Board page 20
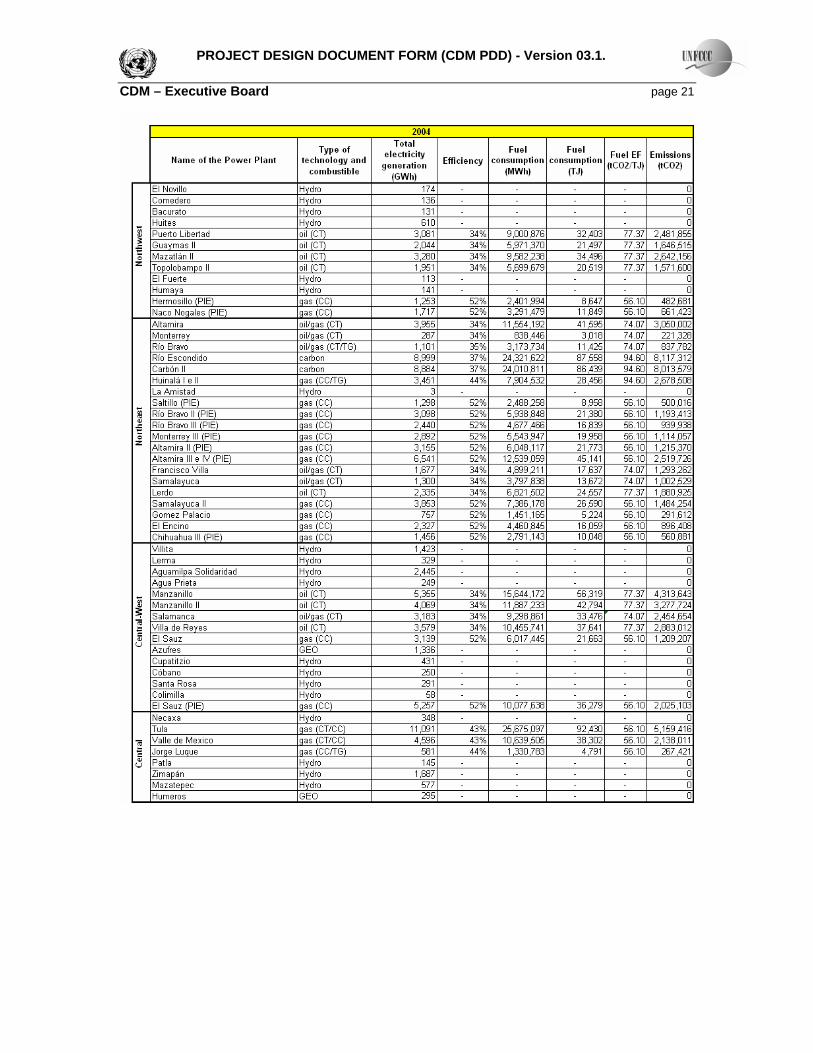
PROJECT DESIGN DOCUMENT FORM (CDM PDD) - Version 03.1. CDM – Executive Board page 21

PROJECT DESIGN DOCUMENT FORM (CDM PDD) - Version 03.1. CDM – Executive Board page 22
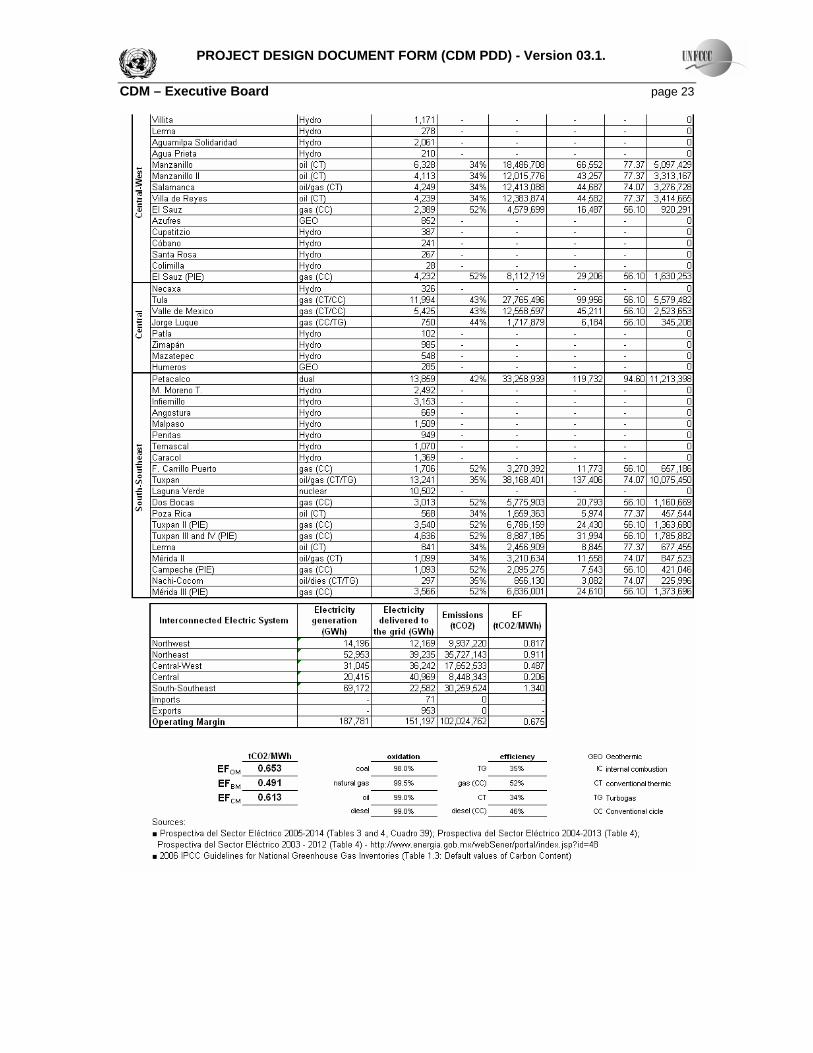
PROJECT DESIGN DOCUMENT FORM (CDM PDD) - Version 03.1. CDM – Executive Board page 23

PROJECT DESIGN DOCUMENT FORM (CDM PDD) - Version 03.1. CDM – Executive Board page 24
Annex 4
MONITORING INFORMATION
The Monitoring Plan is described in B.7.2.