Clean Copy of Final Draft El Centro 2015 UWMP 05242016 Draft El Centro 2015 UWMP... · Appendix B...
102
2015 URBAN WATER MANAGEMENT PLAN City of El Centro April 2016 3 Hutton Centre Drive, Suite 200 Santa Ana, CA 92707
-
Upload
vuongquynh -
Category
Documents
-
view
216 -
download
0
Transcript of Clean Copy of Final Draft El Centro 2015 UWMP 05242016 Draft El Centro 2015 UWMP... · Appendix B...

2015 URBAN WATER
MANAGEMENT PLAN
City of El Centro
April 2016
3 Hutton Centre Drive, Suite 200 Santa Ana, CA 92707


City of El Centro 2015 Urban Water Management Plan Table of Contents
i
TABLE OF CONTENTS
Chapter Page
1 INTRODUCTION AND OVERVIEW .......................................................... 1-1
1.1 BACKGROUND AND PURPOSE ............................................................... 1-1
1.2 UWMP UPDATE AND THE CALIFORNIA WATER CODE .................... 1-1
2 PLAN PREPARATION .............................................................................. 2-1
2.1 BASIS FOR PREPARING A PLAN ............................................................. 2-1
2.2 INDIVIDUAL OR REGIONAL PLANNING AND COMPLIANCE .......... 2-1
2.3 FISCAL OR CALENDAR YEAR AND UNITS OF MEASURE ................ 2-2
2.4 COORDINATION AND OUTREACH ........................................................ 2-2
3 SYSTEM DESCRIPTION ........................................................................... 3-1
3.1 GENERAL DESCRIPTION .......................................................................... 3-1
3.2 SERVICE AREA BOUNDARY MAPS ...................................................... 3-6
3.3 SERVICE AREA CLIMATE ........................................................................ 3-6
3.4 SERVICE AREA POPULATION AND DEMOGRAPHICS ....................... 3-7
4 SYSTEM WATER USE .............................................................................. 4-1
4.1 RECYCLED VERSUS POTABLE AND RAW WATER DEMAND ......... 4-1
4.2 WATER USES BY SECTOR ........................................................................ 4-1
4.3 DISTRIBUTION SYSTEM WATER LOSSES ............................................ 4-4
4.4 ESTIMATING FUTURE WATER SAVINGS ............................................. 4-4
4.5 WATER USE FOR LOWER INCOME HOUSEHOLDS ............................ 4-7
4.6 CLIMATE CHANGE .................................................................................... 4-9
5 SB X7-7 BASELINES AND TARGETS ..................................................... 5-1
5.1 UPDATING CALCULATIONS FROM 2010 UWMP ................................. 5-2
5.2 BASELINE PERIODS................................................................................... 5-2
5.3 SERVICE AREA POPULATION ................................................................. 5-2
5.4 GROSS WATER USE ................................................................................... 5-3
5.5 BASELINE DAILY PER CAPITA WATER USE ....................................... 5-4
5.6 2015 AND 2020 TARGETS .......................................................................... 5-4
5.7 2015 COMPLIANCE DAILY PER CAPITA WATER USE (gpcd) ............ 5-5
5.8 REGIONAL ALLIANCE .............................................................................. 5-5
City of El Centro Table of Contents 2015 Urban Water Management Plan
ii
6 SYSTEM SUPPLIES ................................................................................. 6-1
6.1 PURCHASED IMPORTED WATER ........................................................... 6-1
6.2 GROUNDWATER ...................................................................................... 6-15
6.3 SURFACE WATER .................................................................................... 6-19
6.4 STORMWATER.......................................................................................... 6-19
6.5 WASTEWATER AND RECYCLED WATER ........................................... 6-19
6.6 DESALINATED WATER OPPORTUNITIES ........................................... 6-21
6.7 EXCHANGES OR TRANSFERS ............................................................... 6-22
6.8 FUTURE WATER PROJECTS ................................................................... 6-22
6.9 SUMMARY OF EXISTING AND PLANNED SOURCES OF WATER .. 6-24
6.10 CLIMATE CHANGE IMPACTS TO SUPPLY.......................................... 6-26
7 WATER SUPPLY RELIABILITY ASSESSMENT ...................................... 7-1
7.2 RELIABILITY BY TYPE OF YEAR ........................................................... 7-4
7.3 SUPPLY AND DEMAND ASSESSMENT .................................................. 7-8
8 WATER SHORTAGE CONTINGENCY PLANNING ................................. 8-1
8.1 STAGE OF ACTION .................................................................................... 8-1
8.2 PROHIBITIONS ON END USES ................................................................. 8-3
8.3 PENALTIES, CHARGES, OTHER ENFORCEMENT OF PROHIBITIONS........................................................................................................................ 8-3
8.4 CONSUMPTION REDUCTION METHODS .............................................. 8-3
8.5 DETERMINING WATER SHORTAGE REDUCTIONS ............................ 8-3
8.6 REVENUE AND EXPENDITURE IMPACTS ............................................ 8-6
8.7 RESOLUTIONS OR ORDINANCE ............................................................. 8-7
8.8 CATASTROPHIC SUPPLY INTERRUPTION ........................................... 8-8
8.9 MINIMUM SUPPLY NEXT THREE YEARS ............................................. 8-9
9 DEMAND MANAGEMENT MEASURES ................................................... 9-1
9.1 DEMAND MANAGEMENT MEASURES FOR WHOLESALE AGENCIES........................................................................................................................ 9-1
9.2 DEMAND MANAGEMENT MEASURES FOR RETAIL AGENCIES ..... 9-1
9.3 IMPLEMENTATION OVER THE PAST FIVE YEARS ............................ 9-5
9.4 PLANNED IMPLEMENTATION TO ACHIEVE WATER USE TARGETS........................................................................................................................ 9-5
9.5 MEMBERS OF THE CALIFORNIA URBAN WATER CONSERVATION COUNCIL ...................................................................................................... 9-6
City of El Centro 2015 Urban Water Management Plan Table of Contents
iii
10 PLAN ADOPTION, SUBMITTAL, AND IMPLEMENTATION .................. 10-1
10.1 INCLUSION OF ALL 2015 DATA ............................................................ 10-1
10.2 NOTICE OF PUBLIC HEARING............................................................... 10-1
10.3 PUBLIC HEARING AND ADOPTION ..................................................... 10-1
10.4 PLAN SUBMITTAL ................................................................................... 10-1
10.5 PUBLIC AVAILABILITY .......................................................................... 10-2
10.6 AMENDING AN ADOPTED UWMP ........................................................ 10-2
APPENDICES
Appendix A Urban Water Management Planning Act as amended with SBX7-7
Appendix B DWR UWMP Checklist Organized by Subject
Appendix C Resolution No. 11-89 of City Council of El Centro to adopt 2010 Urban Water Management Plan
Appendix D Draft City of El Centro Resolution to Declare a Water Emergency
Appendix E Draft City of El Centro Moratorium on New Connections during a Water Shortage
Appendix F City of El Centro Ordinance No. 15-07 (Adopted 6-16-15) Establishing Water Conservation Regulations and Restrictions to become Effective Immediately due to Severe Drought
Appendix G Draft City of El Centro No Waste Ordinance
Appendix H AWWA Water Loss Worksheets
Appendix I Notice of Public Hearing and Resolution for Plan Adoption
FIGURES
Figure No. Page
3-1 Imperial IRWP Regional Setting: Imperial Region 3-2
3-2 City and Sphere of Influences Boundary Map 3-5
6-1 Prescribed Operations of Lake Powell & Lake Mead 6-14
6-2 Historic Lake Mead Elevation Levels 6-15
7-2 Lake Mead IOPP Schematic 7-6

City of El Centro Table of Contents 2015 Urban Water Management Plan
iv
TABLES
Table No. Page
Table 2-1: Public Water Systems ................................................................................... 2-1
Table 2-2: Plan Identification ........................................................................................ 2-1
Table 2-3: Agency Identification ................................................................................... 2-2
Table 2-4: Water Supplier Information Exchange ......................................................... 2-2
Table 3-1A: Historical City Climate Characteristics ....................................................... 3-7
Table 3-1B: Historical & Current Population .................................................................. 3-8
Table 3-1C: Current and Projected Population ................................................................ 3-8
Table 3-1: Population – Current and Projected ................................................. (Not Used)
Table 4-1A: Historical and Current Water Service Connections ..................................... 4-1
Table 4-1B: Historical Water Use and Water Loss ......................................................... 4-2
Table 4-1: Demands for Potable and Raw Water – Actual ............................................ 4-3
Table 4-2: Demands for Potable and Raw Water – Projected ....................................... 4-3
Table 4-3: Total Water Demands ................................................................................... 4-4
Table 4-4: 12 Month Water Loss Audit Reporting ........................................................ 4-4
Table 4-5A: Historical & Projected City Per-Capita Water Use ..................................... 4-6
Table 4-5B: Projected City Water Demands ................................................................... 4-8
Table 4-5: Inclusion in Water Use Projections ............................................................. 4-9
Table 5-1A: Baseline Daily Per-Capita Water Use ......................................................... 5-3
Table 5-2B: Minimum Baseline Daily Per-Capita Water Use ......................................... 5-3
Table 5-1C: 2020 Targets by Method .............................................................................. 5-5
Table 5-1: Baselines and Targets Summary ................................................................. 5-5
Table 5-2: 2015 Compliance ......................................................................................... 5-5
Table 6-0A: Seven-Party Agreement for Apportionments and Priorities ........................ 6-3
Table 6-0B: Delivery of Priority 3(a) Consumptive Use Entitlement to IID (CRWDA Exhibit A) .................................................................................................... 6-6
Table 6-0C: Table 6-0D: IID Conserved and Mitigation Water Delivery Schedule 2003- 2077 (KAF, CRWDA Exhibit B) ............................................................... 6-6
Table 6.0D: Conserved and Mitigation Water Delivery Schedule 2003-2077 (KAF, CRWDA Exhibit B) .................................................................................... 6-9
Table 6-0E: Compromised IID QSA Delivery Schedule, 2003-2017 (KAF) ............... 6-10
Table 6-0F: Unregulated Inflow to Lake Powell, 2000-2010 (Percent of Historic Average) .................................................................................................... 6-11
Table 6-1: Groundwater Volume Pumped ....................................................... (Not Used)
Table 6-2: Wastewater Collected within Service Area in 2015 .................................. 6-20
City of El Centro 2015 Urban Water Management Plan Table of Contents
v
Table 6-3: Wastewater Treatment and Discharge within Service Area in 2015 ......... 6-23
Table 6-4: Current and Projected Recycled Water Direct Beneficial Uses within Service Area ................................................................................... (Not Used)
Table 6-5: 2010 UWMP Recycled Water Use Projection Compared To 2015 Actual …………………………………………………………………….. (Not Used)
Table 6-6: Methods to Expand Future Recycled Water Use .......................... (Not Used)
Table 6-7: Expected Future Water Supply Projects or Programs ..................... (Not Used)
Table 6-8: Water Supplies – Actual ............................................................................. 6-26
Table 6-9: Water Supplies – Projected ........................................................................ 6-26
Table 7-1A: IID Inadvertent Overrun Payback to the Colorado River under the IOPP, 2012-2014 ..................................................................................................... 7-6
Table 7-1: Bases of Water Year Data ............................................................................ 7-8
Table 7-2: Normal Year Supply and Demand Comparison ........................................... 7-9
Table 7-3: Single Dry Year Supply and Demand Comparison ...................................... 7-9
Table 7-4: Multiple Dry Years Supply and Demand Comparison................................. 7-9
Table 8-1: Stages of WSCP ........................................................................................... 8-2
Table 8-1A: Per-Capita Health and Safety Water Quantity Calculations ........................ 8-3
Table 8-2: Restrictions and Prohibitions on end uses .................................................... 8-4
Table 8-2A: WSCP Penalties and Charges ...................................................................... 8-4
Table 8-3 Stages Of WSCP – Consumption Reduction Methods................................. 8-5
Table 8-4: Minimum Supply Next Three Years .......................................................... 8-10
Table 10-1: Notification to Cities and Counties .................................................. Not Used)
City of El Centro Acronyms and Abbreviations 2015 Urban Water Management Plan
vi
ACRONYMS and ABBREVIATIONS AAC All-American Canal AB Assembly Bill AF Acre Feet AFY Acre Feet per Year AMI Average Median Income AMR/AMI Automatic Meter Reading/Advanced Metering Infrastructure AOP Annual Operating Plan AWWA American Water Works Association BMP Best Management Practices CAP Central Arizona Project CCF Hundred Cubic Feet CDPH California Department of Public Health CDCR California Department of Corrections and Rehabilitation Facilities CEC California Energy Commission CEQA California Environmental Quality Act CFR Code of Federal Regulations CFS Cubic Feet per Second CII Commercial, Industrial and Institutional CIMIS California Irrigation Management Information System CRA Colorado River Aqueduct CRWDA Colorado River Water Delivery Agreement CUWCC California Urban Water Conservation Council CVWD Coachella Valley Water District CWC California Water Code DMM Demand Management Measure DOE Department of Energy DOF Department of Finance DPH Department of Public Health DU Dwelling Unit DWR Department of Water Resources EDP Equitable Distribution Plan EIR Environmental Impact Report EOC Emergency Operations Center EPA Environmental Protection Agency ET Evapotranspiration Eto Evapotranspiration from a Standardized Grass Surface Etr Evapotranspiration from a Standardized Alfalfa Surface FY Fiscal Year GAC Granular Activated Carbon GCM Global Climate Model GDD Growing Degree Day GPCD Gallons Per Capita Per Day GPD Gallons Per Day GPF Gallons Per Flush GPM Gallons Per Minute GWMP Groundwater Management Plan

City of El Centro 2015 Urban Water Management Plan Acronyms and Abbreviations
vii
HCF Hundred Cubic Feet ICS Intentionally Created Surplus IDP Independent Technical Panel IID Imperial Irrigation District In Inches IOPP Inadvertent Overrun Payback Policy IRP Integrated Resources Plan IRWMP Integrated Regional Water Management Plan IWSP Improved Water and Wastewater Services Program KAFY Thousand Acre Feet per Year LAFCo Local Agency Formation Commission LCR Lower Colorado River M&I Municipal and Industrial MAF Million Acre Feet MAFY Million Acre Feet per Year MCI Municipal, Commercial, and Industrial MCL Maximum Contaminant Level Metropolitan Metropolitan Water District of Southern California MG Million Gallon MGD Million Gallons per Day Mg/L Milligrams Per Liter MIN Minutes MOU Memorandum of Understanding MSL Mean Sea Level MWD Metropolitan Water District of Southern California NBGPP North Basin Groundwater Protection Project NF Nanofiltration NOAA National Oceanic and Atmospheric Administration NPDES National Pollutant Discharge Elimination System PCE Perchloroethylene pci/L Picocuries Per Liter PPR Present Perfected Rights QSA Quantification Settlement Agreement RA Replenishment Assessment REOC Regional Emergency Operations Center RHNA Regional Housing Needs Allocation RO Reverse Osmosis RTP Regional Transportation Plan RUWMP Regional Urban Water Management Plan RWQCB Regional Water Quality Control Board SAP Service Area Plan SB Senate Bill SCADA Supervisory Control and Data Acquisition SCAG Southern California Association of Governments SOI Sphere of Influence SCS Sustainable Communities Strategy SDI Supply and Demand Imbalance SDWA Safe Drinking Water Act
City of El Centro Acronyms and Abbreviations 2015 Urban Water Management Plan
viii
SDCWA San Diego County Water Authority SWP State Water Project SWRCB State Water Resources Control Board TAF Thousand Acre Feet TDS Total Dissolved Solids ug/L Micrograms Per Liter USBR U.S. Bureau of Reclamation USEPA United States Environmental Protection Agency USGS United States Geological Survey UV Ultraviolet UWMP Urban Water Management Plan VOC Volatile Organic Compounds WARN Water Agencies Response Network WRCC Western Regional Climate Center WSCP Water Shortage Contingency Plan

City of El Centro 2015 Urban Water Management Plan Acronyms and Abbreviations
ix
This page intentionally left blank.


City of El Centro 2015 Urban Water Management Plan Chapter 1
1-1
1 INTRODUCTION AND OVERVIEW 1.1 BACKGROUND AND PURPOSE
The City of El Centro has prepared the 2015 update of its Urban Water Management Plan to fulfill the requirements outlined in the California Urban Water Management Planning Act and the Water Conservation Bill of 2009. This plan includes all information necessary to meet the requirements of California Water Code, Division 6, Part 2.6 (Urban Water Management Planning).
1.2 UWMP UPDATE AND THE CALIFORNIA WATER CODE This report has been prepared in compliance with Water Code Sections 10610 through 10656 of the Urban Water Management Planning Act (Act), which were added by Statute 1983, Chapter 1009, and became effective on January 1, 1984. This Act requires that “every urban water supplier shall prepare and adopt an urban water management plan” (Water Code § 10620(a)). An “urban water supplier” is defined as a supplier providing water for municipal purposes to more than 3,000 customers or supplying more than 3,000 acre-feet of water annually (Water Code § 10617). These plans must be filed with the California Department of Water Resources (DWR) every five years. However, the 2015 plans must be submitted to DWR by July 1, 2016. The Act’s requirements include:
Detailed evaluation of the supplies necessary to meet demands over at least a 20-year period, in five-year increments, for a single dry water year, in multi-year droughts, and during average year conditions,
Documentation of the stages of actions an urban water supplier would undertake to address up to a 50 percent reduction in its water supplies,
Description of the actions to be undertaken in the event of a catastrophic interruption in water supplies, and
Evaluation of reasonable and practical efficient water uses, recycling, and conservation activities.
1.2.1 Changes in the Act Since 2010 Since 2010, several amendments have been made to the Act. The following is a summary of the significant changes in the Act that have occurred from 2010 to the present:
Changes the deadline for water suppliers to submit their 2015 UWMPs to DWR by July 1, 2016 (Water Code § 10621(d)).
Adds “distribution system water loss” to the list of past, present, and projected future water uses that the UWMP is to quantify to the extent that records are available and over the same 5-year increments described in Water Code § 10631(a). (Water Code § 10631(e)(1)(J)). For the 2015 UWMP, the distribution system water loss must be quantified for the most recent 12-month period

City of El Centro Chapter 1 2015 Urban Water Management Plan
1-2
available. For all subsequent updates, the distribution system water loss must be quantified for each of the 5 years preceding the plan update. (Water Code § 10631(e)(3)(A)). The distribution system water loss quantification must be reported in accordance with a worksheet approved or developed by DWR through a public process. The water loss quantification worksheet shall be based on the water system balance methodology developed by the American Water Works Association (AWWA) (Water Code § 10631(e)(3)(B)).1
If available and applicable to an urban water supplier, water use projections may display and account for the water savings estimated to result from adopted codes, standards, ordinances, or transportation and land use plans identified by the urban water supplier, as applicable to the service area (Water Code § 10631(e)(4)(A)). To the extent that an urban water supplier reports the information described in § 10631(e)(4)(A), an urban water supplier shall do both of the following: (1) provide citations of the various codes, standards, ordinances, or transportation and land use plans used in making the projections; and (2) indicate the extent that the water use projections consider savings from codes, standards, ordinances, or transportation and land use plans. Water use projections that do not account for these water savings shall note that fact (Water Code § 10631(e)(4)(B)).
Requires plans by retail water suppliers to include a narrative description that addresses the nature and extent of each water demand management measure (DMM) implemented over the past 5 years. The narrative must describe the water DMMs that the supplier plans to implement to achieve its water use targets pursuant to Water Code § 10608.20 (Water Code § 10631(f)(1)(A)). The narrative must also include descriptions of the following water DMMs: water waste prevention ordinances, metering, conservation pricing, public education and outreach, programs to assess and manage distribution system real loss, water conservation program coordination and staffing support; and other DMMs that have a significant impact on water use as measured in gallons per capita per day (gpcd), including innovative measures, if implemented (Water Code § 10631(f)(1)(B).
Requires plans by wholesale water suppliers to include a narrative description of metering, public education and outreach, water conservation program coordination and staffing support, and other DMMs that have a significant impact on water use as measured in gpcd, including innovative measures, if implemented, as well as a narrative description of their distribution system asset management and wholesale supplier assistance programs (Water Code § 10631(f)(2)).
Adds the voluntary reporting in the UWMP of any of the following information: an estimate of the amount of energy used: (1) to extract or divert water supplies; (2) to convey water supplies to water treatment plants or distribution systems; (3) to treat water supplies; (4) to distribute water supplies through the distribution system; (5) for treated water supplies in comparison to the amount used for non-treated water supplies; and (6) to place water into or to withdraw water from storage; and (7) any other energy-related information the urban water supplier deems appropriate (Water Code § 10631.2(a)). DWR included in its UWMP
1 Refer to Appendix H of this UWMP for a copy of AWWA’s Water Loss Worksheets
City of El Centro 2015 Urban Water Management Plan Chapter 1
1-3
guidance a methodology for the voluntary calculation or estimation of the energy intensity of urban water systems (Water Code § 10631.2(b)).
Requires urban water suppliers to submit plans or amendments to plans electronically and to include any standardized forms, tables, or displays specified by DWR (Water Code § 10644(a)(2)).
1.2.2 Senate Bill 7 of the Seventh Extraordinary Session of 2009, Water
Conservation in the Delta Legislative Package In addition to changes to the Act, the state Legislature passed Senate Bill 7 as part of the Seventh Extraordinary Session, referred to as SBx7-7, on November 10, 2009, which became effective February 3, 2010. This law was the water conservation component to the historic Delta legislative package, and seeks to achieve a 20 percent statewide reduction in urban per capita water use in California by December 31, 2020. This implements the Governor’s similar 2008 water use reduction goals. The law requires each urban retail water supplier to develop urban water use targets to help meet the 20 percent goal by 2020, and an interim urban water reduction target by 2015. The bill states that the legislative intent is to require all water suppliers to increase the efficiency of use of water resources and to establish a framework to meet the state targets for urban water conservation called for by the Governor. The bill establishes methods for urban retail water suppliers to determine targets to help achieve increased water use efficiency by the year 2020. The law is intended to promote urban water conservation standards consistent with the California Urban Water Conservation Council’s adopted best management practices. An urban retail water supplier may update its 2020 urban water use target in its 2015 UWMP (Water Code § 10608.20(g)).


City of El Centro 2015 Urban Water Management Plan Chapter 2
2-1
2 PLAN PREPARATION 2.1 BASIS FOR PREPARING A PLAN Per CWC 10617, “urban water supplier” means a supplier, either publicly or privately owned, providing water for municipal purposes either directly or indirectly to more than 3,000 customers or supplying more than 3,000 acre-feet of water annually. An urban water supplier includes a supplier or contractor for water, regardless of the basis of right, which distributes or sells for ultimate resale to customers. This part applies only to water supplied from public water systems. The City of El Centro is a public water supplier that meets the definition of an urban water supplier with 9,906 municipal water service connections and a total 7,117 acre-feet (AF) of water supplied to customers in their water service area in 2015. See Table 2-1.
Table 2‐1 Public Water Systems
Public Water System Number
Public Water System Name
Number of Municipal
Connections 2015
Volume of Water Supplied 2015 (AFY)
1 City of El Centro 9,906 7,117
2.2 INDIVIDUAL OR REGIONAL PLANNING AND COMPLIANCE The City of El Centro has developed an individual UWMP (as opposed to a Regional UWMP) that reports solely on its service area; addresses all requirements of the CWC; and notifies and coordinates with appropriate regional agencies and constituents. See Table 2-2.
Table 2‐2: Plan Identification
Individual UWMP
Regional UWMP (RUWMP)
City of El Centro Chapter 2 2015 Urban Water Management Plan
2-2
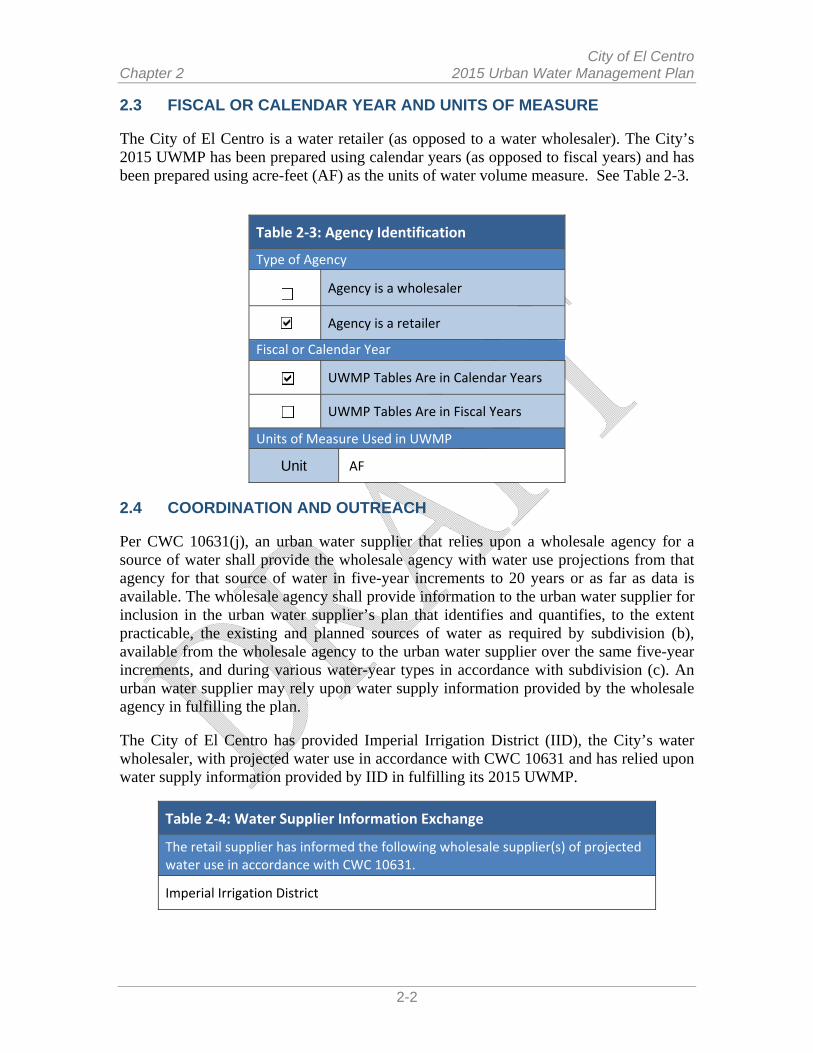
2.3 FISCAL OR CALENDAR YEAR AND UNITS OF MEASURE The City of El Centro is a water retailer (as opposed to a water wholesaler). The City’s 2015 UWMP has been prepared using calendar years (as opposed to fiscal years) and has been prepared using acre-feet (AF) as the units of water volume measure. See Table 2-3.
Table 2‐3: Agency Identification
Type of Agency
Agency is a wholesaler
Agency is a retailer
Fiscal or Calendar Year
UWMP Tables Are in Calendar Years
UWMP Tables Are in Fiscal Years
Units of Measure Used in UWMP
Unit AF
2.4 COORDINATION AND OUTREACH Per CWC 10631(j), an urban water supplier that relies upon a wholesale agency for a source of water shall provide the wholesale agency with water use projections from that agency for that source of water in five-year increments to 20 years or as far as data is available. The wholesale agency shall provide information to the urban water supplier for inclusion in the urban water supplier’s plan that identifies and quantifies, to the extent practicable, the existing and planned sources of water as required by subdivision (b), available from the wholesale agency to the urban water supplier over the same five-year increments, and during various water-year types in accordance with subdivision (c). An urban water supplier may rely upon water supply information provided by the wholesale agency in fulfilling the plan. The City of El Centro has provided Imperial Irrigation District (IID), the City’s water wholesaler, with projected water use in accordance with CWC 10631 and has relied upon water supply information provided by IID in fulfilling its 2015 UWMP.
Table 2‐4: Water Supplier Information Exchange
The retail supplier has informed the following wholesale supplier(s) of projected water use in accordance with CWC 10631.
Imperial Irrigation District

City of El Centro 2015 Urban Water Management Plan Chapter 3
3-1
3 SYSTEM DESCRIPTION 3.1 GENERAL DESCRIPTION 3.1.1 2012 Imperial Region Integrated Regional Water Management Plan
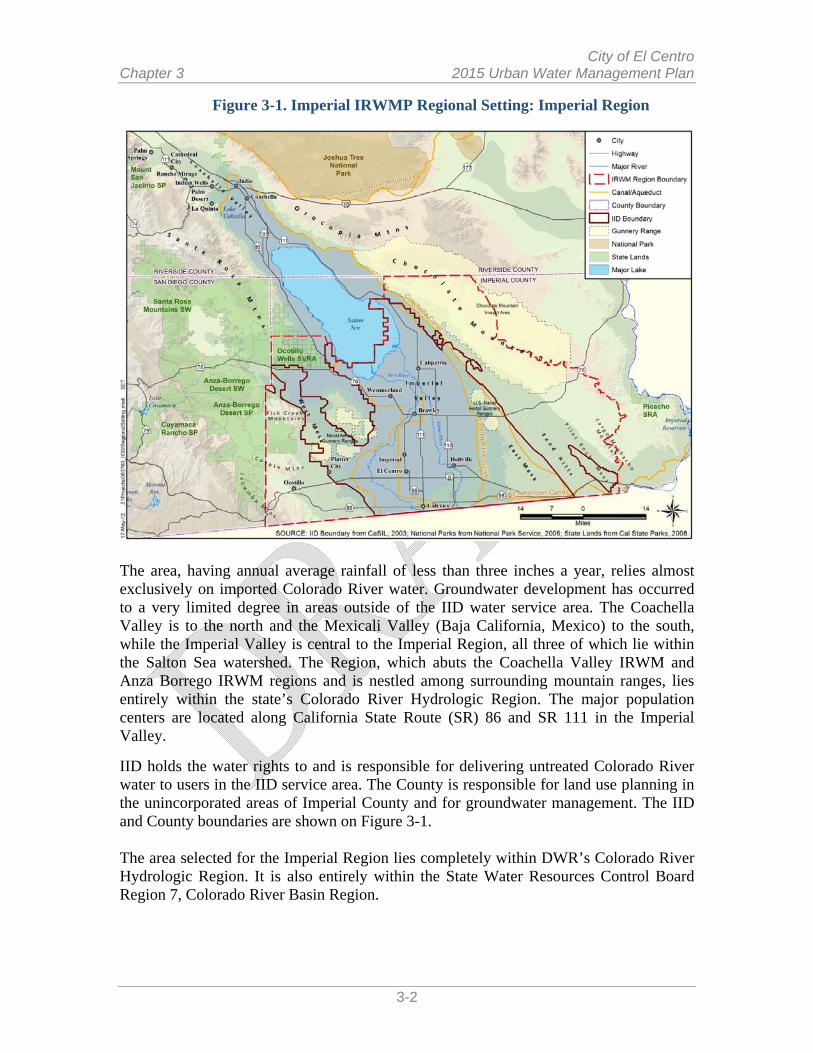
A primary resource for the preparation of the 2015 UWMP for the City of El Centro is the 2012 Imperial Integrated Regional Water Management Plan (Imperial IRWMP or IRWMP) prepared by Imperial County (County), the Imperial Irrigation District (IID), with participation from other Water Forum members that includes the City of El Centro. The purpose of the Imperial IRWMP is to define a portfolio of cost-effective water management strategies that support economic development and provide a reliable water supply for new municipal, commercial, and industrial (MCI) demands without impacting historical MCI and agricultural uses of water or impacting existing agreements or contracts. The IRWMP is to guide action on resource management strategies and projects to be implemented by participating agencies and stakeholder groups in order to meet the Region’s water management goals and objectives. The IRWMP is also a resource the Imperial Region can use to define its long-term needs and priorities for water infrastructure, and match these needs to available state and federal funding. In the near-term, the purpose of the IRWMP is to ensure that the Imperial Region qualifies for funding available from the State of California by meeting IRWMP standards by the State Legislature and managed by DWR The Imperial IRWMP regional setting is defined by the boundary set forth as the “Imperial Region”. The Imperial Region is located in the southeast corner of Imperial County – bordered to the east by the crest of the Chocolate Mountains (which lie west of the Colorado River), to the west by San Diego County, to the north by the Coachella Valley IRWM boundary, the Salton Sea and Riverside County, and to the south by the U.S./Mexico international border. Figure 3-1 shows the location of the Imperial Region. The Imperial Region boundaries were selected for the following reasons:
Imperial Water Forum members have experience working together to address complex issues, so they will be well equipped to develop an IRWMP.
Urban and rural development of the Imperial Valley tie together IID, the County, and the Cities that are working together to better integrate land use and water supply plans and the planning process.
Primary conflicts within the region related to new water demands and future land use changes are intensified by issues surrounding the cap on Colorado River supplies, the approach to apportioning water supplies, and competing uses within the Imperial Valley.
The Imperial Region presents opportunities for recycled and reclaimed water use because of the geographic proximity of its users.
The Imperial Region has opportunities to help the state meet its renewable energy goals by developing geothermal and solar generating facilities.
City of El Centro Chapter 3 2015 Urban Water Management Plan
3-2
Figure 3-1. Imperial IRWMP Regional Setting: Imperial Region
The area, having annual average rainfall of less than three inches a year, relies almost exclusively on imported Colorado River water. Groundwater development has occurred to a very limited degree in areas outside of the IID water service area. The Coachella Valley is to the north and the Mexicali Valley (Baja California, Mexico) to the south, while the Imperial Valley is central to the Imperial Region, all three of which lie within the Salton Sea watershed. The Region, which abuts the Coachella Valley IRWM and Anza Borrego IRWM regions and is nestled among surrounding mountain ranges, lies entirely within the state’s Colorado River Hydrologic Region. The major population centers are located along California State Route (SR) 86 and SR 111 in the Imperial Valley.
IID holds the water rights to and is responsible for delivering untreated Colorado River water to users in the IID service area. The County is responsible for land use planning in the unincorporated areas of Imperial County and for groundwater management. The IID and County boundaries are shown on Figure 3-1. The area selected for the Imperial Region lies completely within DWR’s Colorado River Hydrologic Region. It is also entirely within the State Water Resources Control Board Region 7, Colorado River Basin Region.
City of El Centro 2015 Urban Water Management Plan Chapter 3
3-3
The Urban Area designation on the County’s Land Use Plan includes areas surrounding seven incorporated cities: El Centro, Brawley, Calexico, Calipatria, Holtville, Imperial, and Westmorland. These Cities and the County have authority over land use, authority to adopt General Plans and zoning to guide land use, prepare Urban Water Management Plans to guide use of their available water supplies where required to do so, and to act as lead agency pursuant to the California Environmental Quality Act (CEQA). Imperial Region includes five unincorporated communities: Niland to the north; Heber, Seeley, and the El Centro Naval Air Facility in the center; and Ocotillo/Nomirage in the West Mesa area.
3.1.2 Colorado River Water Supply via Imperial Irrigation District
Colorado River water via the Imperial Irrigation District (IID) is the primary water supply for the Imperial Region. The IID service area, lying entirely within Imperial Valley, is divided into four units: Imperial, West Mesa, East Mesa, and Pilot Knob, with a gross area of 1,061,637 acres. The City of El Centro and the City’s Sphere of Influence is located within the Imperial Unit of IID’s service area. The Imperial Unit of IID, serves an area of 699,092 acres including the seven major urban areas and approximately, a quarter of Imperial County's unincorporated area.
The East Mesa and West Mesa areas use groundwater that is outside of the IID water service area, but inside the Imperial Region.
Surface water imported from the Colorado River by IID is used to meet all current agricultural and non-agricultural water demands in the IID water service area. Non-agricultural includes municipal, commercial, and industrial including renewable energy; environmental; and recreational water users. IID is a wholesale water provider that delivers untreated (raw) water to individual user accounts. The cities are retail water purveyors that treat and convey Colorado River water to retail water accounts.
The seven major urban areas within the IID water service area are the cities of El Centro, Brawley, Calexico, Calipatria, Holtville, Imperial, and Westmorland. Other urban areas within the IID water service area include the unincorporated communities of Heber, Seeley, Niland, the Naval Air Facility at El Centro (NAF El Centro), and two California Department of Corrections and Rehabilitation Facilities (CDCR). The community of Ocotillo/Nomirage is located within the area of West Mesa, and currently uses groundwater. The total population of these cities and communities are expected to increase significantly through the year 2050, subsequently increasing urban water demand.
Rainfall is less than three inches per year and does not contribute to IID water delivery, although at times it does increase or reduce agricultural water demand. Groundwater in the Imperial Valley is of poor quality and is generally unsuitable for domestic or irrigation purposes, though some is pumped for industrial (geothermal) use. Additionally, tile drains are used to dewater the root zone to avoid agricultural root zone contamination, the tile drain and other drainage waters ultimately discharge to the Salton Sea.
City of El Centro Chapter 3 2015 Urban Water Management Plan
3-4
All water supply for the City of El Centro comes from untreated Colorado River water imported and delivered by IID through a canal system. The raw water is then treated at the City’s water treatment plant, stored, and then pumped into the City’s water distribution system.
3.1.2 City of El Centro
The City of El Centro is located in Imperial County, approximately 120 miles east of San Diego, at the intersection of Interstate 8 and Highway 86. The City encompasses an area of 11.019 square miles (7,052 acres). The Imperial County seat is located in the City of El Centro. The population inside the City boundaries was 44,847 on January 1, 2015 as reported by the California Department of Finance (DOF). The City is the largest city and principal trading center in the County
The City has defined a Sphere of Influence (SOI) and has included this land in their land use planning (Planning Area) and also their Urban Development Program to facilitate residential, industrial, and business growth in those areas where public services are available and to provide a variety of growth locations so that an adequate supply of developable land will maintain reasonable housing costs and promote economic development.
The City’s incorporated and SOI boundaries are shown on Figure 3-2. In all, the City’s SOI consists of approximately 16,000 acres of land bound on the north by the Central Drain/Treshill Road, the south by McCabe Road, the east by State Route 111, and the west by Austin Road. The City of Imperial is located directly north of the City’s northern SOI boundary. The unincorporated township of Heber is located directly south of the City’s southern SOI boundary.
The City’s SOI outside the existing boundaries of the City is currently in the jurisdiction of the County, but is planned for incorporation into the City boundaries at some time in the future.
Much of the land surrounding the City is involved in agricultural uses, as farming has historically been a principal component of the region’s economy. The General Plan does not contain an exclusive agricultural land use designation, but agricultural uses are allowed within the Rural Residential designation. It is generally the City’s policy to allow continuation of existing agricultural activity on land while planning for the development of this land for other uses.

City of El Centro 2015 Urban Water Management Plan Chapter 3
3-5
Figure 3-2: City and Sphere of Influence Boundaries Map

City of El Centro Chapter 3 2015 Urban Water Management Plan
3-6
3.1.2.1 City Water System Description
IID is the regional water supplier in the Imperial Valley, delivering wholesale, raw Colorado River water to all agricultural lands and urban water retailers within its water service area including the City of El Centro. The City of El Centro receives all of its water supply from the Colorado River through IID’s All-American Canal and Central Main Canal. The South Date Canal and the Dahlia Lateral Number 1 deliver the raw water to the City from the Central Main Canal at a combined supply capacity of 31.6 MGD.
The raw water is stored in four open, concrete reservoirs, each rated at 12.5 MG for a total City raw water storage capacity of 50 MG. The raw water is treated to potable water standards at the City’s water treatment plant. Water treatment includes clarification, filtration, and chlorination. Potable water is stored in three reservoirs at the treatment plant with a combined storage capacity of 10.0 MG, and in one 4.0 MG reservoir located approximately two miles northwest of the treatment plant (total potable water storage capacity of 14.0 MG). Potable water is pumped from the potable water reservoirs into the distribution system.
3.2 SERVICE AREA BOUNDARY MAPS The boundaries of the City and the City’s Sphere of Influence, along with existing and planned land use, within these boundaries are shown on Figure 3-2. The area within the City boundaries is currently estimated to be approximately 70 percent developed, and the total area within the SOI boundary is estimated to be approximately 30 percent developed. However, almost all of the land developed outside the City boundaries and within the City’s SOI boundaries is currently serviced by other water supplies, i.e. private wells. The City reports that of the 9,906 water service connections in the City’s water service area in 2015, only 8 were outside the City boundaries and only one of these connections was residential. Hence, the City’s water service area now coincides with the City’s incorporated boundaries.
3.3 SERVICE AREA CLIMATE Located within the Imperial Valley, the City of El Centro is part of an arid desert area, characterized by hot, dry summers and mild winters. Summer temperatures typically exceed 100 degrees Fahrenheit (oF), and the winter low temperatures rarely drop below 32 oF.
The average monthly evapotranspiration, rainfall, and temperatures are listed in Table 3-1A. As shown, the average high and low temperatures for this area are 88.8 oF and 56.7 oF dating back to 1932, and the average rainfall is 2.64 inches. The majority of the rainfall occurs from December through March. Periodic summer thunderstorms are common in the region. The Standard average evapotranspiration (ETo) for this area is 74.5 inches dating back to 2001.

City of El Centro 2015 Urban Water Management Plan Chapter 3
3-7
Imperial Valley elevations range from a few feet above to 273 feet below mean sea level (MSL). The U.S./Mexico border, located at the southern end of Imperial Valley, has an elevation of four feet above MSL. The Salton Sea, located at the northern end of Imperial Valley, has a water level of 230 feet below MSL (the sea bottom is 273 feet below MSL). El Centro is the largest American city to lie entirely below sea level (39 feet below MSL on average).
The relatively flat topography (235 feet in 35 miles) of the Imperial Valley and surrounding areas, in conjunction with strong night and day temperature differentials, particularly in the summer months, produce moderate winds and deep thermal circulation systems. The thermal systems facilitate general dispersion of the air.
Table 3‐1A Historical City Climate Characteristics
Month
Standard Average ETo(a)
(inches)
Average Rainfall(b) (inches)
Daily Max Temperature(b) (degrees F)
Daily Min Temperature(c) (degrees F)
January 2.77 0.42 69.9 40.1
February 3.75 0.35 73.8 43.7
March 6.13 0.23 79.6 48.1
April 7.86 0.07 86.5 53.3
May 9.01 0.01 94.8 60.2
June 9.85 0.00 103.2 67.4
July 9.14 0.09 108.0 75.8
August 8.14 0.32 106.7 76.3
September 6.96 0.26 102.5 69.8
October 5.30 0.28 91.7 58.6
November 3.34 0.18 78.8 46.9
December 2.23 0.41 70.1 40.2
Annual 74.48 2.64 88.8 56.7
a) Standard Average ETo from California Irrigation Management Information System (CIMIS) Station 68, Seeley, CA. Station 68 is CIMIS station closest to the city of El Centro; Average for 5/29/1987 through 12/31/2015.
b) Data obtained from Western Regional Climate Center (WRCC), Desert Research Institute, Reno, Nevada (http://www.wrcc.dri.edu/cgi-bin/cliMAIN.pl?ca2713); WRCC program administered by the National Oceanic and Atmospheric Administration (NOAA); data extracted from monitoring Station 042713 at El Centro 2 SSW, CA for period 3/01/1932 through 1/20/2015.
3.4 SERVICE AREA POPULATION AND DEMOGRAPHICS 3.4.1 Service Area Population
The City reports that of the 9,906 water service connections in the City’s water service area in 2015, only 8 were outside the City boundaries and only one of these connections was residential. As it is concluded that there is a 95 percent match between the City and water service area boundaries, DOF population estimates were used to calculate SB7x7 water use targets as presented in Chapter 5.

City of El Centro Chapter 3 2015 Urban Water Management Plan
3-8
Historical and current City population as reported by the City Planning Department in the City of El Centro 2013-2021 Housing Element, and also by the DOF is shown in Table 3-1A. The City’s population has grown 42.9% since 1990.
The area within the City boundaries is currently estimated to be approximately 70 percent developed, and the total area within the SOI boundary is estimated to be approximately 30 percent developed. However, almost all of the development outside the City boundaries and within the City’s SOI boundaries are currently serviced other water supplies, i.e. private wells, etc.
By 2040, a significant percentage of this land inside the SOI will be developed and will receive water service from the City. To identify those areas that will require more extensive planning, ensuring the provision of adequate levels of public services and facilities including water system infrastructure, the City has divided the undeveloped portion of their Planning Area into three development tier areas as discussed in Section 3.4.2
Table 3‐1B: Historical & Current Population
Area 1990 2000 2010 2015
City 31,384 37,835 42,598 44,847
% Increase(a) ‐ 20.6% 35.7% 42.9%
a) Relative to 1990
The Southern California Association of Government’s (SCAG) Draft 2016-2040 Regional Transportation Plan/Sustainable Communities Strategy (2016 RTP/SCS) projected the City’s urban area population would grow to 60,933 by 2040, which is an increase of 36.0% relative to 2015. The SCAG population projections for the City’s urban area for the years 2020 through 2040, which are recognized and used by the City’s Planning Department, are shown in Table 3-1B.
Table 3‐1C: Current and Projected Population
Population Served
2015 2020 2025 2030 2035 2040
44,847 53,176 55,100 57,025 58,948 60,993
% Increase(a) ‐ 18.6% 22.9% 27.2% 31.4% 36.0%
a) Relative to 2015
3.4.2 Water-Use-Related Land Use Planning
As discussed in Section 3.4.1, the City’s population increased 42.9% between 1990 and 2015 and is projected to increase another 36.0% by 2040. Such growth necessitates well-conceived land use planning by the City.

City of El Centro 2015 Urban Water Management Plan Chapter 3
3-9
Existing land use in the City is governed by the provisions of the City of El Centro Zoning Ordinance and is guided by the goals and policies presented in the General Plan. By implementing the language of the General Plan Land Use Element, the City dictates what type of land uses are allowed throughout specific areas within its boundaries. The General Plan Land Use Element lists the following land use designations: Rural Residential, Low Density Residential, Medium Density Residential, High Medium Density Residential, General Commercial (includes Neighborhood Commercial, Office Commercial, and Heavy Commercial), Tourist Commercial, Downtown Commercial, General Industrial (includes Light Manufacturing and General Manufacturing), Planned Industrial, Civic, and Public. Land use designations within the City and SOI boundaries are also shown on Figure 3-2.
To identify those areas that will require more extensive planning, ensuring the provision of adequate levels of public services and facilities, the City has divided the undeveloped portion of the Planning Area into three development tier areas: Tier I, Tier II, and Tier III.
Designation of an area in one of the three tiers does not determine the sequence of development within the Planning Area, but rather, delineates those areas that, due to a lack of public facilities, may require more detailed planning prior to development. For example, development in Development Tier II and III may require a greater cost for infrastructure improvements than would the same development if located within the Development Tier I area since Tier I has greater access to existing public services and facilities.
Tier II and III areas may also require that facilities be sized, at developer expense, to accommodate additional development within an entire Tier Subarea (described below), or such larger area as may be required by the City. Reimbursement agreements, improvement districts, and other public finance strategies may be used to cost-effectively provide needed public infrastructure, as deemed necessary by the City Council.
Development Tier I: Current Urban Service Area: Development Tier I includes land within and adjacent to the present City limits. In most cases, new development within this area can be served by gravity sewer lines to existing trunk sewers. Generally, water lines and reservoirs are also adequate to serve new development; however, easements and financial contributions to improve the ultimate sewer and water systems may be required.
Fire, police, schools, parks, library, medical, roads, and other City services are also in proximity to these areas, though service capacities are likely to be limited and improvements to existing facilities and/or new facilities may be needed to adequately accommodate new development. Subdivisions of land and commercial or industrial development within this area would generally follow standard zoning, subdivision, and environmental review procedures and would not require a Community Facilities Study.

City of El Centro Chapter 3 2015 Urban Water Management Plan
3-10
Development Tier II: Planned Urban Service Area: Development Tier II includes land both within and adjacent to the City limits, but differs from Development Tier I in that public infrastructure to serve new development is more limited. Essential required improvements may include sewer and water pump stations, water storage reservoirs, and sewer trunk lines or force mains. New schools, parks, roadway improvements, and fire stations may also be required to adequately serve development of Development Tier II areas.
As with Development Tier I areas, additional service capacity for police, library, medical, and other City services may also be needed to accommodate new development. Preparation of a Community Facilities Study shall be required for most development projects within Development Tier II areas, including residential subdivisions, multi-family projects, and commercial or industrial development, unless as otherwise exempted as described in the Community Facilities Study Requirements and Exemptions.
Development Tier III: Future Urban Service Area: Development Tier III encompasses unincorporated lands that are not anticipated to be developed for at least ten years, If development other than agriculture and related businesses or residential subdivisions of five or few parcels is proposed, within currently unincorporated portions of Development Tier III areas, the developer or subdivides shall be required to obtain concurrence of the City to allow the project, and the improvement of all public facilities shall be provided by the developer to City standards. Uses that do not require treated water from, or disposal of sewage to City systems, may be permitted. Subdivision of land and commercial or industrial development with this area would require that a Community Facilities Study be prepared, unless otherwise exempted, as described below. In addition, if a project is proposed within the Development Tier III area, a Development Tier Subarea shall be established by the City for which a Community Facilities Study shall be prepared, as described below.
Development Tier Subarea: A Development Tier Subarea will be established for development projects proposed in the Development Tier III area to allow for the planning for water and sewer services through the preparation of a Community Facilities Study. This is not required for development in the Development Tiers I and II areas since the City's Water and Sewer Master Plans delineate water and sewer improvements needed to serve those areas.
The City’s water and sewer master plans will be used to evaluate a development project’s water and sewer needs and the impact of those needs on the City’s water and sewer systems.
The City prepared a Service Area Plan (SAP) dated February 2016 in accordance with the Cortese-Knox-Hertzberg Local Government Reorganization Act of 2000, which requires that a plan identifying the existing and projected demand for public facilities and services (including water system facilities and water service) be prepared by all incorporated cities and special districts within the State.
City of El Centro 2015 Urban Water Management Plan Chapter 3
3-11
The 2000 legislation is implemented by Imperial County Local Agency Formation Commission (LAFCo), whose policy states that a city within the jurisdiction of Imperial County LAFCo must prepare an SAP for any formal annexation of land into the city’s boundaries take place. The City’s SOI outside the existing boundaries of the City is currently in the jurisdiction of the County, but all land outside the City boundaries and inside the SOI boundaries is planned for future incorporation into the City boundaries.
The City has developed 11 General Plan land use designations and five sub-designations within the Planning Area and a corresponding indication of maximum density or intensity of development. The maximum allowable development on individual parcels is governed by these measures of density or intensity, which are intended as policy-level guidance for future development within the City. These and other General Plan land use policies are implemented through the City’s Zoning Ordinance. The City will revise its Zoning Code to ensure consistency with the land uses described in this Element.
The Residential categories include four designations that allow for a range of housing types and densities, including Rural Residential, Low Density Residential, Medium Density Residential, and High-Medium Residential. These designations provide a range of densities to ensure compatibility with existing residential development: provide a range of housing types and prices; and allow for appropriate densities around areas that are not appropriate for higher population densities, such as the area around the sewer plant.
The non-residential land use categories include a variety of designations such as Commercial, Industrial, and Community Facilities. The General Commercial designation includes three subcategories: Neighborhood Commercial, Office Commercial, and Heavy Commercial, which are defined geographically on the Zoning Map. The General Industrial category includes two subcategories: Light Manufacturing and General Manufacturing, both of which are also geographically defined on the Zoning Map. The Downtown Commercial applied in the downtown area. This designation is included to ensure that the land uses occurring in the downtown area are appropriate to support the continued commercial viability of the area. The Community Facilities designations include Civic and Public, which allow for the provision of important public facilities.
For various reasons, many parcels in the community have not been developed to their maximum density or intensity. In the future, maximum development can be expected to occur only on a limited number of parcels. Therefore, the overall future development of the City is anticipated to occur at the average level of development intensity or density. This does not mean that developers can only develop at the average density and intensify, but the average development projection allows the City to plan for future public services to support anticipated future development.
In the City’s Land Use Element, the term density is used for residential uses and refers to the population and development capacity of residential land and is described in terms of dwelling units per net acre of land (du/acre), exclusive of existing and proposed streets and rights-of-way.

City of El Centro 2015 Urban Water Management Plan Chapter 4
4-1
4 SYSTEM WATER USE 4.1 RECYCLED VERSUS POTABLE AND RAW WATER DEMAND
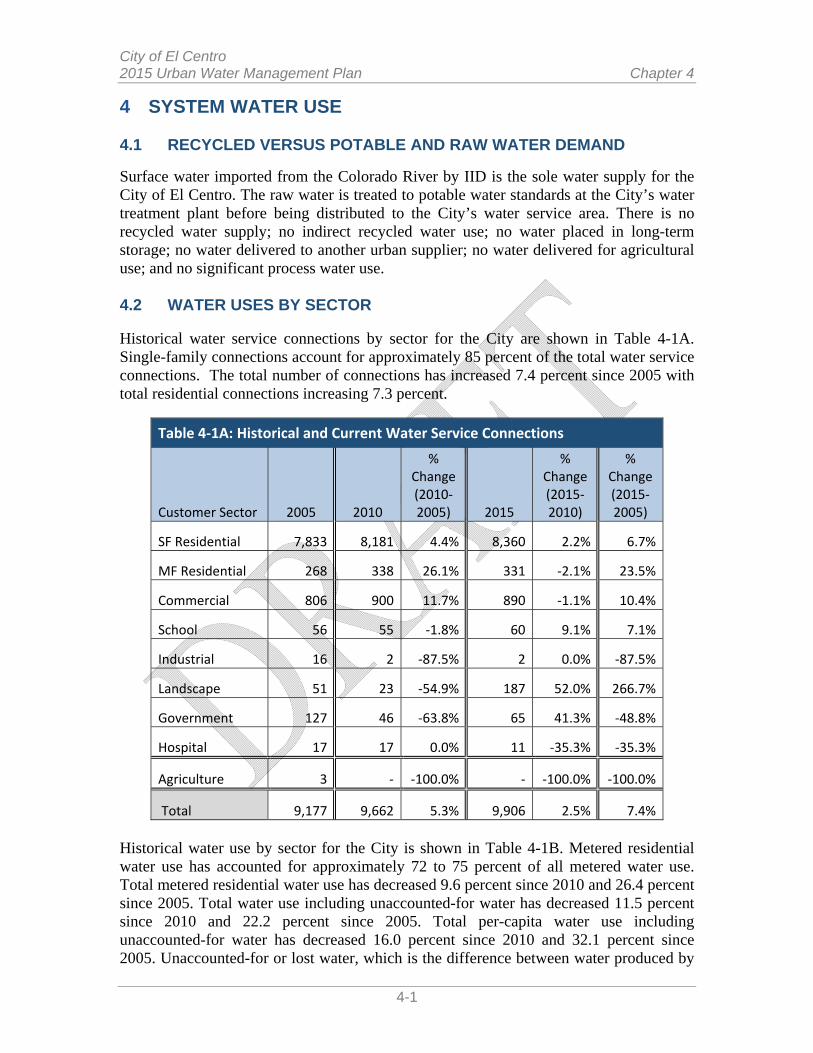
Surface water imported from the Colorado River by IID is the sole water supply for the City of El Centro. The raw water is treated to potable water standards at the City’s water treatment plant before being distributed to the City’s water service area. There is no recycled water supply; no indirect recycled water use; no water placed in long-term storage; no water delivered to another urban supplier; no water delivered for agricultural use; and no significant process water use. 4.2 WATER USES BY SECTOR Historical water service connections by sector for the City are shown in Table 4-1A. Single-family connections account for approximately 85 percent of the total water service connections. The total number of connections has increased 7.4 percent since 2005 with total residential connections increasing 7.3 percent.
Table 4‐1A: Historical and Current Water Service Connections
Customer Sector 2005 2010
% Change (2010‐2005) 2015
% Change (2015‐2010)
% Change (2015‐2005)
SF Residential 7,833 8,181 4.4% 8,360 2.2% 6.7%
MF Residential 268 338 26.1% 331 ‐2.1% 23.5%
Commercial 806 900 11.7% 890 ‐1.1% 10.4%
School 56 55 ‐1.8% 60 9.1% 7.1%
Industrial 16 2 ‐87.5% 2 0.0% ‐87.5%
Landscape 51 23 ‐54.9% 187 52.0% 266.7%
Government 127 46 ‐63.8% 65 41.3% ‐48.8%
Hospital 17 17 0.0% 11 ‐35.3% ‐35.3%
Agriculture 3 ‐ ‐100.0% ‐ ‐100.0% ‐100.0%
Total 9,177 9,662 5.3% 9,906 2.5% 7.4%
Historical water use by sector for the City is shown in Table 4-1B. Metered residential water use has accounted for approximately 72 to 75 percent of all metered water use. Total metered residential water use has decreased 9.6 percent since 2010 and 26.4 percent since 2005. Total water use including unaccounted-for water has decreased 11.5 percent since 2010 and 22.2 percent since 2005. Total per-capita water use including unaccounted-for water has decreased 16.0 percent since 2010 and 32.1 percent since 2005. Unaccounted-for or lost water, which is the difference between water produced by

City of El Centro Chapter 4 2015 Urban Water Management Plan
4-2
the City’s treatment plant and water billed to customers was 6.6 percent in 2005; 10.4 percent in 2010; and 7.9 percent in 2015.
Table 4‐1B: Historical Water Use and Water Loss
2005 Water Use/ Supply
2010 Water Use/ Supply
% Change (2010‐2005)
2015 Water Use/ Supply
% Change (2015‐2010)
% Change (2015‐2005)
Single‐Family Residential
5,352
4,399 ‐17.8%
3,870 ‐12.0% ‐27.7%
Multi‐Family Residential
1,056
822 ‐22.2%
848 3.2% ‐19.7%
Total Residential 6,408 5,221 ‐18.5% 4,719 ‐9.6% ‐26.4%
Population 39,147 42,598 8.8% 44,847 5.3% 14.6%
Residential Per‐Capita (gpcd)
146.1
109.4 ‐25.1%
93.9 ‐14.2% ‐35.7%
Commercial 1,228 1,295 5.5% 906 ‐30.0% ‐26.2%
School 177 117 ‐33.9% 124 6.0% ‐29.9%
Industrial 123 5 ‐95.9% 1 ‐79.7% ‐99.2%
Landscape 157 235 49.7% 519 121.0% 230.8%
Government 400 311 ‐22.3% 238 ‐23.5% ‐40.5%
Hospital 51 23 ‐54.9% 45 95.7% ‐11.8%
Unaccounted 608 839 38.0% 565 ‐32.7% ‐7.1%
Total Water Use 9,152 8,046 ‐12.1% 7,117 ‐11.5% ‐22.2%
Total Per‐Capita (gpcd)
208.7
168.6 ‐19.2%
141.6 ‐16.0% ‐32.1%
Water Supply 9,152 8,046 ‐12.1% 7,117 ‐11.6% ‐22.2%
Water Loss 608 839 565
Water Loss %(a) 6.6% 10.4% 7.9%
(a) Including unbilled and unmetered water use typically used for fighting fires, flushing water mains, conducting fire flow tests, etc.
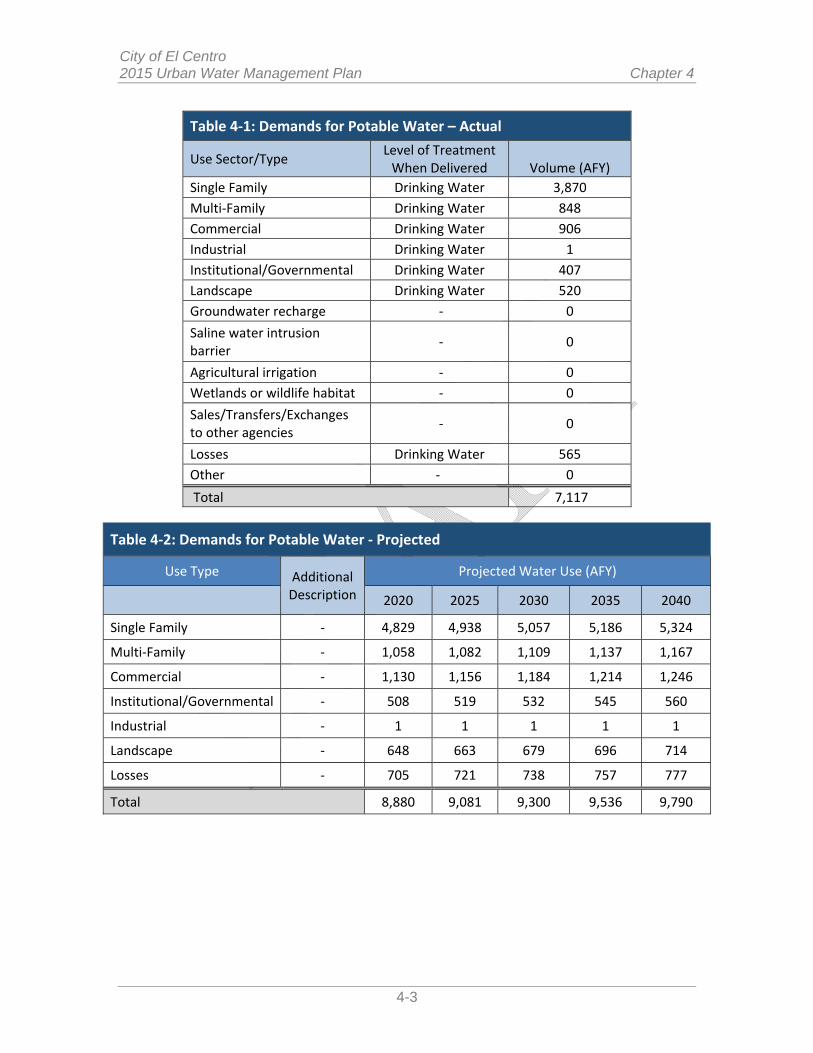
Calendar year 2015 retail water demands for the City (as drinking water) by water use sector is shown in Table 4-1. Projected water demands for the City (as drinking water) by water use sector is shown in Table 4-2. The methodology for estimating projected demands is discussed in Section 4.4. Total projected water demands for the City is shown in Table 4-3. Surface water imported from the Colorado River by IID is the sole water supply for the City of El Centro. The raw water is treated to potable water standards at the City’s water treatment plant before being distributed to the City’s water service area. There is no recycled water supply and no indirect recycled water use projected for the City.
City of El Centro 2015 Urban Water Management Plan Chapter 4
4-3
Table 4‐1: Demands for Potable Water – Actual
Use Sector/Type Level of Treatment When Delivered
Volume (AFY)
Single Family Drinking Water 3,870
Multi‐Family Drinking Water 848
Commercial Drinking Water 906
Industrial Drinking Water 1
Institutional/Governmental Drinking Water 407
Landscape Drinking Water 520
Groundwater recharge ‐ 0
Saline water intrusion barrier
‐ 0
Agricultural irrigation ‐ 0
Wetlands or wildlife habitat ‐ 0
Sales/Transfers/Exchanges to other agencies
‐ 0
Losses Drinking Water 565
Other ‐ 0
Total 7,117
Table 4‐2: Demands for Potable Water ‐ Projected
Use Type Additional Description
Projected Water Use (AFY)
2020 2025 2030 2035 2040
Single Family ‐ 4,829 4,938 5,057 5,186 5,324
Multi‐Family ‐ 1,058 1,082 1,109 1,137 1,167
Commercial ‐ 1,130 1,156 1,184 1,214 1,246
Institutional/Governmental ‐ 508 519 532 545 560
Industrial ‐ 1 1 1 1 1
Landscape ‐ 648 663 679 696 714
Losses ‐ 705 721 738 757 777
Total 8,880 9,081 9,300 9,536 9,790
City of El Centro Chapter 4 2015 Urban Water Management Plan
4-4
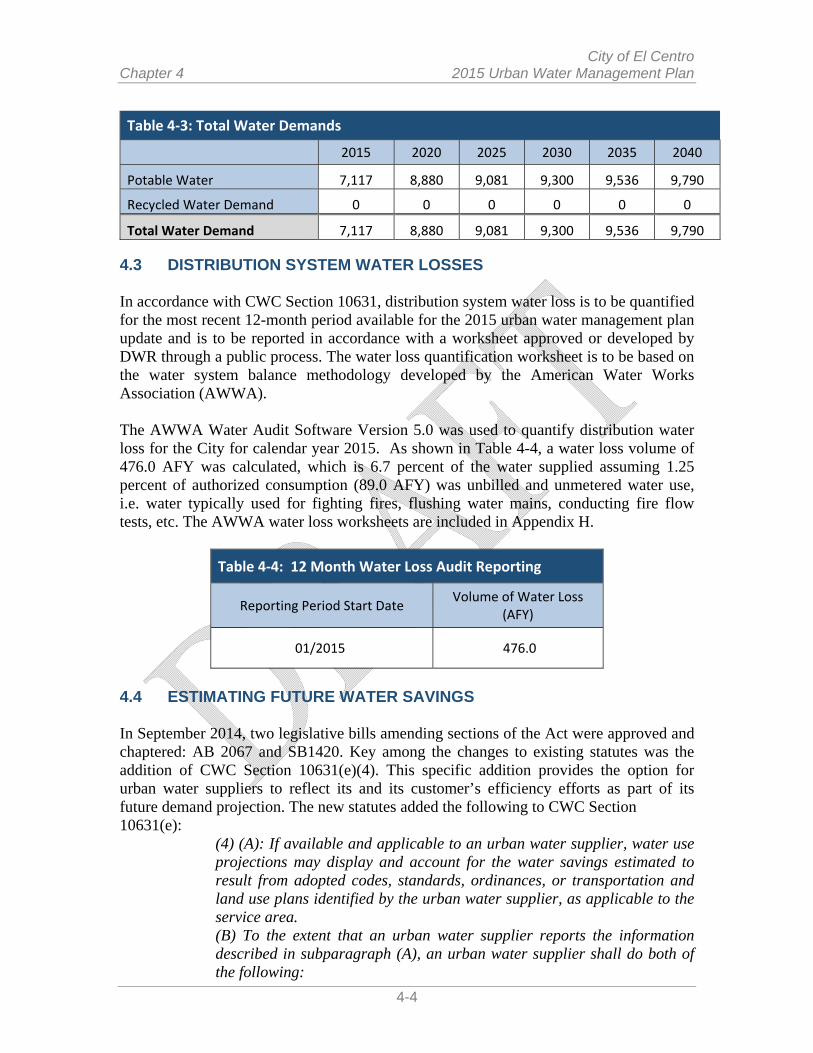
Table 4‐3: Total Water Demands
2015 2020 2025 2030 2035 2040
Potable Water 7,117 8,880 9,081 9,300 9,536 9,790
Recycled Water Demand 0 0 0 0 0 0
Total Water Demand 7,117 8,880 9,081 9,300 9,536 9,790 4.3 DISTRIBUTION SYSTEM WATER LOSSES In accordance with CWC Section 10631, distribution system water loss is to be quantified for the most recent 12-month period available for the 2015 urban water management plan update and is to be reported in accordance with a worksheet approved or developed by DWR through a public process. The water loss quantification worksheet is to be based on the water system balance methodology developed by the American Water Works Association (AWWA). The AWWA Water Audit Software Version 5.0 was used to quantify distribution water loss for the City for calendar year 2015. As shown in Table 4-4, a water loss volume of 476.0 AFY was calculated, which is 6.7 percent of the water supplied assuming 1.25 percent of authorized consumption (89.0 AFY) was unbilled and unmetered water use, i.e. water typically used for fighting fires, flushing water mains, conducting fire flow tests, etc. The AWWA water loss worksheets are included in Appendix H.
Table 4‐4: 12 Month Water Loss Audit Reporting
Reporting Period Start Date Volume of Water Loss
(AFY)
01/2015 476.0
4.4 ESTIMATING FUTURE WATER SAVINGS In September 2014, two legislative bills amending sections of the Act were approved and chaptered: AB 2067 and SB1420. Key among the changes to existing statutes was the addition of CWC Section 10631(e)(4). This specific addition provides the option for urban water suppliers to reflect its and its customer’s efficiency efforts as part of its future demand projection. The new statutes added the following to CWC Section 10631(e):
(4) (A): If available and applicable to an urban water supplier, water use projections may display and account for the water savings estimated to result from adopted codes, standards, ordinances, or transportation and land use plans identified by the urban water supplier, as applicable to the service area. (B) To the extent that an urban water supplier reports the information described in subparagraph (A), an urban water supplier shall do both of the following:
City of El Centro 2015 Urban Water Management Plan Chapter 4
4-5
(i) Provide citations of the various codes, standards, ordinances, or transportation and land use plans utilized in making the projections. (ii) Indicate the extent that the water use projections consider savings from codes, standards, ordinances, or transportation and land use plans. Water use projections that do not account for these water savings shall be noted of that fact.
4.4.1 Reduced City Water Use Since 2005
Through the implementation of City water conservation ordinances and measures discussed in Chapter 9, and as shown in Table 4-1B, total City of El Centro per-capita water use has decreased 16.0 percent since 2010 and 32.1 percent since 2005; and residential per-capita water has decreased 14.2 percent since 2010 and 35.7 percent since 2005. In April 2015, Governor Jerry Brown issued an executive order requiring the State Water Resources Control Board to implement measures to cut the State’s overall water usage by 25% due to the continuing drought. The executive order mandates a 25% reduction in supply to California’s approximately 400 water agencies and requires water agencies and cities to reduce water use 25% (on average) below 2013 levels by the end of February 2016, with usage reported to the State by water suppliers. Cities and water agencies were assigned various reduction goals, and the City of El Centro’s reduction goal was set at 24%. City water use has decreased a cumulative 12.9 percent for the first eight recording months (June 2015 through February 2016) relative to year 2013 water usage in response to the City’s conservation goal set by the State, which has been extended to October 2016 or as long as the drought continues.
4.4.2 Reduced Future City Water Use due to Existing and Future Conservation Measures
Total per-capita City water use has significantly dropped from 208.7 gpcd in 2005 to 168.6 in 2010 to 141.6 in 2015 (a reduction of 32.16 percent). Residential per-capita City water use has also significantly dropped from 136.6 gpcd in 2005 to 103.1 in 2010 to 92.3 in 2015 (a reduction of 32.4 percent).
It is not known how long the current drought will last or when new droughts will start and end in the future. However, many of the water conservation measures already implemented and being implemented by City customers such as turf removal, conversion to drought resistance landscapes, conversion to more efficient irrigation systems and ET-based irrigation controllers, retrofits to high efficiency clothes washers and toilets, implementation of weather-based irrigation controllers, etc. will have permanent effects on water use (reduction) in the future. It is anticipated that once the drought ends, some water conservation will end, and per-capita water use will increase some relative to 2015 water use. However, it is also anticipated that a great deal of water conservation will remain due to permanent measures that have already been implemented for exiting City houses and development.

City of El Centro Chapter 4 2015 Urban Water Management Plan
4-6
As shown in Table 4-5A, it is estimated in this UWMP that total City per-capita water use will increase from 141.6 gpcd in 2015 to 167.4 in 2020 (approximately an 18 percent increase) for existing houses and development after the end of the drought, which is similar to the water use in 2010, and with a water loss similar to 2015 (8.0 percent). However, it is estimated that water conservation retrofits will continue for existing houses and development as aged plumbing and irrigation appurtenances are replaced over time, and that per-capita water use will decrease to 144.7 gpcd in 2040 (a reduction of approximately 14 percent). Water loss is estimated to remain at 8.0 percent for existing housing through 2040.
When preparing an UWMP, water resource engineers are tasked with evaluating historical water use trends resulting from past California droughts and using that information together with their engineering judgement to project future water usage patterns. Historical evidence typically shows that once a drought has ended, water usage tends to increase as water conservation mandates soften. Thus, assuming the current drought ends prior to the year 2020, historical precedents suggest water use will increase; not all the way back to the water use level of 2005 (per capita water use of 209), but rather back to water use levels in 2010 (169 gpcd). In other words, it is estimated that the year 2010 will become the “new normal” for Southern California.
Table 4‐5A: Historical & Projected City Per‐Capita Water Use
2005 2010 2015 2020 2040
Existing Households
Residential Per‐Capita (gpcd) 146.1 109.4 93.9 112.0 98.0
CII Per‐Capita(a) (gpcd) 48.7 41.6 36.5 43.0 36.0
Water Loss Per‐Capita (b)(gpcd)
13.9
17.6
11.2 12.4 10.7
Total Per‐Capita (gpcd) 208.7 168.6 141.6 167.4 144.7
New Households
Residential Per‐Capita (gpcd) ‐ ‐ ‐ 95.0 95.0
CII Per‐Capita (gpcd) ‐ ‐ ‐ 35.0 35.0
Water Loss Per‐Capita (gpcd) ‐ ‐ ‐ 7.8 10.4
Total Per‐Capita (gpcd) ‐ ‐ ‐ 137.8 140.4
(a) Commercial, industrial and institutional per-capita water use (b) Water loss was 6.6%, 10.4% and 7.9% in 2005, 2010, and 2015, respectively; and is
estimated to be 8.0% for existing development and ranging from 6.0% (2020) to 8.0% (2040) in the future for new development
City of El Centro 2015 Urban Water Management Plan Chapter 4
4-7
However, more significant future per-capita water use will occur for the City due to recently enacted statewide building code requirements and landscape ordinances impacting new residential developments as compared with previous residential land use. For example, California’s newly adopted green building code will have a direct impact on home building and water conservation in the State. The new code aims to cut indoor water consumption by at least 20 percent, primarily through more efficient indoor water fixtures. For a three-bedroom house, the saving is estimated to be about 10,000 gallons of water per year, on average.
The California Green Building program also includes outdoor water conservation by reducing the area devoted to high-irrigation lawns and plants, emphasizing natural drought-tolerant plantings, and installing irrigation controls that respond to local weather conditions. This is consistent with the new Model Water Efficient Landscape Ordinance (MWELO), which was adopted by the State on July 15, 2015. An earlier version of MWELO was also previously incorporated into Section 29-142 of the City’s Zoning Ordinance.2
As shown in Table 4-5A, total per-capita water use for new housing and development is estimated to range from at 137.8 (2020) to 140.4 (2040) gpcd for the planning period 2020 through 2040. A residential per-capita water use of 95 gpcd is estimated based on an estimated interior water use of 45.0 gpcd and an exterior water use of 50.0 gpcd consistent with new building codes and landscape ordinances for new residential developments. Future commercial, industrial, and institutional (CII) per-capita water use is estimated at 35.0 gpcd and water loss for new developments is estimated to range from 6.0 percent in 2020 to 8.0 percent in 2040.
Based on per-capita water use developed for existing and new housing and development in Table 4-5A, projected City water demands were developed and are shown in Table 4-5B. Total households for the City (and the City’s estimated water service area) is estimated at 199,000 in the SCAG 2016 Regional Transportation Plan (RTP), which is 6,749 households greater than the number of houses reported for the City by DOF in 2015. Based on 3.07 people per household and a population of 61,000 estimated for the City in 2040, the population for new households is estimated at 20,719 and the population for existing households is estimated at 40,7281 in 2040. As shown in Table 4-5B, total water use is estimated to increase from 7,117 AFY in 2015 to 9,790 AFY in 2040 (an increase of approximately 37.6 percent), which is all attributable to new development. Total per-capita water use is estimated to increase from 141.6 gpcd in 2015 to 164.8 in 2020, and then gradually decrease back to 143.2 gpcd in 2040. These per-capita water use projections are significantly less than the 2015 and 2020 SB X7-7 targets of 192.0 and 190.0 gpcd, respectively, developed for the City in this UWMP as detailed in Chapter 5. 4.5 WATER USE FOR LOWER INCOME HOUSEHOLDS For planning and funding purposes, the State Department of Housing and Community Development (HCD) categorizes households into five income groups based on the County Area Median Income (AMI): 2 The City of El Centro notified DWR by letter dated February 5, 2010 of this action.

City of El Centro Chapter 4 2015 Urban Water Management Plan
4-8
Extremely Low Income — up to 30 percent of AMI Very Low Income - 31 to 50 percent of AMI Low Income - 51 to 80 percent of AMI Moderate Income - 81 to 120 percent of AMI Above Moderate Income — greater than 120 percent of AMI
Combined, extremely low, very low, and low income households are often referred to as lower income household.
Table 4‐5B: Projected City Water Demands
2015 2020 2025 2030 2035 2040
Existing Households
Population
44,847
43,934
43,021
42,107
41,194
40,281
Total Per‐Capita Water Use (gpcd)
141.6 167.4
161.7
156.1
150.4 144.7
Water Use (AFY)
7,117
8,240
7,796
7,362
6,941
6,531
New Households
Population 0
4,144
8,288
12,431
16,575
20,719
Total Per‐Capita Water Use (gpcd) 0
137.8
138.5
139.1
139.8
140.4
Water Use (AFY) 0
640
1,286
1,937
2,595
3,259
Total Per‐Capita Water Use (gpcd)
141.6 164.8 158.0 152.2 147.3 143.2
Total Water Use (AFY)
7,117 8,880 9,081 9,300 9,536 9,790
State Housing Element law requires that a local jurisdiction accommodate a share of the region’s projected housing needs for the planning period. This share, called the Regional Housing Needs Allocation (RHNA), is important because State law mandates that a jurisdiction provide sufficient land to accommodate a variety of housing opportunities for all economic segments of the community. Compliance with this requirement is measured by the jurisdiction's ability in providing adequate land with adequate density and appropriate development standards to accommodate the RHNA. The Southern California

City of El Centro 2015 Urban Water Management Plan Chapter 4
4-9
Association of Governments (SCAG), as the regional planning agency, is responsible for allocating the RHNA to individual jurisdictions within the region. SCAG assigned a RHNA of 1,924 units to the City of El Centro for the 2014-2021 RHNA period, in the following income distribution: Extremely Low/Very Low Income: 487 units Low Income: 300 units Moderate Income: 297 units Above Moderate Income: 840 units The lower income households total 787 units, which are 40.9% of the SCAG-assigned units for 2014-2021. The City must ensure the availability of residential sites at adequate densities and appropriate development standards to accommodate these units by income category. The City has identified vacant land area to accommodate this housing, including 60.4 acres for lower income households. Assuming all 787 lower income housing units are built by 2021, and based on an estimated 3.25 people per dwelling unit and a per-capita residential water usage (including a water loss of 6.0 percent) of 100.0 gpcd (see Table 4-5A), the water demand increase for these 787 lower income housing units is estimated at 288.6 AFY, which is included in all demand projections in this Plan.
Table 4‐5: Inclusion in Water Use Projections
Are Future Water Savings Included in Projections? Yes
If "Yes" to above, state the section or page number where citations of the codes, ordinances, etc., utilized in demand projections are found.
Chapter 9 2015 UWMP
Are Lower Income Residential Demands Included In Projections? Yes
4.6 CLIMATE CHANGE As presented in the 2012 Imperial Integrated Regional Water Management Plan: Climate change predictions for the Imperial Region were derived by analyzing global climate model (GCM) simulations of past and future climate. Six future climatologies of precipitation, temperature, wind and evapotranspiration in Imperial Region were analyzed to assess the magnitude of predicted climate change. The six climatologies are comprised of three different future greenhouse gas emission scenarios that were simulated using two different GCMs. For the Imperial Region, the results indicate more variation in magnitude of future changes between the two GCMs, than among future emission scenarios. Thus, future climate studies should focus on using more GCMs to capture a full range of variability. All climate model runs predict increases in temperature, with greater increases in minimum temperatures (2 percent to 14 percent) than in maximum temperatures (1 percent to 5 percent). The largest predicted increases in minimum temperatures occur in
City of El Centro Chapter 4 2015 Urban Water Management Plan
4-10
winter and fall. Seasonal patterns of increase in maximum temperature are less consistent across model runs. The narrowing of the range of daily temperatures impacts both wind speed and evapotranspiration. Predicted changes in wind range from decreases of 3 percent to increases of 2 percent. While most model runs predicted small increases of less than 4 percent in evapotranspiration, a few predict evapotranspiration decreases, likely due to decreases in wind speed. However, all model runs consistently predict higher evapotranspiration rates in summer. The predicted warming will impact crop development and water use, since plants have different water requirements at each growth stage. Growing degree day (GDD) is used as the primary measure for assessing plant development under the influence of heat. GDD is computed by summing mean daily temperatures in excess of 46oF, up to a daily temperature maximum of 90oF. GDD is accumulated from the beginning of the season and is used to predict key growth benchmarks such as flowering and maturity. The analysis shows an increase in the GDD for all seasons with large increases of up to 19 percent in winter and spring by 2050. The results indicate that crop water use is likely to increase if cropping patterns remain unchanged. Predictions of change in precipitation are less consistent across the six model runs with the largest inconsistencies occurring for fall and summer. Predicted changes in summer rainfall vary between -12 percent and +24 percent while fall rainfall changes of -21 percent to +28 percent are predicted. However, a majority of model runs predict winter precipitation to increase between 3 percent and 19 percent while spring precipitation is predicted to decrease from 15 percent to 30 percent. While the predicted changes would make for improved winter growing conditions with warmer temperatures, the shift from spring to winter precipitation increases the chances of precipitation during the winter harvest season could damage crops just prior to harvest. Excessive summer heat could lead to seed germination problems, sunburn and lower yields. Increased temperatures throughout the year could lead to alterations in crop growth and water use patterns. Hotter summers could also increase water demand and power consumption for domestic and industrial cooling with associated increases in power generation emissions. Farmers are sure to respond to weather changes that impact quality and economic value of crop yields; their response may include changing cropping calendars, type and amount of crop planted, etc. These changes would in turn impact water consumption patterns. However, with its 24/7 delivery schedule, these types of changes in demand patterns can be accommodated by IID Increases in the amount of evaporation associated with increased temperatures would increase crop water requirements. This could cause demand to outstrip supply, resulting in increased overruns and/or more frequent declarations of a Supply and Demand Imbalance (SDI) under the IID Equitable Distribution Plan (EDP). Increased evapotranspiration could also accelerate habitat loss in the marshes, and increase the rate of decline in Salton Sea elevation and salt concentration.
City of El Centro 2015 Urban Water Management Plan Chapter 4
4-11
The Imperial Region obtains its water supply from the Colorado River which flows from the upper basin states (Colorado, Wyoming, and Utah), through the lower basin states (Arizona, Nevada and California) before entering Mexico on its way to the Gulf of California. Under the Law of the River, Colorado River water supply imported by IID is quite secure and reliable because of the seniority of the IID water rights. An array of studies have been carried out on the potential effects of climate change on the Colorado River, including recent work by the USBR as part of the Colorado River Basin Water Supply & Demand Study3. Water deficits must exceed the upper Colorado River Basin states’ allocation before lower states’ apportionment (and hence IID) are reduced. Also, the large volume of available reservoir storage on the Colorado River in Lake Mead and Powell buffer the potential climate change effects related to timing of flows that might occur if there were to be changes in the ratio of snow to rainfall. A reduction in the volume of water available is not envisioned even under the most extreme climate scenarios. Due to IID’s historic water rights, reductions in Colorado River water supply would be absorbed by junior water rights holders prior to effecting IID’s supply and the Imperial Region. Consequently, climate change poses a limited direct threat to the volume or timing of IID and Imperial Region water supply from the Colorado River.
3http://www.usbr.gov/lc/region/programs/crbstudy.html

City of El Centro 2015 Urban Water Management Plan Chapter 5
5-1
5 SB X7-7 BASELINES AND TARGETS
Senate Bill x7-7 (SB x7-7) was enacted in November 2009 (Water Conservation Act of 2009), requiring all water suppliers to increase water use efficiency. The legislation set an overall goal of reducing per-capita urban water use by 20% by December 31, 2020 and to make incremental progress towards this goal by reducing per capita water use by at least 10% by December 31, 2015. In preparing the 2010 UWMP, each urban retail water supplier was required to develop baseline daily per-capita water use, minimum baseline daily per-capita water use, and target daily per-capita water use for 2015 and 2020 that were to be 10% and 20% less, respectively, than the baseline daily per-capita water use based on utilizing one of four methods provided; with the target reduction for 2020 greater than the legislation’s minimum water use reduction requirement. The four methods are:
Method 1: Eighty percent of the water supplier’s baseline per capita water use
Method 2: Per capita daily water use estimated using the sum of performance standards applied to indoor residential use; landscape area water use; and commercial, industrial, and institutional uses
Method 3: Ninety-five percent of the applicable state hydrologic region target as stated in the State’s April 30, 2009, draft 20x2020 Water Conservation Plan
Method 4: A BMP Option based on standards that are consistent with the California Urban Water Conservation Council’s (CUWCC) best management practices (BMPs).
As part of the process, all four methods were evaluated to find the lowest 2020 SB x7-7 target for the City, which must be lower than the minimum 2020 SB x7-7 target allowed by DWR. Method 3 was found to have the lowest 2020 SB x7-7 target for the City (200.5 gpcd); however, this was greater than the minimum 2020 SB x7-7 target allowed for the City by DWR, and the minimum 2020 SB x7-7 target of 198.6 gpcd was substituted. Further detailed information on the evaluation leading to the derivation of this target is presented in Section
Baseline daily per-capita water use is defined as a continuous 10 or 15 year base period (baseline) for water use ending no earlier than December 31, 2004 and no later than December 31, 2010. If the average baseline daily per-capita water use is greater than 100 gpcd for a defined 5-year baseline period, the legislation’s minimum water use reduction requirement must also be met as set in Section 10608.22 of Senate Bill No. 7 SBx7-7. Per SBx7-7, the minimum water use reduction baseline period must end no earlier than December 31, 2007 and no later than December 31, 2010 and the minimum reduction shall be no less than 5 percent of this 5-year base daily per capita water use.

City of El Centro Chapter 5 2015 Urban Water Management Plan
5-2
For the 2015 UWMP, water agencies must demonstrate compliance with their established water use target for 2015, which will also demonstrate whether the agency is on currently on track to achieve its 2020 target. 5.1 UPDATING CALCULATIONS FROM 2010 UWMP In the 2010 UWMP, water agencies calculated a 2020 Urban Water Use Target through the use of a selected target method. The City’s 2020 target was calculated to be 200 gpcd using Method 3. In 2015 UWMPs, water agencies may update their 2020 Target and may make this calculation using a different target method than was used in 2010 DWR determined that significant discrepancies exist between Department of Finance (DOF) projected populations for 2010 (based on 2000 U.S. Census data) and actual populations for 2010 based on 2010 U.S. Census data. The average difference between projected and actual was approximately 3 percent, but the difference for some cities was as high as 9 percent. Therefore, if an agency did not use 2010 Census data for their baseline population calculations in the 2010 UWMP (the full census data set was not available until 2012) DWR has determined that these agencies must recalculate their baseline population for the 2015 UWMPs using 2000 and 2010 Census data. This may affect the baseline and target gpcd values calculated in the 2010 UWMP, which must be modified accordingly in the 2015 UWMP. 5.2 BASELINE PERIODS
The City currently does not produce or receive recycled water supply, and therefore, a 10-year baseline period is used as opposed to a 15-year baseline period. The baseline period must end no earlier than December 31, 2004 and no later than December 31, 2010. The most advantageous sequence of years for calculating per-capita water use is the sequence that generates the highest per-capita water use, making subsequent water conservation easier to achieve. Accordingly the 10-year period 1997 through 2006 was selected as the average per-capita water use baseline for the 2015 UWMP, which is the same baseline period used in the 2010 UWMP as shown in Table 5.1A.
Per SBx7-7, the minimum 5-year water use reduction baseline period must end no earlier than December 31, 2007 and no later than December 31, 2010. A 5-year minimum water use reduction baseline period between 2004 through 2008 was selected to calculate the most advantageous 5-year minimum water use reduction target as shown in Table 5.1B. The minimum 5-year water use reduction baseline period is used to calculate the legislation’s minimum water use reduction requirement.
5.3 SERVICE AREA POPULATION El Centro reports that of the 9,906 water service connections in the City’s water service area in 2015, only 8 were outside the Municipal boundaries and only one of these connections was residential. As it is concluded that there is a 95 percent match between the City and water service area boundaries, DOF population estimates were used to calculate SBx7-7 water use targets.
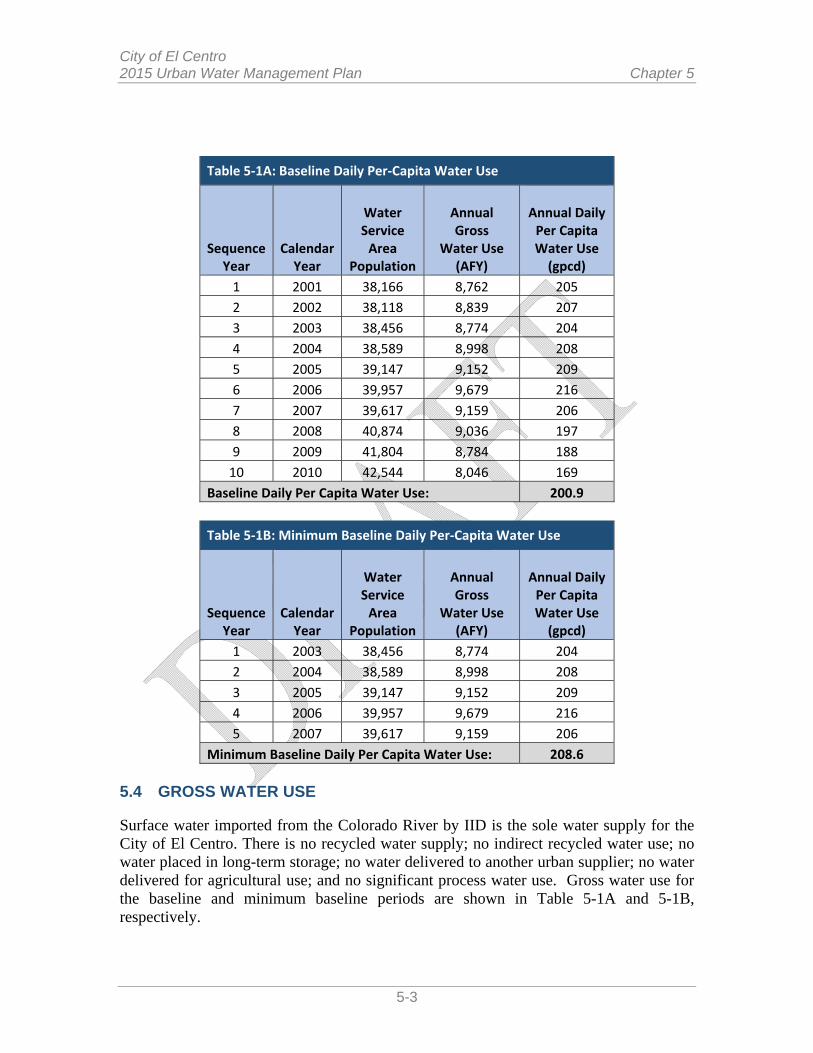
City of El Centro 2015 Urban Water Management Plan Chapter 5
5-3
Table 5‐1A: Baseline Daily Per‐Capita Water Use
Sequence Year
Calendar Year
Water Service Area
Population
Annual Gross
Water Use (AFY)
Annual Daily Per Capita Water Use (gpcd)
1 2001 38,166 8,762 205
2 2002 38,118 8,839 207
3 2003 38,456 8,774 204
4 2004 38,589 8,998 208
5 2005 39,147 9,152 209
6 2006 39,957 9,679 216
7 2007 39,617 9,159 206
8 2008 40,874 9,036 197
9 2009 41,804 8,784 188
10 2010 42,544 8,046 169
Baseline Daily Per Capita Water Use: 200.9
Table 5‐1B: Minimum Baseline Daily Per‐Capita Water Use
Sequence Year
Calendar Year
Water Service Area
Population
Annual Gross
Water Use (AFY)
Annual Daily Per Capita Water Use (gpcd)
1 2003 38,456 8,774 204
2 2004 38,589 8,998 208
3 2005 39,147 9,152 209
4 2006 39,957 9,679 216
5 2007 39,617 9,159 206
Minimum Baseline Daily Per Capita Water Use: 208.6
5.4 GROSS WATER USE Surface water imported from the Colorado River by IID is the sole water supply for the City of El Centro. There is no recycled water supply; no indirect recycled water use; no water placed in long-term storage; no water delivered to another urban supplier; no water delivered for agricultural use; and no significant process water use. Gross water use for the baseline and minimum baseline periods are shown in Table 5-1A and 5-1B, respectively.
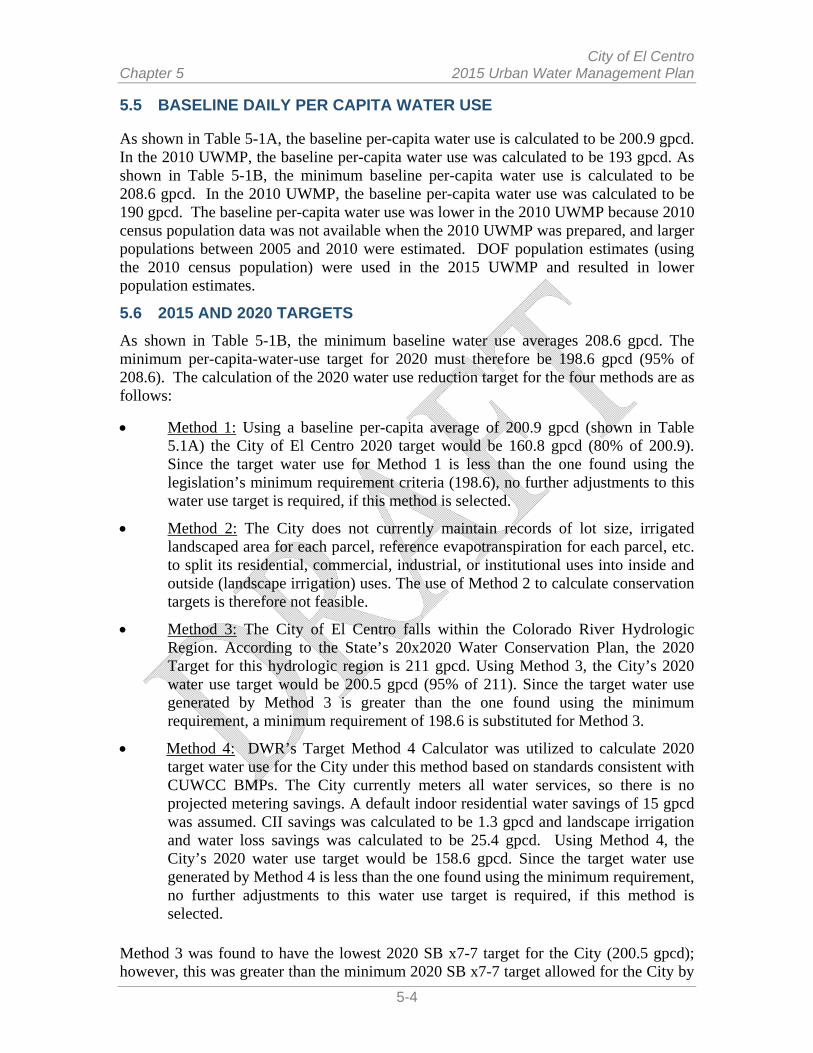
City of El Centro Chapter 5 2015 Urban Water Management Plan
5-4
5.5 BASELINE DAILY PER CAPITA WATER USE As shown in Table 5-1A, the baseline per-capita water use is calculated to be 200.9 gpcd. In the 2010 UWMP, the baseline per-capita water use was calculated to be 193 gpcd. As shown in Table 5-1B, the minimum baseline per-capita water use is calculated to be 208.6 gpcd. In the 2010 UWMP, the baseline per-capita water use was calculated to be 190 gpcd. The baseline per-capita water use was lower in the 2010 UWMP because 2010 census population data was not available when the 2010 UWMP was prepared, and larger populations between 2005 and 2010 were estimated. DOF population estimates (using the 2010 census population) were used in the 2015 UWMP and resulted in lower population estimates.
5.6 2015 AND 2020 TARGETS
As shown in Table 5-1B, the minimum baseline water use averages 208.6 gpcd. The minimum per-capita-water-use target for 2020 must therefore be 198.6 gpcd (95% of 208.6). The calculation of the 2020 water use reduction target for the four methods are as follows:
Method 1: Using a baseline per-capita average of 200.9 gpcd (shown in Table 5.1A) the City of El Centro 2020 target would be 160.8 gpcd (80% of 200.9). Since the target water use for Method 1 is less than the one found using the legislation’s minimum requirement criteria (198.6), no further adjustments to this water use target is required, if this method is selected.
Method 2: The City does not currently maintain records of lot size, irrigated landscaped area for each parcel, reference evapotranspiration for each parcel, etc. to split its residential, commercial, industrial, or institutional uses into inside and outside (landscape irrigation) uses. The use of Method 2 to calculate conservation targets is therefore not feasible.
Method 3: The City of El Centro falls within the Colorado River Hydrologic Region. According to the State’s 20x2020 Water Conservation Plan, the 2020 Target for this hydrologic region is 211 gpcd. Using Method 3, the City’s 2020 water use target would be 200.5 gpcd (95% of 211). Since the target water use generated by Method 3 is greater than the one found using the minimum requirement, a minimum requirement of 198.6 is substituted for Method 3.
Method 4: DWR’s Target Method 4 Calculator was utilized to calculate 2020 target water use for the City under this method based on standards consistent with CUWCC BMPs. The City currently meters all water services, so there is no projected metering savings. A default indoor residential water savings of 15 gpcd was assumed. CII savings was calculated to be 1.3 gpcd and landscape irrigation and water loss savings was calculated to be 25.4 gpcd. Using Method 4, the City’s 2020 water use target would be 158.6 gpcd. Since the target water use generated by Method 4 is less than the one found using the minimum requirement, no further adjustments to this water use target is required, if this method is selected.
Method 3 was found to have the lowest 2020 SB x7-7 target for the City (200.5 gpcd); however, this was greater than the minimum 2020 SB x7-7 target allowed for the City by
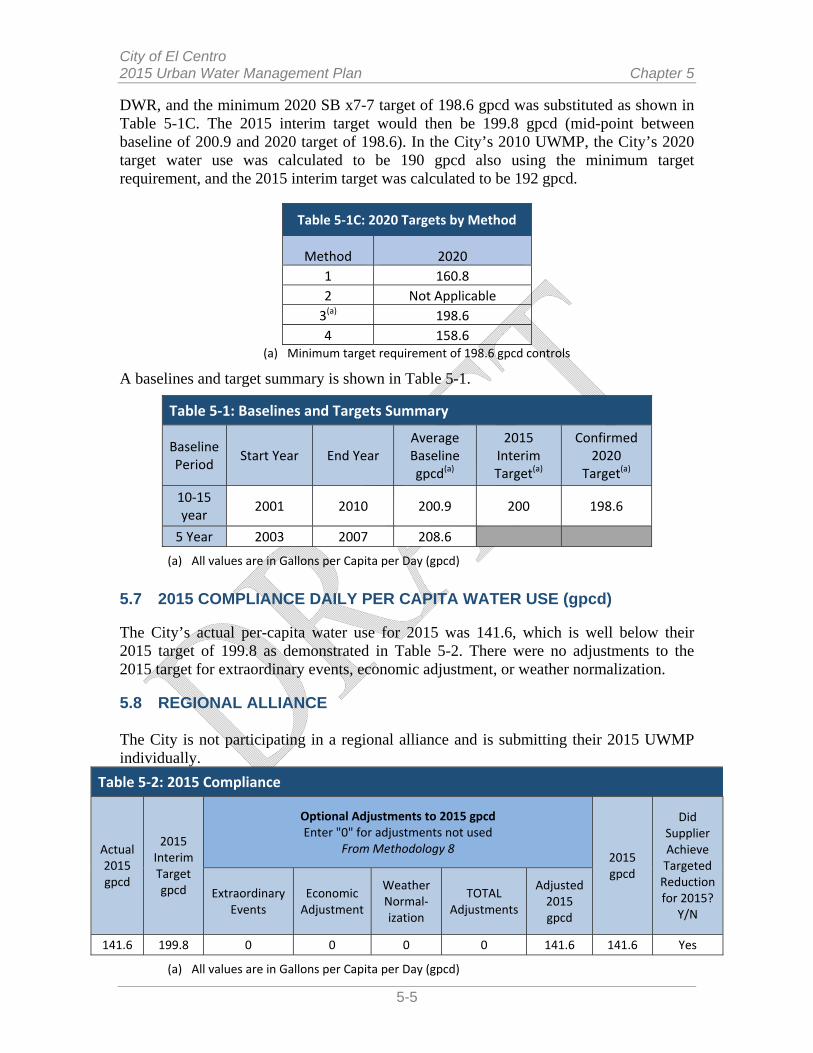
City of El Centro 2015 Urban Water Management Plan Chapter 5
5-5
DWR, and the minimum 2020 SB x7-7 target of 198.6 gpcd was substituted as shown in Table 5-1C. The 2015 interim target would then be 199.8 gpcd (mid-point between baseline of 200.9 and 2020 target of 198.6). In the City’s 2010 UWMP, the City’s 2020 target water use was calculated to be 190 gpcd also using the minimum target requirement, and the 2015 interim target was calculated to be 192 gpcd.
Table 5‐1C: 2020 Targets by Method
Method 2020
1 160.8
2 Not Applicable
3(a) 198.6
4 158.6 (a) Minimum target requirement of 198.6 gpcd controls
A baselines and target summary is shown in Table 5-1.
Table 5‐1: Baselines and Targets Summary
Baseline Period
Start Year End Year Average Baseline gpcd(a)
2015 Interim Target(a)
Confirmed 2020
Target(a)
10‐15 year
2001 2010 200.9 200 198.6
5 Year 2003 2007 208.6
(a) All values are in Gallons per Capita per Day (gpcd)
5.7 2015 COMPLIANCE DAILY PER CAPITA WATER USE (gpcd) The City’s actual per-capita water use for 2015 was 141.6, which is well below their 2015 target of 199.8 as demonstrated in Table 5-2. There were no adjustments to the 2015 target for extraordinary events, economic adjustment, or weather normalization. 5.8 REGIONAL ALLIANCE The City is not participating in a regional alliance and is submitting their 2015 UWMP individually.
Table 5‐2: 2015 Compliance
Actual 2015 gpcd
2015 Interim Target gpcd
Optional Adjustments to 2015 gpcd Enter "0" for adjustments not used
From Methodology 8 2015 gpcd
Did Supplier Achieve Targeted Reduction for 2015?
Y/N
Extraordinary Events
Economic Adjustment
Weather Normal‐ization
TOTAL Adjustments
Adjusted 2015 gpcd
141.6 199.8 0 0 0 0 141.6 141.6 Yes
(a) All values are in Gallons per Capita per Day (gpcd)


City of El Centro 2015 Urban Water Management Plan Chapter 6
6-1
6 SYSTEM SUPPLIES Surface water imported from the Colorado River by IID is the primary water supply for the Imperial Region and the sole water supply for the City of El Centro. Colorado River water is used to meet all current agricultural and non-agricultural water demands in the IID water service area.
Rainfall is less than three inches per year and does not contribute to IID water delivery, although at times it does increase or reduce agricultural water demand. Groundwater in the Imperial Valley is of poor quality and is generally unsuitable for domestic or irrigation purposes, though some is pumped for industrial (geothermal) use.
6.1 PURCHASED IMPORTED WATER All water supply for the City of El Centro is imported Colorado River water purchased from IID. Approximately 96 percent of IID imported Colorado River water is used for agriculture in the Imperial Valley. However, non-agricultural water use is projected to increase as municipal water demand continues to rise due to population growth; as industrial (renewable energy) water demand increases due to increased geothermal energy production; and as feedlot, dairy and fishery, and environmental and recreation uses all continue to increase.
6.1.1 Colorado River Rights
IID’s rights to appropriate Colorado River water are long-standing. Beginning in 1885, a number of individuals, as well as the California Development Company, made a series of appropriations of Colorado River water under California law for use in the Imperial Valley. Pursuant to then-existing California laws, these appropriations were initiated by the posting of public notices for approximately 7 million acre-feet per year (MAFY) at the point of diversion and recording such notices in the office of the county record
The individual appropriations were subsequently assigned to the California Development Company, whose entire assets, including its water rights, were later bought by the Southern Pacific Company. On June 22, 1916, the Southern Pacific Company conveyed all of its water rights to IID.
IID’s predecessor water right holder made reasonable progress in putting their pre-1914 appropriative water rights to beneficial use. By 1929, the beneficial use was 424,145 acres out of the Imperial Valley’s approximately one million irrigable acres.
Colorado River water rights are governed by numerous compacts, state and federal laws, court decisions and decrees, contracts, and regulatory guidelines collectively known as the “Law of the River.” Together, these documents allocate the water, regulate land use, and manage the Colorado River water supply among the seven basin states and Mexico. The following legal and regulatory documents are among those that have significant bearing on IID.

City of El Centro Chapter 6 2015 Urban Water Management Plan
6-2
6.1.1.1 Colorado River Compact (1921)
With the authorization of their legislatures and at the urging of the federal government, representatives from the seven Colorado River basin states began negotiations regarding the distribution of water from the Colorado River in 1921. In November 1922, an interstate agreement, the Colorado River Compact, was signed by the representatives giving each basin perpetual rights to annual apportionments of 7.5 MAFY of Colorado River water. Arizona signed the Compact in 1922, but did not ratified it until 1944. Even after they ratified the Compact, they pursued litigation against the State, which eventually resulted in the USSC granting AZ 46% of the water in the Colorado River Basin. See Arizona v. California US Supreme Court Decision (1964, 1979) in Section 6.1.1.4.
6.1.1.2 Boulder Canyon Project Act (1928)
California was apportioned 4.4 MAFY out of the lower basin allocation of 7.5 MAFY, plus 50 percent of any available surplus water as a result of the Boulder Canyon Project Act, which Congress authorized in 1928, the California Limitation Act, and the Secretary’s contracts with the California water users.
The Secretary entered into contracts with California right holders to further apportion California’s share of Colorado River water, and entered into a permanent service water delivery contract with IID on December 1, 1932. The District undertook to pay the cost of the works (Imperial Dam and the All-American Canal) and to include within itself certain public lands of the United States and other specific lands. The United States undertook to deliver to the Imperial Dam the water that would be carried by the new canal to the various lands to be served by it. IID’s contract with the Secretary incorporated the provisions of the Seven-Party Agreement. IID’s contract has no termination date; it is a contract for permanent water service.
6.1.1.3 California Seven-Party Agreement (1931)
On November 5, 1930, the Secretary of the Interior requested the California Division of Water Resources to recommend a proper method of apportioning the water that California was entitled to receive under the 1922 Colorado River Compact and the Boulder Canyon Project Act. Thereafter, a number of users and prospective users of Colorado River water entered into the Seven-Party Agreement on August 18, 1931. As a result of the Seven-Party Agreement, IID agreed to limit its California pre-1914 appropriative water rights in quantity and priority to the apportionments and priorities contained in the Seven-Party Agreement. The California Seven-Party Agreement (condensed and summarized in Table 6-0A) states the following:
The Division of Water Resources to, in all respects, recognize said apportionments and priorities in all matters relating to State authority and to recommend the [apportionment and priority provisions] to the Secretary of the Interior of the United States for insertion in any and all contracts for water made by him (sic) pursuant to the terms of the Boulder Canyon Project Act.

City of El Centro 2015 Urban Water Management Plan Chapter 6
6-3
Table 6‐0A: Seven‐Party Agreement for Apportionments and Priorities(a)
Priority Order
Description
Annual Apportionment (Acre‐feet)
Annual Present Perfected Rights (PPRs) (Acre‐feet)
1 Palo Verde Irrigation District – for use exclusively on a gross area of 104,500 acres of land within and adjoining the district
3,850,000 219,790 (or consumptive use for
33,604 acres)
2 Yuma Project (Reservation District) – for use on California Division, not exceeding 25,000 acres of land
38,270 (or consumptive use for
6,294 acres)
3a Imperial Irrigation District ‐ for use on lands served by All‐American Canal in Imperial and Coachella Valleys
2,600,000 (or consumptive use for
424,145 acres) ‐ (IID only)
3b Palo Verde Irrigation District – for use exclusively on an additional 16,000 acres of mesa lands
4 Metropolitan Water District and/or City of Los Angeles and/or others – for use by themselves and/or others on Southern California coastal plain
550,000
Subtotal 4,400,000
5a Metropolitan Water District and/or City of Los Angeles and/or others on coastal plain
550,000
5b City and County of San Diego 112,000
6a Imperial Irrigation District ‐ lands served by the All‐ American Canal (AAC) in Imperial and Coachella Valleys
300,000
6b Palo Verde Irrigation District – for exclusive use on 16,000 acres of mesa lands
Total 5,362,000
7 California Agricultural Use ‐ Colorado River Basin lands in California
All remaining available water
(a) ID. “2010 Annual Water Report” < http://www.iid.com/Modules/ShowDocument.aspx?documentid=5057>. p 14.
6.1.2 IID State Applications and Permits
Following execution of the Seven-Party Agreement, IID filed eight applications with the California Division of Water Rights between 1933 and 1936 to appropriate water pursuant to the California Water Commission Act. These applications each reserved the pre-1914 appropriative rights. However, the applications also incorporated the terms of the Seven-Party Agreement (Table 6-1), including the priority and apportionment parameters into IID’s California appropriative applications. Permits were granted on the applications in 1950. 6.1.3 Subordination by Coachella Valley Water District
CVWD was formed in 1918 to protect and conserve local water sources. At the time IID entered into its contract with the Secretary of the Interior, it was anticipated that the lands to be served with Colorado River water in the Coachella Valley to the north would also become a part of IID. However, Coachella farmers eventually decided that they preferred to have their own delivery contract with the Secretary, and an action was brought by the Coachella Valley Water District (CVWD) to protest IID’s court validation of the 1932 IID water service and repayment contract with the Secretary of the Interior.
City of El Centro Chapter 6 2015 Urban Water Management Plan
6-4
In 1934, IID and CVWD executed a compromise agreement that paved the way for CVWD to have its own contract with the Secretary, and which provided that CVWD would subordinate its Colorado River entitlement, in perpetuity, to IID’s entitlement. That is, within the third, sixth, and seventh priority order (Table 6-1), as set forth in the Seven-Party Agreement and California water delivery contracts, IID water use takes precedence over CVWD use. As a practical matter, under Priority 3, CVWD receives what is left of 3.85 MAFY after Palo Verde Irrigation District, Yuma Project, and IID uses are deducted.
In summary, when California is limited to 4.4 MAFY of Colorado River water, IID has senior water rights established under state law in the amount of 3.85 MAFY minus the amounts used by Priorities 1 and 2. Priorities 1 and 2 are not fixed quantities and have ranged from 364,817 AFY to 602,181 AFY over the last 25 years.4
6.1.4 IID Present Perfected Rights, and Arizona v. California US Supreme Court Decision (1964, 1979)
The term “present perfected rights” first appeared in the Colorado River Compact executed on November 24, 1922. The Compact provided that present perfected rights to the beneficial use of waters of the Colorado River system are unimpaired by this Compact. The Boulder Canyon Project Act Section 6, effective on June 25, 1929, recognized and protected these rights by providing that “the dam and reservoir ... shall be used; second, for irrigation and domestic uses and satisfaction of present perfected rights in pursuance of Article VIII of said Colorado River Compact ...” Pursuant to the terms of the Boulder Canyon Project Act, California’s 4.4 MAFY of mainstream water was to be used to satisfy “any rights which existed on December 21, 1928.” Such rights included present perfected rights within IID’s pre-1914 state-law appropriative rights. Although the United States Supreme Court in Arizona v. California defined “perfected right” and “present perfected rights” in its 1964 Decree, IID’s present perfected rights were not quantified until the Supreme Court issued a Supplemental Decree in 1979. That Supplemental Decree defined IID’s present perfected rights as a right to Colorado River water: “In annual quantities not to exceed (i) 2,600,000 acre-feet of diversions from the mainstream or (ii) the consumptive use required for irrigation of 424,145 acres and for the satisfaction of related uses, whichever of (i) or (ii) is less, with a priority date of 1901.” IID’s present perfected rights are very important because Article II(B)(3) of the Supreme Court Decree provides that in any year in which there is less than 7.5 MAF of mainstream water available for release for consumptive use in Arizona, California, and Nevada, the Secretary of the Interior shall first provide for the satisfaction of present perfected rights in the order of their priority dates without regard to state lines before imposing shortage cutbacks on other junior water right holders.
4 “East Brawley Geothermal Development Project SB 610 Water Supply Assessment Review” letter, February 12, 2009, p. 15, and calculations from Derek Dessert, Design Development & Engineering, as emailed to Anisa Divine, June 2012.

City of El Centro 2015 Urban Water Management Plan Chapter 6
6-5
6.1.5 Colorado River Basin Project Act (1968)
In 1968, Congress authorized various water development projects in both the upper and lower basins, including the Central Arizona Project (CAP). Under the Colorado River Basin Act of 1968, priority was given to California’s apportionment over the CAP water supply in times of shortage. Also under the act, the Secretary was directed to prepare long-range criteria for the Colorado River reservoir system in consultation with the Colorado River Basin states.
6.1.6 Quantification Settlement Agreement & Related Agreements (2003)
Due to completion of a large portion of the Central Arizona Project (CAP) infrastructure in 1994, creation of the Arizona Water Banking Authority in 1996, and the growth of Las Vegas in the 1990s, California encountered increasing pressure to live within its Priority 1-4 rights of 4.4 MAFY under the Law of the River. After years of negotiating among Colorado River Compact States and affected California water delivery agencies, the Quantification Settlement Agreement and Related Agreements and associated documents (QSA/Transfer Agreements) were signed by the Secretary of Interior, IID, CVWD, MWD, the SDCWA, and other affected parties on October 10, 2003.
With execution of the QSA/Transfer Agreements, IID’s Priority 3(a) consumptive use was capped at 3.1 MAFY for the 45-year term of the IID/SDCWA transfer agreement, with possible extension for an additional 30 years. Apportionment of Colorado River water to California signatories is contained in the Colorado River Water Delivery Agreement: Federal QSA for purposes of Section 5(b) Interim Surplus Guidelines (CRWDA).
6.1.6.1 Colorado River Water Delivery Agreement (CRWDA)5
As part of the 2003 QSA/Transfer Agreements among California and federal agencies, the CRWDA was entered into by the Secretary of the Interior, IID, CVWD, MWD and SDCWA. The CRWDA involves the federal government because of the change in place of Colorado River water from the All-American Canal to the Colorado River Aqueduct.
The CRWDA lays out how the California 4.4 Plan will be met by quantifying for a specific term of years deliveries of certain Colorado River entitlements within shared priorities, so that transfers may occur. In particular, for the term of the CRWDA, quantification of Priority 3(a) is effected through caps on consumptive use measured at Imperial Dam for IID (3.1 MAFY) and CVWD (330 KAFY). Quantification of Priority 6(a) is effected through quantifying consumptive use amounts to be made available in order of priority to MWD (38 KAFY), IID (63 KAFY), and CVWD (119 KAFY) with the provision that any additional water available to Priority 6(a) be delivered under IID and CVWD existing water delivery contracts with the Secretary. The CRWDA also provides a source of water to effect a San Luis Rey Indian Water rights settlement. The CRWDA provides that the underlying water delivery contract with the Secretary remain in full force and effect. (Colorado River Documents 2008, pages 6-12 and 6-13).
5 2003 CRWDA: Federal QSA. <http://www.usbr.gov/lc/region/g4000/crwda/crwda.pdf>

City of El Centro Chapter 6 2015 Urban Water Management Plan
6-6
Under the terms of the CRWDA, the Secretary of the Interior shall deliver IID’s Priority 3(a) consumptive use entitlement pursuant to Exhibit A (Table 6-0B); and an annual water consumptive use limit is imposed on IID, pursuant to Exhibit B (Table 6-0C). Additionally, the CRWDA satisfies the 2001 Interim Surplus Guidelines requirement that a quantification settlement agreement be adopted as a prerequisite to an interim surplus determination by the Secretary.
Table 6‐0B. Delivery of Priority 3(a) Consumptive Use Entitlement to IID (CRWDA Exhibit A)
Delivered to (entity)
At (point of diversion)
Amount Not to Exceed (AFY)
CVWD Imperial Dam 103,000
MWD 1 * Lake Havasu 110,000*
SDCWA 2 Lake Havasu 56,200
SDCWA 3 Lake Havasu 200,000
SLR 4 See note 4 see note 4
Misc. & Indian PPRs 5 Current points of delivery 11,500
For benefit of MWD/SDCWA 6 Lake Havasu 145,000
IID Imperial Dam Remainder
IID’s Priority 3(a) Total 3,100,000 1 Agreement for Implementation of a Water Conservation Program and Use of Conserved Water, dated Dec 22, 1988; Approval Agreement, dated Dec 19, 1989. Of amount identified: up to 90 KAFY to MWD and 20 KAFY to CVWD.
* By IID/MWD agreement, the 1988 IID/MWD transfer was fixed at 105 KAFY, beginning with calendar year 2007. 2 Water conserved from construction of a new lined canal parallel to the AAC from Pilot Knob to Drop 3. 3 Agreement for Transfer of Conserved Water, dated Apr 29, 1998, as amended. As set forth in Exhibit B (Table 5‐4), delivery amounts shall be 205 KAF in calendar year 2021 and 202.5 KAF in calendar year 2022.
4 Water conserved from AAC lining and made available for benefit of SLR Parties under applicable provisions of PL 100‐675, as amended. Quantity may vary, not to exceed 16 KAFY, as may point of diversion, subject to terms of Allocation Agreement.
5 Water to be delivered to misc. and Indian PPRs identified in the Decree in AZ v. CA, as supplemented. Delivery of water will be to current points of delivery unless modified in accordance with applicable law.
6 As provided in CRWDA subsection 4(g).
Table 6‐0C. IID Net Consumptive Use Schedule 2003‐2077 (KAF, CRWDA Exhibit B)
IID Quantification and Transfers, as of 2011 (KAF) 1 Col 1 2 3 4 5 6 7 8 9 10 11
Year
IID Priority 3(a)
IID
Quantified Amount
IID Reductions IID Net Available for Consumptive
Use (Col 2 ‐ 10)
1988 MWD
Transfer 2
SDCWA Transfer
AAC Lining
Salton Sea Mitigation SDCWA
Transfer 3
Intra‐ Priority 3 CVWD Transfer
MWD Transfer w\ Salton Sea
Restoration 4
Misc. PPRs
IID Total Reduction (Σ Cols 3‐9) 5
2003 3,100 105.1 10.0 0.0 0.0 0.0 0.0 11.5 126.6 2,978.2
2004 3,100 101.9 20.0 0.0 15.0 0.0 0.0 11.5 148.4 2,743.9
2005 3,100 101.9 30.0 0.0 15.0 0.0 0.0 11.5 158.4 2,756.82006 3,100 101.2 40.0 0.0 20.0 0.0 0.0 11.5 172.7 2,909.7
2007 3,100 105.0 50.0 0.0 25.0 0.0 0.0 11.5 191.5 2,872.7
2008 3,100 105.0 50.0 8.9 26.0 4.0 0.0 11.5 205.4 2,825.1
2009 3,100 105.0 60.0 65.5 30.2 8.0 0.0 11.5 280.2 2,566.7
2010 3,100 105.0 70.0 67.7 33.7 12.0 0.0 11.5 299.9 2,545.6
2011 3,100 103.9 63.3 67.7 0.0 16.0 0.0 11.5 246.4 2,915.8
2012 3,100 105 90 67.7 45 21 100 11.5 440.2 2,659.8
2013 3,100 105 100 67.7 70 26 100 11.5 480.2 2,619.8
2014 3,100 105 100 67.7 90 31 100 11.5 505.2 2,594.8
2015 3,100 105 100 67.7 110 36 100 11.5 530.2 2,569.8
2016 3,100 105 100 67.7 130 41 100 11.5 555.2 2,544.8
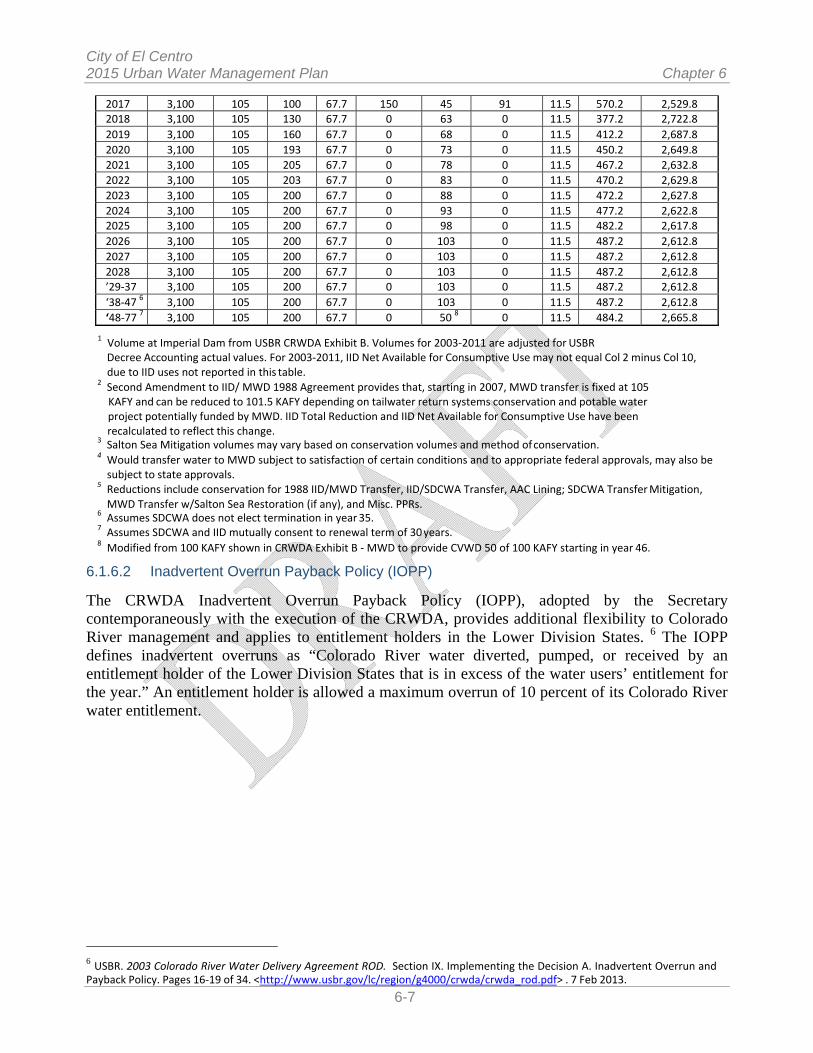
City of El Centro 2015 Urban Water Management Plan Chapter 6
6-7
2017 3,100 105 100 67.7 150 45 91 11.5 570.2 2,529.82018 3,100 105 130 67.7 0 63 0 11.5 377.2 2,722.8
2019 3,100 105 160 67.7 0 68 0 11.5 412.2 2,687.8
2020 3,100 105 193 67.7 0 73 0 11.5 450.2 2,649.8
2021 3,100 105 205 67.7 0 78 0 11.5 467.2 2,632.8
2022 3,100 105 203 67.7 0 83 0 11.5 470.2 2,629.8
2023 3,100 105 200 67.7 0 88 0 11.5 472.2 2,627.8
2024 3,100 105 200 67.7 0 93 0 11.5 477.2 2,622.82025 3,100 105 200 67.7 0 98 0 11.5 482.2 2,617.8
2026 3,100 105 200 67.7 0 103 0 11.5 487.2 2,612.8
2027 3,100 105 200 67.7 0 103 0 11.5 487.2 2,612.8
2028 3,100 105 200 67.7 0 103 0 11.5 487.2 2,612.8’29‐37 3,100 105 200 67.7 0 103 0 11.5 487.2 2,612.8
‘38‐47 6 3,100 105 200 67.7 0 103 0 11.5 487.2 2,612.8
‘48‐77 7 3,100 105 200 67.7 0 50 8 0 11.5 484.2 2,665.8
1 Volume at Imperial Dam from USBR CRWDA Exhibit B. Volumes for 2003‐2011 are adjusted for USBR Decree Accounting actual values. For 2003‐2011, IID Net Available for Consumptive Use may not equal Col 2 minus Col 10, due to IID uses not reported in this table.
2 Second Amendment to IID/ MWD 1988 Agreement provides that, starting in 2007, MWD transfer is fixed at 105 KAFY and can be reduced to 101.5 KAFY depending on tailwater return systems conservation and potable water project potentially funded by MWD. IID Total Reduction and IID Net Available for Consumptive Use have been recalculated to reflect this change. 3 Salton Sea Mitigation volumes may vary based on conservation volumes and method of conservation. 4 Would transfer water to MWD subject to satisfaction of certain conditions and to appropriate federal approvals, may also be subject to state approvals.
5 Reductions include conservation for 1988 IID/MWD Transfer, IID/SDCWA Transfer, AAC Lining; SDCWA Transfer Mitigation, MWD Transfer w/Salton Sea Restoration (if any), and Misc. PPRs.
6 Assumes SDCWA does not elect termination in year 35. 7 Assumes SDCWA and IID mutually consent to renewal term of 30 years. 8 Modified from 100 KAFY shown in CRWDA Exhibit B ‐ MWD to provide CVWD 50 of 100 KAFY starting in year 46.
6.1.6.2 Inadvertent Overrun Payback Policy (IOPP)
The CRWDA Inadvertent Overrun Payback Policy (IOPP), adopted by the Secretary contemporaneously with the execution of the CRWDA, provides additional flexibility to Colorado River management and applies to entitlement holders in the Lower Division States. 6 The IOPP defines inadvertent overruns as “Colorado River water diverted, pumped, or received by an entitlement holder of the Lower Division States that is in excess of the water users’ entitlement for the year.” An entitlement holder is allowed a maximum overrun of 10 percent of its Colorado River water entitlement.
6 USBR. 2003 Colorado River Water Delivery Agreement ROD. Section IX. Implementing the Decision A. Inadvertent Overrun and Payback Policy. Pages 16‐19 of 34. <http://www.usbr.gov/lc/region/g4000/crwda/crwda_rod.pdf> . 7 Feb 2013.

City of El Centro Chapter 6 2015 Urban Water Management Plan
6-8
In the event of an overrun, the IOPP provides a mechanism to payback the overrun. When the Secretary has declared a normal year for Colorado River diversions, a contractor has from one to three years to pay back its obligation, with a minimum annual payback equal to 20 percent of the entitlement holder’s maximum allowable cumulative overrun account or 33.3 percent of the total account balance, whichever is greater. However, when Lake Mead is below 1125 feet on January 1, the terms of the IOPP require that the payment of the inadvertent overrun obligation be made in the calendar year after the overrun is reported in the USBR Lower Colorado Region Colorado River Accounting and Water Use Report [for] Arizona, California, and Nevada (Decree Accounting Report).7.
6.1.6.3 Impacts on Water Supply
The annual water consumptive use limit imposed by CRWDA Exhibit B (Table 6-0C) creates complicated accounting for both IID and USBR, and is still evolving. The record included herein represents IID efforts to consolidate USBR and IID numbers. As IID works with USBR to develop consolidated accounting formats, the presentation of these values is likely to be refined and updated. The 3.1 MAFY cap and the water efficiency conservation and transfer programs present unique challenges as data prior to 2003 cannot always be compared or averaged with QSA/Transfer Agreements data absent additional data rectification or benchmarking. As a result of the QSA/Transfer Agreements, IID will be able to more efficiently deliver Colorado River water to the Imperial Valley. Imperial Valley agricultural water users will be able to more efficiently use their irrigation water; thus, preserving Imperial Valley agricultural output while reducing their use of Colorado River water. The voluntary on-farm efficiency conservation program will financially compensate participants for the water they conserve. USBR will not challenge reasonable and beneficial use under the 43 C.F.R. Part 417 as long as IID participates in the QSA/Transfer Agreements; thus, the Imperial Valley will be able to rely on the senior rights to a large volume of Colorado that IID possesses. In short, the QSA/Transfer Agreements ensure that IID will receive Colorado River water as scheduled in CRWDA Exhibit B (Table 6-0C) and provide the means to allow IID and the customers it serves to elevate their Colorado River water use to efficient 21st Century standards and ensure the continued availability of this precious supply, while meeting delivery obligations as shown in Table 6-0D. The impact of the QSA/Transfer Agreements on the Region’s water supply is limitation of the amount of Colorado River water available for delivery by IID to its customers. IID has agreed to 45 years of large-scale water conservation and transfer, increasing from 120,000 AFY in 2003, to 408,000 AFY in year 24 (2026). From 2026 through 2047, the IID reduction is stabilized at 408,000 AFY. The conserved amounts are to be delivered to urban areas in California’s Colorado River and Southern Coast Hydrologic Regions. As shown in Table 5-5, the conserved water will be delivered (volumes at Imperial Dam), as follows:
105,000 AFY to MWD, can be reduced by up to 3.5 KAFY subject to tailwater return systems performance and potable projects potentially funded by MWD
200,000 AFY to SDCWA 103,000 AFY to CVWD
7 2003 ROD CRWDA IOPP:< http://www.usbr.gov/lc/region/g4000/crwda/crwda_rod.pdf>
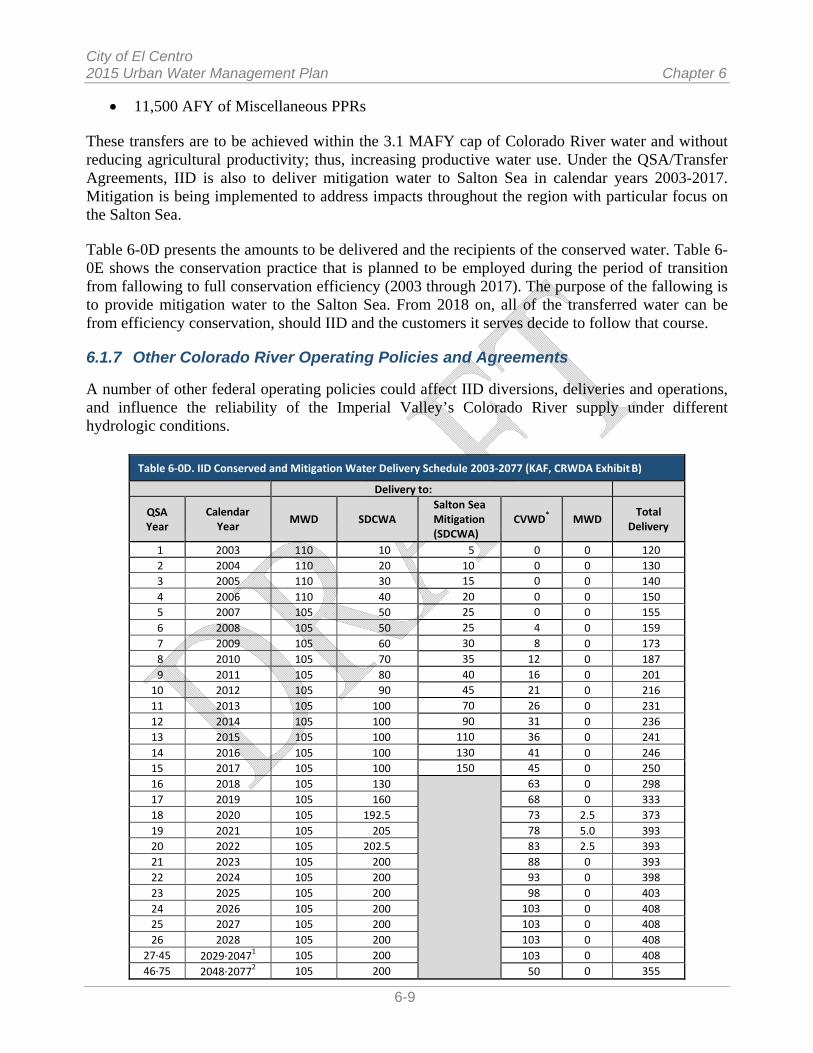
City of El Centro 2015 Urban Water Management Plan Chapter 6
6-9
11,500 AFY of Miscellaneous PPRs
These transfers are to be achieved within the 3.1 MAFY cap of Colorado River water and without reducing agricultural productivity; thus, increasing productive water use. Under the QSA/Transfer Agreements, IID is also to deliver mitigation water to Salton Sea in calendar years 2003-2017. Mitigation is being implemented to address impacts throughout the region with particular focus on the Salton Sea.
Table 6-0D presents the amounts to be delivered and the recipients of the conserved water. Table 6-0E shows the conservation practice that is planned to be employed during the period of transition from fallowing to full conservation efficiency (2003 through 2017). The purpose of the fallowing is to provide mitigation water to the Salton Sea. From 2018 on, all of the transferred water can be from efficiency conservation, should IID and the customers it serves decide to follow that course. 6.1.7 Other Colorado River Operating Policies and Agreements
A number of other federal operating policies could affect IID diversions, deliveries and operations, and influence the reliability of the Imperial Valley’s Colorado River supply under different hydrologic conditions.
Table 6‐0D. IID Conserved and Mitigation Water Delivery Schedule 2003‐2077 (KAF, CRWDA Exhibit B)
Delivery to:
QSA Year
Calendar Year
MWD
SDCWA
Salton Sea Mitigation (SDCWA)
CVWD*
MWD
Total Delivery
1 2003 110 10 5 0 0 120
2 2004 110 20 10 0 0 130
3 2005 110 30 15 0 0 140
4 2006 110 40 20 0 0 150
5 2007 105 50 25 0 0 155
6 2008 105 50 25 4 0 159
7 2009 105 60 30 8 0 173
8 2010 105 70 35 12 0 187
9 2011 105 80 40 16 0 201
10 2012 105 90 45 21 0 216
11 2013 105 100 70 26 0 231
12 2014 105 100 90 31 0 236
13 2015 105 100 110 36 0 241
14 2016 105 100 130 41 0 246
15 2017 105 100 150 45 0 250
16 2018 105 130 63 0 298
17 2019 105 160 68 0 333
18 2020 105 192.5 73 2.5 373
19 2021 105 205 78 5.0 393
20 2022 105 202.5 83 2.5 393
21 2023 105 200 88 0 393
22 2024 105 200 93 0 398
23 2025 105 200 98 0 403
24 2026 105 200 103 0 408
25 2027 105 200 103 0 408
26 2028 105 200 103 0 408
27∙45 2029∙20471 105 200 103 0 408
46∙75 2048∙20772 105 200 50 0 355

City of El Centro Chapter 6 2015 Urban Water Management Plan
6-10
*or MWD if CVWD declines to acquire 1 Assumes SDCWA does not elect termination in year 35 when its wheeling agreement with MWD ends. 2 Assumes SDCWA and IID mutually consent to renewal term of 30 years. Source: <http://www.usbr.gov/lc/region/g4000/QSA/crwda.pdf>
6.1.7.1 Criteria for Coordinated Long-Range Operation of Colorado River Reservoirs8
These Operating Criteria control operation of the Colorado River reservoirs in compliance with requirements set forth in the Colorado River Compact of 1922, the United States-Mexico Water Treaty of 1944, the Colorado River Storage Project Act of 1956, the Boulder Canyon Projects Act (Lake Mead) and the Colorado River Basin Project Act (Upper Basin Reservoirs) of 1968, and other applicable federal laws.9 Under these Operating Criteria, the Secretary of the Interior makes annual determinations published in the USBR Annual Operating Plan for Colorado River Reservoirs (discussed below) regarding the release of Colorado River water for deliveries to the Lower Basin States. A requirement to equalize active storage between Lake Powell and Lake Mead when there is sufficient storage in the Upper Basin is included in these operating criteria..
Table 6‐0E. Compromise IID QSA Delivery Schedule, 2003‐2017 (KAF)
Delivery for Transfer Conservation Practice 1 2 3 4 5 6 7 8
Year to
SDCWA to
CVWD Total Transfer
(Col 2+3) or (Col 5+6)
Efficiency for Delivery
Fallowing for Delivery
Fallowing for Mitigation
Total Fallowing (Col 6+7)
2003 10 0 10 0 10 5 15
2004 20 0 20 0 20 10 30
2005 30 0 30 0 30 15 45
2006 40 0 40 0 40 20 60
2007 50 0 50 0 50 25 75
2008 50 4 54 4 50 25 75
2009 60 8 68 8 60 30 90
2010 70 12 82 12 70 35 105
2011 80 16 96 16 80 40 120
2012 90 21 111 21 90 45 135
2013 100 26 126 46 80 70 150
2014 100 31 131 71 60 90 150
2015 100 36 136 96 40 110 150
2016 100 41 141 121 20 130 150
2017 100 45 145 145 0 150 150
Total 1,000 240 1,240 540 700 800 1,500
Source: “QSA by and among IID, MWD, and CVWD, Exhibit C.” p 39 of 44. 10 Oct 2010. Volumes at Imperial Dam. <http://www.iid.com/Modules/ShowDocument.aspx?documentid=882>
6.1.7.2 Annual Operating Plan (AOP) for Colorado River Reservoirs
Annual operating plans are developed in accordance with Section 602 of the Colorado River Basin Project Act (Public Law 90-537); the Criteria for Coordinated Long-Range Operations of Colorado River Reservoirs Pursuant to the Colorado River Basin Project Act of 1968, as amended, promulgated by the Secretary of the Interior; and Section 1804(c)(3) of the Grand Canyon
8 Criteria for Coordinated Long‐Range Operation of Colorado River reservoirs Pursuant to the Colorado River Basin Project Act of September 30, 1967 (P.L. 90‐537). June 8, 1970.
<http://www.usbr.gov/lc/region/pao/pdfiles/opcriter.pdf 9 USBR website: The Law of the River, for Operating Criteria and other agreements visit <http://www.usbr.gov/lc/region/g1000/lawofrvr.html>
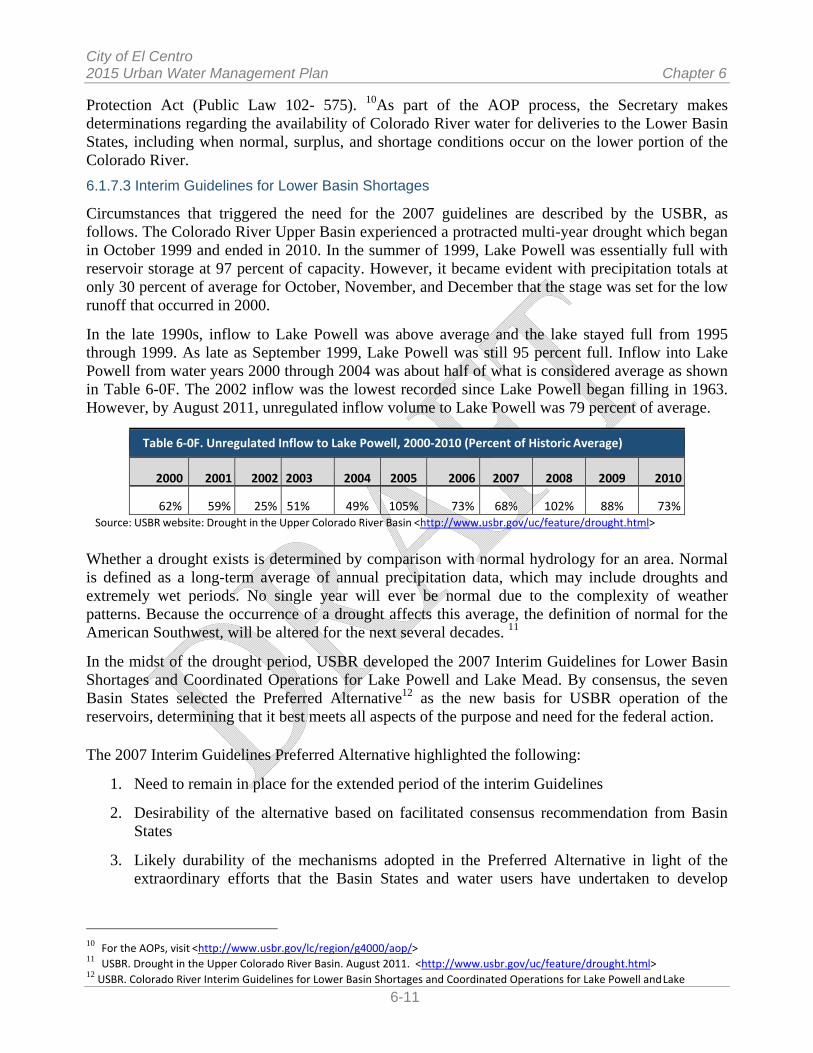
City of El Centro 2015 Urban Water Management Plan Chapter 6
6-11
Protection Act (Public Law 102- 575). 10As part of the AOP process, the Secretary makes determinations regarding the availability of Colorado River water for deliveries to the Lower Basin States, including when normal, surplus, and shortage conditions occur on the lower portion of the Colorado River.
6.1.7.3 Interim Guidelines for Lower Basin Shortages
Circumstances that triggered the need for the 2007 guidelines are described by the USBR, as follows. The Colorado River Upper Basin experienced a protracted multi-year drought which began in October 1999 and ended in 2010. In the summer of 1999, Lake Powell was essentially full with reservoir storage at 97 percent of capacity. However, it became evident with precipitation totals at only 30 percent of average for October, November, and December that the stage was set for the low runoff that occurred in 2000.
In the late 1990s, inflow to Lake Powell was above average and the lake stayed full from 1995 through 1999. As late as September 1999, Lake Powell was still 95 percent full. Inflow into Lake Powell from water years 2000 through 2004 was about half of what is considered average as shown in Table 6-0F. The 2002 inflow was the lowest recorded since Lake Powell began filling in 1963. However, by August 2011, unregulated inflow volume to Lake Powell was 79 percent of average.
Table 6‐0F. Unregulated Inflow to Lake Powell, 2000‐2010 (Percent of Historic Average)
2000 2001 2002 2003 2004 2005 2006 2007 2008 2009 2010
62% 59% 25% 51% 49% 105% 73% 68% 102% 88% 73%Source: USBR website: Drought in the Upper Colorado River Basin <http://www.usbr.gov/uc/feature/drought.html>
Whether a drought exists is determined by comparison with normal hydrology for an area. Normal is defined as a long-term average of annual precipitation data, which may include droughts and extremely wet periods. No single year will ever be normal due to the complexity of weather patterns. Because the occurrence of a drought affects this average, the definition of normal for the American Southwest, will be altered for the next several decades. 11
In the midst of the drought period, USBR developed the 2007 Interim Guidelines for Lower Basin Shortages and Coordinated Operations for Lake Powell and Lake Mead. By consensus, the seven Basin States selected the Preferred Alternative12 as the new basis for USBR operation of the reservoirs, determining that it best meets all aspects of the purpose and need for the federal action.
The 2007 Interim Guidelines Preferred Alternative highlighted the following:
1. Need to remain in place for the extended period of the interim Guidelines
2. Desirability of the alternative based on facilitated consensus recommendation from Basin States
3. Likely durability of the mechanisms adopted in the Preferred Alternative in light of the extraordinary efforts that the Basin States and water users have undertaken to develop
10 For the AOPs, visit <http://www.usbr.gov/lc/region/g4000/aop/> 11 USBR. Drought in the Upper Colorado River Basin. August 2011. <http://www.usbr.gov/uc/feature/drought.html> 12 USBR. Colorado River Interim Guidelines for Lower Basin Shortages and Coordinated Operations for Lake Powell and Lake
City of El Centro Chapter 6 2015 Urban Water Management Plan
6-12
implementing agreements that will facilitate the water management tools (shortage sharing, forbearance, and conservation efforts) identified in the Preferred Alternative
4. Range of elements in the alternative that will enhance the Secretary’s ability to manage the Colorado River reservoirs in a manner that recognizes the inherent tradeoffs between water delivery and water storage.
Importantly for the long-term stable management of the Colorado River, adoption of this decision activates a legal agreement among the Basin States that contains a critically important provision: the Basin States have agreed to mandatory consultation provisions to address future controversies on the Colorado River through consultation and negotiation, as a requirement, before resorting to litigation. With respect to the various interests, positions and views of each of the seven Basin States, this provision adds an important new element to the modern evolution of the legal framework for the prudent management of the Colorado River.
In June 2007, the USBR announced that a preferred alternative for Colorado River Interim Guidelines for Lower Basin Shortages and Coordinated Operations of Lake Powell and Lake Mead (Preferred Alternative) had been determined.13 The Preferred Alternative, based on the Basin States consensus alternative and an alternative submitted by the environmental interests called “Conservation Before Shortage,” was comprised of four key operational elements. These four key elements of the Preferred Alternative which would guide operations of Lake Powell and Lake Mead through 2026 are:
1. Shortage strategy for Lake Mead and Lower Division states: The Preferred Alternative proposed discrete levels of shortage volumes associated with Lake Mead elevations to conserve reservoir storage and provide water users and managers in the Lower Basin with greater certainty to know when, and by how much, water deliveries will be reduced during low reservoir conditions.
2. Coordinated operations of Lake Powell and Lake Mead: The Preferred Alternative proposed a fully coordinated operation of the reservoirs to minimize shortages in the Lower Basin and to avoid risk of curtailments of water use in the Upper Basin.
13 USGR website: <http://www.usbr.gov/newsroom/newsrelease/detail.cfm?RecordID=17341>. description of the preferred alternative is available on Reclamation's Lower Colorado Region web site, at <http://www.usbr.gov/lc/region/programs/strategies/documents.html>.

City of El Centro 2015 Urban Water Management Plan Chapter 6
6-13
3. Mechanism for storage and delivery of conserved water in Lake Mead: The Preferred Alternative proposed the Intentionally Created Surplus (ICS) mechanism to provide for the creation, accounting, and delivery of conserved system and non-system water thereby promoting water conservation in the Lower Basin. Credits for Colorado River or non-Colorado River water that has been conserved by users in the Lower Basin creating an ICS would be made available for release from Lake Mead at a later time. The total amount of credits would be 2.1 MAF, but this amount could be increased up to 4.2 MAF in future years.
4. Modifying and extending elements of the Interim Surplus Guidelines, which determine conditions under which surplus water is made available for use within the Lower Division states. These modifications eliminate the most liberal surplus conditions thereby leaving more water in storage to reduce the severity of future shortages.
The time span to 2026 provides an opportunity to gain operating experience for the management of Lake Powell and Lake Mead and to improve the basis for making additional future operational decisions, whether during the interim period or thereafter.
Figure 6-1 shows how the coordinated operation element allows for the adjustment of Lake Powell releases to respond to low reservoir storage conditions in either Lake Powell or Lake Mead. The ICS water conservation mechanism encourages efficient use and management of Colorado River water, and enhances conservation opportunities in the Lower Basin and the retention of water in Lake Mead.
Importantly for long-term stable management of the Colorado River, adoption of the 2007 Interim Guidelines activates a critical provision in the legal agreement among the basin states: the basin states have agreed to mandatory provisions to address future controversies on the Colorado River through consultation and negotiation before resorting to litigation. With respect to the various interests, positions and views of each of the seven basin states, this provision adds an important element to the evolution of the legal framework for the prudent management of the Colorado River. Furthermore, the coordinated operation element allows for adjustment of Lake Powell releases to respond to low reservoir storage conditions in either Lake Powell or Lake Mead, while, keeping the 2007 Interim Guidelines in place through 2026 provides an opportunity to gain operating experience for the management of Lake Powell and Lake Mead and to improve the basis for making additional future operational decisions, whether during the interim period or thereafter. The Intentionally Created Surplus (ICS) water conservation mechanism encourages efficient use and management of Colorado River water, and enhances conservation opportunities in the Lower Basin and the retention of water in Lake Mead

City of El Centro Chapter 6 2015 Urban Water Management Plan
6-14
In 2015, Lake Mead hovered around 1075 feet, which is the level that signals a shortage necessitating rationing, and is the lowest level since 1937, two years after the lake began filling, and is 150 feet below the highest level of 1,225 feet in 1983. Historic Lake Mead elevation levels are shown in Figure 6-2.
Figure 6‐1. Prescribed Operations of Lake Powell and Lake Mead in the Interim Guidelines
1
Subject to April adjustments that may result in balancing releases or releases according to the Equalization Tier 2
These are amounts of shortage (i.e., reduced deliveries in the United States) 3
If Lake Mead falls below elevation 1,025 feet; USDOI will initiate efforts to develop additional guidelines for shortages at lower Lake Mead elevations. Source: < http://wwa.colorado.edu/IWCS/archive/IWCS_2009_Jan_feature2.pdf
6.1.7.4 Annual 417 Process
Pursuant to the Code of Federal Regulations (CFR) Title 43 Part 417 (43 CFR part 417), prior to the beginning of each calendar year, USBR consults, as appropriate, with holders of Boulder Canyon Project Act Section 5 contracts (Contractors) for the delivery of water. IID is one such Contractor. Under these consultations, USBR makes recommendations related to water conservation measures and operating practices in the diversion, delivery, distribution, and use of Colorado River water as stated by USBR in the following the following excerpt:

City of El Centro 2015 Urban Water Management Plan Chapter 6
6-15
The Regional Director or his (sic) representative will, prior to the beginning of each calendar year, arrange for and conduct such consultations with each Contractor as the Regional Director may deem appropriate as to the making by the Regional Director of annual recommendations relating to water conservation measures and operating practices in the diversion, delivery, distribution and use of Colorado River water, and to the making by the Regional Director of annual determinations of each Contractor’s estimated water requirements for the ensuing calendar year to the end that deliveries of Colorado River water to each Contractor will not exceed those reasonably required for beneficial use under the respective Boulder Canyon Project Act contract or other authorization for use of Colorado River water.
Figure 6‐2. Historic Lake Mead Elevation Levels
6.2 G
ROUNDWATER
Imperia
l Vall
ey and Coachel
la Vall
ey are
located in the Colorado Desert geomorphic province. The Colorado Desert is a low-lying barren desert basin, with portions of the area below mean sea level and runoff flowing to the Salton Sea. The province is a depressed block between active branches of alluvium-covered San Andreas Fault with the southern extension of the Mojave Desert to the east. Characterized by the ancient beach lines and silt deposits of extinct Lake Cahuilla, the Region is bounded to the west by the Jacumba Mountains and on the east by the Chocolate Mountains. Beyond the westerly mountains lies San Diego County, and to the east is the Colorado River watershed and southwestern Arizona. Much of the central portion of the Region is below sea level, reaching nearly 230 feet below mean sea level (MSL) at the Salton Sea.

City of El Centro Chapter 6 2015 Urban Water Management Plan
6-16
Imperial Region is situated on and near extensive fault systems, generally trending northwest to southeast. Large nearby faults include the San Andreas, Superstition Hills, and San Jacinto faults (Hart and Bryant 1999). The faulting influences groundwater movement.
Groundwater basins within the Imperial Region include portions of the Coyote Wells Valley Basin, Borrego Valley Basin, Ocotillo-Clark Valley Basin, West Salton Sea Basin, and Ogilby Valley Basin, and all of the Imperial Valley Basin, East Salton Basin, and East Amos Valley Basin, for a total of approximately 2,800 square miles (DWR 1975). The major surface water body within the Region is the Salton Sea, and drainage is to the Salton Sea via the New River and Alamo River, a few direct-to-sea drains and various washes. Groundwater-bearing materials are generally younger than older alluvial sediments derived from the erosion of the surrounding mountain ranges. 6.2.1 East Mesa Groundwater Basin
Located in the southeastern portion of the Salton Basin, East Mesa is the area east of the East Highline Canal, and west of the Sand Hills Fault. The Algodones Fault, an easterly splay of the San Andreas Fault system, is mapped as bordering the eastside of the Sand Hills (Loeltz et. al. 1975). The East Mesa is also roughly bordered by the Coachella Canal on the east, and the All-American Canal (AAC) on the south. The East Mesa is an alluvial surface that slopes gently west-southwest, covered with thin veneers of wind-blown sand. The East Mesa aquifer is chiefly unconfined, homogenous, and composed of coarse-grained deposits of gravel, sand, silt, and silty clay that were deposited by the Colorado River. Faults in the East Mesa act as partial barriers to the westward flow of groundwater from this area. The Calipatria Fault also crosses a small portion of the East Mesa along the southwest margin and impedes the flow of groundwater out of East Mesa (Crandall 1983). 6.2.2 Imperial Valley Groundwater Basin Imperial Valley. Most studies of groundwater conditions in the Imperial Valley (central irrigated area) focus exclusively on the upper 1,000 feet of water-bearing strata. Groundwater data are limited for the Imperial Valley area because of the poor quality and poor yields in the upper 300 feet. Historically there has been little need to investigate and develop the groundwater in the Imperial Valley area due to the availability and low cost of imported surface water. Studies indicate that groundwater in the Imperial Valley generally occurs in two water-bearing zones: (1) a shallow unconfined aquifer from 0 to 300 feet that is bounded at depth by a low-permeability clay; and (2) an intermediate semi-confined aquifer from 300 to 1,500 feet that is bounded above by the aquitard and at depth by the older marine and non-marine sediments (Tetra Tech 1999; Montgomery Watson 1995). A third, deeper aquifer has been identified by some authors that may be present at depths greater than 1,500 feet, but is likely a poor water supply resource (Durbin and Imhoff 1993). Hydraulic communication between the upper unconfined and lower semi-confined water-bearing zones is weak, but varies depending on geographic location. Elevations of the base of the deeper aquifer vary from -800 feet MSL in the center of the Salton Trough to -200 feet MSL in the northeast. The upper aquifer averages 250 feet in thickness, and the deeper aquifer averages 550
City of El Centro 2015 Urban Water Management Plan Chapter 6
6-17
feet in thickness. The aquitard separating the two water-bearing zones varies in thickness from 0 to 260 feet. This aquitard reportedly pinches out near East Mesa and toward the West Mesa, such that only one somewhat homogenous aquifer is present in the mesas adjoining the Imperial Valley area. 6.2.3 West Mesa Groundwater Basin West Mesa is a loosely defined area of gently sloping desert land that lies to the south of the Salton Sea, west of the Westside Main Canal, and east of the Coyote and Jacumba Mountains. The area includes portions of several small groundwater subbasins for which little information is known. The exception being the Ocotillo/Coyote Wells Subbasin, for which a study by USGS for IC/USGS and two groundwater studies by Bookman Edmonton for U.S. Gypsum (Bookman-Edmonston 1996; Bookman-Edmonston 2004) provide information on both the quality and quantity of available groundwater; the sub basin was designated a sole source aquifer by USEPA in 1996.10 Underlying geology is critical for both water levels and water quality in the Ocotillo-Coyote Wells basin, with some domestic wells having non-potable water. This part of West Mesa includes the area around the town of Plaster City where the U.S. Gypsum plant operates. The groundwater aquifer in the Ocotillo/Coyote Wells Subbasin is unconfined, with a saturated thickness of approximately 400 feet and an average depth-to-groundwater of approximately 100 feet. The aquifer is generally homogenous and more coarse-grained than the Imperial Valley. The data do not indicate separate water-bearing zones or intervening aquitards of any regional significance. Groundwater and surface water flows east toward discharge areas in the Imperial Valley and Salton Sea. 6.2.4 Watersheds Imperial Region lies wholly within the Salton Sea Transboundary Watershed (USGS Hydrologic Unit 18100200), which is the Priority Watershed in the Colorado River Basin Region. It encompasses one-third of the region (about 8,360 square miles) and contains five (out of a total of six) of the Region's impaired surface waterbodies. Most of the watershed is in Imperial County. The watershed has been identified as a Category I (impaired) Watershed under the 1998 California Unified Watershed Assessment. The watershed contains five main surface waterbodies: the Salton Sea, the New River, the Alamo River, the Imperial Valley Agricultural Drains, and the Coachella Valley Stormwater Channel. The Salton Sea is California's largest lake and was famous for its sport fishery and recreational uses. It is about 35 miles long and 9-15 miles wide with approximately 360 square miles of water surface and 105 miles of shoreline. The surface of the sea lies approximately 232 feet below sea level. One of the major functions of the Salton Sea is to serve as a sump for agricultural wastewater for the Imperial and Coachella Valleys. Approximately 75% of the freshwater inflow to the Sea is agricultural drain water from Imperial Valley. As the Sea has no outlets, salts concentrate in it and nutrients enhance the formation of eutrophic conditions. Currently, the Sea is 25% saltier than the ocean, with salinity increasing at approximately 1% per year. The New River originates in Mexico. It flows approximately 20 miles through the City of Mexicali, Mexico, crosses the International Boundary, continues through the City of Calexico in the United
City of El Centro Chapter 6 2015 Urban Water Management Plan
6-18
States, and travels northward about 60 miles until it empties into the Salton Sea. Its flow at the International Boundary is about 108,400 to 145,000 acre-feet per year (AFY). The New River carries urban runoff, untreated and partially treated municipal wastes, untreated and partially treated industrial wastes, and agricultural runoff from the Mexicali Valley, Mexico across the International Boundary into the United States. In addition, the River carries urban runoff, agricultural runoff, treated industrial wastes, and treated, disinfected and non-disinfected domestic wastes from the Imperial Valley. It also carries approximately 4,350 to 7,970 AFY of treated wastewater from point sources in Imperial Valley. The New River flow at the Salton Sea is about 430,000 AFY. The Alamo River channel originates approximately 2 miles south of the International Boundary with Mexico, and runs northward. Across the border it flows for about 50 miles until it empties into the Salton Sea. The Alamo River is dominated by agricultural return flows from Imperial Valley. It also carries approximately 15 to 27 cubic feet per second (cfs) (10,867 to 19,200 AFY) of treated wastewater from point sources in Imperial Valley. Its flow at the International Boundary is 3 to 5 cfs (2100 to 3620 AFY), whereas at its delta with the Salton Sea is about 800 to 1000 cfs (600,000 to 800,000 AFY).15 The Ag Drain system comprises over 1,450 miles of surface drains, which discharge into the Alamo and New Rivers and the Salton Sea. The Ag Drains primarily carry agricultural runoff from the Imperial Valley. Agricultural discharges in the Imperial Valley average about 830,000 acre-feet/year. Of this amount, approximately 36 percent is tailwater, 33 percent is seepage, and 30 percent is tilewater. The resulting mix of tailwater, tilewater, and seepage contains pesticides, nutrients, selenium, and silt in amounts that violate water quality standards. 6.2.5 Groundwater Quality Beneath East Mesa the water quality is moderate to poor and has been locally influenced by seepage from the major conveyance canals (All American and East Highline canals). Higher than recommended concentrations of nitrate and fluoride for drinking water are common and elevated concentrations of sulfate may also be present. Concentrations of boron are typically higher than those recommended for certain agricultural crops. Elevated levels of selenium present in IID drain water are thought to be an imported contaminant from the Colorado River supply. Total dissolved solids (TDS) concentrations were summarized for three distinct water-bearing zones, shallow (80’ to 300’), intermediate (300’ to 1,500’) and deep (>1,500’) aquifers (Durbin and Imhoff 1993). The shallow aquifer contains highly variable water quality, ranging from 800 to over 10,000 milligrams per liter (mg/L) TDS. Relatively consistent water quality is present in the shallow aquifer beneath East Mesa ranging from 800 to 2,200 mg/L TDS. The intermediate aquifer contains water that is uniform averaging 2,200 mg/L, while the deep aquifer contains the poorest quality water. The Imperial Valley contains a large area of poor quality groundwater that is generally unsuitable for domestic or irrigation use without treatment. The chemical quality of groundwater differs greatly from place to place, and salinity is the primary water quality issue. TDS range from a few hundred to more than 10,000 mg/L. West Mesa groundwater is derived from recent precipitation that has not yet reached the more saline deposits of the central part of the valley and may contain a TDS concentration which ranges from

City of El Centro 2015 Urban Water Management Plan Chapter 6
6-19
about a high quality of 300 ppm TDS to non-potable with over 2000 ppm and even up to 6,000 ppm in some wells in the Nomirage area because wells are drilled into old marine or brackish deposits along the northern side of the Jacumba Mountains. DWR Table 6-1 is to show groundwater pumped for the last five years. As the City did not pump groundwater in the past five years, this table was omitted. 6.3 SURFACE WATER The City does not use, or plan to use, self-supplied surface water as part of its water supply. The City purchases surface water from IID, which is not self-supplied. 6.4 STORMWATER
The city captures runoff in retention/detention basins, which discharge to IID drains. The City is currently not using stormwater to meet local water supply demands. At this time, there are no plans to utilize stormwater, but that could change in the future. 6.5 WASTEWATER AND RECYCLED WATER
El Centro collects sanitary wastewater flows within the City’s water service area and conveys the flows to the municipal wastewater treatment plant located on La Brucherie Rd. in the northwest part of the City. The City operates and maintains the wastewater collection system and the treatment plant. Metered wastewater flows averaged 3.4 MGD (3,800 AFY) for 2015 as shown in Table 6-2.
Table 6‐2: Wastewater Collected Within Service Area in 2015
Wastewater Collection Recipient of Collected Wastewater
Wastewater Collection Agency
Wastewater Volume
Metered or Estimated?
Volume of Wastewater Collected in 2015 (AFY)
Wastewater Treatment Agency
Treatment Plant Name
Is WWTP Located
Within UWMP Area?
City of El Centro Metered 3,800 City of El Centro El Centro Yes
Total 3,800
The wastewater treatment plant, which has a plant capacity of 8.0 MGD (8,960 AFY), provides primary and secondary treatment with ultraviolet (UV) disinfection. The plant does not have tertiary treatment facilities and does not produce recycled water. All treated effluent is discharged to the Central Main Drain. Due to the poor percolation of local soils, high water table, old infrastructure, and depth of infrastructure, groundwater infiltration has become a problem. A Capital Improvement Plan has been completed, but has not been adopted. The upgrades would be dependent upon development impact fees and reimbursement agreements. No community in the Imperial Region produces recycled water as studies have found the capital costs to construct recycled water facilities to be prohibitive relative to the purchase of IID imported water. Also, there has been a lack of political acceptance for rate increases as rate-payers have a limited ability or willingness to pay. Most communities identified the need for State, federal, or private sector funding to upgrade wastewater treatment plants. Wastewater facilities within the Imperial Region ultimately discharge to the Salton Sea (via drains and/or the Alamo River or New
City of El Centro Chapter 6 2015 Urban Water Management Plan
6-20
River). The flows help sustain habitat along IID drains and the New and Alamo rivers. The Salton Sea depends on agricultural and IID system discharges, direct rainfall, and municipal wastewater inflows to offset the effect of evaporation on salinity levels. Regional recycled water opportunities were evaluated in the 2012 Imperial Integrated Regional Water Management Plan. Recycled water could be used to supplement or replace Colorado River water used to irrigate local golf courses, recreational areas, green spaces, or nearby agricultural land. Recycled water could be used to create or maintain habit features or for algae production. This would help to free Colorado River water for future industrial growth or other beneficial uses. Imperial Region has 14 wastewater treatment plants and discharge locations. Wastewater effluent volume is approximately 16,000 acre-feet per year and future volume is projected to exceed 36,000 acre-feet per year. If all the wastewater available were reclaimed, it would only provide a fraction of the Region’s forecasted future demand for renewable energy, which is between 146,000 and 180,000 acre-feet per year, with and without conservation, respectively. Wastewater treatment plants under review for upgrading to provide tertiary wastewater treatment to supply cooling water for a renewable energy facility are the City of Imperial, City of Brawley and Seeley. While recycled water may not be cost-effective for individual communities since they can obtain less expensive water from IID, it may be a viable method to increase regional water supplies or may become more cost-effective as the cost of water for new users is factored into the planning process. Successful water recycling projects require water user acceptance and commitment, public support and acceptance, evaluation of environmental impacts and benefits, and analysis of economic feasibility. Growers have expressed concern with proposals to blend tertiary treated Title 22 compliant water in IID irrigation canals. Public acceptance of recycled water remains a major obstacle to implementation of water recycling projects. The following four water quality characteristics have been identified as being of particular concern regarding confidence in the safety of the water: (1) microbiological quality, (2) salinity, (3) heavy metals, and (4) organic and inorganic substances such as pharmaceuticals and personal care products, household chemicals and detergents, fertilizers, pesticides, fungicides, and animal growth hormones. Salinity is a particular concern in the Imperial Region. Municipal water supplies of raw Colorado River water typically have salinity levels above 760 ppm, and municipal use typically adds 300 ppm. TDS levels of 1,000 ppm adversely affect most crops or require changes in irrigation practices (e.g., increased leaching). Thus, recycling for irrigation may require desalting, blending with other supplies, or changes in agricultural practices. The County General Plan Water Element identifies the major environmental issues expected to be of concern with local tertiary treatment systems:
Reduction of flows in IID drains Reduction of flows to Salton Sea Increase in drain water salinity Impact on fish and wildlife, recreation, and aesthetic values
City of El Centro 2015 Urban Water Management Plan Chapter 6
6-21
Any diversion of flows may have environmental impacts on the drains, rivers and/or the Salton Sea, and related mitigation costs must be factored into reuse strategies. Directing treated discharges away from the Salton Sea may not be feasible until the Salton Sea salinity level impedes fish production or has been restored and is not dependent on the inflows (Salton Sea Authority, 2006). Also, additional treatment to facilitate recycling could result in the concentration of contaminants in the remaining flows discharged to the drains or rivers. Imperial County and IID will work to advance recycled water use in the region by:
Integrating the recycling municipal wastewater with a regional mitigation banking strategy.
Supporting wastewater facility plant upgrades that propose reclaiming municipal water for use in renewable energy projects that are planned for Seeley, Brawley, and Imperial and include as part of the near-term strategy.
Requiring mitigation to meet state and federal environmental requirements related to
reduction in flows to IID drains and to the New and Alamo rivers and other waterways through development of a regional mitigation bank; seek to provide regional benefits, create partnerships, and meet multiple Imperial IRWMP goals by using reclaimed wastewater for this purpose where cost-effective and timely.
Considering regional municipal water reclamation projects to increase cost-effectiveness of project development and operation, provide benefits to multiple parties, and improve opportunities to reuse the water.
Providing policy and financial incentives for public/private partnerships to construct
municipal recycling facilities and for crediting the produced water to sponsoring entities to allow for exchange of produced water for delivery of Colorado River water.
Continuing to evaluate the cost-effectiveness and political viability of regional municipal
wastewater treatment facilities that include reclaiming wastewater as part of the mid- and long-term water management strategy.
Coordinating and adopting appropriate policies to encourage use of recycled municipal
water in-lieu of Colorado River water to mirror California Energy Commission (CEC) and SWRCB policy.
Wastewater treatment and discharge characteristics associated with the City are shown in Table 6-3. Note that DWR Tables 6-4, 6-5, and 6-6 are to show historical, existing and projected recycled water use. As the City has not and does not project recycled water use, these Tables were not used. 6.6 DESALINATED WATER OPPORTUNITIES The Imperial Region has very few desalination facilities. Some of the geothermal plants are using very high temperature fluids that flash to steam under the reduced pressures at the land surface. The resultant steam, once condensed, results in fresh water. The highly concentrated fluids and solids that remain are then re-injected into the underground formations. One of the possibilities is to desalinate IID drain water to create additional fresh water supplies and support transfer of water via exchange.
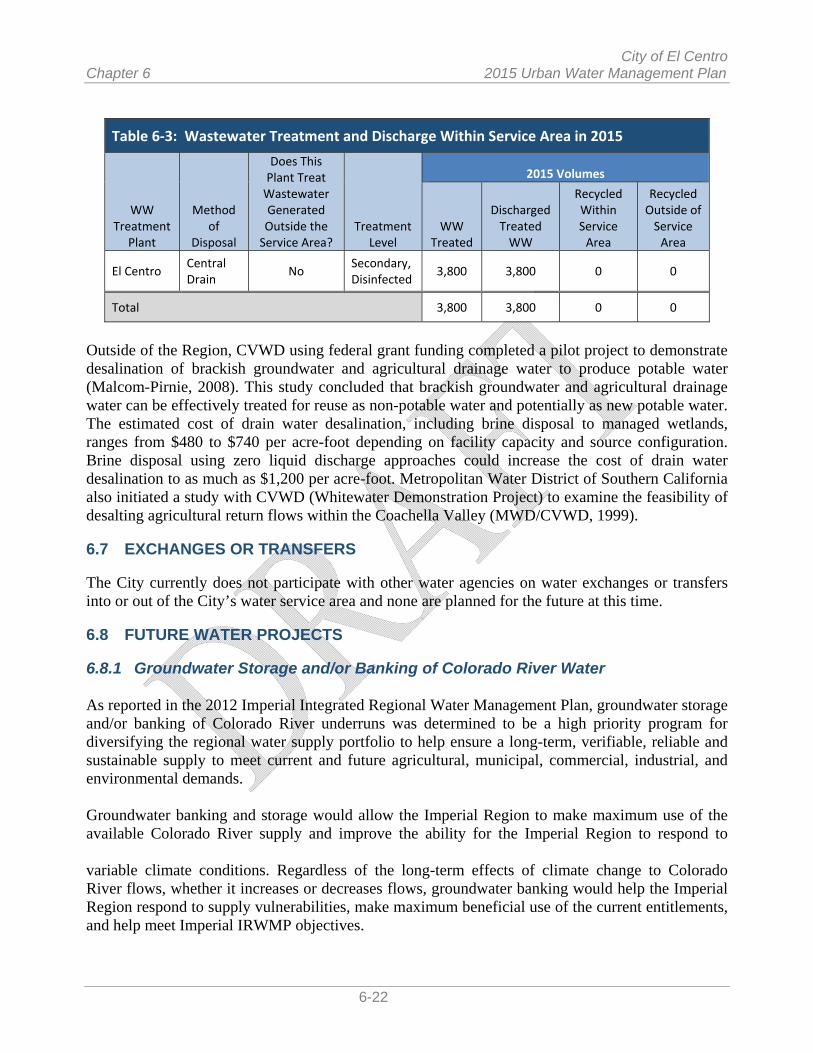
City of El Centro Chapter 6 2015 Urban Water Management Plan
6-22
Table 6‐3: Wastewater Treatment and Discharge Within Service Area in 2015
WW Treatment
Plant
Method of
Disposal
Does This Plant Treat Wastewater Generated Outside the Service Area?
Treatment Level
2015 Volumes
WW Treated
Discharged Treated WW
Recycled Within Service Area
Recycled Outside of Service Area
El Centro Central Drain
No Secondary, Disinfected
3,800 3,800 0 0
Total 3,800 3,800 0 0
Outside of the Region, CVWD using federal grant funding completed a pilot project to demonstrate desalination of brackish groundwater and agricultural drainage water to produce potable water (Malcom-Pirnie, 2008). This study concluded that brackish groundwater and agricultural drainage water can be effectively treated for reuse as non-potable water and potentially as new potable water. The estimated cost of drain water desalination, including brine disposal to managed wetlands, ranges from $480 to $740 per acre-foot depending on facility capacity and source configuration. Brine disposal using zero liquid discharge approaches could increase the cost of drain water desalination to as much as $1,200 per acre-foot. Metropolitan Water District of Southern California also initiated a study with CVWD (Whitewater Demonstration Project) to examine the feasibility of desalting agricultural return flows within the Coachella Valley (MWD/CVWD, 1999). 6.7 EXCHANGES OR TRANSFERS The City currently does not participate with other water agencies on water exchanges or transfers into or out of the City’s water service area and none are planned for the future at this time. 6.8 FUTURE WATER PROJECTS 6.8.1 Groundwater Storage and/or Banking of Colorado River Water As reported in the 2012 Imperial Integrated Regional Water Management Plan, groundwater storage and/or banking of Colorado River underruns was determined to be a high priority program for diversifying the regional water supply portfolio to help ensure a long-term, verifiable, reliable and sustainable supply to meet current and future agricultural, municipal, commercial, industrial, and environmental demands. Groundwater banking and storage would allow the Imperial Region to make maximum use of the available Colorado River supply and improve the ability for the Imperial Region to respond to variable climate conditions. Regardless of the long-term effects of climate change to Colorado River flows, whether it increases or decreases flows, groundwater banking would help the Imperial Region respond to supply vulnerabilities, make maximum beneficial use of the current entitlements, and help meet Imperial IRWMP objectives.

City of El Centro 2015 Urban Water Management Plan Chapter 6
6-23
Development of groundwater storage and banking facilities requires a source of good quality water; conveyance facilities to put water into groundwater storage (canals, pipelines, recharge ponds); facilities to extract water from storage and deliver the water to the point of use (wells, canals, or pipelines); and recharge areas with appropriate groundwater conditions. Conveyance includes using the existing regional Colorado River delivery canals when there is available capacity and developing smaller conveyances to move water into and out of the recharge area or wellfields used to recover recharged water. Developing recharge ponds requires access to relatively large tracts of land. In areas like East Mesa where the groundwater levels are relatively high, groundwater can be pumped to make storage space available. The groundwater conditions that influence site selection and design of recharge ponds and wells include permeability of the surface soils and underlying aquifers, the extent of clay layers, location of faults, groundwater quality, and current levels of groundwater use. Alternative supplies available for groundwater storage or banking in the Imperial Region include Colorado River water, local runoff and floodwaters, and imported water from other regions. Of these alternative supplies, Colorado River entitlements were determined to be the best and most feasible source for groundwater storage. Groundwater storage is a beneficial use consistent with IID Colorado River water rights and California state law. The IID entitlement is fixed, but the agricultural demands vary year to year, resulting in underruns and overruns. IID could divert water in underrun years to store in a groundwater basin for future use. Given the groundwater banking and storage options available to the Region, not all underruns could be captured for groundwater recharge. Conservatively estimated, the yield could be between 19,000 and 55,000 acre-feet per year depending on assumptions related to capping overruns, depleting groundwater storage, and how the water would be distributed. Higher yields are related to managing overruns through demand management and the IID Equitable Distribution Plan, because limiting overruns decreases IID’s payback requirement, thus increasing the amount of water available for use or retained in storage in future years. The stored water could be pumped and used by agricultural and other current users, and/or be provided to meet future water demands to avoid potential impacts to current water users. When IID is not able to divert underrun water in any given year to store the water in the groundwater basin, those with junior rights to the Colorado River are able to divert the water. Imperial Region already has facilities in place to convey Colorado River water to candidate groundwater recharge locations. Colorado River water is conveyed through the 80-mile-long All-American Canal and diverted to CVWD’s Coachella Canal and to IID’s East Highline, Central Main, and Westside canals. Operational capacity in the All-American Canal and other canals would be needed when Colorado River water is available for delivery to recharge sites. No capacity limitations were identified in existing conveyance facilities based on the water availability and operational scenarios that were considered. For the reconnaissance study, smaller conveyance canals were configured to move water from the main canals to proposed recharge areas and from wellfields to the point of delivery In selecting Imperial Region Groundwater Recharge Areas, conducting additional feasibility study and/or pilot projects is recommended to fill data gaps and resolve uncertainties regarding selection of a preferred area and location. Under California law, water recharged into an aquifer is

City of El Centro Chapter 6 2015 Urban Water Management Plan
6-24
recoverable by the party that conducted the recharge operation and put the water into storage, so any water intentionally recharged should be recoverable. For the Imperial IRWMP, the feasibility of wellfields and recharge facilities in East Mesa, Sand Hills, and the Pilot Knob Mesa areas were reviewed using existing data and reports. The general concept of a groundwater recharge program in the East Mesa was investigated by the Colorado River Board of California and the USBR (USBR, 1992; USBR, 1979). West Mesa groundwater storage and in-lieu storage were also explored. East Mesa provides the best opportunity for development of recharge and storage projects. IID entitlements to Colorado River water could be conveyed through the All-American and Coachella canals, and smaller project-specific conveyance could be developed to move water to proposed recharge ponds or the unlined portions of the old and unused Coachella Canal. A 15-mile section of the unlined Coachella Canal west of the San Andreas Fault was abandoned when the lined canal was constructed. The unlined Coachella Canal has the ability to recharge about 10,000 acre-feet per year per mile (USBR, 1992). If all of the unlined section were used, up to 150,000 acre-feet per year could be recharged. Clay was used to reduce seepage from the unlined canal and removal of the clay layer might increase the percolation rate. To keep the recharge near the wellfields, modifying a two-mile long section of the unlined Coachella Canal could provide capacity to percolate 20,000 to 40,000 acre-feet per year. Wellfields would be located to extract water from storage and to recapture the recharged water. Groundwater levels are relatively shallow in this area. This means available groundwater storage space is relatively full and could be pumped to create storage for Colorado River water. Pumped water quality may be ready for direct delivery or for blending. In areas of saline water, water pumped to evacuate groundwater storage for recharging Colorado River waters would either need to be treated (desalination) before use or the brackish groundwater be matched to an appropriate beneficial use. Put and take operations could be configured and tested to time recharge and pumping cycles to create and maintain a pocket of Colorado River water in the East Mesa. Groundwater storage and banking projects are mid- to long-term opportunities. Specific groundwater storage and banking projects require further feasibility study and site investigations to better define water quality, hydrogeology, and design parameters; to optimize the recharge/extraction operations; and to compare local and interregional opportunities. The short-term focus will be on conducting needed feasibility studies and/or pilot and demonstration projects to obtain needed data; selecting a preferred groundwater banking alternative; developing final project designs and funding requirements; and seeking State and federal grant funding to conduct the needed evaluations and pilot projects. DWR Table 6-7 is to show future water supply projects or programs that provide a quantifiable increase to an agency’s water supply. As there are no future IID water supply projects or programs that provide a quantifiable increase to IID’s water supply at this time, this table was omitted. 6.9 SUMMARY OF EXISTING AND PLANNED SOURCES OF WATER Surface water imported from the Colorado River by IID is the primary water supply for the Imperial

City of El Centro 2015 Urban Water Management Plan Chapter 6
6-25
Region and the sole water supply for the City of El Centro. Colorado River water is used to meet all current agricultural and non-agricultural water demands in the IID water service area.
Rainfall is less than three inches per year and does not contribute to IID water delivery, although at times it does increase or reduce agricultural water demand. Groundwater in the Imperial Valley is of poor quality and is generally unsuitable for domestic or irrigation purposes, though some is pumped for industrial (geothermal) use.
As reported in the 2012 Imperial Integrated Regional Water Management Plan, groundwater storage and/or banking of Colorado River underruns was determined to be a high priority program for diversifying the regional water supply portfolio to help ensure a long-term, verifiable, reliable and sustainable supply to meet current and future agricultural, municipal, commercial, industrial, and environmental demands. Groundwater storage and banking projects are mid- to long-term opportunities. Specific groundwater storage and banking projects require further feasibility study and site investigations to better define water quality, hydrogeology, and design parameters; to optimize the recharge/extraction operations; and to compare local and interregional opportunities.
The City collects municipal wastewater and sewers it to their wastewater treatment plant, which has a plant capacity of 8.0 MGD (8,960 AFY) and provides primary and secondary treatment with ultraviolet (UV) disinfection. The plant does not have tertiary treatment facilities and does not produce recycled water. All treated effluent is discharged to the Central Main Drain. At this time, no community in the Imperial Region produces recycled water as studies have found the capital costs to construct recycled water facilities to be prohibitive relative to the purchase of IID imported water. Although the City of El Centro has been in talks with a geothermal energy company regarding upgrading the wastewater treatment plant to tertiary treatment in exchange for access to tertiary treated effluent, and Imperial County and IID are working to advance recycled water use in the region, nothing is definitive at this time, and future recycled water use by the City cannot be projected in this UWMP. The City’s actual water supplies for 2015 and projected supplies for 2020 through 2040 are shown in Table 6-8 and Table 6-9, respectively.

City of El Centro Chapter 6 2015 Urban Water Management Plan
6-26
6.10 CLIMATE CHANGE IMPACTS TO SUPPLY As discussed in Section 4.6, Climate change predictions for the Imperial Region were derived by analyzing global climate model (GCM) simulations of past and future climate as presented in the 2012 Imperial Integrated Regional Water Management Plan.
Table 6‐8: Water Supplies — Actual
Water Supply
Additional Detail on Water Supply
2015
Actual Volume Water Quality
Purchased or Imported Water
Treated IID water 7,117 Drinking Water
Total 7,117
Table 6‐9: Water Supplies — Projected
Water Supply
Additional Detail
Projected Water Supply
2020 2025 2030 2035 2040
Volume(a) Volume(a) Volume(a) Volume(a) Volume(a)
Purchased or Imported Water
Treated IID water
8,880 9,081 9,300 9,536 9,790
Total 8,880 9,081 9,300 9,536 9,790
(a) Supply expected to be reasonable available

City of El Centro 2015 Urban Water Management Plan Chapter 7
7-1
7 WATER SUPPLY RELIABILITY ASSESSMENT 7.1 CONSTRAINTS ON WATER SOURCES
7.1.1 Reliability of Colorado River Surface Water Supplies IID, the City’s wholesaler, has significant historical legal protections in place to maintain its Priority 3(a) water right to consumptive use of 3.1 MAF per year under the QSA/Transfer Agreements and its Priority 6(a) to 300 KAF per year. IID’s present perfected right of 2.6 MAF per year makes the supply very reliable in terms of IID’s ability to provide water to the service area even in dry years (as defined by elevations in Lake Mead under the 2007 Interim Guidelines for Lower Basin Shortages) as present perfected rights are the last to be reduced in time of drought. However, given the terms of IID’s Priority 3(a) quantification (Table 6-0D), even with this level of reliability, IID has begun experiencing years with a supply/demand imbalance (demand exceeding supply) resulting from fluctuations in agricultural use. This is expected to be exacerbated if municipal (residential, commercial, and urban industrial) and industrial (renewable energy) demands increase as forecasted. The reliability and certainty of IID’s ability to deliver Colorado River water and to meet its customers’ demands are governed by a number of factors as briefly summarized below:
1. In years with normal or average Colorado River flows and adequate reservoir storage in Lakes Powell and Mead, IID’s allocation will remain capped at 3.1 MAF.
2. In years with surplus flows of more than 7.5 MAF in the Lower Basin (triggered by elevation of Lake Mead ), the Seven-Party Agreement and the QSA/Transfer Agreements provide for diversions above 4.4 MAF for use in California. The likelihood of surplus flows in the Colorado River has been diminished by increased Colorado River water use by Nevada and Arizona and by the 11-year drought (1999-2010) in the Colorado River watershed that resulted in historically low levels in Lake Mead.
3. Even in drought years, with Lower Colorado River flows less than 7.5 MAF at
Lees Ferry, existing laws and agreements provide security that IID will receive its annual present perfected right of 2.6 MAF and its overall annual water allocation of 3.1 MAF. However, should levels in Lake Mead fall below 1075 feet (critical shortage), other agreements take effect.
IID’s protections are based on the following:
1. 1885 California water right, based on reasonable and beneficial use annually of approximately 7 MAF conveyed to IID on June 22, 1916.
2. 1922 Colorado River Compact requires the Upper Basin states to ensure the annual supply of 7.5 MAF at Lees Ferry for use by the Lower Basin states (actually stated as 75 MAF over 10 years). Thus, it is the responsibility of the Upper Basin states to provide the full Lower Basin allocation, even in drought
City of El Centro Chapter 7 2015 Urban Water Management Plan
7-2
years and even if the 10-year running average annual water supply of the river is less than 15.0 MAF.
3. 1931 Seven-Party Agreement provides a schedule of apportionments and
priorities. 4. In 1931, as a result of the Seven-Party Agreement, IID agreed to limit its
California pre-1914 appropriative water rights in quantity and priority to the apportionments and priorities contained in the Agreement.
5. 1964 Supreme Court decree in California v. Arizona defined the present
perfected rights on the Colorado River and set IID’s at 2.6 MAF annually because that was the annual quantity historically diverted by IID and used to irrigate 424,145 acres.
6. 1968 Colorado River Basin Project Act states that all deliveries to the Central
Arizona Project (CAP) and all other post-1968 water deliveries are subordinate to pre-existing Colorado River water rights in the Lower Basin, regardless of each state’s allocations under the 1928 Boulder Canyon Project Act.
7. 1979 Supplemental Decree in Arizona v. California retains IID’s present
perfected rights to use of Colorado River water. If water supply shortages occur along the Colorado River, IID’s present perfected rights must be satisfied prior to the satisfaction of any non-perfected rights, regardless of state lines and federal agreements.
8. 2007 Colorado River Interim Guidelines for Lower Basin Shortages and
Coordinated Operations for Lake Powell and Lake Mead provide that shortages in Lake Mead storage (decreasing water levels in the reservoir) will prompt reductions in the annual deliveries to Arizona and Nevada but that California will remain at 4.4 MAF per year.26
If California’s annual consumptive use remains at 4.4 MAF, then IID deliveries should likewise remain at the levels described in CRWDA Exhibit B (Table 6-0D), decreasing from just over 2.97 MAF in 2003 to 2.53 in 2017 (due to required Salton Sea mitigation flow), then increasing in 2018 to just over 2.7 MAF; and declining again until the reduction is stabilized in 2026 at just over 2.6 MAF per year. This reduction in net consumptive use is to be achieved through conservation efficiency practices; thereby, retaining the productivity of the agricultural system and meeting the demand of the existing M&I users, allowing for 3.1 MAF in net annual consumptive use. Furthermore, IID has significant historical legal protections in place to maintain its annual Priority 3(a) right to 3.1 MAF of Colorado River water even during periods of lower flow in the Colorado River. 7.1.2 Equitable Distribution Plan Water Apportionment
In some years IID’s total annual consumptive use may exceed its Colorado River entitlement, resulting in inadvertent overruns (annual use that exceeds the capped amount of supply), which IID must pay back in subsequent years from extraordinary
City of El Centro 2015 Urban Water Management Plan Chapter 7
7-3
conservation practices.14 Forecasted increases in M&I demand are expected to exacerbate this condition.
Any time annual consumptive use exceeds the threshold, an inadvertent overrun is charged to IID. In the case of underruns (annual consumptive use is less than capped amount), IID could have taken the underrun had storage been available to IID. Beyond 2011, the underrun potential decreases and overrun potential increases each year that water demand for renewable energy rises and M&I growth occurs on non-irrigated agriculture lands.
To reduce the likelihood of an overrun in any given year, the IID Board approved the 2009 Regulations for Equitable Distribution Plan (EDP) that define how IID will apportion water to its customers should demand be anticipated to exceed available supply.15 When this is projected to occur, the IID Board may declare a supply/demand imbalance.
The IID Board of Directors adopted revised regulations for the EDP on October 28, 2013 (Resolution No. 13-2013).16 Under the terms of the 2013 EDP, apportionment of supply among IID water users is to be based on the following criteria:
a. Municipal Users – Base amount of 2006 usage plus current IID-wide average use per capita multiplied by the increase in population since 2006;
b. Industrial Users – For existing contracts, estimated based on the past use, not to exceed contracted amount and contract terms. For new contracts, estimated based on anticipated use, not to exceed contract amount and contract terms, taking into consideration the Integrated Water Resources Management Plan;
c. Feed Lots, Dairies and Fish Farms – Estimated based upon past use and consideration of future changes;
d. Environmental Resources Water – Estimated based upon the amount reasonably necessary to achieve the purposes of the District’s commitments, taking past use into account; and
e. Agricultural Lands – Straight Line Apportionment used. Subtract the estimated demand for categories a through d above from Available Water Supply, and then divide the remaining supply by the total number of Eligible Agricultural Acres pursuant to Subsections 2.15 a through c to determine the apportionment per Eligible Agricultural Acre. The amount apportioned to acreage that has either suspended farming activities or is no longer receiving agricultural water service (such as renewable energy generation projects), and has been designated as suitable for the Temporary Land Conversion Fallowing Policy, is subject to a District Conservation Assignment (IID, 2013).
The baseline District-wide average is taken to be the year 2006 calculated average of approximately 0.26 AFY per capita (232 gpcd). A calculation for the EDP apportionment is to be done by IID at the end of each year using the District-wide average from the preceding year.
14 Per terms of the USBR Inadvertent Overrun and Payback Policy 15 EDP, IID 2009. <http://www.iid.com/index.aspx?page=144> 16 IID 2013 Regulations for EDP. <http://www.iid.com/Modules/ShowDocument.aspx?documentid=7749>
City of El Centro Chapter 7 2015 Urban Water Management Plan
7-4
The District will notify non-agricultural users of their apportionment no later than December 1, prior to the beginning of the water year. Non-agricultural water users will be allowed to use that amount of water needed for reasonable and beneficial use. If a non-agricultural water user’s usage exceeds the amount of apportionment quantified for its usage, the fee for the excess amount of water shall be the water user’s standard water rate plus the conserved water rate (rate specified in the District's Rate Schedule 13).
For agricultural water users, implementation of the EDP will cap their annual water apportionments and call into effect measures that require additional planning and water management actions, with resulting higher costs.
Urban (domestic, commercial and urban industrial) and environmental uses are not required to cut back as much as agriculture (if at all) during a year that EDP is in effect. The higher degree of reliability and change in timing of deliveries granted to non-agricultural users by IID can reduce the supply available to agricultural water users in any year that EDP is in effect – especially if new developments, with their associated water supply requirements, are approved.
7.2 RELIABILITY BY TYPE OF YEAR An important caveat for IID Colorado River water accounting is that, under the Law of the River and the QSA/Transfer Agreements, consumptive use is not the same as delivery. Table 6-0C (IID Net Consumptive Use Schedule 2003-2077 extracted from KAF, CRWDA Exhibit B) shows IID’s Priority 3(a) Quantified Amount (Column 2), IID Reductions (Columns 3-9), IID Total Reduction (Column 10) and IID Net Consumptive Use Amount (Column 11), all volumes at Imperial Dam. This exhibit regulates IID’s annual supply and accounts for IID’s water transfer and other obligations.
In years when agricultural demand is higher than the projected use with conservation as in years of low rainfall or due to market driven cropping choices, IID water use may exceed the quantified amount. If there are not drought conditions on the Colorado River, IID has up to three years under the IOPP to pay that water back. However, in years of drought (Lake Mead water level at 1125 feet or less), the 2007 Interim Guidelines come into effect and outstanding overruns must be paid back in the calendar year following publication of the overrun in the USBR LCR Decree Accounting Report.
7.2.1 Normal Year Supply and Demand
Due to IID annual consumptive use limits under the QSA/Transfer Agreements, water supplies during a normal year are best represented by the CRWDA net consumptive use amount shown in Column 11 of Table 6-0C (IID Net Consumptive Use Schedule 2003-2077 extracted from KAF, CRWDA Exhibit B). These annual values plus an adjustment for normal rainfall of 3 inches/year, represent the maximum available supply for each year. IID suggests that Table 6-0C, which assumes full use of IID’s quantified water supply, be used in determining base normal year water availability.
City of El Centro 2015 Urban Water Management Plan Chapter 7
7-5
7.2.2 Single-Dry Year Supply and Demand Because of the low rainfall in the IID water service area, dry and multiple-dry water year analysis assumes one of the following scenarios is in effect:
1. USBR has declared a normal condition for deliveries to the Colorado River Lower Basin, and rainfall is scarce and creates drier than normal local conditions in the IID water service area. The year of 2006 with 0.43 inches of rain – well below the 93-year average of 3.15 inches – and relatively high IID consumptive use of Colorado River water is deemed the “dry” water year.
2. USBR has declared a normal condition for deliveries to the Colorado River Lower Basin, and an apportionment has been declared by IID’s Board of Directors for the year.
3. USBR has declared a shortage for deliveries to the Colorado River Lower Basin,
IID has outstanding overruns to pay back to the river, and an apportionment is in effect with or without conditions similar to those in 2012 IWSP Water Agreement.
On November 28, 2006, the IID Board of Directors adopted Resolution No 22-2006 approving development and implementation of an Equitable Distribution Plan to deal with times when customers’ demand would exceed IID’s Colorado River supply; such as scenarios 2 and 3, above. As part of this Resolution, the IID Board directed the General Manager to prepare the rules and regulations necessary or appropriate to implement the plan within the District, which the board adopted in November 2006. The IID 2013 Revised EDP, adopted by the Board on October 28, 2013, allows IID to pay back its outstanding overruns using EDP Apportionment, and it is expected that an annual EDP Apportionment will be established for each of the next several years, if not for the duration of the QSA/Transfer Agreements. For purposes of this UWMP, years with a shortage condition that impacts non-agricultural projects such as an IOPP payback obligation constitute “dry” years for IID. For single-dry year and multiple-dry water year assessments, IID’s EDP governs. IOPP payback, EDP Apportionment, and the IWSP are further discussed under single-dry and multiple-dry year projections. 7.2.2.1 Water Management under EDP Apportionment On January 1, 2013, the water level in Lake Mead was 1120.5 feet, and for the first time since the IOPP came into effect Lower Colorado River Basin water users face a shortage condition (Figure 7-2). For IID, this means that outstanding overruns must be paid back to the river in calendar years 2013 and 2014 as described below and shown in Table 7-1a.

City of El Centro Chapter 7 2015 Urban Water Management Plan
7-6
Table 7‐1a. IID Inadvertent Overrun Payback to the Colorado River under the IOPP, 2012‐2014
Calendar Year of Payback
2011 Overrun Payback (AF)
2012 Overrun Payback (AF)
Payback Total for Calendar Year (AF)
2013 55,710 ‐ 55,710
2014 20,662 134,076 154,738
Total Payback 76,372 134,076 210,448
Notes: All values are consumptive use volumes at Imperial Dam (AF). 2013 Payback Total was 62 KAF, but in 2012 IID had 6,290 AF of early payback, reducing volume to 55,710 AF
IID’s maximum allowable cumulative overrun account is 62,000 AF.17 Thus, for IID’s 2011 overrun of 82,662 AF (which was published in 2012), 62,000 AF were to be paid back at the river in calendar year 2013, with the remaining 20,662 AF to be paid back in 2014; however, due to an early payback of 6,290 AF in 2012, IID had 55,710 AF to pay back in 2013 and 20,662 AF of the 2011 overrun to pay back in 2014. In addition, because of the low level of Lake Mead on Jan 1, 2013, IID’s entire 2012 overrun of 134,076 AF had to be paid back in 2014, for a total of 154,738 AF in 2014. Furthermore, under the terms of the IOPP, no overruns are allowed in a year when payback is required.
Figure 7‐2. Lake Mead IOPP Schematic
The 2013 IOPP payback obligation and prohibition on overruns in payback years, led the IID Board to implement an apportionment program pursuant to the 2009 Regulations for EDP, which were subsequently revised and modified. The Revised 2013 EDP version was approved and adopted by the IID Board on October 28, 2013. The Revised 2013
17 For IID Quantified Amount: 3.1 MAFY *10 percent = 310,000 AF allowable cumulative overrun account amount; minimum repayment in a calendar year is the less of 310,000 * 20 percent = 62,000 or the amount in the account, if less than 62,000 AF.

City of El Centro 2015 Urban Water Management Plan Chapter 7
7-7
EDP also establishes an agriculture water clearinghouse to facilitate the movement of apportioned water between agricultural water users and between farm units. This is to allow growers and IID to balance water demands for different types of crops and soils with the apportionments that are made. IID’s Water Conservation Committee agreed on a July 1, 2013 start date for the agricultural water clearinghouse.
7.1.2.2 Dry Year Demand
In the case of demand, IID notes that, in general, an inch of rainfall over the IID service area can result in 40,000 to 60,000 AF of reduction in IID’s consumptive use of Colorado River water as measured at Imperial Dam. Calendar year 2003 had rainfall of 2.72 inches – the closest in recent years to the 93-year average of 3.15 inches. For this reason, 2003 is deemed a “normal” year. IID’s projected Net Consumptive Use (CRWDA Exhibit B) amount that year (2003) was 2,963.5 KAF (see Table 6-0C) For the selected “dry” water year of 2006, with 0.43 inches of rainfall, IID’s projected Net Consumptive Use was 2,909,500 AF; actual Net Consumptive Use was 2,909,680 AF (USBR 2006 Decree Accounting report), with an overrun of 18,914 AF). Agronomic and/or agricultural economic conditions always influence individual farm management decisions and practices and, thus, impacted water use in 2006. For this UWMP, it is assumed that, during a “dry” year, water availability to Imperial Valley water users will be 50,000 AF less for every inch of rainfall less than normal year rainfall (93-year average of 3.15 inches). That in turn, could reduce consumptive use of Colorado River water, especially in a year an inadvertent overrun is not allowed because a payback is in effect and an EDP Apportionment is in effect. Given that IID system and AAC “losses” are the same in normal, wet or dry years; and using 2003 as a base, the following give “Normal Year” and “Dry Year” values:
Normal Year:
1. 2003 Projected Net Consumptive Use (CRWDA Exhibit B, at Imperial Dam) = 2,968,400 AF
2. 2003 Effective Rainfall (Imperial Valley) = (3.15 inches) x (50,000 AF) = 157,500 AF
3. 2003 “Normal Year” Water Availability = 2,968,400 AF + 157,500 AF = 3,125,900 AF less “losses”
Dry Year:
1. 2006 Rainfall = 0.43 inches (the driest year since 1956) 2. 2006 Effective Rainfall = (0.43 inches) x (50,000 AF) = 21,500 AF 3. 2006 “Dry Year” Water Availability = 2,968,400 AF + 21,500 AF = 2,989,900
AF less “losses” This illustrates that water availability in a Dry Year could be around 136,000 AF less than in a Normal Year and that an overrun might be less likely in a Normal Year than in a Dry Year. However, due to the small difference in rainfall in a Dry and Normal Year in the arid Imperial Valley, the impact of agricultural economic decisions may override this distinction.

City of El Centro Chapter 7 2015 Urban Water Management Plan
7-8
Note that while effective rainfall may or may not reduce the amount of Colorado River water needed by agricultural and urban users, it will positively impact the Salton Sea. Effective rainfall has no measurable impact on residential, industrial, or commercial use of Colorado River water.
7.2.2.2 Dry Year Supply
As discussed above, the Revised 2013 Equitable Distribution Plan, is the mechanism by which EDP Apportionment is being administered for dry-year supply. Based on this EDP as discussed above, cuts in supply to non-M&I users would be the first to be cut and while M&I users would be asked to conserve water, the supply would not be reduced. Therefore, single and multiple dry year supplies are shown balanced with demands over the projection period. Basis of water year data and percent of average supply deemed to be available for average year, dry year and multiple dry year conditions is shown in Table 7-1.
Table 7‐1: Basis of Water Year Data
Year Type Base Year
Available Supplies if Year Type Repeats
% of Average Supply
Average Year 2003 100%
Single‐Dry Year 2006 100%
Multiple‐Dry Years 1st Year 2006 100%
Multiple‐Dry Years 2nd Year 2007 100%
Multiple‐Dry Years 3rd Year 2008 100%
7.3 SUPPLY AND DEMAND ASSESSMENT
As stated in CWC 10635(a):
Every urban water supplier shall include, as part of its urban water management plan, an assessment of the reliability of its water service to its customers during normal, dry, and multiple dry water years. This water supply and demand assessment shall compare the total water supply sources available to the water supplier with the total projected water use over the next 20 years, in five-year increments, for a normal water year, a single dry water year, and multiple dry water years. The water service reliability assessment shall be based upon the information compiled pursuant to Section 10631, including available data from state, regional or local agency population projections within the service area of the urban water supplier.
Projected normal-year average-annual City supplies and demands as developed in Table 6-9 and Table 4-3, respectively, are shown in Table 7-2. City demands are estimated to increase by 5 percent during single dry-year and multiple dry-year supply scenarios. Projected single-dry-year average-annual City supplies and demands are shown in Table 7-3. Projected multiple dry-year average-annual City supplies and demands are shown in Table 7-4.

City of El Centro 2015 Urban Water Management Plan Chapter 7
7-9
Table 7‐2: Normal‐Year Supply and Demand Comparison
2020 2025 2030 2035 2040
Supply totals (from Table 6‐9) 8,880 9,081 9,300 9,536 9,790
Demand totals (from Table 4‐3) 8,880 9,081 9,300 9,536 9,790
Difference 0 0 0 0 0
Table 7‐3: Single‐Dry Year Supply and Demand Comparison
2020 2025 2030 2035 2040
Supply totals 9,324 9,535 9,765 10,013 10,280
Demand totals 9,324 9,535 9,765 10,013 10,280
Difference 0 0 0 0 0
Table 7‐4: Multiple Dry Years Supply and Demand Comparison
2020 2025 2030 2035 2040
First year
Supply totals 9,324 9,535 9,765 10,013 10,280
Demand totals 9,324 9,535 9,765 10,013 10,280
Difference 0 0 0 0 0
Second year
Supply totals 9,324 9,535 9,765 10,013 10,280
Demand totals 9,324 9,535 9,765 10,013 10,280
Difference 0 0 0 0 0
Third year
Supply totals 9,324 9,535 9,765 10,013 10,280
Demand totals 9,324 9,535 9,765 10,013 10,280
Difference 0 0 0 0 0


City of El Centro 2015 Urban Water Management Plan Chapter 8
8-1
8 WATER SHORTAGE CONTINGENCY PLANNING A water shortage contingency plan (WSCP) is a document that can be created separately from the UWMP and amended as needed without amending the corresponding UWMP. However, the most current version of the WSCP must be included as part of the UWMP when the UWMP is submitted to DWR. The City adopted their 2010 UWMP by Resolution No. 11-89 on June 21, 2011. A copy of the adopted resolution is included in Appendix C. As part of the City’s 2010 UWMP a WSCP was created and presented in the Plan report. Resolution No. 11-89 declares the following:
1. That the 2010 Urban Water Management Plan is hereby adopted and ordered filed with the City Clerk.
2. That the Mayor is hereby authorized and directed to file the 2010 Urban Water
Management Plan with the California Department of Water Resources within thirty days after this date.
3. That the Mayor is hereby authorized to implement the Water Conservation
Programs as set forth in the 2010 Urban Water Management Plan, which includes water shortage contingency analysis and recommendations to the City Council regarding necessary procedures, rules, and regulations to carry out effective and equitable water conservation programs.
4. That in a water shortage, the Mayor is hereby authorized to declare a Water
Shortage Emergency according to the Water Shortage Stages and Triggers indicated in the Plan, and implement necessary elements of the Plan.
5. That the Mayor shall recommend to the City Council additional regulations to
carry out effective and equitable allocation of water resources. In adopting the 2010 UWMP, the City also effectively adopted the WSCP contained within the Plan. As such, this WSCP from the adopted 2010 UWMP is reiterated in this 2015 Plan. It will be noted that the City plans to develop and adopt the WSCP as a separate document in the near future. 8.1 STAGE OF ACTION The City has four stages of action in their WSCP that reflect decreasing water supplies with increasing levels of prohibitions and consumption reduction methods as shown in Table 8-1. Stage IV is a supply reduction up to 50% or greater or contamination of 40 percent of the water supply, i.e. water quality exceeds primary drinking water standards. Moving from one stage to another is automatically triggered once water supplies have reached a certain percent of average supply.
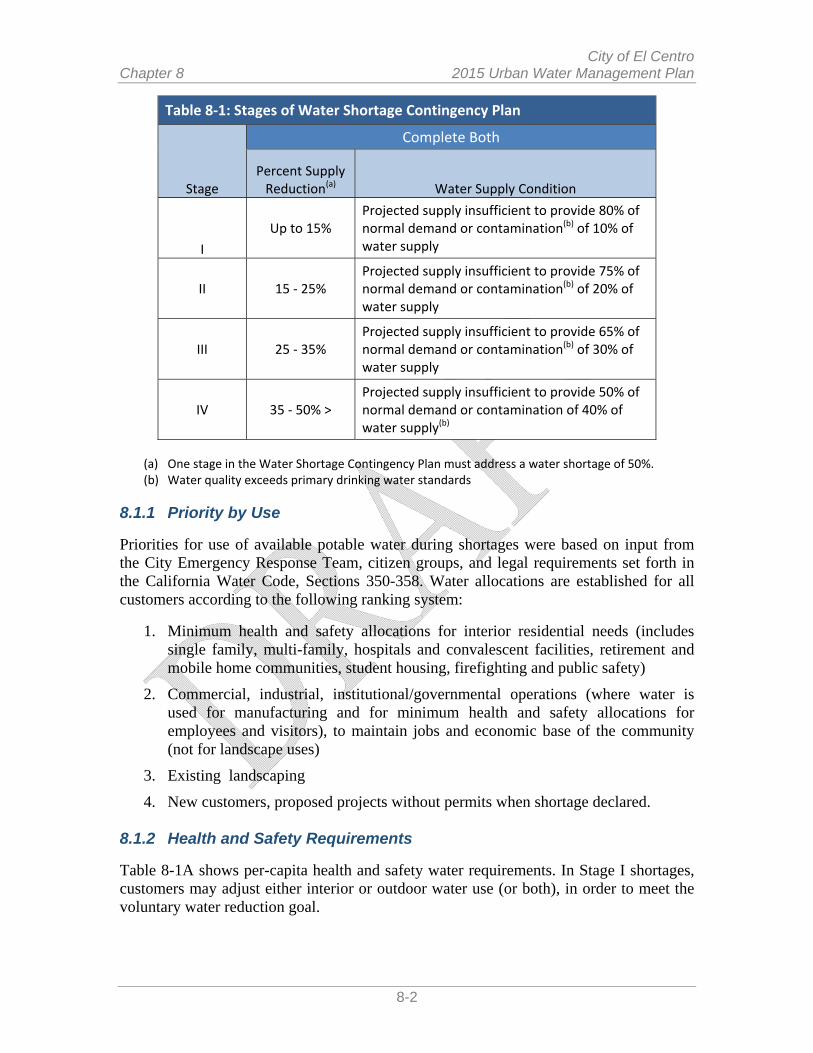
City of El Centro Chapter 8 2015 Urban Water Management Plan
8-2
Table 8‐1: Stages of Water Shortage Contingency Plan
Stage
Complete Both
Percent Supply Reduction(a) Water Supply Condition
I
Up to 15% Projected supply insufficient to provide 80% of normal demand or contamination(b) of 10% of water supply
II 15 ‐ 25% Projected supply insufficient to provide 75% of normal demand or contamination(b) of 20% of water supply
III 25 ‐ 35% Projected supply insufficient to provide 65% of normal demand or contamination(b) of 30% of water supply
IV 35 ‐ 50% > Projected supply insufficient to provide 50% of normal demand or contamination of 40% of water supply(b)
(a) One stage in the Water Shortage Contingency Plan must address a water shortage of 50%. (b) Water quality exceeds primary drinking water standards
8.1.1 Priority by Use
Priorities for use of available potable water during shortages were based on input from the City Emergency Response Team, citizen groups, and legal requirements set forth in the California Water Code, Sections 350-358. Water allocations are established for all customers according to the following ranking system:
1. Minimum health and safety allocations for interior residential needs (includes single family, multi-family, hospitals and convalescent facilities, retirement and mobile home communities, student housing, firefighting and public safety)
2. Commercial, industrial, institutional/governmental operations (where water is used for manufacturing and for minimum health and safety allocations for employees and visitors), to maintain jobs and economic base of the community (not for landscape uses)
3. Existing landscaping
4. New customers, proposed projects without permits when shortage declared. 8.1.2 Health and Safety Requirements
Table 8-1A shows per-capita health and safety water requirements. In Stage I shortages, customers may adjust either interior or outdoor water use (or both), in order to meet the voluntary water reduction goal.

City of El Centro 2015 Urban Water Management Plan Chapter 8
8-3
Table 8‐1A: Per‐Capita Health and Safety Water Quantity Calculations
Non‐Conserving Habit Changes(a) Conserving Fixtures(b)
Toilets 4 flushes x 3.5 gpf 14.0 3 flush x 3.5 gpf 10.5 4 flush x 1.6 gpf 6.4
Shower 5 min x3.0gpm 15.0 4 min x 3.0gpm 12.0 5 min x 2.0 10.0
Washer 12.0 gpcd 12.0 11.0 gpcd 11.0 10.0 gpcd 10.0
Kitchen 4 gpcd 4.0 4 gpcd 3.0 4.0 gpcd 3.0
other 4 gpcd 4.0 4 gpcd 4.0 4.0 gpcd 4.0
Gallons per person per day 49.0 40.5 33.4
CCF per person per year 24.0 20.0 16.0
(a) Reduced shower use results from shorter length of shower and reduced flow. Reduced washer use results from fuller loads.
(b) Fixtures include ULF 1.6 gpf toilets, 2.0 gpm showerheads, faucet aerators and efficient clothes washers.
However, under Stage II, Stage III and Stage IV mandatory rationing programs, the City has established a health and safety allotment of 50 gpcd (which translates to 24 HCF per person per year), because that amount of water is sufficient for essential interior water with no habit or plumbing fixture changes. If customers wish to change water use habits or plumbing fixtures, 50 gpcd is sufficient to provide for limited non- essential (i.e. outdoor) uses.
Stage IV mandatory rationing, which is likely to be declared only as the result of a prolonged water shortage or as a result of a disaster, would require that customers make changes in their interior water use habits (for instance, not flushing toilets unless “necessary” or taking less frequent showers). 8.2 PROHIBITIONS ON END USES
The City has prohibitions on end uses related to each stage of the WSCP as shown in Table 8-2. A violation of each prohibition carries a penalty, charge, or other enforcement as discussed in Section 8.3
8.3 PENALTIES, CHARGES, OTHER ENFORCEMENT OF PROHIBITIONS
Penalties or charges associated with a violation of the WSCP under a given stage of enforcement is shown in Table 8-2A. 8.4 CONSUMPTION REDUCTION METHODS
The methods used by the City to reduce consumption at each stage of WSCP enforcement is shown in Table 8-4.
8.5 DETERMINING WATER SHORTAGE REDUCTIONS
Single-family account allocations may be determined as follows: assuming four persons or less per home, an account would receive 11 hundred cubic feet (HCF) per month (68 gpcd) plus 55% of their historic use, not to exceed an upper limit. The upper limit on additional water may be 30 HCF per year (i.e., 132 HCF + 50% historic <=162 HCF a

City of El Centro Chapter 8 2015 Urban Water Management Plan
8-4
year). Appeals would be available for additional people. For each additional person at a home the allotment is increased by 4 HCF per billing period (49 gpcd).
Table 8‐2: Restrictions and Prohibitions on End Uses
Stage Restrictions and Prohibitions
on End Users Additional Explanation or
Reference
Penalty, Charge, or Other
Enforcement?
I Other Serving drinking water unless requested
Yes
II
Other ‐ Prohibit use of potable water for construction and dust control
Yes
II Other Prohibit use of potable water for compaction and building wash down
Yes
III Other ‐ Prohibit use of potable water for washing hard surfaces
Yes
III Other Prohibit potable water for sewer maintenance or fire protection training
Yes
IV Other In excess of amount allocated
Yes
IV Other As necessary Yes
Table 8‐2A: WSCP Penalties and Charges
Penalty or Charges Stage When Penalty Takes
Effect
25% Rate Increase II
50% Rate Increase III
100% Rate Increase IV
Penalty for Excess Use II
200% Charge for Excess Use III
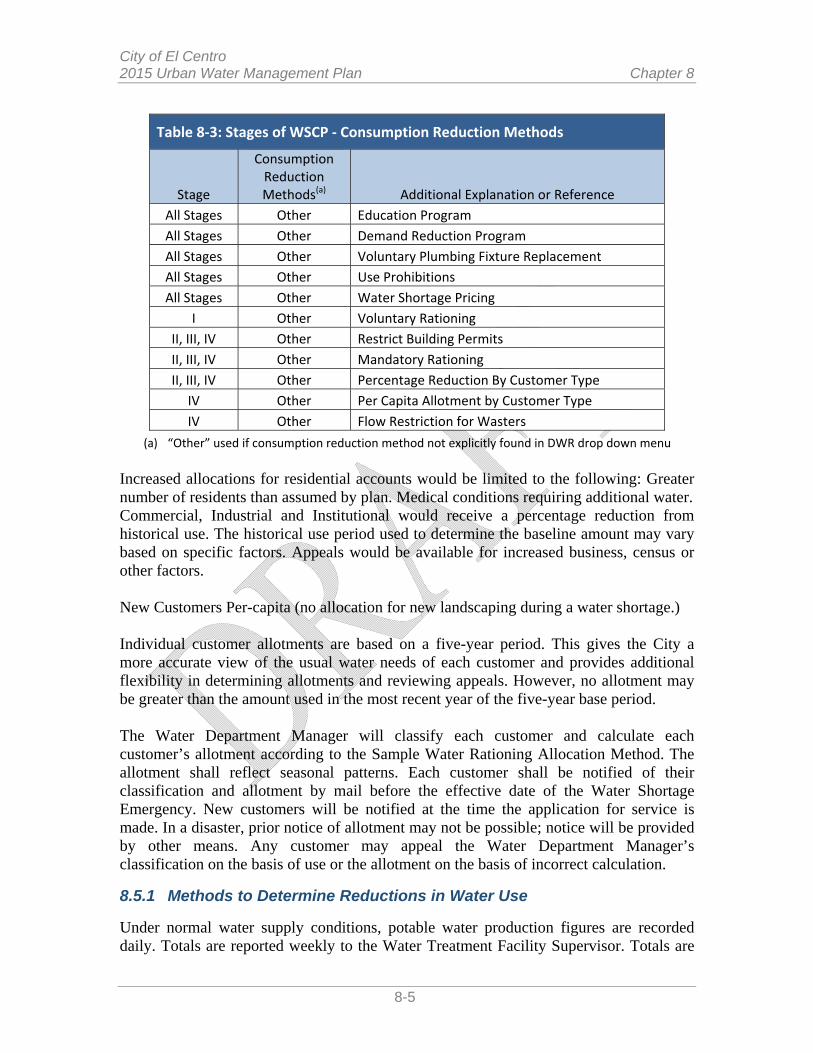
City of El Centro 2015 Urban Water Management Plan Chapter 8
8-5
Table 8‐3: Stages of WSCP ‐ Consumption Reduction Methods
Stage
Consumption Reduction Methods(a) Additional Explanation or Reference
All Stages Other Education Program
All Stages Other Demand Reduction Program
All Stages Other Voluntary Plumbing Fixture Replacement
All Stages Other Use Prohibitions
All Stages Other Water Shortage Pricing
I Other Voluntary Rationing
II, III, IV Other Restrict Building Permits
II, III, IV Other Mandatory Rationing
II, III, IV Other Percentage Reduction By Customer Type
IV Other Per Capita Allotment by Customer Type
IV Other Flow Restriction for Wasters
(a) “Other” used if consumption reduction method not explicitly found in DWR drop down menu
Increased allocations for residential accounts would be limited to the following: Greater number of residents than assumed by plan. Medical conditions requiring additional water. Commercial, Industrial and Institutional would receive a percentage reduction from historical use. The historical use period used to determine the baseline amount may vary based on specific factors. Appeals would be available for increased business, census or other factors. New Customers Per-capita (no allocation for new landscaping during a water shortage.) Individual customer allotments are based on a five-year period. This gives the City a more accurate view of the usual water needs of each customer and provides additional flexibility in determining allotments and reviewing appeals. However, no allotment may be greater than the amount used in the most recent year of the five-year base period. The Water Department Manager will classify each customer and calculate each customer’s allotment according to the Sample Water Rationing Allocation Method. The allotment shall reflect seasonal patterns. Each customer shall be notified of their classification and allotment by mail before the effective date of the Water Shortage Emergency. New customers will be notified at the time the application for service is made. In a disaster, prior notice of allotment may not be possible; notice will be provided by other means. Any customer may appeal the Water Department Manager’s classification on the basis of use or the allotment on the basis of incorrect calculation.
8.5.1 Methods to Determine Reductions in Water Use
Under normal water supply conditions, potable water production figures are recorded daily. Totals are reported weekly to the Water Treatment Facility Supervisor. Totals are
City of El Centro Chapter 8 2015 Urban Water Management Plan
8-6
reported monthly to the Water Department Manager and incorporated into the water supply report. During a Stage I or Stage II water shortage, daily production figures are reported to the Supervisor. The Supervisor compares the weekly production to the target weekly production to verify that the reduction goal is being met. Weekly reports are forwarded to the Water Department Manager and the Water Shortage Response Team. Monthly reports are sent to the City Council. If reduction goals are not met, the Manager will notify the City Council so that corrective action can be taken. During a Stage III or Stage IV water shortage, the procedure listed above will be followed, with the addition of a daily production report to the Manager. During emergency shortages, production figures are reported to the Supervisor hourly and to the Manager and the Water Shortage Response Team daily. Daily reports will also be provided to the City Council and the Imperial County Office of Emergency Services. All surplus revenues that the City collects are currently used to fund the Rate Stabilization Fund, conservation, recycling, and other capital improvements. The City estimated projected ranges of water sales by shortage stage to best understand the impact each level of shortage will have on projected revenues and expenditures by each shortage stage. 8.6 REVENUE AND EXPENDITURE IMPACTS In order to mitigate the financial impacts of a water shortage, the City has established an Emergency Fund. The goal is to maintain the fund at 75% of normal water department revenue. This fund will be used to stabilize rates during periods of water shortage or disasters affecting the water supply. The City will not have to increase rates as much or as often during a prolonged or severe shortage. However, even with the emergency fund, rate increases will be necessary during a prolonged water shortage. As described in this Plan, a Stage II shortage will be accompanied by a 15- 25% reduction in water deliveries while a Stage III will be accompanied by a 25 -35% reduction. The experiences of California water purveyors during the 1990-91 water shortage demonstrated that actual water use reductions by customers are usually considerably larger than those requested by the supplier. During the 1990-91 water shortage it was also politically difficult for many agencies to adopt the rate increases necessitated by a 20% to 50% reduction in sales. When a Water Shortage Emergency is declared, the supply shortage will trigger the appropriate Rationing Stage and rate increase. Water rates increase by the following percentages when the indicated Stages are implemented: Stage I: no rate increase Stage II: 25% increase over pre-shortage rates Stage III: 50% increase over pre-shortage rates

City of El Centro 2015 Urban Water Management Plan Chapter 8
8-7
Stage IV: 100% increase over pre-shortage rates Most California water agencies, which experienced water shortages, found that customer demand did not return to pre-shortage levels. After a shortage, water department expenses are expected to drop below pre-shortage levels but water sales are not expected to rebound. In anticipation of reduced sales, after a declared shortage ends, the City's rates will be set for one year at 115% of the pre-shortage rates. Any excess revenues collected as a result of this rate adjustment will be used for the Rate Stabilization Fund. 8.7 RESOLUTIONS OR ORDINANCE The City has drafted a resolution that establishes criteria to declare a water shortage emergency, included in Appendix D, which will be adopted in the near future. The draft resolution contains the following:
WHEREAS, the Council finds, determines and declares as follows: (a) The City is the water purveyor for the property owners and inhabitants of El
Centro; (b) The demand for water service is not expected to lessen. (c) When the potable water supply available to the City falls at or below the Stage
II triggering levels described in the 2010 Urban Water Management Plan, the City will declare a water shortage emergency. The water supply would not be adequate to meet the ordinary demands and requirements of water consumers and there may be insufficient water for human consumption, sanitation, fire protection, and environmental requirements. This condition is likely to exist until groundwater contamination is remedied and/or water system damage resulting from a disaster are repaired and normal water service is restored.
NOW, THEREFORE, BE IT RESOLVED that the City Council of EI Centro hereby directs the Mayor to find, determine, declare and conclude that a water shortage emergency condition exists that threatens the adequacy of water supply, until the City’s water supply is deemed adequate and potable. After the declaration of a water shortage emergency, the Mayor is directed to determine the appropriate Rationing Stage and implement the City's Water Shortage Emergency Response. FURTHERMORE, the Council shall periodically conduct proceedings to determine additional restrictions and regulations which may be necessary to safeguard the adequacy and quality of the water supply for domestic, sanitation, fire protection, and environmental requirements.
The City has also drafted a Moratorium on New Connections during a Water Shortage that will be incorporated into the City Municipal Code (included in Appendix E for reference). The City adopted Ordinance No. 15-07 on June 16, 2015 establishing water conservation regulations and restrictions to become effective immediately due to the severe drought (see Appendix F).
City of El Centro Chapter 8 2015 Urban Water Management Plan
8-8
In adopting the 2010 UWMP, the City also effectively adopted the WSCP contained within the Plan. As such, this WSCP from the adopted 2010 UWMP is reiterated in this 2015 Plan. It will be noted that the City plans to develop and adopt the WSCP as a separate document in the near future. 8.8 CATASTROPHIC SUPPLY INTERRUPTION 8.8.1 Imperial Irrigation District Emergency Preparedness Plan During or immediately after any water supply emergency, IID staff implements the Emergency Preparedness Plan. The Emergency Preparedness Plan includes required actions and procedures by IID staff to respond to events that impair water operation of canals, laterals, drains, dams, and other facilities. These responses are not normal operation and maintenance activities. Generally, any occurrence that requires an immediate response is classified as an extreme event or emergency. The Emergency Preparedness Plan defines the role each responsible employee will play during an emergency. Water Department staff conducts emergency and/or disaster response planning in the Water Control Center. Coordination of staffs with other departments will take place in the General Manager's conference room. All-American Canal River Division staff planning will be centered in the Imperial Dam Control House. Other staffs meet and coordinate actions at designated areas. Established actions and procedures exist for extreme events and emergencies that endanger operation of the water system. Possible emergencies/extreme events that endanger operation of the water system could include: earthquakes, storms, rain, run- off from desert washes, flooding, facility or structure damage, power outages, fire, vehicles in canals, equipment theft/vandalism, or other disaster. The Imperial Irrigation District's water delivery and drainage systems do not totally shut down during an emergency. The Imperial Irrigation District has conducted Emergency Preparedness Exercises in the past. Emergency preparedness exercises will be updated with the development of new emergency preparedness exercises. Water Department staffs trained and participated with the U.S. Department of the Interior Bureau of Reclamation's Tabletop Exercise for emergency preparedness. The cities in the Imperial Unit have a ten-day storage holding capacity requirement. The Imperial County Office of Emergency Services requires this storage holding capacity for cities (Imperial Irrigation District, 1998, p.22). IID is considered a special district in the eyes of the state and the federal government. A special district has to meet the same requirements as a local city pertaining to emergency preparedness and emergency management. As such, IID is required to go through the appropriate channels regarding mutual aid. In the event of a natural and or man-made disaster, IID would open its Emergency Operations Center (EOC) located at headquarters in Imperial, California. IID would then notify the Operational Area, which is the Imperial County Office of Emergency Services
City of El Centro 2015 Urban Water Management Plan Chapter 8
8-9
located in Heber at the Imperial County Fire Department Station #2. If the event called for mutual aid IID, the EOC would request assistance from the OA. If the OA was unable to fulfill this request it would go to the next highest level, which would be the Regional Emergency Operations Center (REOC), located in Los Alamitos. In the event the REOC was unable to fill the request it would go to the State Operations Center located in Sacramento, which would fill the request or ask for federal assistance from the Federal Emergency Management Agency a subsection of the Federal Department of Homeland Security. 8.8.2 City Response to Catastrophic Water Supply Reduction Upon a catastrophic water supply reduction, mandatory provisions to reduce individual urban consumer water use will be placed into effect. During a shortage the City would increase media attention to the water supply situation and would step up public water education programs, encourage property owners to apply for landscape and interior water use surveys and continue to advertise the importance of customers installing efficient plumbing fixtures. In the event of extended regional power outages, the City will use standby diesel generators that will power critical functions at the water treatment plant. The fuel would be brought in as needed. In this way the residents of EI Centro would not lose supply of potable water. In the event of an earthquake that damages critical components of the water treatment plant, the City will divert irrigation water into the potable water distribution system. Under this scenario non-potable water would be delivered to City customers and the water would have to be boiled by each customer prior to potable water use. The water could be delivered by diesel powered pumps to the City’s distribution system. If the All-American or Central Main Canal is damaged and unable to transmit water, the City will declare a water shortage emergency and will implement the appropriate conservation measures. The City will have approximately ten days of raw water storage to rely on from the time of the emergency with these conservation measures in place. 8.9 MINIMUM SUPPLY NEXT THREE YEARS To reduce the likelihood of an overrun in any given year, the IID Board approved the 2009 Regulations for Equitable Distribution Plan (EDP) that define how IID will apportion water to its customers should demand be anticipated to exceed available supply. When this is projected to occur, the IID Board may declare a supply/demand imbalance. The IID Board of Directors adopted revised regulations for the EDP on October 28, 2013 (Resolution No. 13-2013). Under the terms of the 2013 EDP, apportionment of supply among IID water users is to be based on the following criteria: Under the 2013 EDP, if IID water supply reductions are necessary in the next three years primarily due to a continuation of the drought, then the City of El Centro and other municipal water users would be the last user category to be impacted, with agricultural water users accounting for the majority of reduced water demands. IID water apportioned

City of El Centro Chapter 8 2015 Urban Water Management Plan
8-10
to municipal water users would be a base amount of 2006 usage plus current II District-wide average use per capita multiplied by the increase in population since 2006. As such the minimum supply estimated for the City for the next three years is shown in Table 8-4.
Table 8‐4: Minimum Supply Next Three Years (AFY)
2016 2017 2018
Available Water Supply
7,470 7,822 8,175
City of El Centro Chapter 9 2015 Urban Water Management Plan
9-1
9 DEMAND MANAGEMENT MEASURES The goal of this chapter on Demand Management Measures (DMM) is to provide a comprehensive description of the water conservation programs that a supplier has implemented, is currently implementing, and plans to implement in order to meet its urban water use reduction targets. This chapter describes the City of El Centro’s efforts to promote conservation and to reduce the demand on the water supply. The section of the California Water Code (CWC 10631) addressing DMMs was significantly modified in 2014, based on recommendations from the Independent Technical Panel (ITP) to the legislature. The ITP was formed by DWR to provide information and recommendations to DWR and the Legislature on new demand management measures, technologies and approaches to water use efficiency. In its report to the Legislature, the ITP recommended that the UWMP Act should be amended to simplify, clarify, and update the demand management measure reporting requirements. The ITP recommended, and the legislature enacted, streamlining the retail agency requirements from 14 specific measures to six more general requirements plus an “other” category. CWC 10631 (f)(A) The narrative shall describe the water demand management measure that the
supplier plans to implement to achieve its water use targets pursuant to 0608.20. (B) The narrative pursuant to this paragraph shall include descriptions of the
following water demand management measures: i. Water waste prevention ordinances. ii. Metering. iii. Conservation pricing. iv. Public education and outreach. v. Programs to assess and manage distribution system real loss. vi. Water conservation program coordination and staffing support. vii. Other demand management measures that have a significant impact on water use
as measured in gallons per capita per day, including innovative measures, if implemented.
9.1 DEMAND MANAGEMENT MEASURES FOR WHOLESALE AGENCIES This section is not applicable as the City of El Centro is a retail agency. 9.2 DEMAND MANAGEMENT MEASURES FOR RETAIL AGENCIES 9.2.1 Water Waste Prevention Ordinances The City’s draft “No Waste Ordinance”, which is included in Appendix G, explicitly states that the waste of water is to be prohibited. The ordinance also prohibits specific actions that waste water:
1. No customer shall waste water. As used herein, the term "waste" means:
City of El Centro Chapter 9 2015 Urban Water Management Plan
9-2
a. Use of potable water to irrigate turf, ground-cover, shrubbery, crops, vegetation, and trees between the hours of 10:00 o'clock A.M. and 6:00 o'clock P.M. or in such a manner as to result in runoff for more than five (5) minutes;
b. Use of potable water to wash sidewalks, walkways, driveways, parking lots, open ground or other hard surfaced areas except where necessary for public health or safety;
c. Allowing potable water to escape from breaks within the customer's plumbing system for more than twenty-four hours after the customer is notified or discovers the break;
d. Washing cars, boats, trailers, aircraft, or other vehicles by hose without a shutoff nozzle and bucket except to wash such vehicles at commercial or fleet vehicle washing facilities using water recycling equipment.
e. Use of potable water to clean, fill or maintain decorative fountains, lakes or ponds.
2. The following restrictions are effective during a declared Water-Shortage
Emergency.
a. No restaurant, hotel, cafe, cafeteria or other public place where food is sold, served or offered for sale, shall serve drinking water to any customer unless requested.
b. Use of potable water for construction, compaction, dust control, street or parking lot sweeping, building wash down where non-potable water is sufficient.
c. Use of potable water for sewer system maintenance or fire protection training without prior approval by the Mayor;
d. Use of potable water for any purpose in excess of the amount allocated.
3. Other restrictions may be necessary during a declared Water Shortage Emergency, to safeguard the adequacy of the water supply for domestic, sanitation, fire protection, and environmental requirements.
The City’s draft “No Waste Ordinance” stipulates enforcement, penalties for violations, appeals, and remedies. The City will adopt the draft ordinance In the near future. 9.2.2 Metering
The City of El Centro is fully metered. City ordinances require meters for all service connections. Meters older than 10 years are inspected and replaced if necessary. The City reads the meters and bills customers based on volume of water used every month. The customers are billed based on the volume of water used, the size of the meter and the type of connection. The City keeps records of the historical usage, meter size and type of connection.
City of El Centro Chapter 9 2015 Urban Water Management Plan
9-3
The City is currently in the process of replacing old existing water meters at their current in-service location with an AMR/AMI (Automatic Meter Reading/Advanced Metering Infrastructure) system in an effort to improve the process of collecting water meter reading data, tampering and other alerts, as well as the capability to safely conduct water service disconnection and reconnects remotely at residential meter locations where customers frequently make late payments. It is also the intent of the City to enhance the billing process and customer service through the addition of a consumer- facing web portal which will provide water customers with access to usage information, alerts and budget management tools. For the past several years, the City has been replacing meters (approximately 1,900 total) with a model that will easily accept the AMR/AMI added electronics onto the meter. As meters age and wear out, they read on the low side due to friction of internal parts. Since all of the City’s old meters (it is estimated that approximately 80 percent of the City’s existing meters are over 10 years old) are to be replaced with new meters, an overall revenue increase of at least 3% ($240,000 annually) is expected. In addition to the AMR/AMI features, the proposed project will include a remote Shut-Off feature that will be installed at addresses where reoccurring shut-offs are required due to late payment. Benefits of AMR/AMI metering system include:
Improved Customer Service Improved Data Collection and Billing Accuracy Reduced Customer Complaints Improved Billing with real-time data Identify Customer Water Leaks Early Reduction in Theft of Service Customer Information System Website Remote shut-off and turn-on of service for late-payment Cost savings in meter reading Staff can more closely monitor citywide water consumption
The City plans to have the AMR/AMI metering project constructed and in operation by October 2016. 9.2.3 Conservation Pricing
A conservation pricing structure is always in place and is not dependent upon a water shortage for implementation, although a conservation rate structure could include drought rate structures. Conservation pricing sends a signal to customers regarding their water use. A common example of conservation pricing is a tiered rate structure, where efficient water use is billed at a low price and higher water use billed at progressively higher prices.
City of El Centro Chapter 9 2015 Urban Water Management Plan
9-4
However, the 4th District Court of Appeal ruled in April 2015 that a tiered water rate structure used by the City of San Juan Capistrano to encourage conservation was unconstitutional, saying it violated voter-approved Proposition 218, which prohibits government agencies from charging more for a service than it costs to provide it. The court said in its ruling that San Juan Capistrano did not carry its burden of proving its higher tiers reflected its costs of service. This ruling is being appealed. The City is working on a water budget. The proposed structure is to establish a baseline for each account. If water consumption exceeds the baseline, then a penalty of $1 for every percent over the baseline will be added. For example, if a person exceeds their baseline by 5%, then $5 would be added to the bill. The current financial software does not permit this at this time. 9.2.4 Public Education and Outreach
The City participates in various education and outreach programs to inform the public of water conservation goals and methods including:
Marketing of rebates; Communicating water use via water bills (e.g., increased frequency of billing, an
easy to understand bill format, or bills that compare a customer’s water use to the water use of similar customers);
Providing school education programs; Information booths at fairs and public events; Newsletters; Informative websites, online tools, or social media; Newspaper articles
Specific examples include:
Imperial County Mid-Winter Fair – hosted a booth for the duration of the fair. The fair was scheduled from February 26th – March 6th 2016. An education booth was manned each day of the fair from opening to closing. Approximately 1600 educational packets were passed out to children ranging in ages from 2-17 years old.
36th Annual Children’s Fair – An informational booth was hosted to educate
school aged children and their parents on the importance of water saving measures and conservation. This event was very well attended and 800 educational packets were handed out as part of the event.
City Hosted Events/Activities – The Public Works department will be
participating in various different upcoming city hosted events/activities to educate the citizens of El Centro on the importance of water conservation.
City of El Centro Chapter 9 2015 Urban Water Management Plan
9-5
The City communicates water conservation goals, ordinances, restrictions, and available programs through the City’s website “Save Our Water” and through press releases. The website provides information on available rebate programs available through DWR including rebates for turf replacement and for converting to high-efficiency toilets. As an example of a City press release communications, the City issued a press release informing customers of the State’s water conservation goal to reduce City water demands by 24 percent and that the City had in response established a Level 2 Water Conservation Plan. The press release provided information on what significant changes were occurring relative to previous water drought restrictions that had previously been in place. 9.2.5 Programs to Access and Manage Distribution System Real Loss The City provides routine and planned system maintenance to prevent system water losses. The City is planning the conversion to an Advanced Metering Infrastructure (AMI), which will better manage the production, storage and distribution of water. It will help the City substantially decrease non-revenue water by detecting water loss both in the distribution network and at customer end-points. 9.2.6 Water Conservation Program Coordination and Staffing Report Due to a lack of available funding, all water conservation efforts are being coordinated through the City’s stormwater program. The person heading City water conservation efforts is Tim Rogers, Stormwater Coordinator. 9.3 IMPLEMENTATION OVER THE PAST FIVE YEARS Over the past five years, the City has replaced pipelines, meters, and other water system appurtenances on a regular program to limit system leakage and to more accurately record water usage. The City is currently in the process of replacing old existing water meters at their current in-service location with an AMR/AMI (Automatic Meter Reading/Advanced Metering Infrastructure) system. The City communicated water conservation goals, ordinances, restrictions, and available programs through the City’s website “Save Our Water” and through press releases. The City participated in various education and outreach programs to inform the public of water conservation goals and methods. 9.4 PLANNED IMPLEMENTATION TO ACHIEVE WATER USE TARGETS Through City water conservation efforts, City per-capita water use has decreased 12.3 percent since 2010 and 28.6 percent since 2005; and residential per-capita water has decreased 10.4 percent since 2010 and 32.4 percent since 2005. The City’s actual per-capita water use for 2015 was 141.6, which is well below their calculated SBx7-7 2015 and 2020 targets of 199.8 and 198.6 gpcd, respectively. The City will continue to implement water conservation measures to achieve its 2020 water use target and continue this downward trend in City water usage.
City of El Centro Chapter 9 2015 Urban Water Management Plan
9-6
9.5 MEMBERS OF THE CALIFORNIA URBAN WATER CONSERVATION COUNCIL
The City is currently not a member of the CUWCC.
City of El Centro Chapter 10 2015 Urban Water Management Plan
10-1
10 PLAN ADOPTION, SUBMITTAL, AND IMPLEMENTATION 10.1 INCLUSION OF ALL 2015 DATA
The City’s 2015 UWMP consists of water use and planning data for the entire year of 2015. The City is reporting on a 2015 calendar year basis. 10.2 NOTICE OF PUBLIC HEARING The City will hold a public hearing prior to adopting the 2015 UWMP. The public hearing will provide an opportunity for the public to provide input to the plan before it is adopted. The City will consider all public input. CWC 10642 …Prior to adopting a plan, the urban water supplier shall make the plan available for public inspection…Prior to the hearing, notice of the time and place of hearing shall be published within the jurisdiction of the publicly owned water supplier pursuant to Section 6066 of the Government Code… Government Code 6066 Publication of notice pursuant to this section shall be once a week for two successive weeks. Two publications in a newspaper published once a week or oftener, with at least five days intervening between the respective publication dates not counting such publication dates, are sufficient. The period of notice commences upon the first day of publication and terminates at the end of the fourteenth day, including therein the first day. The City’s public notice was sent out on April 4, 2016. A copy of the public notice is included in Appendix H. 10.3 PUBLIC HEARING AND ADOPTION As part of the public hearing, the City will provide information on their baseline values, water use targets, and implementation plan required in the Water Conservation Act of 2009. The public hearing on the UWMP will take place before the adoption of the UWMP, which will allow the City the opportunity to modify the UWMP in response to public input before adoption. The City will formally adopt the UWMP before submitting the UWMP to DWR. A copy of the City’s adoption resolution is included in Appendix H. 10.4 PLAN SUBMITTAL The City’s 2015 UWMP will be submitted to DWR within 30 days of adoption and by July 1, 2016. UWMP submittal will be done electronically through WUEdata, an online submittal tool. After the UWMP has been submitted, DWR will review the plan and make a determination as to whether or not the UWMP addresses the requirements of the CWC. The DWR reviewer will contact the water supplier as needed during the review process. Upon completion of the Plan review, DWR will issue a letter to the agency with the results of the review.
City of El Centro Chapter 10 2015 Urban Water Management Plan
10-2
No later than 30 days after adoption, the City will submit a CD or hardcopy of the adopted 2015 UWMP to the California State Library. 10.5 PUBLIC AVAILABILITY Not later than 30 days after filing a copy of its plan with DWR, the City will l make the plan available for public review during normal business hours by placing a copy of the UWMP at the front desk of the City’s Public Works office, and by posting the UWMP on the City’s website for public viewing. R
10.6 AMENDING AN ADOPTED UWMP If the City amends the adopted UWMP, each of the steps for notification, public hearing, adoption, and submittal will also be followed for the amended plan.