
Clean and stable utilization of solar energy by...
12
Clean and stable utilization of solar energy by integrating dish solar Stirling engine and salinity gradient technology Xiaotian Lai, Minjie Yu, Rui Long * , Zhichun Liu, Wei Liu ** School of Energy and Power Engineering, Huazhong University of Science and Technology,1037 Luoyu Road, Wuhan, 430074, China article info Article history: Received 8 January 2019 Received in revised form 23 May 2019 Accepted 11 June 2019 Available online 12 June 2019 Keywords: Dish solar Stirling engine Salinity gradient Energy storage Clean energy utilization abstract A hybrid energy utilization system, integrating dish solar SE and salinity gradient based energy storage system, was proposed to realize clean and stable power generation from solar energy. Power output of dish solar Stirling engine was utilized to pressurize the salt water into RO (reverse osmosis) for storing the energy in the form of concentration gradient, and stable power output was generated from the concentration gradient via PRO (pressure retarded osmosis). The system performance was systematically investigated under the ideal and non-ideal models, to evaluate the theoretical and realistic energy conversion ability. Results indicate that higher initial concentration presents better energy efficiency, for it has slower decreasing slope of transmembrane water flux in PRO. Optimal RO and PRO operating pressure exist for achieving the maximal energy efficiency. The ideal maximal overall energy conversion efficiency reaches 9.23% within the research scope. With the detrimental factors being considered, the maximal overall efficiency of 5.07% is achieved. © 2019 Elsevier Ltd. All rights reserved. 1. Introduction The rapid consumption of fossil fuels and accompanying pollu- tion problems such as the emission of greenhouse gas, NO x and SO x influence human society significantly [1]. Numerous researches such as clean combustion [2], low temperature heat utilization [3], sustainable energy exploitation [4], novel hybrid energy system [5,6] and heat transfer enhancement [7 ,8] in recent decades were conducted as powerful response. Solar energy, the original energy source which is of tremendous amount and totally clean, is regar- ded as one of prospective methods to mitigate these problems [9]. It is mainly categorized into two types of photovoltaic and solar thermal utilization [10]. Photovoltaic technology has the advantage of better system simplicity while solar thermal technology gener- ally achieves higher solar-electric conversion efficiency. As to solar thermal utilization, common configurations of trough, tower and dish are widely utilized to focus sunshine to obtain high temper- ature for driving thermodynamic cycles. Compared with the other two, dish configuration requires less space and has higher con- centration ratio to produce thermal energy with high temperature level. Hence, it is utilized to drive some small-scale thermodynamic cycles such as Brayton [11] and Stirling cycles [12]. For SE has higher theoretical thermal efficiency and operates with less noise [13, 14], dish solar SE has been attracting considerable attention since its invention in 1987 by Roelf J. Meijer. Mohammad Hossein Ahmadi et al. analyzed the theoretical performance of dish solar SE and optimized the operating tem- peratures to achieve the compromise of power output and thermal efficiency with three different decision methods in Ref. [15]. Results indicate optimal temperatures decided by LINMAP approaches the ideal solution most closely. Furthermore, entransy loss and entropy generation rate were considered as additional optimization targets to achieve more comprehensive optimal performance in Ref. [16]. Fatih Aksoy et al. conducted an experiment of a beta type SE which operates with halogen lamp as solar simulator. The performance was tested under the lamp power of 400 and 1000 W respectively. Higher lamp power achieves better engine power of 127.17W, torque of 3.4 Nm and efficiency of 12.85% [17]. G.E. Carrillo Cabal- lero et al. modeled and investigated the performance of a dish solar SE with directly illumined receiver. Their research indicates radia- tive loss in receiver is significant which occupies 96.06% in the total heat loss under low wind speed condition. Furthermore, optimal efficiency of 21% and power output of 11.1kW were obtained with multi-objective algorithm [18]. Ana C. Ferreira et al. evaluated and optimized the thermal and economic performance of a dish solar SE * Corresponding author. ** Corresponding author. E-mail addresses: [email protected] (R. Long), [email protected] (W. Liu). Contents lists available at ScienceDirect Energy journal homepage: www.elsevier.com/locate/energy https://doi.org/10.1016/j.energy.2019.06.082 0360-5442/© 2019 Elsevier Ltd. All rights reserved. Energy 182 (2019) 802e813
Transcript of Clean and stable utilization of solar energy by...
lable at ScienceDirect
Energy 182 (2019) 802e813
Contents lists avai
Energy
journal homepage: www.elsevier .com/locate/energy
Clean and stable utilization of solar energy by integrating dish solarStirling engine and salinity gradient technology
Xiaotian Lai, Minjie Yu, Rui Long*, Zhichun Liu, Wei Liu**
School of Energy and Power Engineering, Huazhong University of Science and Technology, 1037 Luoyu Road, Wuhan, 430074, China
a r t i c l e i n f o
Article history:Received 8 January 2019Received in revised form23 May 2019Accepted 11 June 2019Available online 12 June 2019
Keywords:Dish solar Stirling engineSalinity gradientEnergy storageClean energy utilization
* Corresponding author.** Corresponding author.
E-mail addresses: [email protected] (R. Long), w
https://doi.org/10.1016/j.energy.2019.06.0820360-5442/© 2019 Elsevier Ltd. All rights reserved.
a b s t r a c t
A hybrid energy utilization system, integrating dish solar SE and salinity gradient based energy storagesystem, was proposed to realize clean and stable power generation from solar energy. Power output ofdish solar Stirling engine was utilized to pressurize the salt water into RO (reverse osmosis) for storingthe energy in the form of concentration gradient, and stable power output was generated from theconcentration gradient via PRO (pressure retarded osmosis). The system performance was systematicallyinvestigated under the ideal and non-ideal models, to evaluate the theoretical and realistic energyconversion ability. Results indicate that higher initial concentration presents better energy efficiency, forit has slower decreasing slope of transmembrane water flux in PRO. Optimal RO and PRO operatingpressure exist for achieving the maximal energy efficiency. The ideal maximal overall energy conversionefficiency reaches 9.23% within the research scope. With the detrimental factors being considered, themaximal overall efficiency of 5.07% is achieved.
© 2019 Elsevier Ltd. All rights reserved.
1. Introduction
The rapid consumption of fossil fuels and accompanying pollu-tion problems such as the emission of greenhouse gas, NOx and SOxinfluence human society significantly [1]. Numerous researchessuch as clean combustion [2], low temperature heat utilization [3],sustainable energy exploitation [4], novel hybrid energy system[5,6] and heat transfer enhancement [7,8] in recent decades wereconducted as powerful response. Solar energy, the original energysource which is of tremendous amount and totally clean, is regar-ded as one of prospectivemethods tomitigate these problems [9]. Itis mainly categorized into two types of photovoltaic and solarthermal utilization [10]. Photovoltaic technology has the advantageof better system simplicity while solar thermal technology gener-ally achieves higher solar-electric conversion efficiency. As to solarthermal utilization, common configurations of trough, tower anddish are widely utilized to focus sunshine to obtain high temper-ature for driving thermodynamic cycles. Compared with the othertwo, dish configuration requires less space and has higher con-centration ratio to produce thermal energy with high temperature
[email protected] (W. Liu).
level. Hence, it is utilized to drive some small-scale thermodynamiccycles such as Brayton [11] and Stirling cycles [12]. For SE has highertheoretical thermal efficiency and operates with less noise [13,14],dish solar SE has been attracting considerable attention since itsinvention in 1987 by Roelf J. Meijer.
Mohammad Hossein Ahmadi et al. analyzed the theoreticalperformance of dish solar SE and optimized the operating tem-peratures to achieve the compromise of power output and thermalefficiency with three different decisionmethods in Ref. [15]. Resultsindicate optimal temperatures decided by LINMAP approaches theideal solution most closely. Furthermore, entransy loss and entropygeneration rate were considered as additional optimization targetsto achieve more comprehensive optimal performance in Ref. [16].Fatih Aksoy et al. conducted an experiment of a beta type SE whichoperates with halogen lamp as solar simulator. The performancewas tested under the lamp power of 400 and 1000W respectively.Higher lamp power achieves better engine power of 127.17W,torque of 3.4 Nm and efficiency of 12.85% [17]. G.E. Carrillo Cabal-lero et al. modeled and investigated the performance of a dish solarSE with directly illumined receiver. Their research indicates radia-tive loss in receiver is significant which occupies 96.06% in the totalheat loss under low wind speed condition. Furthermore, optimalefficiency of 21% and power output of 11.1 kW were obtained withmulti-objective algorithm [18]. Ana C. Ferreira et al. evaluated andoptimized the thermal and economic performance of a dish solar SE

X. Lai et al. / Energy 182 (2019) 802e813 803
based micro cogeneration system. Optimization algorithm of GPS(generalized pattern search) was employed in order to maximizethe system annual worth. Results indicate that electrical and ther-mal power of 3.65 kW and 11.06 kW can be obtained with anattractive economic performance [19]. It can be seen dish solar SE isfeasible to convert the solar energy into electricity with remarkableability. However, one of the main barriers is the intermittency ofincident solar energy with time and limits the further developmentof dish solar SE. Energy storage system is one of the efficientmethods to solve this problem. Y. Kadri et al. investigated theperformance of dish solar SE coupled with lead acid battery. Batterywas utilized to meet the insufficient power of SE when sunshineintensity drops with daily time. Results indicate this hybrid systemis capable to meet the custom demand continuously and achieveefficient energy balance of subsystems with the maintain of linkvoltage [20]. Compared with CAES (compressed air energy storage)and PHS (pumped hydro storage), battery is independent on thegeometrical condition and has more flexible compacity, but thetoxicity and potential pollution risk still require furtherimprovement.
In the recent years, a salinity gradient based energy storagesystem was proposed and attracted some attention for the sub-stance is easily obtainable and has extremely slight effect onenvironment [21,22]. The sustainable energy is utilized to generateconcentration difference via RO, then released by PRO to generatestable power output. As a membrane filtration technology, RO iswidely utilized for fresh water production [23] and waste watertreatment [24]. It is noteworthy that not only fresh water can begenerated in RO, but considerable Gibbs free energy is also stored inthe form of concentration difference simultaneously. This energy iscapable to be released by PRO to generate shaft power [25,26], andthe first PRO plant was constructed in 2009 as well [27]. Thefundamental thermodynamic analysis conducted by Ngai Yin Yipet al. clarified the relationship of frictional loss, extractable powerand outlet residual concentration difference in PRO precisely, andindicated that PRO has competitive efficiency of 60% with river andsea solutions [28]. Jeri L. Prante utilized PRO to harvest the Gibbsfree energy from RO module and reduce the energy consumptionfor salt water desalination. With the integration of PRO, the SEC(specific energy consumption) drops significantly by 40% from 2.0to 1.2 kW,h=m3 under a recovery rate of 50% [29]. Chun Feng Wanet al. proposed a closed loop SWRO (sea water reverse osmosis) byemploying PRO to reduce the specific energy consumption.Compared with the configuration of single RO module, the furtherinstallment of PX (pressure exchanger) and PRO module reducesthe SEC from 5.51 to 1.79 and 1.08 kW,h=m3 respectively [30]. Thesignificant energy consumption drop indicates the outlet concen-tration difference of RO has great potential to be released by PRO.Hence, Wei He et al. [21] and Rui Long et al. [22] both evaluated theenergy conversion ability of RO and PRO based energy storagesystem, the results indicate that it is feasible and has acceptableefficiency.
Hence, in order to solve the intermittency of solar energy with acleaner method. A hybrid system which utilizes a closed loopsalinity gradient based energy storage system to stabilize the poweroutput of dish solar SE was proposed. For dish solar Stirling engineoperates with low capacity but requires less space consumption, itis suitable to be utilized for remote small-scale off-grid powergeneration. In addition, the substance of NaCl solution for energystorage and release is extremely easily acquirable and eco-friendly.Hence, this hybrid system can be a potential clean and stable powergeneration method from sunshine for small scale distributedhousehold. With the establishment of the corresponding mathe-matical models and algorithm under ideal and non-ideal condi-tions, the energy conversion ability was investigated systematically
to evaluate the ideal energy conversion limitation and the realisticability with current technology ability. The influence mechanism ofinitial concentration, operating pressures of RO and PRO on energyconversion efficiency was analyzed and optimized to achieve themaximum within the scope of this study. The influence of detri-mental factors such as the imperfect regeneration, friction loss andconcentration polarization on the system performance was inves-tigated as well. Finally, some meaningful conclusions were drawn.
2. System description and mathematical model
2.1. System description
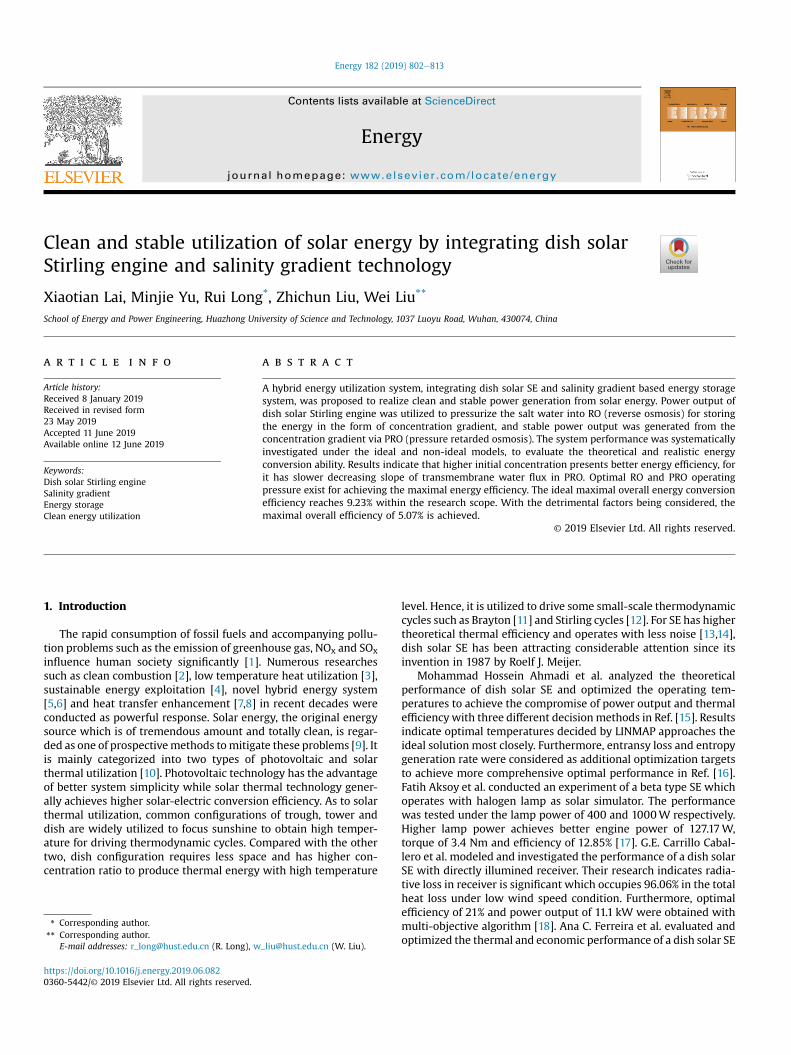
As depicted in Fig. 1, this hybrid system consists of three mainsubsystems those are dish solar SE module, energy storage moduleand energy release module respectively. In dish solar SE, as theconcentrated sunlight from concentrator focuses on receiver, solarenergy converts into thermal energy with high temperature. Thendriven by the temperature difference, thermal energy transfers intothe heater of SE, to heat the charged gas and motivate SE togenerate shaft power for driving the pump.
The energy storage module is composed of pressure exchanger,RO device and three tanks. The effluent brinewater from TanM withan initial concentration of Cin, separates into two streams forconcentrating and diluting in RO respectively. Stream S14 (to bediluted) flows into RO directly while stream S2 (to be concentrated)needs to be pressurized in advance. PX is installed to harvest theresidual pressure in effluent concentrated flow from RO, for pre-pressurizing stream S2. Then, pump provides the net energyrequirement for pressure elevation in RO. Driven by the hydraulicpressure difference aside the semipermeable membrane, trans-membrane water flux occurs and leads to the appearance of con-centration difference between two streams. Hence, in energystorage module, the shaft power from SE is converted into the highpressure of concentrated solution and Gibbs free energy sequen-tially, then stored in tank TanL and TanH.
In energy release module, the solution with high concentrationgets pressurized by PX and feeds into PRO. Driven by the osmoticpressure difference between two solutions, water transfers fromthe solution of low concentration to the high side. The extractedwater flows into a hydro turbine to generate stable electricityoutput, and the residual stream goes through PX for pressurizingstream S7. Finally, three streams S11, S13 and S17 flow into the tankTanM simultaneously, the concentration of brine water returns tothe initial value. Thus, a salinity gradient based closed loop cyclecan be established to stabilize the power output of dish solar SEsystem.
2.2. Mathematical model and algorithm
The ideal model of dish solar SE is established based on theadiabatic model of SE stated in Appendix. A1 and the energy bal-ance equations at hot and cold ends as follows.
_QH;Supplement ¼ _QH;Transfer ¼ _QH;Load (1)
_QL;Supplement ¼ _QL;Transfer ¼ _QL;Load (2)
In heater, the heat supplement is the utilizable thermal energyfrom receiver in Eq. (3). The heat transferred is the production ofheat transfer ability (KH) and temperature difference betweenreceiver and substance in the form of Eq. (4). In addition, the heatload in heater is the thermal requirement for heating substancewhich is a function of Th and Tl in Eq. (5) according to the adiabatic
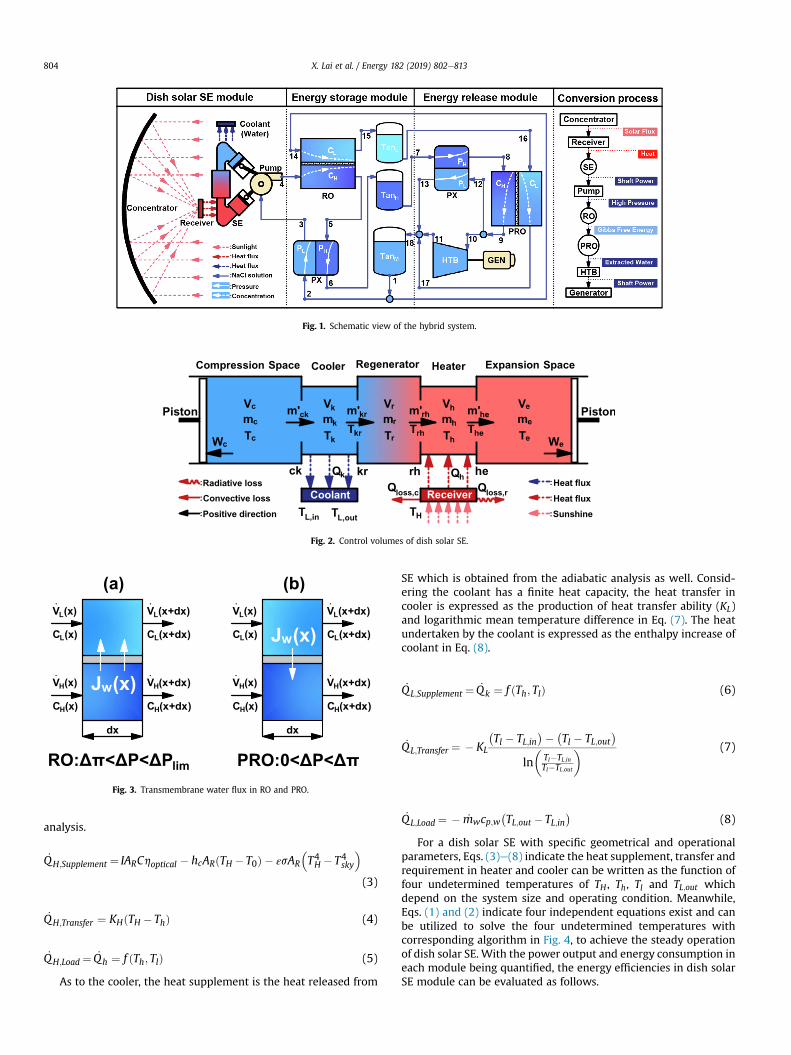
Fig. 1. Schematic view of the hybrid system.
Tck
Wc We
Vc
mc
Tc
Vk
mk
Tk
Vh
mh
Th
Ve
me
Te
Vr
mr
Tr
m'ck m'kr
Tkr
m'rh
Trh The
m'hePiston Piston
RegeneratorCompression Space Cooler Heater Expansion Space
Qkck kr rh heQh
Qloss,c
Qloss,rReceiverCoolant
TL,in T
L,outTH :Sunshine
:Heat flux
:Heat flux:Convective loss
:Positive direction
:Radiative loss
Fig. 2. Control volumes of dish solar SE.
CH(x)
RO: < P< Plim
dx
VH(x) VH(x+dx)Jw(x)CH(x+dx)
VL(x+dx)VL(x)
CL(x) CL(x+dx)
(a)
PRO:0< P<
dx
VH(x)
CH(x)
Jw(x)
VH(x+dx)
CH(x+dx)
VL(x)
CL(x)
VL(x+dx)
CL(x+dx)
(b)
Fig. 3. Transmembrane water flux in RO and PRO.
X. Lai et al. / Energy 182 (2019) 802e813804
analysis.
_QH;Supplement ¼ IARChoptical � hcARðTH � T0Þ � εsAR
�T4H � T4sky
�
(3)
_QH;Transfer ¼ KHðTH � ThÞ (4)
_QH;Load ¼ _Qh ¼ f ðTh; TlÞ (5)
As to the cooler, the heat supplement is the heat released from
SE which is obtained from the adiabatic analysis as well. Consid-ering the coolant has a finite heat capacity, the heat transfer incooler is expressed as the production of heat transfer ability (KL)and logarithmic mean temperature difference in Eq. (7). The heatundertaken by the coolant is expressed as the enthalpy increase ofcoolant in Eq. (8).
_QL;Supplement ¼ _Qk ¼ f ðTh; TlÞ (6)
_QL;Transfer ¼ � KL
�Tl � TL;in
�� �Tl � TL;out
�ln�
Tl�TL;inTl�TL;out
� (7)
_QL;Load ¼ � _mwcp;w�TL;out � TL;in
�(8)
For a dish solar SE with specific geometrical and operationalparameters, Eqs. (3)e(8) indicate the heat supplement, transfer andrequirement in heater and cooler can be written as the function offour undetermined temperatures of TH , Th, Tl and TL;out whichdepend on the system size and operating condition. Meanwhile,Eqs. (1) and (2) indicate four independent equations exist and canbe utilized to solve the four undetermined temperatures withcorresponding algorithm in Fig. 4, to achieve the steady operationof dish solar SE. With the power output and energy consumption ineach module being quantified, the energy efficiencies in dish solarSE module can be evaluated as follows.

Begin
Set H H,1T =T
Solve with Eq. (3)H,SupplementQ
Set l l,1T =T
Initialize geometrical
and operational parameters
Solve with Eq. (4)hT
Solve with Eq. (7)L,TransferQ
Solve and
with adiabatic analysis
L,SupplementQH,LoadQ
Solve with Eq. (8)L,outT
Check
H,Supplement H,LoadQ =Q?
Solve
with Eq. (A-12) and (9)-(11)
Receiver SE D-SEP, , ,
Yes
No
Check
L,Supplement L,TransferQ =Q?
Yes
Set H,RO H,RO,1V =V(0)
Solve and
by integrating Eq. (14) and (15)
H,ROV (L) L,ROV (L)
Solve the distribution of
and with Eq. (16) and (17)
H,ROC
L,ROC
End
Check
ROP = P?
Yes
No
Update
H,ROV (0)
Solve and
by integrating Eq. (14) and (15)
H,PROV (L) L,PROV (L)
Solve the distribution of
and with Eq. (16) and (17)
H,PROC
L,PROC
Solve and
with Eq. (18) and (19)
ROPG
Solve
with Eq. (20)-(24)
, , , ,PRO RO PRO ESSP
NoUpdate
lT
1
2
3
4
5
6
7
8
9
10
11
12
13
14
15
16
17
18
19
Update
HT
Fig. 4. Algorithm flow chart.
X. Lai et al. / Energy 182 (2019) 802e813 805
hReceiver ¼_QH;Load
IARChoptical(9)
hSE ¼ P_QH;Load
(10)
hDS�SE ¼P
IARC¼ hopticalhReceiverhSE (11)
In the energy storage and release system, the governing equa-tions of RO and PRO are familiar but with different net driving force.The ideal membranes required in RO and PRO are both semi-permeable membranes which only allow the permeation of waterflux. Water flux permeates from the highly pressurized concen-trated side to the diluted side in RO, and permeates from the dilutedside into the slightly pressurized concentrated side in PRO drivenby the net osmotic pressure difference. The infinitesimal controlvolumes are depicted in Fig. 3 and the equations of transmembranewater flux are stated in Eqs. (12) and (13).
Jw;ROðxÞ ¼ AROðDPROðxÞ�DpROðxÞÞ (12)
Jw;PROðxÞ ¼ APROðDpPROðxÞ�DPPROðxÞÞ (13)
As water flux pierces through the membrane, the distribution of
volume flow rate and concentration along the flow direction can becalculated according to Eq. (14)e(17) (RO: i ¼ � 1, PRO: i ¼ 1) withthe initial values specified previously.
d _VHðxÞdx
¼ iWJwðxÞ (14)
d _VLðxÞdx
¼ � iWJwðxÞ (15)
CHðxÞ ¼ CHð0Þ_VHð0Þ_VHðxÞ
(16)
CLðxÞ ¼ CLð0Þ_VLð0Þ_VLðxÞ
(17)
With the variation of solution concentration, the energy storedin the form of Gibbs free energy can be expressed as Eq. (18) [31].CM;ROðLÞ is the concentration of the mixture of two effluent streamsfrom RO.
DG ¼ 2RT�_VH;ROðLÞCH;ROðLÞln
CH;ROðLÞCM;ROðLÞ
þ _VL;ROðLÞCL;ROðLÞlnCL;ROðLÞCM;ROðLÞ
(18)

(a)
.ESolar 100.00%
X. Lai et al. / Energy 182 (2019) 802e813806
The net energy consumption in RO is the difference of energyrequired for pressure elevation and energy harvested from theeffluent flow by pressure exchanger. The power output of PROdepends on the extracted water flow rate and operating pressure.
PRO ¼DPRO _VH;ROð0Þ � hERDDPRO _VH;ROðLÞ (19)
PPRO ¼ DPPRO_VH;PROð0Þ� _VH;PROðLÞ
�(20)
As the energy input and output of each subsystem is deter-mined, the local and overall efficiencies can be evaluated accordingto Eq. (21)e(24) as well.
hRO ¼ DGPRO
(21)
hPRO ¼ PPRODG
(22)
hESS ¼PPROPRO
(23)
h ¼ PPROIAHC
(24)
The corresponding algorithm is depicted in Fig. 4 for stating amore precise insight view of calculation procedures. As step 1initialized the geometrical and operational parameters, steps 2e11are set to achieve the steady operation of dish solar SE by iteratingTH and Tl. The convergence of Tl in steps 6e9 represents the energybalance between charged gas and cooling water is achieved.Similarly, the convergence of TH in steps 3e10 represents the en-ergy balance between solar receiver and SE is achieved. Thus, thepower output and energy efficiencies of dish solar SE can be eval-uated at step 11. Successively, an appropriate inlet volume flow rateis determined with steps 12e16 to match the net energy con-sumption of RO and energy supplied by dish solar SE. The corre-sponding outlet values of concentration and flow rate in RO can beobtained then specified as the initial values of PRO module. Gov-erned by the differential equations Eq. (14)-(17), the stable poweroutput of PRO and energy conversion efficiencies can be obtainedafter the calculation of extracted water flowrate with steps 17e19.
40 80 120 160
40
80
120
160
200
0 10 20 30 40 50 60
(b)
.
.
.
.
QL
P
QH
ELoss,r
16.73%
43.18%
59.91%
38.60%
1.49%
(kW)
ELoss,c
V(c
c)
PH2 (bar)
Vc
Ve
3. Results and analysis
3.1. Evaluation of theoretical performance
Theoretical model illustrates the fundamental principle thatenergy conversion procedure follows. Some improvable detri-mental factors such as optical loss, regenerative heat loss, powerloss originated from the flow friction in engine and concentrationpolarization phenomenon in RO and PRO are neglected to evaluatethe ideal system performance with the initial values set in Table 1.
In dish solar SE, TH increases to drive the thermal energy intoheat engine as the concentrated solar flux illuminates on solar
Table 1Initial values set for sample calculation.
Dish solar SE systemADishðm2Þ ARðm2Þ Gas (�) F (Hz)53 0.058 H2 25Energy storage and release systemLRO(m) WRO(m) AROm =ðs ,PaÞ NRO(�)2 1 1.19e-11 400
receiver. Meanwhile, convective and radiative heat losses exist dueto the temperature difference between receiver and environment.TH of 1590 K is achieved as the dish solar SE operates steadily with asolar power input of 47.93 kW. The blue bars above the dash line inFig. 5-(a) illustrates the energy distribution at receiver. It can beseen the convective and radiative losses occupy 1.49% and 38.60%respectively. The radiative loss is more significant for it is positivelyrelated to the fourth powder of TH . The residual 59.91% of inputsolar energy is converted into utilizable heat and transferred tomotivate the heat engine for generating shaft power.
In heat engine, substance temperature is elevated to 1447 Kheated by the receiver. Then hot gas expands sufficiently to achievea cyclic expansion work of 1147.53 J encircled by the red dot curvein Fig. 5-(b). And the area encircled by the blue dot curve indicatesthat the compressed cold gas consumes 319.66 J in a thermody-namic cycle. Finally, net power output of 20.70 kW is generated andoccupies 43.18% of the entire incident solar energy while theemitted heat in cooler occupies 16.73%.
Sequentially, the shaft power is stored as Gibbs free energy in ROand released as stable shaft power in PRO. From Table 2, as thetransmembrane water flux permeates through the membrane inRO, salt solution with initial concentration of 0.5M is concentratedto 0.84M and diluted to 0.36M respectively. Gibbs free energy of9.05 kW is stored with the efficiency of 43.71% equivalently. As theconcentrated and diluted solutions flow through PRO module, theconcentration difference drops to release a stable power output of4.06 kW with the efficiency of 44.83%. It is noteworthy that theintegration of energy storage system is capable to stabilize theenergy output of dish solar SE, but the increase of systemcomplexity also reduces the overall energy conversion efficiency.Thus, achieving the maximal efficiency of ESS is essential forevaluating the optimal overall performance.
Energy storage and release in RO and PRO module rely on thevariation of solution concentration which is driven by the trans-membrane water flux. For the net driving force associates closelywith the osmotic and hydraulic pressure difference, the initialconcentration of NaCl solution and operating pressure influence
IðW =m2Þ Vwindðm =sÞ hoptical(%) ε(%)906 1 100 100
LPRO(m) WPRO(m) APROm =ðs ,PaÞ NPRO(�)5 3 1.87e-12 400
Fig. 5. Energy distribution in dish solar SE of sample calculation.

Table 2Energy storage and release performance of sample calculation.
CRO;H;outðMÞ CRO;L;outðMÞ DGRO;outðkWÞ hROð%Þ
0.84 0.36 9.05 43.71CPRO,H,out(M) CPRO,L,out(M) PPRO;outðkWÞ hPROð%Þ0.67 0.40 4.06 44.83
0 1 2 3 4 5
0.0E+00
5.0E-07
1.0E-06
1.5E-06
2.0E-06
2.5E-06
3.0E-06
3.5E-06
.
.
0.9
1.0
1.1
1.2
CH
,in
,PR
O(M
)
1.6E-03
2.0E-03
2.4E-03
2.8E-03
Cin=0.6 MCin=0.5 M
V H,P
RO
(m3/s
) VH,PRO
PPRO
Cin=0.4 M
2.8
3.2
3.6
4.0
4.4
P PR
O(k
W)
(c)
(a)
J w,P
RO
(m/s
)
XPRO (m)
Cin=0.4 M
Cin=0.5 M
Cin=0.6 M
(b)
Fig. 7. Performance comparison under different initial concentration of NaCl solution.
0 1 2 3 4 5
0.0E+00
1.0E-06
2.0E-06
3.0E-06
4.0E-06
5.0E-06
.5.0E-03
1.0E-02
1.5E-02
PRO=4.0 MPaPRO=2.9 MPaPRO=2.5 MPa
V H,i
n,P
RO
(m3/s
)
3.0
3.5
4.0
4.5
5.0
P PR
O(k
W)
2.4E-03
2.8E-03
3.2E-03
3.6E-03 VH,PRO
PPRO
V H,P
RO
(m3/s
) (c)
(b)
R-
R+
B+
J w,P
RO
(m/s
)
XPRO (m)
PRO=2.5 MPa
PRO=2.9 MPa
PRO=4.0 MPa
B-
(a)
.
.
Fig. 8. Performance comparison under different operating pressure in RO.
X. Lai et al. / Energy 182 (2019) 802e813 807
the performance of ESS. hESS in Eq. (23) evaluates the fraction ofstabilized energy output in the mechanical energy input and h in(24) represents the overall energy conversion efficiency. Fig. 6 de-picts the hESS and h under different operating pressure and initialsolution concentration. It can be seen that higher initial concen-tration contributes to better energy efficiency, hESS and h getsimproved by around 2.5% and 1.0% as initial concentration increasesfrom 0.4M to 0.6M.
Compare the transmembrane water flux distribution in PROwith different initial concentration under specified DPRO and DPPROin Fig. 7. It can be seen that for the membrane area is sufficient,specified DPRO achieves the same initial osmotic pressure differ-ence in PROwhich equals toDPRO. However, higher Cin correspondsto higher initial draw solution concentration in PRO which isdepicted in Fig. 7-(b). Beginning with the same transmembranewater flux, higher initial draw solution concentration in PRO ismore difficult to be interrupted. Hence, the transmembrane waterflux drops more slowly along the flow direction under a higher Cinwhich is consistent with Fig. 7-(a). Meanwhile, the production ofthe area in grey beneath the transmembrane water flux curve andmembrane width represents the flow rate of extracted water in asingle PRO unit. It can be seen Cin of 0.6M occupies larger area andthen inducesmore total extractedwater and power output in Fig. 7-(c).
Furthermore, with the increase of RO and PRO operating pres-sure, hESS and h vary in the range of 12e21% and 5e9% with a trendof decreasing after increasing in Fig. 6. From Fig. 8-(a), it can be seenthat the increase of RO operating pressure can improve the outletconcentration difference of RO, then provides stronger initialdriving force for transmembrane water flux in PRO. As DPRO in-creases from 2.5MPa to 2.9MPa, the corresponding red and blackwater flux curves indicate DPRO of 2.9 MPa achieves more freshwater extraction (red area difference of Rþ and R-) with theimprovement of initial driving force. When DPRO further increasesto 4.0MPa, the pumped feed solution into RO drops significantly aswell, for the power input from SE is constant. Thus, the initial flowrate of draw solution in PRO drops sequentially as depicted in Fig. 8-
16
17
18
19
20
21
22
12
14
16
18
20
22
2.4 2.8 3.2 3.6 4.0
7.2
7.6
8.0
8.4
8.8
9.2
0.4 0.8 1.2 1.6 2.0
5
6
7
8
9
(a-1)
ES
S(%
)
Cin=0.4 M
Cin=0.5 M
Cin=0.6 M
(b-1)
ES
S(%
)
Cin=0.4 M
Cin=0.5 M
Cin=0.6 M
(a-2)
(%)
PRO (MPa)
Cin=0.4 M
Cin=0.5 M
Cin=0.6 M
(b-2)
(%)
PPRO (MPa)
Cin=0.4 M
Cin=0.5 M
Cin=0.6 M
Fig. 6. Efficiency as a function of operating pressure in RO and PRO under differentinitial concentration of NaCl aqueous solution.
(b). Comparing the black and blue water flux curves in Fig. 8-(a), ittells that stronger DPRO of 4.0MPa leads the transmembrane waterflux in PRO to drop sharply and vanish quickly. The reason is thatlower initial flow rate is easier to be interrupted by stronger initialdriving force. Hence, water flux under DPRO of 2.9MPa exceeds thatunder DPRO of 4.0 MPa after the blue dot, then achieves moreextracted water (blue area difference of Bþ and B-) and poweroutput in Fig. 8-(c). Namely, the optimal RO operating pressurerepresents a state point at which the initial osmotic pressure dif-ference and flow rate of draw solution in PRO are both relativelyhigh to result in strong initial driving force and low decreasingspeed of draw solution concentration simultaneously. On the otherhand, optimal PRO operating pressure represents the most appro-priate point of transmembrane water flow rate and hydraulicpressure difference. For high DPPRO increases the specific poweroutput ability of PRO but reduces the net extracted water, and lowDPPRO increases the amount of extracted water but reduces thespecific power output ability of PRO.
In order to evaluate the optimal system performance undermaximal efficiency, numerical optimization algorithms of GA (ge-netic algorithm) and PSO (particle swarm optimization) wereemployed to optimize the operating pressure, for the nonlinearity

Table 3System optimal efficiency under ideal condition.
Cin(M) Algorithm (�) DPRO(MPa) DPPRO(MPa) hESS;max(%) h(%) Time (�)
0.4 GA 2.60 1.07 19.27 8.32 8 h 47minPSO 2.68 1.17 19.36 8.36 4 h 36min
0.5 GA 2.76 1.25 20.53 8.86 10 h 30minPSO 2.80 1.25 20.54 8.87 4 h 26min
0.6 GA 2.92 1.32 21.38 9.23 8 h 57minPSO 2.89 1.32 21.38 9.23 4 h 47min
X. Lai et al. / Energy 182 (2019) 802e813808
of the mathematical model. Results are listed in Table 3, it can beseen the optimal results achieved by GA and PSO are generallyconsistent while PSO requires only around half of the time con-sumption of GA. Maximal energy conversion efficiencies under theinitial concentration of 0.4, 0.5 and 0.6M are 19.36%, 20.54% and21.38% respectively. The corresponding overall efficiencies are8.36%, 8.87% and 9.23%. Equivalently, maximal stabilized poweroutput of 4.42 kW can be generated as ESS operates under themaximal efficiency condition with the initial concentration of0.6M.
Plotting the corresponding concentration distribution diagramin Fig. 9, the concentration of concentrated and diluted solutionsvaries from 0.60M to 1.01 and 0.43M respectively in energy storageprocess. Meanwhile, Gibbs free energy of 9.35 kW is stored. Then asthe concentrated and diluted solutions flow into energy releasemodule, extractedwater drives the hydro turbine to generate stablepower output. Meanwhile, the concentration of two streams vary to0.76 and 0.49M. It can be seen the residual unextractable Gibbs freeenergy in PRO originated from the applied hydraulic pressure dif-ference is considerable which leads to the relatively low energyefficiency. For rationally releasing Gibbs free energy and improvingthe energy efficiency, multi-stage PRO configuration or additionalRED (reverse electrodialysis) device can be installed and furtherinvestigated.
3.2. Evaluation of current performance
In this part, the aforementioned detrimental factors such as theoptical loss, heat regeneration and pressure loss in heat engine,concentration polarization in RO and PRO are considered to give amore realistic performance evaluation. The corresponding modelswere validated with relative experimental researches in Appendixas well.
In Fig. 10, the ideal and non-ideal energy distribution in dish
0.0 0.2 0.4 0.6 0.8 1.0
0.4
0.5
0.6
0.7
0.8
0.9
1.0
1.1
0.2 0.4 0.6 0.8 1.0
GPRO,out=2.48 kWGRO,out=9.35 kW
C(M
)
X*RO
Storage Residual
X*PRO
CH
CL
Fig. 9. Concentration distribution along the flow direction in RO and PRO modulesunder optimal condition.
solar SE are compared under the same geometrical and operationalconditions. As to the optical module in Fig. 10-(a), the realisticperformance has an optical efficiency which considers the opticalloss originated from the imperfect reflection of concentrator andoptical interception at the receiver entrance. With less solar fluxilluminating on the receiver, receiver temperature drops to 1128 K.Hence, convective and radiative heat losses both decrease with thedrop of temperature difference between receiver and environment.It can be seen the radiative loss drops significantly from 38.60% to9.73%. Consequentially, though optical loss occupies considerablepart of the incident solar energy, the drop of receiver heat loss issignificant as well. Thus, more heat is supplied to the engine whichoccupies 67.95% of the solar energy, to meet the heat demand ofisothermal heat absorbing and imperfect heat regeneration. How-ever, lower receiver temperature also induces lower heat absorbingtemperaturewhich is 965 K under a specified heat transfer ability athot end. Then it leads to weaker gas expansion compared with theideal condition as illustrated by the red curves in Fig. 10-(b).Meanwhile, the blue curves indicate that the consumed com-pressed work varies slightly between two conditions. Under thenon-ideal condition, more heat is required to be released into theenvironment due to the additional regeneration heat loss. The totalemitted heat occupies 42.39% of the incident solar energy. Hence,heat releasing temperature is higher and induces a plumper VePdiagram though the average pressure decreases slightly. By sub-tracting the power consumption for gas compression and powerloss by flow friction from the expansion power, net power output ofheat engine drops to 12.25 kW which is 25.56% of the total solarenergy. The drop of power output and efficiency in dish solar SEwillinfluence the performance of downstream ESS and overall systemsequentially.
With the concentration polarization in RO and PRO beingconsidered, the performance of ESS was optimized targeting withthe maximal efficiency as well. PSO was employed for it requiresless time consumption to obtain the optimal value, and the resultsare stated in Table 4. Compared with the ideal condition, it can beseen the optimalDPRO increases while the optimalDPPRO decreases.
In RO module, as water flux pierces from the concentrated sideto diluted side, concentration polarization aggravates the osmoticpressure difference. Then water flux in RO decreases with the dropof net driving force. The blue curve in Fig. 11-(a) illustrates thedistribution of transmembrane water flux under the ideal condi-tion. It can be seen the area beneath the blue curve is considerablylarge to achieve high outlet concentration difference in RO. How-ever, as utilizing the same DPRO of 2.89MPa under the non-idealcondition (black curve), water flux drops significantly with theincrease of osmotic pressure difference. This is unfavorable forachieving high outlet concentration difference. Hence, the optimalDPRO under non-ideal condition should increase to improve thetransmembrane water flux which is plotted with the red curve inFig. 11-(a). With the aforementioned analysis, the optimal DPROcorresponds to an appropriate operating state at which the DPROand flow rate of salt water are both relatively high. Meanwhile, thedetrimental factors in dish solar SE reduces the power input for ESSas well which means less salt water can be pumped. Thus, the

40 80 120 160
40
80
120
160
200
0 10 20 30 40 50 60
(b)
(kW)
42.39%
25.56%
67.95%
9.73%
0.95%
16.73%
38.60%
59.91%
38.60%
1.49%
0.00%
21.37%
100.00%
100.00% Non-ideal
Ideal
.
.
.
.
.
QL
P
QH
ELoss,r
ESolar
ELoss,c
.ELoss,o
(a)
V(c
c)
PH2(bar)
Vc,I
Ve,I
Vc,N
Ve,N
Fig. 10. Dish solar SE energy distribution comparison under ideal and non-ideal conditions.
Table 4System optimal efficiency under non-ideal condition.
Cin(M) Algorithm (�) DPRO(MPa) DPPRO(MPa) hESS;max(%) h(%) Time (�)
0.4 PSO 2.89 1.04 14.40 4.68 3 h 36min0.5 PSO 3.17 1.17 15.10 4.91 3 h 42min0.6 PSO 3.43 1.30 15.59 5.07 4 h 31min
0.0 0.4 0.8 1.2 1.6 2.0
0.0E+00
5.0E-06
1.0E-05
1.5E-05
2.0E-05
2.5E-05
3.0E-05
3.5E-05
0.00
0.01
0.02
0.03
V H,i
n,R
O(m
3/s
)
VH,in,RO
CRO,out
I
.
0.0
0.2
0.4
0.6
0.8
N
CR
O,o
ut(M
)
(b)
(a)
J w,R
O(m
/s)
XRO (m)
I- PRO=2.89 MPa
N- PRO=2.89 MPa
N- PRO=3.43 MPa
Fig. 11. Performance comparison of RO under ideal and non-ideal condition.
X. Lai et al. / Energy 182 (2019) 802e813 809
optimal DPRO under the non-ideal condition only increases in someextent, to achieve an appropriate flow rate and CP reductionsimultaneously. For the lower flow rate depicted with the red bar inFig. 11-(b) is easier to be interrupted, though the transmembranewater flux under non-ideal condition is weaker, the variation ofconcentration difference is more obvious. Finally, the outlet con-centration difference of RO under non-ideal condition is higher inFig. 11-(b), which is beneficial for PRO. When water flux piercesfrom the diluted side to the concentrated side in PRO, the mem-brane osmotic pressure difference is reduced by the concentrationpolarization in PRO. Higher initial bulk concentration difference is
capable to offset part of this negative effect. Hence, the optimalDPPRO under non-ideal condition decreases slightly.
As to the efficiency of ESS, the concentration polarization in-creases the resistance for transmembrane water flux and limits theenergy conversion ability of RO and PRO consequentially. For thesolution with an initial concentration of 0.6M, Fig. 12-(a) indicatesthe efficiency of RO and PRO both drop from 45.21% and 47.29% to41.15% and 37.88% respectively as compared with the ideal condi-tion. The corresponding concentration distribution and outletGibbs free energy are illustrated in Fig. 12-(b), it can be seen thoughthe bulk outlet concentration difference in RO under non-idealcondition is larger, lower flow rate and CP both reduce the storedGibbs free energy to 5.04 kWwith a power input of 12.25 kW. Thenin PRO, stable power of 1.91 kW is generated and the residual Gibbsfree energy is 1.07 kW. Hence, the corresponding efficiency of ESSdrops to 15.59% in Table 4. Furthermore, accompanying with thedecrease of dish solar SE efficiency from 43.18% to 25.56% in up-stream, the overall efficiency drops to 5.07% under non-ideal con-dition. The efficiency drop in dish solar module is more significantas compared with RO and PRO modules, for the imperfect regen-eration and pressure drop in the heat engine not only increasesmore heat consumption but also reduces the power output. Thus,improving the performance of dish solar engine by optimizing theheat exchange ability and flow friction will be beneficial forimproving the overall energy conversion efficiency.
4. Conclusion
A hybrid energy utilization system, integrating dish solar SE andsalinity gradient based energy storage system, was proposed torealize clean and stable power generation from solar energy. Fac-tors impacting the overall system performance are systematically

0.0 0.2 0.4 0.6 0.8 1.0
0.4
0.5
0.6
0.7
0.8
0.9
1.0
1.1
0.2 0.4 0.6 0.8 1.0
Dish solar SE RO PRO Overall0
10
20
30
40
50
60
5.07%9.23%
37.88%
47.29%
41.15%
45.21%
25.56%(%)
I
N43.18%
(a)
(b)
C(M
)
X*RO
Storage
GRO,out=5.04 kW
Residual
GPRO,out=1.07 kW
X*PRO
CH,I CL,I
CH,N CL,N
Fig. 12. Efficiency comparison of sub and overall systems in (a) and concentrationdistribution along the flow direction in RO and PRO under optimal conditions in (b).
X. Lai et al. / Energy 182 (2019) 802e813810
investigated. Higher initial concentration of salt water achievesbetter efficiency of ESS, for it has stronger osmotic pressure dif-ference along the flow direction in PRO. Moreover, optimal DPROand DPPRO exist to achieve the maximal energy conversion effi-ciency under a specified power input from dish solar SE. Theoptimal DPRO represents a state point at which operating pressureand flow rate are both relatively high to achieve strong initialtransmembrane water flux and low decreasing slope of draw so-lution concentration in PRO simultaneously. Meanwhile, theoptimal DPPRO represents the trade-off of strong specific powerability and high flow rate of extracted water. With numericaloptimization work, the maximal ESS efficiency and overall
Table A1Governing equations of adiabatic model
Step G
Volume variationV
V
Gas pressurep
ODE of operational parameters with respect to crank angled
d
d
d
d
Heat exchanged and work generated per secondQ
Q
Q
P
efficiency of 21.38% and 9.23% were achieved under ideal condition.Further considering the detrimental factors, the improvement ofoptical efficiency increases the receiver temperature to enhance thegas expansion and thermal efficiency of SE. The imperfect heatregeneration and friction loss deteriorates the efficiency of dishsolar SE for more heat is required and less shaft power is generated.Thus, power output and efficiency drop from 20.70 kW and 43.18%to 12.25 kW and 25.56% under non-ideal condition. The CP phe-nomenon in RO and PRO reduces the efficiency of EES for theresistance of transmembrane water flux is increased. As to the so-lution with initial concentration of 0.6M, the maximal ESS effi-ciency and corresponding overall efficiency decrease to 15.59% and5.07%. For improving the overall energy conversion efficiency inrealistic condition, the improvement of dish solar SE performanceshould be emphasized as comparedwith RO and PRO. Furthermore,the analysis of concentration distribution indicates the residualGibbs free energy in PRO is considerable under the optimal con-dition. Hence, configuration of multistage PRO or additionallyapplied RED device can be further investigated to enhance thestable power output.
Acknowledgements
We acknowledge the support received from the National Nat-ural Science Foundation of China (51736004,51706076).
Appendix
A1. Adiabatic model of SE
With the divided control volumes of SE as depicted in Fig. 2, thethermodynamic processes are considered operating isothermally inheater and cooler, adiabatically in compression and expansionspaces. Referred from the significant work conducted by Urieli andBerchowitz [32], the basic governing equations of adiabatic modelare listed below.
overning Equation Number
c ¼ Vclc þ12Vswcð1 þ cos qÞ (A-1)
e ¼ Vcle þ12Vsweð1 þ cosðq þ aÞÞ (A-2)
¼ mRg�Vc
Tcþ Vk
Tkþ Vr
Trþ Vh
Thþ Ve
Te
� (A-3)
pdq
¼�gp
�1Tck
dVc
dqþ 1The
dVe
dq
��Vc
Tckþ g
�Vk
Tkþ Vr
Trþ Vh
Th
�þ Ve
The
(A-4)
mc
dq¼
pdVc
dqþ 1gVc
dpdq
RTck
(A-5)
me
dq¼
pdVe
dqþ 1gVe
dpdq
RThe
(A-6)
mi
dq¼ mi
pdpdq
ði ¼ k; r;hÞ (A-7)
Tidq
¼ Ti
�1pdpdq
þ 1Vi
dVi
dq� 1
mi
dmi
dq
�ði ¼ c;eÞ (A-8)
_h ¼ F
R 2p0
�VhcvRg
dpdq
� cp
�Th
m0rh
dq� The
m0he
dq
�dq
(A-9)
_r ¼ F
R 2p0
�VrcvRg
dpdq
� cp
�Tkmkr
0
dq� Th
mrh0
dq
�dq
(A-10)
_k ¼ F
R 2p0
�VkcvRg
dpdq
� cp
�Tck
m0ck
dq� Tk
m0kr
dq
�dq
(A-11)
¼ F� R 2p
0
�pdVc
dq
�dq þ R 2p
0
�pdVe
dq
�dq
(A-12)

X. Lai et al. / Energy 182 (2019) 802e813 811
According to Ref. [32], the main calculation procedure of adia-batic model is to solve the correct gas temperature in expansionand compression spaces. For the thermodynamic cycle is a closedloop, the initial temperature in expansion and compression spaceequals to the final temperature in expansion and compressionspace respectively as the shaft rotates by a round. With the correcttemperature being solved, the heat transferred at hot and coldends, power generated can be obtained sequentially.
Table A4Model validation for PRO
CH(g/L) 35 60
DPPRO(Pa) 318303 656808 979827 324813 664241 982716Simulation (m/s) 2.95e-6 2.57e-6 2.20e-6 4.59e-6 4.32e-6 4.06e-6Experiment (m/s)[35] 2.91e-6 2.61e-6 2.32e-6 4.68e-6 4.24e-6 4.31e-6Error (%) 1.47% �1.47% �5.22% �1.87% 1.85% �5.91%
A2. Model validation
In a realistic dish solar SE, the imperfect regeneration and flowfriction loss exist and deteriorate the power output and energyefficiency. Considering the regenerator has an effectiveness of εR forheat exchange, the heat absorbed and released can be obtained asEq. (A-13) and (A-14) to achieve the energy balance in Eqs. (1) and(2).
_Q0
h ¼ _Qh þ ð1� εRÞ _Qr (A-13)
_Q0
k ¼ _Qk � ð1� εRÞ _Qr (A-14)
Meanwhile, the pressure drop originated from flow friction inthe heat exchangers induces the loss of power output as well. Thus,the realistic power output should be modified as Eq. (A-15).
P0 ¼ P � F
XðI
DpidVeÞ ði¼h; r; kÞ (A-15)
The simulation result is validated with previously reportedexperiment [33]. The comparison is listed in Table A2.
Table A2Model validation for dish solar SE
TH(K) _Qreceiver;loss(kW) _Q0
h(kW) P0(kW) hDS�SE(%)
Simulation 1134.77 5.27 32.43 12.90 26.92Experiment [33] 1123.15 6.12 31.63 12.25 25.51Error 1.03% �13.89% 2.53% 5.31% 5.53%
In Table A2, the temperature of receiver, heat loss in receiver,heat absorbed by SE, shaft power output and energy efficiency arevalidated. Results indicate the relative error of heat loss in receiveris �13.89% for the reflection and conduction losses in receiver areneglected for simplicity, the other errors are acceptable to state areliable simulation result for dish solar SE. As to the concentrationpolarization, the membrane concentration in RO is modified ac-cording to Eq. (A-16).
CH;RO;m ¼ CH;RO;b exp�Jw;RO
kRO
�(A-16)
Table A3Model validation for RO
DPRO(Pa) 518133 677547 853959 1050130 1322090
Simulation (%) 35.81 48.36 61.58 74.92 88.83Experiment (%)[34] 38.08 51.13 64.55 77.45 90.22Error �5.96% �5.42% �4.60% �3.27% �1.54%
The RO model was validated with previously reported experi-mental results. The relative error of recovery rate with the inletvelocity of 0.075m/s under different operating pressure indicatethis model is reliable to simulate the performance of RO module. Inthe modified model of PRO module, the membrane concentration
of draw and feed solutions have Eq. (A-17) and (A-18) which arestated as follows.
CH;PRO;m ¼CH;PRO;b exp�� Jw;PRO
kPRO
�� BJw;PRO
�CH;PRO;m� CL;PRO;m
�
��1� exp
�Jw;PRO
kPRO
�
(A-17)
CL;PRO;m¼CL;PRO;b exp�KJw;PRO
�þ BJw;PRO
�CH;PRO;m �CL;PRO;m
�
�hexp
�KJw;PRO
��1
i
(A-18)
The PRO model was validated with the relative experiment,water flux calculated was compared with the experimental resultsunder different operating pressure and concentration of draw so-lution. The relative error indicates the modified model of PRO isreliable.
Nomenclature
A Area in dish solar SE m2, Water permeation coefficientin RO and PRO m =ðs ,PaÞ
B Salt permeability coefficient m =scp Specific heat at constant pressure J =ðkg ,KÞC Sunshine concentration ratio in dish solar SE, Salt
concentration in RO and PRO mol =m3
F Rotation frequency of engine shaft Hzhc Convective heat transfer coefficient W =ðm2 ,KÞI Solar flux intensity W =m2
Jw Transmembrane water flux m =sK Heat transfer ability in dish solar SE W =K , Solute
resistivity in PRO s =mL Length of semipermeable membrane mm Mass of charged gas in SE kg_mw Mass flow rate of coolant kg =sN Unit number of RO and PROp Pressure of charged gas in SE PaP Power output W_Q Heat transfer rate WR Molar gas constant J =ðmol ,KÞRg Gas constant J =ðkg ,KÞS State pointT Temperature K

X. Lai et al. / Energy 182 (2019) 802e813812
Tan Water tankV Volume cc_V Volume flow rate m3 =sVwind Wind velocity m =sW Width of semipermeable membrane mDP Operating pressure difference MPaDp Osmotic pressure difference MPaDG Gibbs free energy W
Greek Symbolsa Phase angle radg Specific heat ratioε Emissivity of solar receiverεR Effectiveness of regeneratorh Efficiency %s Stefan Boltzmann constant W =ðm2 ,K4Þq Crank angle rad
Subscripts0 Environment1e18 State turning pointsb Bulk flowc Compression spaceck Interface between compression space and coolercl Clearance volumeDish Solar dishDS-SE Dish solar SEe Expansion spaceERD Energy recovery deviceh Heat absorbing of gas/Heaterhe Interface between heater and expansion spaceH Hot end in dish solar SE, High salt solution
concentration in RO and PROI Ideal conditionin Inletk Coolerkr Interface between cooler and regeneratorl Heat releasing of gas/CoolerL Cold end in dish solar SE, Low salt solution
concentration in RO and PROM MixtureN Non-ideal conditionout Outletr Regeneratorrh Interface between regenerator and heaterR Receiversw Swept volumew Water
AbbreviationsCAES Compressed air energy storageCP Concentration polarizationESS Energy storage systemGA Genetic algorithmGPS Generalized pattern searchLINMAP Linear programming techniques for multidimensional
analysis of preferenceODE Ordinary differential equationPHS Pumped hydro storagePRO Pressure retarded osmosisPSO Particle swarm optimizationPX Pressure exchangerRED Reverse electrodialysisRO Reverse osmosis
SE Stirling engineSEC Specific energy consumption kW,h=m3
SWRO Sea water reverse osmosis
References
[1] Bilgen S. Structure and environmental impact of global energy consumption.Renew Sustain Energy Rev 2014;38:890e902.
[2] Jiang L, Agrawal AK, Taylor RP. Clean combustion of different liquid fuels usinga novel injector. Exp Therm Fluid Sci 2014;57:275e84.
[3] Long R, Lai X, Liu Z, Liu W. Direct contact membrane distillation system forwaste heat recovery: modelling and multi-objective optimization. Energy2018;148:1060e8.
[4] Fern�andez-Gonz�alez D, Ruiz-Bustinza I, Gonz�alez-Gasca C, Pi~nuela Noval J,Moch�on-Casta~nos J, Sancho-Gorostiaga J, et al. Concentrated solar energyapplications in materials science and metallurgy. Sol Energy 2018;170:520e40.
[5] Lai X, Long R, Liu Z, Liu W. A hybrid system using direct contact membranedistillation for water production to harvest waste heat from the proton ex-change membrane fuel cell. Energy 2018;147:578e86.
[6] Roumpedakis TC, Christou T, Monokrousou E, Braimakis K, Karellas S. Inte-grated ORC-Adsorption cycle: a first and second law analysis of potentialconfigurations. Energy 2019;179:46e58.
[7] Liu W, Liu P, Dong ZM, Yang K, Liu ZC. A study on the multi-field synergyprinciple of convective heat and mass transfer enhancement. Int J Heat MassTransf 2019;134:722e34.
[8] Liu W, Liu P, Wang JB, Zheng NB, Liu ZC. Exergy destruction minimization: aprinciple to convective heat transfer enhancement. Int J Heat Mass Transf2018;122:11e21.
[9] Wang G, Yao Y, Chen Z, Hu P. Thermodynamic and optical analyses of a hybridsolar CPV/T system with high solar concentrating uniformity based on spectralbeam splitting technology. Energy 2019;166:256e66.
[10] Aksoy F, Karabulut H. Performance testing of a Fresnel/Stirling micro solarenergy conversion system. Energy Convers Manag 2013;75:629e34.
[11] Li Y, Liu G, Liu X, Liao S. Thermodynamic multi-objective optimization of asolar-dish Brayton system based on maximum power output, thermal effi-ciency and ecological performance. Renew Energy 2016;95:465e73.
[12] Ahmadi MH, Mohammadi AH, Dehghani S, Barranco-Jim�enez MA. Multi-objective thermodynamic-based optimization of output power of Solar Dish-Stirling engine by implementing an evolutionary algorithm. Energy ConversManag 2013;75:438e45.
[13] Cheng C-H, Yang H-S. Optimization of rhombic drive mechanism used in beta-type Stirling engine based on dimensionless analysis. Energy 2014;64:970e8.
[14] Ipci D, Karabulut H. Thermodynamic and dynamic analysis of an alpha typeStirling engine and numerical treatment. Energy Convers Manag 2018;169:34e44.
[15] Ahmadi MH, Sayyaadi H, Dehghani S, Hosseinzade H. Designing a solarpowered Stirling heat engine based on multiple criteria: maximized thermalefficiency and power. Energy Convers Manag 2013;75:282e91.
[16] Ahmadi MH, Ahmadi MA, Mellit A, Pourfayaz F, Feidt M. Thermodynamicanalysis and multi objective optimization of performance of solar dish Stirlingengine by the centrality of entransy and entropy generation. Int J Electr PowerEnergy Syst 2016;78:88e95.
[17] Aksoy F, Karabulut H, Çınar C, Solmaz H, €Ozg€oren Y€O, Uyumaz A. Thermalperformance of a Stirling engine powered by a solar simulator. Appl ThermEng 2015;86:161e7.
[18] Carrillo Caballero GE, Mendoza LS, Martinez AM, Silva EE, Melian VR,Venturini OJ, et al. Optimization of a Dish Stirling system working with DIR-type receiver using multi-objective techniques. Appl Energy 2017;204:271e86.
[19] Ferreira AC, Nunes ML, Teixeira JCF, Martins LASB, Teixeira SFCF. Thermody-namic and economic optimization of a solar-powered Stirling engine formicro-cogeneration purposes. Energy 2016;111:1e17.
[20] Kadri Y, Hadj Abdallah H. Performance evaluation of a stand-alone solar dishStirling system for power generation suitable for off-grid rural electrification.Energy Convers Manag 2016;129:140e56.
[21] He W, Wang J. Feasibility study of energy storage by concentrating/desali-nating water: concentrated Water Energy Storage. Appl Energy 2017;185:872e84.
[22] Long R, Lai X, Liu Z, Liu W. A continuous concentration gradient flow electricalenergy storage system based on reverse osmosis and pressure retardedosmosis. Energy 2018;152:896e905.
[23] Lai X, Long R, Liu Z, Liu W. Stirling engine powered reverse osmosis forbrackish water desalination to utilize moderate temperature heat. Energy2018;165:916e30.
[24] Guo C, Chang H, Liu B, He Q, Xiong B, Kumar M, et al. A combinedultrafiltrationereverse osmosis process for external reuse of Weiyuan shalegas flowback and produced water. Environ Sci: Water Res. Technol. 2018;4(7):942e55.
[25] He W, Wang Y, Shaheed MH. Modelling of osmotic energy from natural saltgradients due to pressure retarded osmosis: effects of detrimental factors andflow schemes. J Membr Sci 2014;471:247e57.
[26] Banchik LD, Sharqawy MH, Lienhard JH. Effectiveness-mass transfer units

X. Lai et al. / Energy 182 (2019) 802e813 813
(ε-MTU) model of a reverse osmosis membrane mass exchanger. J Membr Sci2014;458:189e98.
[27] He W, Wang Y, Shaheed MH. Maximum power point tracking (MPPT) of ascale-up pressure retarded osmosis (PRO) osmotic power plant. Appl Energy2015;158:584e96.
[28] Yip NY, Elimelech M. Thermodynamic and energy efficiency analysis of powergeneration from natural salinity gradients by pressure retarded osmosis. En-viron Sci Technol 2012;46(9):5230e9.
[29] Prante JL, Ruskowitz JA, Childress AE, Achilli A. RO-PRO desalination: an in-tegrated low-energy approach to seawater desalination. Appl Energy2014;120:104e14.
[30] Wan CF, Chung T-S. Energy recovery by pressure retarded osmosis (PRO) inSWROePRO integrated processes. Appl Energy 2016;162:687e98.
[31] Banan Sadeghian R, Pantchenko O, Tate D, Shakouri A. Miniaturized concen-tration cells for small-scale energy harvesting based on reverse electrodial-ysis. Appl Phys Lett 2011;99(17):173702.
[32] Urieli I, Berchowitz DM. Stirling cycle engine analysis: A. Hilger Bristol. 1984.[33] Reinalter W, Ulmer S, Heller P, Rauch T, Gineste J-M, Ferriere A, et al. Detailed
performance analysis of a 10kW Dish stirling system. J Sol Energy Eng2008;130(1):011013.
[34] Song L, Tay K. Performance prediction of a long crossflow reverse osmosismembrane channel. J Membr Sci 2006;281(1e2):163e9.
[35] Achilli A, Cath TY, Childress AE. Power generation with pressure retardedosmosis: an experimental and theoretical investigation. J Membr Sci2009;343(1e2):42e52.


![M :î )åD%'#1×,º-â 7(¯ ]tsl.energy.hust.edu.cn/__local/9/7F/0E/2467E62A31... · (1School of Energy and Engineering Power , Huazhong University of Science and Technology , Wuhan](https://static.fdocuments.net/doc/165x107/5f056ae57e708231d412dca2/m-d1-7-tsl-1school-of-energy-and-engineering-power-huazhong.jpg)


