Clean Air Interstate Rule - EPA's Web Archive | US EPA
25
Transcript of Clean Air Interstate Rule - EPA's Web Archive | US EPA

12/2/2005
Technical Support Document for the
Rule to Reduce Interstate Transport of Fine Particulate Matter and Ozone (Clean Air Interstate Rule):
Reconsideration Notice of Proposed Rule
Sulfur Dioxide Allowance Allocation Methodology Comparative Analysis Technical Support Document
EPA Docket number: OAR-2003-0053 December 2005
U.S. Environmental Protection Agency Office of Air and Radiation
1

12/2/2005
Sulfur Dioxide Allocations Methodology Technical Support Document This Technical Support Document (TSD) provides a description of the analysis done in support of EPA’s response to the petition for reconsideration on the Clean Air Interstate Rule (CAIR) Sulfur Dioxide (SO2) allocation methodology. It also provides information on data sources for the analyses. This document includes details of the following analyses:
• Ratio of allocation to CAIR base case emissions scenario by parent company for 2015
• Ratio of allocation to projected emissions with CAIR controls (control case) by parent company for 2015
• Owner/operator level information for each of the above (base case and control case in 2015)
It also includes appendices of the data sources and methods for aggregating unit and plant level data to the owner/operator and parent/holding company level (Source: Memo from David Sellers, Perrin Quarles Associates, 12/02/05). The underlying data, including data for both 2010 and 2015, is available in the docket (OAR-2003-0053), as “SO2 Allowance Allocation Methodology Comparative Analysis Data Files.”
Overview A variety of SO2 allowance allocation methodologies were raised and analyzed during the rulemaking process. Aside from the method chosen by EPA, which is the allocation method chosen by Congress in title IV of the Clean Air Act, other methodologies analyzed included allocating on the basis of recent historic tonnage emissions, heat input (with alternatives based on heat input from all fossil generation, and heat input from coal- and oil-fired generation only) and heat output (with alternatives based on all generation and all fossil-fired generation). While each allocation methodology suggested by commenters during the rulemaking process has its advantages and disadvantages for different companies and States, EPA explained in the final rule that its chosen methodology is reasonable on several grounds. First, EPA believes that “achieving SO2 reductions for electric generating units (EGU) using the title IV allowances is necessary in order to ensure the preservation of a viable title IV program” (Response to Comments (RTC) at 511, section X.A.26, 2005). See also discussion in preamble to the final CAIR in section IX (70 FR 25290-91). Second, in using the title IV allowances, EPA relied on the selection by Congress of the permanent allocation methodology established in title IV for purposes of reducing SO2 emissions. As stated in the RTC (p. 512), “Congress clearly did not choose a policy to regularly revisit and revise these allocations, believing that its allocations methodology for title IV
2

12/2/2005
allowances would be appropriate for future time periods.” Third, title IV allowance allocations provide a logical and well understood starting point from which additional EGU SO2 emission reductions can be achieved for Acid Rain units, which are the vast majority of affected CAIR EGUs. Finally, EPA’s State-by-State analysis of several methods for SO2 allocations shows that the use of title IV allowances to develop State budgets creates a reasonable result (see RTC, section X.A.26). In more than two-thirds of CAIR States (which account for about 80 percent of the total heat input in the CAIR region from 1999-2002), the State budget calculated using the title IV allowances results in the State receiving a percentage of total SO2 allocations that is within the range of percentages resulting under other suggested SO2 allocation methods (see RTC, Section X.A.26). For example, Ohio’s budget for 2010 under EPA’s method is 333,520 tons, which is about 9 percent of the total (CAIR region) budget of 3,619,196 tons.1 When we calculated budgets and percentage share of the total budget for each of the alternative methodologies, we found that Ohio would receive the largest percentage of the CAIR region budget under the historic tonnage method (about 12%) and the smallest percentage share under the output method for all generation (about 5%). The title IV method, chosen by EPA, provides a percentage share of total allocations within the range set by the maximum and minimum percentages from all methods analyzed. The policy decision to base the CAIR SO2 budgets on the existing title IV allowance system, and EPA’s demonstration that the result of using the system is reasonable, fully support the use of an allocation system based on title IV allowances. Nevertheless, as a part of this reconsideration, EPA performed additional analyses, explained below, to evaluate the SO2 allocation methodology in the final CAIR rule in light of the petitioner’s concerns. Similar to the State-by-State analysis, in these analyses, EPA compared three alternative SO2 allowance allocation methodologies to the methodology in the final CAIR. However, in these analyses, EPA examined how allowances were distributed to companies relative to their projected SO2 emissions because the petitioner claimed that the distribution of SO2 allowances is inequitable and unreasonable. According to the petitioner, the allowance distribution will result in the petitioner’s relatively low-emitting units buying allowances from other relatively high-emitting units. When evaluating the impact of the various allocation methodologies, computing allocations on a company-by-company basis is more appropriate than comparing allocations on a unit-by-unit basis, although allowances are allocated to units. This is because, while one unit could be allocated fewer allowances under one methodology, the methodology could result in another unit owned by the same company being allocated more allowances, which may offset the smaller allocation of the first unit. If the units are at the same source, the allowances can be used to cover emissions from either unit, and if the units are at different sources, allowances can be transferred from one source to the other at little or no cost. EPA analyzed the allocation methodologies at the parent company (e.g., at the holding company level where applicable). EPA also conducted this
1 EPA’s methodology to calculate the Regional and State budgets is described in the TSD in the docket http://www.epa.gov/cair/pdfs/finaltech06.pdf
3

12/2/2005
analysis at the operating company level, which takes into account that holding companies may incur some cost to shift allowances between operating companies (which typically consist of units within a single State), especially in States with price-regulation over power generation. Believing that taking this into account would not have a major effect on the outcome of these analyses, EPA performed this portion of the analyses to test this assumption. EPA utilized the best SO2 allowance allocation, heat input, and emissions data available to the Agency at the time of this Response to CAIR Petition for Reconsideration. EPA’s analyses encompassed about two-thirds of the total number of CAIR plants, over 95 percent of total annual allocations for all methodologies, and about 97 percent of the total projected emissions in the CAIR region during the years 2010 and 2015 and for both control and base cases (Note: 2015 analyses are described herein; 2010 figures and tables can be found in the docket, OAR-2003-0053, “SO2 Allowance Allocation Methodology Comparative Analysis Data Files”). The three alternative allowance allocation methodologies EPA analyzed were suggested by various commenters during the rulemaking process. These methodologies are:
1. Allocating allowances based on more recent heat input data; 2. Allocating allowances based on more recent heat input data adjusted for
fuel type (e.g. coal, oil and gas); 3. Allocating allowances based on more recent heat input data adjusted both
for fuel type (e.g. coal, oil and gas) and for coal type (e.g. bituminous, sub-bituminous and lignite).
In comparing the CAIR final SO2 allocation methodology and the three alternative methodologies, EPA took into account certain factors that are applicable to the CAIR final allocation methodology but not to the three alternative methodologies. For all four methodologies, EPA analyzed the resulting total allowance allocations, and the total projected emissions, for companies’ sources located in the States subject to CAIR. In addition, for all the methodologies, EPA analyzed the relationship between allowances and emissions in two ways. In the first (see Section 1), EPA calculated the ratio of allowances to total projected emissions before CAIR controls (base case). This measures how much each company falls short of allowances relative to CAIR-required reductions and gives a sense of the effort required of companies to either purchase allowances or add controls to cover their activities after they consider their allocated allowances. Then, in the second approach (see Section 2), EPA calculated the ratio of allowances to total projected emissions with CAIR controls installed (control case). This way measures how many allowances a company would need to purchase or would be able to sell after controls are installed, or if companies would have excess allowances to sell if their units already had relatively low emissions. For the CAIR final methodology, EPA also considered both the allowance allocations and emissions for companies’ sources both in the CAIR region and outside the CAIR region. EPA believes that this is appropriate because, under the CAIR final
4

12/2/2005
methodology, if a company’s sources outside the CAIR region have more title IV allowances than needed to cover their emissions under the Acid Rain Program, the company could transfer, at little or no net cost, excess allowances to the company’s sources in the CAIR region for use to cover emissions under the CAIR trading program. Under the three alternative methodologies, which would require creating new CAIR SO2 allowances independent of the existing title IV allocations, CAIR sources could not use title IV allowances held for sources outside (or in) the CAIR region for compliance with the CAIR SO2 allowance holding requirement. Opting into the Acid Rain Program Further, in the analysis of the CAIR final methodology, EPA considered the allocation of title IV allowances to CAIR region units that are not currently in the Acid Rain Program but that could opt into the Acid Rain Program and receive title IV allowances (see 42 U.S.C. 7651i and 18 CFR part 74). This analysis assumed that companies owning non-Acid Rain units subject to CAIR would opt into the Acid Rain Program because they would receive title IV allowances to cover a portion of the units’ emissions under CAIR. EPA believes this assumption is reasonable because any of these units has the option of becoming an Acid Rain Program opt-in unit at little cost. In contrast, the analysis of the three alternative methodologies did not consider Acid Rain Program opt-in allowances because these approaches do not use title IV allowances for CAIR compliance. EPA maintains that the statutory and regulatory provisions governing Acid Rain Program opt-in units allow units that are subject to CAIR, but not to the Acid Rain Program, to opt into the Acid Rain Program. Under section 410(a) of the Clean Air Act, the owner or operator of any unit that emits SO2 and “is not, nor will become, an affected unit” under the general applicability provisions of CAA title IV (i.e., starting in 2000, CAA sections 403(e)(for new units) and 405 (for existing units)) may apply to have the unit become an opt-in unit under the Acid Rain Program. 42 U.S.C. 7651i(a). (The separate treatment of “process sources” under sections 410(a) and (e) is not applicable to electric generating units covered by CAIR.) Section 410 was added to the Clean Air Act by the Clean Air Act Amendments of 1990, which were enacted on November 15, 1990. EPA interprets section 410(a) to allow any SO2-emitting unit not currently covered by the general applicability provisions to opt into the Acid Rain Program and be allocated SO2 allowances, provided that certain requirements (e.g., emissions monitoring and reporting requirements under part 75 of the Acid Rain regulations) are met. EPA maintains that the section 410(a) language referring to a unit that “is not” an affected unit reflects the fact that one of the general applicability provisions (section 405) covers units in existence when the Clean Air Act Amendments of 1990 were enacted and that the section 410(a) language referring to a unit that “will [not] become” an affected unit reflects the fact that another general applicability provision (section 403(e)) covers units (i.e., units that had not even commenced construction in November 1990) that were not in existence at the time of enactment. In short, section 410(a) included language using both a verb in the present tense (i.e., “is not”) to refer to existing units and a verb in the future tense (i.e., “nor will become”) to refer to future units. EPA does not interpret the latter language -- which was necessary as a matter of grammar to refer to units not in existence in 1990 -- to bar, from opting in, currently operating units that are not covered by the generally
5
12/2/2005
applicability provisions but that may become subject to those provisions sometime in the future. Consequently, a unit that currently has an exemption from the general applicability provisions, e.g., an exempt cogeneration unit under CAA section 402(17)(C) or 405(g)(6)(A)), may opt in under section 410(a), even if the exemption may be lost sometime in the future. Such a unit may become and remain an opt-in unit until the unit loses its exemption. This interpretation of section 410(a) is reflected in the implementing regulations. For example, § 74.2 states that the opt-in regulations apply to units that “are not affected units under § 72.6 [the general applicability provisions]...and that are operating and are located in the 48 contiguous States of the District of Columbia”. 40 CFR 74.2. The opt-in regulations do not exclude operating units that are currently exempt from the general applicability provisions but that may subsequently lose their exemption. Moreover, § 74.46(b)(iii) specifically addresses how to treat opt-in allowance allocations for operating units that opt in but subsequently become subject to the general applicability provisions. Since the provision explains how to treat such allowance allocations for the year in which the units lose their exemption and for subsequent years, this supports EPA’s interpretation that currently exempt units may become opt-in units even though they may lose their exemption in the future. EPA notes that the additional cost for CAIR units of opting into the Acid Rain Program will be minimal. The major cost for any unit to opt in is the cost of meeting emissions monitoring and reporting costs under part 75. Whether or not they become Acid Rain Program opt-in units, all units under CAIR already have to meet, and incur the costs of, part 75 emissions monitoring and reporting requirements.
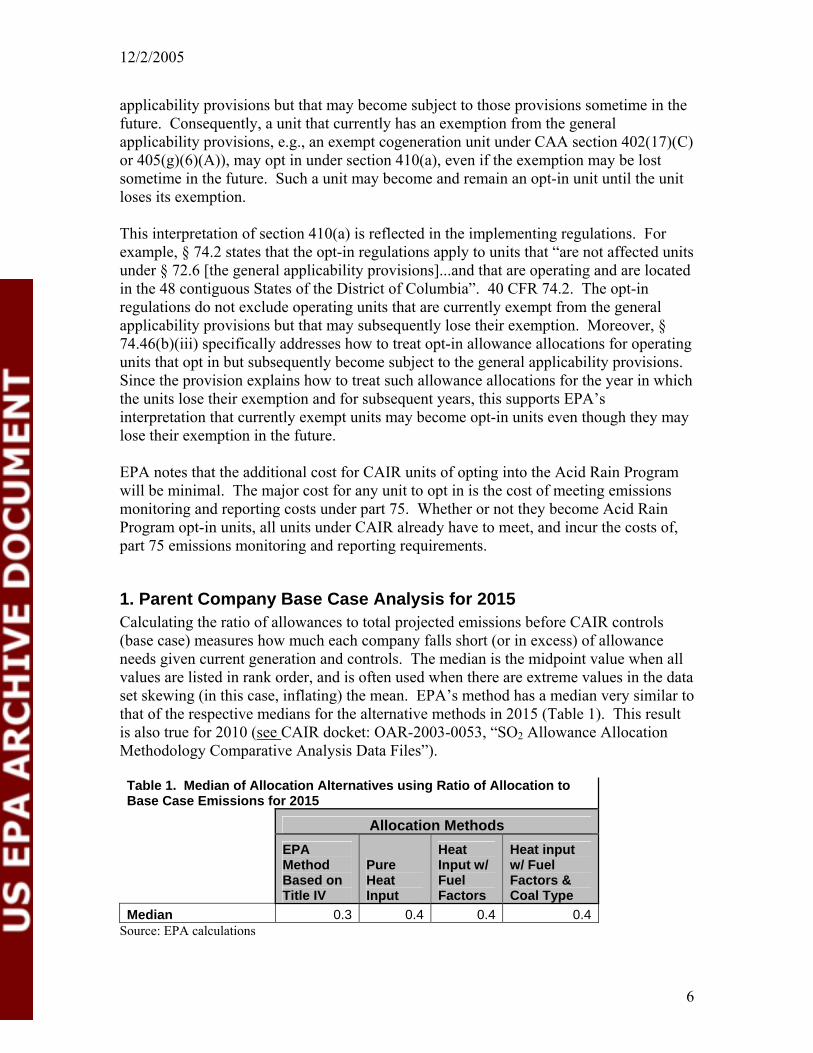
1. Parent Company Base Case Analysis for 2015 Calculating the ratio of allowances to total projected emissions before CAIR controls (base case) measures how much each company falls short (or in excess) of allowance needs given current generation and controls. The median is the midpoint value when all values are listed in rank order, and is often used when there are extreme values in the data set skewing (in this case, inflating) the mean. EPA’s method has a median very similar to that of the respective medians for the alternative methods in 2015 (Table 1). This result is also true for 2010 (see CAIR docket: OAR-2003-0053, “SO2 Allowance Allocation Methodology Comparative Analysis Data Files”). Table 1. Median of Allocation Alternatives using Ratio of Allocation to Base Case Emissions for 2015
Allocation Methods
EPA Method Based on Title IV
Pure Heat Input
Heat Input w/ Fuel Factors
Heat input w/ Fuel Factors & Coal Type
Median 0.3 0.4 0.4 0.4 Source: EPA calculations
6

12/2/2005
In this analysis, companies are ranked in ascending order by their ratio of SO2 allowance allocation to emissions. The distribution of ratios of allocation to emissions for each method were then charted in the figures below. The values under each method were rank-ordered independently, and therefore, the changes in ratios for an individual company are not represented here. The complete data file can be found in docket, which includes company-specific data to compare across the methods (OAR-2003-0053, “SO2 Allowance Allocation Methodology Comparative Analysis Data Files”). The figures below show values for more than 90 percent of companies, which are below a ratio of 4.0 (allowances to emissions). A smaller figure shows the effect of including all companies in the chart except for extreme values. Including extreme values would render the chart unreadable. Figure 1. Source: EPA – see Appendix A, PQA Memo, for detailed description of data sources.
Ratio of SO2 Allowance Allocations to CAIR Base Case Emissions (without Controls) in 2015 for 114 Companies
under CAIR Method and Alternatives
0.00
1.00
2.00
3.00
4.00
1 10 19 28 37 46 55 64 73 82 91 100 109Cumulative Number of Parent/Holding Companies
Rat
io o
f SO
2 A
llow
ance
Allo
catio
ns to
C
AIR
Bas
e C
ase
in 2
015
EPA Method (w/ non-CAIR + opt-ins) Pure Heat Input HI w/ Fuel Factors HI w/ FF & Coal Type
*Extreme values removed from Figure
7

12/2/2005
Figure 2. Source: EPA – see Appendix A, PQA Memo, for detailed description of data sources.
Ratio of SO2 Allowance Allocations to CAIR Base Case Emissions (without Controls) in 2015 for 114 Companies
under CAIR Method and Alternatives
0100200300400500600700800900
1000
1 10 19 28 37 46 55 64 73 82 91 100 109Cumulative Number of Parent/Holding Companies
Rat
io o
f SO
2 A
llow
ance
A
lloca
tions
to C
AIR
Bas
e C
ase
in 2
015
EPA Method (w/ non-CAIR + opt-ins) Pure Heat Input
HI w/ Fuel Factors HI w/ FF & Coal Type
*Extreme values excluded The above figures show that EPA’s method – which is based on the title IV SO2 allocation method – is not significantly different than the alternative approaches analyzed. Given the over-riding policy decision to maintain the title IV SO2 trading program, EPA’s method is a reasonable approach for SO2 allowance allocations under CAIR. For 2015, EPA’s analysis shows that the cumulative number of companies with a variety of ratios of projected base case SO2 allowance allocations to emissions are similar across the four methodologies. In 2015 EPA’s method provides up to a ratio of 1.7 allowances to base case emissions for the lower 90 percent of companies analyzed (out of 103 companies in 2015). The corresponding range of ratios for the alternative methods is 1.4 (heat input with fuel factors and coal type) to 3.2 (pure heat input). EPA’s preliminary analysis of data for 2010 showed a similar relationship between data is in the docket (OAR-2003-0053, “SO2 Allowance Allocation Methodology Comparative Analysis Data Files”).
2. Parent Company CAIR Control Case Analyses for 2015 EPA calculated the ratio of allowances to total projected emissions with CAIR controls installed (control case). This approach measures how many allowances a company would need to purchase after controls are installed. The control case analyses, like the base case analyses, show that EPA’s method is not significantly different from the alternatives analyzed.
8
12/2/2005
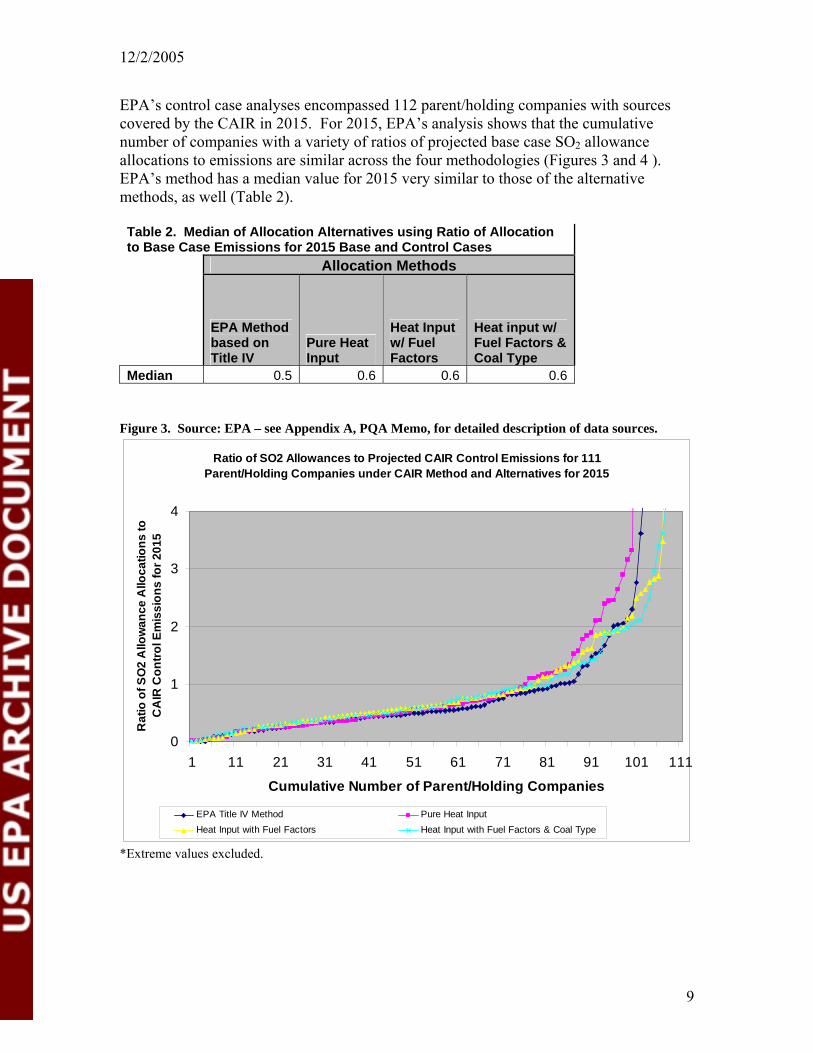
EPA’s control case analyses encompassed 112 parent/holding companies with sources covered by the CAIR in 2015. For 2015, EPA’s analysis shows that the cumulative number of companies with a variety of ratios of projected base case SO2 allowance allocations to emissions are similar across the four methodologies (Figures 3 and 4 ). EPA’s method has a median value for 2015 very similar to those of the alternative methods, as well (Table 2). Table 2. Median of Allocation Alternatives using Ratio of Allocation to Base Case Emissions for 2015 Base and Control Cases Allocation Methods
EPA Method based on Title IV
Pure Heat Input
Heat Input w/ Fuel Factors
Heat input w/ Fuel Factors & Coal Type
Median 0.5 0.6 0.6 0.6 Figure 3. Source: EPA – see Appendix A, PQA Memo, for detailed description of data sources.
Ratio of SO2 Allowances to Projected CAIR Control Emissions for 111 Parent/Holding Companies under CAIR Method and Alternatives for 2015
0
1
2
3
4
1 11 21 31 41 51 61 71 81 91 101 11
Cumulative Number of Parent/Holding Companies
Rat
io o
f SO
2 A
llow
ance
Allo
catio
ns to
C
AIR
Con
trol E
mis
sion
s fo
r 201
5
1
EPA Title IV Method Pure Heat InputHeat Input with Fuel Factors Heat Input with Fuel Factors & Coal Type
*Extreme values excluded.
9

12/2/2005
Figure 4. Source: EPA – see Appendix A, PQA Memo, for detailed description of data sources.
Ratio of SO2 Allowances to Projected CAIR Control Emissions for 111 Parent/Holding Companies under CAIR Method and Alternatives for
2015
0100200300400500600700800900
1000
1 21 41 61 81 101
Cumulative Number of Parent/Holding Companies
Rat
io o
f SO
2 A
llow
ance
A
lloca
tions
to C
AIR
Con
trol
Em
issi
ons
for 2
015
EPA Title IV Method Pure Heat InputHeat Input with Fuel Factors Heat Input with Fuel Factors & Coal Type
*Extreme values excluded. While allocations vary from company to company under the four methodologies, overall, the distributions of allowances that companies received relative to their projected emissions for the CAIR control case are very similar. For example, when looking at company-specific comparisons for the ten largest emitting parent companies with CAIR controls (which are likely to be the largest power companies overall), the difference between the ratio of SO2 allocations to emissions for the EPA method and the next best alternative vary by less than a ratio of 0.1 for eight of the ten companies [see Table 3, Column labeled, “Ratio Difference (Max or Next Best Minus EPA Method)”]. The exceptions were TXU and Cinergy. TXU is predicted to have a ratio 0.14 higher under the EPA method than the next best alternative, while Cinergy is predicted to have a ratio 0.22 lower than the higher of the four alternatives. Although Cinergy is predicted to have a larger ratio under a different method, even under EPA’s method, Cinergy should be able to account for 70 percent of its emissions with allowances after CAIR controls, according to this analysis (Table 3). Other large companies (not in the top ten, as defined above) like, Duke and Allete have similar ratios across all methodologies (less than ten points variation). However, AES, South Carolina Public Service Authority, and FPL see increases in the allowance-to-emissions ratio greater than 0.1 with alternative methods. In all the methods analyzed, FPL is predicted to be able to account for all of its emissions and have an excess
10

12/2/2005
available to be banked or sold. AES and South Carolina should be able to cover more than two-thirds and nearly one-half of their emissions (respectively) under EPA’s method (Table 3). The lack of consistency in direction of the change in ratio (increase or decrease), as well as the small overall change in ratios for large companies further suggests that no methodology stands out as providing a more reasonable method of allocation across all companies. This is true when examining allowance needs under either the base case or control case, as described above. Table 3. Ratio of Allowance Allocation to Emissions for Select High-Emitting Companies
2015 CAIR Control Scenario Allocation Methodologies
2015 Base Case Scenario Allocation Methodologies
Parent Company
EPA Method
Pure Heat Input
Heat Input with Fuel Factors
Heat Input with Fuel Factors and Coal Type
Ratio Difference (Max or Next Best Minus EPA Method)
EPA Method
Pure Heat Input
Heat Input with Fuel Factors
Heat Input with Fuel Factors and Coal Type
Ratio Difference (Max or Next Best Minus EPA Method)
In Top 10 (Y or N)
Southern 0.49 0.47 0.51 0.50 0.01 0.25 0.24 0.26 0.26 0.00 yes AEP 0.71 0.72 0.77 0.75 0.06 0.24 0.23 0.24 0.24 0.00 yes TVA 0.46 0.48 0.49 0.51 0.05 0.29 0.30 0.31 0.32 0.03 yes DTE ENERGY CO 0.30 0.26 0.30 0.27 0.00 0.29 0.26 0.29 0.27 0.00 yes Ameren 0.44 0.44 0.46 0.48 0.03 0.25 0.24 0.25 0.27 0.02 yes LGE 0.48 0.49 0.48 0.47 0.02 0.35 0.36 0.35 0.34 0.01 yes TXU 0.64 0.37 0.50 0.49 -0.14 0.64 0.37 0.50 0.49 -0.14 yes Alliant Energy 0.28 0.27 0.27 0.25 -0.01 0.27 0.26 0.26 0.24 -0.01 yes Cinergy 0.70 0.83 0.82 0.93 0.22 0.25 0.30 0.30 0.33 0.04 yes Edison International 0.52 0.56 0.57 0.42 0.05 0.30 0.32 0.32 0.24 0.02 yes Duke 0.62 0.59 0.57 0.58 -0.03 0.59 0.56 0.55 0.55 -0.03 no AES 0.57 0.59 0.79 0.97 0.41 0.42 0.43 0.58 0.72 0.30 no SOUTH CAROLINA PUBLIC SERVICE AUTH. 0.44 0.57 0.58 0.58 0.14 0.32 0.42 0.42 0.43 0.11 no ALLETE INC 0.26 0.28 0.28 0.28 0.01 0.25 0.27 0.27 0.26 0.02 no FPL 13.76 18.62 6.61 2.97 4.86 4.59 6.21 2.21 0.99 1.62 no
11

12/2/2005
3. Owner/Operator-level Base Case and Control Case Analyses for 2015 EPA analyses at the operating company level take into account that companies may incur some cost to shift allowances across State lines, e.g. if the States involved regulate retail electricity sales. Believing that taking this into account would not have a major effect on the outcome of these analyses, EPA performed this portion of the analyses to test this assumption. The results for the owner/operating company analyses were not a lot different than the parent/holding company analyses. In the below described analyses, EPA’s method provides a ratio of allocations to emissions similar to the two heat input alternatives that include fuel factors. This is true for both 2010 (see docket: OAR-2003-0053, “SO2 Allowance Allocation Methodology Comparative Analysis Datafile”) and 2015 and with base case and control case emissions. One major difference seen in the owner-level analyses compared to the parent-level analyses for 2015 is that the pure heat input method provides extremely high allocation-to-emissions ratios to a larger number of companies. The reason for this trend is that it is the only allocation method of the four analyzed that does not include any fuel-weighting. Therefore, these companies with primarily gas generation,2 having little or no emissions, are estimated to receive a disproportionately large number of allowances relative to their emissions under the pure heat input method. These gas generation companies, in general, will not be investing in controls to meet CAIR emissions reduction requirements. Many of these same predominantly gas generation companies have zero allowances under the EPA method because the units they operate commenced operations after 1990, which accounts for the number of companies at the lower end of the spectrum on EPA’s curve of figures 5 through 8. Since these units have negligible SO2 emissions, receiving no allowances will not significantly impact the operating companies (see docket, OAR-2003-0053, “SO2 Allowance Allocation Methodology Comparative Analysis Data Files,” for related data). The median for the owner/operating companies in both control and base case scenarios is close to the medians of the other fuel factor methods analyzed for both 2010 and 2015, being only one-tenth lower than the next higher alternative (Tables 4 and 5). The trend of values for all methods begins to converge at the higher end of the spectrum, which can be seen in the smaller figures. Complete data tables supporting these analyses are in the docket (OAR-2003-0053), as “SO2 Allowance Allocation Methodology Comparative Analysis Data Files.” 2 Companies that are in the 70th percentile or greater of ratios under the pure heat input approach (the top 68 out of 204 analyzed for CAIR control case and the top 61 of 209 for base case) are all exclusively gas-fired.
12

12/2/2005
Table 4. Median Analysis of Allocation Alternatives using Ratio of Allocation to Base Case Emissions for 2010 & 2015 Allocation Methods
EPA Method Based on Title IV
Pure Heat Input
Heat Input w/ Fuel Factors
Heat input w/ Fuel Factors & Coal Type
2010 Median 0.3 0.6 0.5 0.42015 Median 0.2 0.4 0.3 0.3 Table 5. Median Analysis of Allocation Alternatives using Ratio of Allocation to CAIR Control Emissions for 2010 & 2015 Allocation Methods
EPA Method Based on Title IV
Pure Heat Input
Heat Input w/ Fuel Factors
Heat input w/ Fuel Factors & Coal Type
2010 Median 0.5 1.2 0.7 0.62015 Median 0.4 1.2 0.5 0.6 Figure 5. Source: EPA – see Appendix A, PQA Memo, for detailed description of data sources.
Ratio of SO2 Allowances to Base Case Emissions for 209 Owner/Operating Companies under CAIR Method
and Alternatives for 2015
0
1
2
3
4
1 21 41 61 81 101 121 141 161 181 201
Cumulative Number of Owner/Operating Companies
Rat
io o
f SO
2 A
llow
ance
A
lloca
tions
to B
ase
Cas
e Em
issi
ons
in 2
015
EPA Title IV Method Pure Heat Input HI w/ Fuel Factors HI w/ FF & Coal Type
*Extreme values excluded.
13

12/2/2005
Figure 6. Source: EPA – see Appendix A, PQA Memo, for detailed description of data sources.
Ratio of SO2 Allowances to Base Case Emissions for 209 Owner/Operating Companies under CAIR Method and
Alternatives for 2015
0100200300400500600700800900
1000
1 21 41 61 81 101 121 141 161 181 201Cumulative Number of Owner/Operating Companies
Rat
io o
f SO
2 A
llow
ance
A
lloca
tions
to B
ase
Cas
e Em
issi
ons
in 2
015
EPA Title IV Method Pure Heat InputHI w/ Fuel Factors HI w/ FF & Coal Type
*Extreme values excluded Figure 7. Source: EPA – see Appendix A, PQA Memo, for detailed description of data sources.
Ratio of SO2 Allowances to CAIR Control Emissions for 204 Owner/Operating Companies under CAIR Method and Alternatives in 2015
0
1
2
3
4
1 21 41 61 81 101 121 141 161 181 201
Cumulative Number of Owner/Operating Companies
Rat
io o
f SO
2 A
llow
ance
Allo
catio
ns to
CA
IR
Con
trol E
mis
sion
s in
201
5
EPA Title IV Method Pure Heat Input HI w/ Fuel Factors HI w/ FF & Coal Type
*Extreme values excluded
14

12/2/2005
Figure 8. Source: EPA – see Appendix A, PQA Memo, for detailed description of data sources.
Ratio of SO2 Allowances to CAIR Control Emissions for 204 Owner/Operating Companies under CAIR Method and Alternatives
in 2015
0100200300400500600700800900
1000
1 21 41 61 81 101 121 141 161 181 201
Cumulative Number of Owner/Operating Companies
Rat
io o
f SO
2 A
llow
ance
A
lloca
tions
to C
AIR
Con
trol
Em
issi
ons
in 2
015
EPA Title IV Method Pure Heat Input HI w/ Fuel Factors HI w/ FF & Coal Type
*Extreme values excluded Once the pure heat input approach is removed from consideration among the SO2 allowance allocation alternatives for the reasons mentioned above, these owner/operating company analyses show results similar to the parent/holding company analyses described in sections 1 and 2. Among the three remaining methods that incorporate a fuel-adjustment factor, neither heat input methodology stands out as providing a more reasonable method of allocation across all companies when examining allowance needs under either the base case or CAIR control case. In addition, the CAIR method for allocating SO2 allowances is supported by EPA’s over-riding policy decision to preserve operation of the title IV SO2 cap and trade program as the CAIR method.
15

12/2/2005
Appendix A
16
Memorandum December 2, 2005 Page 1
PERRIN QUARLES ASSOCIATES, INC.
675 PETER JEFFERSON PARKWAY, SUITE 200 CHARLOTTESVILLE, VIRGINIA 22911
VOICE: (434) 979-3700 C FAX: (434) 296-2860 EMAIL: [email protected]
MEMORANDUM TO: Chitra Kumar FROM: David Sellers RE: CAIR SO2 Allocation Analysis Data DATE: December 2, 2005 I. Background This memorandum describes the data provided for a comparison of allocations and emissions for owners and parent companies under different SO2 allocation methods under the Clean Air Interstate Rule (CAIR). Each of the allocation options, which were provided by the Clean Air Markets Division (CAMD), are briefly described below and are followed by a discussion of the data sources and how the information was combined. The November 2, 2005, November 23, 2005, and November 30, 2005 data compilations have been provided separately by email. The owner and parent company information was compiled to respond to a data request with a short turn-around time. As a result, there were simplifying assumptions for plants with multiple owners and no in-depth checking for recent ownership changes. II. Allocation Options A. Analysis 1: Allocations under the Existing CAIR Rule

Memorandum December 2, 2005 Page 2
This data compilation has two parts and displays the impact of allocations distributed per the current rule, which relies on existing Acid Rain allocations. Analysis 1a looks at allocations and projected emissions for Acid Rain units only. Analysis 1b adds CAIR affected non-Acid Rain units that potentially may opt-in to the Acid Rain Program to receive SO2 allowances. B. Analysis 2: Extending CAIR SO2 Requirements on a Company Wide Basis This analysis is similar to Analysis 1, except that the affected units include all Acid Rain units in the CAIR SO2 states and any Acid Rain unit outside the CAIR SO2 region belonging to a CAIR unit owner. Analysis 2 looks at allocations and projected emissions for Acid Rain units only. Analysis 2b, which was later added, includes CAIR affected non-Acid Rain units that potentially may opt-in to the Acid Rain Program to receive SO2 allowances.
C. Analyses 3, 4, and 5: Allocate CAIR State SO2 Budgets to All Affected Units
Based on Baseline Heat Input These analyses evaluate allocation approaches that are similar to the methodology in the model trading rule for the CAIR NOx control program, which allocates a share of a state budget to a unit based on baseline heat input. All plants with a CAIR unit in the SO2 control region (Acid Rain and non-Acid Rain) are included in the allocations. Analysis 3 uses a fuel neutral heat input approach, while Analysis 4 adjusts the baseline heat input based on fuel type (coal, oil, gas), and Analysis 5 adds coal type to the fuel adjustment factors. III. Analysis Data Sources A. Units and Plants Analysis 1a includes all Acid Rain units in the CAIR SO2 Region with initial allocations, existing Acid Rain units with opt-in allocations, and Acid Rain coal units (coal identified as the primary fuel in the monitoring plan) with zero allocations. Additional Acid Rain gas and oil primary fuel units in the CAIR SO2 Region that did not receive initial allocations are also included. Analysis 1b adds non-Acid Rain coal fired units in the CAIR Region which may opt-in to the Acid Rain Program. Analysis 2 includes the Analysis 1a units outside the CAIR region which share common owners with Analysis 1a units. The additional Acid Rain units outside the CAIR region were identified from the draft NEEDS file based on the common owner in the Utilname field of the spreadsheet (Draft NEEDS3_0_9_21_05v3ToEPA.xls). There were initially 382 units outside the CAIR region that were identified which had a CAIR region owner. Of these, there were 240 with a unique CAMD database ID (Acid Rain or NOx Budget Program unit). The 240 units were matched with initial or opt-in allocations in the CAMD data which identified 102 units with Acid Rain Program allocations. The

Memorandum December 2, 2005 Page 3
102 units with allocations were then included in Analysis 2 with the Analysis 1a units. In addition, plants for which there were Acid Rain units without allocations were also added to the Analysis 2 plant level worksheet (11 plants with 22 units outside the CAIR region). Analysis 2b adds the non-Acid Rain coal fired units in the CAIR Region which may opt-in to the Acid Rain Program. Analyses 3, 4, and 5 include all Acid Rain units in the CAIR SO2 region, and non-Acid Rain plants which have a boiler or combustion turbine serving a generator with nameplate capacity greater than 25 MW. The Acid Rain units are from the Acid Rain worksheet in the finaltech9.xls spreadsheet in the final CAIR technical support information available on EPA's website. The Acid Rain units were originally identified by a February 2004 query of the CAMD database. Non-Acid Rain plants are from the Non-Acid Rain worksheet in finaltech9.xls, and include plants which had a CAIR affected unit as identified from Energy Information Administration (EIA) data. The non-Acid Rain plants were further screened based on ongoing CAIR inventory work. B. 2010 Acid Rain Allocations 2010 Acid Rain unit allocations were pulled from the CAMD database, and are shown in the Analyses 1a, 1b, and 2 spreadsheets. These are the allocations in Table A4 from the 1998 allowance reallocation. The Analyses 1a, 1b, and 2 spreadsheet files also include fields showing the allocations reduced by 50 percent and 65 percent. These fields reflect the CAIR allowance surrender requirements in 2010 and 2015. Applying the allowance surrender requirements in this manner to Acid Rain units outside the CAIR region in Analysis 2 will underestimate the allowances available for these units, as there is a 1 to 1 surrender requirement under the Acid Rain Program for emissions from these units in 2010 and 2015. C. Opt-In Allocations Acid Rain program opt-in allocations for existing opt-in units were obtained from CAMD in the file OPTIN04.xls. Opt-in allocations in the 2004 worksheet of that file were used for the Warrick and Alma opt-in units. Opt-in allocations were estimated for potential coal-fired non-Acid Rain opt-in units using the average annual heat input for the 2001 - 2003 period from EIA data and the plant 2000 SO2 rate from EPA's EGRID database. Estimates were calculated in this way because the annual heat input and SO2 emission data for the periods required for opt-in calculations under 40 CFR Part 74 were not available for this analysis. The allocations were calculated on a plant basis and divided evenly between the

Memorandum December 2, 2005 Page 4
units at multiple unit plants. Opt-in allocations were estimated for units at 31 plants. The opt-in allocations also were reduced by 50 percent and 65 percent to reflect CAIR allowance surrender requirements in 2010 and 2015. The opt-in units are listed in the opt-in worksheet in the Analysis 1b spreadsheet. D. Projected Emissions Projected 2010 and 2015 annual SO2 emissions from coal fired units under CAIR and the base case were taken from IPM model run files provided by CAMD: ● CAIR 2010 - EPA219b_CAIR_55_2010_Pechan ● CAIR 2015 - EPA219b_CAIR_55_2015_Pechan ● Base case 2010 - EPA219_BC_16b_2010_Pechan ● Base case 2015 - EPA219_BC_16b_2015_Pechan The run files provide projected emissions for the coal fired units in 1,000 tons of SO2. There are no projected emissions for gas and oil fired units in the IPM model run files. Projected emissions for gas fired units were calculated for this analysis based on the projected 2010 and 2015 annual heat input in the IPM model run files, and SO2 emission factors (lb/mmBtu). There are no 2010 and 2015 projected oil fired heat inputs in the IPM model runs, so no projected emissions were calculated for oil fired units. An SO2 emission factor of 0.0006 lb/mmBtu was used to calculate projected emissions for gas fired units, as suggested by CAMD. This is the default SO2 emission factor under Part 75 for units burning pipeline natural gas. Matching between files was done at the plant basis because of differences between unit IDs in the model run files and the Acid Rain and non-Acid Rain inventory files. Unit level matches which are presented in the unit level worksheets in the spreadsheets for 1a, 1b, 2, and 2b did not capture all of the projected emissions because of the inconsistency in some unit IDs. E. Owner and Parent Company Information The initial owner/operator and parent company information was obtained from matches with the Draft NEEDS3_0_9_21_05v3ToEPA.xls file that was provided by CAMD. Owners that were missing from the NEEDS file were filled in by querying CAMD's Data and Maps database. Internet searches were used to identify parent company relationships beyond those initially identified in the NEEDs file. The searches were limited to units with allocations or coal fired units with projected emissions. In Data and Maps, multiple owners are listed for several plants, but each has one

Memorandum December 2, 2005 Page 5
owner/operator. For these plants, the owner/operator was designated as the owner. For municipalities, co-ops, and other owners/operators that do not have parent companies, the parent company field was populated with the owner/operator name. Owners/operators and parent companies were not identified or matched for all of the plants in the different analyses. Table 1 shows the number of plants in each analysis dataset, the number of plants for which an owner or parent company was not identified, and the percent of 2010 allocations in each analysis associated with plants that did not have an owner or parent match. The table shows that the plants without owner or parent information accounted for a very small percentage of total allocations: under 1 percent to 4 percent. Also for Analysis 2, there may be an additional number of plants outside the CAIR region which should have been included in the analysis population but may not have been identified because a parent company match was not made.
Table 1 Plants without an Owner or Parent Match
Analysis Number of
Plants
Plants without
Owner Match
Plants without Owner Match as a Percent of Total 2010 Allocations
Plants without Parent Match
Plants without Parent Match as a Percent of Total 2010 Allocations
1a 796 18 0% 136 0%
1b 830 18 0% 136 0%
2 851 18 0% 136 0%
3 920 29 0.5% 182 4%
4 920 29 0.005% 182 0.05%
5 920 29 0.004% 182 0.04%
F. Plant Level Baseline Heat Input by Fuel - Analyses 3, 4 and 5 The 1999 through 2002 heat inputs (unit level for Acid Rain units and plant level for non-Acid Rain plants) were used for Analyses 3, 4, and 5, and were taken from the data used for the development of CAIR state NOx budgets. The Acid Rain heat input data were from the CAMD database, and the non-Acid Rain heat input data were calculated from EIA data (the EIA-860b, EIA-759, and EIA-767 databases). The Acid Rain unit data assigns all of the unit's annual heat input to the primary fuel reported in the unit's monitoring plan. For the non-Acid Rain data, these analyses use the sum of plant

Memorandum December 2, 2005 Page 6
level heat input by coal, gas, and oil. These totals were used to assign an annual CAIR fuel type for Analyses 4 and 5 based on the following criteria from the CAIR model trading rule:
● Coal: If there is any coal heat input for the year, the unit is a coal unit for that year.
● Oil: If the unit is not coal, and the oil heat input is > 15 percent of the total annual heat input, the unit is an oil unit for that year.
● Gas: If the unit is not coal or oil, the unit is a gas unit for that year.
G. Baseline Heat Input Fuel Adjustment Factors -Analyses 4 and 5 In Analyses 4 and 5, the heat input data used in Analysis 3 are adjusted by a fuel adjustment factor for the different fuels burned (coal, oil, or gas). The adjustment factors reflect the relative SO2 emission rates of each fuel type. For Acid Rain units, all of the unit's heat input was assigned to the primary fuel type reported in the unit's Part 75 monitoring plan. For non-Acid Rain units, the fuel type was based on the different fuels reported in the EIA databases and the CAIR rule definitions of coal, oil, and gas units. The fuel adjustment factors were calculated using 2002 Acid Rain Program emissions data. Average SO2 rates in lb/mmBtu were calculated for all coal, gas, and oil Acid Rain units based on the primary fuel type reported in a unit's monitoring plan. The adjustment factors were then calculated as the ratio of each primary fuel average SO2 rate to the coal average SO2 rate. The adjustment factors developed from the 2002 Acid Rain data are shown in Table 2.
Table 2 Fuel Type Heat Input Adjustment Factors
Fuel Type Number of Units
Average SO2 Rate* (lb/mmBtu)
Fuel Type Adjustment Factor
Coal 1,076 1.28 1.0
Oil 216 0.40 0.3
Gas 1,687 0.011 0.009
* Average SO2 Rate calculated as the unweighted average of each unit average. Analysis 5 uses the same adjustment factors for oil and gas, but adds additional coal type factors. Coal type information is not available in the CAMD data, so EIA 767 data from 2001 - 2003 were used to identify Acid Rain units which burn a single coal type (bituminous, subbituminous, or lignite). The 2002 Acid Rain emissions data were

Memorandum December 2, 2005 Page 7
used to calculate average SO2 rates by coal type for the single coal units. Coal type adjustment factors were calculated by determining the ratio of SO2 rates for each coal type to the lowest SO2 rate coal type using the 2002 data. The coal type adjustment factors developed in this manner are shown in Table 3.
Table 3 Coal Type Heat Input Adjustment Factors
Coal Type Number of Units*
Average SO2 Rate** (lb/mmBtu)
Coal Type Adjustment Factor
Bituminous 568 1.61 2.6
Subbituminous 8 0.61 1.0
Lignite 164 0.61 1.0 * Includes only units burning a single type of coal. ** Average SO2 Rate calculated as the unweighted average of each unit average. The annual heat inputs were adjusted for coal type by multiplying the heat input times the coal type adjustment factor and the fraction of coal heat input provided by each coal type in 1999 based on Hg ICR data for that year. These are the same data that were used for the Hg rule allocations. A factor of 1.0 was assigned to any coal fired unit which did not have Hg ICR coal data. The simplifying assumption of similar coal types burned throughout the 1999 - 2002 period based on the 1999 coal data from the Hg ICR will not reflect the actual coals burned during each year for units which burn multiple coals. An analysis for the Hg rule allocations found that about 17 percent of the units burned a different coal combination in 2002 compared to 1999 based on EIA heat input data. Also, all multiple coal units will have different coal type ratios in 2000 through 2002 than in 1999 (about 17 percent of CAIR region coal units). H. Baseline Heat Input Allocations - Analyses 3, 4, and 5 For Analyses 3 through 5, the highest three year average heat input during the period was calculated for each plant. Plants with less than four years data during the period used the average heat input of all available years. Also, only Acid Rain heat input years were used for plants which operated under the Acid Rain Program for only part of the baseline period. The plant level three year averages were summed for each state, and then each plant SO2 allocation was determined by the ratio of the plant's three year average to the

Memorandum December 2, 2005 Page 8
statewide three year average total heat input multiplied by the state CAIR SO2 budgets (2010 and 2015). The state SO2 budgets were taken from the final CAIR. DBS/eam