Predation, Mutualism, Commensalism, or Parasitism Predation, Mutualism, Commensalism, or Parasitism.
www.BioInteractive.org Published June 2015
Page 1 of 10
Educator Materials
Classroom Resource Selection by Predation
LOOK WHO’S COMING FOR DINNER: SELECTION BY PREDATION
OVERVIEW
This activity serves as a supplement to the film The Origin of Species: Lizards in an Evolutionary Tree. It is based on a year-long predation study of Anolis sagrei lizards conducted by Dr. Jonathan Losos and colleagues (Losos et al., 2006) described in an accompanying 3-minute video clip. The activity is written in a case-study format, in which students are asked to formulate a hypothesis and analyze a set of sample research data from actual field experiments designed to test this hypothesis. Students answer a series of quantitative and qualitative questions about the data. The quantitative analysis comprises calculating and interpreting descriptive statistics and plotting their results as line graphs.
The activity illustrates the role of predation as an agent of natural selection and emphasizes that strong selective pressures can change a population by favoring the survival of individuals with certain trait variations over others. It also shows that the direction of selective pressure can change rapidly depending on the environment.
For this activity, Losos provided survival and habitat use measurements recorded before and after the introduction of a predator. Original data sets were modified slightly for the purpose of this activity. All sample measurements came from A. sagrei populations living on the small Bahamian islands near Abaco.
The activity is structured in four parts (see also Figure 1 on page 3 of this document):
• PART I: Introduces the field study and asks students to formulate a hypothesis.
• PART II: States the hypothesis formulated by Losos and colleagues and how they tested it.
• PART III: Asks students to collect data, perform simple calculations, and answer questions.
• PART IV: Prompts students to watch a video on additional findings and provides discussion questions.
KEY CONCEPTS AND LEARNING OBJECTIVES
• Many traits vary among individuals in a population. Depending on environmental conditions, including the presence of predators, shelter availability, and competition for food, individuals with one form of a trait may have a survival advantage over individuals with other forms of the trait.
• Natural selection acts on variations in traits. It is a process by which some individuals are more likely to survive and/or reproduce than others.
• Predation can pose strong selective pressure on populations. Individuals with traits that enhance their ability to evade predators are more likely to survive and produce offspring than individuals without those traits.
• Evolution by natural selection occurs if, over generations, certain traits (and their associated alleles) become more common in the population while unfavorable traits become less common or disappear.
• Scientists can test evolutionary processes empirically by conducting experiments with currently living species.
• Graphing data allows us to more readily identify patterns and trends in data sets.
After completing this activity, students should be able to:
• Make predictions based on observations.
• Organize and analyze data by interpreting graphs and performing simple calculations.
• Draw conclusions about advantageous traits that are crucial to survival under certain selective pressures.
Ti0 www.BioInteractive.org Page 2 of 10
Educator Materials
Classroom Resource Selection by Predation
CURRICULUM AND TEXTBOOK CONNECTIONS
Curriculum Standards
NGSS (2014) HS-LS2-1, HS-LS2-2, HS-LS4-2, HS-LS4-3, HS-LS4-4, HS-LS4-5 HS-LS2.A, HS-LS2.C, HS-LS2.B, HS-LS2.C
Common Core
CCSS.ELA-LITERACY.RST.9-10.3, CCSS.ELA-LITERACY.RST.9-10.4, CCSS.ELA-LITERACY.RST.9-10.5, CCSS.ELA-LITERACY.RST.11-12.3, CCSS.ELA-LITERACY.RST.11-12.4, CCSS.MATH.CONTENT.HSN-Q.A.1, CCSS.MATH.CONTENT.HSS-ID.A.2, CCSS.MATH.CONTENT.HSS-IC.A.1, CCSS.MATH.CONTENT.HSS-IC.B.5
AP (2012-13) 1.A.1, 1.A.2, 1.A.4, 2.D.1, 2.E.3, 4.B.3
IB (2016) 5.1, 5.2, 10.3, C1
Textbook Chapter Sections
Miller and Levine (2010), Biology 3.1, 4.2, 5.2, 16.1, 16.3, 16.4, 29.1
Reece et al. (2011), Campbell Biology (9th ed.) 22.2, 22.3, 23.4, 51.1, 51.3, 53.1, 53.2, 53.3, 53.5, 54.1, 54.4
TIME REQUIREMENTS
This activity can be completed in one or two classroom periods (approx. 50-80 min.), depending on whether some parts are assigned as homework. Viewing the film The Origin of Species: Lizards in an Evolutionary Tree prior to the activity is highly recommended and will require an additional 17 minutes. See “Teaching Tips” for suggestions on implementing this activity and Figure 1 for an overview of the activity and its time requirements.
SUGGESTED AUDIENCE
This activity was designed for a high school biology and environmental science course but may also be appropriate for any preparatory college biology or undergraduate biology or ecology class.
PRIOR KNOWLEDGE
Students should have a general understanding of evolutionary theory, including concepts like adaptation, fitness, and natural selection. It would be helpful for students to have some prior practice both with constructing graphs as well as with organizing and analyzing data using simple descriptive statistics. They should be familiar with the concept of making and justifying claims using experimental evidence and scientific reasoning.

Ti0 www.BioInteractive.org Page 3 of 10
Educator Materials
Classroom Resource Selection by Predation
Figure 1. Activity overview and suggestions for organizing class time. Depending on the class, parts of the activity can be assigned as homework in advance, such as Part I in combination with the short film The Origin of Species: Lizards in an Evolutionary Tree. Parts II and III should be completed in class (yellow), whereas some or all of Part IV can be assigned as follow-up homework if class time is short. If students watch the predation video clip (Part IV) in class, they should complete question 11 before watching the video and questions 12-14 after watching the video. It’s recommended to include a brief class discussion of the answers to questions 2-10 (Part III, about 10 min.). If any of the questions in Part IV are assigned as homework, the answers can be discussed in the next class period.
Ti0 www.BioInteractive.org Page 4 of 10
Educator Materials
Classroom Resource Selection by Predation
MATERIALS
• Ruler for graphing. Colored pens or pencils are recommended for graphing but not required.
• At least one or two calculators with basic math functions per group.
TEACHING TIPS
• It’s important to emphasize to students that this activity does not show how speciation occurs. Speciation can be a difficult concept for students to fully comprehend, so it may be helpful to show a short (2 min.) animation that summarizes the basic principles of how new species arise (Anole Lizards: An Example of Speciation). This could be assigned as homework together with a short discussion on why the experiment in the activity only shows natural selection, not the evolution of new species.
• If students watch the film The Origin of Species: Lizards in an Evolutionary Tree before completing Part I of this activity, they may get confused about the differences in hind limb length discussed in the film compared to the changes in hind limb length discussed in this activity. In the film, changes in hind limb length are adaptations characteristic of different anole species. This activity examines the effect of natural selection on variations in hind limb length in a single population of anoles. The anole species in this activity is a trunk-ground anole adapted to living on the ground. Trunk-ground anoles have longer hind limbs compared to other anole species, but individuals’ hind limb lengths vary even within a species. Make sure that students understand this point.
• The beginning of Part II of this activity reveals the hypothesis students have to formulate in Part I. It may therefore be best if students get Part I first before receiving the rest of the document. Part I can be printed as one double-sided sheet of paper. To save class time, distribute Part I and assign it as homework the day before along with the short film The Origin of Species: Lizards in an Evolutionary Tree.
• Make one-sided printouts of the island “snapshot” cards that are downloadable as PDFs. The document has two island snapshots on each page that can be printed in either color or black-and-white. Cut the pages along the white lines to separate the snapshots. To be able to reuse snapshots, laminate them and use dry-erase pens, or have students record the data in their notebook or on the assignment cards included at the end of this document.
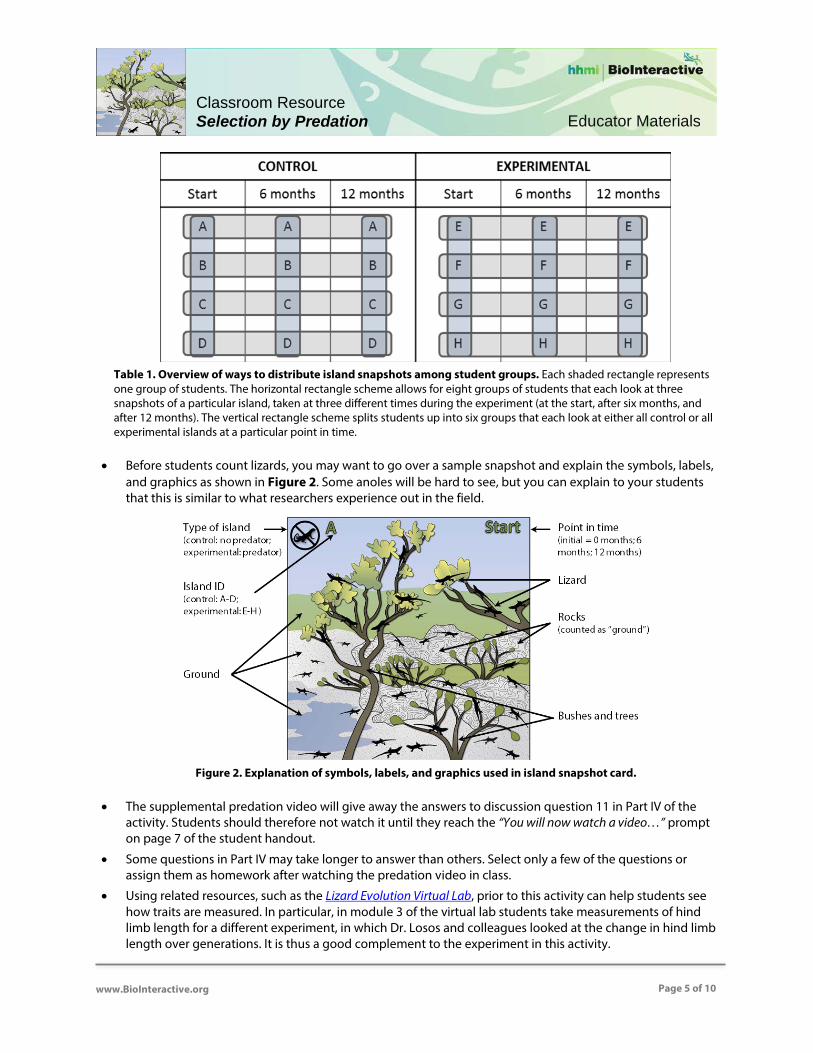
• You may wish to have students work in groups of two to four that each look at a subset of snapshots. Table 1 below illustrates two possible ways snapshots can be split up among student groups. There are a total of 24 snapshots (8 islands x 3 time points per island) that show how many lizards are living on each island and where:
- Four experimental and four control islands that are marked with letters A through H. Experimental and control islands can be identified both by their letters (A-D: control; E-H: experimental) and by the curly-tailed lizard in the circle at the top left corner:
- Each of these eight islands is shown at three different points in time (initial population, after six months, and after 12 months), resulting in a total of 12 experimental and 12 control “snapshots.”
A group could get all the snapshots for a particular island (i.e., all the A snapshots) or all the same time points for different islands (i.e., all the six-month snapshots). Alternatively, use the assignment cards at the end of this document to assign snapshots to groups. Each group of students then shares their data with the class and adds the missing entries into their data tables. For this purpose, project Tables 1 and 2 of the student handout on the screen or draw the tables on the board.
Ti0 www.BioInteractive.org Page 5 of 10
Educator Materials
Classroom Resource Selection by Predation
Table 1. Overview of ways to distribute island snapshots among student groups. Each shaded rectangle represents one group of students. The horizontal rectangle scheme allows for eight groups of students that each look at three snapshots of a particular island, taken at three different times during the experiment (at the start, after six months, and after 12 months). The vertical rectangle scheme splits students up into six groups that each look at either all control or all experimental islands at a particular point in time.
• Before students count lizards, you may want to go over a sample snapshot and explain the symbols, labels, and graphics as shown in Figure 2. Some anoles will be hard to see, but you can explain to your students that this is similar to what researchers experience out in the field.
Figure 2. Explanation of symbols, labels, and graphics used in island snapshot card.
• The supplemental predation video will give away the answers to discussion question 11 in Part IV of the activity. Students should therefore not watch it until they reach the “You will now watch a video…” prompt on page 7 of the student handout.
• Some questions in Part IV may take longer to answer than others. Select only a few of the questions or assign them as homework after watching the predation video in class.
• Using related resources, such as the Lizard Evolution Virtual Lab, prior to this activity can help students see how traits are measured. In particular, in module 3 of the virtual lab students take measurements of hind limb length for a different experiment, in which Dr. Losos and colleagues looked at the change in hind limb length over generations. It is thus a good complement to the experiment in this activity.
Ti0 www.BioInteractive.org Page 6 of 10
Educator Materials
Classroom Resource Selection by Predation
• Assign the paper by Losos et al. (2006) as additional reading for AP or undergraduate students.
• An additional example of the effect of natural selection on a trait is described in the short film The Origin of Species: The Beak of the Finch. It features biologists Peter and Rosemary Grant, who documented the evolution of the famous Galápagos finches by tracking changes in body traits directly tied to survival, such as beak length before and after two major droughts. They observed similar consequences in a very short time: populations decreased in size and the average beak size of survivors was different than the average beak size in the initial population. In contrast to Losos and his colleagues, however, the Grants were also able to look at future generations and observe evolution.
ANSWER KEY PART I: INTRODUCTION
1. Based on these initial observations by Dr. Losos and colleagues, formulate a hypothesis regarding how L. carinatus affects where A. sagrei lives. Explain your reasoning.
Presence of the curly-tailed lizard L. carinatus drives A. sagrei to live higher off the ground, spending most of its time up in the bushes.
PART II: HYPOTHESIS AND EXPERIMENT
Students are provided with the background needed to understand the data they will collect and analyze in Part III. It states the hypothesis formulated by Dr. Losos and colleagues and describes the experiment they designed to test their hypothesis.
PART III: DATA COLLECTION AND ANALYSIS
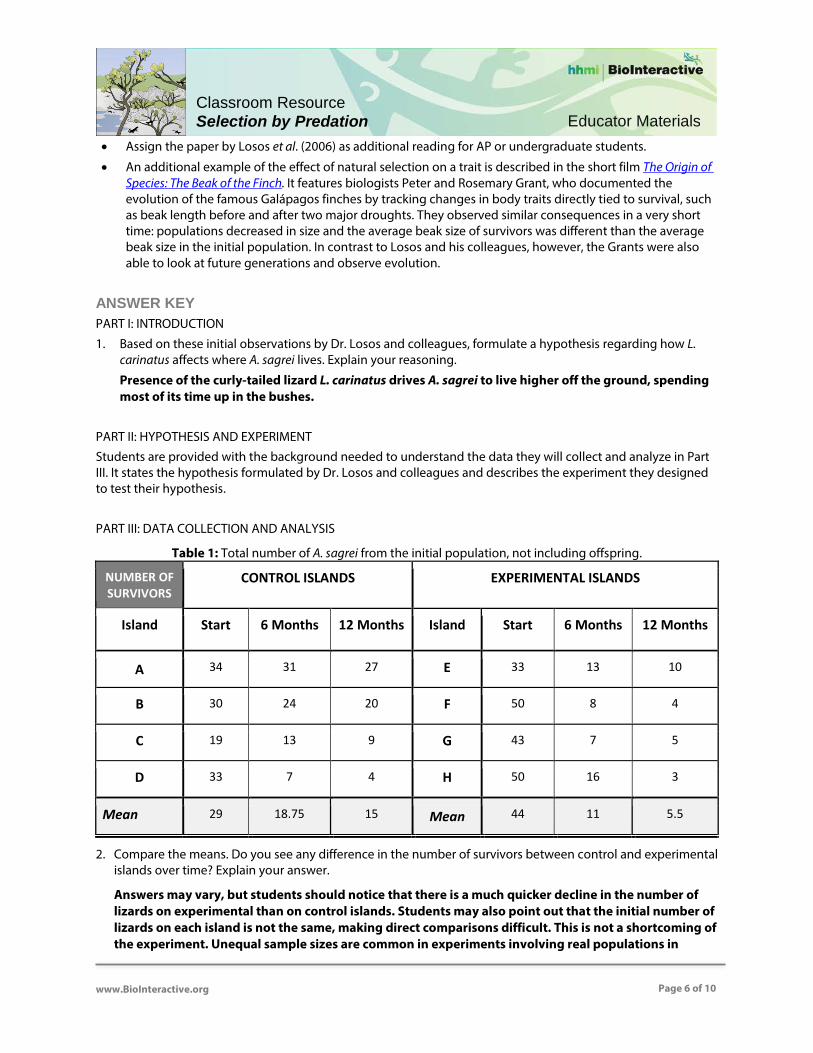
Table 1: Total number of A. sagrei from the initial population, not including offspring.
NUMBER OF SURVIVORS
CONTROL ISLANDS EXPERIMENTAL ISLANDS
Island Start 6 Months 12 Months Island Start 6 Months 12 Months
A 34 31 27 E 33 13 10
B 30 24 20 F 50 8 4
C 19 13 9 G 43 7 5
D 33 7 4 H 50 16 3
Mean 29 18.75 15 Mean 44 11 5.5
2. Compare the means. Do you see any difference in the number of survivors between control and experimental islands over time? Explain your answer.
Answers may vary, but students should notice that there is a much quicker decline in the number of lizards on experimental than on control islands. Students may also point out that the initial number of lizards on each island is not the same, making direct comparisons difficult. This is not a shortcoming of the experiment. Unequal sample sizes are common in experiments involving real populations in
Ti0 www.BioInteractive.org Page 7 of 10
Educator Materials
Classroom Resource Selection by Predation
nature. One way to make comparisons easier is to calculate ratios or relative values. Below, students are asked to calculate the proportion of anoles that survived (survival rate), which are ratios that control for the initial, unequal sample size by dividing the numbers by the mean number of lizards present at the start of the experiment. Some students may notice that there is a sharp decline in anole numbers on island D, which is a control island. Use this as an opportunity to discuss the importance of repeating an experiment. What would have happened if Dr. Losos and colleagues had only used one experimental island and one control island? What if the experimental island had been island D? Note also that the data pertain only to anoles present at the beginning of the experiment and do not include offspring that are born into the population. So even though the numbers are decreasing on all islands (including control islands), this does not mean that the populations will eventually go extinct.
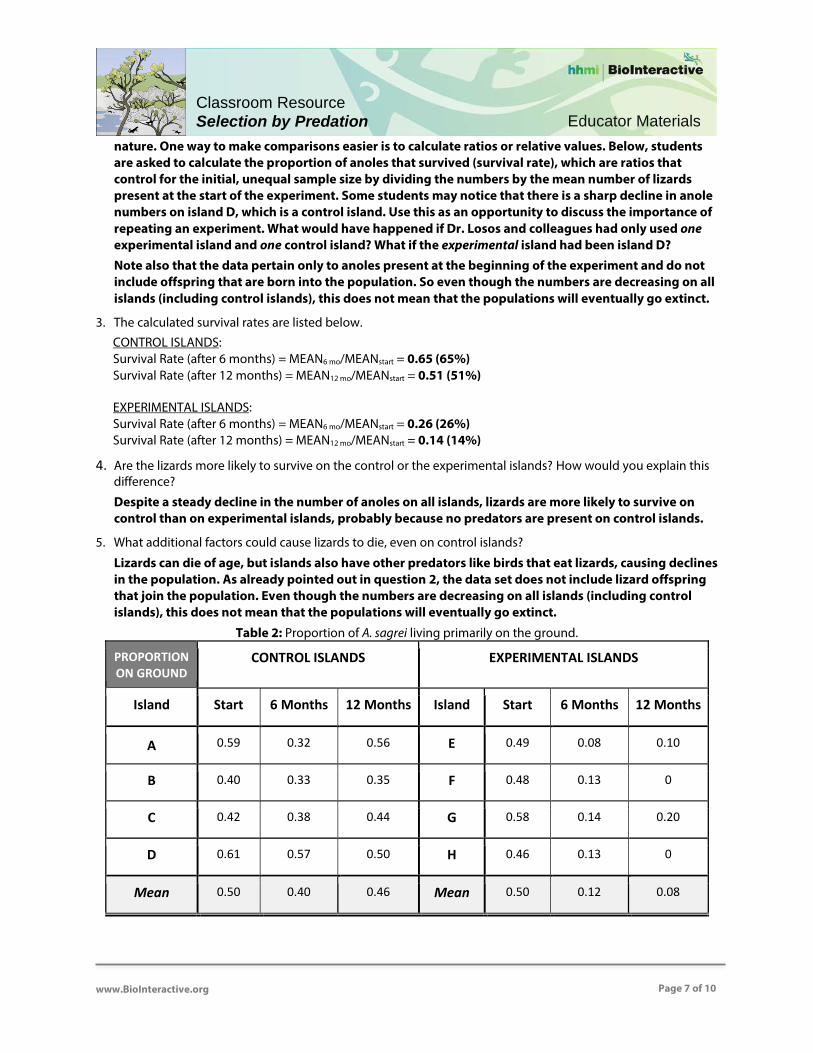
3. The calculated survival rates are listed below.
CONTROL ISLANDS: Survival Rate (after 6 months) = MEAN6 mo/MEANstart = 0.65 (65%) Survival Rate (after 12 months) = MEAN12 mo/MEANstart = 0.51 (51%) EXPERIMENTAL ISLANDS: Survival Rate (after 6 months) = MEAN6 mo/MEANstart = 0.26 (26%) Survival Rate (after 12 months) = MEAN12 mo/MEANstart = 0.14 (14%)
4. Are the lizards more likely to survive on the control or the experimental islands? How would you explain this difference? Despite a steady decline in the number of anoles on all islands, lizards are more likely to survive on control than on experimental islands, probably because no predators are present on control islands.
5. What additional factors could cause lizards to die, even on control islands?
Lizards can die of age, but islands also have other predators like birds that eat lizards, causing declines in the population. As already pointed out in question 2, the data set does not include lizard offspring that join the population. Even though the numbers are decreasing on all islands (including control islands), this does not mean that the populations will eventually go extinct.
Table 2: Proportion of A. sagrei living primarily on the ground.
PROPORTION ON GROUND
CONTROL ISLANDS EXPERIMENTAL ISLANDS
Island Start 6 Months 12 Months Island Start 6 Months 12 Months
A 0.59 0.32 0.56 E 0.49 0.08 0.10
B 0.40 0.33 0.35 F 0.48 0.13 0
C 0.42 0.38 0.44 G 0.58 0.14 0.20
D 0.61 0.57 0.50 H 0.46 0.13 0
Mean 0.50 0.40 0.46 Mean 0.50 0.12 0.08
Ti0 www.BioInteractive.org Page 8 of 10
Educator Materials
Classroom Resource Selection by Predation
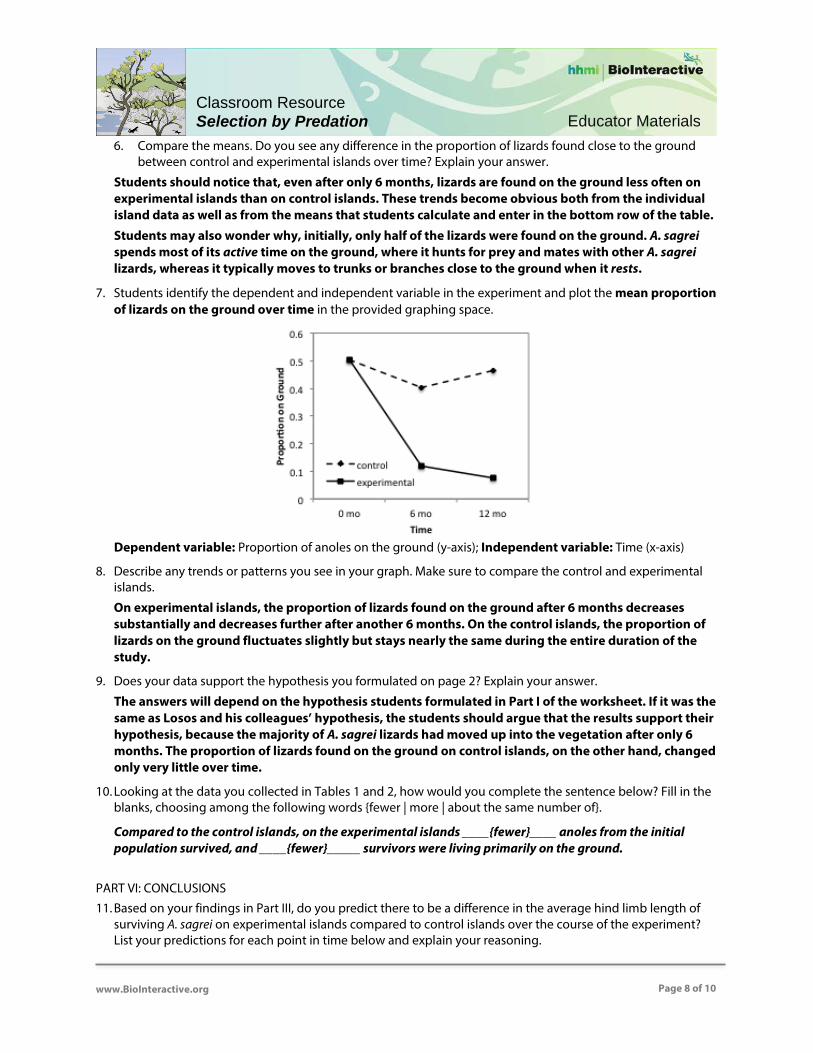
6. Compare the means. Do you see any difference in the proportion of lizards found close to the ground between control and experimental islands over time? Explain your answer.
Students should notice that, even after only 6 months, lizards are found on the ground less often on experimental islands than on control islands. These trends become obvious both from the individual island data as well as from the means that students calculate and enter in the bottom row of the table.
Students may also wonder why, initially, only half of the lizards were found on the ground. A. sagrei spends most of its active time on the ground, where it hunts for prey and mates with other A. sagrei lizards, whereas it typically moves to trunks or branches close to the ground when it rests.
7. Students identify the dependent and independent variable in the experiment and plot the mean proportion of lizards on the ground over time in the provided graphing space.
Dependent variable: Proportion of anoles on the ground (y-axis); Independent variable: Time (x-axis)
8. Describe any trends or patterns you see in your graph. Make sure to compare the control and experimental islands.
On experimental islands, the proportion of lizards found on the ground after 6 months decreases substantially and decreases further after another 6 months. On the control islands, the proportion of lizards on the ground fluctuates slightly but stays nearly the same during the entire duration of the study.
9. Does your data support the hypothesis you formulated on page 2? Explain your answer.
The answers will depend on the hypothesis students formulated in Part I of the worksheet. If it was the same as Losos and his colleagues’ hypothesis, the students should argue that the results support their hypothesis, because the majority of A. sagrei lizards had moved up into the vegetation after only 6 months. The proportion of lizards found on the ground on control islands, on the other hand, changed only very little over time.
10. Looking at the data you collected in Tables 1 and 2, how would you complete the sentence below? Fill in the blanks, choosing among the following words {fewer | more | about the same number of}.
Compared to the control islands, on the experimental islands ____{fewer}____ anoles from the initial population survived, and ____{fewer}_____ survivors were living primarily on the ground.
PART VI: CONCLUSIONS
11. Based on your findings in Part III, do you predict there to be a difference in the average hind limb length of surviving A. sagrei on experimental islands compared to control islands over the course of the experiment? List your predictions for each point in time below and explain your reasoning.
Ti0 www.BioInteractive.org Page 9 of 10
Educator Materials
Classroom Resource Selection by Predation
If students watched the short film The Origin of Species: Lizards in an Evolutionary Tree, they should know that long legs are advantageous when living on the ground, while short legs are better suited for climbing twigs in small trees and bushes. A. sagrei are long-legged lizards, but there is slight variation in leg length that natural selection can act on. Beginning of experiment: The average hind limb length should be about equal on both control and experimental islands. After 6 and 12 months: Students may predict that the average hind limb length of survivors decreased over time as more anoles started living on twigs and bushes, selecting for those with slightly shorter legs. Other students may predict that both short and long legs were advantageous throughout the course of the experiment and that average hind limb length didn’t change. None of these answers is incorrect. In fact, Dr. Losos and colleagues also did not predict precisely what the study showed. As shown in the video, when the ground-dwelling predator lizard was first introduced to the experimental islands, anoles ran away to escape the predator. Initially, natural selection therefore favored longer-legged lizards that were able to run more quickly. So after six months, the average hind limb length of survivors was greater than that of the population at the start, because lizards with shorter legs were killed in greater numbers than those with longer legs. Over time these survivors started spending more time in bushes higher off the ground to escape the predator. In this environment, slightly shorter legs were favored and anoles with slightly longer legs compared to the other survivors were killed. So after 12 months, the average hind limb length of the few remaining survivors was again shorter and more similar to the average hind limb length of the population at the start of the experiment. The study thus showed a reversal in the direction of natural selection.
Students may ask why anoles didn’t stay on the ground if they had been fast enough to escape the predator during the first six months. Why did they start climbing bushes and small trees? Explain to your students that living on the ground was dangerous, even for fast lizards, so it became advantageous to find other ways to escape, like climbing bushes and small trees.
(Students watch the predation video clip)
12. What did Dr. Losos and colleagues discover about the average hind limb length of survivors after six months and after 12 months? Remember that they looked at the survivors of only one generation of lizards.
See answer to question 11 above. a. Were these findings different from what you expected? Explain your answer.
Answers may vary. Refer to question 11 above for possible points of confusion. b. How did Dr. Losos and colleagues explain their findings?
See answer to question 11 above.
13. Dr. Losos and colleagues had set out to study the effect of predation on evolution, but they were only able to take measurements for a year and in only one generation of anoles. For evolution by natural selection to occur in a particular population, there has to be variation in a trait in that population, the variation must be heritable, and individuals who possess a particular version of the trait have to have a fitness advantage (i.e., be more likely to survive and produce more offspring) over other individuals.
Consider the trait hind limb length and explain whether Dr. Losos and his colleagues were able to demonstrate each of the following claims with their predation experiment. For each claim list the evidence that supports it. If a claim is not supported by evidence, explain why not and what additional observation would be needed to support the claim.
a. There was variation in the trait among individual anoles in the population.
Yes, although A. sagrei is a species of long-legged anoles, hind limb length varied among individuals.
Ti0 www.BioInteractive.org Page 10 of 10
Educator Materials
Classroom Resource Selection by Predation
b. Variation in the trait was heritable.
No. Dr. Losos and colleagues did not measure hind limb length in the offspring of survivors to determine whether the trait was heritable. So the experiment itself did not demonstrate that the variation is heritable. However, we know from other studies that hind limb length is determined by genes and is thus a heritable trait.
c. Some anoles had a fitness advantage over other anoles.
No. We don’t know anything about the reproductive success of the surviving anoles. We can assume that the survivors ultimately contributed more to the gene pool by producing more offspring than anoles that didn’t survive, but the experiment didn’t measure this. The experiment only showed differential survival.
To measure fitness, Losos and colleagues would have had to count the number of offspring each lizard produced as a result of its survival.
d. Natural selection favored certain trait variations.
Yes. At first, the predator was the selective force, and lizards with longer legs were more likely to survive than those with shorter legs, because they could run faster. When the lizards started climbing trees and bushes, the new habitat became the selective force, and lizards with shorter legs were favored because they were able to hold on to small twigs and branches.
e. Beneficial trait variations were passed on to future generations, and the population changed as lizards with features better adapted to living on trees evolved.
No. A hurricane terminated the study before Dr. Losos and colleagues could look at hind limb length in future generations and determine whether evolution had occurred.
14. If Dr. Losos and his colleagues had been able to continue their experiment and measure the anoles on these islands for many years, including offspring generations, what do you predict they would have found? How would the population have changed?
Students may predict that the average hind limb length would have become shorter and shorter with each generation. This is a reasonable prediction and consistent with what Dr. Losos and colleagues have found in other experiments, such as the one shown in the film The Origin of Species: Lizards in an Evolutionary Tree. Some students may also point out that if the favored trait (shorter legs) was heritable, it would have been passed on to future generations. As a result, the population would have changed, leading to evolution.
REFERENCE Losos, J.B., Schoener, T.W., Langerhans, R.B., Spiller, D.A. (2006). Rapid temporal reversal in predator-driven natural selection. Science, 314, 1111. DOI: 10.1126/science.113358
AUTHOR Written by Sandra Blumenrath, PhD, HHMI, and Keri Shingleton, PhD, Holland Hall, Oklahoma
Reviewed and edited by Laura Bonetta, PhD, HHMI, and Ann Brokaw, Rocky River High School, Ohio; copyedited by Linda Felaco
Scientific review by Jonathan Losos, PhD, Harvard University
Graphics by Heather McDonald, PhD, and Sandra Blumenrath, PhD, HHMI FIELD TESTERS Marty Buehler, Hastings High School, Michigan; Melissa Csikari, Colonial Forge High School, Virginia; Karen Davis, Canyon High School, Texas; Robin Cochran Dirksen, Lead-Deadwood High School, South Dakota; David Knuffke, Deer Park High School, New York; Valerie May, Woodstock Academy, Connecticut; Jesusa Merioles and Ioana Paunescu, International Community High School, New York; Jenny Sarna, Chicago Public Schools, Illinois

Total # of surviving anoles on the island: ______ Proportion of surviving anoles found on the ground: ______
Total # of surviving anoles on the island: ______ Proportion of surviving anoles found on the ground: ______
Total # of surviving anoles on the island: ______ Proportion of surviving anoles found on the ground: ______
Total # of surviving anoles on the island: ______ Proportion of surviving anoles found on the ground: ______
Total # of surviving anoles on the island: ______ Proportion of surviving anoles found on the ground: ______
Total # of surviving anoles on the island: ______ Proportion of surviving anoles found on the ground: ______
Total # of surviving anoles on the island: ______ Proportion of surviving anoles found on the ground: ______
Total # of surviving anoles on the island: ______ Proportion of surviving anoles found on the ground: ______
Total # of surviving anoles on the island: ______ Proportion of surviving anoles found on the ground: ______
Total # of surviving anoles on the island: ______ Proportion of surviving anoles found on the ground: ______
Total # of surviving anoles on the island: ______ Proportion of surviving anoles found on the ground: ______
Total # of surviving anoles on the island: ______ Proportion of surviving anoles found on the ground: ______

Total # of surviving anoles on the island: ______ Proportion of surviving anoles found on the ground: ______
Total # of surviving anoles on the island: ______ Proportion of surviving anoles found on the ground: ______
Total # of surviving anoles on the island: ______ Proportion of surviving anoles found on the ground: ______
Total # of surviving anoles on the island: ______ Proportion of surviving anoles found on the ground: ______
Total # of surviving anoles on the island: ______ Proportion of surviving anoles found on the ground: ______
Total # of surviving anoles on the island: ______ Proportion of surviving anoles found on the ground: ______
Total # of surviving anoles on the island: ______ Proportion of surviving anoles found on the ground: ______
Total # of surviving anoles on the island: ______ Proportion of surviving anoles found on the ground: ______
Total # of surviving anoles on the island: ______ Proportion of surviving anoles found on the ground: ______
Total # of surviving anoles on the island: ______ Proportion of surviving anoles found on the ground: ______
Total # of surviving anoles on the island: ______ Proportion of surviving anoles found on the ground: ______
Total # of surviving anoles on the island: ______ Proportion of surviving anoles found on the ground: ______