Classification of Some Wild Yam Species Tubers of Ivory ... · The Table allowed the Luff Schoorl,...
15
____________________________________________________________________________________________ *Corresponding author: Email: [email protected]; International Journal of Biochemistry Research & Review 2(4): 137-151, 2012 SCIENCEDOMAIN international www.sciencedomain.org Classification of Some Wild Yam Species Tubers of Ivory Coast Forest Zone Sahoré Drogba Alexis 1* and Amani N’guessan Georges 1 ¹Food Sciences and Technology Department, University Nangui Abrogoua 02 BP 801 Abidjan 02, Côte d’Ivoire. Authors’ contributions This work was carried out in collaboration between both authors. Author SDA designed the study, wrote the protocol, the first draft of the manuscript and managed the analyses of the study. Author ANG read and corrected the first draft of the manuscript. Both authors read and approved the final manuscript. Received 10 th August 2012 Accepted 9 th November 2012 Published 18 th December 2012 ABSTRACT The tubers of some wild yam species (eight) found in the Ivory Coast forest were collected and their classification according to their nutrients and antinutritional factors was made by principal component analysis (PCA). The principal component analysis (PCA) of individuals, constituted by the yam species, according to nutrients considered as the variables, showed two principal axes of correlation F1 and F2. The percentages of variables dispersion around the principal axes F1 and F2 were equal to 72.86% and 20.24% respectively. The individuals projected on the principal axes F1 and F2 grouped into four classes around the axes. Around the axis F1 (72.26%): The class gathering the tubers of wild yam species D. minutiflora; D. will hirtiflora and D. bulbifera bulbil which contained more Moisture and the class gathering the tubers of wild yam species D. burkilliana; D. bulbifera tuber; D. dumetorum; D. praehensilis and D. mangenotiana which had the highest Energy Value. Around the axis F2 (20.24%): The class gathering the tubers of wild yam species D. burkilliana; D. bulbifera tuber; D. dumetorum and D. praehensilis which contained more Soluble carbohydrates and the class gathering the tubers of wild yam species D. minutiflora; D. hirtiflora; D. bulbifera bulbil and D. mangenotiana which contained more ash. The principal component analysis (PCA) of individuals, constituted by wild yam species, according to their Antinutritional factors Research Article
Transcript of Classification of Some Wild Yam Species Tubers of Ivory ... · The Table allowed the Luff Schoorl,...

____________________________________________________________________________________________
*Corresponding author: Email: [email protected];
International Journal of Biochemistry Research& Review
2(4): 137-151, 2012
SCIENCEDOMAIN internationalwww.sciencedomain.org
Classification of Some Wild Yam SpeciesTubers of Ivory Coast Forest Zone
Sahoré Drogba Alexis1* and Amani N’guessan Georges1
¹Food Sciences and Technology Department, University Nangui Abrogoua02 BP 801 Abidjan 02, Côte d’Ivoire.
Authors’ contributions
This work was carried out in collaboration between both authors. Author SDA designed thestudy, wrote the protocol, the first draft of the manuscript and managed the analyses of the
study. Author ANG read and corrected the first draft of the manuscript. Both authors readand approved the final manuscript.
Received 10th August 2012Accepted 9th November 2012
Published 18th December 2012
ABSTRACT
The tubers of some wild yam species (eight) found in the Ivory Coast forest were collectedand their classification according to their nutrients and antinutritional factors was made byprincipal component analysis (PCA). The principal component analysis (PCA) ofindividuals, constituted by the yam species, according to nutrients considered as thevariables, showed two principal axes of correlation F1 and F2. The percentages ofvariables dispersion around the principal axes F1 and F2 were equal to 72.86% and20.24% respectively. The individuals projected on the principal axes F1 and F2 groupedinto four classes around the axes. Around the axis F1 (72.26%): The class gathering thetubers of wild yam species D. minutiflora; D. will hirtiflora and D. bulbifera bulbil whichcontained more Moisture and the class gathering the tubers of wild yam species D.burkilliana; D. bulbifera tuber; D. dumetorum; D. praehensilis and D. mangenotiana whichhad the highest Energy Value. Around the axis F2 (20.24%): The class gathering thetubers of wild yam species D. burkilliana; D. bulbifera tuber; D. dumetorum and D.praehensilis which contained more Soluble carbohydrates and the class gathering thetubers of wild yam species D. minutiflora; D. hirtiflora; D. bulbifera bulbil and D.mangenotiana which contained more ash. The principal component analysis (PCA) ofindividuals, constituted by wild yam species, according to their Antinutritional factors
Research Article

International Journal of Biochemistry Research & Review, 2(4): 137-151, 2012
138
considered as the variables, showed two principal axes of correlation F1 and F2. Thepercentages of variables dispersion around the principal axes F1 and F2 were equal to35.88% and 31.99%) respectively. The individuals projected on the principal axes F1 andF2 grouped into 3 classes around axes: Around the axis F1 (35.88%): The class gatheringthe tubers of wild yam species D. mangenotiana; D. dumetorum; D. burkilliana; D.bulbifera bulbil; D. togoensis; D. bulbifera tuber and D. praehensilis which contained more,Tannins, Alkaloids and Hydrocyanic acid. Around the F2 axis (31.99%): The classgathering the tubers of wild yam species D. togoensis; D. dumetorum; D. minutiflora; D.mangenotiana; D. praehensilis and D. bulbifera bulbil which contained more Oxalic Acidand the class gathering the tubers of wild yam species D. togoensis; D. hirtiflora; D.minutiflora and D. dumetorum and which contained more Sapogenins.
Keywords: Tuber; wild yam species; antinutritional factors; nutrients, individuals; variables;principal component analysis; distribution; classes.
1. INTRODUCTION
The word yam indicated a set of plants of several species of the kind Dioscorea restarted onall the continents [17,22,24,25]. Next to cultivated yam [17] and sometimes even celebratedthrough holidays by some peoples [26, 28] there were also the species of yam which grew inthe wild state and which were still the object of picking [22]. In Ivory Coast for example, theywere the inhabitants of regions (south; west) where the culture of the yam remainedmarginal which consumed especially some species of these wild yams [23]. But yamsgenerally and wild yam species in particular contained variable quantities of chemicalsubstances: alkaloids, tannins, sapogénines, phenols, phytates, oxalates, etc. [27,29]. Ifsome of these substances gave only a bitter taste to tubers after cooking, the others asalkaloids were toxic [13]. This toxic matter, when they are ingested would provoke grave,even mortal symptoms [15,21,31]. Before thus to consume them, these tubers of wild yamshould be treated to reduce or destroy their toxic matter [18]. The populations, whichconsumed such tubers, constituting nevertheless useful reserves for the periods of famine orfood shortage, were conscious of its potential risks [17]. That was why they used traditionalbut often inappropriate processing, to eliminate these substances toxic of tubers [18]. Aclassification of these tubers based on their chemical composition would allow knowingpossibly which of these tubers of wild yam would be the least toxic thus more capable of theconsumption. Yams are used as well in the other purposes as the food, particularly, the wildyams which are used for their therapeutic properties and also for their toxic properties [22]. Itwas the case in West Africa where the toxic properties of various species of wild yam wereof all time exploited by hunters, fishermen and farmers [26]. So, poisons having convulsiveand paralysing effects or hemolytic are extracted from the species of wild yam D. dumetorumand D. bulbifera [26].
These extracts would be alkaloids such as the dihydrodioscorin, the diosbulbin andsapogenins derived of saponins [12,26]. The objective of our study was to make aclassification of the tubers of the wild yam species collected in the Ivory Coast forest zone byusing the method of the principal components analysis (PCA). This statistical method ofanalysis could allow us to discriminate these species of wild yam according to their nutrientsand their antinutritional factors. Such study would find an eventual interest in a perspectiveof domestication of these yams with medicinal and nutritional uses, to introduce intocropping systems more efficient species carefully selected.
International Journal of Biochemistry Research & Review, 2(4): 137-151, 2012
139
2. MATERIALS AND METHODS
2.1 Vegetable Material
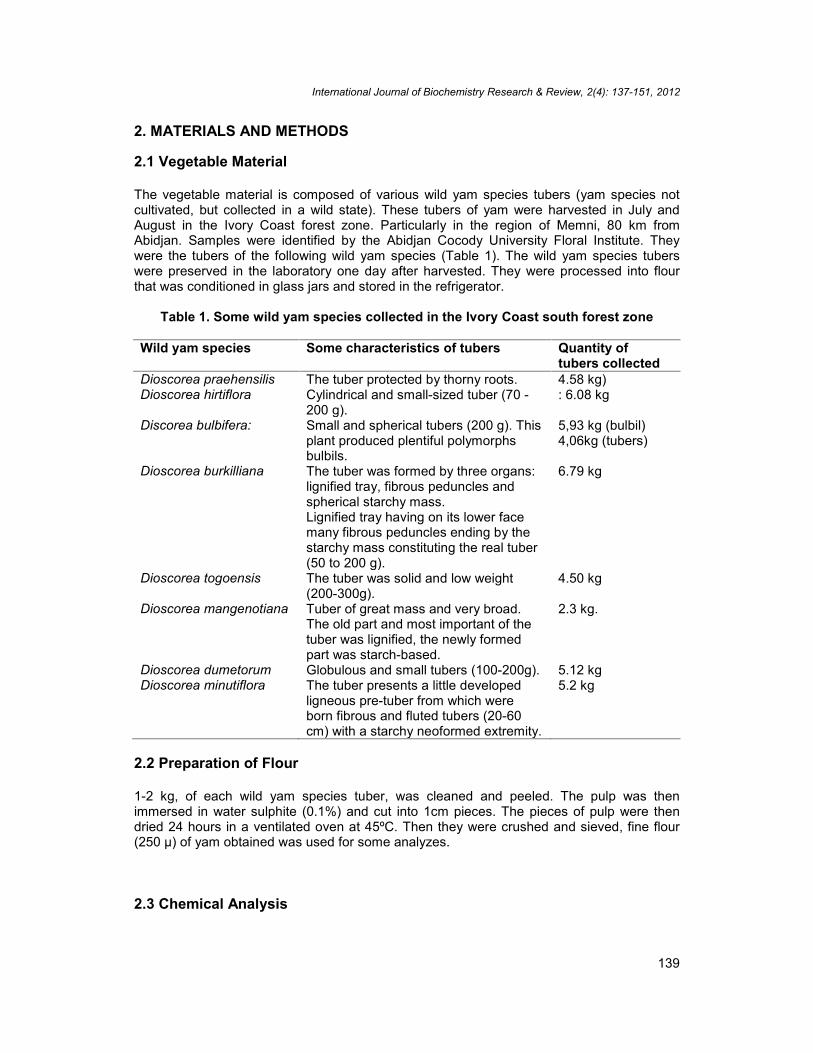
The vegetable material is composed of various wild yam species tubers (yam species notcultivated, but collected in a wild state). These tubers of yam were harvested in July andAugust in the Ivory Coast forest zone. Particularly in the region of Memni, 80 km fromAbidjan. Samples were identified by the Abidjan Cocody University Floral Institute. Theywere the tubers of the following wild yam species (Table 1). The wild yam species tuberswere preserved in the laboratory one day after harvested. They were processed into flourthat was conditioned in glass jars and stored in the refrigerator.
Table 1. Some wild yam species collected in the Ivory Coast south forest zone
Wild yam species Some characteristics of tubers Quantity oftubers collected
Dioscorea praehensilis The tuber protected by thorny roots. 4.58 kg)Dioscorea hirtiflora Cylindrical and small-sized tuber (70 -
200 g).: 6.08 kg
Discorea bulbifera: Small and spherical tubers (200 g). Thisplant produced plentiful polymorphsbulbils.
5,93 kg (bulbil)4,06kg (tubers)
Dioscorea burkilliana The tuber was formed by three organs:lignified tray, fibrous peduncles andspherical starchy mass.Lignified tray having on its lower facemany fibrous peduncles ending by thestarchy mass constituting the real tuber(50 to 200 g).
6.79 kg
Dioscorea togoensis The tuber was solid and low weight(200-300g).
4.50 kg
Dioscorea mangenotiana Tuber of great mass and very broad.The old part and most important of thetuber was lignified, the newly formedpart was starch-based.
2.3 kg.
Dioscorea dumetorum Globulous and small tubers (100-200g). 5.12 kgDioscorea minutiflora The tuber presents a little developed
ligneous pre-tuber from which wereborn fibrous and fluted tubers (20-60cm) with a starchy neoformed extremity.
5.2 kg
2.2 Preparation of Flour
1-2 kg, of each wild yam species tuber, was cleaned and peeled. The pulp was thenimmersed in water sulphite (0.1%) and cut into 1cm pieces. The pieces of pulp were thendried 24 hours in a ventilated oven at 45ºC. Then they were crushed and sieved, fine flour(250 μ) of yam obtained was used for some analyzes.
2.3 Chemical Analysis

International Journal of Biochemistry Research & Review, 2(4): 137-151, 2012
140
2.3.1 Moisture content
5 g of the fresh yam pulp were placed in an oven at 105ºC during 24 hours until constantweight and the amount of water evaporated is determined after weighing [5].
2.3.2 Ash content
After determining moisture content, dry sample obtained was incinerated at 550ºC in amuffle furnace. This temperature was maintained until obtaining ashes without organicparticles. After cooling ashes in desiccators, they are weighed immediately [5].
2.3.3 Proteins content
Crude protein content was determined from dosage of total nitrogen by Kjeldahl method [10].One gram of sample (yam flour) was mineralized at 400ºC for 2 hours in concentratedsulfuric acid (20 ml) in the presence of a catalyst (1g Selenite of sodium + 1g copper sulfate+ 20 G of potassium sulphate). Ten milliliters of mineral solution added to 10 ml sodiumhydroxide solution (40%) were distilled and the distillate collected in 20 ml of boric acid wastitrated with sulfuric acid (0.1 N) in the presence of a colored indicator mixed (methyl red andbromocresol green). With this method, all nitrogen compounds were assayed. Theconversion of nitrogen to proteins was carried out by a conversion factor of total nitrogen inproteins which was 100/16 = 6.25.
2.3.4 Lipid content
Lipid content was determined using the apparatus Soxhtec System HT 1043. The extractionsolvent was diethyl ether [10]. This dosage of lipids was based on the principle ofsolubilization of fat in nonpolar organic solvent. The lipids contained in 3 g of the yam flourwere entrained by 70 ml of diethyl ether at 119ºC. Extraction was carried by flux and refluxduring 65 min. Solvent was collected and then lipids were recovered and weighed afterremoval of traces of the solvent in an oven at 130ºC for 30 minutes.
2.3.5 Soluble carbohydrate content
Soluble carbohydrates content (soluble sugars) was determined by the iodine method of LuffSchoorl [10]. The sugars were extracted with water from 5 g of the yam flour and placed inthe presence of Fehling's solution and potassium iodide (10 ml of KI solution 10% w / v).Iodine resulting from the reaction was titrated with thiosulfate (0.1 N). The Table allowed theLuff Schoorl, with the volume of thiosulfate made to determine the soluble carbohydratescontent of the sample.
2.3.6 Total carbohydrates content
The sum of digestible and indigestible carbohydrates was evaluated by difference: 100 -(moisture content + fats content + proteins contents + ashes content). The knowledge of thetotal carbohydrate content was necessary for the application of thermal coefficients ofAtwater and Rosa [1]. for the calculation of the energy value.
2.3.7 Starch content

International Journal of Biochemistry Research & Review, 2(4): 137-151, 2012
141
To determine the starch content we proceed by estimation using 0.9 the conversion factor ofthe glucose in starch [8].
% Starch = 0, 9 {(% Total carbohydrate) – (% Soluble carbohydrates + % Cellulose)}
2.3.8 Cellulose content
The method of weende [2] was used. Acid hydrolysis (200 ml of acid sulphuric 0.255 N) andalkaline hydrolysis (200 ml of 0.3N sodium hydroxide) of the proteins and digestiblecarbohydrates contained in 3 g of the yam flour were carried out, and then the hydrolysatewas degreased with acetone. The residue was dried and weighed. After calcination theweight of the ashes was subtracted.
2.3.9 Energy value
The energy value was calculated by application of the thermal coefficients of Atwater andRosa [1]. with 4 calories for 1g of proteins; 9, 3 calories for 1g of lipids and 3, 75 calories for1g of carbohydrates. The energy value (callus / 100 g) = 4 x % proteins + 9, 3 x % lipids + 3,75 x % carbohydrates.
2.3.10 Oxalic acid content
Oxalic acid content was determined by titrimetric procedure. 10 g of the sample weremacerated to hot (60ºC) in 50 ml of boiled distilled water for 30 min shaking. The maceratewas filtered on the filter and the filtrate reduced to 200 ml in a graduated flask with boileddistilled water. Fifty milliliters of this solution taken in a 250 ml flask were diluted with 50 mlof boiled water and titrated with a solution of sodium hydroxide (0.1 N) in the presence ofphenolphthalein. The result was expressed in millequivalents or g / 100 g of acid determinedin this case oxalic acid [30]. Oxalic acid (HOOC-COOH) was an organic diacid, it releases 2equivalents (H⁺) in solution to a molecular weight of M = 90 g. One milliequivalentcorresponded to 90 / (2 x 1000) = 0,045 g of oxalic.
2.3.11 Tannins content
The tannin content was determined by the method of acidified vanillin after soaking thesample in methanol [9]. One gram (1g) of the sample was macerated in 50 ml of methanolduring 28 hours. In 1 ml of this solution added the reagent Vanillin-HCl (5 ml) (reagent wasused for the reference 100 % transmittance) and to read the UV spectrophotometer at 500nm. The tannin content was determined by comparison to a solution of catechin.
2.3.12 Hydrocyanic acid content
The hydrocyanic acid content was determined by the method of alkalinity titration [20]. Thesample (27g) was macerated in water (200 ml) for 18 hours. The macerate is distilled byinternment in water vapor and the distillate is collected in a solution NaOH (5%). Afterdiluting 100 ml of the distillate to 2/5, cyanogenic ions of distillate were determined by atitrated solution of silver nitrate (0.02 N) in the presence of potassium iodide 8 ml. It wasnecessary to plan a witness. Cyanogenic ions in aqueous solution complexed silver ions.AgNO3 molecule reacted with two molecules of HCN representing 54 g of HCN for AgNO3solution with 1N in the case of a solution.

International Journal of Biochemistry Research & Review, 2(4): 137-151, 2012
142
2.3.13 Alkaloid content
The alkaloids of the sample were put into solution by maceration in a mixture of diethyl etherand chloroform and extracted by HCl [7]. 15 g of the sample were macerated in a mixture ofdiethyl ether (100 ml) and chloroform (50 ml) overnight and the alkaloids put thus in solutionwere extracted with hydrochloric acid (0.3 N) and were precipitated by the silico-tungstic acidsolution (10%). The precipitate was incinerated and the ashes were weighed. The alkaloidcontent of the essay was obtained by multiplying the weight of the ashes by a factor 0.2.Alkaloids content accounted for 20% weight of the ashes.
2.3.14 Sapogenins content
Usually the saponins by hydrolyzing gave the sapogenins. The principal sapogeninscontained in yam were diosgenin. The extraction of sapogenins from (5g) sample was madeby reflux boiling (30 min) in 50 ml of ethanol. The alcoholic extract was concentrated to syrupand hot hydrolyzed with 10 ml of sulfuric acid (4 N) for 2 hours. Sapogenins whichprecipitated were isolated by filtration. They were then dried and weighed [6].
2.4 Statistical Analysis
The analysis of variance (ANOVA) at p<0.05 means and standard deviations were carriedout to compare the levels of nutrients and antinutritional factors in the tubers. The principalcomponents analysis (PCA) was performed using the software Statsoft.99 ed-Test Newman- Keuls (NCSS, Kaysville, USA) to classify wild yam species tubers according to theirdifferent nutrients and antinutritional factors to determine the characteristic of each speciesof wild yam species studied.
3. RESULTS
3.1 Principal Component Analysis (PCA) of Wild Yam Species TubersAccording to Their Nutrient Composition
Table 2 indicated the nutrient composition of tubers. The principal component analysis(PCA), of the variables constituted by nutrients (Table 2) according to the individualsconstituted by wild yam species tubers (Table 1), showed two principal axes F1 and F2(Fig. 1). The percentages of variables dispersion around the principal axes F1 and F2 (Fig.1a) were equal to 72.86% and 20.24%, respectively. The circle expressing correlations ofthe variables with respect to the axes was represented by the Fig. 1a. With the principal axisF1 (Fig. 1a) the variable moisture was correlated towards the positive values and thevariables: soluble carbohydrates, starch, energy value, lipids, proteins, cellulose and ashwere correlated towards negative values. With principal axis F2 (Fig. 1a) the variables:starch, soluble carbohydrates, and energy value were correlated towards positive values andthe variables: moisture, lipids, proteins, cellulose and ash were correlated towards thenegative values. The projection of individuals, consisting of wild yam species tubers (Table1), on principal axes F1 and F2, was represented in the Fig. 1b. It identified four groups ofindividuals around the axes. Around the principal axis F1 (Fig. 1b) two classes emerged: theclass of wild yam species D. minutiflora; D. hirtiflora, and D. bulbifera bulbil which groupedtogether towards positive values of the principal axis F1 (Fig. 1b) and the class of wild yamspecies D. burkilliana; D dumetorum; D. bulbifera tuber; D. praehensilis and D.mangenotiana which grouped together towards negative values of the principal axis F1 (Fig.1b). Around the principal axis F2 (Fig. 1b) two classes emerged: the class of wild yam

International Journal of Biochemistry Research & Review, 2(4): 137-151, 2012
143
species: D. burkilliana; D. bulbifera tuber; D. dumetorum and D. praehensilis which groupedtogether towards the positive values of the principal axis F2 (Fig. 1b) and the class of wildyam species: D. minutiflora; D. hirtiflora; D. bulbifera bulbil and D. mangenotiana whichgrouped together towards negative values of the principal axis F2 (Fig. 1b).
Fig. 1a. Circle of variables (nutrients of wild yam species) correlationS. Carb: soluble carbohydrates

International Journal of Biochemistry Research & Review, 2(4): 137-151, 2012
144
Fig. 1b. Distribution of individuals (tubers of wild yam species) around the principal axesMang: mangenotiana; Bulk: burkilliana; Dum: dumetorum; Bulb b: bulbifera (bulbil);
Bulb t: bulbifera (tuber); Hirt: hirtiflora; Minu: minutiflora; Prae: praehensilisFig. 1. Principal component analysis (PCA) of wild yam species tubers according to
their nutrients
3.2 Principal Component Analysis of Wild Yam Tubers According to TheirComposition of Antinutritional Factors
Table 3 indicated the antinutritional factors composition of tubers. The principal componentanalysis (PCA), of the variables constituted by antinutritional factors (Table 3) according tothe individuals constituted by wild yam species tubers (Table 1), showed two principal axesF1 and F2 (Fig. 2. The percentages of variables dispersion around axes F1 and F2 (Fig. 2a)were equal to 35.88% and 31.99% respectively. The circle expressing correlations of thevariables with respect to the axes was represented by the Fig. 2a. With the F1 axis (Fig. 2a)the variable sapogenins was correlated towards the positive values and the variables:tannin, hydrocyanic acid, alkaloids and oxalic acid were correlated towards negative values.With F2 axis (Fig. 2a) the variables: tannin, hydrocyanic acid, oxalic acid and sapogeninswere correlated towards positive values and the variable alkaloid was correlated towards thenegative values. The projection of individuals, consisting of wild yam species tubers (Table1), on axes F1 and F2, was represented in Fig. 2b. It identified three groups of individualsaround the axes. Around the F1 axis (Fig. 2b) emerged the class of wild yam species: D.dumetorum; D.togoensis; D.bulbifera bulbil; D.Bulbifera tuber; D.burkilliana; D.praehensilis;D.minutiflora and D.mangenotiana. Around the F2 axis (Fig. 2 b) two classes emerged. Theclass of wild yam species: D. dumetorum; D.togoensis; D.bulbifera bulbil; D.praehensilis;D.minutiflora and D.mangenotiana and the class of wild yam species which grouped togethertowards positive values of the F2 axis (Fig. 2b) D. dumetorum; D.togoensis; D.minutifloraand D. hirtiflora.

International Journal of Biochemistry Research & Review, 2(4): 137-151, 2012
145
Fig. 2a. Circle of variables (antinutritional factors of wild yam species) correlationSapg: sapogenins; Ox. acid: Oxalic acid; Hcyanic acid: hydrocyanic acid; Alka: alkaloids
Fig. 2b. Distribution of individuals (tubers of wild yam species) around the principal axesMang: mangenotiana; Bulk: burkilliana; Dum: dumetorum; Bulb b: bulbifera (bulbil);
Bulb t: bulbifera (tuber); Hirt: hirtiflora; Minu: minutiflora; Prae: praehensilis; Toge: togoensisFig. 2. Principal component analysis (PCA) of wild yam species tubers according to
their antinutritional factors

International Journal of Biochemistry Research & Review, 2(4): 137-151, 2012
146
Table 2. Composition of wild yam species tubers
Species Moisture% f.m
Proteins% d.m
Lipid%d.m
Solublecarbohydrates%d.m
Starch% d.m
Totalcarbohydrates% d.m
cellulose% d.m
Ash%d.m
EnergyCa/100g
D. minutiflora 84,95b 10,56d 2,95a 2,37b 67,53c 81,73b 4,30c 4,76d 376aD. hirtiflora 81,89e 9,55bcd 3,35b 1,42a 67,40c 82,27b 5,98d 4,84d 377aD. bulbifera bulbil 81,44e 8,82bc 3,99c 3,59c 57,15a 82,44b 7,67f 4,74d 381bcD. burkilliana 71,59d 8,24b 3,26ab 2,34b 70,05d 83,77bc 3,64a 4,73d 377aD. bulbifera tuber 69,80c 6,29a 3,53b 2,29b 73,01d 86,87c 3,71ab 3,31b 383dD. dumetorum 69,65c 9,93cd 3,43b 3,77c 68,05c 83,36b 4,03bc 3,27b 384dD. praehensilis 68,05a 9,48bcd 3,61b 3,81c 69,37d 84,51bc 3,62a 2,40a 389eD. mangenotiana 66,24a 14,18e 4,61d 2,25b 58,83b 74,94a 7,33e 6,27c 380b
The indicated values represented the average of three determinations (n = 3); ** in every column the values affected by different letters weresignificantly different in p < 0. 05.
Table 3. Composition of wild yam species tubers antinutritional factors
Species Oxalic acidmg/100g dm
Tanninsmg/100g dm
Hydrocyanic acid10¯²mg/100g dm
Alkaloidmg/100g dm
apogenins% dm
D. dumetorum 12.93e 560.10h 33.03e 167.70e 0.78bD. togoensis 12.63e 456.03e 2.00a 214.80h 1.49cD. minutiflora 10.03e 385.73b 2.00a 01.03a 0.90bD. bulbifera bulbil 9.33cd 470.03f 1.97a 165.63d 0.22aD. praehensilis 9.03d 570.30h 4.00b 150.63c 0.05aD. mangenotiana 8.33c 410.73c 20.03d 175.70f 0.26aD. bulbifera tuber 6.83b 421.00d 10.03c 248.23i 0.08aD. hirtiflora 6.50b 15.03a 7.00c 107.63b 1.34cD. burkilliana 5.43a 489.23g 4.03b 187.03g 0.20a
* The indicated values represented the average of three determinations (n = 3); ** in every column the values affected by different letters weresignificantly different in p < 0. 05.

International Journal of Biochemistry Research & Review, 2(4): 137-151, 2012
147
4. DISCUSSION
4.1 Principal Component Analysis (PCA) of Wild Yam Species TubersAccording to Their Nutrient Composition
4.1.1 Observation on the variables (nutrients)
The ACP of wild yam tubers (Table 1) according to their nutrients (Table 2) revealed twoprincipal axes F1 and F2 (Fig.1a). Around these axes we noticed that the dispersion ofvariables (nutrients) was in a circle (Fig. 1a) where the variables which were situated on theborder of the circle were correlated between them. Thus the observation of this circle ofcorrelation (Fig. 1a) showed variables: starch, soluble carbohydrates, energy value, lipid,proteins, cellulose, ash and moisture situated on the border of the circle and closer to theprincipal axes F1 and F2 (Fig.1a). These different variables were thus correlated betweenthem and more or less correlated with the principal axes F1 and F2 (Fig. 1a). The principalaxis F1 (Fig. 1a) were correlated towards its positive values with the variable water andtowards its negative values to variables: lipid, energy value, protein and solublecarbohydrates. The principal axis F2 (Fig. 1a) were correlated towards its positive valueswith the variable starch and towards its negative values with the variable ash from theseobservations we noticed that the principal axis F1 (Fig. 1a) expressed more variablemoisture and the group of variables: energy, lipid, starch and proteins. Variable water wasnegatively correlated with the variable energy value. According to Bradbury [11] the energyvalue of a tuber was inversely proportional to its moisture content. Concerning the principalaxis F2 (Fig. 1), it expressed the variable soluble carbohydrates and the variable ash. Thesetwo variables were negatively correlated to each other.
4.1.2 Observation on the individuals (wild yam species tubers)
The distribution of individuals (Table 2) around the axes F1 and F2 (Fig. 1b) revealed by theACP identified different regrouping classes: The positioning of these classes with respect toprincipal axes F1 and F2 (Fig. 1b) and with respect to variables (Fig. 1a) allowed todiscriminate tubers (Table 1) around four characteristic variables (Table 2).
4.1.2.1 Around the principal axis F1 (Fig. 1b)
One class which gathered towards the positive values of the principal axis F1(Fig. 1 b) the individuals D. minutiflora; D. hirtiflora and D. bulbifera bulbil.
Observing the correlations of the variables with this principal axis F1 (Fig. 1a) and thedistribution of individuals around that same principal axis F1 (Fig. 1b) we noticed that thetubers of this class had the highest levels of moisture (Table 2).
One class which gathered towards the negative values of principal axis F1 (Fig. 1b)the individuals D. burkilliana, D. dumetorum, D. bulbifera tuber, D. praehensilis andD. mangenotiana.
Observing the correlations of the variables with this principal axis F1 (Fig. 1a) and thedistribution of the individuals around this same principal axis F1 (Fig. 1b), we noticed that thetubers of this class had the highest levels of lipid, starch, proteins and the highest energyvalues (Table 2). The tubers of this class had the best nutritional potential.

International Journal of Biochemistry Research & Review, 2(4): 137-151, 2012
148
4.1.2.2 Around the principal axis F2 (Fig. 1b) 3
One class which gathered towards the positive values of the principal axis F2(Fig. 1b) the individuals D. burkilliana; D. bulbifera tuber; D. dumetorum and D.praehensilis.
Observing the correlations of the variables with this principal axis F2 (Fig. 1a) and thedistribution of individuals around the same principal axis F2 (Fig. 1b), we noticed that thetubers of this class had the highest levels of soluble carbohydrates (Table 2).
One class which gathered towards the negative values of the principal axis F2(Fig.1b) the individuals D. minutiflora; D. bulbifera bulbil; D. mangenotiana and D.hirtiflora.
Observing the correlations of the variables with this principal axis F2 (Fig. 1a) and thedistribution of individuals around the same principal axis F2 (Fig. 1b), we noticed that thetubers of this class had the highest levels of ash (Table 2).
4.2 Principal Component Analysis of Wild Yam Tubers According to TheirComposition of Antinutritional Factors
4.2.1 Observation on variables (Antinutritional Factors)
The ACP of the wild yam tubers (Table 1) according to their antinutritional factors (Table 3)revealed two principal axes F1 and F2 (Fig. 2a). Around these axes we noticed that thedispersion of variables (Table III) around the principal axes F1 and F2 (Fig. 2a) was in acircle of coordination (Fig. 2a); we noticed that in this circle that the variables are notbordering (Fig.1a) and were also close to each other. The variables are not correlated withone another (Fig. 2a). Although they are more or less close to the principal axes F1 and F2(Fig. 2a) so more or less correlated with these axes. The principal axis F1 (Fig. 2a) wascorrelated towards its negative values with the variables tannins, alkaloids and hydrocyanicacid. It was more correlated with the variable Tannins which was closer. The principal axisF2 (Fig. 2a) was correlated towards its positive values with variables: acid oxalic andsapogenins. It was more correlated with the variable oxalic acid which was closer from theseobservations we could say that the principal axis F1 (Fig. 2a) expressed more the variableTannin. While the principal axis F2 (Fig. 2a) expressed more the variable oxalic acid.
4.2.2 Observation on the individuals (wild yam species tubers)
The projection of individuals (Table 1) around the principal axis F1 and F2 (Fig. 2b) and theirposition relative to the axes and variables (Fig. 2a) revealed three classes of regrouping ofthese individuals.
4.2.2.1 Around the principal axis F1 (Fig. 2b)
One class which gathered the individuals D. togoensis; D. bulbifera bulbil; D.mangenotiana; D. bulbifera tuber; D. burkilliana; D. praehensilis and D. dumetorum.
The distribution of these individuals around the principal axis F1 (Fig. 2b) and the correlationof this axis with the variables (Fig. 2a) allowed us to say that the wild yam species tubers
International Journal of Biochemistry Research & Review, 2(4): 137-151, 2012
149
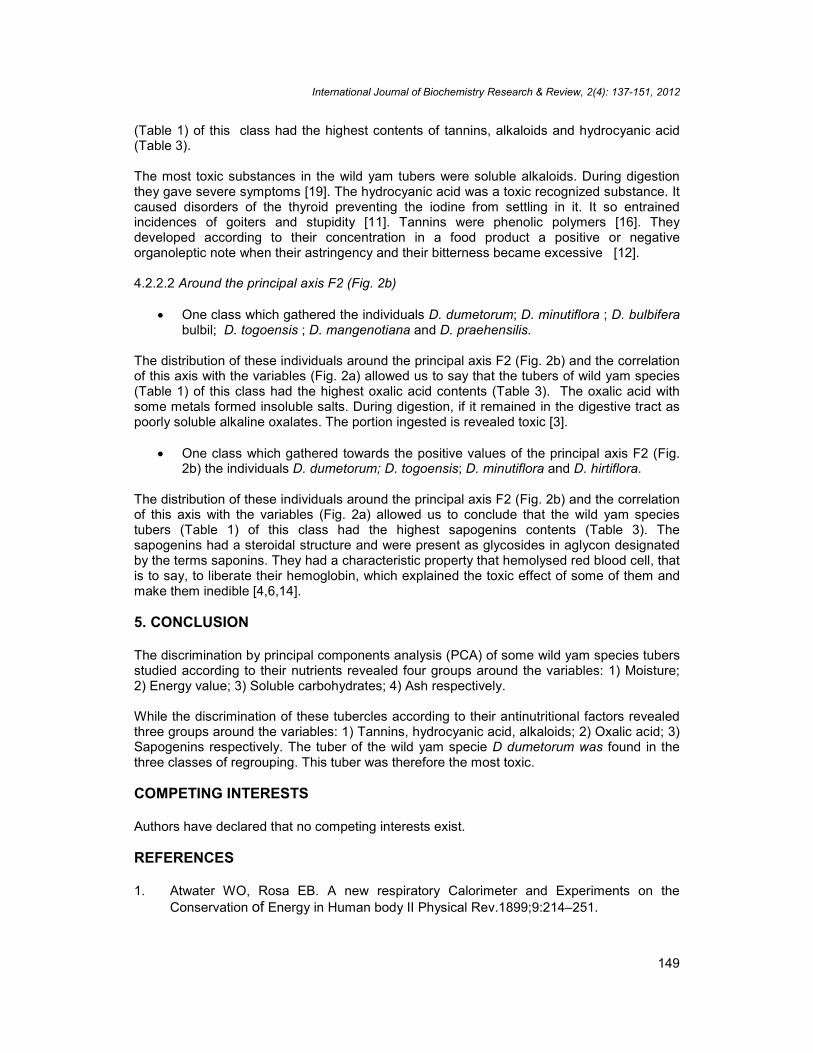
(Table 1) of this class had the highest contents of tannins, alkaloids and hydrocyanic acid(Table 3).
The most toxic substances in the wild yam tubers were soluble alkaloids. During digestionthey gave severe symptoms [19]. The hydrocyanic acid was a toxic recognized substance. Itcaused disorders of the thyroid preventing the iodine from settling in it. It so entrainedincidences of goiters and stupidity [11]. Tannins were phenolic polymers [16]. Theydeveloped according to their concentration in a food product a positive or negativeorganoleptic note when their astringency and their bitterness became excessive [12].
4.2.2.2 Around the principal axis F2 (Fig. 2b)
One class which gathered the individuals D. dumetorum; D. minutiflora ; D. bulbiferabulbil; D. togoensis ; D. mangenotiana and D. praehensilis.
The distribution of these individuals around the principal axis F2 (Fig. 2b) and the correlationof this axis with the variables (Fig. 2a) allowed us to say that the tubers of wild yam species(Table 1) of this class had the highest oxalic acid contents (Table 3). The oxalic acid withsome metals formed insoluble salts. During digestion, if it remained in the digestive tract aspoorly soluble alkaline oxalates. The portion ingested is revealed toxic [3].
One class which gathered towards the positive values of the principal axis F2 (Fig.2b) the individuals D. dumetorum; D. togoensis; D. minutiflora and D. hirtiflora.
The distribution of these individuals around the principal axis F2 (Fig. 2b) and the correlationof this axis with the variables (Fig. 2a) allowed us to conclude that the wild yam speciestubers (Table 1) of this class had the highest sapogenins contents (Table 3). Thesapogenins had a steroidal structure and were present as glycosides in aglycon designatedby the terms saponins. They had a characteristic property that hemolysed red blood cell, thatis to say, to liberate their hemoglobin, which explained the toxic effect of some of them andmake them inedible [4,6,14].
5. CONCLUSION
The discrimination by principal components analysis (PCA) of some wild yam species tubersstudied according to their nutrients revealed four groups around the variables: 1) Moisture;2) Energy value; 3) Soluble carbohydrates; 4) Ash respectively.
While the discrimination of these tubercles according to their antinutritional factors revealedthree groups around the variables: 1) Tannins, hydrocyanic acid, alkaloids; 2) Oxalic acid; 3)Sapogenins respectively. The tuber of the wild yam specie D dumetorum was found in thethree classes of regrouping. This tuber was therefore the most toxic.
COMPETING INTERESTS
Authors have declared that no competing interests exist.
REFERENCES
1. Atwater WO, Rosa EB. A new respiratory Calorimeter and Experiments on theConservation of Energy in Human body II Physical Rev.1899;9:214–251.

International Journal of Biochemistry Research & Review, 2(4): 137-151, 2012
150
2. AFNOR. NF V 03-040. 12. Produits Agricoles et alimentaires.Détermination de lacellulose brute. 1993.
3. Adrian J, Potus J, Poiffait A, Dauvillier P. Introduction à l’analyse nutritionnelle desdenrées alimentaires. Lavoisier. Paris. 1998.
4. Abe MO. Adaptability of potato drying to yam processing. J. Milk. Food Tech.1973;36:456-462.
5. A.O.A.C. Association of Official Analytical Chemist Official, ‛methods of analysis’ 11thedition, Arlington VA, USA; 1980.
6. Asiedu JJ. La transformation des produits agricoles en zone tropicale Approchetechnologique’. Karthala, Paris 1991.
7. J.O. 371 L 0250 / CEE. Méthodes d’analyse des composants des aliments d’animaux;1998.
8. J.O. L 248 /CEE n°900 Règlement définissant les méthodes d’analyse et autresdispositions de caractère technique; 2008.
9. Burns RE Agronomy Journal.1971;63:511-512.10. BIPEA. Bureau Interprofessionnel d’Etude Analytique; ‛méthodes d’analyse des
Communautés Européennes’, Gennevilliers, France.1976.11. Bradbury JH. ASEAN Food Journal; 1988;4:3-13.12. Coursey DG. Yam. An account of the nature, origins, cultivation and utilization of the
useful members of the Dioscoreaceae, Londres, Tropical Product Institute; 1967.13. Coursey DG, Russel JC. A note on endogenous and Biodeteriotation factors in the
respiration of dormant yam tubers International Biodeteriotation Bulletin.1969;5(1):27-30.
14. Coursey DG. Cassava as Food Toxicity and Technology In Nestle B.and Mac Intyre R.Ed. Chronic cassava toxicity –Actes de l’atelier interdisciplinaire Londres, 29–30janvier 1973 ;27– 36. Ottawa – C.R.D.I (I.D). 1973
15. Coursey DG. Ressources principales plantes racines : leurs possibilités d’utilisationpar l’homme, l’animal, l’industrie. In Actes du second symposium de la sociétéinternationale pour les plantes racines tropicales d’Afrique, pages 27-36, Douala,Cameroun, 14-19 Août ; 1983.
16. Conia JM. Introduction à la chimie organique’. Inter. Paris ; 1987.17. Dégras L. L’igname, plante à tubercule tropical. Techniques agricoles et production
tropicale’. 452 Maisonneuve et Larose. Paris ; 1986.18. Dumont R, Hamon P, Seignobos C. Les ignames au Cameroun. CIRAD, CA, Coll.
Repères, cultures annuelles, Montpellier ; 1994.19. FAO. Bilans Alimentaire, Rome.1971.20. Holleman LWJ, Aten A. Agriculteur. FAO, Rome, Italie Cahier. 1956;54.21. Hladik A, Bahuchet S, Okatillon C, Hladik CM. Rev.Ecol (terre vie).1984;39:248-290.22. Hamon P, Dumont R, Zoundjihekpon J, Tio-Touré B, Hamon S. Les ignames
sauvages d’Afrique de l’Ouest. Caractères morphologiques’, ORSTOM, Paris; 1995.23. Ildefonse N. Agriculture vivrière oust africaine à travers le cas de la Côte d’Ivoire’.
IDESSA, Bouaké; 1995.24. Knuth R. Dioscoreaceae» In Engler. Das Pflanzenreich.1924;87(IV-43):1- 387.25. Miège J. Contribution à l’étude systématique des Dioscorea d’Afrique occidentale.
Thèse Sc. Nat. Paris; 1952.26. Miège J. Stratégies végétales’. Musée de Genève, 1977;172:13–17.27. Martin FW. Los names medicinales y su mejoramiento. Primer internacional seminario
sobre los Dioscoreales.Publ. ; Inst Nat.invest. Mexico. For. 1972;8:93-107.28. Perrot CH. L’igname dans les cérémonies politico-religieuses de l’aire culturelle Akan.
In l’igname plante séculaire et culture d’avenir. Actes du séminaire internationalCIRAD-INRA – ORSTOM-CORAF. D. Berthaud, N. Bricas, J.L. Marchand (Eds),Montpellier, France, 3-6 Juin; 1998.

International Journal of Biochemistry Research & Review, 2(4): 137-151, 2012
151
29. Quigley FR. Diosgenin in West African Dioscorea plants Planta Medica. 1978;33:414-415.
30. Rachid S. Analyse physicochimique I - Analyse des denrées alimentaires. ENSA.Agadir - Maroc. 1978.
31. Webster J, Beck W. Ternai B. Journal Agric. Food Chem. 1984;32:1087–1090._________________________________________________________________________© 2012 Alexis and Georges; This is an Open Access article distributed under the terms of the Creative CommonsAttribution License (http://creativecommons.org/licenses/by/3.0), which permits unrestricted use, distribution, andreproduction in any medium, provided the original work is properly cited.
Peer-review history:The peer review history for this paper can be accessed here:
http://www.sciencedomain.org/review-history.php?iid=171&id=3&aid=794