Classification of Protein Crystallization Trial...
7
Classification of Protein Crystallization Trial Images using Geometric Features M. Sigdel 1 , M. S. Sigdel 1 , ˙ I. Dinç 1 , S. Dinç 1 , M. L. Pusey 2 , and R. S. Aygün 1 1 Computer Science Department, The University of Alabama in Huntsville, Huntsville, Alabama, United States 2 iXpressGenes, Inc., 601 Genome Way, Huntsville, Alabama, United States Abstract— In this paper, we describe our method for clas- sification of protein crystallization trial images using geo- metric features. The objective is to automatically categorize a protein crystal according to the presence of protein crystal types in the images. We consider only the images consisting of protein crystals for the classification. The images are clas- sified into 4 categories- needles, small crystals, large crystals and other crystals. Image classification consists of two main steps - image feature extraction and applying decision tree classifier. Our feature extraction includes application of canny edge detection, extraction of edge related features from the edge image, and extraction of blob related features from multiple thresholding techniques. We performed our experiments on 212 expert labeled images and tested our results using 10-fold cross validation. Our results indicate that the proposed classification technique produces a rea- sonable classification performance. The overall accuracy of the classification is 75%. Keywords: crystallization, edge detection, blob features 1. Introduction Protein crystallization is the process for formation of protein crystals. Protein crystallization is a rare process and requires thousands of trials for successful crystallization [1]. The objective of crystallization trials is to determine suitable conditions for protein crystallization and produce protein crystals suitable for X-ray diffraction. High throughput systems have been developed in recent years trying to identify the best conditions to crystallize proteins [1]. Imaging techniques are used to monitor the progress of crystallization. The crystallization trials are scanned periodically to determine the state change or the possibility of forming crystals. With large number of images being captured, it is necessary to have a reliable classification system to distinguish the crystallization states each image belongs to. The fundamental aim is to discard the unsuccess- ful trials, identify the successful trials, and possibly identify the trials which could be optimized. Many research studies have been done to distinguish the protein images as non-crystal (does not contain crystal) or crystal (has crystal). For example, Cumba et al. (2003)[2], Cumba et al. (2005) [3], Berry et al. (2006) [4], Pan et al. (2006) [5] and Po and Laine (2008) [6] have described the classification of crystallization trials into non-crystal or crystal categories. In our previous work [7], we described classification of crystallization images into three categories (non-crystals, likely-leads and crystals). Saitoh et al. (2006) [8] proposed crystallization trials classification into five cate- gories (clear drop, creamy precipitate, granulated precipitate, amorphous state precipitate, and crystal). Spraggon et al. (2002) [9] have described classification of the crystallization imagery into 6 different categories (experimental mistake, clear drop, homogeneous precipitant, inhomogeneous pre- cipitant, microcrystals, and crystals). Likewise, Cumba et al. (2010) [10] classified into 6 basic categories (phase separation, precipitate, skin effect, crystal, junk, and unsure). Not all protein crystals are suitable for X-ray diffraction. The main interest for crystallographers is the formation of large 3D crystals. Other crystal structures are also important as the crystallization conditions can be optimized to get better crystals. Therefore, it is necessary to have a reliable system that distinguishes between different types of crystals according to the shapes and sizes. In the previous studies, classification of the different types of crystals has not been the main focus. Various classification techniques have been proposed for the classification of protein crystallization trials. Classifica- tion algorithms such as support vector machines (SVMs), decision trees, neural networks, boosting, and random forest have been used [7]. Alternatively, combination of multiple classifiers has also been studied in the literature [8]. The recent study by Hung et al. (2014) [11] have proposed protein crystallization image classification using elastic net. In terms of the feature extraction, a variety of image processing techniques have been proposed. Research studies Cumba et al. (2003) [2], Saitoh et al. (2004)[12] and Zhu et al. (2004) [13] used a combination of geometric and texture features as the input to their classifier. Saitoh et al. (2006) [8] used global texture features as well as features from local parts in the image and features from differential images. Cumba et al. (2010) [10] extracted several features such as basic statistics, energy, Euler numbers, Radon-Laplacian features, Sobel-edge features, microcrystal features, and GLCM features to obtain a large feature vector. Increasing the number of features may not necessarily improve the accuracy. Moreover, it may slow down the classification process.
-
Upload
hoangthien -
Category
Documents
-
view
232 -
download
0
Transcript of Classification of Protein Crystallization Trial...

Classification of Protein Crystallization Trial Images usingGeometric Features
M. Sigdel1, M. S. Sigdel1, I. Dinç1, S. Dinç1, M. L. Pusey2, and R. S. Aygün1
1Computer Science Department, The University of Alabama in Huntsville, Huntsville, Alabama, United States2iXpressGenes, Inc., 601 Genome Way, Huntsville, Alabama, United States
Abstract— In this paper, we describe our method for clas-sification of protein crystallization trial images using geo-metric features. The objective is to automatically categorizea protein crystal according to the presence of protein crystaltypes in the images. We consider only the images consistingof protein crystals for the classification. The images are clas-sified into 4 categories- needles, small crystals, large crystalsand other crystals. Image classification consists of two mainsteps - image feature extraction and applying decision treeclassifier. Our feature extraction includes application ofcanny edge detection, extraction of edge related featuresfrom the edge image, and extraction of blob related featuresfrom multiple thresholding techniques. We performed ourexperiments on 212 expert labeled images and tested ourresults using 10-fold cross validation. Our results indicatethat the proposed classification technique produces a rea-sonable classification performance. The overall accuracy ofthe classification is 75%.
Keywords: crystallization, edge detection, blob features
1. IntroductionProtein crystallization is the process for formation of
protein crystals. Protein crystallization is a rare process andrequires thousands of trials for successful crystallization [1].The objective of crystallization trials is to determine suitableconditions for protein crystallization and produce proteincrystals suitable for X-ray diffraction.
High throughput systems have been developed in recentyears trying to identify the best conditions to crystallizeproteins [1]. Imaging techniques are used to monitor theprogress of crystallization. The crystallization trials arescanned periodically to determine the state change or thepossibility of forming crystals. With large number of imagesbeing captured, it is necessary to have a reliable classificationsystem to distinguish the crystallization states each imagebelongs to. The fundamental aim is to discard the unsuccess-ful trials, identify the successful trials, and possibly identifythe trials which could be optimized.
Many research studies have been done to distinguish theprotein images as non-crystal (does not contain crystal) orcrystal (has crystal). For example, Cumba et al. (2003)[2],Cumba et al. (2005) [3], Berry et al. (2006) [4], Pan etal. (2006) [5] and Po and Laine (2008) [6] have described
the classification of crystallization trials into non-crystal orcrystal categories. In our previous work [7], we describedclassification of crystallization images into three categories(non-crystals, likely-leads and crystals). Saitoh et al. (2006)[8] proposed crystallization trials classification into five cate-gories (clear drop, creamy precipitate, granulated precipitate,amorphous state precipitate, and crystal). Spraggon et al.(2002) [9] have described classification of the crystallizationimagery into 6 different categories (experimental mistake,clear drop, homogeneous precipitant, inhomogeneous pre-cipitant, microcrystals, and crystals). Likewise, Cumba etal. (2010) [10] classified into 6 basic categories (phaseseparation, precipitate, skin effect, crystal, junk, and unsure).
Not all protein crystals are suitable for X-ray diffraction.The main interest for crystallographers is the formation oflarge 3D crystals. Other crystal structures are also importantas the crystallization conditions can be optimized to getbetter crystals. Therefore, it is necessary to have a reliablesystem that distinguishes between different types of crystalsaccording to the shapes and sizes. In the previous studies,classification of the different types of crystals has not beenthe main focus.
Various classification techniques have been proposed forthe classification of protein crystallization trials. Classifica-tion algorithms such as support vector machines (SVMs),decision trees, neural networks, boosting, and random foresthave been used [7]. Alternatively, combination of multipleclassifiers has also been studied in the literature [8]. Therecent study by Hung et al. (2014) [11] have proposedprotein crystallization image classification using elastic net.
In terms of the feature extraction, a variety of imageprocessing techniques have been proposed. Research studiesCumba et al. (2003) [2], Saitoh et al. (2004)[12] and Zhu etal. (2004) [13] used a combination of geometric and texturefeatures as the input to their classifier. Saitoh et al. (2006) [8]used global texture features as well as features from localparts in the image and features from differential images.Cumba et al. (2010) [10] extracted several features suchas basic statistics, energy, Euler numbers, Radon-Laplacianfeatures, Sobel-edge features, microcrystal features, andGLCM features to obtain a large feature vector. Increasingthe number of features may not necessarily improve theaccuracy. Moreover, it may slow down the classificationprocess.

This study describes our technique for protein crystalliza-tion image classification. Our focus is on classifying crystal-lization trial images according to the types of protein crystalspresent in the images. Our feature extraction includes edgerelated features from canny edge image and extracting blobrelated features from multiple thresholding techniques. Theimages are classified into 4 categories- needle crystals, smallcrystals, large crystals and other crystals. Image classifica-tion consists of two main steps - image feature extractionand applying decision tree for the classification. We are ableto achieve a reasonable classification performance.
This paper is arranged as follows. The following sectiondescribes the image categories for the classification problemconsidered in this paper. Section 3 provides the imageprocessing and feature extraction steps used in our research.Experimental results and discussion are provided in Section4. The last section concludes the paper with future work.
2. Image CategoriesThe simplest classification of the crystallization trials
distinguishes between the non-crystals (trial images notcontaining crystals) and crystals (images having crystals).In this study, we are interested in developing a systemto classify different crystal types. We consider four imagecategories (Needle crystals, Small crystals, Large crystals,Other Crystals) for protein crystallization images consistingcrystals. Description of each of these categories is providednext.
Needle Crystals - Needle crystals have pointed edges andlook like needles. These crystals can appear alone or as acluster in the images. The overlapping of multiple needlecrystals on top of each other makes it difficult to get thecorrect crystal structure for these images. Fig. 1[a-c] showsome sample images under this category.
Small Crystals - This category contains small sized crys-tals. These crystals can have 2-dimensional or 3-dimensionalshapes. These crystals can also appear alone or as a clusterin the images. Because of their small size, it is difficult tovisualize the geometric shapes expected in crystals. Besides,the crystals may be blurred because of focusing problems.Fig. 1[d-f] provide some sample images under this category.
Large Crystals - This category includes images with largecrystals with quadrangle (2-dimensional or 3-dimensional)shapes. Depending on the orientation of protein crystals inthe solution, more than one surface may be visible in someimages. Fig. 1[g-i] show some sample images under thiscategory.
Other Crystals - The images in this category may be com-bination of needles, plates, and other types of crystals. Wecan observe high intensity regions without proper geometricshapes expected in a crystal. This can be due to focusingproblems. Some representative images are shown in Fig 1[j-l].
Fig. 1: Sample protein crystallization images: [a-c] NeedleCrystals [d-f] Small Crystals [g-i] Large Crystals [j-l] OtherCrystals
3. Feature ExtractionThe images of crystallization trials are collected using
CrystalX2 software from iXpressGenes Inc. Protein solu-tions are trace fluorescently labeled and the images arecollected with green light as the excitation source. As such,the crystals are expected to be highlighted (high intensity)in the image. This can simplify further image processing asthe desired objects (crystals) become distinct.
The distinguishing characteristics of protein crystals arethe presence of straight lines and quadrangular shapes.Therefore, we focus on extracting geometric features ofthe objects (or regions) in the image. Fig. 2 shows thecomponents for image pre-processing and feature extractionof our system. Firstly, we down-sample the image andgenerate binary images using two thresholding techniques.Next, we apply image segmentation and extract featuresrelated to the blobs from these binary images. Similarly,we apply canny edge detection and link the edges to getseparated segments (graphs) in the image. We then findfeatures related to the segments and the edges. Details ofour image processing and feature extraction technique isprovided next.
3.1 Image downsamplingA high resolution image may keep unnecessary details and
increases the computation time significantly. Therefore, wedown-sample the images before further processing. In our

Fig. 2: Component diagram for image processing and featureextraction
experiments, the original size of the images is 2560x1920pixels. We reduce the image size by 8-fold to get 320x240sized image. Our analysis shows that the down-sampledimages contain sufficient detail for feature extraction.
3.2 Image binarizationImage binarization is a technique for separating fore-
ground and background regions in an image. For the pro-tein images consisting of crystals, the crystal regions areexpected to be represented as the foreground in the binaryimage. Images vary depending on crystallization techniquesand imaging devices. This makes it difficult to use a fixedthreshold for binarization. Therefore, dynamic thresholdingmethods are preferred. Different thresholding techniquesprovide good results for different images. Hence, extractingfeatures from multiple thresholding techniques can be help-ful. We apply two percentile based thresholding methods.The implementation and results for each of these techniquesare described next.
1) 95th Percentile of Green (G95) - When green lightis used as the excitation source for fluorescence basedacquisition, the intensity of the green pixel componentis observed to be higher than the red and blue compo-nents in the crystal regions [7]. We utilize this featurefor image binarization. First, threshold intensity τg95is computed as the 95th percentile intensity of thegreen component in all pixels. This means that thenumber pixels in the image with the green componentintensity below this intensity constitute around 95%of the pixels. Also, a minimum gray level intensitycondition (τmin = 40) is applied. All pixels with gray
level intensity greater than τmin and having greenpixel component greater than τg95 constitute the fore-ground region while the remaining pixels constitutethe background region.
2) Max green threshold (GMax) - This technique issimilar to the 95th percentile green intensity thresholddescribed earlier. In this method, maximum intensityof green component (τgmax) is used as the thresholdintensity for green component. All pixels with graylevel intensity greater than τmin and having greenpixel component greater than τgmax constitute theforeground region while the remaining pixels consti-tute the background region. The foreground (object)region in the binary image from this method is usuallysmaller than the foreground region from G95 thresh-old.
Fig. 3 shows some sample thresholded images using thetwo methods. From the original and binary images in Fig.3, we can observe that a single technique may not yieldgood results for all images. For the images (i) and (ii),the binary images with G95 provide better representationof the crystal objects. However, for image (iii), the resultfrom GMax threshold provides better representation of thecrystals.
Fig. 3: Figure showing results of two image binarizationtechniques on crystallization trial images a) Original imagesb) G95 thresholded images c) GMax thresholded images
3.3 Image segmentationAfter we generate the binary image, we apply connected
component labeling to segment the regions (crystals). Thebinary image could be obtained from any of the thresholdingmethods. Let O be the set of the blobs in a binary imageB, and B consists of n number of blobs. The blobs areordered from the largest to the smallest such that area(Oi)

≥ area(Oi+1). Each blob Oi is enclosed by a minimumboundary rectangle (MBR) having width (wi) and height(hi). In our implementation, we define the minimum size ofthe blob to be 25 pixels.
We include the number of blobs in the binary image as oneof the image feature. Likewise, for the 3 largest blobs (O1,O2 and O3), we extract the following features and appendit to our feature vector.
1) Blob area - This is the area of the minimum boundingrectangle (MBR) enclosing the blob. In other words,it is simply the number of pixels in the blob image.
2) Blob perimeter - This is calculated as the sum ofdistance between each adjoining pair of pixels aroundthe border of a blob.
3) Blob filled area - This is calculated as the number ofwhite pixels in the blob.
4) Blob eccentricity - This measure corresponds to theratio of the length of the MBR to the the width of theMBR. Eccentricity value lies between 0 and 1 where 0is obtained when the blob is a circle and 1 is obtainedwhen the blob corresponds to a line segment.
If a binary image contains less than 3 blobs, the value 0is used for each of these features. It should be noted that theblobs may not necessarily represent crystals in an image. Forsuch cases, the blob features may not be particularly usefulfor the classifier.
3.4 Convex hull areaIn binary images, convex hull is the smallest set of points
that forms a polygon shape, which contains the entire objectsunder consideration [14]. Convex hull points of an objectindicates us the smallest number of enclosing object pointswhich can be useful to detect boundaries of the object. Weuse area of convex hull as another image feature. This featureis useful to determine how the crystals are spread in theimage.
3.5 Canny edge detectionCanny edge detection algorithm [15] is one of the most
reliable algorithms for edge detection. The algorithm con-sists of four major steps. Firstly, Gaussian smoothing is doneto reduce noise in the image. After Gaussian smoothing,intensity gradient of the image is calculated in differentdirections. Edge detection operators like Robers, Perwitt,Sobel are used to find the first derivative in the horizontaldirection (Gy) and the vertical direction (Gx). Then edgegradient and direction are determined as follows:
g =
√Gx
2 +Gy2 (1)
θ = Gy/Gx (2)
After finding the edge gradient and direction, the edgeswhich do not have local maximum are suppressed and clas-sified as weak edges. Likewise, edges with local maximum
are classified as strong edges. If a weak edge is in theneighbor of a strong edge, then it is reclassified as strongedge. The strong edges and the reclassified weak edges formthe complete edge image. The result of applying canny edgedetector on three images is shown in Fig. 4. Our results showthat for most cases, the shapes of crystals are kept intact inthe resulting edge image.
Fig. 4: Applying canny edge detection for 3 images a)Original image b) Canny edge image
3.6 Edge linking
An edge image can contain many edges which may ormay not be part of the crystals. To analyze the shape andother edge related features, we link the edges to form graphsor segments. We used the MATLAB procedure by Kovesi[16] to perform this operation. The input to this step is abinary edge image. Firstly, isolated pixels are removed fromthe input edge image. Next, the information of start and endpoints of the edges, endings and junctions are determined.From every end point, we track points along an edge untilan end point or junction is encountered, and label the imagepixels.
The result of edge linking is shown in Fig. 5c and Fig.6c. The corresponding edge images are provided in Fig. 5band Fig. 6b respectively.

Fig. 5: Figure showing edge detection and edge feature extraction a) Original image b) Canny edge image c) Edge linkingd) Line fitting e) Edge cleaning f) Image with cyclic graphs or edges forming line normals
3.7 Line fitting and edge cleaningDue to problem with focusing, many edges could be
formed. To reduce the number of edges and to link the edgestogether, line fitting is done. In this step, edges within certaindeviation from a line are connected to form a single edge.The result from line fitting is shown in Fig. 5d and Fig.6d. Here, the margin of 3 pixels is used as the maximumallowable deviation. From the figures, we can observe thatafter line fitting, the number of edges is reduced and theshapes resemble to that of exact shapes of the crystals.However, although desirable, this may not be achieved inall images.
Likewise, isolated edges and edges that are shorter thana minimum length are removed. The result from removingthe uninterested edges is shown in Fig. 5e and Fig. 6e. Thusobtained list of edges is used to extract the following edgerelated features.
1) Length of edges - We determine the length of eachedge using Euclidean distance measure. For an edgewith the edge points (x1, y1) and (x2, y2), the length(l) of the edge is computed using equation (3).
l =
√(x1 − x2)
2+ (y1 − y2)
2 (3)
2) Angle between the edges - We determine the slope of
each line and use it to compute the angle betweenconnected lines. If two adjacent lines are almost per-pendicular to each other, that provides a hint for theobject to be small crystal or large crystal.
3) Line normals - Two lines are said to form line normalsif the angle between the lines is 90 degrees. For eachconnected edge segment, we determine if two edgesare perpendicular with each other. We consider twolines to be normals if the angle between the lines θlies between 60 and 90 i.e., 60 ≤ θ ≤ 120.
4) Cyclic graphs - We check the edge link list anddetermine if the edges form a cycle. This is a usefulfeature to distinguish between needle crystals andother crystals.
Fig. 5f and Fig. 6f provide the edge linked image withonly the edge segments that are cyclic or have line normals.
3.8 Harris corner detectionCorner points are considered as one of the uniquely rec-
ognizable features in an image. A corner is the intersectionof two edges where the variation in both x and y gradientvector directions is very high. Harris corner detection [17]exploits this idea and it basically measures the change inintensity of a pixel (x, y) for a displacement of a searchwindow in all directions. We apply Harris corner detection

Fig. 6: Figure showing edge detection and edge feature extraction a) Original image b) Canny edge image c) Edge linkingd) Line fitting e) Edge cleaning f) Image with cyclic graphs or edges forming line normals
and count the number of corners as the image feature.
3.9 List of featuresFor each image, we apply 2 dynamic image thresholding
methods. Connected component labeling is done on thethresholded images and corresponding blob features areextracted. From each binary image, we extract 3*4 + 2 = 14blob features. Likewise, we apply canny edge detection andextract 11 edge and corner features. Therefore, we extract atotal of 2*14 + 11 = 39 features per image. Below is the listof all the extracted features.
1) Blob featuresa) Area of the 3 largest blobsb) Perimeter of the 3 largest blobsc) Filled area of the 3 largest blobsd) Eccentricity of the 3 largest blobse) No of blobsf) Area of convex hull
2) Edge featuresa) No of segments (graphs)b) No of 1 edge graphsc) No of 2 edge graphsd) Has cyclic graph (0 or 1)e) Has line normals (0 or 1)f) No of cyclic graphs
g) No of graphs with line normalsh) Average length of edge in all segmentsi) Sum of lengths of all edgesj) Maximum length of an edgek) No of Harris corner points
4. Experimental ResultsOur experimental dataset consists of 212 expert labeled
images. The images are hand-labeled by an expert into 4different categories - Needle Crystals (NC), Small Crystals(SC), Large Crystals (LC) and Other Crystals (OC). Theseare represented in the proportion 24%, 20%, 35% and 21%respectively. Each image is processed as described in theearlier section and 39-dimension feature vector is obtainedby extracting the blob, edge and corner features. We usedecision tree as the classifier and evaluate the performanceusing 10-fold cross validation. Table 1 provides the result-ing confusion matrix. We are able to achieve an accuracyof 75% [(38+36+58+26)/212] on average for a four-classclassification problem.
Among the 4 classes, we can observe that the systemdistinguishes the small crystals and needle crystals withhigh accuracy. Distinction between large crystals and othercrystals is the most problematic.
From our discussion with the expert, small and largecrystals are the most important crystals in terms of their
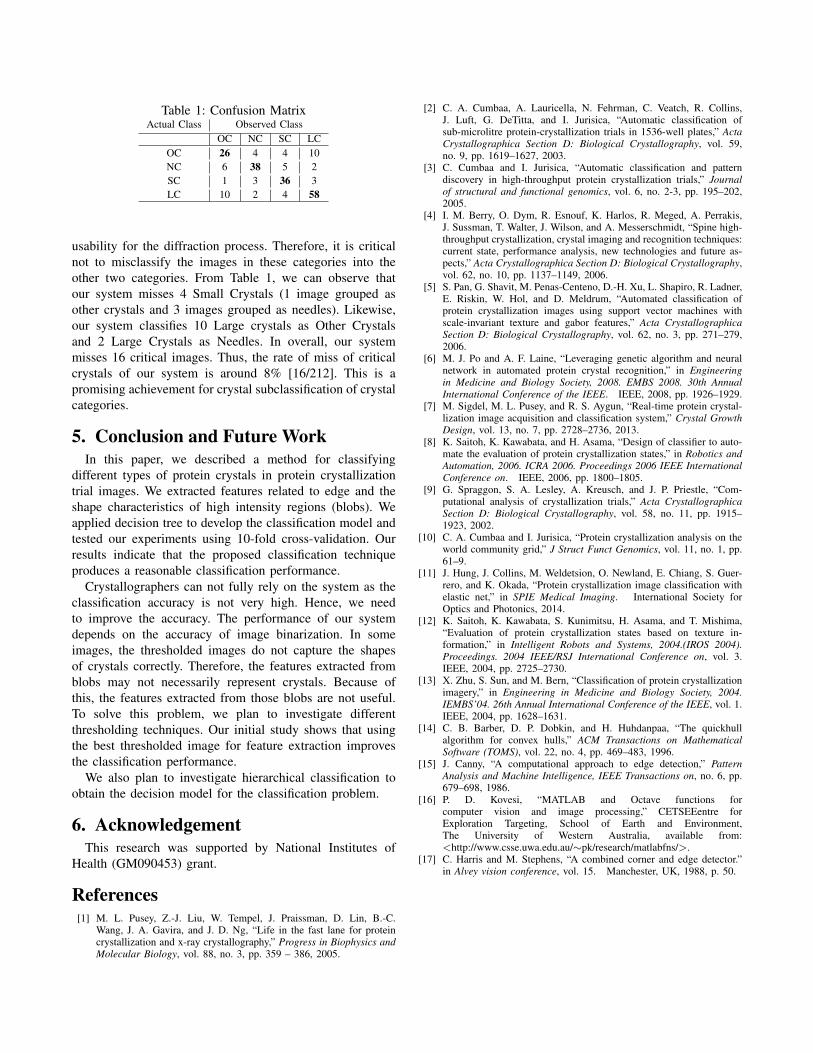
Table 1: Confusion MatrixActual Class Observed Class
OC NC SC LCOC 26 4 4 10NC 6 38 5 2SC 1 3 36 3LC 10 2 4 58
usability for the diffraction process. Therefore, it is criticalnot to misclassify the images in these categories into theother two categories. From Table 1, we can observe thatour system misses 4 Small Crystals (1 image grouped asother crystals and 3 images grouped as needles). Likewise,our system classifies 10 Large crystals as Other Crystalsand 2 Large Crystals as Needles. In overall, our systemmisses 16 critical images. Thus, the rate of miss of criticalcrystals of our system is around 8% [16/212]. This is apromising achievement for crystal subclassification of crystalcategories.
5. Conclusion and Future WorkIn this paper, we described a method for classifying
different types of protein crystals in protein crystallizationtrial images. We extracted features related to edge and theshape characteristics of high intensity regions (blobs). Weapplied decision tree to develop the classification model andtested our experiments using 10-fold cross-validation. Ourresults indicate that the proposed classification techniqueproduces a reasonable classification performance.
Crystallographers can not fully rely on the system as theclassification accuracy is not very high. Hence, we needto improve the accuracy. The performance of our systemdepends on the accuracy of image binarization. In someimages, the thresholded images do not capture the shapesof crystals correctly. Therefore, the features extracted fromblobs may not necessarily represent crystals. Because ofthis, the features extracted from those blobs are not useful.To solve this problem, we plan to investigate differentthresholding techniques. Our initial study shows that usingthe best thresholded image for feature extraction improvesthe classification performance.
We also plan to investigate hierarchical classification toobtain the decision model for the classification problem.
6. AcknowledgementThis research was supported by National Institutes of
Health (GM090453) grant.
References[1] M. L. Pusey, Z.-J. Liu, W. Tempel, J. Praissman, D. Lin, B.-C.
Wang, J. A. Gavira, and J. D. Ng, “Life in the fast lane for proteincrystallization and x-ray crystallography,” Progress in Biophysics andMolecular Biology, vol. 88, no. 3, pp. 359 – 386, 2005.
[2] C. A. Cumbaa, A. Lauricella, N. Fehrman, C. Veatch, R. Collins,J. Luft, G. DeTitta, and I. Jurisica, “Automatic classification ofsub-microlitre protein-crystallization trials in 1536-well plates,” ActaCrystallographica Section D: Biological Crystallography, vol. 59,no. 9, pp. 1619–1627, 2003.
[3] C. Cumbaa and I. Jurisica, “Automatic classification and patterndiscovery in high-throughput protein crystallization trials,” Journalof structural and functional genomics, vol. 6, no. 2-3, pp. 195–202,2005.
[4] I. M. Berry, O. Dym, R. Esnouf, K. Harlos, R. Meged, A. Perrakis,J. Sussman, T. Walter, J. Wilson, and A. Messerschmidt, “Spine high-throughput crystallization, crystal imaging and recognition techniques:current state, performance analysis, new technologies and future as-pects,” Acta Crystallographica Section D: Biological Crystallography,vol. 62, no. 10, pp. 1137–1149, 2006.
[5] S. Pan, G. Shavit, M. Penas-Centeno, D.-H. Xu, L. Shapiro, R. Ladner,E. Riskin, W. Hol, and D. Meldrum, “Automated classification ofprotein crystallization images using support vector machines withscale-invariant texture and gabor features,” Acta CrystallographicaSection D: Biological Crystallography, vol. 62, no. 3, pp. 271–279,2006.
[6] M. J. Po and A. F. Laine, “Leveraging genetic algorithm and neuralnetwork in automated protein crystal recognition,” in Engineeringin Medicine and Biology Society, 2008. EMBS 2008. 30th AnnualInternational Conference of the IEEE. IEEE, 2008, pp. 1926–1929.
[7] M. Sigdel, M. L. Pusey, and R. S. Aygun, “Real-time protein crystal-lization image acquisition and classification system,” Crystal GrowthDesign, vol. 13, no. 7, pp. 2728–2736, 2013.
[8] K. Saitoh, K. Kawabata, and H. Asama, “Design of classifier to auto-mate the evaluation of protein crystallization states,” in Robotics andAutomation, 2006. ICRA 2006. Proceedings 2006 IEEE InternationalConference on. IEEE, 2006, pp. 1800–1805.
[9] G. Spraggon, S. A. Lesley, A. Kreusch, and J. P. Priestle, “Com-putational analysis of crystallization trials,” Acta CrystallographicaSection D: Biological Crystallography, vol. 58, no. 11, pp. 1915–1923, 2002.
[10] C. A. Cumbaa and I. Jurisica, “Protein crystallization analysis on theworld community grid,” J Struct Funct Genomics, vol. 11, no. 1, pp.61–9.
[11] J. Hung, J. Collins, M. Weldetsion, O. Newland, E. Chiang, S. Guer-rero, and K. Okada, “Protein crystallization image classification withelastic net,” in SPIE Medical Imaging. International Society forOptics and Photonics, 2014.
[12] K. Saitoh, K. Kawabata, S. Kunimitsu, H. Asama, and T. Mishima,“Evaluation of protein crystallization states based on texture in-formation,” in Intelligent Robots and Systems, 2004.(IROS 2004).Proceedings. 2004 IEEE/RSJ International Conference on, vol. 3.IEEE, 2004, pp. 2725–2730.
[13] X. Zhu, S. Sun, and M. Bern, “Classification of protein crystallizationimagery,” in Engineering in Medicine and Biology Society, 2004.IEMBS’04. 26th Annual International Conference of the IEEE, vol. 1.IEEE, 2004, pp. 1628–1631.
[14] C. B. Barber, D. P. Dobkin, and H. Huhdanpaa, “The quickhullalgorithm for convex hulls,” ACM Transactions on MathematicalSoftware (TOMS), vol. 22, no. 4, pp. 469–483, 1996.
[15] J. Canny, “A computational approach to edge detection,” PatternAnalysis and Machine Intelligence, IEEE Transactions on, no. 6, pp.679–698, 1986.
[16] P. D. Kovesi, “MATLAB and Octave functions forcomputer vision and image processing,” CETSEEentre forExploration Targeting, School of Earth and Environment,The University of Western Australia, available from:<http://www.csse.uwa.edu.au/∼pk/research/matlabfns/>.
[17] C. Harris and M. Stephens, “A combined corner and edge detector.”in Alvey vision conference, vol. 15. Manchester, UK, 1988, p. 50.