Classical and Modern Methods in Caries Epidemiology · 2018-09-25 · Classical and Modern Methods...
22
7 Classical and Modern Methods in Caries Epidemiology M. Larmas, H. Vähänikkilä, K. Leskinen and J. Päkkilä University of Oulu Finland 1. Introduction In epidemiological research the focus is on the occurrence, causes, and modifying factors of diseases and thereby their prevention. During the last decades, the epidemiology of dental caries has not dealt with the prevalence of the disease, but is measuring the past and present caries experience in terms of past and present treatment need, which does not follow the practices in epidemiology. Therefore it would be important that dental research returns the rules of (medical) epidemiology. The World Health Organization [WHO] has recommended that the International Statistical Classification of Diseases and Related Health Problems [ICD] must be followed in diagnoses by both physicians and dentist. Because of this legislation all dental patients must have one primary diagnosis and when necessary, one or multiple secondary diagnoses. The primary diagnosis is not necessarily the most serious disease but it only means that the disease which needs most treatment in time or equipment during the emergency visit or normal treatment period. This practice is meant only for statistical purposes in dental care, and therefore, represents some overview of the prevalence of diseases in that community. The same system has been used by dentists in the secondary care level in hospitals or other institutes. This WHO´s decision recombined medical and dental professions. At the same time it also revealed that some diverse practices occurred in the use of certain common terms (for example disease prevalence) or principles of making diagnoses between dentistry and medicine. WHO determines dental caries in two different ways as discussed recently (Larmas, 2010a): in ICD it is a disease (WHO, 1977, 1992), and in oral health surveys as a process (WHO, 1997), assessing also the treatment need at the same time. Early epidemiological surveys on dental caries assessed number of persons suffering from the disease, thus, following the normal medical practice (Morelli, 1924).The aim of this review is to shed light on these diagnostic or assessment practices for epidemiological purposes. 2. Diagnosis of dental caries and caries assessment 2.1 Caries diagnosis As a disease dental caries is determined in the classifications of diseases [ICDs]. They are systematic classifications of diseases, subject to agreement by governments. They are widely used for national mortality and morbidity statistics. The diseases as described verbally are about the same in different revisions of the ICDs, but their codes vary. The codes of the www.intechopen.com
Transcript of Classical and Modern Methods in Caries Epidemiology · 2018-09-25 · Classical and Modern Methods...

7
Classical and Modern Methods in Caries Epidemiology
M. Larmas, H. Vähänikkilä, K. Leskinen and J. Päkkilä University of Oulu
Finland
1. Introduction
In epidemiological research the focus is on the occurrence, causes, and modifying factors of diseases and thereby their prevention. During the last decades, the epidemiology of dental caries has not dealt with the prevalence of the disease, but is measuring the past and present caries experience in terms of past and present treatment need, which does not follow the practices in epidemiology. Therefore it would be important that dental research returns the rules of (medical) epidemiology. The World Health Organization [WHO] has recommended that the International Statistical Classification of Diseases and Related Health Problems [ICD] must be followed in diagnoses by both physicians and dentist. Because of this legislation all dental patients must have one primary diagnosis and when necessary, one or multiple secondary diagnoses. The primary diagnosis is not necessarily the most serious disease but it only means that the disease which needs most treatment in time or equipment during the emergency visit or normal treatment period. This practice is meant only for statistical purposes in dental care, and therefore, represents some overview of the prevalence of diseases in that community. The same system has been used by dentists in the secondary care level in hospitals or other institutes. This WHO´s decision recombined medical and dental professions. At the same time it also revealed that some diverse practices occurred in the use of certain common terms (for example disease prevalence) or principles of making diagnoses between dentistry and medicine. WHO determines dental caries in two different ways as discussed recently (Larmas, 2010a): in ICD it is a disease (WHO, 1977, 1992), and in oral health surveys as a process (WHO, 1997), assessing also the treatment need at the same time. Early epidemiological surveys on dental caries assessed number of persons suffering from the disease, thus, following the normal medical practice (Morelli, 1924).The aim of this review is to shed light on these diagnostic or assessment practices for epidemiological purposes.
2. Diagnosis of dental caries and caries assessment
2.1 Caries diagnosis
As a disease dental caries is determined in the classifications of diseases [ICDs]. They are systematic classifications of diseases, subject to agreement by governments. They are widely used for national mortality and morbidity statistics. The diseases as described verbally are about the same in different revisions of the ICDs, but their codes vary. The codes of the
www.intechopen.com

Oral Health Care – Pediatric, Research, Epidemiology and Clinical Practices
130
ninth revision (ICD-9, WHO, 1977) are presently used in the USA, the tenth (ICD-10, WHO, 1992) in most other countries. ICD-10 is revised periodically. The recommended use of ICD states that all diagnoses must be recorded at the appropriate
level, meaning that when the disease codes are used, they are used as three, four, or five
characters levels. Of the licensed health care personnel, who has the right to make
diagnoses, physicians are educated to make the caries diagnosis at three character level i.e.
“dental caries” (K02 in ICD-10 or 521 in ICD-9) whereas dentists must use the four character
level, like “caries of cementum” (K02.2 in ICD-10).
Another recommendation in the use of ICD is the fact that diseases needing treatment only
should be recorded in the list of diagnoses. Thus, in the case of “caries limited to enamel”
(coded at four character level K02.0, ICD-10) it should be diagnosed only when needing
intervention (not only treatment by a restoration but also, for example, fluoride or sealing
treatments), otherwise this diagnosis is omitted from the list of diagnoses in the record.
In the case a dentist makes a special diagnosis of caries like “feeding bottle caries”, or “caries
due to hyposalivation”, both diseases should be classified into the ICD category “other
specified dental caries”, the latter needing additionally a secondary ICD diagnosis as
“disturbances of salivary secretion” or shortly “hyposecretion”.
2.2 Caries assessment
In Oral Health Surveys (WHO, 1997) dental caries is determined “decayed” (code 1 for permanent teeth, code A for primary teeth) or “filled, with decay” (codes 2 or B, respectively). The “decay” codes caries at the dentinal level of involvement, requiring evidence of cavitations to record it. The F-component is classified as “filled, no decay” (codes 3 and D), and the M-component as “missing as a result of caries” under the age of 30 years and in older patient, the M is “missing, any other reason”. These tooth-specific recordings are only tooth-specific diagnoses, but real diagnoses commit patients as a whole and therefore the real diagnosis of the patient is “dental caries in one or multiple teeth”, as will be discussed in detail later. When caries prevalence rose to close hundred percent in the population (even before the adulthood), more accurate measures of caries experience were needed. Attempts were made to measure mean number of teeth affected by caries in populations, until a standardized index of decayed (D), missing (M) or filled (F) teeth was defined (Klein et al., 1938). Originally it was meant to inform caries “prevalence and treatment need” in elementary school children, later its use was expanded to describe past and present caries experience also in adults. The DMF index is still used in high number of scientific articles, which underlines its leading role in the present caries research. However, the term caries experience underlines that it does not describe caries prevalence in the epidemiological sense. The discrepancy between caries diagnosis and caries assessment is vanished in practice, because caries, termed “decay” in oral health surveys has reached the level of caries (=dentine) needing restoration and all its previous stages ( white or chalky spots; discolored or rough spots; stained pits or fissures etc.) are omitted from the list of diagnoses in ICD (WHO, 1992) or are recorded as “sound” in oral health surveys (WHO, 1997). A relatively new system for caries detection and assessment has lately developed [ICADS] to facilitate caries epidemiology, research and appropriate clinical management to grapple with some of the problems of caries assessment (Pitts, 2004). This system records both enamel and dentine caries and explores the measurement of caries activity (Pitts, 2004).
www.intechopen.com
Classical and Modern Methods in Caries Epidemiology
131
However, ICADS does not follow the normal epidemiological practice in that sense that the patient has one or multiple diseases in one or multiple organs, which means that the number of patients (not that of teeth) is the number of cases in the statistics. A patient with carious lesions in three teeth is not three times more sick than a patient with caries in one tooth, both are simply “carious”, whereas subjects with multiple restorations or dental implants are “healthy”in the ICD. The same concerns any cancer: a patient with for example an epithelial cancer in any organ with multiple metastases is simple one “cancer” patient, the number of diseased organs or metastases does not change the diagnosis, nor the mean number of lesions or metastases in the population is counted. The severity and treatment need of the patient will increase with the number of lesions, but not the number of that disease.
3. Prevalence of a disease
In epidemiology, prevalence of a disease may be defined as the proportion of population that has disease at a specific point in time (Rothman and Greenland, 1988). Textbooks in epidemiology use also terms “point prevalence”, “prevalence proportion” and “prevalence rate”, meaning the same thing. The prevalence pool is the subset of the population with the disease (Rothman and Greenland, 1998). Lifetime prevalence is the proportion of a population that has had the disease in question at some time during their lives. In epidemiology a subject is either healthy or has one or numerous different diseases. The prevalence(s) of disease(s) varies in a community, as does the number of lesions / restorations / fractures in a patient, but one patient has one ICD-category of dental caries in one or multiple teeth. Then the single patient with dental caries increases dental caries prevalence by one in the population, or else, increases first maxillary and mandibular molar caries cases by four (if all first molars have caries). In the latter case, the caries prevalence is one (patient) with four carious lesions in the first molars, or else one patient with caries in the first maxillary and mandibular, right and left molars, i.e. four different caries diseases, which, however, does not follow the ICD. In medicine/dentistry, for example, there are two possible diagnostic approaches when the locations of diseased organs are studied. “General diseases” like “osteoporosis” may concern the whole skeleton although some parts of the skeleton are more vulnerable for other osteoporosis-connected diseases, like fractures of bones. Some bones may have fractures more frequently than the other bones of the same osteoporotic patient. The ICD sub-classification of “osteoporosis with fractures” is based on its aetiology, like “postmenopausal”, “malabsorption”, etc., not the location or number of fractured bones. Dental caries (as a disease in enamel, dentine etc.) can be classified similarly as a “general disease”, although some teeth/surfaces are more vulnerable than others, and patients are caries prone or resistant. “Local diseases” like injuries or fractures of bones/teeth occur in certain sites of the body due to external reasons. Fractures of skull and facial bones, maxilla and mandible, fractures of teeth, etc. are examples of local diseases in ICD. Each bone or tooth has its own fracture, or even many fractures, and the subject may have multiple fractures. Dental caries can be classified also as a “local disease”. In this case caries in canines is not the same disease which commits caries in molars, although the aetiology is (about) the same, like is the aetiology of fractures. ICD classifies dental caries as a general disease, like osteoporosis, and one patient with caries may have carious lesions in one or multiple teeth. This results in a hierarchical nature
www.intechopen.com

Oral Health Care – Pediatric, Research, Epidemiology and Clinical Practices
132
of the disease data, in which carious teeth are clustered within patients. This complicates the statistical analysis of the observed differences of caries in cohorts in epidemiological or experimental studies. This may be avoided when each tooth, primary or permanent, is treated as having its own “caries” resulting in a possibility of 32 different caries onsets in permanent and 20 in primary teeth, or else, even five more lesions on different surfaces of each tooth (Larmas et al., 1995). However, this type of classification is not possible following the ICD in the disease prevalence studies, but it is possible when the severity and treatment need of the disease is determined. We may count that each tooth have five surfaces (incisal edges of incisors and cuspal tips of canines being a surface), though many epidemiological surveys count each tooth having different numbers of “missing” surfaces, basing on their mean caries occurrence values. All dentists agree with our “anatomical” system when counting the treatment fees, and therefore we recommend that practice also in research.
4. Epidemiological research
In epidemiology, the focus is on the occurrence of disease. If the subject has a disease or diseases, he/she is a “case” in statistics, a “patient” in medicine/dentistry, with the rest of the population being healthy (Rothman and Greenland, 1998). Both ICD-10 and-9 (the latter with different codes) determine different types (enamel, dentine, cementum etc.) of dental caries as diseases, which may occur in one or multiple locations determining thereby the prevalence of these diseases in patients (not in teeth) in that population. If caries commits many teeth, the disease is more severe, but still the same “single” disease in that patient. This medical/dental principle is followed only rarely in dental statistics: each tooth or restoration is treated as its own “case”, which does not follow the principles of clinical epidemiology where the patient is always the “case” (=N). Another possibility, which, however, does not follow the present ICD system, is to consider each carious tooth/surface as its own disease in the patient. This quantitative approach is followed when the efficacy of caries preventive measures is scientifically (meaning by calibrated examiners) determined in caries research, but should not be followed when the possible reduction of caries prevalence after a clinical trial is determined.
5. Evidence-based [EBD] vs. practice-based dentistry [PBD]
Systematic clinical reviews demonstrating causality normally evolve from laboratory studies through animal studies to case series and thereafter to controlled clinical trials (Niederman and Leithch, 2006). These studies demand strict scientific rules (good laboratory practice, good clinical practice, cross-over study design etc.) for providing information for each of these steps. The evidence-based approach to create knowledge may not be enough: translational research (know how) is also needed in addition to the classical laboratory and clinical studies to show how science works in practice (Niederman and Leithch, 2006, Mjör, 2008, Larmas, 2010b). Same statistical methods are always used in analyzing the EBD and PBD study results, the research protocols having only different aims and principles. All drugs are carefully tested applying EBD protocol before the registration for use, their efficacy should be very high, often almost 100%, or at least significantly more effective than the older ones. Their practical effectiveness is another issue: Is a drug with an efficacy of 100 % to cure the disease truly
www.intechopen.com
Classical and Modern Methods in Caries Epidemiology
133
100% effective if it is used as prescribed only by 50 % of the patients? Restoration certainly eliminates caries, but is not effective when not used. The real effectiveness of the use of an effective drug or treatment in everyday practice can be studied applying PBD study design. Because non-calibrated clinicians (in this case also examiners) are providing information on the efficacy of different treatments in practice, the possibility of use the huge longitudinal study material with sophisticated statistical methods created in the course of normal dental practice would provide more statistical power in analyzing possible differences between different treatment protocols with the same effective treatment, and thereby the effectiveness in real life conditions. When the research protocol is not standardized and non-calibrated researchers are conducting them, more sophisticated statistical methods can overrule some of the flaws in calibration and standardization.
6. Recording events in the dentition
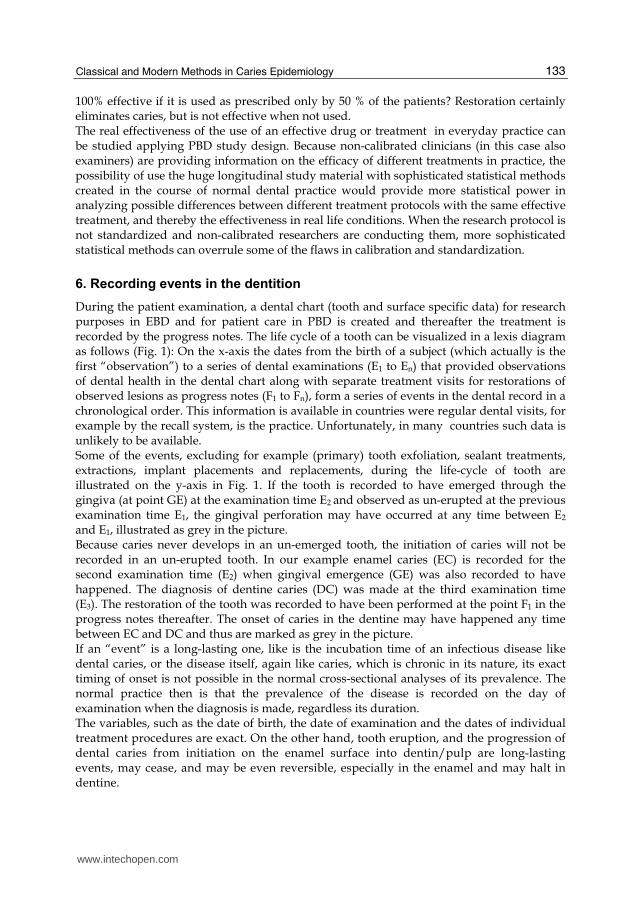
During the patient examination, a dental chart (tooth and surface specific data) for research purposes in EBD and for patient care in PBD is created and thereafter the treatment is recorded by the progress notes. The life cycle of a tooth can be visualized in a lexis diagram as follows (Fig. 1): On the x-axis the dates from the birth of a subject (which actually is the first “observation”) to a series of dental examinations (E1 to En) that provided observations of dental health in the dental chart along with separate treatment visits for restorations of observed lesions as progress notes (F1 to Fn), form a series of events in the dental record in a chronological order. This information is available in countries were regular dental visits, for example by the recall system, is the practice. Unfortunately, in many countries such data is unlikely to be available. Some of the events, excluding for example (primary) tooth exfoliation, sealant treatments, extractions, implant placements and replacements, during the life-cycle of tooth are illustrated on the y-axis in Fig. 1. If the tooth is recorded to have emerged through the gingiva (at point GE) at the examination time E2 and observed as un-erupted at the previous examination time E1, the gingival perforation may have occurred at any time between E2 and E1, illustrated as grey in the picture. Because caries never develops in an un-emerged tooth, the initiation of caries will not be recorded in an un-erupted tooth. In our example enamel caries (EC) is recorded for the second examination time (E2) when gingival emergence (GE) was also recorded to have happened. The diagnosis of dentine caries (DC) was made at the third examination time (E3). The restoration of the tooth was recorded to have been performed at the point F1 in the progress notes thereafter. The onset of caries in the dentine may have happened any time between EC and DC and thus are marked as grey in the picture. If an “event” is a long-lasting one, like is the incubation time of an infectious disease like dental caries, or the disease itself, again like caries, which is chronic in its nature, its exact timing of onset is not possible in the normal cross-sectional analyses of its prevalence. The normal practice then is that the prevalence of the disease is recorded on the day of examination when the diagnosis is made, regardless its duration. The variables, such as the date of birth, the date of examination and the dates of individual treatment procedures are exact. On the other hand, tooth eruption, and the progression of dental caries from initiation on the enamel surface into dentin/pulp are long-lasting events, may cease, and may be even reversible, especially in the enamel and may halt in dentine.
www.intechopen.com
Oral Health Care – Pediatric, Research, Epidemiology and Clinical Practices
134
Fig. 1. Schematic presentation of the life cycle of a tooth (y-axis) as a function of time (x-axis) There are exact dates separately for clinical examinations, E1, E2…En (dental chart) and treatment visits (progress notes), F1, F2…Fn. The eruption process is a long-lasting event and marked as grey in the picture. Carious process is also long lasting event (two grey areas)
Tooth eruption from the time of emergence into the oral cavity to full occlusion could last as long as 5.5 years for permanent canines and 2.6 years for the first permanent molar teeth (Pahkala et al., 2002). The estimate of the average times from the stage of incipient lesion to the clinical caries lesion was 18 + 6 months in children (Parfitt, 1956). Therefore, observations in dental record cannot give an accurate picture of the exact date of tooth emergence or the exact date of the onset of carious lesion on enamel surface but certain time limits can be determined retrospectively from the dental charts and progress notes of the record (Bogaerts et al., 2002).
7. Cross-sectional and longitudinal studies of mean prevalence or -index values
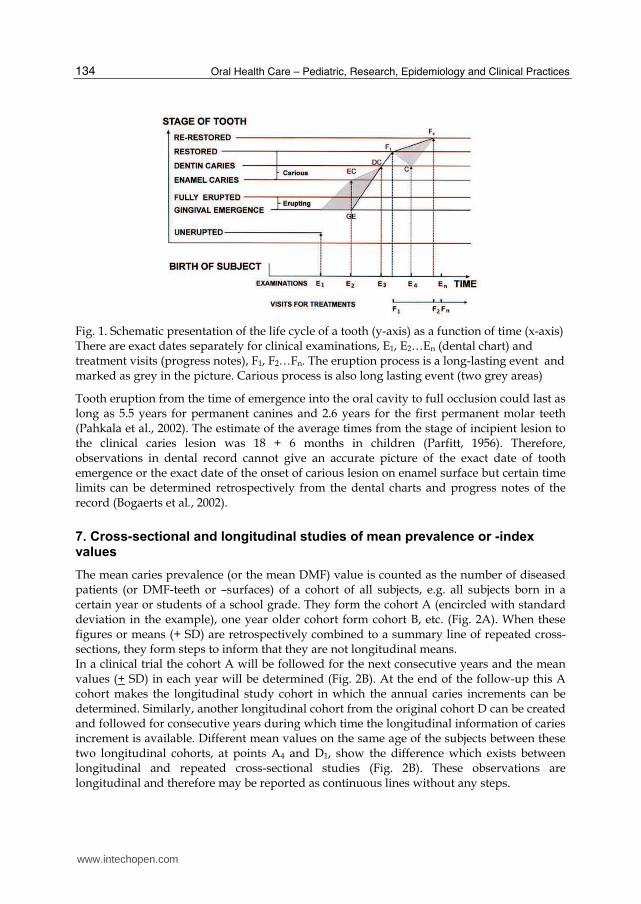
The mean caries prevalence (or the mean DMF) value is counted as the number of diseased patients (or DMF-teeth or –surfaces) of a cohort of all subjects, e.g. all subjects born in a certain year or students of a school grade. They form the cohort A (encircled with standard deviation in the example), one year older cohort form cohort B, etc. (Fig. 2A). When these figures or means (+ SD) are retrospectively combined to a summary line of repeated cross-sections, they form steps to inform that they are not longitudinal means. In a clinical trial the cohort A will be followed for the next consecutive years and the mean values (+ SD) in each year will be determined (Fig. 2B). At the end of the follow-up this A cohort makes the longitudinal study cohort in which the annual caries increments can be determined. Similarly, another longitudinal cohort from the original cohort D can be created and followed for consecutive years during which time the longitudinal information of caries increment is available. Different mean values on the same age of the subjects between these two longitudinal cohorts, at points A4 and D1, show the difference which exists between longitudinal and repeated cross-sectional studies (Fig. 2B). These observations are longitudinal and therefore may be reported as continuous lines without any steps.
www.intechopen.com

Classical and Modern Methods in Caries Epidemiology
135
Fig. 2. Principles of trans-sectional (A) and longitudinal (B) studies as well as survival analysis (C) A.Repeated cross-sections of the means (+ SD) of a group of subjects (e.g. born on year A, B, C or else, for example a school grade A, B, C etc) form the mean prevalence or index curve. B. The group A is followed for three consecutive years from A1 to A4 and group D is followed for two years from D1 to D3. The difference between step A4 and D1 shows the difference between longitudinal and trans-sectional analyses. C. All observations of the examinations of age cohorts (2A) and longitudinal (dotted lines) study groups (2B) are combined as a summary survival estimate (solid line) as long as information is available. There are numerous statistical methods to model this
www.intechopen.com
Oral Health Care – Pediatric, Research, Epidemiology and Clinical Practices
136
When the examinations of the cohorts A, B, C, D etc. from the cross-section (Fig. 2A) and the examinations of the two longitudinal cohort studies (Fig. 2B) are combined, a summary line can be created applying similar methods which are used in survival analysis: each individual is indicated by lines or points as long as information is available, from one day to several years. These lines and points can be combined to mean values per subject at different ages. This system has been recently used in Finland where digital patient records have been used for more than ten years in many health centres resulting in a digital dataset with annual examinations with many patients but only with one examination with some other patients. An automatic data-mining system was develop and used for the determination of mean DS, MS, and FS, for all ages with varying number of subjects during the follow-up (Korhonen et al., 2007). Mean or median values of the prevalence of diseases have certain pros and cons: they are very simple and commonly used. But in caries research problems arise. Caries is an infectious but chronic disease and therefore it is suitable for an analysis of a cross-section of a lengthy time period. But on the other hand, its later forms are irreversible and the body itself can not cure those forms. Treatment by a dentist does this, but then the disease disappears even from the ICD, but not from dental indices, unless used separately for each parameter (Korhonen et al., 2007).
8. Principles of time to event [TTE] analyses
When the dots and lines (Fig 2A, and 2B) are used as a dataset for time to event (TTE) analyses, they can also be combined with numerous survival analysis methods into a summary curve (Fig. 2C). Survival analysis system as such is only a complimentary to the traditional ones and in a way more accurate statistical method for the prediction of events and analysis of statistical differences between cohorts. These methods can be used in analyzing the irreversible transitions from e.g. sound to (first) caries onsets, which covers mainly children and adolescents in practice, but also survival from first carious attack to second caries onsets of the same teeth, restorations, re-restorations and even the presence of tooth in the oral cavity, survival of restorations, crowns, bridges, implants etc, not shown in the picture. During last years the development of statistical methods has advanced so that many of the problems with the classical methods, like determining the mean and median values in groups of subjects with normal or skewed distributions or when (prospective) longitudinal cohort design is followed, the information of censored observations cannot be incorporated in the analysis, if traditional caries increment studies are conducted. In the latter case, the lost of subjects during the trial is the major problem, because it reduces the number of subjects and if there is a systematic pattern in who is lost it may bias the findings. Survival analysis system may provide tools to make the analyses more informative. To produce meaningful information of the survival time of a tooth or the whole dentition remaining caries-free, and how these vary between patients, or observing dentists, the standard methodology can be applied, like estimating the mean cumulative intensity curves of the events for each individual and/or for each tooth and surface. When the mean values are replaced by survival curves, this can lead to the problem of a large number of curves, one for each patient and/or each tooth/surface. A more compact and integrated picture is preferred for a group of teeth or patients. Fig. 3 represents an example of survival times of five different individual teeth or five different carious patients (A, B, C, D, E). Tooth emergence is recorded (interval censored) at
www.intechopen.com

Classical and Modern Methods in Caries Epidemiology
137
points of A1, B1, C1, D1, E1 and first caries attack (interval censored) by arrows at points A2, B2, C2, D2, E2 according to the chronological age. Tooth coded with A is emerged at A1 and diagnosed carious at A2, tooth coded with B from B1 to B2 . This leads to a mixture of lines with different slopes A1 – A2, B1 – B2 … one for each 32 permanent tooth or 160 for each permanent tooth surface. As stated earlier the latter figure follows the anatomy of a 5-surface tooth. This results in a group of lines for a subject. When the emergence times are combined together and marked as zero on the x-axis (tooth age), the picture is more clear because the starting point of the individual curves is the same and takes into account the large variation of the emergence times of permanent teeth (Fig. 3B).
Fig. 3. The principle of time to event analysis A. Survival measures the time between two events (y-axis). The first event may represent the emergence of the tooth and could be marked on the chronological age at points A1, B1, C1 D1 etc. The second event may represent caries, restoration, etc. and are marked with A2, D2, C2 etc. The picture shows e.g. that tooth B was erupted early but became carious late whereas the tooth E erupted late but became carious soon. This picture shows the chronological age-scale. B. When A1, B1, C1, D2, E1 are turned to the origin, the survival times can be represented as a function of tooth age. The shortest survival time is shown with the tooth E and the longest with the tooth B. C. The same events of different teeth (A2. B2…) as presented in Fig. 2A above are combined together as a cumulative curve of the subject. Because the time scale is the chronological age of the subject the timing of tooth emergence is also indicated although only the failure (caries) is shown in the cumulative curve. D. The same events of different teeth (A2, B2…) are combined together as a cumulative curve as a function of the tooth age. Note that the shapes of the curves of the same events are now different from the curve following the chronological age (3C)
www.intechopen.com

Oral Health Care – Pediatric, Research, Epidemiology and Clinical Practices
138
When these five lines of timing of caries onsets are combined as a cumulative summary curve for each carious tooth (or five patients with caries), a curve with five steps (one for each tooth/patient) is obtained as a function of chronological age (Fig. 3C) or tooth age (Fig. 3D). Although the caries onset curves describe the same five teeth of the same patient and event, or else, five different carious patients, the slopes of these curves vary and differ from each other. These summary lines represent the events in the chronological or tooth age. TTE of any tooth is the time from birth of the subject to the event in the chronological age-scale of the subject. When the age-scale is the “tooth age”, it is from tooth emergence into the oral cavity to the event. In our example of tooth life cycle, the time without enamel caries is zero in the tooth age scale (Fig. 1) because tooth emergence (GE) and enamel caries onset (EC) is observed at the second examination (E2) after the first examination (E1) when the tooth was recorded as unemerged. Time between the irreversible events can be statistically described as “survival times” between these two occasions. The statistical term “event” may mean the first appearance of a tooth into a mouth, which is also called “tooth emergence”. Biologically the real tooth “eruption” is the movement of tooth from its position in bone to full occlusion. For example, the eruption time of first permanent molars covers the time from birth to 11-12 years of age, but their tooth emergence time is their out-coming, around 7 years. Standard survival analysis requires independent data for significance testing. Because each tooth in the oral cavity is dependent on each other, independence is a special problem in dental research. In recent years it has been recognized that survival analysis could also be applied to dependent data, for example in repeated observations of the same individual (Aalen et al., 1995).
9. Survival analysis
9.1 Models of survival analysis
There are many types of models that have been used for survival analysis also in dental research, as discussed recently (Stephenson et al., 2010a). Some terms used in the context may still demand verbal description (statisticians give equations only): first (1) the survival function gives an estimate of the probability that the time of “death” is later than some specified time. The survival function is also called the survivor function or survivorship function in problems of biological survival, and the reliability function in mechanical survival problems. In the latter case, the methods of estimating survival functions are non-parametric in which no assumption is made about the underlying distribution, whether it is skewed (they are biased) or bell-shaped. A variety of methods (non-, semi-, and fully parametric) of survivorship analysis have been developed. Second (2) the hazard function is defined as the event rate at a certain time conditional on survival until the same time or later. Quantities derived from the survival distributions are (3) future lifetime at a given time is denoted by the time remaining until death. The expected future lifetime represents this. Survival models can be usefully viewed as (ordinary) regression models in which the response variable is time. However, computing the likelihood function (needed for fitting parameters or making other kinds of inferences) is complicated by the censoring. The likelihood function for a survival model, in the presence of censored data, is the joint
www.intechopen.com
Classical and Modern Methods in Caries Epidemiology
139
probability of the data given the parameters of the model. It is customary to assume that the data are independent given the parameters. Then the likelihood function is the product of the likelihood of each datum. It is convenient to partition the data into four categories: uncensored, left-censored, right-censored, and interval-censored, as will be discussed later. In the context of caries data analysis, the initial state, in addition to the birth of the subject, might represent un-erupted or sound tooth/surface in primary or permanent tooth, and the end state might represent a carious, exfoliated, restored, or extracted tooth/surface. Because oral cavity contains high number of primary and permanent teeth/surfaces, this results in clustering of data within children/subjects and thereby at least two different approaches in statistical survival analyses: (1) a subject specific time-dependent analysis tries to cover eventualities where units are subject to potential failure from multiple causes. This, however, results in quantification of caries in the individual and this, on the other hand, a variety of distributions of events in the oral cavity. (2) a tooth specific approach, in which a carious patient has different caries onsets in different teeth. Clustering is inherent in caries data, for example with surfaces clustered within teeth and teeth clustered within subjects. Many survival analyses also involve repeated observations of the same individual. Repeated observations on the same unit comprise a dependency in the same way that dependency arises through clustering. There are numerous statistical methods which take into account the dependence problem when caries is regarded as quantitative terms in the oral cavity as the research unit. When caries in each tooth is regarded as a different disease and comparisons between patients are performed between these individual teeth, some of the dependence problems are avoided, but a clinical problem arises from the fact that this approach does not follow the principles of ICD, because caries as a disease commits the dentition, not individual teeth. In short, survival analysis involves the modelling of time to event data; in this context, death or failure is considered an “event” in the survival analysis literature. The flexibility of a counting process is that it allows modelling multiple (or recurrent) events. This type of modelling fits very well in many situations (e.g. people can have caries multiple times even in the same teeth/surfaces, and restorations can be re-restored multiple times). The most important benefit of that system is the possibility of use retrospectively all the (huge) information available in real life conditions [PBD] and/or else problems due to loss of subjects during longitudinal trials [EPD].
9.2 Censoring in the statistical treatment
The observed timing of the event is not always exact which leads to “censoring” in the statistical analysis of longitudinal data (Lindsey and Ryan, 1998). Each subject is followed for a certain period of time, and the event must be censored if it did not occur at the completion of the follow-up or had happened before the follow-up. Though the term “censoring” has a negative meaning in the scientific sense, in statistics it only means that the observation time is not exact or that the event did not occur during the follow-up. If the tooth has already erupted or restored at the first examination, no exact date can be recorded for these events before that time. In statistical analyses such survival data are normally “left-censored”. If the observation period is terminated at certain point, the failure times of those teeth are “right-censored” after that. They may happen later but are not included in the analysis. If a series of examinations are conducted over a lengthy time “interval-censored” observations can be recorded as having occurred at the first
www.intechopen.com
Oral Health Care – Pediatric, Research, Epidemiology and Clinical Practices
140
examination following the event or alternatively, at the midpoint of the two last examinations (Aalen et al., 1995). Interval censored events are those that occur between two points. If the event is interpreted as having occurred at the first examination following the event, then information relating to the previous observation has been lost, and this lost of information may be significant. This approach is analogous to treating left-censored data as failures at the time of the first examination, which approach occurs in cross-sectional studies on the disease prevalence, or mean values of DMF-index. In a sense all caries related data cannot be left-censored as tooth emergence does not happen at birth. Interval censoring at the first examination after the event is the appropriate approach, unless the event of interest is tooth emergence itself. Also then, interval censoring to the first examination after age of two years for primary molars and after six years for any permanent teeth (but left censoring after age 8 years for incisors and first molars, and 14 years for the rest permanent teeth, excluding wisdom teeth) seems to be scientifically acceptable in that sense that clinical experience gives some limits for tooth emergence (and primary tooth exfoliation) which “window” can be taken into account in recording dental observations. Thus, all caries experience studies should be interval-censored on the day of examination as the onset of caries. The time between examinations affects the observed and real occurrence times. If the interval between examinations of sound-carious or unerupted-erupted events is about 1 year, interval censoring at the first examination after the event seems appropriate, so that if a tooth was unerupted at age 6 and emerged at age 7, the observed emergence time can be considered to be 7 years on that subject. However, the real event has happened any date between 6 and 7 years, the midpoint being 6 ½ years. Both 6 ½ and 7 years are very close to the date reported in textbooks. If the examination interval is one year, a deduction of six months should be performed in the interval censored date/data to obtain the most probable real date on the onset of the event. Interval censoring to that “most probable” date is commonly used for tooth emergence, but as we stated above, we recommend interval-censoring at the first examination after the event, because both tooth eruption and caries initiation are long-lasting events, and in this case the “relative truth” is closer than the “absolute truth” on the correct timing of caries initiation: If the examination interval is one year, in the determination of caries onset, a deduction of half a year should be performed both from the tooth emergence time and onset of caries. This deduction is unnecessary if caries onset is determined from the tooth emergence. Exfoliation or extraction of any primary or permanent tooth should result in right censoring of any event in these teeth after their exfoliation/extractions.
9.3 Patient specific failure intensities
The failure rate may vary between patients, but also between teeth, some having a high failure rate and others a lower one. For each patient or tooth an intensity of failure or hazard rate can be defined. To obtain a picture of the intensity, it is useful to estimate the cumulative intensity (cumulative hazard rate). The hierarchical nature of the caries data inside the oral cavity results in clustering within children and can be accounted for by formulating the model as performed recently by Stephenson et al. (2010a). Hierarchical model structures of analyzing caries data, in which surfaces are assumed to be nested within individuals, have been observed to be appropriate (Burnside et al., 2006).
www.intechopen.com

Classical and Modern Methods in Caries Epidemiology
141
The interpretation of these plots is that the intensities of failure can be estimated from the
slopes of the curves. Some of them rise/fall rapidly, (depending on whether they are drawn
upward or downward), indicating a high failure rate while others rise/fall more slowly,
indicating a lower failure rate. The plots for some individuals are flat, meaning that no
failures have been observed.
The direction of the curve depends on the function it represents and the data being
modeled, but mathematically the direction of the curve is insignificant. Because the hazard
function often increases but the survivor function decreases over time, the direction of
hazard rate is normally drawn upward, while survival function downward, with the
exception of the expected future lifetimes, which are normally drawn upward.
9.4 Survival analysis in evidence-based dentistry
The first study utilizing survival analysis methods by calibrated examiners is the classic
study of Carlos and Gittelsohn (1965). Their report was based on a clinical trial of children
aged 4-18 years at baseline and conducted in two towns in the state of New York, USA in
the 1940’s. They applied life table estimates of logarithmic failure intensities separately to
different teeth. Some of their results can be questioned: First, the follow-up time was
divided into four-month computational intervals, in which interval-censored occurrence
times were denoted to have taken place at the mid-points of the dental examination interval,
but left-censoring so that all permanent teeth that had erupted before the first clinical
examination, was conducted leaving only 2104 children out of 7400 to be analyzed in the
data set. This resulted in systematic biases (Härkänen et. al., 2002), because many caries-
prone teeth were left-censored. Since then, survival analysis methods have been applied to reanalyzing the longitudinal caries data in many other clinical trials, too (Hannigan et al., 2001, Hujoel et al., 2003, Baelum et al., 2003). All these large-scale time dependent analyses of caries data have employed fully parametric tooth-specific methods in permanent dentitions. Recently, multivariate multilevel parametric survival models were also applied at tooth surface level to the analysis of the sound-carious and sound-exfoliation transitions to which first and second primary molar surfaces were subject (Stephenson et al., 2010a). The highest rate of occurrence and lowest median survival times were observed to be associated with occlusal surfaces of children from poor socio-economic class in non-fluoridated areas. Survival analysis methods have also applied to the analysis of how rapidly dental caries progresses (Shwartz et al., 1984a,b) as also seen in prospective radiographic studies (Mejare et al., 1999) or oral health surveys by calibrated examiners (Leroy et al., 2005a,b). When more sophisticated survival analyses are conducted e.g. with clinical trials in which different variables and cofactors are determined in the EBD-fashion, multivariate survival methods, like the semiparametric Cox-regression are conducted. In these cases the variables and their impact and timing is carefully determined. In addition to the complexity of modeling multivariate survival data, the disease itself (dental caries) further complicates the analysis because of the causality. Fully parametric regression models are widely used for the sound- carious transitions inside
the oral cavity, where tooth surfaces are clustered within children, and such methods are
preferred in many caries data analyses (Hannigan et al., 2001, Baelum et al., 2003, Leroy et
al., 2005a,b, Stephenson et al., 2010). In particular for the interval-censored data, parametric
modeling is preferred to non-fully parametric models such as the Cox proportional hazards
www.intechopen.com

Oral Health Care – Pediatric, Research, Epidemiology and Clinical Practices
142
model (Leroy et al., 2005a), and parametric models may lead to more precise inferences than
those arising from semiparametric methods (Baelum et al., 2003).The log-logistic
distribution selected for the parametric competing risk models was parameterized in an
accelerated failure time setting and was found to describe caries data well in permanent
dentition (Hannigan et al., 2001).
Leroy et al., (2005a,b) used multivariate survival analysis for the identification of factors, like
caries in primary molars, with cavity formation of first permanent molars in a follow-up
study with the EBD-fashion. Stephenson et al (2010a) reported that socio-economic class,
fluoridation status and surface type (occlusal vs. all other) were found to be the strongest
predictors of caries in primary molars. They applied multilevel competing risks
methodology to identify factors associated with caries occurrence in the presence of
concurrent risk of exfoliation, but not the effect of different emergence times between the
first and second primary molars. The concurrent risk of exfoliation was shown to reduce
the distinction in survival experience between different types of surfaces and children in
different socio-economic class or fluoridation status. All these studies used multiple teeth
as indicators or predictors but Stephenson et al., (2010a) fund that clustering of data had
little effect on inferences of parameter significance. They also reported that treatment by
restoration was found to be significantly associated with survival with respect to
extraction, with survival rates of over 80% at 14 years, double those of untreated teeth
(Stephenson et al 2010b). However, only a few, if any, primary molars are in the oral
cavity on that age.
Is dental caries a general disease (=dental caries with cavities in different teeth is like osteoporosis with fractures in different bones) or a local disease like are fractures (due to external breaks) in different bones. If it is a “local disease”, it is a microbial disease in molars, incisors, canines, and/or in fissures, smooth surfaces, etc, perhaps by different microbes. If caries is a “general disease”, host factors (like salivary secretion rate, resistance of dentition to caries, and developmental status of different teeth) may be the primary aetiological factors. To compare these possibilities, sophisticated statistics may determine the modeling of the hazard function or the survivor function. Interpretation of the shapes of the curves may even help in the determining the nature of caries disease: general or local, which is not fully analyzed yet.
9.5 Survival analysis in practice-based dentistry
Today, the use of digital dental records, in which the observations are made on tooth surface level, and the interval of examinations is predetermined to be, for example, one year, automatically creates huge datasets, which can be used for prospective scientific analyses, too. In these datasets the problem is the registration of caries: it does not meet the requirement of calibrated observations though observations of especially amalgam restorations and missing teeth are very accurate, but unfortunately, the “past caries experience” leading to either restoration or extraction is, again, un-exact, because they are always conducted by uncalibrated examiners and they may change over time, as discussed previously (Larmas, 2010a). An example of this kind of arbitrary is the observation of Korhonen et al., (2009) who reported that practicing dentists (N= more than 100) found regularly significantly more carious lesions in their new patients than in their old patients (N= more than 100.000) after the age of 20 years during the 10-15 years follow-up time, which was the digital era of the
www.intechopen.com

Classical and Modern Methods in Caries Epidemiology
143
Finnish public dental. This difference between old and new patients was so distinct that even the mean values revealed it, but more sophisticated statistical methods are needed when the effect of various cofactors on un-calibrated caries assays are reliably analyzed. Nobody really knows how much the variation of caries diagnosis of new and old patients has effect on the present DMF values. The tooth-specific system has been used in longitudinal (retrospective) analyses of caries onsets as seen in normal dental records i.e. in PBD. In these studies one tooth (only) is treated as an indicator of dental health of that oral cavity and these teeth are compared to their counterparts in other subjects (Larmas et al., 1995, Virtanen and Larmas, 1995, Suni et al., 1998, Härkänen et al., 2000, Ollila and Larmas, 2007). All these studies used the non-parametric Kaplan-Meier method or Bayesian analysis for comparing the tooth-specific survival data. The non-parametric methods have been used for the determination of the survival time of each tooth remaining caries-free, either from the tooth emergence (Virtanen and Larmas, 1995, Suni et al., 1998) or from the birth of the subject up to 20 years of age (Leskinen et al., 2008a). The results show that onset of caries occurs immediately after tooth emergence in first and second molars, equally on left and right sides (probably indicating that caries commits these two molar teeth at the same time on the left and right sides), but caries onsets on maxillary and mandibular molars differ (significantly), mandibular molars being more caries prone. All canines and mandibular incisors do not commit caries under 20 years of age (Korhonen et al., 2003), whereas maxillary incisors and all premolars commit caries, but only some years (termed lag phase) after the tooth emergence (Virtanen and Larmas, 1995). A summarized curve of teeth erupting during the first and second phases of tooth emergence is also obtained in order to reveal if carious prone circumstances exist during the whole transitional phase of permanent tooth eruption. Teeth that emerged at the first transitional phase (incisors and first molars) at 6 – 8 yrs of age may have different shapes of survival curves than those teeth that emerge during the second mixed dentition period (premolars and second molars) four-five years later (Korhonen et al., 2003). This explains why the DMF-index ages of the WHO are 12 years old (end of the first mixed dentition period), 15 years (end of second mixed dentition period), and in adults, but in the latter case with a very large age scales, 35-55, and 65-74 years (WHO, 1997). Comparison on caries onsets in sealed and unsealed fissures revealed that the onset of caries in sealed fissures was less than that of unsealed molars, but not in premolars, and sealing of first molars of very caries active subjects (caries in first permanent molars before age 8 years) was not enough for the prevention of caries in other (non-sealed) first molars, but restoration was performed in these unsealed molars before age 10 years (Leskinen et al., 2008b). The variation of intensities between patients can be analyzed by means of the “frailty” type model also in non-parametric models (Clayton and Cuzick, 1985). The intensity of frailty of a particular individual can be determined by a frailty or mixing variable that is a random variable for the population of individuals. Hence any given individual has a specific frailty. Those with a large value have a high rate of failure (they are caries prone) while those with a small value have a small rate of failure (are caries resistant). The idea is that individuals or even different tooth types may have different frailties, and caries prone/active subjects/teeth will have more caries than caries resistant. Härkänen et al., (2000) applied Bayesian analysis and frailty model so that the baseline
intensity functions were modeled non-parametrically, and the frailty component was
www.intechopen.com
Oral Health Care – Pediatric, Research, Epidemiology and Clinical Practices
144
introduced by using cross-validation techniques by assuming a hierarchical gamma prior
especially to find the ages at which the intensity model can provide better predictions than
the simple models using DMFS-index values.
Later it appeared that it was necessary to relax the time-independence assumption of the
individual frailties due to changes of habits related to oral health and oral environment,
presence vs. absence of open cavities which factors can affect the infection process, and
changes in the ways of actions of dentists who treated the patients (Härkänen et al., 2000).
They observed that the most difficult age interval appeared to be from 8 to 10 years and they
believed that the most obvious reason for that is the fact that first molars erupt around 7
years and the high risk surfaces of these teeth are soon after their emergence, and therefore
very few surfaces of high risk are left after age 8 years. This novel observation contradicts
that textbook information by Carlos and Gittelsohn (1965) that molar teeth (as most other
teeth) are most vulnerable to caries 2- 2½ years after tooth emergence, which probably is
due to the heavy left-censoring of the data as discussed before.
9.6 Advantages of survival analysis
As Hannigan (2004) stated in her excellent review of TTE methods of the use of survival
time as the outcome measure in caries, the additional statistical system provides an
approach that can be understood easily by everyone. She stated that the most common
approaches to modeling multivariate survival data scientifically include: 1) using the time to
the first event in the patient as the survival time while ignoring the multiplicity, 2)
conditional models, such as the frailty model, which include a random per-subject effect,
and 3) the marginal models approach.
When the methodology proposed here is either subject or tooth (surface) based, it uses all
the data collected during the clinical treatment of the patient during his/her lifetime in the
PBD, or calibrated data in clinical trials or prevalence studies [EBD]. It includes data
collected at the clinical examinations and data from subjects in intermediate examinations as
long as the subjects are visiting that dental office or attended the trial, but censoring can be
accounted, too. The results of the analysis are easily interpreted with the use of survival
curves and median survival times.
Survival modeling has mainly used in the renewed statistical treatment of the findings of
previous caries trials, the results showing that the differences existed also when using more
sophisticated survival analysis. Hujoel et al., (2003) established the benefits of xylitol with
Poisson regression models and Hannigan et al., (2001) who reanalyzed the effect of diet and
tooth brushing habits by the log-logistic distribution selected for the parametric competing
risk models, showed a good fit to the caries data. She concluded that the marginal model
approach may be more suitable than the frailty model for multivariate survival data from
caries clinical trials, since most of the source of variability is due to different anatomic
susceptibilities of the tooth surfaces (caries may be regarded as a local disease in different
teeth) rather than to the specific subject – specific frailty (caries is a general disease in caries
prone subjects, like is osteoporosis with fractures).
Computationally, the marginal model approach is easier to implement with standard
software packages.
The results of sophisticated TTE studies on caries onsets in different teeth can be
summarized: caries commits erupting molar teeth especially immediately after tooth
www.intechopen.com

Classical and Modern Methods in Caries Epidemiology
145
emergence (even in months), all other teeth have a “lag-phase” of several years after their
emergence (Virtanen and Larmas, 1995), the length of which in all canines and mandibular
incisors is not known in any country, however, more than 15 years. Is the different behavior
of individual teeth due to their different time independent “frailties” and/or must the time-
independence of the individual frailties relaxed so that teeth during primary dentinogenesis
have different “frailty” than the same teeth during the secondary dentinogenesis. In this
case the statistical “frailty” may be connected to the biological “young” odontoblast versus
“old” odontoblast context, or odontoblast/ odontocyte terminology, as discussed recently
(Larmas, 2008).
The survival analysis is usually time consuming and the most modern frailty-based
approach supplemented with empirical estimates demands plenty of computer capacity,
and is thus suitable for scientific analyses of longitudinal clinical trials in evidence based
dentistry [EBD]. A simplified empirical approach for the determination of lifetime of sound
tooth and tooth surfaces should be developed for the clinical practice [PBD], which could be
fully automatically been performed when digital dental records are available. For that
purpose either subject-specific or tooth-specific approach seems appropriate from the
statistical point of view. When the cumulative values are used (separately for D, M, or F)
survival analysis principles (instead of dividing the subjects afterwards into age cohorts) are
recommended for counting the means of the different dental index values of the subjects as
a function of age fully automatically from the digital dental records (Korhonen et al., 2007)
or survival of teeth caries-free in different health centres (Korhonen et al., 2003). Thereby
modern TTE analyses have a link to previous epidemiological observations on mean and
median values as well as results of clinical trials.
10. Conclusions
The most serious problem in caries epidemiology today is the use of certain index values,
which try to combine (1) the past and present at the same time, which is impossible, (2) treat
dental caries, but also restorations and extractions as “diseases” due to caries, which is also
impossible , and (3) try to determine the seriousness of the disease inside the patient in
quantitative terms, all of which procedures do not follow the practices in epidemiology:
subjects are either healthy or have one or many different diseases, but never many diseases
with the same ICD-classification. This dental practice has left the real caries prevalence un-
determined all over the world, though mean DMF-index values are reported worldwide in
thousands of publications.
11. References
Aalen OO, Bjertness E, Sonju T. (1995). Analysis of dependent survival data applied to lifetimes and amalgam fillings. Stat Med;14:1819-1827.
Baelum V, Machiulskiene V, Nyvad B, Richards A, Vaeth M. (2003). Application of survival analysis to carious lesion transitions in intervention trials. Community Dent Oral Epidemiol;31:252-260.
Bogaerts K, Leroy R, Lesaffre E, Declerck D.(2002). Modelling tooth emergence data based on multivariate interval-censored data. Stat Med ; 21:3775-3787.
www.intechopen.com
Oral Health Care – Pediatric, Research, Epidemiology and Clinical Practices
146
Burnside G, Pine CM, Williamson PR (2006). Statistical aspects of design and analysis of clinical trials for the prevention of caries. Caries Res; 40:360-365.
Carlos JP, Gittelsohn AM. Longitudinal studies of the natural history of caries – II.( 1965). Arch Oral Biol;10:739-751.
Clayton D and Cuzick J (1985). Multivariate generalizations of the proportional hazards model (with discussion). J Royal Stat Soc Ser A;148:82-117.
Espelied I, Treit AM, Mejare I, Sundberg H, Hallonsten AL.( 2001). Restorative treatment decisions on occlusal caries in Scandinavia. Acta Odontol Scand;59:21-27.
Hannigan A. Using survival methodologies in demonstrating caries efficacy. (2004). J Dent Res:83:C99-C102
Hannigan A, O’Mullane DM, Barry D, Schafer F, Roberts AJ (2001). A re-analysis of a caries clinical trial by survival anaysis. J Dent Res;80:427-431.
Härkänen T, Larmas MA, Virtanen JI, Arjas E.( 2002). Applying modern survival methods to longitudinal dental caries studies. J Dent Res;81:144-148.
Härkänen T, Virtanen JI, Arjas E. (2000). Caries on permanent teeth: a non parametric Bayesian analysis. Scand J Stat; 27:577-588.
Hujoel PP, Isokangas PJ, Tiekso J, Davis S, Lamont RJ, Derouen TA, Mäkinen KK.( 2003). A re-analysis of caries rates in a preventive trial using Poisson regression models. J Dent Res; 73:573-579.
Hujoel PP, Löe H, Anerud A, Boysen H, Leroux BC. (1998). Forty-five-year tooth survival probabilities among men in Oslo, Norway. J Dent Res; 77:2020-2027.
Klein H, Palmer CE, Knutson JW. (1938). Dental status and dental needs of elementary school children. Public Health Reports; 53:751-755.
Korhonen M, Käkilehto T, Larmas M. (2003). Tooth-by-tooth survival analysis of the first caries attack in different age cohorts and health centers in Finland. Acta Odontol Scand; 61:1-5.
Korhonen M, Salo S, Suni J, Larmas M. (2007). Computed online determination of life-long mean index values for carious, extracted, and/or filled permanent teeth. Acta Odontol Scand; 65:214-218.
Korhonen M, Gundogar M, Suni J, Salo S, Larmas M (2009). A practice-based study of the variation of diagnostics of dental caries in new and old patients. Caries Res; 43: 339-344.
Larmas M. (2008). Pre-odontoblasts, odontoblasts, or odontocytes. J Dent Res ; 87: 198-199. Larmas M. (2010a). Has dental caries prevalence some connection with caries index values
in adults? Caries Res; 44: 81-84. Larmas M. (2010b). End of cross-over designs for studies on the effect of sugar substitutes?
Caries Res ; 44:169. Larmas MA, Virtanen JI, Bloigu RS. (1995). Timing of first restorations in permanent teeth: a
new system for oral health determination. J Dent; 23:347-352. Leroy R, Bogaerts K, Lesaffre E, Derclerck D. (2005a;). Effect of caries experience in primary
molars on cavity formation in the adjacent first permanent molars.Caries Res ; 39:342-349.
Leroy R, Bogaerts K, Lesaffre E, Derclerck D. (2005b ). Multivariate survival analysis for the identification of factors associated with cavity formation in permanent first molars. Eur J Oral Sci; 103:145-152.
www.intechopen.com
Classical and Modern Methods in Caries Epidemiology
147
Leskinen K, Ekman A, Oulis C, Forsberg H, Vadiakas G, Larmas M. (2008a ). Comparison of the effectiveness of fissure sealants in Finland, Sweden, and Greece. Acta Odontol Scand.; 66:65-72.
Leskinen K, Salo S, Suni J, Larmas M. (2008b ). Comparison of dental health in sealed and non-sealed first permanent molars: 7 years follow-up in practice-based dentistry. J Dent.;36: 27-32.
Lindsey JC, Ryan LM. (1998). Tutorial in biostatistics – methods for interval-censored data. Stat Med;17: 219-238.
Mejare I, Källestål C, Stenlund H. (1999). Incidence and progression of approximal caries from 11 to 22 years of age in Sweden: a prospective radiographic study. Caries Res;43: 93-100.
Morelli MG. (1924). The introduction of a quantitative caries index for teeth. Dent Cosmos; 66:1068-1075.
Mjör I.( 2008). Conrolled clinical trials and practice-based based research in dentistry. J Dent Res; 87:605.
Niederman R, Leithch J. (2006). “Know what and “know how”! Knowledge creation in clinical practice. J Dent Res;85:296-297.
Ollila P, Larmas M. (2007). A seven-year survival analysis of caries onset in primary second molars and permanent first molars in different caries risk groups determined at age of two years. Acta Odontol Scand; 65: 29-35.
Pahkala R, Pahkala A, Laine T. (1991). Eruption pattern of permanent teeth in a rural community in northeastern Finland. Acta Odontol Scand; 49:341-349.
Parfitt GJ. (1956). The speed of development of a caries cavity. Br Dent J; 100:204-207. Pitts N. (2004). ´ICADS´ - an international system for caries detection and assessment being
developed to facilitate caries epidemiology, research and appropriate clinical management. Community Dent Health; 21:193-198.
Rothman KJ, Greenland S. (1998). Measures of disease frequency. in: Modern epidemiology, Rothman KJ, Greenland S. (Eds). Philadelphia, Lippincott-Raven Publishers, , pp.42-43.
Shwartz M, Pliskin JS, Grondahl HG, Boffa J. (1984a ). Use of the Kaplan-Meier estimate to reduce biases in estimating the rate of caries progression. Community Dent Oral Epidemiol; 12:103-108.
Shwartz M, Pliskin JS, Grondahl HG, Boffa J. (1984b ). Study desing to reduce biases in estimating the percentage of caries lesions that do not progress within a time period. Community Dent Oral Epidemiol; 12:109-113.
Stephenson J, Chadwick BL, Playle RA, Treasure ET. (2010a). Modelling childhood caries using parametric competing risks survival methods for clustered data. Car Res ¸44:69-80.
Stephenson J, Chadwick BL, Playle RA, Treasure ET. (2010b). A competing risk survival analysis model to assess the efficacy of filling carious primary teeth. Car Res.; 44:285-93.
Suni J, Helenius H, Alanen P. (1998). Tooth and tooth surface survival rates in birth cohorts from 1965, 1970, 1975 and 1980 in Lahti, Finland. Community Dent Oral Epidemiol;26:101-106.
Virtanen JI, Larmas MA. (1995). Timing of first fillings on different permanent tooth surfaces in Finnish schoolchildren. Acta Odontol Scand;53:287-92.
www.intechopen.com

Oral Health Care – Pediatric, Research, Epidemiology and Clinical Practices
148
World Heath Organization. ( 1977). International Statistical Classification of Diseases and Related Health Problems. Ninth revision, Geneva, WHO,.
World Heath Organization. (1992). International Statistical Classification of Diseases and Related Health Problems. Tenth revision, vol 1, Tabular list, Geneva, WHO,.
World Heath Organization. (1997). Oral Health Surveys, Basic Methods, ed 4, Geneva, WHO,
www.intechopen.com

Oral Health Care - Pediatric, Research, Epidemiology and ClinicalPracticesEdited by Prof. Mandeep Virdi
ISBN 978-953-51-0133-8Hard cover, 302 pagesPublisher InTechPublished online 29, February, 2012Published in print edition February, 2012
InTech EuropeUniversity Campus STeP Ri Slavka Krautzeka 83/A 51000 Rijeka, Croatia Phone: +385 (51) 770 447 Fax: +385 (51) 686 166www.intechopen.com
InTech ChinaUnit 405, Office Block, Hotel Equatorial Shanghai No.65, Yan An Road (West), Shanghai, 200040, China
Phone: +86-21-62489820 Fax: +86-21-62489821
Oral health care in pediatric dentistry deals with complete oral health, including preventive aspects for childrenright from their conception to adolescence, encompassing all the spheres of dentistry including variousspecialties. It also includes planning a preventive program at individual and community levels. The currentresearch interests in oral health care include studies regarding the role of stem cells, tissue culture, and otherground-breaking technologies available to the scientific community in addition to traditional fields such asanatomy, physiology, and pharmaceuticals etc of the oral cavity. Public health and epidemiology in oral healthcare is about the monitoring of the general oral health of a community, general afflictions they are sufferingfrom, and an overall approach for care and correction of the same. The oral health care-giver undertakesevaluation of conditions affecting individuals for infections, developmental anomalies, habits, etc. and providescorrective action in clinical conditions. The present work is a compendium of articles by internationallyrenowned and reputed specialists about the current developments in various fields of oral health care.
How to referenceIn order to correctly reference this scholarly work, feel free to copy and paste the following:
M. Larmas, H. Vähänikkilä, K. Leskinen and J. Päkkilä (2012). Classical and Modern Methods in CariesEpidemiology, Oral Health Care - Pediatric, Research, Epidemiology and Clinical Practices, Prof. MandeepVirdi (Ed.), ISBN: 978-953-51-0133-8, InTech, Available from: http://www.intechopen.com/books/oral-health-care-pediatric-research-epidemiology-and-clinical-practices/classical-and-modern-methods-in-caries-epidemiology

© 2012 The Author(s). Licensee IntechOpen. This is an open access articledistributed under the terms of the Creative Commons Attribution 3.0License, which permits unrestricted use, distribution, and reproduction inany medium, provided the original work is properly cited.