Class Test 2 Thursday May 28, 5-8 pm For those who want a paper-based test 25 multiple choice...
80
Class Test 2 • Thursday May 28, 5-8 pm • For those who want a paper- based test • 25 multiple choice questions • Covers Lectures 6 – 10 – Chapters 7-16
-
Upload
clement-singleton -
Category
Documents
-
view
213 -
download
0
Transcript of Class Test 2 Thursday May 28, 5-8 pm For those who want a paper-based test 25 multiple choice...

Class Test 2
• Thursday May 28, 5-8 pm
• For those who want a paper-based test
• 25 multiple choice questions
• Covers Lectures 6 – 10– Chapters 7-16

Lecture Purpose
• To introduce a key macroeconomic model
• To model changes in the economy due to changes economic variables
• Prepare for the concluding discussions on macroeconomic policy

Lecture 10: Aggregate Demand and Aggregate Supply
Short run fluctuations in the economy

The Short Run & the Long Run
• In the short run.– Changes in the money supply affect nominal
variables (eg prices) but not real variables in the long run (eg output).
• In the long run– Output changes due to technology, population
growth etc
Short-Run Economic Fluctuations
• Economic activity fluctuates from year to year.– In most years production of goods and services rises
but in some years normal growth does not occur, causing a recession.
• A recession is a period of declining real GDP, falling incomes, and rising unemployment.
• A depression is a severe recession.

Growth over time
Real GDP
($b)
YearsLong term average
Recession
‘Boom’

Characteristics of Economic Fluctuations
• Economic fluctuations are irregular and unpredictable.
• Most macroeconomic variables are related and fluctuate together.– As output falls, unemployment rises and vice
versa
Explaining Economic Fluctuations
• Most economists use the model of aggregate demand and aggregate supply to illustrate the effects of short-run fluctuations in economic activity.
• This is shown in relation to the long-term trend
The Basic Model of Economic Fluctuations
• Two variables are used to develop a model to analyse the short-run fluctuations.– The economy’s output of goods and services
measured by real GDP.– The overall price level measured by the CPI or
the GDP deflator.
Aggregate Demand and Aggregate Supply
• The aggregate demand curve shows the quantity of goods and services that households, firms, and the government want to buy at any price level.
• The aggregate supply curve shows the quantity of goods and services that firms choose to produce and want to sell at any price level.

The Aggregate Demand Curve
• The four components of GDP (Y) contribute to the aggregate demand for goods and services.
Y = C + I + G + NX

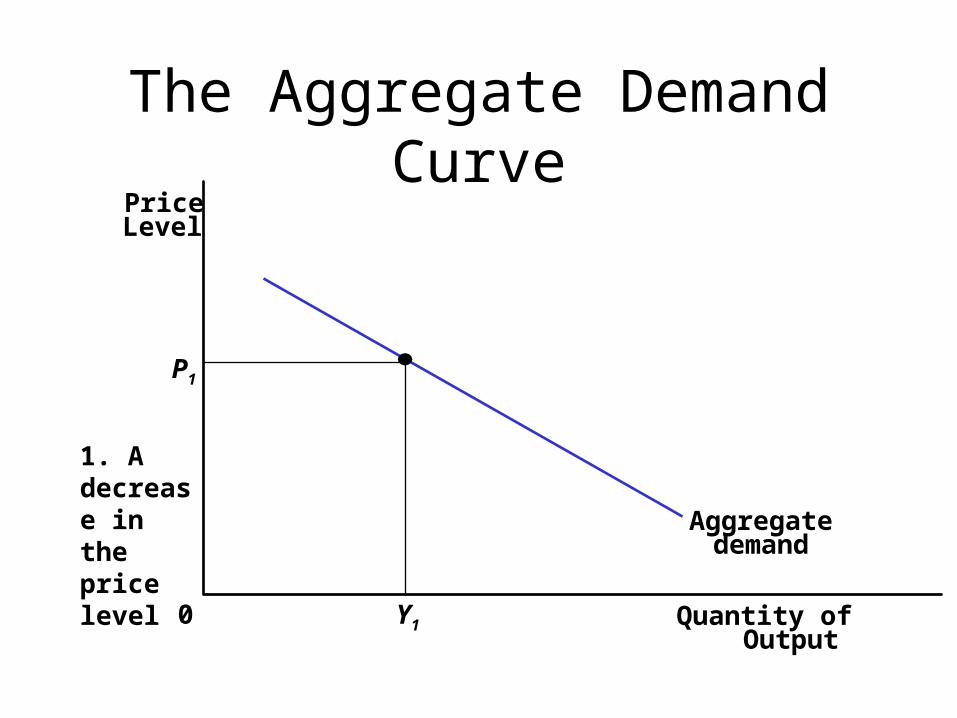
The Aggregate Demand Curve
Quantity ofOutput
PriceLevel
0
Aggregatedemand
P1
Y1
The Aggregate Demand Curve
Quantity ofOutput
PriceLevel
0
Aggregatedemand
P1
Y1
1. A decrease in the pricelevel

The Aggregate Demand Curve
Quantity ofOutput
PriceLevel
0
Aggregatedemand
P1
Y1 Y2
P21. A decrease in the pricelevel
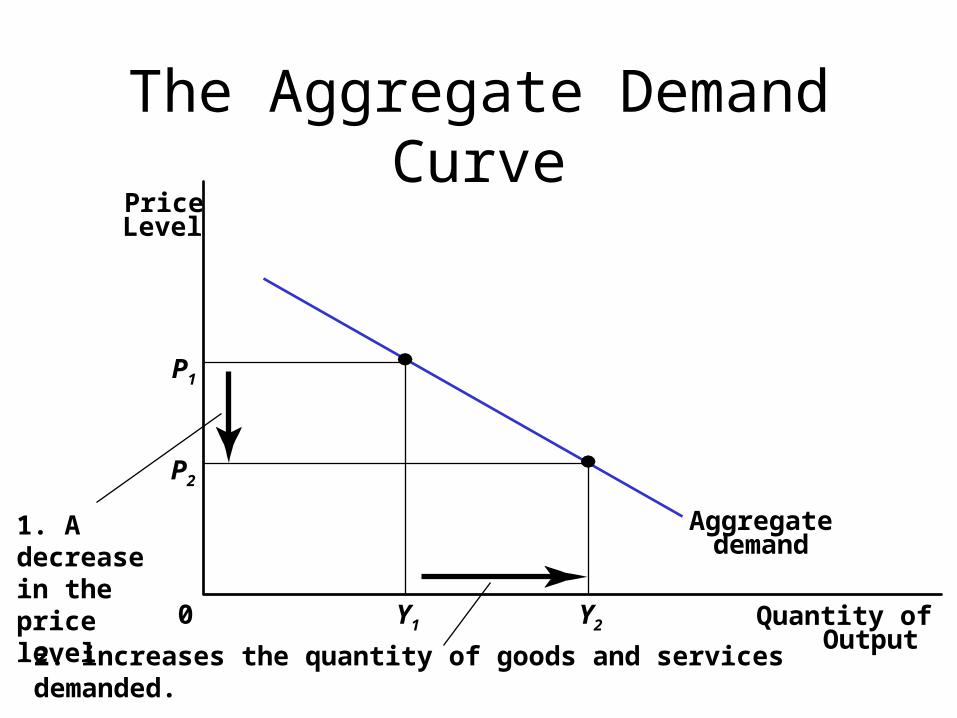
The Aggregate Demand Curve
Quantity ofOutput
PriceLevel
0
Aggregatedemand
P1
Y1 Y2
P2
1. A decrease in the pricelevel
2. increases the quantity of goods and services demanded.

Explaining the aggregate demand curve:
3 Theories
• Pigou’s wealth effect
• Keynes’ interest rate effect
• Mundell-Fleming’s exchange-rate effect

Pigou’s wealth effect
• Consumers feel wealthier, which stimulates the demand for consumption goods.– A decrease in the price level makes consumers
feel more wealthy.– This encourages them to spend more.– The increase in consumer spending means a
larger quantity of goods and services demanded.

Keynes’ interest-rate effect
• The lower the price level, the less money households need to hold to buy the goods and services they want.– A lower price level reduces the interest rate,
which encourages greater spending on investment goods.
– The increase in investment spending means a larger quantity of goods and services demanded.

Mundell-Fleming’s exchange-rate effect
• When the prices of domestic goods decreases, net exports increase.– A fall in the Australian price level causes
Australian interest rates to fall.– The real exchange rate depreciates, which
stimulates Australian net exports.– The increase in net export spending means a
larger quantity of goods and services demanded.
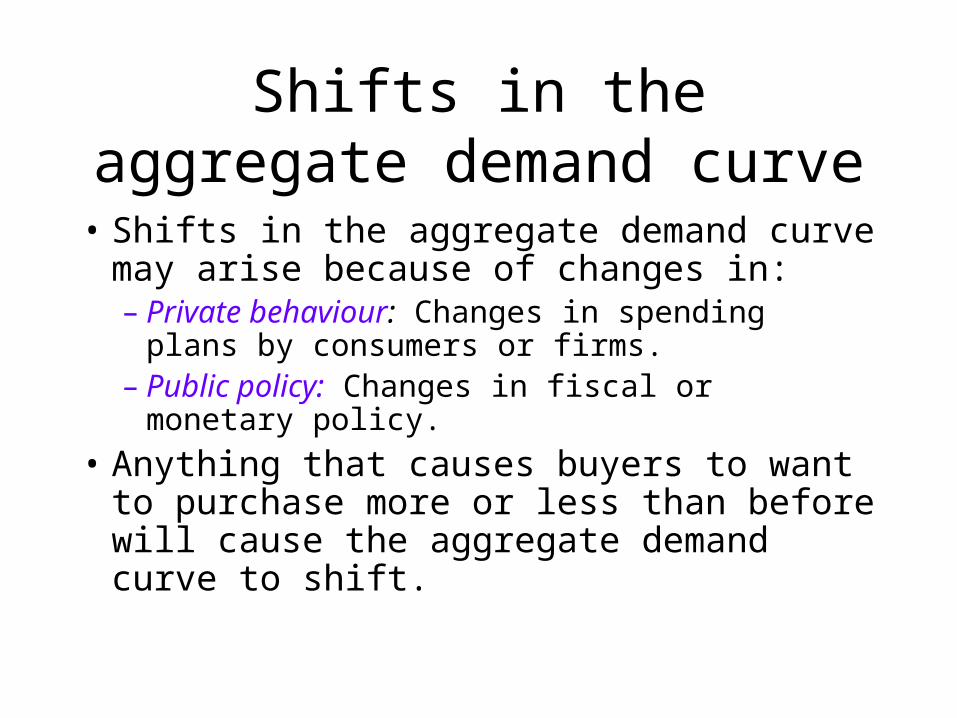
Shifts in the aggregate demand curve
• Shifts in the aggregate demand curve may arise because of changes in:– Private behaviour: Changes in spending plans
by consumers or firms.– Public policy: Changes in fiscal or monetary
policy.
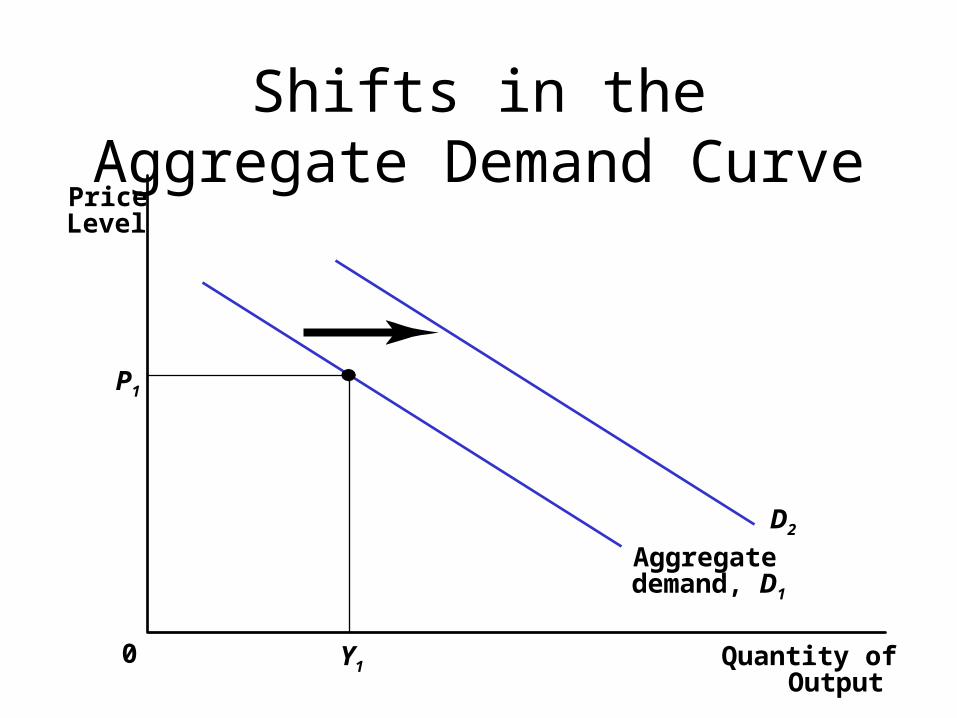
• Anything that causes buyers to want to purchase more or less than before will cause the aggregate demand curve to shift.

Shifts in the Aggregate Demand Curve
Quantity ofOutput
PriceLevel
0
Aggregatedemand, D1
P1
Y1
Shifts in the Aggregate Demand Curve
Quantity ofOutput
PriceLevel
0
Aggregatedemand, D1
P1
Y1
D2

Shifts in the Aggregate Demand Curve
Quantity ofOutput
PriceLevel
0
Aggregatedemand, D1
P1
Y1 Y2
D2
Shifts in aggregate demand
• People will buy more of the goods and services at every price
• Same principle as for microeconomic markets

The Aggregate Supply Curve
• In the long run, the aggregate-supply curve is vertical.
• In the short run, the aggregate-supply curve is upward sloping.

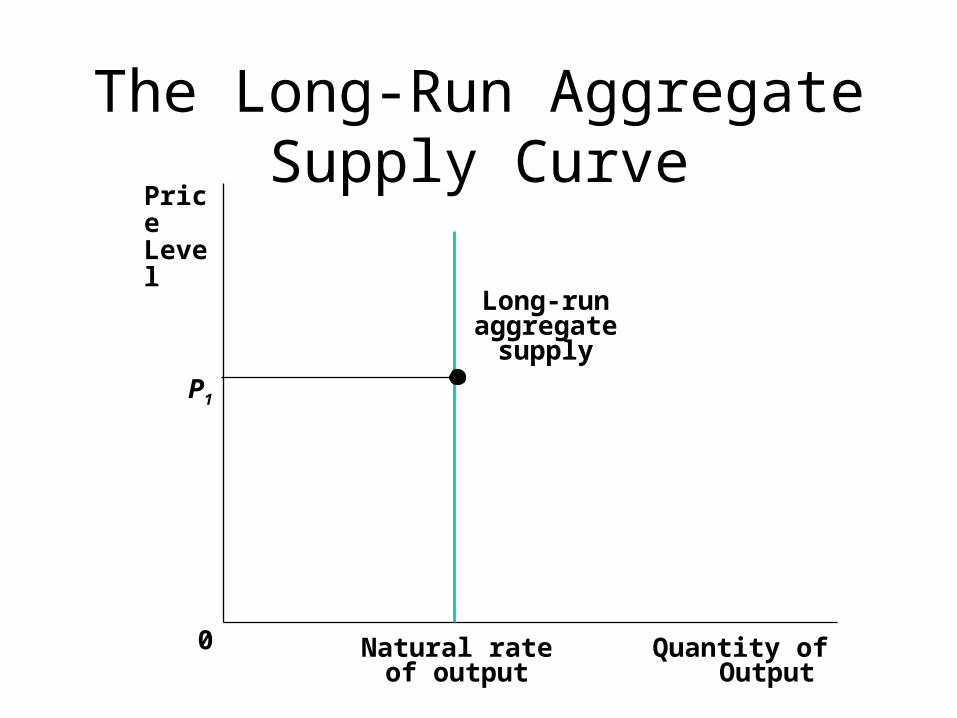
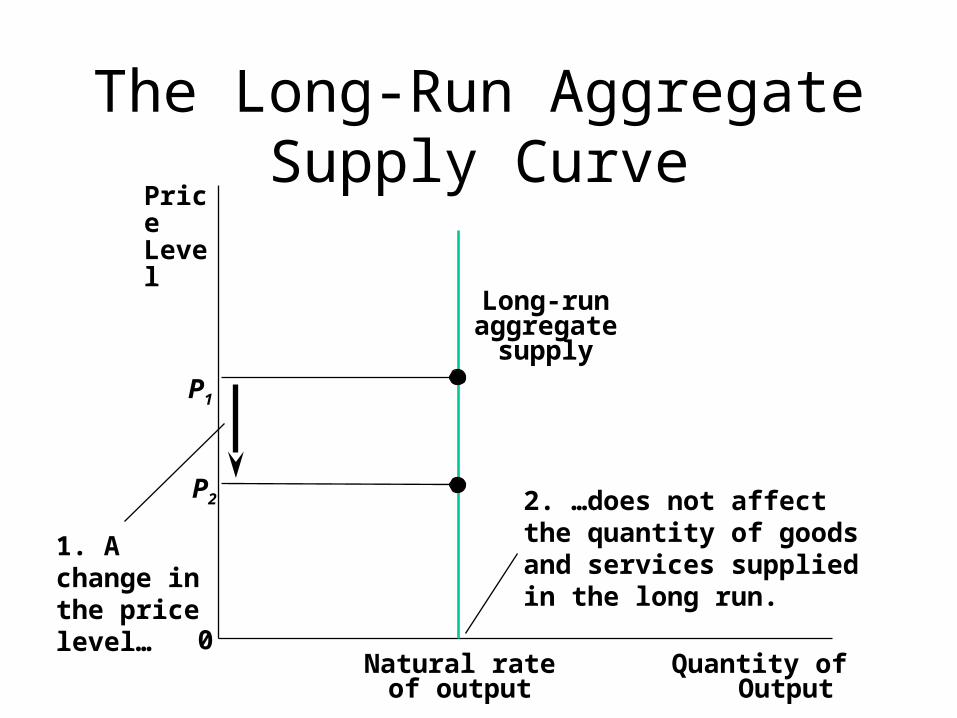
The Long-Run Aggregate Supply Curve
• The long-run aggregate supply depends on the economy’s resources and level of technology.
• The price level does not affect these variables in the long run.
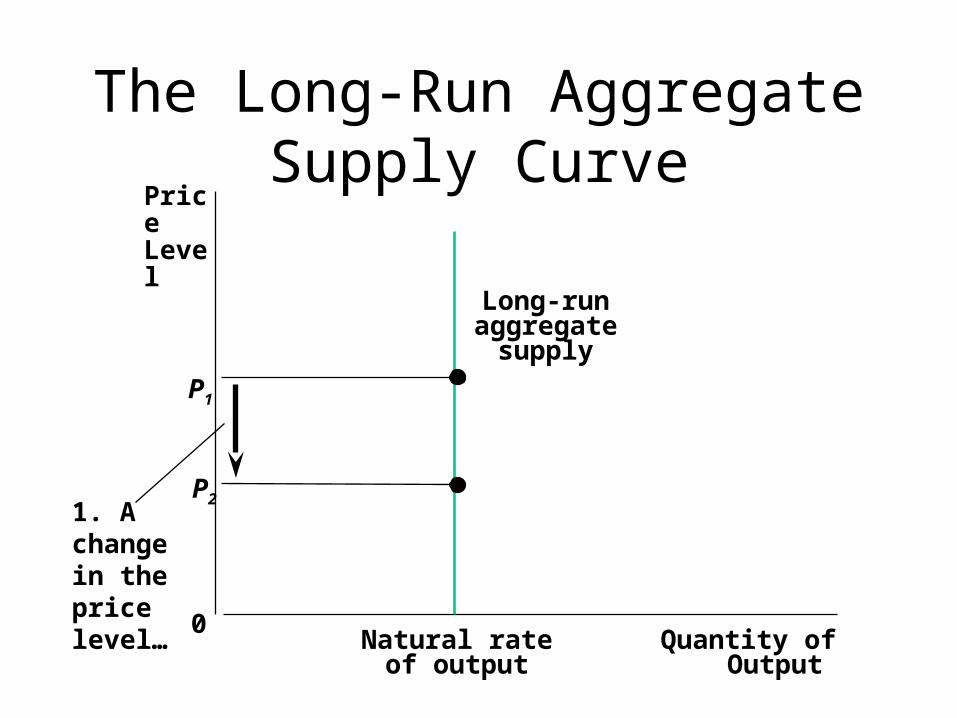
• The long-run aggregate supply curve is vertical at the natural rate of output.
The Long-Run Aggregate Supply Curve
Quantity ofOutput
Natural rateof output
Price Level
0
Long-runaggregate
supply
P1
The Long-Run Aggregate Supply Curve
Quantity ofOutput
Natural rateof output
Price Level
0
Long-runaggregate
supply
P21. A change in the price level…
P1
The Long-Run Aggregate Supply Curve
Quantity ofOutput
Natural rateof output
Price Level
0
Long-runaggregate
supply
P2
1. A change in the price level…
P1
2. …does not affect the quantity of goods and services supplied in the long run.

Shifts in the Long-Run Aggregate Supply Curve
• Any change in the factors that determine the long-run aggregate supply will cause the curve to shift.
• An event that reduces the economy’s potential output shifts the curve to the left.
• Any event that increases the economy’s potential output shifts the curve to the right.
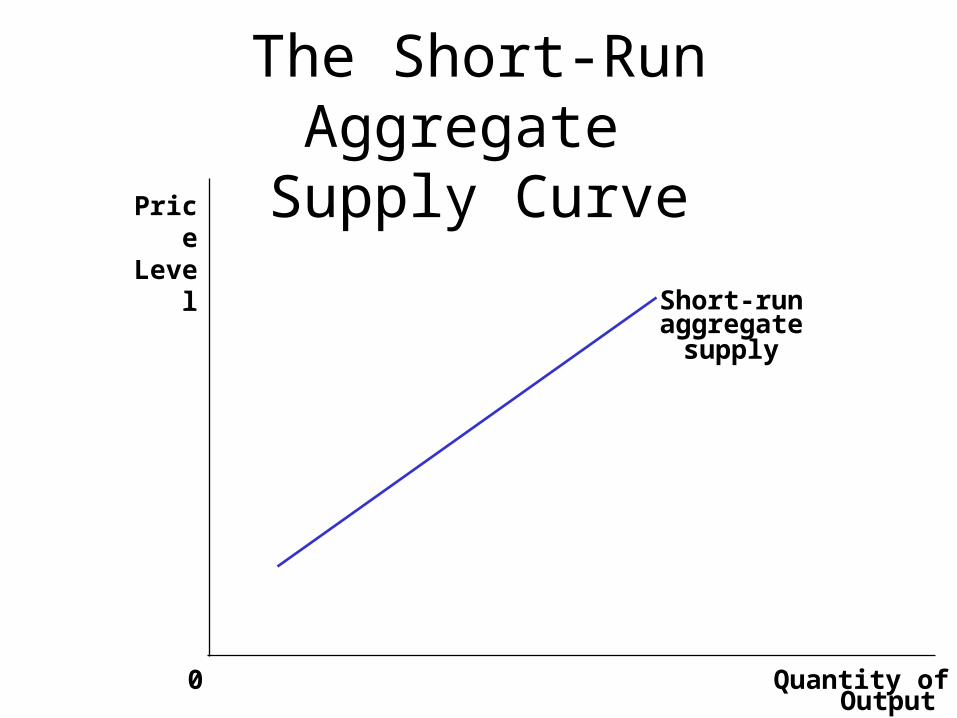
The Short-Run Aggregate Supply Curve
• In the short run, an increase in the overall level of prices in the economy tends to raise the quantity of goods and services supplied.
• A decrease in the level of prices tends to reduce the quantity of goods and services supplied.
The Short-Run Aggregate Supply Curve
Quantity ofOutput
Price Level
0
Short-runaggregate
supply

The Short-Run Aggregate Supply Curve
Y1
P1
Quantity ofOutput
Price Level
0
Short-runaggregate
supply

The Short-Run Aggregate Supply Curve
Y1
P1
P21. A decrease in the price level Quantity of
Output
Price Level
0
Short-runaggregate
supply
Y2

The Short-Run Aggregate Supply Curve
Y1
P1
P21. A decrease in the price level Quantity of
Output
Price Level
0
Short-runaggregate
supply
Y2
2. reduces the quantity of goods and services supplied in the short run
Explaining the slope of the aggregate supply curve
• New classical misperceptions theory
• The Keynesian sticky-wage theory
• The new Keynesian sticky-price theory

The New Classical Misperceptions Theory
• Changes in the overall price level temporarily mislead suppliers about what is happening in the markets in which they sell their output.– A lower price level causes misperceptions
about relative prices.– These misperceptions induce suppliers to
decrease the quantity of goods and services supplied.
The Keynesian Sticky-Wage Theory
• Nominal wages are slow to adjust, or are ‘sticky’ in the short run.– Wages do not adjust immediately to a fall in the
price level.– A lower price level makes employment and
production less profitable.– This induces firms to reduce production.
The New Keynesian Sticky-Price Theory
• Prices of some goods and services adjust sluggishly in response to changing economic conditions.– An unexpected fall in the price level leaves
some firms with higher-than-desired prices.– This depresses sales, which induces firms to
reduce the quantity of goods and services they produce.

Shifts in the Aggregate Supply Curve
P1
Quantity ofOutput
Price Level
0
Short-run aggregate supply, S1
Y2

Shifts in the Aggregate Supply Curve
P1
Quantity ofOutput
Price Level
0
Short-run aggregate supply, S1
Y2
S2

Shifts in the Aggregate Supply Curve
Y1
P1
Quantity ofOutput
Price Level
0
Short-run aggregate supply, S1
Y2
S2
Why the aggregate supply curve might shift
• Changes in factor (input) prices
• Changes in productivity
• Legal-institutional environment
• Expectations about the price level
Changes in Resource Prices
• Changes in the prices of domestic or imported resources change firms’ cost of production.– An increase in input prices shifts the
aggregate supply curve to the left.– A decrease in input prices shifts the aggregate
supply curve to the right.
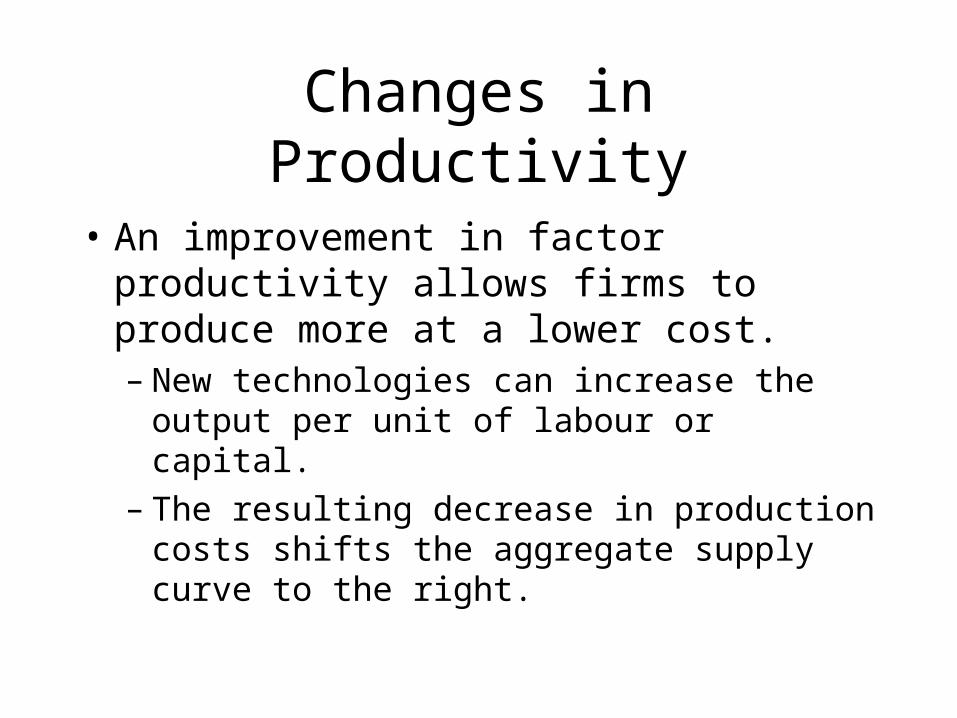
Changes in Productivity
• An improvement in factor productivity allows firms to produce more at a lower cost.– New technologies can increase the output per
unit of labour or capital.– The resulting decrease in production costs
shifts the aggregate supply curve to the right.
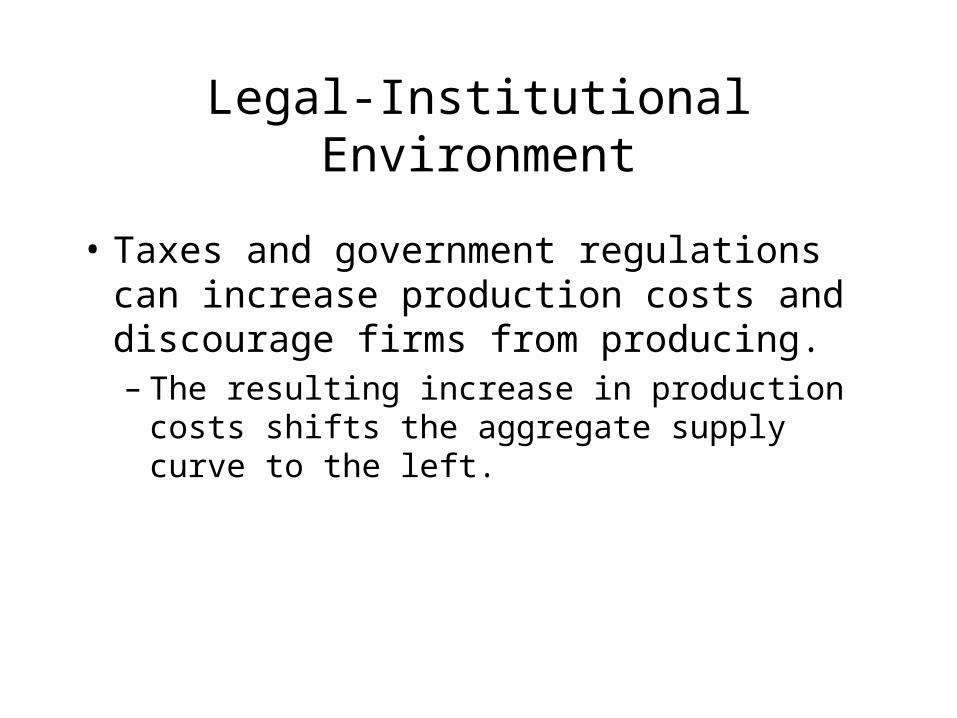
Legal-Institutional Environment
• Taxes and government regulations can increase production costs and discourage firms from producing.– The resulting increase in production costs shifts
the aggregate supply curve to the left.

Expectations About the Price Level
• Current wages and prices often depend on expectations of the price level.– A higher expected price level shifts the short-
run aggregate supply curve to the left.– A lower expected price level shifts the short-
run aggregate supply curve to the right.

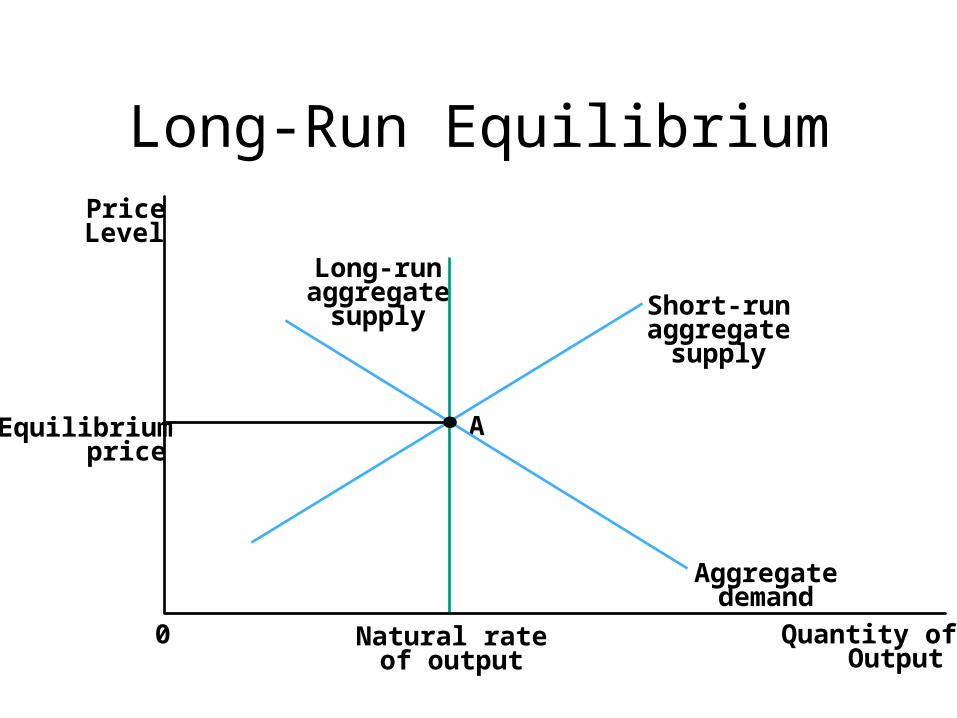
Long-Run Equilibrium
• The intersection of the aggregate demand curve and the long-run aggregate supply curve determines the economy’s equilibrium output and price level.
• Output is at its ‘natural’ rate.
• The short-run aggregate supply curve passes through the point of intersection.
Long-Run Equilibrium
Natural rateof output
Quantity ofOutput
PriceLevel
0
Equilibriumprice
Short-runaggregate
supply
Long-runaggregate
supply
Aggregatedemand
A

Two causes of recession
• A recession in the economy may have two causes.– A decrease in aggregate demand.– A decrease in aggregate supply.
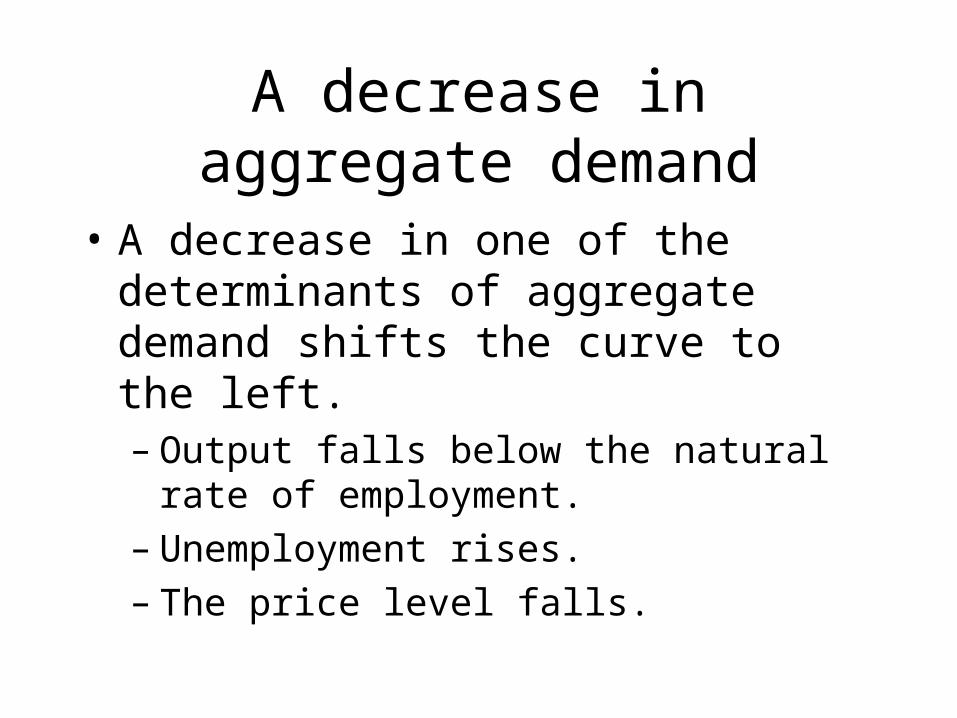
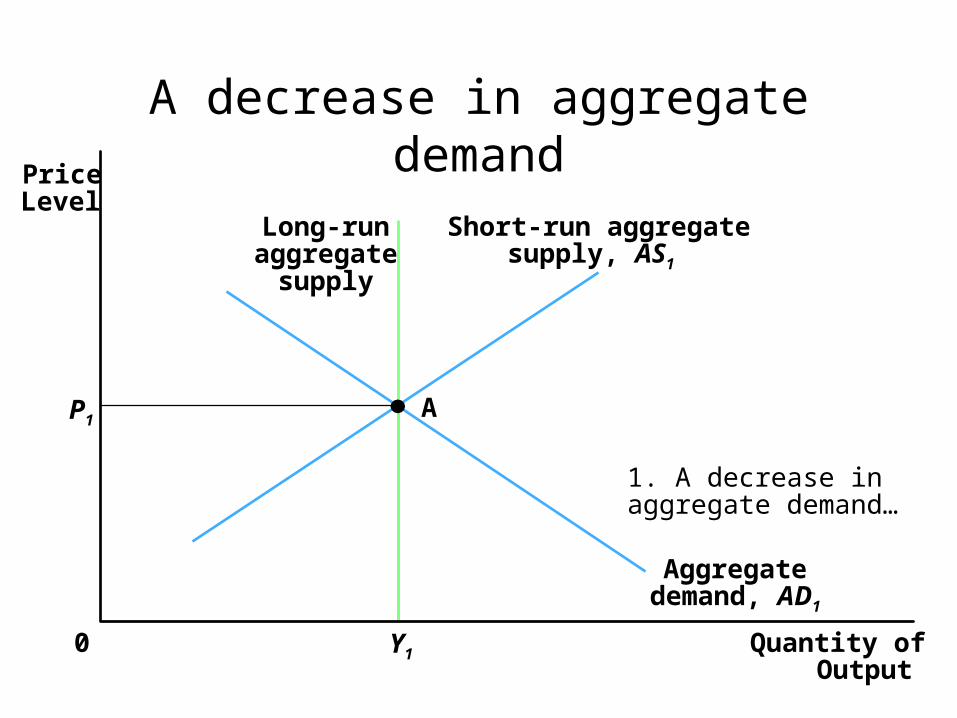
A decrease in aggregate demand
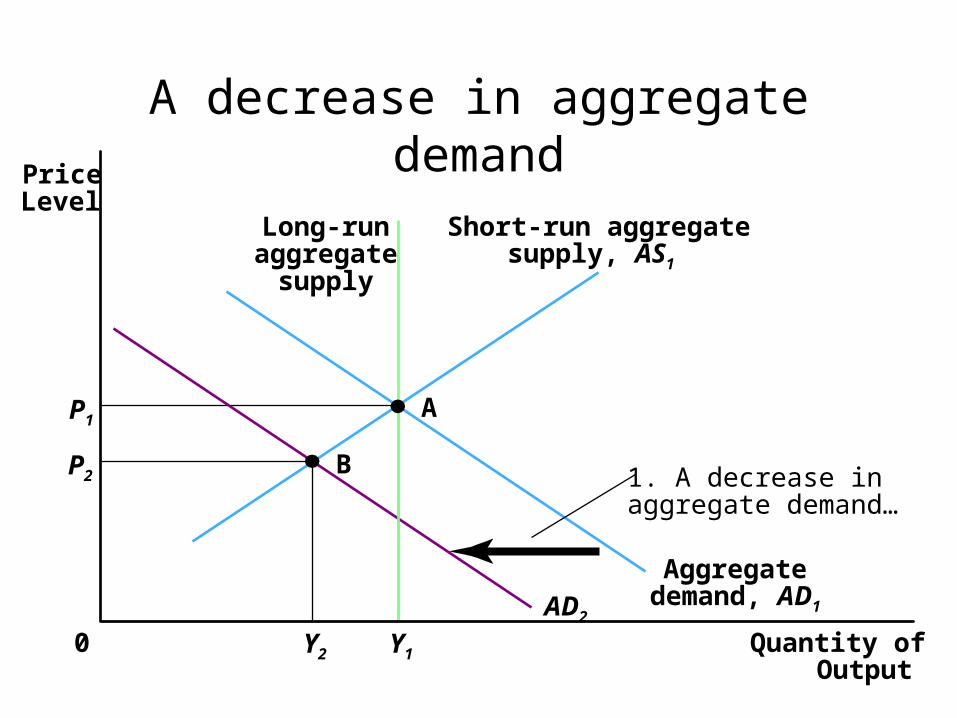
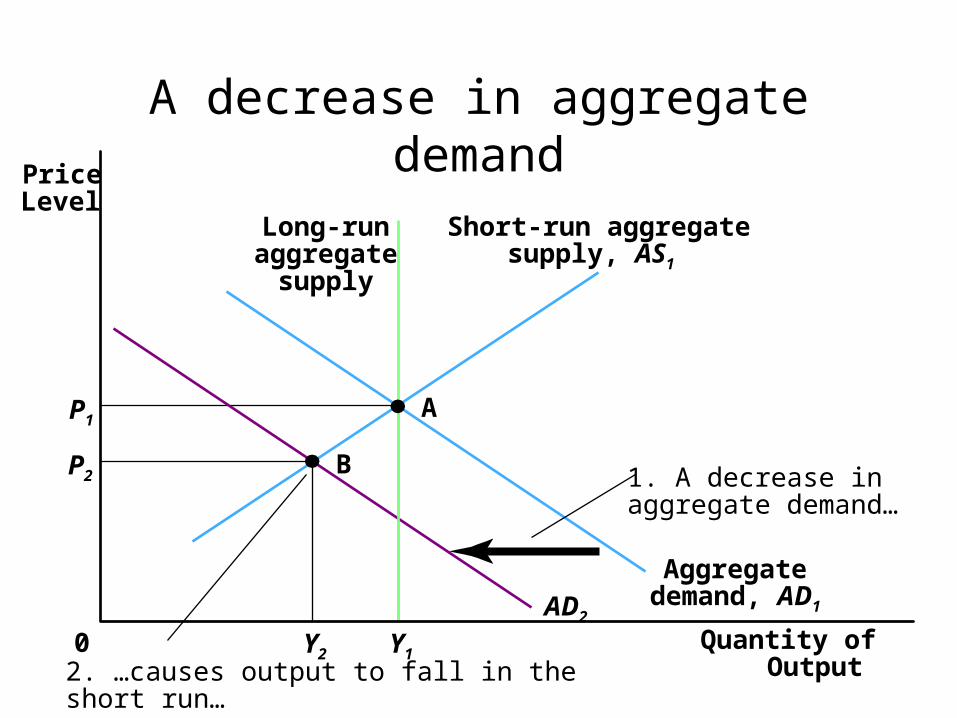
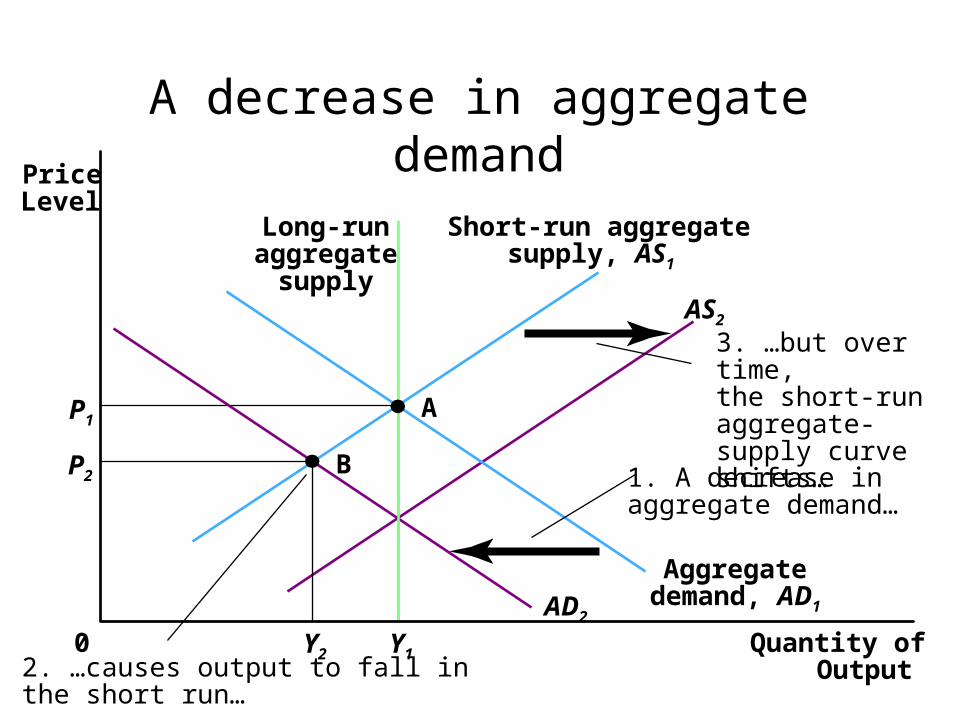
• A decrease in one of the determinants of aggregate demand shifts the curve to the left.– Output falls below the natural rate of
employment.– Unemployment rises.– The price level falls.
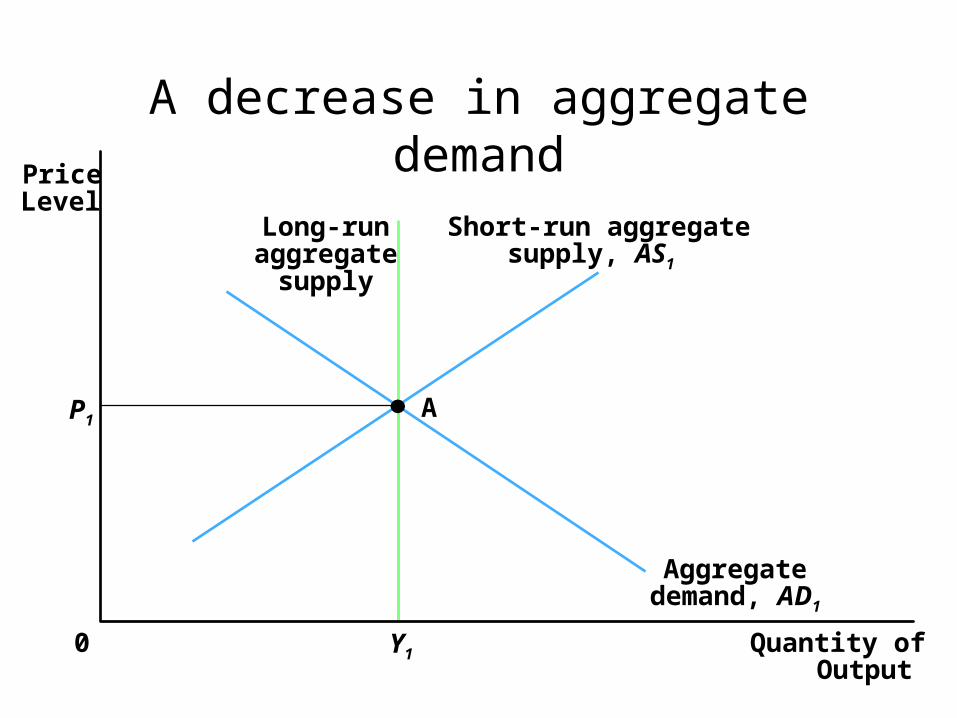
A decrease in aggregate demand
Quantity ofOutput
PriceLevel
0
Short-run aggregatesupply, AS1
Long-runaggregate
supply
AP1
Y1
Aggregatedemand, AD1
A decrease in aggregate demand
Quantity ofOutput
PriceLevel
0
Short-run aggregatesupply, AS1
Long-runaggregate
supply
Aggregatedemand, AD1
AP1
Y1
1. A decrease inaggregate demand…

A decrease in aggregate demand
Quantity ofOutput
PriceLevel
0
Short-run aggregatesupply, AS1
Long-runaggregate
supply
Aggregatedemand, AD1
AP1
Y1
AD2
1. A decrease inaggregate demand…
A decrease in aggregate demand
Quantity ofOutput
PriceLevel
0
Short-run aggregatesupply, AS1
Long-runaggregate
supply
Aggregatedemand, AD1
A
B
P1
P2
Y1Y2
AD2
1. A decrease inaggregate demand…
A decrease in aggregate demand
Quantity ofOutput
PriceLevel
0
Short-run aggregatesupply, AS1
Long-runaggregate
supply
Aggregatedemand, AD1
A
B
P1
P2
Y1Y2
AD2
1. A decrease inaggregate demand…
2. …causes output to fall in the short run…

A decrease in aggregate demand
Quantity ofOutput
PriceLevel
0
Short-run aggregatesupply, AS1
Long-runaggregate
supply
Aggregatedemand, AD1
A
B
P1
P2
Y1Y2
AD2
1. A decrease inaggregate demand…
3. …but over time,the short-run aggregate-supply curve shifts…
2. …causes output to fall in the short run…
A decrease in aggregate demand
Quantity ofOutput
PriceLevel
0
Short-run aggregatesupply, AS1
Long-runaggregate
supply
Aggregatedemand, AD1
A
B
P1
P2
Y1Y2
AD2
AS2
1. A decrease inaggregate demand…
3. …but over time,the short-run aggregate-supply curve shifts…
2. …causes output to fall in the short run…

A decrease in aggregate demand
Quantity ofOutput
PriceLevel
0
Short-run aggregatesupply, AS1
Long-runaggregate
supply
Aggregatedemand, AD1
A
B
C
P1
P2
P3
Y1Y2
AD2
AS2
1. A decrease inaggregate demand…
3. …but over time,the short-run aggregate-supply curve shifts…
2. …causes output to fall in the short run…
4. …and output returnsto its natural rate.

A Decrease in Aggregate Supply
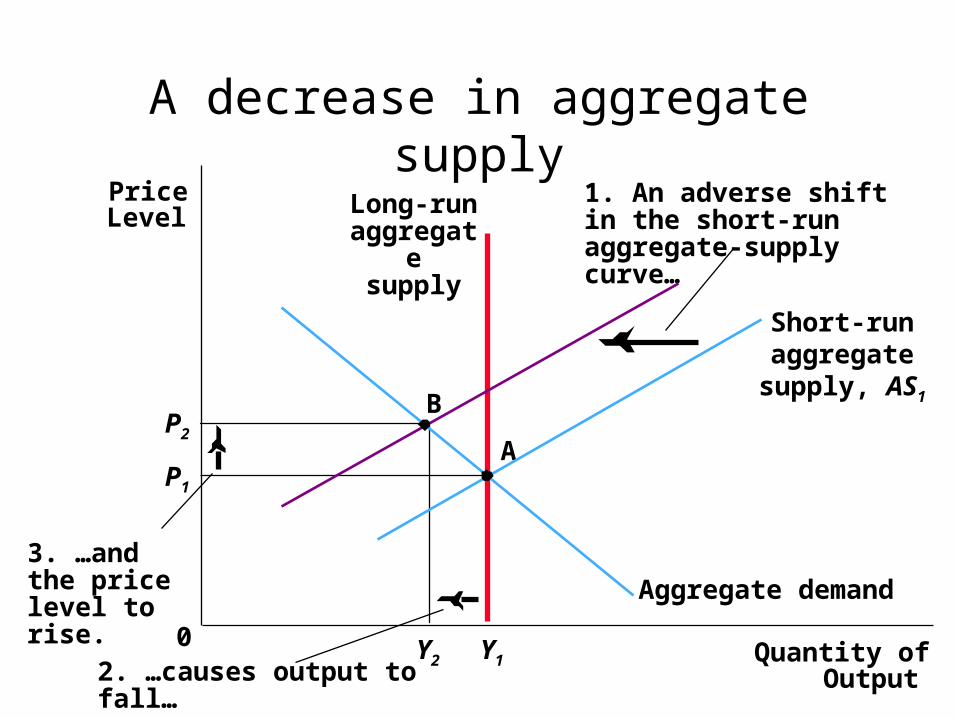
• A decrease in one of the determinants of aggregate supply shifts the curve to the left.– Output falls below the natural rate of
employment.– Unemployment rises.– The price level rises.

A decrease in aggregate supply
Long-runaggregate
supply
Short-run aggregate
supply, AS1
Quantity ofOutput
PriceLevel
0
Aggregate demand
A
Y1
P1

A decrease in aggregate supply
Long-runaggregate
supply
1. An adverse shift in the short-run aggregate-supply curve…
Short-run aggregate
supply, AS1
Quantity ofOutput
PriceLevel
0
Aggregate demand
A
Y1
P1

A decrease in aggregate supply
Long-runaggregate
supply
1. An adverse shift in the short-run aggregate-supply curve…
Short-run aggregate
supply, AS1
Quantity ofOutput
PriceLevel
0
Aggregate demand
A
Y1
P1

A decrease in aggregate supply
Long-runaggregate
supply
1. An adverse shift in the short-run aggregate-supply curve…
Short-run aggregate
supply, AS1
Quantity ofOutput
PriceLevel
0
Aggregate demand
A
B
Y1Y2
P2
P1

A decrease in aggregate supply
2. …causes output to fall…
Long-runaggregate
supply
1. An adverse shift in the short-run aggregate-supply curve…
Short-run aggregate
supply, AS1
Quantity ofOutput
PriceLevel
0
Aggregate demand
A
B
Y1Y2
P2
P1
A decrease in aggregate supply
2. …causes output to fall…
Long-runaggregate
supply
1. An adverse shift in the short-run aggregate-supply curve…
Short-run aggregate
supply, AS1
Quantity ofOutput
PriceLevel
0
Aggregate demand
A
B
Y1Y2
3. …and the price level to rise.
P2
P1
Stagflation
• Adverse shifts in aggregate supply cause stagflation—a combination of recession and inflation.– Output falls and prices rise.– Policymakers who can influence aggregate
demand cannot offset both of these adverse effects simultaneously.

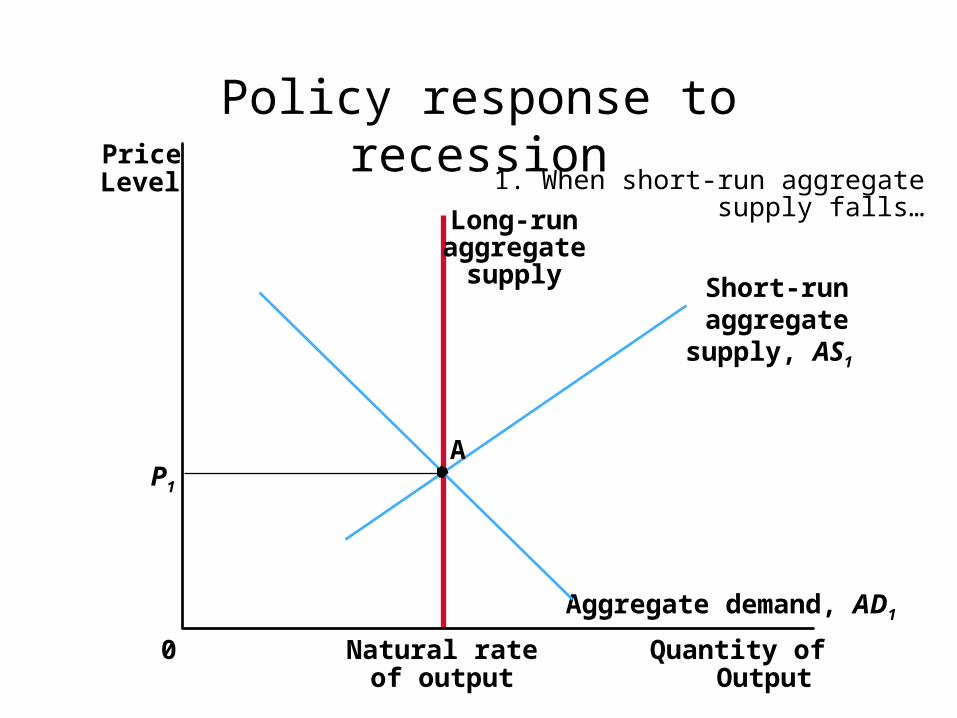
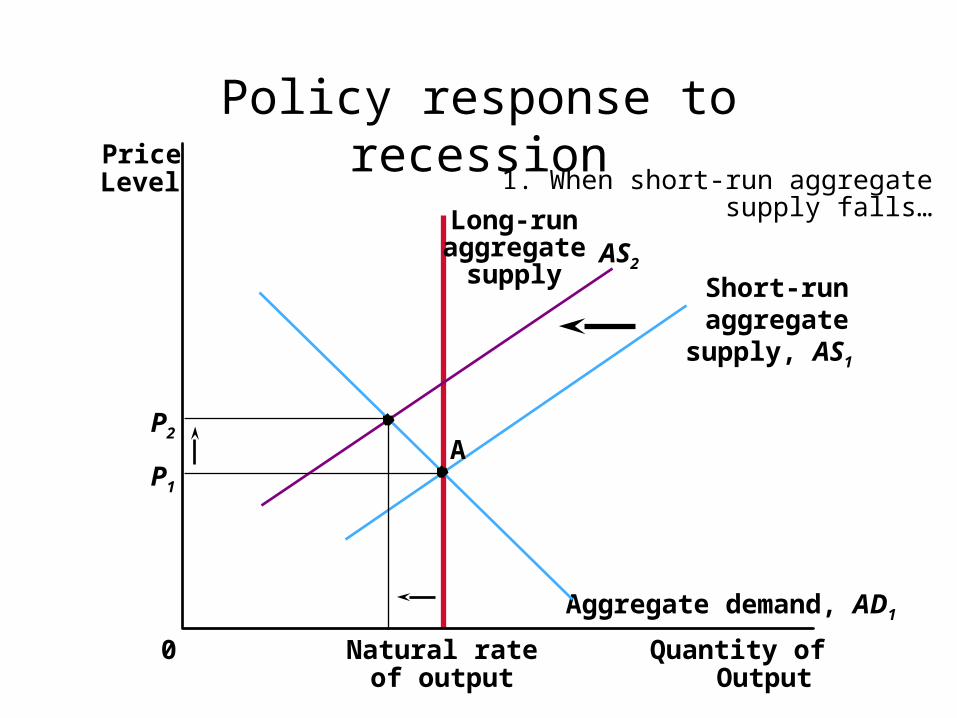
Policy responses to recession
• Policymakers may respond to a recession in one of the following ways:– Do nothing and wait for prices and wages to
adjust.– Take action to increase aggregate demand by
using monetary and fiscal policy.

Policy response to recession
Quantity ofOutput
Natural rateof output
PriceLevel
0
Short-run aggregate supply, AS1
Aggregate demand, AD1
Long-run aggregate
supply
AP1
Policy response to recession
Quantity ofOutput
Natural rateof output
PriceLevel
0
Short-run aggregate supply, AS1
Aggregate demand, AD1
Long-run aggregate
supply
AP1
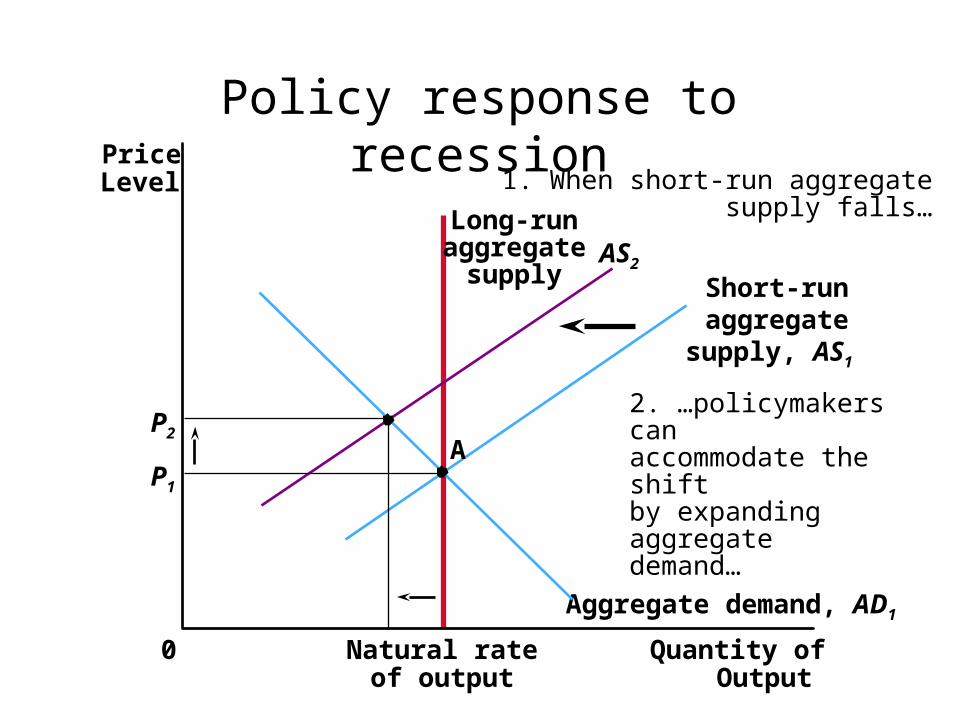
1. When short-run aggregate supply falls…

Policy response to recession
Quantity ofOutput
Natural rateof output
PriceLevel
0
Short-run aggregate supply, AS1
Aggregate demand, AD1
Long-run aggregate
supply
AP1
AS2
1. When short-run aggregate supply falls…
Policy response to recession
Quantity ofOutput
Natural rateof output
PriceLevel
0
Short-run aggregate supply, AS1
Aggregate demand, AD1
Long-run aggregate
supply
AP2
P1
AS2
1. When short-run aggregate supply falls…
Policy response to recession
Quantity ofOutput
Natural rateof output
PriceLevel
0
Short-run aggregate supply, AS1
Aggregate demand, AD1
Long-run aggregate
supply
AP2
P1
AS2
1. When short-run aggregate supply falls…
2. …policymakers canaccommodate the shiftby expanding aggregatedemand…

Policy response to recession
Quantity ofOutput
Natural rateof output
PriceLevel
0
Short-run aggregate supply, AS1
Aggregate demand, AD1
Long-run aggregate
supply
AP2
P1
AS2
1. When short-run aggregate supply falls…
2. …policymakers canaccommodate the shiftby expanding aggregatedemand…
AD2

Policy response to recession
Quantity ofOutput
Natural rateof output
PriceLevel
0
Short-run aggregate supply, AS1
Aggregate demand, AD1
Long-run aggregate
supply
A
C
P2
P3
P1
AS2
1. When short-run aggregate supply falls…
2. …policymakers canaccommodate the shiftby expanding aggregatedemand…
AD2

Policy response to recession
Quantity ofOutput
Natural rateof output
PriceLevel
0
Short-run aggregate supply, AS1
Aggregate demand, AD1
Long-run aggregate
supply
A
C
P2
P3
P1
AS2
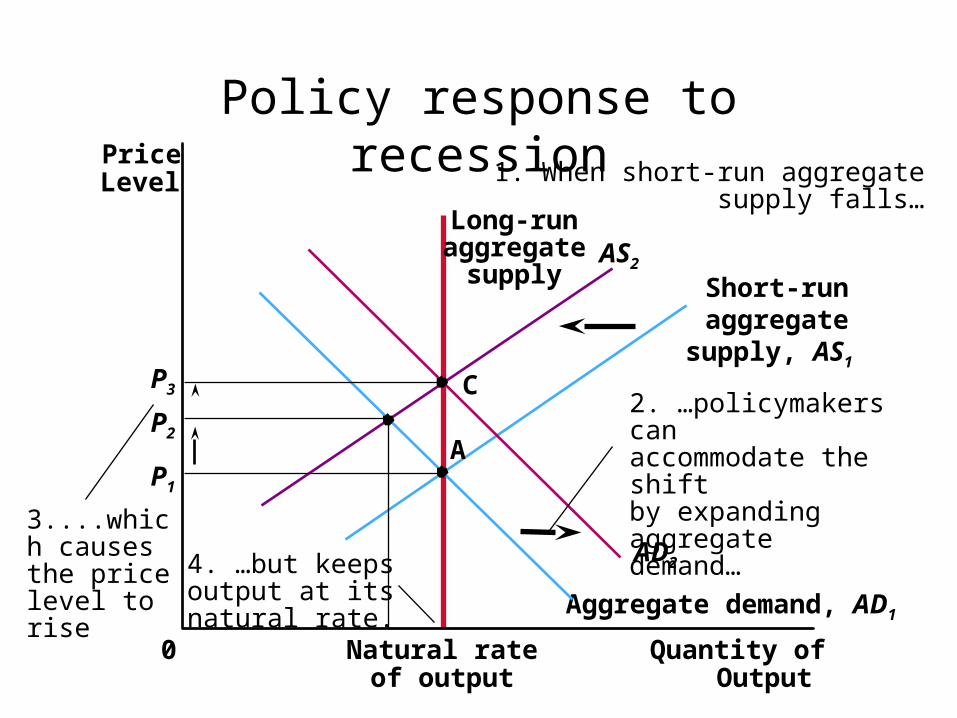
3....which causes the price level to rise
1. When short-run aggregate supply falls…
2. …policymakers canaccommodate the shiftby expanding aggregatedemand…
AD2
Policy response to recession
Quantity ofOutput
Natural rateof output
PriceLevel
0
Short-run aggregate supply, AS1
Aggregate demand, AD1
Long-run aggregate
supply
A
C
P2
P3
P1
AS2
3....which causes the price level to rise
1. When short-run aggregate supply falls…
2. …policymakers canaccommodate the shiftby expanding aggregatedemand…
AD24. …but keeps output at its natural rate.

Self-Test (Hakes & Parry): Chapter 16
• Match all Terms & Definitions• Answer questions 1, 2, 3 & 4 of the Practice
Problems• Answer Short Answer questions 1, 2, 5, 6, 7, 9 &
11• Do all True/False Questions• Answer Multiple Choice Questions 1, 2, 4, 5, 6, 8,
9, 10, 11, 13, 14, 15, 16, 17, 18, 19 & 20• Make notes on the Advanced Critical Thinking
questions • Check answers in guide and revise accordingly

Reading
• This week: Text and Study Guide Chapter 16
• For next lecture: Chapter 17 & 18