CLASS Application in Western Africa Diana Verseghy Climate Processes Section Climate Research...
34
CLASS Application in Western Africa Diana Verseghy Climate Processes Section Climate Research Division Environment Canada
-
Upload
joseph-wilkins -
Category
Documents
-
view
217 -
download
3
Transcript of CLASS Application in Western Africa Diana Verseghy Climate Processes Section Climate Research...

CLASS Application inWestern Africa
Diana Verseghy
Climate Processes Section
Climate Research Division
Environment Canada

ALMIP2 – “AMMA Land Surface Model Intercomparison Project”, phase 2
• “AMMA – “African Monsoon Multidisciplinary Analysis”; ran from 2002 to 2010
• Aimed at improving knowledge and understanding of the West African Monsoon and its variability, for better prediction of the monsoon and its socioeconomic impacts
• International coordination of research campaign over west Africa and the tropical Atlantic
• Involved groups and agencies from Africa, France, UK, USA and EU: atmospheric modellers, oceanographers, land surface field researchers, impact assessment groups

AMMA project overview

AMMA-CATCH – “Coupling of the Tropical Atmosphere and the Hydrological Cycle”
• Sub-project of AMMA; established enhanced observations of the atmosphere, land and ocean components of the water cycle for the WAM area
• Included establishment of three land surface mesosites along the north-south transect of the WAM; enhanced observation period from 2005 to 2008.
• Important feature – installation of an augmented network of rain gauges across the mesosites, to track the intense convective storms that are characteristic of the monsoon season (40-50 each year)

West African Monsoon

Development of ALMIP project
• First phase of ALMIP took place in 2009; limited number of models run over western Africa, at 0.5o resolution
• Second phase, ALMIP2, opened to involvement by the wider land surface modelling community; spearheaded by a group at Metéo-France.
• First call for participation sent out in 2010; 26 land surface modelling groups expressed interest.
• Experimental setup and data assembly took place in 2011; model runs proceeded through 2012.
• First analysis workshop held in Toulouse, France in April 2013.

Setup of modelling domains
• Three mesosites: Benin 120 x 120 km, Niger 100 x 100 km, Mali 50 x 50 km
• Modelling grid superimposed on each mesosite with a spatial resolution of about 5 km
• Downwelling SW and LW radiation from EUMETSAT Land Surface Analysis Satellite Applications Facility (Land-SAF)
• Air temperature, humidity, wind speed and surface pressure from ECMWF reanalyses
• Modelled time period: four years (2005-2008) for Benin and Niger, three years (2006-2008) for Mali

Setup (continued)
• Rainfall data – two interpolation methods: first, Lagrangian methodology + kriging (Lagrangian method when coherent structures can be identified from the rain gauge data, kriging otherwise); second, standard Thiessen polygon approach
• Land surface soil and vegetation background data – ECOCLIMAP v. 2, derived from Landsat and FAO data. Parameters provided: vegetation fractional coverage, type, albedo, height, LAI, rooting depth, minimum stomatal resistance; soil texture and depth, porosity, saturated hydraulic conductivity

Participating land surface models
• CLASS – Canadian Land Surface Scheme (EC)• CLM – Community Land Model (NCAR / Taiwan U.)• CLSM – Catchment Land Surface Model, based on NSIPP (NASA)• CLSM_NASA• COLA_SSiB (Center for Ocean, Land and Atmosphere Studies – USA)• HTESSEL – Hydrology Tiled ECMWF Scheme for Surface Exchange over Land• ISBA – Interactions between Soil, Biosphere and Atmosphere (Metéo-France)• JULES – Joint UK Land Environment Simulator (UKMO)• LIS-CABLE – Community Atmosphere Biosphere Land Exchange (NASA-GSFC)• LIS-MOSAIC – SiB + mosaic function (NASA-GSFC)• LIS-NOAH (NCEP)• MATSIRO – Minimal Advanced Treatment of Surface Interception and Runoff (U. of Tokyo)• ORCHIDEE – SECHIBA + STOMATE +LPJ (IPSL, Paris)• SETHYS – Suivi de l’Etat Hydrique des Sols (IPSL)• SPONSOR (Russian Academy of Sciences, Moscow)• SWAP (Institute of Water Problems, Moscow)• SiBUC – SiB + Urban Canopy (Kyoto U.)• STEP – Sahelian Transpiration, Evaporation and Prediction Model (France)

Designed for use with atmospheric models; main function is to provide the lower boundary conditions at the land surface
Evaluates the components of the energy and water budgets for soil, vegetation, and snow
In operational use in the Canadian Global Climate Model and the Canadian Regional Climate Model
In continuous development since 1987; latest version of CLASS, version 3.6, was released in 2011
CLASS (“Canadian Land Surface Scheme”)

How sensitive is the CLASS simulation to soil and vegetation characteristics?
• Compare base runs done using ECOCLIMAP parameters with runs using operational Canadian AGCM parameters
• Vegetation distributions obtained from GLC2000 dataset
• Albedos, heights, maximum and minimum leaf area index, rooting depths assigned to each class in lookup tables
• Soil texture and depth obtained from Webb et al. (1981) dataset, derived from FAO/UNESCO data
• Three experiments carried out: first using GLC2000 AGCM vegetation, at ALMIP2 resolution; then adding Webb soil, at AGCM resolution; then averaging vegetation and soil data and running each domain as a single grid cell.

Benin mesosite
Fallow area Beterou outlet
60% deciduous forest; rest tropical grassland and crops


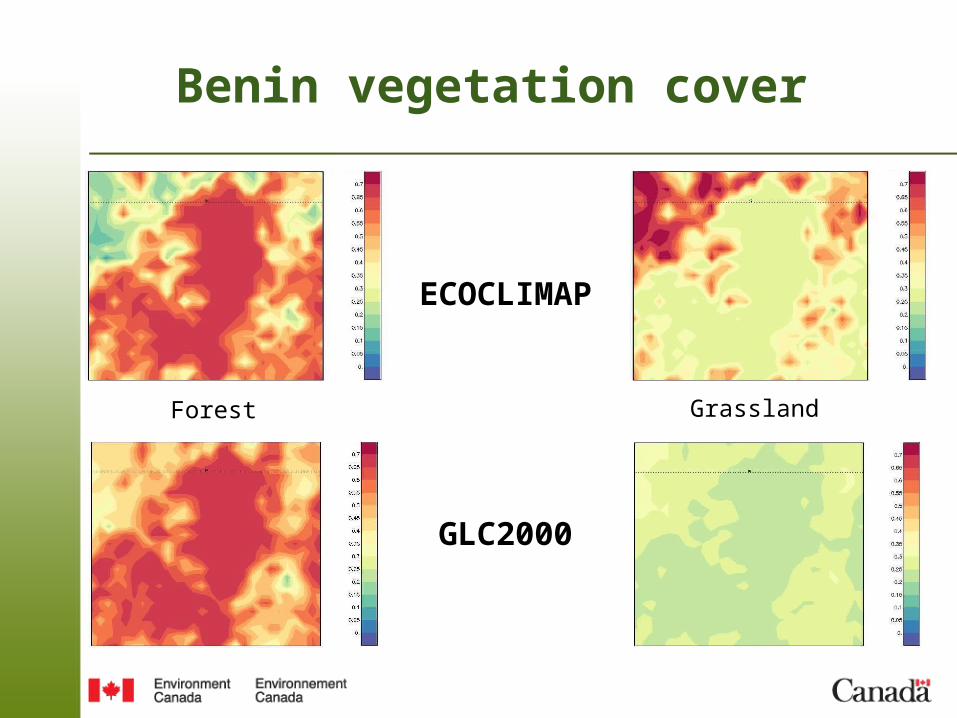
Benin vegetation cover
Forest
ECOCLIMAP
Grassland
GLC2000

Energy balance SWnet LWnet H LE
ECOCLIMAP v2 204.4 -78.5 52.3 73.0
GLC2000 + ECOCLIMAP 193.1 -76.5 47.8 68.3
GLC2000 + Webb 191.1 -74.4 42.7 73.6
All averaged 191.6 -74.4 43.7 73.2
Water balance PCP Evapg ETc ROF
ECOCLIMAP v2 97.2 28.1 44.3 18.2
GLC2000 + ECOCLIMAP 97.2 26.7 40.9 23.5
GLC2000 + Webb 97.2 30.0 43.2 11.2
All averaged 97.2 29.6 43.3 11.6
Benin site ALB FVEG RSMN SAND DPTH
ECOCLIMAP v2 0.15 0.82 65 51 1.9
GLC2000 + Webb 0.20 0.90 117 42 3.6
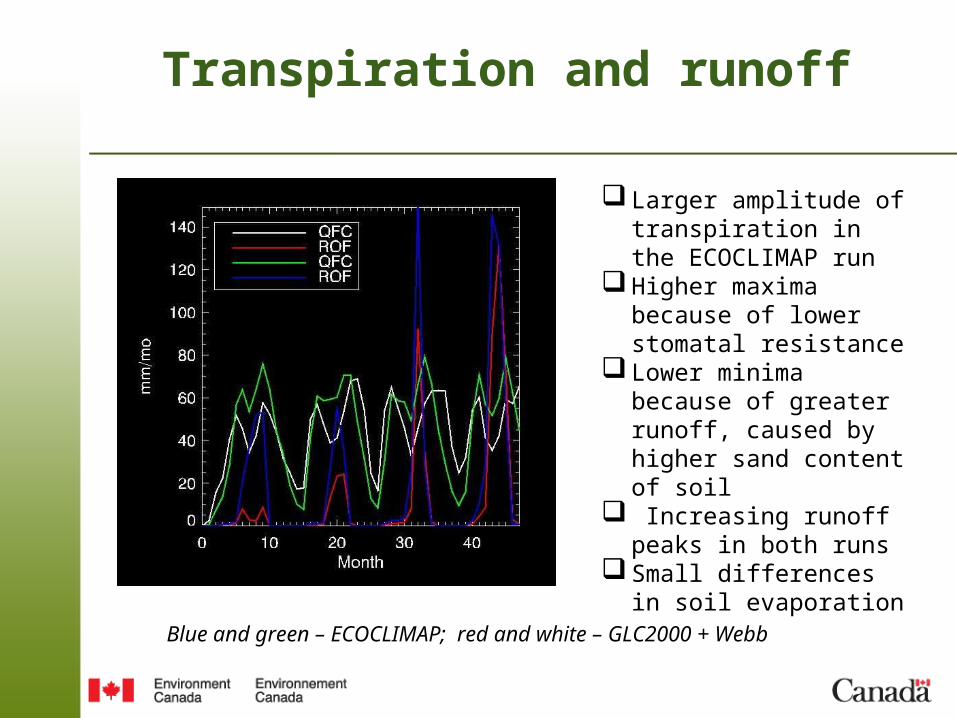
Transpiration and runoff
Larger amplitude of transpiration in the ECOCLIMAP run
Higher maxima because of lower stomatal resistance
Lower minima because of greater runoff, caused by higher sand content of soil
Increasing runoff peaks in both runs
Small differences in soil evaporation
Blue and green – ECOCLIMAP; red and white – GLC2000 + Webb

Soil moisture
The deep soil moisture in all runs was initialized to the wilting point (a function of soil texture). Over the Benin domain this turns out to be an underestimation, and the aftereffects persist for the duration of the simulation.
Red – ECOCLIMAPWhite – GLC2000 + Webb

Niger mesosite
Half tropical grassland, 20% “tiger bush”, 20% crops(in SW of domain; mainly millet); remainder bare soil


Niger vegetation cover
Forest Grassland
GL
C20
00E
CO
CL
IMA
P
Arable
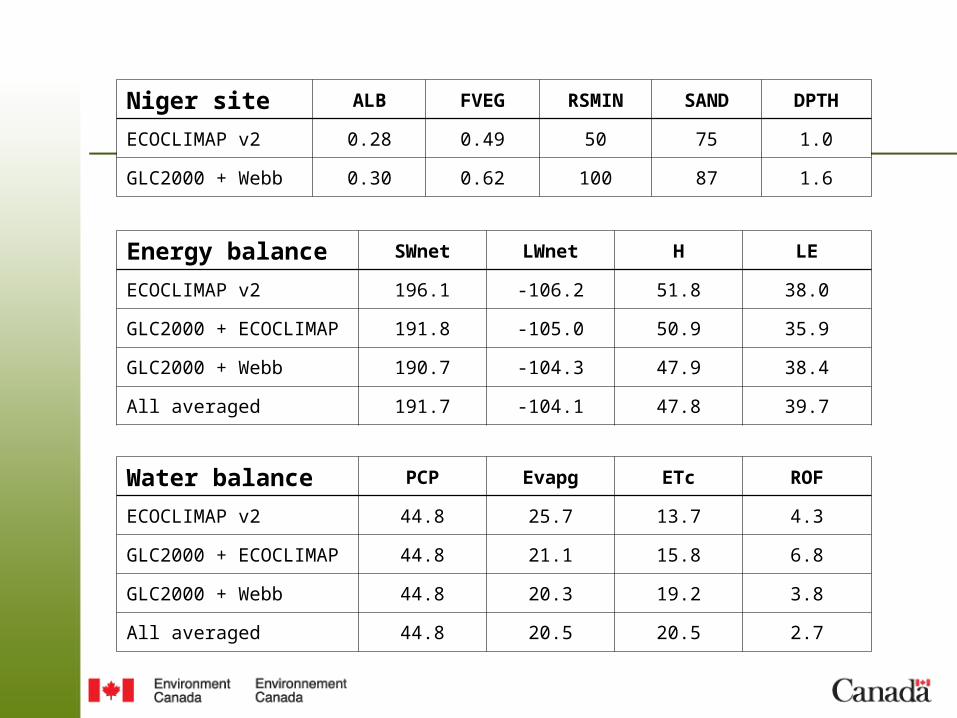
Energy balance SWnet LWnet H LE
ECOCLIMAP v2 196.1 -106.2 51.8 38.0
GLC2000 + ECOCLIMAP 191.8 -105.0 50.9 35.9
GLC2000 + Webb 190.7 -104.3 47.9 38.4
All averaged 191.7 -104.1 47.8 39.7
Water balance PCP Evapg ETc ROF
ECOCLIMAP v2 44.8 25.7 13.7 4.3
GLC2000 + ECOCLIMAP 44.8 21.1 15.8 6.8
GLC2000 + Webb 44.8 20.3 19.2 3.8
All averaged 44.8 20.5 20.5 2.7
Niger site ALB FVEG RSMIN SAND DPTH
ECOCLIMAP v2 0.28 0.49 50 75 1.0
GLC2000 + Webb 0.30 0.62 100 87 1.6

Transpiration and soil evaporation
Blue and green – ECOCLIMAP; red and white – GLC2000 + Webb
Runoff differs very little between the runs over this domain
Soil evaporation dominates because of low vegetation cover; lower in ECOCLIMAP, thus higher peaks
Transpiration declines more slowly with GLC2000 because of higher stomatal resistance (slower drawdown of soil moisture)
Thus, overall ET is similar in magnitude

Soil moisture
Variations in deep soil moisture reflect effects of evaporation and soil texture
ECOCLIMAP soil is less sandy, therefore greater water holding capacity, higher wilting point
ECOCLIMAP soil moisture levels off more rapidly because transpiration is not sustained as long
Red – ECOCLIMAPWhite – GLC2000 + Webb

Mali mesosite
Northern 1/3 of domain bare rock; rest mainly grassland and pasture, with 10% forest in low-lying areas

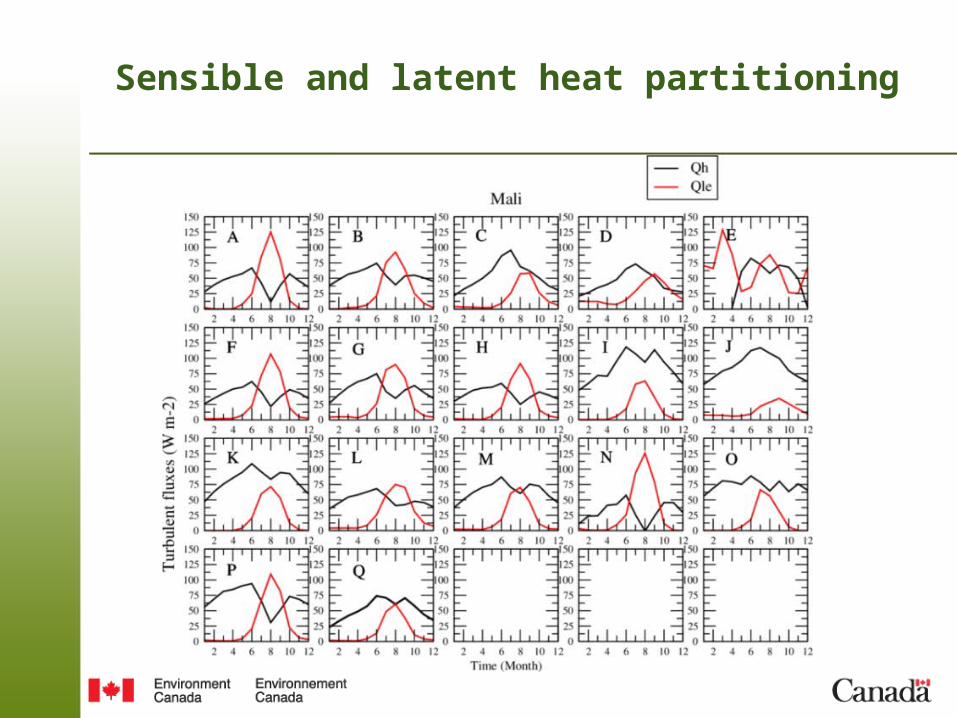
Sensible and latent heat partitioning

Mali vegetation cover
Forest
ECOCLIMAP
Grassland
GLC2000

Energy balance SWnet LWnet H LE
ECOCLIMAP v2 187.5 -112.6 48.3 26.7
GLC2000 + ECOCLIMAP 173.9 -109.1 38.8 26.2
GLC2000 + Webb 173.3 -109.0 37.6 26.7
All averaged 173.5 -108.9 37.5 27.2
Water balance PCP Evapg ETc ROF
ECOCLIMAP v2 28.8 20.7 7.1 0.5
GLC2000 + ECOCLIMAP 28.8 19.3 7.9 1.1
GLC2000 + Webb 28.8 18.9 8.8 0.1
All averaged 28.8 19.0 9.3 0.1
Mali site ALB FVEG RSMN SAND DPTH
ECOCLIMAP v2 0.29 0.35 30 78 0.8
GLC2000 + Webb 0.35 0.60 100 85 1.5

Sensible and latent heat fluxes
Blue and green – ECOCLIMAP; red and white – GLC2000 + Webb
Generally higher peaks with ECOCLIMAP because of more available energy (lower albedo); otherwise patterns are very similar
Soil evaporation dominates as in Niger, again because of low vegetation cover
Transpiration drops off faster with ECOCLIMAP because of lower stomatal resistance, as in Niger
Runoff is close to zero even in the rainy season, because of high evaporative demand

Soil moisture
Deep soil moisture content stays close to the minimum value for both runs, only rising slightly in the rainy season
The climate over this mesosite is almost completely dominated by the precipitation regime and the strong atmospheric demand; variations in soil and vegetation characteristics have little effect
Red – ECOCLIMAPWhite – GLC2000 + Webb
Conclusions
• Decreasing the resolution of background soil and vegetation information and using generic vegetation parameters have little effect on overall EB and WB partitioning (at least for CLASS)
• Evolution in time of EB and WB components was most strongly influenced by albedo, stomatal resistance, and soil texture
• Soil characteristics are at least as important as vegetation characteristics
• Large scatter between simulations by different models, even when highly constrained by forcing and background data, is worrisome, and indicates substantial differences between model physical parameterizations
• Next step: local-scale validation of models against flux tower data collected within the three mesoscale areas