Clark County update (PDF)
24
Clark County Department of Air Quality Ozone Advance Program Progress Report June 2015
Transcript of Clark County update (PDF)
Clark County Department of Air Quality
Ozone Advance Program
Progress Report
June 2015

Clark County: Ozone Advance Program Progress Report
ii

Clark County: Ozone Advance Program Progress Report
iii
Table of Contents 1. Introduction ........................................................................................................................................... 1-1
2. Ozone Health Effect and Sources ...................................................................................................... 2-4
3. Program Update .................................................................................................................................... 3-1
4. Emission Reductions ............................................................................................................................ 4-1
5. Conclusion ............................................................................................................................................. 5-1
Clark County: Ozone Advance Program Progress Report
iv
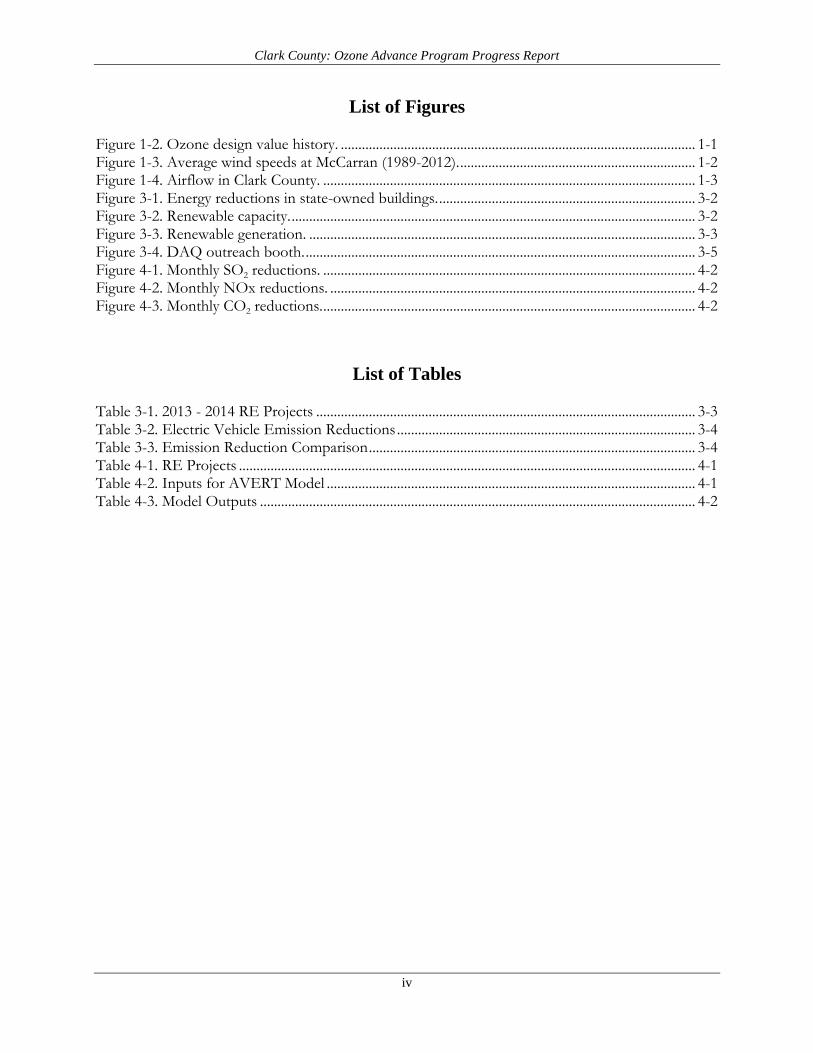
List of Figures Figure 1-2. Ozone design value history. ..................................................................................................... 1-1 Figure 1-3. Average wind speeds at McCarran (1989-2012). ................................................................... 1-2 Figure 1-4. Airflow in Clark County. .......................................................................................................... 1-3 Figure 3-1. Energy reductions in state-owned buildings. ......................................................................... 3-2 Figure 3-2. Renewable capacity. ................................................................................................................... 3-2 Figure 3-3. Renewable generation. .............................................................................................................. 3-3 Figure 3-4. DAQ outreach booth. ............................................................................................................... 3-5 Figure 4-1. Monthly SO2 reductions. .......................................................................................................... 4-2 Figure 4-2. Monthly NOx reductions. ........................................................................................................ 4-2 Figure 4-3. Monthly CO2 reductions. .......................................................................................................... 4-2
List of Tables Table 3-1. 2013 - 2014 RE Projects ............................................................................................................ 3-3 Table 3-2. Electric Vehicle Emission Reductions ..................................................................................... 3-4 Table 3-3. Emission Reduction Comparison ............................................................................................. 3-4 Table 4-1. RE Projects .................................................................................................................................. 4-1 Table 4-2. Inputs for AVERT Model ......................................................................................................... 4-1 Table 4-3. Model Outputs ............................................................................................................................ 4-2

Clark County: Ozone Advance Program Progress Report
v
List of Acronyms and Abbreviations
Acronyms
AQR Clark County Air Quality Regulation
AVERT Avoided Emissions and Generation Tool
CARB California Air Resources Board
CEA Consumer Electronics Association
CEP Clean Energy Project, Inc.
DAQ Clark County Department of Air Quality
EE energy efficiency
EV electric vehicle
EPA U.S. Environmental Protection Agency
HA hydrographic area
IRTA Institute for Research and Technical Assistance
NAAQS National Ambient Air Quality Standards
PV photovoltaic
RE renewable energy
RTC Regional Transportation Commission of Southern Nevada
Abbreviations
CO carbon monoxide
CO2 carbon dioxide
kWh kilowatt-hour
GWh gigawatt-hour
MW megawatt
MWh megawatt-hour
NOx nitrogen oxides
ppb parts per billion
ppm parts per million
VOC volatile organic compounds

Clark County: Ozone Advance Program Path Forward
1-1
1. Introduction
The Clark County Department of Air Quality (DAQ) enrolled in U.S. Environmental Protection
Agency (EPA) Ozone Advance program on June 12, 2013. The program’s goal is to help
maintenance and attainment areas ensure continued health protection, to better position those
areas to remain in attainment, and to efficiently direct available resources toward actions to
address ozone and its precursors.
Current Attainment Status
Clark County was a maintenance area for the 1997 8-hour ozone National Ambient Air Quality
Standard (NAAQS), and the 1997 NAAQS was revoked on April 6, 2015, by the 2008 ozone
NAAQS implementation rule. Clark County is currently in attainment/unclassifiable for the 2008
8-hour ozone standard. By law, the state of Nevada uses hydrographic areas (HAs) to define
airsheds.
The Clark County ozone design value history in Figure 1-2 shows a downward trend from 2007
through 2011; however, the design values increased in 2012, 2013, and 2014.
Figure 1-1. Ozone design value history.

Clark County: Ozone Advance Program Progress Report
1-2
DAQ is in the process of completing exceptional event packages for wildfires that occurred in
2013. If the Region 9 office of the EPA will concur with DAQ’s findings, the design values will
lower to near or under the NAAQS.
Impacts of Meteorological Conditions on Ozone Concentrations
High ozone events in Clark County generally occur during weather patterns characterized by
high pressure. Regional wind fields are also influenced by the local terrain, which channels
winds through passes, slopes, and valleys. Such slope-and-valley wind systems are local,
thermally driven flow circulations created in complex terrain areas like the Las Vegas Valley.
These systems directly affect the transport and dispersion of pollutants.
According to historical data collected at McCarran International Airport1, the highest average
wind speeds in Clark County occur in the early spring (April–May), the same months that ozone
concentrations increase rapidly. Figure 1-3 shows average wind speeds during the year.
Figure 1-2. Average wind speeds at McCarran (1989-2012).
The northwest quadrant of the Las Vegas Valley typically experiences the highest ozone levels
when Clark County experiences elevated ozone concentrations. Often stagnant flow conditions in
the populated urban areas of California increase ozone concentrations, which can transport to
southern Nevada and contribute to widespread exceedances throughout the Clark County
network. Figure 1-4 shows the predominant airflow in Clark County; the general airflow enters
from the south (following I-15) and exits to the northwest (following U.S. Highway 95).
1 http://weatherspark.com/averages/30697/Las-Vegas-Nevada-United-States.

Clark County: Ozone Advance Program Progress Report
1-3
Figure 1-3. Airflow in Clark County.
Several studies directed by DAQ confirmed that there is transport from Southern California into
Clark County; however, the contribution from local versus transported ozone is difficult to
quantify without extensive regional modeling analyses.
Clark County: Ozone Advance Program Progress Report
2-4
2. Ozone Health Effect and Sources2
Overview of Ozone
Ozone (O3) is a tri-atomic ion of oxygen. In the stratosphere or upper atmosphere, ozone occurs
naturally and protects the Earth’s surface from ultraviolet radiation. Ozone in the lower
atmosphere is often called ground-level ozone, tropospheric ozone, or ozone pollution to
distinguish it from upper-atmospheric or stratospheric ozone. Ozone occurs naturally in the
lower atmosphere (troposphere) and in most locations background ozone is relatively low, well
below the NAAQS. However, at higher locations in the west, background ozone can be modeled
at levels approaching the NAAQS. The term “smog” is also commonly used to refer to ozone
pollution.
Although ozone is a component of smog, smog is a combination of ozone and airborne particles
having a brownish or dirty appearance. It is possible for ozone levels to be elevated even on clear
days with no obvious “smog.” In the lower atmosphere, ozone is formed when airborne
chemicals, primarily nitrogen oxides (NOx) and volatile organic compounds (VOCs), combine in
a chemical reaction driven by heat and sunlight. These ozone-forming chemicals are called
precursors to ozone.
Manmade NOx and VOC precursors contribute to ozone concentrations above natural
background levels. Since ozone formation is greatest on hot, sunny days with little wind,
elevated ozone concentrations occur during the warm weather months, generally April through
September. In agreement with EPA’s guidance, Clark County operates certain ozone monitors
year-round.
Ozone Health Effects
When people breathe ozone, it acts as an irritant to the lungs. Short-term, infrequent exposure to
ozone can result in throat and eye irritation, difficulty drawing a deep breath, and coughing.
Long-term and repeated exposure to ozone concentrations above the NAAQS can result in
reduction of lung function as the cells lining the lungs are damaged.
Repeated cycles of damage and healing may result in scarring of lung tissue and permanently
reduced lung function. Health studies indicate that high ambient ozone concentrations may
impair lung function growth in children and result in reduced lung function in adulthood. In
adults, ozone exposure may accelerate the natural decline in lung function that occurs as part of
the aging process. Ozone may aggravate chronic lung diseases such as emphysema and
bronchitis and reduce the immune system’s ability to fight off bacterial infections in the
respiratory system.
Asthmatics and others with respiratory disease are especially at risk from elevated ozone
concentrations. Ozone can aggravate asthma, increasing the risk of asthma attacks that require a
doctor’s attention or the use of additional medication. According to the EPA, one reason for this
2 Text borrowed from Cumberland County, North Carolina Path Forward plan
Clark County: Ozone Advance Program Progress Report
2-5
increased risk is that ozone increases susceptibility to allergens, which are the most common
triggers for asthma attacks. In addition, asthmatics are more severely affected by the reduced
lung function and irritation that ozone causes in the respiratory system. There is increasing
evidence that ozone may trigger, not just exacerbate, asthma attacks in some individuals.
All children are at risk from ozone exposure because they often spend a large part of the summer
playing outdoors, their lungs are still developing, they breathe more air per pound of body
weight, and they are less likely to notice symptoms. Children and adults who frequently exercise
outdoors are particularly vulnerable to ozone’s negative health effects because they may be
repeatedly exposed to elevated ozone concentrations while breathing at an increased respiratory
rate.
Ozone Sources
Ozone-forming pollutants, or precursors, are VOCs and NOx.
Volatile Organic Compounds
VOCs are sometimes referred to as hydrocarbons. In Clark County, large portions of precursor
VOCs are produced by natural (biogenic) sources, primarily trees. Man-made (anthropogenic)
VOCs also contribute to ozone production, particularly in urban areas. Sources of anthropogenic
VOCs include unburned gasoline fumes from gas stations and cars, industrial emissions, and
consumer products such as paints, solvents, and the fragrances in personal care products.
Nitrogen Oxides
NOx is produced when fuels are burned and result from the reaction of atmospheric nitrogen at
the high temperatures produced by burning fuels. Power plants, highway motor vehicles (the
major contributor in urban areas) and off-road mobile source equipment, such as construction
equipment, lawn care equipment, trains, and boats, are the major sources of NOx. Other NOx
sources include “area” sources, which are small, widely distributed sources such as fires (forest
fires, backyard burning, house fires, etc.) and natural gas hot water heaters.
Source Categories
The following lists the sources, by category, that contribute to NOx and VOC emissions:
Biogenic: Trees and other natural sources.
Mobile: Vehicles traveling on paved roads: cars, trucks, buses, motorcycles, etc.
Nonroad: Vehicles not traveling on paved roads: construction, agricultural, and lawn care
equipment, motorboats, locomotives, etc.
Point: “Smokestack” sources: industry and utilities.

Clark County: Ozone Advance Program Progress Report
2-6
Area: Sources not falling into the above categories. For VOCs this includes gas stations, dry
cleaners, print shops, and consumer products. For NOx this includes forest and residential fires,
natural gas hot water heaters, etc.
Source Apportionment Modeling
DAQ has conducted several studies to characterize ozone transport, and the results show that
interstate transport significantly impacts Clark County. Transport from Asia and stratospheric
ozone intrusions also contribute to ozone concentrations. While it is difficult to quantify
transport contributions from any of these sources, DAQ plans to perform source apportionment
modeling in the near future, with the goal of identifying sources that affect ozone concentrations
in the county. The new 2011 computer modeling platform that EPA is proposing may be able to
analyze interstate transport and better characterize source contributions.
Past modeling results show that the background ozone concentration in Clark County is between
40 and 45 parts per billion (ppb). Modeling also shows that transport into Clark County from
inside and outside the United States is between 20 and 40 percent, depending on the episode.
Clark County: Ozone Advance Program Path Forward
3-1
3. Program Update
The initiatives described in the Ozone Advance Path Forward submittal of June 23, 2014
are still ongoing. The sections in this chapter are either updates to existing initiatives
outlined in the original submittal, or new initiatives commenced after the submittal. The
sections are identified as Update or New Initiative.
Energy Efficiency
Several agencies and businesses in Clark County promote voluntary measures to control ozone
precursors from mobile sources and energy usage. Government entities and private companies
both offer many different opportunities for the citizens of Clark County to engage in programs
that reduce emissions.
It is difficult, however, to achieve long-lasting results from voluntary programs because they
involve a behavior change. Therefore, education and outreach are key components of any
successful program. Recognizing this, the agencies and businesses promoting voluntary control
measures have developed sets of materials to use in outreach campaigns to actively promote and
improve their programs.
Renewable Energy
Many renewable energy projects were initiated over the last few years. Federal grants and the
NV Renewable Portfolio Standard (RPS) are the drivers for the projects. The following
paragraphs give a brief overview of the projects, at various levels, that were finished between
2011 and 2013 and the projects that are scheduled to be finished in the next couple of years.
State wide - Update
Although Nevada was one of the front-runners of renewable energy generation between 2011
and 2012 when the amount of renewable energy produced in Nevada increased by 19 percent, it
was the 2013 Legislative Session that helped to encourage growth in all market sectors. In 2014,
Nevada installed 339 megawatt (MW) of solar electric capacity, ranking it 3rd nationally. The
789 MW of solar energy currently installed in Nevada ranks the state 5th in the country in
installed solar capacity.
The Nevada Office of Energy is the gatekeeper of many of the federal funds and grants available
to agencies and entities in the state, distributing and tracking the funds it receives for projects in
Nevada. The office has a directive, per the Nevada Revised Statutes, to prepare a state energy
plan that reduces the amount of energy purchased for state-owned buildings and facilities.
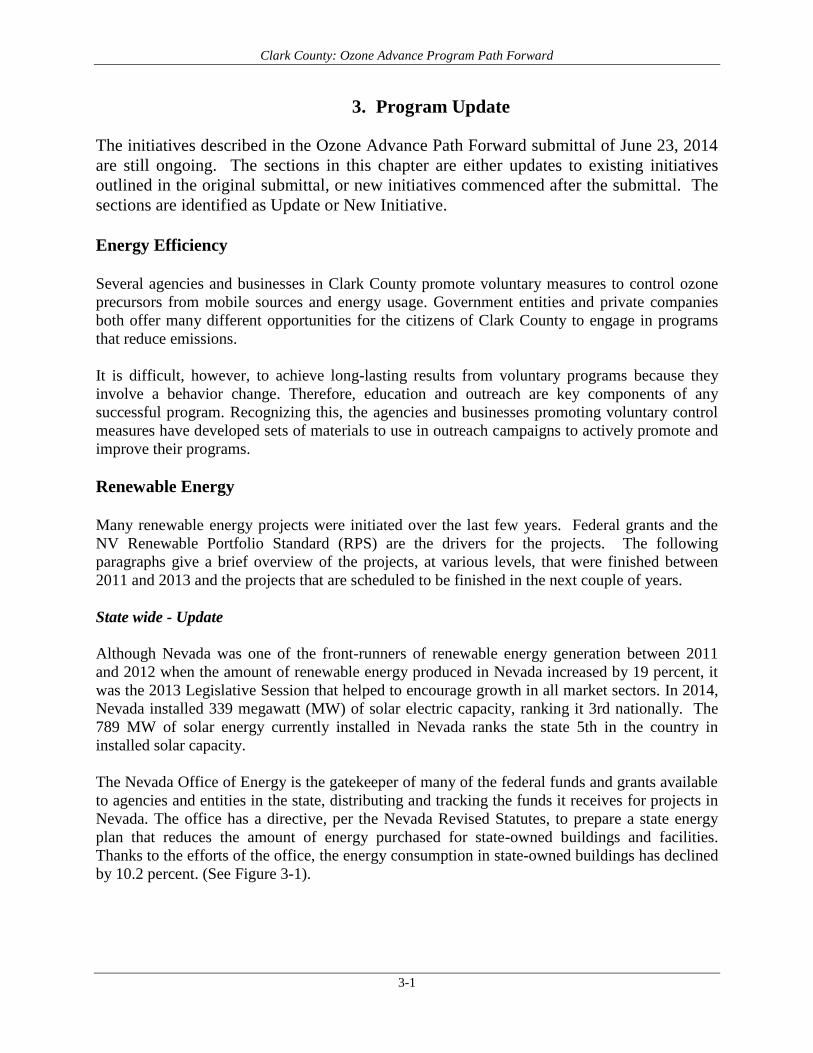
Thanks to the efforts of the office, the energy consumption in state-owned buildings has declined
by 10.2 percent. (See Figure 3-1).
Clark County: Ozone Advance Program Progress Report
3-2
Figure 3-1. Energy reductions in state-owned buildings.
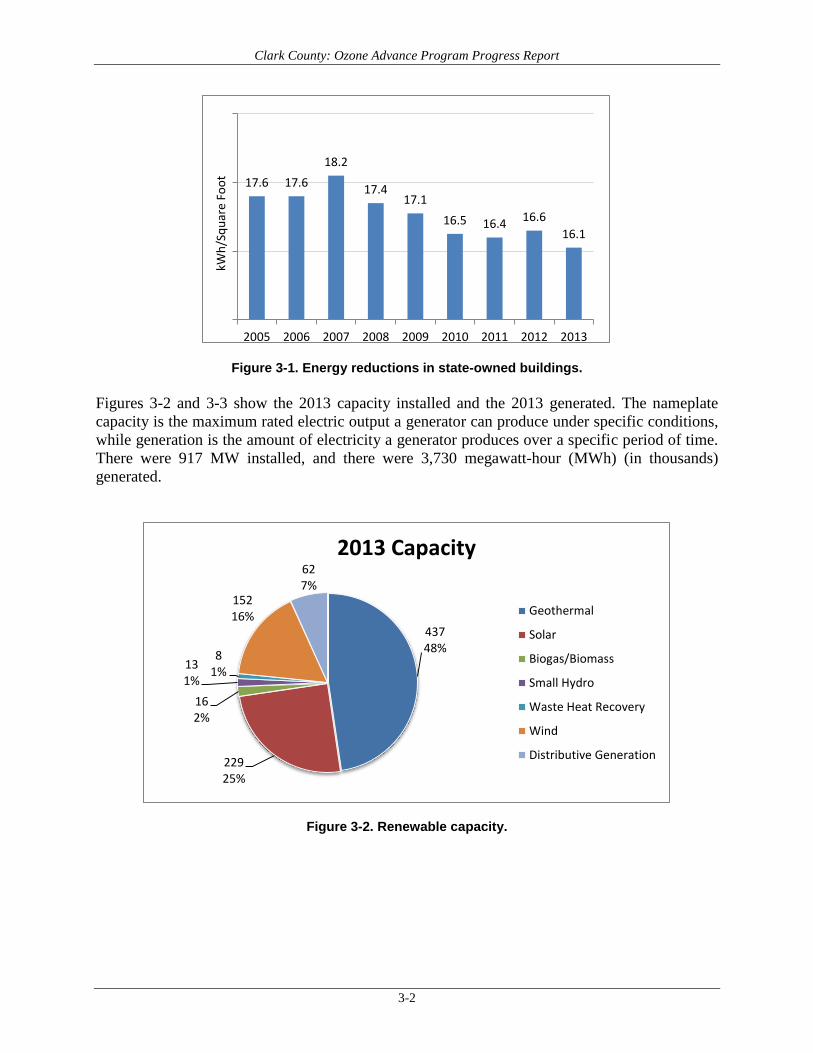
Figures 3-2 and 3-3 show the 2013 capacity installed and the 2013 generated. The nameplate
capacity is the maximum rated electric output a generator can produce under specific conditions,
while generation is the amount of electricity a generator produces over a specific period of time.
There were 917 MW installed, and there were 3,730 megawatt-hour (MWh) (in thousands)
generated.
Figure 3-2. Renewable capacity.
17.6 17.6
18.2
17.4 17.1
16.5 16.4 16.6
16.1
2005 2006 2007 2008 2009 2010 2011 2012 2013
kWh
/Sq
uar
e Fo
ot
437 48%
229 25%
16 2%
13 1%
8 1%
152 16%
62 7%
2013 Capacity
Geothermal
Solar
Biogas/Biomass
Small Hydro
Waste Heat Recovery
Wind
Distributive Generation

Clark County: Ozone Advance Program Progress Report
3-3
Figure 3-3. Renewable generation.
Copper Mountain 2 in Boulder City was completed in 2012 by developer First Solar. This
photovoltaic (PV) project has the capacity to generate 92 MW of electricity. Another utility
scale project, Copper Mountain 3, with a capacity of 250 MW, is currently under construction in
Boulder City and is scheduled to come online in 2015. At 110 MW, Crescent Dunes Solar
Energy Project in Nye County is among the largest solar installations in Nevada and was
completed in 2014 by SolarReserve. Table 3-1 shows some of the Clark County projects that
were completed by the end of 2014, or will be completed by the end of 20153.
Table 3-1. 2013 - 2014 RE Projects
PROJECT SIZE TYPE COUNTY
City of Las Vegas East Yard 100 kW Photovoltaic Clark
City of Las Vegas West Yard 200 kW Photovoltaic Clark
City of Las Vegas Durango Hills 200 kW Photovoltaic Clark
City of Las Vegas received three loans from the State Energy Office totaling $1.2 million to help
fund construction of three solar parking shade structures. The projects are expected to produce
1.2 million kilowatt-hour (kWh) of power annually and reduce greenhouse gas emissions by an
estimated 23.8 million pounds of carbon dioxide (CO2) during the first 20 years of operation.
Spring Valley is a 152 MW project located in White Pine County, Nevada. Spring Valley is
situated on approximately 7,680 acres on federal land administered by the Bureau of Land
Management, which granted the project a right-of-way. The project consists of 66 2.3 MW
Siemens turbines that commenced commercial operation in August 2012. One hundred percent
of the project's output, including electricity generation and environmental attributes, is sold to
3 2014 Status of Energy Report for the State of Nevada
2732 73%
496 13%
74 2%
55 2%
39 1%
258 7%
76 2%
2013 Generation
Geothermal
Solar
Biogas/Biomass
Small Hydro
Waste Heat Recovery
Wind
Distributive Generation

Clark County: Ozone Advance Program Progress Report
3-4
NV Energy under a long-term power purchase agreement. Spring Valley connects to the NV
Energy transmission system and was Nevada's first commercial wind power project.
Moapa River Indian Reservation, Moapa - First Solar, a leading provider of comprehensive PV
energy solutions, is constructing a 250 MW alternating current (AC) solar project located on
approximately 2,000 acres on the Moapa River Indian Reservation in Clark County, Nevada.
Moapa Southern Paiute Solar, LLC (a subsidiary of First Solar Electric, LLC) is the project
owner and will construct the project using First Solar’s advanced PV thin film solar
modules. When fully operational, the project will generate enough clean solar energy to serve
the needs of about 100,000 homes per year, displacing approximately 178,000 metric tons of
CO2 annually—the equivalent of taking about 34,000 cars off the road.. Construction has begun
and is expected to be complete by June 2016.
Clark County Department of Air Quality (DAQ)
Congestion Mitigation Projects – New Initiative
DAQ’s used CMAQ grants to apply for congestion mitigation projects. Three proposals were
submitted and an Electric Vehicle (VE) purchase project was selected. The Electric Vehicle
project has three phases. Phase 1 occurs in FY15 during which DAQ will acquire 8 EVs and 8
charging stations for inclusion in the county fleet. In the second phase, during FY16, DAQ will
purchase 13 additional EVs and charging stations. In the third phase, during FY17, eight more
EVs will be added to the fleet. The electric vehicles will be Chevy Volts. Table 3-2 shows the
total vehicle emission reductions by 2017 over the lifetime of the vehicles, and Table 3-3 shows
the total emissions reduction comparison with a mid-size gasoline car, in this case a Chevy
Impala. Table 3-2. Electric Vehicle Emission Reductions
Pollutant Emission
Reductions (kg/day/vehicle)
Emission Reductions (kg/day/all vehicles)
Total Emission Reductions over Vehicle Life(s)
(kg/all vehicles)
Volatile Organic Compounds (VOCs) 0.02 0.52 2,175
Carbon Monoxide (CO) 0.14 4.12 17,151
Nitrogen Oxides (NOx) 0.02 0.51 2,103
Table 3-3. Emission Reduction Comparison
Pollutant Percent
Reduction
Volatile Organic Compounds (VOCs) 70%
Nitrogen Oxides (NOx) 60%
Average: 66%

Clark County: Ozone Advance Program Progress Report
3-5
DAQ Public Education and Outreach Program - Update
The goal of DAQ’s Public Education and Outreach Program is to enhance its interaction with the
community and industry in efforts to create citizen awareness and an interest in air quality,
transform behaviors and habits, and encourage voluntary air pollution-reducing actions.
Figure 3-4. DAQ outreach booth.
To this end, DAQ has developed and distributed to the public several brochures on air quality
with an emphasis on ozone. Additionally, the public can sign up for EPA’s EnviroFlash alerts
through DAQ’s Web site. Every year, Clark County issues a season-long ozone advisory that
informs the public of ozone’s health effects and suggests ways to reduce ozone pollution. DAQ
also provides daily air quality reports and forecasts on its Web site, along with real-time
monitoring data.
DAQ engages with external organizational committees that focus on public outreach and
communication. In the last year, DAQ has redesigned brochures on specific air quality topics and
issues, identified outreach opportunities, reviewed outreach material other agencies, and ordered
tchotchke for outreach events. To reach a broader audience in the community, DAQ is making
an effort to target events that differ from a traditional environmental purpose. Additionally, the
public outreach budget was increased to accommodate all the activities above.
Thus far, DAQ participated in the outreach activities listed below:
October 2014 - Las Vegas Green Up at Las Vegas Wash
November 2014 - Clark County Health and Wellness Fair
February 2015 - Black History Month Celebration at the Springs Preserve
March 2015 - March 18 Senior Expo and Health Fair
March 2015 - Springs Preserve Annual Plant Sale and Green Expo
April 2015 - Ask the Expert Day at Clark County Government Center
April 2015 - Green Fest -Earth day celebration at Downtown Summerlin
May 2015 - Science and Technology Expo
May 2015 - Better Breeders Club
May 2015 – Jazz in the Park

Clark County: Ozone Advance Program Progress Report
3-6
June 2015 - Jazz in the Park
Some visitors are aware of the department’s presence and function in the community. They are
inquisitive and ask very specific questions about air quality and seem to have an understanding
how air quality affects their health. At the other end of the spectrum, many visitors are not aware
that Clark County has a Department of Air quality and want to know more about the
department’s activities and function.
The goal of outreach is to communicate the department’s purpose to the community through
public, private, and business events in a professional, informative, and friendly manner. DAQ
believes it is essential to educate the public to allow them to make informed decisions about their
health and welfare. For example, DAQ informs them of EnviroFlash and lets them know they
can sign up for air quality forecasts. DAQ also lets them know that near-real time monitoring
data is available on the department’s Web site. DAQ’s management believes that its Public
Education and Outreach program has been successful thus far.
Pollution Prevention Grant Program – New Initiative
DAQ will participate in the “Multi-State Collaboration to Demonstrate Safer Low-VOC, Low
Toxicity Alternatives in Auto Repair and Industrial Cleaning Applications in EPA Region IX”
project. The project will focus on demonstrating safer alternative cleaners used by auto repair
and industrial facilities for repair and maintenance cleaning, brake cleaning, batch loaded cold
cleaning, and vapor degreasing. Demonstrations will be conducted in California, Arizona, and
Nevada (the three state collaborators) to illustrate how facilities can convert to water-based
cleaning processes. Outreach materials will be prepared for the four cleaning applications and
they will be widely disseminated4. California Air Resources Board (CARB) is partnering with
Institute for Research and Technical Assistance (IRTA) and with agencies in Arizona and
Nevada on the proposed project. Specifically, the project will involve:
• Collecting and analyzing information on repair and maintenance cleaning, brake
cleaning, batch loaded cold cleaning and vapor degreasing in the project participant
jurisdictions;
• Estimating emissions of VOCs and toxics in these four applications;
• Investigating the current status of the four applications in Southern California;
• Selecting demonstration sites in the project participant jurisdictions;
• Equipping, arranging, and conducting demonstrations;
• Updating costs and conducting cost analysis of water-based cleaning and solvent cleaning
in the four applications;
• Developing stand-alone case studies for each application;
• Assisting some facilities in conversions; and
• Preparing final report and outreach materials and arranging and holding a webinar
4 Fiscal Year 2015 Pollution Prevention Grant Program EPA-HQ-OPPT-2015-002.
Clark County: Ozone Advance Program Progress Report
3-7
The ultimate goal is to convince affected facility owners to switch to water-based products, thus
reducing the total VOC emissions from these facilities.
DAQ support for Club Ride program – New Initiative DAQ will support the Regional Transportation Commission of Southern Nevada’s (RTC’s) Club
Ride program by providing $200,000 for an advertising campaign promoting the program. The
goal is to significantly increase the participation in the program with television ads, pamphlets,
and other outreach materials. The projected start of the campaign is mid-2015.
Clean Energy Project
Clean Energy Project, Inc. (CEP) is a nonprofit, nonpartisan organization dedicated to powering
the clean energy economy through education and engagement with policy leaders, community
leaders, and citizens on the economic benefits of fully developing a clean energy economy.
Welcome to Fabulous Las Vegas5 - New Initiative
CEP and Green Chips6 worked with the Clark County Commission to develop a solar project to
power the “Welcome to Fabulous Las Vegas” sign with Nevada’s own solar energy. The
installation allows The Strip's most iconic landmark's legendary neon and incandescent lights to
run solely on harnessed solar energy. Converting this iconic sign's power source to solar provides
an example to the Las Vegas community that clean, renewable energy can help power
businesses, homes, or even signs throughout Nevada.
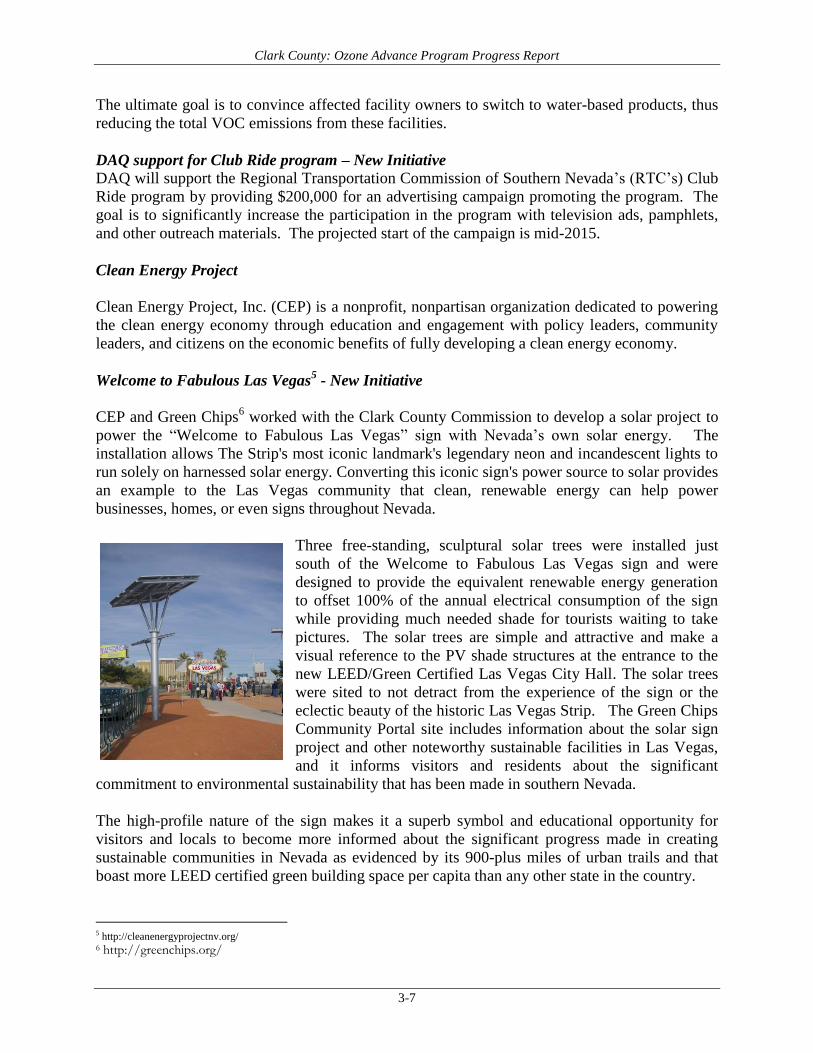
Three free-standing, sculptural solar trees were installed just
south of the Welcome to Fabulous Las Vegas sign and were
designed to provide the equivalent renewable energy generation
to offset 100% of the annual electrical consumption of the sign
while providing much needed shade for tourists waiting to take
pictures. The solar trees are simple and attractive and make a
visual reference to the PV shade structures at the entrance to the
new LEED/Green Certified Las Vegas City Hall. The solar trees
were sited to not detract from the experience of the sign or the
eclectic beauty of the historic Las Vegas Strip. The Green Chips
Community Portal site includes information about the solar sign
project and other noteworthy sustainable facilities in Las Vegas,
and it informs visitors and residents about the significant
commitment to environmental sustainability that has been made in southern Nevada.
The high-profile nature of the sign makes it a superb symbol and educational opportunity for
visitors and locals to become more informed about the significant progress made in creating
sustainable communities in Nevada as evidenced by its 900-plus miles of urban trails and that
boast more LEED certified green building space per capita than any other state in the country.
5 http://cleanenergyprojectnv.org/ 6 http://greenchips.org/

Clark County: Ozone Advance Program Progress Report
3-8
In April 20147, CEP has released the “Buy Green List,” Nevada’s first sustainability-driven
consumer guide in observance of Earth Day and Earth Week. “Empowering consumers by
informing them about local companies, which not only support the clean energy economy, but
also benefit from clean business practices, is essential to increasing demand for the clean energy
economy,” said Lydia Ball, executive director CEP. “With this early success, we are confident
even more Nevada businesses will become Buy Green List participants as the program continues
to grow and expand.”
In late March, CEP held an introductory seminar outlining the “Buy Green List” program to
interested companies and organizations. In less than three weeks more than 50 Nevada-based
companies and organizations from various industries committed to become more sustainable.
“First Friday strives to lead in festivals becoming more environmentally conscious,” said Charles
Ressler with First Friday. “We want to show that from office to outdoor, festival production
companies can reduce their impact and educate their attendees, thus inspiring other companies
and festivals to do the same.”
The “Buy Green List” program is intended to grow with the goal of having a majority of
Nevada-based businesses pledge to become more energy conscious. To be listed, companies
must:
• Sign a pledge supporting clean energy practices in Nevada including increased clean
energy generation, increased energy saving practices, and improved energy efficiency;
• Sign up for NV Energy’s MyAccount program to easily track energy usage;
• Sign up for NV Energy’s paperless billing service; and
• Agree to implement a number of energy saving practices within their company and
educating employees how to be more energy smart.
The following link provides information about the program, about the “Green Buy List,” and
how to apply: http://www.cleanenergyprojectnv.org/buy-green-list.
Clark County Automotive Fleet - Update
According to Automotive Fleet magazine, Clark County’s automotive fleet was rated No. 6 in
the nation for having the highest percentage of hybrids in its fleet. No other public sector fleet in
Nevada was found to be in the top 25.
The finding is significant since Clark County’s fleet is already the third largest in the state
(behind the state of Nevada and the Clark County School District).
The County has 2,775 vehicles, 539 of which are hybrid (using a combination of gasoline and
electricity). The hybrid portion accounts for 19 percent of the county fleet. DAQ believes this is
a strong indication of commitment to conserve energy and reduce air pollution.
7 http://cleanenergyprojectnv.org/

Clark County: Ozone Advance Program Progress Report
3-9
Regional Transportation Commission - New Initiative
The RTC is the transit authority and transportation/planning agency for southern Nevada. One of
its major goals is to implement and update Clark County’s transportation systems to improve air
quality. In April 2015 EPA honored the Club Ride Commuter Services with its 2015 Clean Air
Excellence Award for its commuter program designed to improve air quality and encourage
commute alternatives such as riding transit, carpooling, vanpooling, walking, bicycling, working
compressed work weeks, and telecommuting. The 2015 Clean Air Excellence Award recognizes
innovative state, local, tribal, and private sector programs that protect health and the
environment, educate the public, serve their communities, and boost the economy.
“With over one million clean commute trips reported this year, Club Ride has saved Nevadans
$1.6 million in commuting costs,” said Jared Blumenfeld Regional Administrator for EPA’s
Pacific Southwest Office. “Southern Nevadans breathe cleaner air thanks to this award-winning
program.”
“We have been working diligently with community partners to create a cleaner, more sustainable
Southern Nevada,” said RTC's general manager Tina Quigley. “We are proud to receive this
great accolade and to share it with our partners as we continue to improve the quality of life for
the millions of residents and visitors to Southern Nevada.”
Club Ride partners with nearly 300 employers and more than 24,000 registered commuters in
Clark County to meet these goals. Club Ride’s efforts improve air quality and the overall quality
of life. Club Ride’s additional 2014 highlights include: 59 tons of CO emissions reduced; 2,324
tons of greenhouse gases reduced; 5.9 million miles removed from the road; and 10,287 new
commuters welcomed to the program.
Club Ride recognizes the unique 24-hour workforce in Clark County and has tailored its program
to meet the needs of each employer. Outreach coordinators conduct over 650 worksite and
community events every year, including health fairs, orientations, and special events such as
Bike Week and Earth Day.
A network of live freeway traffic cams alerts commuters to possible traffic gridlocks so they can
avoid traffic congestion. RTC also set up a Bike Center in downtown Las Vegas that provides
free parking for 75 bikes and free workshops on bike repair. Additionally, RTC has an extensive
electric bike program for government employees in the downtown area.
NV Energy – Unit Shutdown – New Initiative
In June 2013, Nevada’s governor signed a law accelerating the retirement of Reid Gardner
Generating Station. Three of the plant's four units were closed in December 2014, and the
remaining unit will close in 2017.
NV Energy has announced that it is seeking proposals to acquire a new generating resource with
approximately 54 MW of planning capacity resources for southern Nevada customers as part of
its 2015 Emissions Reduction Capacity Replacement Plan Request for Proposals for a new

Clark County: Ozone Advance Program Progress Report
3-10
generating facility of no less than 54 MW and no more than 68 MW, and with a commercial
operation date no earlier than May 2018.
Highway projects - Update
Project Neon has six phases and is scheduled for completion in 2019. NDOT started Phase 1 on
the project and is scheduled to be finished in 2016. The project is designed to alleviate
congestion by providing alternatives to motorists who travel daily on I-15. The project includes
High-Occupancy Vehicle lanes between U.S. 95 and I-15, along with better connections to
surface streets into the downtown area. This project will reduce emissions from NOx, an ozone
precursor.
Boulder City Bypass project involves road improvements to U.S. Highway 93, a major regional
commercial corridor and the single route through Boulder City. As a major urban arterial,
Highway 93 carries 32,000 east-west traffic vehicles per day. Construction of the project Phase 1
started in early 2015 and includes the Railroad Pass interchange with a project length of 2.5
miles. The second phase of the project is 12.5 miles long and will bypass Boulder City.
Construction is anticipated to start in May 2015.

Clark County: Ozone Advance Program Path Forward
4-1
4. Emission Reductions DAQ used EPA’s AVoided Emissions and geneRation Tool (AVERT) to calculate the emission
reductions since 2012 due significantly to renewable energy and energy efficiency programs.
The table below is an update of the completed projects and their MW capacities.
Table 4-1. RE Projects
Type Project MW
Solar Boulder City Copper Mountain 2 92
Boulder City Copper Mountain 3 250
Crescent Dunes 110
Moapa 250
Spectrum 30
NV Energy Solar Electric Program 5
Solar Total 737
Wind Spring Valley 152
Wind Total 152
Table 4-2 shows the corresponding input file for the AVERT model.
Table 4-2. Inputs for AVERT Model
Enter EE impacts based on the % reduction of regional fossil load
Reduce generation by a percent in some or all hours
Apply reduction to top X% hours: 0%
% of top hours
Reduction % in top X% of hours: 0.0% % reduction
And/or enter EE impacts distributed evenly throughout the year
Reduce generation by annual gigawatt-hour (GWh): 0 GWh
OR
Reduce each hour by constant MW: 0.0 MW
And/or enter annual capacity of RE resources Wind Capacity: 152 MW
Utility Solar PV Capacity:
737
MW
Rooftop Solar PV Capacity: 0 MW
According to the model, the updated renewable energy generation displaced 379,600 MWh. This
equals a reduction of 50,400 pounds (25.2 tons per year) of NOx. During the ozone season,
renewables displaced a total of 35,400 pounds (17.7 tons) of NOx in Clark County (Table 4-3).
Figures 4-1, 4-2, and 4-3 show the SO2, NOx, and CO2 monthly emission reductions.

Clark County: Ozone Advance Program Progress Report
4-2
Table 4-3. Model Outputs
Peak Gross Generation, Post-EERE
(MW)
Annual Gross
Generation, Post-EERE
(MWh)
Annual Displaced Generation
(MWh)
Annual Displaced NOx (lb)
Annual Displaced CO2 (tons)
Ozone Season
Displaced NOx (lb)
Ozone Season, 10 Peak Days Displaced NOx (lb)
4,215 18,567,800 -379,600 -50,400 -172,700 -35,400 -200
Figure 4-1. Monthly SO2 reductions.
Figure 4-2. Monthly NOx reductions.
Figure 4-3. Monthly CO2 reductions.
-4,000
0
4,000
Jan Feb Mar Apr May Jun Jul Aug Sep Oct Nov Dec
-12,000
-8,000
-4,000
0
Jan Feb Mar Apr May Jun Jul Aug Sep Oct Nov Dec
-20,000
-16,000
-12,000
-8,000
-4,000
0
Jan Feb Mar Apr May Jun Jul Aug Sep Oct Nov Dec
Clark County: Ozone Advance Program Path Forward
5-1
5. Conclusion
Several factors out of DAQ’s control have a significant impact on ozone concentrations in Clark
County. However, Clark County as a community is trying hard to reduce VOC and NOx
precursors through mandatory and voluntary control measures, including the installation and use
of renewable energy (RE) and energy efficiency (EE) measures.
Many organizations in Clark County, both government and private, are making great strides to
reduce precursor emissions through various programs, and DAQ will continue to research and
evaluate control measures.
Private companies and departments at all levels of government provide Clark County residents
with a variety of programs to reduce emissions. Future federal regulations for mobile sources, in
conjunction with scheduled highway improvement projects, will further reduce NOx emissions
in the county, as will the replacement of the Reid Gardner coal-fired boilers and further RPS
requirements.
Although the measures do not seem to have an immediate result, the change will be noticeable in
the near future, and will certainly help Clark County to try to maintain the ozone NAAQS.