clarinda - Iowa Workforce Development more information regarding the clarinda laborshed analysis,...
4
clarinda · iowa laborshed · analysis 201 6 a study of workforce characteristics
Transcript of clarinda - Iowa Workforce Development more information regarding the clarinda laborshed analysis,...

clarinda · iowa
laborshed · analysis
2016 a s t u d y o f w o r k f o r c e c h a r a c t e r i s t i c s

The education and wage data by industry within the above table includes all respondents without consideration of employment status or willingness to change/enter employment.
**Insufficient survey data/refused
Some Level Beyond
High SchoolAssociate Degree
Undergraduate
Degree or HigherAnnual Salary Hourly Wage
All Employed 73.9% 17.1% 35.6% $50,000 $15.00
Agriculture, Forestry & Mining 60.7% 7.1% 35.7% ** **
Construction 42.9% 21.4% 14.3% ** $13.63
Education 92.9% 9.5% 76.2% $52,000 $12.50
Entertainment & Recreation ** ** ** ** **
Finance, Insurance & Real Estate 80.8% 15.4% 50.0% $60,000 $15.00
Healthcare & Social Services 77.4% 19.4% 32.2% $52,000 $14.25
Manufacturing 67.2% 18.0% 23.0% $45,500 $18.00
Personal Services 74.2% 16.1% 29.0% $38,400 $10.50
Professional Services ** ** ** ** **
Public Administrat ion & Government 80.0% 20.0% 37.2% $50,750 $27.00
Transportat ion, Communication & Ut ilit ies 72.7% 18.2% 13.6% $62,500 $15.68
Wholesale & Retail Trade 60.9% 14.1% 23.5% $50,000 $9.00
Education Median Wages
74.1% (38,516)
9.4% (4,886) 6.6% (3,431) 9.9% 5,145
30.0%
55.3%
48.1%
17.9%
0%
20%
40%
60%
80%
100%
Employed *Unemployed Homemakers Retired
Percent Likely to Change/Accept Employment
** Insufficient survey data/refused
Industry % of
Employed
Est imated # of
Employed
% Employed within
the Industry
% Likely to Change
Employment
% Unemployed*
within the Industry
Healthcare & Social Services 16.7% 6,432 79.4% 38.0% 7.9%
Manufacturing 16.0% 6,163 78.7% 27.7% 9.8%
Wholesale & Retail Trade 14.4% 5,546 66.2% 50.0% 13.8%
Education 10.3% 3,967 73.8% 35.5% 4.8%
Agriculture, Forestry & Mining 8.3% 3,197 89.3% 8.0% 7.1%
Finance, Insurance & Real Estate 8.0% 3,081 92.3% 20.8% 3.8%
Personal Services 8.0% 3,081 77.4% 13.0% 6.5%
Public Administrat ion & Government 7.0% 2,696 60.0% 28.6% 8.6%
Transportat ion, Communication & Ut ilit ies 4.3% 1,656 59.1% 46.2% 9.1%
Construction 3.7% 1,425 78.6% 27.3% 14.3%
Professional Services 2.0% 770 75.0% 0.0% 12.5%
Entertainment & Recreation 1.0% 385 ** ** **
Active Military Duty 0.3% 117 ** ** **
† Individuals may be underemployed for more than one reason, but are counted only once for to tal estimated underemployment.
% UnderemployedEst imated
Underemployed
Inadequate Hours 1.5% 136
Mismatch of Skills 4.2% 381
Low Income 1.5% 136
†Total Underemployment 6.4% 580
Underemployment
Networking,
13.8%
IowaWORKS
Centers,
23.8%
Newspapers,
35.0%
Internet,
65.0%
E m p l o y m e n t L e v e l s a n d S t a t u s b y I n d u s t r y
Underemployment
A Laborshed is the area or region from which an employment center draws its commuting workers. To determine the approximate boundaries of a Laborshed area, local employers supply the residential ZIP codes of each of their employees. This Laborshed analysis addresses the workforce characteristics of the Clarinda Laborshed area.
E m p l o y m e n t S t a t u s (estimated total)*
Estimated Population 18-64: 51,978 (entire Laborshed area)
Estimated Number of Individuals Very Likely or Somewhat Likely to Change or Accept Employment in Clarinda (10,810):
9,060 Employed 666 Unemployed 600 Homemakers 484 Retired
Employed - likely to change employment
Median Wages: $12.00/hr & $45,000/yr 26.1% are actively seeking new employment 21.6% are working multiple jobs Currently working an average of 42 hrs/week 32.9% currently working within the
professional, paraprofessional & technical occupational category followed by 17.6% within the production, construction & material handling occupational category
Most frequently identified job search resources:
Clarinda Laborshed Analysis
www.indeed.com www.iowajobs.org
The Valley News - Shenandoah Clarinda Herald Journal
The underemployed are individuals who are working fewer than 35 hours per week but desire more hours; are working in positions that do not meet their skill or education level, or have worked for higher wages at previous employment; or are working at wages equal to or less than the national poverty level and work 35 or more hours per week.
*Employment status is self-identified by the survey respondent. The unemployment percentage above does not reflect the unemployment rate published by the U.S. Bureau of Labor Statistics, which applies a stricter definition.
Survey respondents from the Clarinda Laborshed area were asked to identify the industry in which they are currently working. The largest concentration of workers are employed in the healthcare and social services industry.

The education and wage data by industry within the above table includes all respondents without consideration of employment status or willingness to change/enter employment.
**Insufficient survey data/refused
Some Level Beyond
High SchoolAssociate Degree
Undergraduate
Degree or HigherAnnual Salary Hourly Wage
All Employed 73.9% 17.1% 35.6% $50,000 $15.00
Agriculture, Forestry & Mining 60.7% 7.1% 35.7% ** **
Construction 42.9% 21.4% 14.3% ** $13.63
Education 92.9% 9.5% 76.2% $52,000 $12.50
Entertainment & Recreation ** ** ** ** **
Finance, Insurance & Real Estate 80.8% 15.4% 50.0% $60,000 $15.00
Healthcare & Social Services 77.4% 19.4% 32.2% $52,000 $14.25
Manufacturing 67.2% 18.0% 23.0% $45,500 $18.00
Personal Services 74.2% 16.1% 29.0% $38,400 $10.50
Professional Services ** ** ** ** **
Public Administrat ion & Government 80.0% 20.0% 37.2% $50,750 $27.00
Transportat ion, Communication & Ut ilit ies 72.7% 18.2% 13.6% $62,500 $15.68
Wholesale & Retail Trade 60.9% 14.1% 23.5% $50,000 $9.00
Education Median Wages
91.4%
59.7%
46.2%42.5%
30.6%
24.2%
16.1%12.9% 11.8% 11.3%
Health/Medical Insurance
Pension/Retirement/401K
Dental Coverage
Vision Coverage
Life Insurance
Paid Vacation
Paid Sick Leave
Disability Insurance
Paid Holidays
Prescription Drug Coverage
Networking,
13.8%
IowaWORKS
Centers,
23.8%
Newspapers,
35.0%
Internet,
65.0%
The survey provides the respondents an opportunity to identify employment benefits they currently are offered. The chart at left provides the percentage of responses from those that are currently employed full-time.
The majority (70.1%) of these respondents state they are currently sharing the cost of health/medical insurance premiums with their employer. However, 16.9 percent indicate their employer pays the entire cost of insurance premiums.
C o m m u t i n g S t a t i s t i c s
The map at the right represents the concentration of those who are likely to commute into Clarinda from their home ZIP for an employment opportunity.
Those who are likely to change/accept employment in the Clarinda Laborshed area are willing to commute an average of 25 miles one-way for employment opportunities.
The out commute for Clarinda is estimated at 20.4 percent—approximately 638 people living in Clarinda work in other communities.
Most of those who are out commuting are working in Shenandoah (IA), Red Oak (IA), College Springs (IA) or Maryville, (MO).
Two-fifths (40.0%) of out commuters are likely to change employment (approximately 255 people).
E d u c a t i o n L e v e l s a n d M e d i a n W a g e s b y I n d u s t r y
T o p C u r r e n t B e n e f i t s o f t h e F u l l - T i m e E m p l o y e d
Concentration of Those Likely to Change/Accept Employment in Clarinda
Legend
Interstates
4 Lane Highways
U.S. Highways
State Highways
Iowa County
Kansas County
Missouri County
Nebraska County
Likely to Change/Accept Employment
by Place of Residence (per ZIP Code)
4 - 45
46 - 181
182 - 475
476 - 1,453
1,454 - 3,428
10 Mile Interval Between Rings
Area Shown
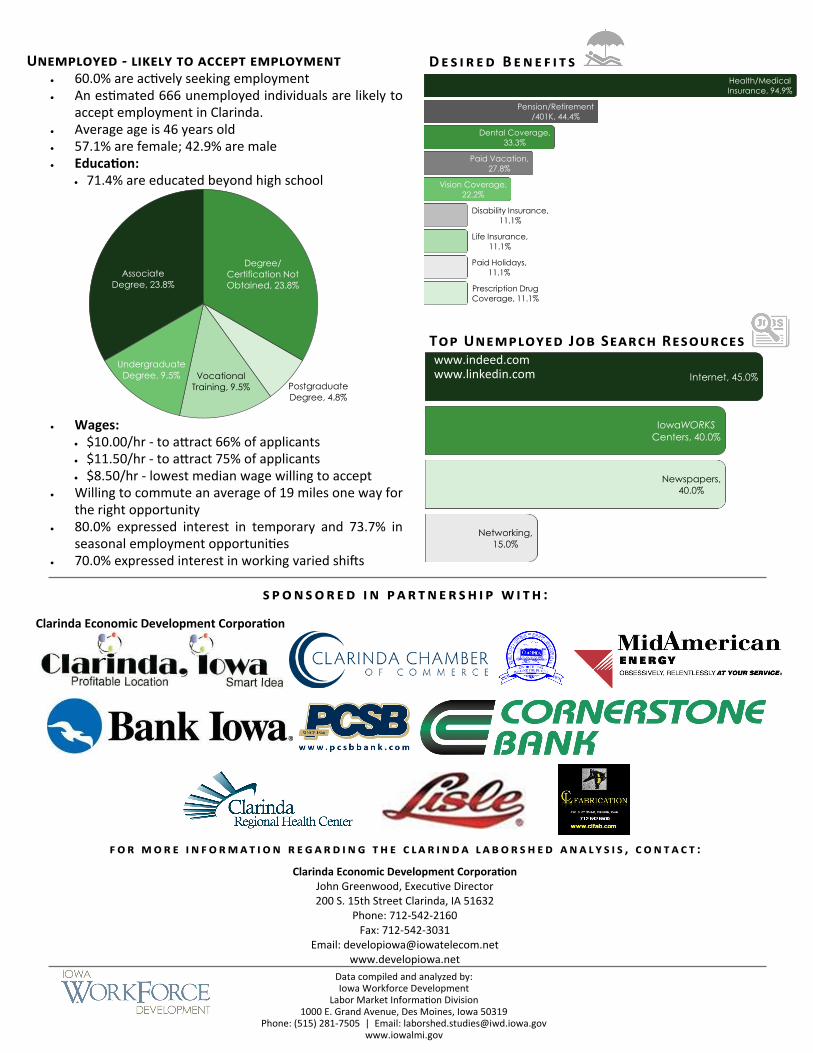
Degree/
Certification Not
Obtained, 23.8%
Postgraduate
Degree, 4.8%
Vocational
Training, 9.5%
Undergraduate
Degree, 9.5%
Associate
Degree, 23.8%
Networking,
15.0%
Newspapers,
40.0%
IowaWORKS
Centers, 40.0%
Internet, 45.0%
Unemployed - likely to accept employment 60.0% are actively seeking employment An estimated 666 unemployed individuals are likely to
accept employment in Clarinda. Average age is 46 years old 57.1% are female; 42.9% are male Education:
71.4% are educated beyond high school
Prescription Drug
Coverage, 11.1%
Paid Holidays,
11.1%
Life Insurance,
11.1%
Disability Insurance,
11.1%
Vision Coverage,
22.2%
Paid Vacation,
27.8%
Dental Coverage,
33.3%
Pension/Retirement
/401K, 44.4%
Health/Medical
Insurance, 94.9%
Top Unemployed Job Search Resources
f o r m o r e i n f o r m a t i o n r e g a r d i n g t h e c l a r i n d a l a b o r s h e d a n a l y s i s , c o n t a c t :
Clarinda Economic Development Corporation John Greenwood, Executive Director 200 S. 15th Street Clarinda, IA 51632
Phone: 712-542-2160 Fax: 712-542-3031
Email: [email protected] www.developiowa.net
Data compiled and analyzed by: Iowa Workforce Development
Labor Market Information Division 1000 E. Grand Avenue, Des Moines, Iowa 50319
Phone: (515) 281-7505 | Email: [email protected] www.iowalmi.gov
s p o n s o r e d i n p a r t n e r s h i p w i t h :
D e s i r e d B e n e f i t s
Wages: $10.00/hr - to attract 66% of applicants $11.50/hr - to attract 75% of applicants $8.50/hr - lowest median wage willing to accept
Willing to commute an average of 19 miles one way for the right opportunity
80.0% expressed interest in temporary and 73.7% in seasonal employment opportunities
70.0% expressed interest in working varied shifts
www.indeed.com www.linkedin.com
Clarinda Economic Development Corporation