City Research Onlineopenaccess.city.ac.uk/20071/1/avgoustaki_frankort_ILRR.pdf · lqwhqvlw\...
45
City, University of London Institutional Repository Citation: Avgoustaki, A. & Frankort, J. (2018). Implications of work effort and discretion for employee well-being and career-related outcomes: an integrative assessment. Industrial and Labor Relations Review, This is the accepted version of the paper. This version of the publication may differ from the final published version. Permanent repository link: http://openaccess.city.ac.uk/20071/ Link to published version: Copyright and reuse: City Research Online aims to make research outputs of City, University of London available to a wider audience. Copyright and Moral Rights remain with the author(s) and/or copyright holders. URLs from City Research Online may be freely distributed and linked to. City Research Online: http://openaccess.city.ac.uk/ [email protected] City Research Online
Transcript of City Research Onlineopenaccess.city.ac.uk/20071/1/avgoustaki_frankort_ILRR.pdf · lqwhqvlw\...

City, University of London Institutional Repository
Citation: Avgoustaki, A. & Frankort, J. (2018). Implications of work effort and discretion for employee well-being and career-related outcomes: an integrative assessment. Industrial and Labor Relations Review,
This is the accepted version of the paper.
This version of the publication may differ from the final published version.
Permanent repository link: http://openaccess.city.ac.uk/20071/
Link to published version:
Copyright and reuse: City Research Online aims to make research outputs of City, University of London available to a wider audience. Copyright and Moral Rights remain with the author(s) and/or copyright holders. URLs from City Research Online may be freely distributed and linked to.
City Research Online: http://openaccess.city.ac.uk/ [email protected]
City Research Online

1
IMPLICATIONS OF WORK EFFORT AND DISCRETION FOR EMPLOYEE WELL-BEING
AND CAREER-RELATED OUTCOMES: AN INTEGRATIVE ASSESSMENT*
Argyro Avgoustaki ESCP Europe Business School
527 Finchley Road London (UK) NW3 7BG Tel: +44 20 7443 8800
e-mail: [email protected]
Hans T. W. Frankort Cass Business School
City, University of London 106 Bunhill Row
London (UK) EC1Y 8TZ Tel: +44 20 7040 5202
e-mail: [email protected]
Forthcoming at the Industrial and Labor Relations Review
* Authorship is alphabetical. The authors thank Laura Empson, Santi Furnari, Jaime Ortega, and Andrew Oswald for helpful comments and discussion. They also thank audiences at ESCP Europe Business School (Madrid), the London School of Economics and Political Science, Universidad Carlos III de Madrid, the 2017 Academy of Management Meeting (Atlanta, GA), and the 2018 LAEMOS Conference (Buenos Aires) for constructive suggestions. During part of the research for this paper, both authors were Visiting Scholars at the Departamento de Economía de la Empresa at Universidad Carlos III de Madrid, and they thank Eduardo Melero, Jaime Ortega, and Neus Palomeras for their hospitality and support. Research grants from the Spanish Ministry of Economics and Competitiveness (research grant ECO2012-33308) and ESCP Europe Business School are gratefully acknowledged. Additional results and copies of the data set and do-file used to generate the results presented in the paper are available from the authors at [email protected].

2
IMPLICATIONS OF WORK EFFORT AND DISCRETION FOR EMPLOYEE WELL-BEING
AND CAREER-RELATED OUTCOMES: AN INTEGRATIVE ASSESSMENT
Abstract How does work effort affect employee outcomes? The authors bridge distinct literatures on the well-being versus career-related implications of work effort by analyzing the relation of overtime work and work intensity to both types of outcomes. They also extend examination of the role of discretion in modifying the effects of work effort from well-being to career-related outcomes. Using data from the fifth and sixth European Working Conditions Surveys, the authors show that greater work effort relates strongly to reduced well-being and modestly to inferior career-related outcomes, while discretion may attenuate these adverse implications. Even with discretion, work intensity generally is a stronger predictor of unfavorable outcomes than overtime work. Implications include the need for employees to become aware of the broader limitations of excessive work effort, for employers to give discretion when viable, and for public policy to devise strategies that help limit the adverse consequences of work intensity.

3
In 2016, over five million UK employees reported regularly working unpaid overtime
(Trades Union Congress 2017), while about 36 percent of Dutch employees reported often or
always working at a high pace (CBS 2017). Figures such as these exemplify a tendency of many
employees to supply high levels of work effort on a frequent basis. A fundamental question is
how work effort is related to individual consequences, both in terms of employee well-being as
well as career-related outcomes. Answers to this question are important because they may inform
employees’ labor supply decisions and they can assist employers and governments in designing
strategies that stimulate productive and sustainable effort in the workforce.
Work effort includes “overtime work” and “work intensity”, where the former is the
amount of time an employee works in excess of normal hours, while the latter is the level of
effort supplied per unit of working time. A broad and multidisciplinary literature has studied the
well-being consequences of both types of work effort, while a small and separate literature in
economics has focused on overtime work and its career-related implications. Our first objective is
to bridge these literatures by offering an integrative analysis of the implications of overtime work
and work intensity for employee well-being and career-related outcomes. Our second objective is
to examine how the level of discretion given to employees influences the relationship between
work effort and employee outcomes, where “discretion” means the freedom to decide how and
when to carry out the work. We do so in the spirit of the ‘job demands-control model’ (Karasek
1979), which suggests that a focus on work effort (often referred to as ‘job demands’) is truncated
without simultaneous attention to the discretion afforded to employees. The intuition is that
discretion serves as a buffer that can alleviate the possibly adverse implications of work effort for
employee well-being. Here, we extend this idea of an interaction between work effort and
discretion by using it not just to predict well-being but also career-related outcomes, a relation
thus far underemphasized in the literature.

4
We use micro data on a random sample of 51,895 employees from across 36 European
countries, drawn from the fifth and sixth European Working Conditions Surveys (Eurofound
2010, 2015). Our data set covers all industries and occupations and contains detailed information
on types of work effort, types of discretion, and indicators of well-being and career-related
outcomes. We estimate models using overtime work and work intensity, as well as interactions
with types of discretion, to predict indicators of well-being (i.e., stress, fatigue, and job
satisfaction) and career-related outcomes (i.e., career prospects, job security, and recognition).
We control for a wide range of factors that may determine both work effort and discretion as well
as employee consequences, and our results hold up across alternative model specifications. In
subsample analyses, we document similarities and differences among the estimates between high-
skilled white collars and low-skilled blue collars.
We contribute to scholarship on the consequences of work effort by bridging the distinct
literatures on well-being and career-related implications. We assess the two types of outcomes in
one and the same sample of employees, allowing us to offer original insight into the comparative
relevance of overtime work and work intensity for predicting well-being versus career-related
outcomes. Additionally, by extending the interactive effects of work effort and discretion from
well-being to career-related implications, we provide new and more comprehensive evidence on
the role of discretion in conditioning work effort associations with employee outcomes.
Background
Work Effort and Employee Outcomes
Work effort has two dimensions (Green 2001; Kristensen, Bjorner, Christensen, and Borg
2004). The first is extensive work effort, or the duration of work. Overtime work is one prevalent
aspect of extensive work effort and captures the amount of time an employee works in excess of
normal hours. Both part-time and full-time employees can work overtime. The second dimension

5
of work effort is work intensity (sometimes referred to as ‘intensive work effort’), which has
been defined as “the rate of physical and/or mental input to work tasks performed during the
working day” (Green 2001: 56). Rather than referring to work duration, work intensity refers to
the level of effort supplied per unit of working time.
A large literature has studied the implications of overtime work and work intensity for
employee well-being. The core idea is that work effort of either kind is associated with reduced
well-being, through several mechanisms. Overtime work prolongs an employee’s exposure to
workplace stressors and, by shortening the periods when an employee rests, decreases the ability
to recover between working days (Sánchez 2017). Work intensity instead reduces or eliminates
gaps between tasks during which the body or mind can rest, thus decreasing the employee’s
ability to recover during working days (Green 2001). A lack of recovery between or during
working days may have cumulative effects because a fatigued employee requires progressively
more effort to maintain adequate performance.
While some studies find limited support for an association between overtime work and
aspects of employee well-being (Robone, Jones, and Rice 2011; Wood and De Menezes 2011),
the balance of the available evidence is that greater work effort is associated with symptoms of
stress, anxiety, depression, and burnout (Sparks, Cooper, Fried, and Shirom 1997; Golden and
Wiens-Tuers 2006; Virtanen et al. 2011), inferior work-life balance (Schieman, Milkie, and
Glavin 2009; Green et al. 2013; Boxall and Macky 2014), increased sleep deprivation and fatigue
(Belman and Monaco 2001; Cottini and Lucifora 2013), poorer self-reported mental health (Goh,
Pfeffer, and Zenios 2016), as well as reduced job-related well-being (Green, Felstead, Gallie, and
Inanc 2016). Consequently, available arguments and evidence lead us to expect that (I) overtime
work and work intensity are negatively associated with employee well-being.

6
Further, a small and separate literature in economics has focused on overtime work and its
career-related consequences for employees within the firm. One argument has been that
employers might perceive employees who supply overtime as more committed and motivated.
Thus, overtime work may be taken by employers as a signal of employee value, which helps
them to prioritize which employees should receive more opportunities for career advancement,
improved terms of employment, or recognition more generally (Landers, Rebitzer, and Taylor
1996; Holmstrom 1999). Consistent with this theory, some studies suggest that overtime work
may be positively associated with future promotions and earnings within the firm (Francesconi
2001; Pannenberg 2005; Anger 2008), both reflections of career advancement and recognition.
Other evidence suggests that employees supplying more overtime might also be more likely to
receive a permanent contract (Booth, Francesconi, and Frank 2002), thus improving their terms
of employment through greater job security.
Others have argued that high effort levels might not be of a productive kind because work
effort is subject to decreasing marginal returns (Chapman 1909; Green 2001, 2004b). Convergent
with this idea, available evidence suggests that productivity decreases as working hours increase
(Pencavel 2015), which can be attributed to the reduced opportunity for physical, mental, and
emotional recovery associated with overtime work (Pencavel 2016; Sánchez 2017). Limited
recovery in turn reduces the ability for sustained performance at a high cognitive level and
increases the likelihood of mistakes, accidents, and injuries (e.g., Dembe, Erickson, Delbos, and
Banks 2005; Folkard and Lombardi 2006). To the extent that such issues accumulate over time
and become reflected in the quality of an employee’s work, they may reduce his or her career-
related opportunities.
Studies of the relationship between work effort and career-related outcomes have
overwhelmingly focused on overtime work rather than work intensity. Nevertheless, we suspect

7
that work intensity could have a signaling component similar to overtime work. Higher work
intensity requires mental and/or physical input that can reflect employee value, commitment, or
motivation, which may convey credible information to employers to the extent it is observable.
Yet, if it cumulates to reduce quality, high work intensity might also be counterproductive like
overtime work, which would harm career-related outcomes.
Overall, arguments and available evidence would imply two opposing expectations
regarding the career-related implications of work effort. If work effort more strongly signals
employee value than it is self-limiting and counterproductive, then (IIa) overtime work and work
intensity are positively associated with career-related outcomes. If, instead, work effort is self-
limiting and counterproductive more than it signals employee value, then (IIb) overtime work and
work intensity are negatively associated with career-related outcomes.
The Role of Discretion
Work effort conceivably has direct implications for employees, yet all employees are not
equally susceptible to its various consequences. Perhaps most prominently, a psychological
literature on job strain has suggested that the consequences of work effort for well-being depend
on “the discretion permitted the worker in deciding how to meet [job] demands” (Karasek 1979:
285). Here, we build on and extend the intuition of an interaction between work effort and
discretion by examining its implications not just for well-being but also career-related outcomes.
We define discretion as an employee’s freedom to decide how and when to carry out his or her
work (Ortega 2009a, 2009b; Moen et al. 2016).1 We first outline some evidence on the discretion
association with employee outcomes and then discuss how discretion may modify the well-being
and career-related implications of work effort.
1 In the literature, discretion has also been referred to as autonomy (e.g., Hackman and Oldham 1975), decision latitude (e.g., Karasek 1979), or job control (e.g., Van Yperen and Hagedoorn 2003).

8
Employees with greater discretion report lower levels of stress (Henly and Lambert 2014)
and increased job satisfaction and well-being (De Menezes and Kelliher 2017; Wheatley 2017),
and they tend to be more involved and committed (Wood, Holman, and Stride 2006; Lyness,
Gornick, Stone, and Grotto 2012). Furthermore, employees who have control over when to work
experience less work-life conflict (Kelly, Moen, and Tranby 2011). Discretion has also been
related to reduced turnover intentions, voluntary turnover, job insecurity, and dismissals (Wood
et al. 2006; Batt and Colvin 2011; Avgar, Pandey, and Kwon 2012; Gallie, Felstead, Green, and
Inanc 2017), as well as enhanced career success (Leslie, Manchester, Park, and Mehng 2012).
While the implications of discretion for well-being and career-related outcomes are
compelling in and of themselves, our interest is in the role of discretion in modifying the
consequences of work effort. With respect to well-being, the ‘job demands-control model’
(Karasek 1979) suggests that discretion serves as a buffer that can alleviate the possibly adverse
implications of work effort and so discretion should be of particular relevance to those employees
supplying higher levels of effort. Discretion implies the opportunity to expend effort in ways and
at times that are relatively more convenient for an employee. Therefore, work effort, whether
overtime work or work intensity, may have less adverse well-being implications in employees
with discretion. Illustrative evidence includes the finding that discretion is associated with
reduced fatigue in nurses with highly demanding jobs (Van Yperen and Hagedoorn 2003); that
the decline in well-being observed in the UK during the 1990s was “associated with a
combination of rising work effort and declining task discretion” (Green 2004b: 616); and that, in
a sample of European employees, work intensity is more adversely associated with job
satisfaction in employees without discretion (Lopes, Lagoa, and Calapez 2014).
Discretion may also affect the way in which work effort translates to career-related
outcomes, a relation thus far underemphasized in the literature. Discretion implies the freedom to

9
adapt work in ways and to times when an employee believes his or her anticipated added value is
greatest. As such, discretion may help an employee ease the progressive tension between work
effort and the quality of output (Singh 2000). Recent findings provide indirect evidence
consistent with such a relation, by showing that discretion may increase effort (Lott and Chung
2016; Beckmann, Cornelissen, and Kräkel 2017). This outcome has been interpreted largely as
reflecting voluntary effort on the part of the employee: discretion may motivate greater work
effort as an act of reciprocation to the employer (Kelliher and Anderson 2010) and it may
increase the anticipated value of additional effort (Green 2004a; Beckmann et al. 2017). In either
case, discretion-induced effort is typically interpreted as relatively more productive compared to
a counterfactual increase in effort without discretion. Therefore, discretion may strengthen the
positive signal generated through higher levels of work effort, while also curtailing its self-
limiting and counterproductive tendencies.
Overall, the arguments and available evidence on the interaction between work effort and
discretion lead us to expect, first, that (III) work effort is less negatively associated with employee
well-being in employees with more discretion. Second, we also expect that (IV) work effort is
associated with better—either more positive or less negative—career-related outcomes in
employees with more discretion.
Occupational Differences
One relevant question concerns whether differences exist across occupations in how types
of effort are associated with employee outcomes, and how discretion modifies such associations.
High-skilled white collars are more likely to use overtime work to signal their value (Landers et
al. 1996; Schieman and Glavin 2016) and may often feel they do so by choice (Michel 2011;
Empson 2017). Instead, low-skilled blue collars may be more prone to involuntary pressures for
intensive work, in part because they tend to have less discretion compared to high-skilled white

10
collars (Kossek and Lautsch 2018). Thus, overtime associations with well-being and career-
related outcomes might be relatively more favorable in higher-level occupations. Moreover,
given the lesser prevalence of discretion in lower-level occupations, perhaps low-skilled blue
collars that do have discretion benefit disproportionally relative to high-skilled white collars. We
treat these issues as open empirical questions and explore them after our main analysis.
Method
Data and Sample
We analyze a pooled cross section of employees drawn from the fifth and sixth European
Working Conditions Surveys (EWCSs), carried out by the European Foundation for the
Improvement of Living and Working Conditions in 2010 and 2015, respectively. The EWCSs
survey stratified random samples of employees through (face-to-face) interviews that cover issues
like work effort, work organization, well-being, and careers. Prior waves of this survey have been
used regularly in the literature, for example, by Green and McIntosh (2001) to study work
intensification in Europe; Ortega (2009a, 2009b) to study discretion; and Avgoustaki (2016) to
study the antecedents of extensive work effort.
Across the 2010 and 2015 waves of the EWCS, a total of 87,666 individuals were
interviewed, covering 34 countries in 2010—i.e., the EU 27, Albania, Croatia, the Former
Yugoslav Republic of Macedonia, Kosovo, Montenegro, Norway, and Turkey, and 35 countries
in 2015—i.e., the EU 28, Albania, the Former Yugoslav Republic of Macedonia, Montenegro,
Norway, Serbia, Switzerland, and Turkey. Before pooling the two waves, we imposed a small
number of sampling rules. We omitted self-employed individuals, individuals below 16 and
above 65 years old, as well as individuals whose tenure in their firm exceeded 50 years.
Subsequently, we applied list-wise deletion in cases of missing values on any of the variables

11
included in our model specifications. Together, these sampling rules produced our analysis
sample, a pooled cross section of 51,895 employees from across 36 countries.
Outcome Variables
Employee Well-Being
The variable Stress is measured with a categorical variable asking respondents to indicate,
on a 5-point scale (4 = always; 3 = most of the time; 2 = sometimes; 1 = rarely; and 0 = never),
the extent to which they experience stress in their work. Fatigue is measured with a question
asking whether an employee suffered from overall fatigue in the past 12 months (1 = yes; 0 = no).
Satisfaction is measured with a question asking respondents to indicate, on a 4-point scale (3 =
very satisfied; 2 = satisfied; 1 = not very satisfied; 0 = not at all satisfied), whether on the whole
they are satisfied with the working conditions in their main job.
Career-Related Outcomes
The variable Career is measured with a question that captures, on a 5-point scale (4 =
strongly agree; 3 = agree; 2 = neither agree nor disagree; 1 = disagree; and 0 = strongly disagree),
whether an employee’s job offers good prospects for career advancement. Security is measured
with a question that asks respondents to indicate their level of agreement or disagreement with
the statement that they might lose their job in the next six months (4 = strongly disagree; 3 =
disagree; 2 = neither agree nor disagree; 1 = agree; and 0 = strongly agree). The variable
Recognition, available only in EWCS 2015, is measured with a question that asks respondents to
indicate their level of agreement or disagreement with the statement that they receive the
recognition they deserve for their work. Recognition is captured on a 5-point scale (4 = strongly
agree; 3 = agree; 2 = neither agree nor disagree; 1 = disagree; and 0 = strongly disagree).
Explanatory Variables
Work Effort

12
The variable Overtime measures how often an employee worked in his or her free time to
meet work demands in the past 12 months (4 = daily; 3 = several times a week; 2 = several times
a month; 1 = less often; 0 = never). We capture intensive work effort with two ordinal indicators
measured on a 6-point scale (6 = all of the time; 5 = almost all of the time; 4 = around ¾ of the
time; 3 = around half of the time; 2 = around ¼ of the time; 1 = almost never; and 0 = never). The
first indicator captures whether an employee’s job involves working at very high speed and the
second whether the job involves working to tight deadlines. Factor analysis shows that the two
load onto one factor, with a Cronbach’s alpha of 0.78, and so we define the variable Work
intensity as the average of scores on the two indicators.
Discretion
We capture discretion with two variables, one for work discretion and another for
discretion over one’s schedule. Similar to Avgoustaki (2016), we measure the former, Work
discretion, as the average of three dichotomous indicators (1 = yes; 0 = no) of an employee’s
discretion to choose the order of tasks, methods of work, and the rate or speed of work. We
measure the latter, Schedule discretion, as the average of two indicators on an employee’s
discretion to adapt or entirely determine their working hours (1 = yes; 0 = no) and take breaks (1
= sometimes or always; 0 = rarely or never).
Controls
We control for a large number of factors that may confound associations among work
effort, discretion, and outcomes. Evidence suggests that human resource practices (other than
discretion) are associated with effort (Avgoustaki 2016) and the provision of discretion
(Gittleman, Horrigan, and Joyce 1998; Ortega 2009a, 2009b). We control for four such practices:
training, task rotation, productivity pay, and teamwork. We capture training with three dummy
variables (1 = yes; 0 = no) for the types of training employees have undergone during the past 12

13
months: Employer-provided training (i.e., training paid for or provided by the employer),
Employee-funded training (i.e., training paid for by the employee), and On-the-job training. Task
rotation captures whether an employee’s job involves rotating tasks, Productivity pay captures
whether employees receive piece rate or other productivity payments, and Teamwork captures
whether employees perform part of their work in a team. All three are dummies (1 = yes; 0 = no).
Additional controls include dichotomous variables (1 = yes; 0 = no) capturing whether
employee remuneration includes payment for overtime (Paid overtime), whether an employee’s
pace of work is dependent on work done by colleagues (Pace of work dependent on colleagues),
and whether his or her pace of work depends on the speed of a machine or movement of a
product (Pace of work dependent on equipment). We also control for uncertainty at work through
Task uncertainty, which captures, on a 4-point scale (3 = very often, to 0 = never), how often
employees must interrupt one task to take on a different, unforeseen task. We control for Male, a
dummy variable (1 = male; 0 = female) that absorbs gender differences in working conditions
and outcomes. To capture age-dependent well-being (Blanchflower and Oswald 2017) and proxy
for work experience, we control for Age in years and Age squared, and Log firm tenure, the log
of an employee’s tenure in the firm in years plus one. Employees with more responsibility may
expend more effort and have more discretion and so we control for Log subordinates, the log of
the number of people under an individual’s supervision plus one.2
We also control for a broad range of fixed effects. We include fixed effects for 35
countries, 16 NACE industry sections, four sectors (public sector, joint private-public sector, not-
for-profit sector, other; private sector omitted as reference), nine one-digit ISCO88 occupations,
six one-digit ISCED education levels, five types of employment contracts (indefinite, fixed-term,
2 We take the log to address positive skew in the distributions of tenure and subordinates.

14
temporary employment agency contract, apprenticeship or other training scheme, no contract;
other contract omitted as reference), and two establishment size categories (10-249 employees
and 250+ employees; 2-9 employees omitted as reference). In models for all outcomes except
Recognition, which is available only for 2015, we include a fixed effect for survey year (1 =
2015; 0 = 2010). Table A.1 in the Online Appendix provides a comprehensive list of definitions
and sources for all outcome and explanatory variables.
Main Results
Table 1 shows summary statistics for each survey wave separately as well as the pooled
sample and provides correlations among the study variables in the pooled sample. From 2010 to
2015, the means suggest noteworthy increases in career prospects and job security, moderate
increases in Stress, Satisfaction, and Work intensity, and a reduction in Overtime.
[[Table 1 near here]]
Among the six outcomes, Fatigue is a dummy variable and all others are ordinal variables.
Therefore, we estimate binary logit models for Fatigue and ordered logit models for all other
outcomes, using the explanatory variables described in the previous section. We report beta
coefficients corresponding to the log of the unstandardized odds ratio. We also report odds ratios
(OR) to examine the magnitude of the estimates. The explanatory variables differ in their
underlying measurement scales and distributions. Therefore, we report odds ratios for an increase
in each predictor from its 10th percentile to its 90th percentile, allowing for an appropriate
comparison of effect sizes.3 We obtain robust standard errors clustered by country-industry pairs
to account for the possibility that survey responses are more similar among employees working in
3 Relevant percentiles are given in Table A.2 in the Online Appendix.
15
a given industry in a given country. When unaccounted for, such non-independence may
artificially reduce standard errors, increasing the probability of Type-I errors.
Overtime and Work Intensity Estimates
[[Table 2 near here]]
Table 2 shows the regression estimates that we use to assess the coefficients for Overtime
and Work intensity. Unreported regression diagnostics indicate that collinearity is well within
acceptable limits for all the key variables. After adjusting for a large number of covariates,
Overtime is associated with increased Stress and Fatigue and decreased Satisfaction, as well as
reduced levels of perceived career prospects, job security, and Recognition. Work intensity too is
associated with increased Stress and Fatigue and decreased Satisfaction, as well as reduced levels
of career prospects, job security, and Recognition. The coefficients are all precisely determined
and so support expectations (I) and (IIb). The estimates provide no evidence for a positive
association between types of work effort and the career-related outcomes. Thus, support is not
found for expectation (IIa). These findings are consistent with prior evidence for a negative
association between work effort and well-being (e.g., Golden and Wiens-Tuers 2006; Green et al.
2016), while they also resonate with the idea that overtime work may in the margin decrease the
quality of work (e.g., Pencavel 2015, 2016) and so is associated with inferior career-related
outcomes. Our estimates extend available findings by uncovering this negative association
between overtime work and career-related outcomes but also by offering evidence for a similarly
negative association involving work intensity.
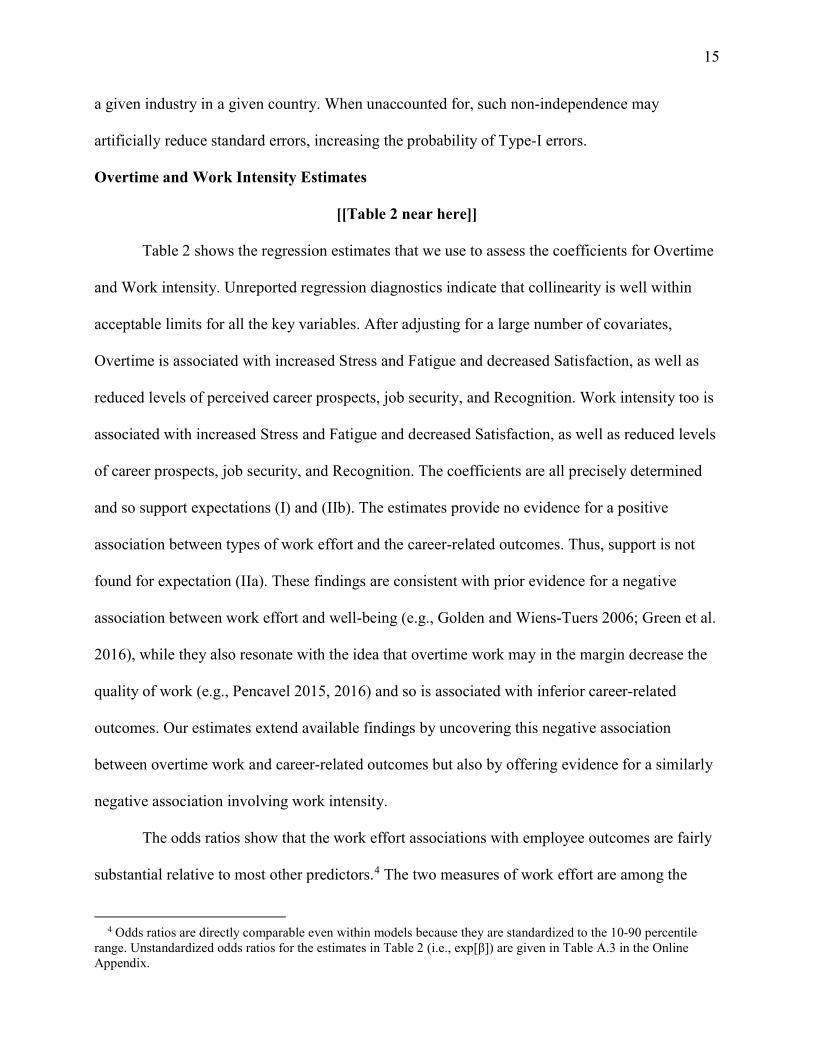
The odds ratios show that the work effort associations with employee outcomes are fairly
substantial relative to most other predictors.4 The two measures of work effort are among the
4 Odds ratios are directly comparable even within models because they are standardized to the 10-90 percentile range. Unstandardized odds ratios for the estimates in Table 2 (i.e., exp[β]) are given in Table A.3 in the Online Appendix.

16
most positively associated with Stress and Fatigue, and among the most negatively associated
with Satisfaction, Security, and Recognition.5 Moreover, associations between the two effort
variables and ones capturing employee well-being tend to be more substantial than associations
with the career-related outcomes. Across the six models, work intensity generally is a stronger
predictor of unfavorable outcomes than overtime work. Except in the model predicting Career,
these differences are large and particularly pronounced in the model predicting Stress.6 Although
prior studies have incorporated indicators of extensive and intensive effort to predict employee
well-being (e.g., Wood and De Menezes 2011; Green et al. 2016), our focus on multiple types of
outcomes supplies the novel insight that work intensity is important relative to overtime work for
predicting both well-being and career-related outcomes.
The well-being versus career-related implications of work effort have been studied in
separate literatures and so we lack estimates that are comparable across both types of outcomes.
Our models, estimated on one and the same sample of employees, help bridge this gap between
literatures and so extend prior findings, by suggesting that work effort does not seem to be
associated with a balance of favorable and unfavorable outcomes, where career-related outcomes
compensate for reduced well-being. Work effort broadly predicts unfavorable outcomes.
Work Effort Interactions with Discretion
Table 3 shows estimates for the interactions between dimensions of work effort and
discretion, allowing us to assess the role of discretion in modifying the work effort associations
with employee well-being (expectation (III)) and career-related outcomes (expectation (IV)).
5 Negative associations have odds ratios below unity. Odds ratios closer to zero imply more-strongly negative associations. 6 Our measure for overtime work distinguishes employees by the frequency of overtime without reference to the duration of overtime. We have also undertaken an analysis using as an alternative measure for overtime work the number of days per month that an employee works more than ten hours. One might reasonably expect stronger effects for this measure because it uses an overtime threshold that is fairly conservative for most European countries (Avgoustaki 2016). Even compared to this alternative measure, work intensity generally is a stronger predictor of unfavorable well-being and career-related outcomes. These estimates are available from the authors on request.

17
Despite the introduction of four interaction effects in each of the models, unreported regression
diagnostics indicate that collinearity remains within acceptable limits for all the key variables.
[[Table 3 near here]]
The interaction between Overtime and Work discretion is negatively associated with
Stress and Fatigue and positively associated with Satisfaction, Security, and Recognition, while
its association with Career is statistically insignificant. Coefficients for the interaction between
Overtime and Schedule discretion are all indistinguishable from 0 at the 95% level. The
interaction between Work intensity and Work discretion is positively associated with
Satisfaction, Career, and Recognition, while its associations with Stress, Fatigue, and Security are
statistically insignificant. Finally, the interaction between Work intensity and Schedule discretion
is negatively associated with Fatigue and positively associated with Satisfaction and Career,
while its associations with Stress, Security, and Recognition are statistically insignificant.
The statistically significant estimates in Table 3 are consistent with our expectations.
Associations between work effort and employee well-being are less negative in employees with
more discretion (particularly Work discretion), while in such employees associations between
work effort and career-related outcomes are also relatively more favorable. These findings
provide a measure of support for expectations (III) and (IV). These findings expand available
evidence by showing that the interaction between work effort and discretion predicts not just
well-being, as in previous studies building on Karasek (1979). Discretion also improves the
association between work effort and career-related outcomes.
In Table 2, we established that work intensity generally is a stronger predictor of
unfavorable outcomes than overtime work. However, the magnitudes of the odds ratios for the
statistically significant interactions in Table 3 reveal that discretion more effectively improves
associations between Work intensity and employee outcomes than it improves the Overtime

18
associations with employee outcomes. Thus, one might ask whether discretion helps employees
bridge the discrepancies between the two types of work effort in terms of their unfavorable
associations with the various outcomes.
One straightforward way to explore this question is to calculate odds ratios for Overtime
and Work intensity in employees with and without discretion. In Table 3, odds ratios for the main
effects of Overtime and Work intensity represent effects for employees without discretion. Where
effort-by-discretion interactions are statistically significant, odds ratios for employees with
discretion can be obtained straightforwardly as OReffort*OReffort×discretion. Table A.4 in the Online
Appendix gives all odds ratios estimated this way. In the Career model, odds ratios for Work
intensity in employees with discretion converge towards the odds ratio for Overtime.7 In the
Recognition model, odds ratios for Work intensity in employees with Work discretion converge
towards the odds ratio for Overtime in employees without discretion. Instead, for Stress, Fatigue,
Satisfaction, and Security, Work intensity with discretion remains a stronger predictor of
unfavorable outcomes even when compared to Overtime without discretion. Therefore, even in
employees with discretion, work intensity remains important relative to overtime work
particularly for predicting well-being outcomes. This result underlines the importance of work
intensity and nuances the role of discretion: while discretion may go some way toward alleviating
unfavorable implications of work intensity, it may not fully resolve them.
Robustness
We assessed the robustness of our findings in two supplementary analyses.8 First, in the
period of recovery after the Great Recession, working conditions in different countries,
7 Post-hoc tests show that the respective odds ratios for Work intensity with Work discretion and Schedule discretion are statistically indistinguishable from 0.918, the odds ratio for Overtime (i.e., χ2[1df] = 0.2, p = 0.65, and χ2[1df] = 2.19, p = 0.14, respectively). 8 The results for these robustness checks are available from the authors on request.

19
industries, sectors, and occupations may have developed at different rates. We re-estimated
models 1-5 (model 6 covers only 2015) in Tables 2 and 3 after including fixed effects for
country-year, industry-year, sector-year, and occupation-year pairs. These additional fixed effects
offer a flexible approach to account for heterogeneity in the development of working conditions
from 2010 to 2015. Estimates were similar in magnitude and remained well determined. Thus, we
believe our results do not spuriously reflect uneven developments in working conditions.
Second, despite controls for a range of employee characteristics, it is possible that
unobserved factors like ability may determine both effort and discretion as well as better career-
related opportunities. This possibility would bias our estimates if such factors remain unabsorbed
by included controls. To examine this possibility, we included in models 4-6 of Tables 2 and 3 an
additional variable for whether the employee’s salary increased in the past 12 months (1 = yes; 0
= no). Wage increases tend to be serially correlated even after accounting for observable
characteristics and so past wage growth may be interpreted as a shadow of latent ‘quality’ (Baker,
Gibbs, and Holmstrom 1994; Gibbons and Waldman 1999). Encouragingly, in these
supplementary regressions, the results from Tables 2 and 3 replicate with only fractional
differences in the effort and discretion coefficients and their precision.
Occupational Differences in Employee Outcomes
How are work effort and discretion associated with employee outcomes in different types
of occupations? We examine this question by comparing upper- and lower-level occupations.9
Table A.5 in the Online Appendix shows summary statistics for subsamples of high-skilled white
collars and low-skilled blue collars. High-skilled white collars on average supply more overtime
9 We have also undertaken a similar analysis for employees with contingent versus permanent contracts. The results of this supplementary analysis are available from the authors on request.
20
and have more discretion compared to low-skilled blue collars, while Work intensity is higher in
low-skilled blue collars.
[[Table 4 near here]]
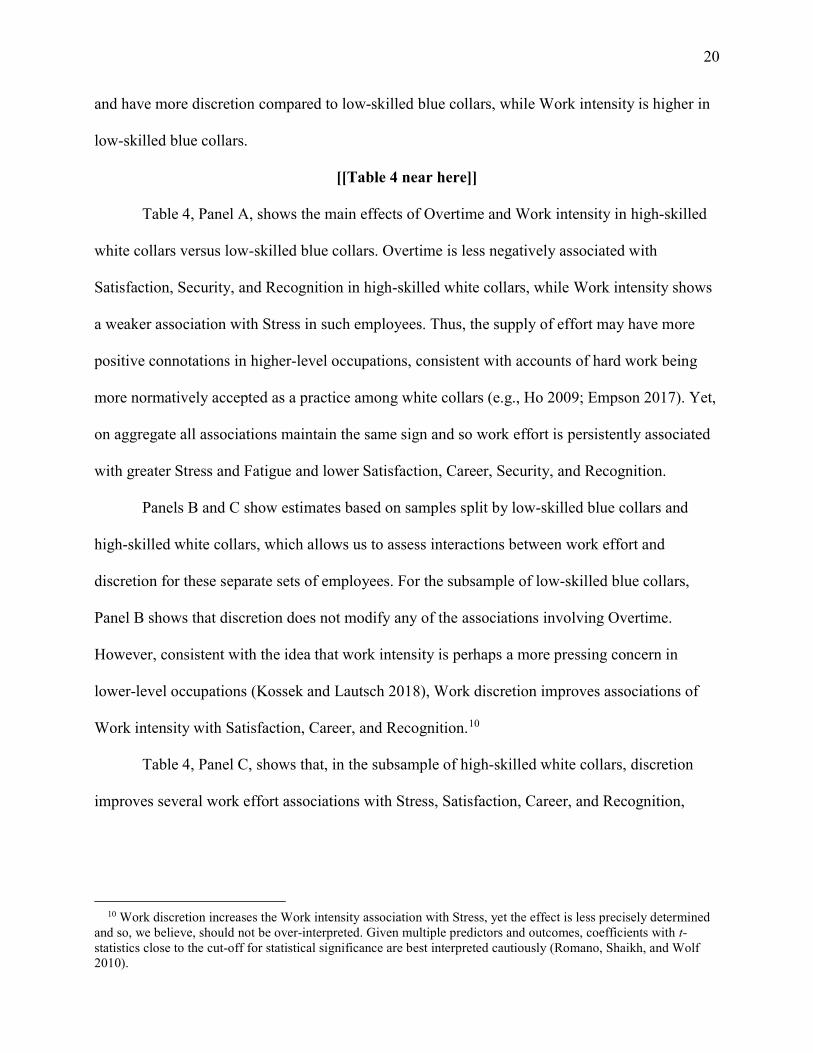
Table 4, Panel A, shows the main effects of Overtime and Work intensity in high-skilled
white collars versus low-skilled blue collars. Overtime is less negatively associated with
Satisfaction, Security, and Recognition in high-skilled white collars, while Work intensity shows
a weaker association with Stress in such employees. Thus, the supply of effort may have more
positive connotations in higher-level occupations, consistent with accounts of hard work being
more normatively accepted as a practice among white collars (e.g., Ho 2009; Empson 2017). Yet,
on aggregate all associations maintain the same sign and so work effort is persistently associated
with greater Stress and Fatigue and lower Satisfaction, Career, Security, and Recognition.
Panels B and C show estimates based on samples split by low-skilled blue collars and
high-skilled white collars, which allows us to assess interactions between work effort and
discretion for these separate sets of employees. For the subsample of low-skilled blue collars,
Panel B shows that discretion does not modify any of the associations involving Overtime.
However, consistent with the idea that work intensity is perhaps a more pressing concern in
lower-level occupations (Kossek and Lautsch 2018), Work discretion improves associations of
Work intensity with Satisfaction, Career, and Recognition.10
Table 4, Panel C, shows that, in the subsample of high-skilled white collars, discretion
improves several work effort associations with Stress, Satisfaction, Career, and Recognition,
10 Work discretion increases the Work intensity association with Stress, yet the effect is less precisely determined and so, we believe, should not be over-interpreted. Given multiple predictors and outcomes, coefficients with t-statistics close to the cut-off for statistical significance are best interpreted cautiously (Romano, Shaikh, and Wolf 2010).

21
while Security is lower in employees with Schedule discretion working Overtime.11 The
interaction between Overtime and Schedule discretion in model 4 is worth singling out because it
shows a rare sign reversal, where the Overtime association with Career is positive (rather than
less negative) given Schedule discretion. Schedule discretion does not modify any of the
associations involving Work intensity.
Overall, Table 4 suggests that discretion improves effort associations with outcomes in
upper- and lower-level occupations alike, although relatively more so for work intensity in low-
skilled blue collars and overtime work in high-skilled white collars.12 These findings expand an,
as yet, limited understanding of whether and how discretion practices have heterogeneous effects
across occupations (Kossek and Lautsch 2018).
Conclusion
Our first objective has been to bridge the distinct literatures on the well-being and career-
related effects of work effort, by offering an integrative analysis of the implications of overtime
work and work intensity for employee well-being and career-related outcomes. Using micro data
on a random sample of 51,895 European employees across 2010 and 2015, we have shown that
greater work effort is associated with reduced well-being and inferior career-related outcomes.
These findings hold true even in upper-level occupations (Table 4, Panel A), where the ambiguity
surrounding performance evaluation plausibly enhances the career-related outcomes of visible
work effort. The work effort associations with well-being stand out as particularly substantial.
Between types of work effort, work intensity generally is a stronger predictor of unfavorable
outcomes than overtime work. These results align with prior evidence on the negative relation
11 It is possible that job insecurity elicits greater overtime in employees with schedule discretion. With available data, our analyses cannot easily adjudicate between this and other narratives, an issue we return to in the Conclusion. 12 A pairwise statistical comparison of all effort-by-discretion interactions between low-skilled blue collars and high-skilled white collars gives results that are consistent with this conclusion. Table A.6 in the Online Appendix shows the χ2-statistics for these comparisons and their p-values.

22
between work effort and employee well-being. They also imply that the self-limiting and
counterproductive tendencies of work effort, whether overtime work or work intensity, outweigh
the role of work effort as a value-signaling device. Moreover, the magnitude of the work intensity
effects converges with suggestions in the work intensification literature that work intensity may
pose greater threats to employee well-being than overtime work (e.g., Green 2004a).
Our second objective has been to examine how work effort associations with employee
outcomes vary with the level of discretion given to employees. We have shown that discretion
may reduce the adverse implications of work effort with respect to both well-being and career-
related outcomes, but work intensity generally remains a strong predictor of unfavorable
outcomes even in employees with discretion. Moreover, discretion might be more effective in
helping high-skilled white collars deal with overtime work, and low-skilled blue collars with
work intensity. These findings contribute to a more comprehensive view of the role of discretion
in conditioning a broader set of outcomes beyond employee well-being.
Our analyses are based on observational data in a pooled cross section and so our findings
must be treated cautiously. First, selectivity is a concern. Work effort and the availability of
discretion vary systematically across employees, and their determinants might correlate with
well-being and career-related outcomes. Our models contain a large number of controls for such
confounding influences, yet it remains possible that relevant employee differences are omitted.
Second, causality may operate from outcomes to work effort and discretion, an issue perhaps
more pressing in the models for career-related outcomes: employees with limited career potential
might experience more pressure to work hard, while ones with greater potential might more
readily receive discretion.
We are reassured by essentially unaltered estimates in supplementary specifications
controlling for past wage growth, and by the absence of systematic differences in the work

23
intensity associations with career-related outcomes between high-skilled white collars and low-
skilled blue collars. The latter is an unlikely result in the presence of consequential reverse
causality from career potential to work effort, given that low-skilled blue collars with nowhere to
go would be relatively more vulnerable to supervisory pressures for intense work. Longitudinal
studies will be important to help address issues of unobserved heterogeneity. To establish cause
and effect, scholars may also exploit exogenous shifts in labor regulations, some of which might
change work effort without changing relevant outcomes per se.
Although we cannot draw definite causal inferences due to the empirical challenges that
remain, our results certainly do not deny the possibility that work effort and discretion affect
employee outcomes. In this vein, we explore some possible implications. Oftentimes, workers
both complain and boast about excessive work effort (evidence for professionals abound—e.g.,
Ho 2009; Empson 2017), perhaps because they accept inferior well-being while anticipating
career-related progress. Our results could imply that the latter might not materialize. If overtime
work and work intensity pose challenges not just for well-being but also career-related outcomes,
then employees must become more aware of the broader limitations of excessive work effort. The
possible limitations of work effort also have implications for employers, who may worry about
productivity and quality issues. Our findings foreshadow that greater discretion should be given
when viable, and certainly where high levels of work effort are likely or unavoidable.
Governments have long recognized the issues involved in extensive work effort, for
example, by imposing restrictions on standard working hours. And countries such as France and
Italy have passed laws giving employees a right to disconnect from work. Some employers have
followed suit by setting limits to out-of-hours communications. While all such initiatives concern
the duration of work, our findings would imply that the intensity of work might have more severe
ramifications for employees. This indicates a need for greater awareness of such potential effects

24
among employers and policy makers, and for greater attention to strategies that may help relieve
employees of undue exposure to intensive work. This is challenging not least because the
evaluation of work intensity is complex relative to work duration. Suitable initiatives will take
time to unfold (Lehndorff 2014) and may encounter resistance (Kellogg 2011), yet we believe
they merit genuine consideration.

25
References
Anger, Silke. 2008. Overtime work as a signaling device. Scottish Journal of Political Economy 55(2): 167-189.
Avgar, Ariel C., Niti Pandey, and Kiwook Kwon. 2012. Discretion in context: A moderated mediation model of the relationship between discretion and turnover intentions. Industrial Relations: Journal of Economy and Society 51(1): 106-128.
Avgoustaki, Argyro. 2016. Work uncertainty and extensive work effort: The mediating role of human resource practices. Industrial and Labor Relations Review 69(3): 656-682.
Baker, George, Michael Gibbs, and Bengt Holmstrom. 1994. The wage policy of a firm. Quarterly Journal of Economics 109(4): 921-955.
Batt, Rosemary, and Alexander J. S. Colvin. 2011. An employment systems approach to turnover: Human resources practices, quits, dismissals, and performance. Academy of Management Journal 54(4): 695-717.
Beckmann, Michael, Thomas Cornelissen, and Matthias Kräkel. 2017. Self-managed working time and employee effort: Theory and evidence. Journal of Economic Behavior & Organization 133: 285-302.
Belman, Dale L., and Kristen A. Monaco. 2001. The effects of deregulation, de-unionization, technology, and human capital on the work and work lives of truck drivers. Industrial and Labor Relations Review 54(2A): 502-524.
Blanchflower, David G., and Andrew Oswald. 2017. Do humans suffer a psychological low in midlife? Two approaches (with and without controls) in seven data sets. NBER Working Paper No. 23724. August.
Booth, Alison L., Marco Francesconi, and Jeff Frank. 2002. Temporary jobs: Stepping stones or dead ends? Economic Journal 112(480): F189-F213.
Boxall, Peter, and Keith Macky. 2014. High-involvement work processes, work intensification and employee well-being. Work, Employment and Society 28(6): 963-984.
CBS (Dutch Central Statistics Office). 2017. Psychosociale arbeidsbelasting (PSA) werknemers. Accessed at http://statline.cbs.nl/Statweb (August 2017).
Chapman, Sydney J. 1909. Hours of labour. Economic Journal 19(75): 353-373. Cottini, Elena, and Claudio Lucifora. 2013. Mental health and working conditions in Europe.
Industrial and Labor Relations Review 66(4): 958-988. Dembe, Allard E., J. Bianca Erickson, Rachel G. Delbos, and Steven M. Banks. 2005. The
impact of overtime and long work hours on occupational injuries and illnesses: New evidence from the United States. Occupational & Environmental Medicine 62(9): 588-597.
De Menezes, Lilian M., and Clare Kelliher. 2017. Flexible working, individual performance, and employee attitudes: Comparing formal and informal arrangements. Human Resource Management 56(6): 1051-1070.
Empson, Laura. 2017. Leading Professionals: Power, Politics, and Prima Donnas. Oxford, UK: Oxford University Press.

26
Eurofound. 2010. Fifth European Working Conditions Survey. Accessed at https://www. eurofound.europa.eu/surveys/european-working-conditions-surveys (August 2012).
Eurofound. 2015. Sixth European Working Conditions Survey. Accessed at https://www. eurofound.europa.eu/surveys/european-working-conditions-surveys (February 2017).
Folkard, Simon, and David A. Lombardi. 2006. Modeling the impact of the components of long work hours on injuries and “accidents”. American Journal of Industrial Medicine 49(11): 953-963.
Francesconi, Marco. 2001. Determinants and consequences of promotions in Britain. Oxford Bulletin of Economics and Statistics 63(3): 279-310.
Gallie, Duncan, Alan Felstead, Francis Green, and Hande Inanc. 2017. The hidden face of job insecurity. Work, Employment and Society 31(1): 36-53.
Gibbons, Robert, and Michael Waldman. 1999. A theory of wage and promotion dynamics inside firms. Quarterly Journal of Economics 114(4): 1321-1358.
Gittleman, Maury, Michael Horrigan, and Mary Joyce. 1998. “Flexible” workplace practices: Evidence from a nationally representative survey. Industrial and Labor Relations Review 52(1): 99-115.
Goh, Joel, Jeffrey Pfeffer, and Stefanos A. Zenios. 2016. The relationship between workplace stressors and mortality and health costs in the United States. Management Science 62(2): 608-628.
Golden, Lonnie, and Barbara Wiens-Tuers. 2006. To your happiness? Extra hours of labor supply and worker well-being. Journal of Socio-Economics 35(2): 382-397.
Green, Francis. 2001. It’s been a hard day’s night: The concentration and intensification of work in late 20th century Britain. British Journal of Industrial Relations 39(1): 53-80.
Green, Francis. 2004a. Why has work effort become more intense? Industrial Relations: Journal of Economy and Society 43(4): 709-741.
Green, Francis. 2004b. Work intensification, discretion and the decline in well-being at work. Eastern Economic Journal 30(4): 615-625.
Green, Francis, Alan Felstead, Duncan Gallie, and Hande Inanc. 2016. Job-related well-being through the Great Recession. Journal of Happiness Studies 17(1): 389-411.
Green, Francis, and Steven McIntosh. 2001. The intensification of work in Europe. Labour Economics 8(2): 291-308.
Green, Francis, Tarek Mostafa, Agnès Parent-Thirion, Greet Vermeylen, Gijs van Houten, Isabella Biletta, and Maija Lyly-Yrjanainen. 2013. Is job quality becoming more unequal? Industrial and Labor Relations Review 66(4): 753-784.
Hackman, J. Richard, and Greg R. Oldham. 1975. Development of the job diagnostic survey. Journal of Applied Psychology 60(2): 159-170.
Henly, Julia R., and Susan J. Lambert. 2014. Unpredictable work timing in retail jobs: Implications for employee work-life conflict. Industrial and Labor Relations Review 67(3): 986-1016.
Ho, Karen. 2009. Liquidated: An Ethnography of Wall Street. Durham, NC: Durham University Press.
27
Holmstrom, Bengt. 1999. Managerial incentive problems: A dynamic perspective. Review of Economic Studies 66(1): 169-182.
Karasek, Jr., Robert A. 1979. Job demands, job decision latitude, and mental strain: Implications for job redesign. Administrative Science Quarterly 24(2): 285-308.
Kelliher, Clare, and Deirdre Anderson. 2010. Doing more with less? Flexible working practices and the intensification of work. Human Relations 63(1): 83-106.
Kellogg, Katherine C. 2011. Challenging Operations: Medical Reform and Resistance in Surgery. Chicago, IL: University of Chicago Press.
Kelly, Erin L., Phyllis Moen, and Eric Tranby. 2011. Changing workplaces to reduce work-family conflict: Schedule control in a white-collar organization. American Sociological Review 76(2): 265-290.
Kossek, Ellen E., and Brenda A. Lautsch. 2018. Work-life flexibility for whom? Occupational status and work-life inequality in upper, middle, and lower level jobs. Academy of Management Annals 12(1): 5-36.
Kristensen, Tage S., Jakob B. Bjorner, Karl B. Christensen, and Vilhelm Borg. 2004. The distinction between work pace and working hours in the measurement of quantitative demands at work. Work & Stress 18(4): 305-322.
Landers, Renee M., James B. Rebitzer, and Lowell J. Taylor. 1996. Rat race redux: Adverse selection in the determination of work hours in law firms. American Economic Review 86(3): 329-348.
Lehndorff, Steffen. 2014. It’s a long way from norms to normality: The 35-hour week in France. Industrial and Labor Relations Review 67(3): 838-863.
Leslie, Lisa M., Colleen F. Manchester, Tae-Youn Park, and Si Ahn Mehng. 2012. Flexible work practices: A source of career premiums or penalties? Academy of Management Journal 56(6): 1407-1428.
Lopes, Helena, Sérgio Lagoa, and Teresa Calapez. 2014. Work autonomy, work pressure, and job satisfaction: An analysis of European Union countries. Economic and Labour Relations Review 25(2): 306-326.
Lott, Yvonne, and Heejung Chung. 2016. Gender discrepancies in the outcomes of schedule control on overtime hours and income in Germany. European Sociological Review 32(6): 752-765.
Lyness, Karen S., Janet C. Gornick, Pamela Stone, and Angela R. Grotto. 2012. It’s all about control: Worker control over schedule and hours in cross-national context. American Sociological Review 77(6): 1023-1049.
Michel, Alexandra. 2011. Transcending socialization: A nine-year ethnography of the body’s role in organizational control and knowledge workers’ transformation. Administrative Science Quarterly 56(3): 325-368.
Moen, Phyllis, Erin L. Kelly, Wen Fan, Shi-Rong Lee, David Almeida, Ellen E. Kossek, and Orfeu M. Buxton. 2016. Does a flexibility/support organizational initiative improve high-tech employees’ well-being? Evidence from the Work, Family, and Health Network. American Sociological Review 81(1): 134-164.

28
Ortega, Jaime. 2009a. Employee discretion and performance pay. Accounting Review 84(2): 589-612.
Ortega, Jaime. 2009b. Why do employers give discretion? Family versus performance concerns. Industrial Relations: Journal of Economy and Society 48(1): 1-26.
Pannenberg, Markus. 2005. Long-term effects of unpaid overtime: Evidence for West Germany. Scottish Journal of Political Economy 52(2): 177-193.
Pencavel, John. 2015. The productivity of working hours. Economic Journal 125(589): 2052-2076.
Pencavel, John. 2016. Recovery from work and the productivity of working hours. Economica 83(332): 545-563.
Robone, Silvana, Andrew M. Jones, and Nigel Rice. 2011. Contractual conditions, working conditions and their impact on health and well-being. European Journal of Health Economics 12(5): 429-444.
Romano, Joseph P., Azeem M. Shaikh, and Michael Wolf. 2010. Hypothesis testing in econometrics. Annual Review of Economics 2: 75-104.
Sánchez, Rafael. 2017. Does a mandatory reduction of standard working hours improve employees’ health status? Industrial Relations: Journal of Economy and Society 56(1): 3-39.
Schieman, Scott, and Paul Glavin. 2016. The pressure-status nexus and blurred work-family boundaries. Work and Occupations 43(1): 3-37.
Schieman, Scott, Melissa A. Milkie, and Paul Glavin. 2009. When work interferes with life: Work-nonwork interference and the influence of work-related demands and resources. American Sociological Review 74(6): 966-988.
Singh, Jagdip. 2000. Performance productivity and quality of frontline employees in service organizations. Journal of Marketing 64(2): 15-34.
Sparks, Kate, Cary Cooper, Yitzhak Fried, and Arie Shirom. 1997. The effects of hours of work on health: A meta-analytic review. Journal of Occupational and Organizational Psychology 70(4): 391-408.
Trades Union Congress. 2017. Workers in the UK put in £33.6 billion worth of unpaid overtime a year. Accessed at https://www.tuc.org.uk/news/workers-uk-put-£336-billion-worth-unpaid-overtime-year (June 2017).
Van Yperen, Nico W., and Mariët Hagedoorn. 2003. Do high job demands decrease intrinsic motivation or fatigue or both? The role of job control and job social support. Academy of Management Journal 46(3): 339-348.
Virtanen, Marianna, Jane E. Ferrie, Archana Singh-Manoux, Martin J. Shipley, Stephen A. Stansfeld, Michael G. Marmot, Kirsi Ahola, Jussi Vahtera, and Mika Kivimäki. 2011. Long working hours and symptoms of anxiety and depression: A 5-year follow-up of the Whitehall II study. Psychological Medicine 14(12): 2485-2494.
Wheatley, Daniel. 2017. Autonomy in paid work and employee subjective well-being. Work and Occupations 44(3): 296-328.

29
Wood, Stephen, and Lilian M. De Menezes. 2011. High involvement management, high-performance work systems and well-being. International Journal of Human Resource Management 22(7): 1586-1610.
Wood, Stephen, David Holman, and Christopher Stride. 2006. Human resource management and performance in UK call centres. British Journal of Industrial Relations 44(1): 99-124.

30
Table 1. Summary Statistics and Correlations 2010 2015 2010-2015
N=25,356 N=26,539 N=51,895
Variable Mean SD Mean SD Mean SD 1 2 3 4 5 6 7 8 9
1 Stress 1.87 1.15 1.92 1.14 1.90 1.15
2 Fatigue 0.42 0.49 0.40 0.49 0.41 0.49 0.21
3 Satisfaction 2.00 0.71 2.06 0.69 2.03 0.70 -0.22 -0.23
4 Career 1.76 1.18 1.95 1.35 1.86 1.28 -0.03 -0.11 0.34
5 Security 2.70 1.23 2.91 1.29 2.81 1.27 -0.05 -0.09 0.27 0.15
6 Recognition (N=26,462)
― ― 2.61 1.17 ― ― -0.20 -0.18 0.50 0.44 0.20
7 Overtime 0.94 1.16 0.73 1.01 0.83 1.09 0.21 0.10 -0.04 0.07 0.01 -0.04
8 Work intensity 2.65 1.83 2.72 1.84 2.69 1.84 0.34 0.14 -0.18 -0.01 -0.09 -0.13 0.13
9 Work discretion 0.65 0.39 0.66 0.39 0.65 0.39 -0.01 -0.02 0.18 0.16 0.15 0.16 0.13 -0.10
10 Schedule discretion 0.41 0.35 0.43 0.36 0.42 0.35 -0.03 -0.07 0.19 0.16 0.12 0.19 0.12 -0.08 0.34
11 Employer-provided training
0.35 0.48 0.39 0.49 0.37 0.48 0.09 -0.02 0.13 0.18 0.13 0.10 0.14 0.00 0.14
12 Employee-funded training
0.06 0.24 0.07 0.25 0.06 0.25 0.06 0.03 0.02 0.06 -0.01 0.00 0.10 0.01 0.06
13 On-the-job training 0.37 0.48 0.38 0.49 0.38 0.48 0.06 0.00 0.09 0.16 0.07 0.08 0.10 0.03 0.09
14 Task rotation 0.51 0.50 0.52 0.50 0.52 0.50 0.07 0.03 -0.01 0.04 0.01 -0.01 0.04 0.12 0.02
15 Productivity pay 0.13 0.33 0.11 0.32 0.12 0.32 0.00 0.03 -0.04 0.02 -0.06 -0.01 0.03 0.08 -0.02
16 Teamwork 0.65 0.48 0.62 0.48 0.64 0.48 0.06 0.03 0.03 0.09 0.03 0.05 0.08 0.08 0.07
17 Paid overtime 0.32 0.47 0.34 0.48 0.33 0.47 0.03 0.00 0.02 0.06 0.04 0.01 0.03 0.09 -0.01
18 Pace of work dependent on colleagues
0.49 0.50 0.47 0.50 0.48 0.50 0.11 0.07 -0.08 0.04 -0.06 -0.06 0.05 0.25 -0.05
19 Pace of work dependent on equipment
0.18 0.39 0.20 0.40 0.19 0.39 0.04 0.05 -0.11 -0.04 -0.09 -0.07 -0.05 0.25 -0.17
20 Task uncertainty 1.24 0.94 1.25 0.91 1.24 0.93 0.24 0.08 -0.03 0.04 0.05 -0.07 0.23 0.22 0.16

31
21 Male 0.50 0.50 0.49 0.50 0.49 0.50 -0.04 -0.07 -0.02 0.06 -0.02 0.01 0.03 0.05 -0.03
22 Age 40.72 11.35 41.55 11.64 41.14 11.50 -0.01 0.00 0.01 -0.17 0.08 -0.03 0.00 -0.09 0.05
23 Log firm tenure 9.72 9.52 9.67 9.55 9.69 9.53 0.05 0.00 0.02 -0.06 0.19 -0.01 0.03 -0.05 0.06
24 Log subordinates 2.36 25.13 2.13 21.64 2.24 23.41 0.03 -0.01 0.03 0.05 0.02 0.02 0.06 0.03 0.05
Variable 10 11 12 13 14 15 16 17 18 19 20 21 22 23
11 Employer-provided training 0.11
12 Employee-funded training 0.01 0.09
13 On-the-job training 0.08 0.43 0.09
14 Task rotation -0.04 0.09 0.02 0.14
15 Productivity pay 0.01 -0.02 0.01 0.01 -0.01
16 Teamwork 0.02 0.13 0.04 0.15 0.39 0.00
17 Paid overtime -0.04 0.06 0.00 0.08 0.09 0.14 0.06
18 Pace of work dependent on colleagues -0.04 0.01 0.00 0.04 0.23 0.05 0.23 0.07
19 Pace of work dependent on equipment -0.13 -0.07 -0.03 -0.02 0.08 0.11 0.04 0.10 0.20
20 Task uncertainty 0.13 0.15 0.04 0.13 0.17 -0.05 0.15 0.02 0.15 -0.02
21 Male 0.07 -0.02 -0.03 -0.02 0.01 0.08 0.02 0.12 0.08 0.14 -0.06
22 Age 0.06 0.02 -0.04 -0.05 -0.05 -0.04 -0.02 -0.05 -0.07 -0.05 -0.03 -0.02
23 Log firm tenure 0.03 0.09 -0.02 0.02 0.01 -0.04 0.04 0.00 -0.01 -0.02 0.03 0.02 0.56
24 Log subordinates 0.06 0.04 0.00 0.02 0.00 0.00 0.02 0.00 0.03 -0.01 0.05 0.04 0.03 0.04
Notes: Correlations are for the pooled sample (2010-2015), except correlations involving Recognition (row/column (6)), which are for available observations in 2015 (N=26,462). To conserve space, correlations involving fixed effects for countries, industries, sectors, occupations, education levels, contract types, and establishment sizes are omitted.

32
Table 2. Regression Estimates for Employee Well-Being and Career-Related Outcomes Employee well-being Career-related outcomes Ordered logit Binary logit Ordered logit Ordered logit
Stress Fatigue Satisfaction Career Security Recognition (1) (2) (3) (4) (5) (6)
Variable β OR β OR β OR β OR β OR β OR
Overtime 0.238*** 1.608 0.183*** 1.440 -0.159*** 0.728 -0.040*** 0.924 -0.042*** 0.920 -0.157*** 0.729 [24.290] [16.277] [-14.710] [-3.641] [-3.983] [-11.004] Work intensity 0.331*** 6.166 0.143*** 2.199 -0.150*** 0.439 -0.021*** 0.890 -0.069*** 0.683 -0.100*** 0.578 [36.925] [21.733] [-23.352] [-3.400] [-12.147] [-12.076] Work discretion -0.170*** 0.844 0.014 1.014 0.490*** 1.633 0.392*** 1.480 0.292*** 1.339 0.455*** 1.576 [-6.370] [0.412] [18.366] [13.642] [10.301] [12.889] Schedule discretion -0.234*** 0.791 -0.106** 0.900 0.614*** 1.848 0.396*** 1.486 0.269*** 1.309 0.620*** 1.858 [-7.655] [-3.161] [17.713] [11.535] [8.625] [15.626] Employer-provided 0.086*** 1.089 -0.025 0.975 0.225*** 1.252 0.354*** 1.424 0.180*** 1.197 0.243*** 1.275 training [4.146] [-1.038] [10.102] [15.829] [8.620] [8.150] Employee-funded 0.117*** 1.124 0.084* 1.087 -0.038 0.962 0.029 1.030 -0.189*** 0.827 -0.127** 0.881 traininga [3.548] [2.069] [-0.987] [0.755] [-5.327] [-2.656] On-the-job training 0.012 1.012 0.080*** 1.083 0.126*** 1.134 0.228*** 1.256 0.012 1.012 0.167*** 1.182 [0.684] [3.365] [5.434] [10.451] [0.527] [6.280] Task rotation 0.071*** 1.073 0.110*** 1.116 -0.057** 0.944 0.005 1.005 0.009 1.009 0.005 1.005 [3.718] [4.730] [-2.667] [0.232] [0.447] [0.183] Productivity pay 0.016 1.016 0.011 1.011 0.021 1.021 0.138*** 1.148 -0.065* 0.937 0.124** 1.132 [0.539] [0.288] [0.676] [4.761] [-2.168] [2.964] Teamwork -0.007 0.993 0.017 1.017 0.129*** 1.137 0.178*** 1.195 0.069*** 1.071 0.185*** 1.203 [-0.324] [0.687] [6.082] [8.915] [3.692] [6.537] Paid overtime -0.019 0.981 0.050* 1.051 0.143*** 1.154 0.258*** 1.294 0.142*** 1.152 0.122*** 1.130 [-1.012] [2.163] [6.431] [11.950] [7.477] [3.822] Pace of work dependent 0.098*** 1.103 0.042 1.043 -0.090*** 0.914 0.038* 1.038 -0.111*** 0.895 -0.075** 0.928 on colleagues [5.332] [1.664] [-4.536] [2.294] [-5.931] [-2.992] Pace of work dependent -0.009 0.991 0.054 1.056 -0.053* 0.948 0.032 1.032 -0.045 0.956 -0.029 0.971 on equipment [-0.359] [1.919] [-2.030] [1.195] [-1.897] [-0.838]

33
Task uncertainty 0.319*** 2.605 0.213*** 1.893 -0.219*** 0.518 -0.130*** 0.677 -0.065*** 0.823 -0.221*** 0.514 [24.904] [15.925] [-16.015] [-11.374] [-5.596] [-14.109] Male -0.107*** 0.898 -0.334*** 0.716 -0.037 0.964 0.180*** 1.198 -0.058** 0.944 -0.046 0.956 [-5.362] [-14.465] [-1.706] [8.334] [-2.669] [-1.799] Age 0.046*** 4.348 0.033*** 2.915 -0.048*** 0.214 -0.043*** 0.253 -0.060*** 0.148 -0.053*** 0.181 [7.656] [4.264] [-7.405] [-6.645] [-9.445] [-6.538] Age squared -0.001*** 0.072 -0.000*** 1.000 0.001*** 13.77 0.000* 1.000 0.001*** 13.77 0.001*** 13.77 [-8.024] [-3.320] [6.549] [2.233] [7.956] [6.237] Log firm tenure 0.117*** 1.457 0.006 1.019 -0.010 0.968 -0.048*** 0.856 0.310*** 2.716 -0.046** 0.862 [9.840] [0.474] [-0.730] [-3.636] [21.131] [-2.608] Log subordinates 0.045*** 1.051 -0.082*** 0.914 0.153*** 1.183 0.236*** 1.296 0.056*** 1.063 0.138*** 1.164 [3.752] [-5.574] [11.905] [17.841] [4.324] [8.043] Year 2015 0.086*** 1.090 -0.036 0.965 0.161*** 1.175 0.272*** 1.312 0.493*** 1.637 ― ―
[3.975] [-1.113] [5.749] [10.095] [16.312] ― Fixed effectsb Yes Yes Yes Yes Yes Yes
Log pseudolikelihood -70,708 -31,304 -49,014 -76,055 -68,711 -36,460
Number of observations 51,895 51,895 51,895 51,895 51,895 26,462 Notes: *Statistically significant at the .05 level; ** at the .01 level; *** at the .001 level. β are beta coefficients from ordered (models 1, 3-6) and binary (model 2) logit regressions, with t-statistics in brackets, based on robust standard errors clustered by country × industry pairs. OR are odds ratios associated with an increase in each predictor from its 10th percentile to its 90th percentile. Relevant percentiles and unstandardized odds ratios (i.e., exp[β]) are given in Tables A.2 and A.3 in the Online Appendix. Estimates in models 1 to 5 are for the pooled sample (2010-2015); estimates in model 6 are for 2015. a. The 10th and 90th percentiles of Employee-funded training are identical and so its odds ratios are given for the 94th relative to the 10th percentile. b. Fixed effects are for counties (35), industries (16), sectors (4), occupations (9), education levels (6), contract types (5), and establishment sizes (2).

34
Table 3. Regression Estimates for Employee Well-Being and Career-Related Outcomes: Work Effort Interactions with Discretion
Employee well-being Career-related outcomes
Ordered logit Binary logit Ordered logit Ordered logit
Stress Fatigue Satisfaction Career Security Recognition
(1) (2) (3) (4) (5) (6)
Variable β OR β OR β OR β OR β OR β OR
Overtime 0.280*** 1.750 0.245*** 1.633 -0.221*** 0.643 -0.043* 0.918 -0.060** 0.885 -0.213*** 0.654 [14.365] [9.810] [-9.856] [-2.290] [-3.047] [-7.440] Work intensity 0.353*** 6.960 0.173*** 2.591 -0.214*** 0.310 -0.103*** 0.567 -0.087*** 0.621 -0.153*** 0.431 [24.267] [15.301] [-18.007] [-9.415] [-8.742] [-10.694] Work discretion -0.070 0.932 0.132* 1.141 0.243*** 1.276 0.159*** 1.173 0.189*** 1.209 0.215*** 1.239 [-1.491] [2.465] [5.539] [3.640] [4.246] [3.674] Schedule discretion -0.172*** 0.842 0.024 1.024 0.461*** 1.586 0.199*** 1.220 0.281*** 1.324 0.551*** 1.734 [-3.302] [0.389] [8.026] [3.661] [5.146] [8.052]
Overtime × Work -0.052* 0.901 -0.086** 0.841 0.074** 1.160 -0.020 0.962 0.057* 1.121 0.088** 1.192 discretion [-2.267] [-2.935] [2.859] [-0.801] [2.393] [2.738]
Overtime × -0.013 0.974 -0.004 0.992 0.021 1.044 0.035 1.071 -0.049 0.906 -0.017 0.966 Schedule discretion [-0.579] [-0.128] [0.829] [1.420] [-1.815] [-0.507]
Work intensity × -0.024 0.875 -0.021 0.895 0.073*** 1.496 0.093*** 1.672 0.022 1.133 0.069*** 1.458 Work discretion [-1.604] [-1.432] [5.203] [6.976] [1.633] [3.602]
Work intensity × -0.018 0.905 -0.045** 0.781 0.048** 1.308 0.060*** 1.392 0.012 1.068 0.029 1.177 Schedule discretion [-1.191] [-2.691] [2.792] [3.622] [0.788] [1.483] Controlsa
Yes Yes Yes Yes Yes Yes
Log pseudolikelihood
-70,698 -31,290 -48,972 -75,995 -68,703 -36,442
Number of observations
51,895 51,895 51,895 51,895 51,895 26,462
Notes: *Statistically significant at the .05 level; ** at the .01 level; *** at the .001 level. β are beta coefficients from ordered (models 1, 3-6) and binary (model 2) logit regressions, with t-statistics in brackets, based on robust standard errors clustered by country × industry pairs. OR are odds ratios associated with an increase in each predictor from its 10th percentile to its 90th percentile. Relevant percentiles are given in Table A.2 in the Online Appendix. Coefficients and odds ratios for the main effects of Overtime and Work intensity represent effects for employees without discretion. Estimates in models 1 to 5 are for the pooled sample (2010-2015); estimates in column 6 are for 2015. a. All models include the same set of control variables as in Table 2.

35
Table 4. Regression Estimates for Employee Well-Being and Career-Related Outcomes: Results for High-Skilled White Collars versus Low-Skilled Blue Collars
Employee well-being Career-related outcomes
Ordered
logit
Stress
Binary logit
Fatigue
Ordered logit
Satisfac
tion
Career
Ordered logit
Security
Recogni tion
Variable (1) (2) (3) (4) (5) (6)
Panel A: Full sample
Overtime 0.248*** 0.176*** -0.175*** -0.023 -0.063*** -0.197*** [17.550] [13.004] [-12.663] [-1.683] [-4.925] [-9.465] Work intensity 0.358*** 0.137*** -0.151*** -0.025*** -0.072*** -0.109*** [33.164] [17.052] [-18.987] [-3.294] [-10.925] [-10.359] High-skilled white collara 0.552*** -0.253*** 0.469*** 0.917*** 0.080 0.180** [11.172] [-4.946] [9.858] [17.453] [1.879] [3.026] Overtime × High-skilled white -0.011 0.012 0.039* -0.022 0.050* 0.083** collara [-0.609] [0.556] [2.205] [-1.164] [2.531] [2.987] Work intensity × High-skilled -0.073*** 0.017 0.003 0.009 0.009 0.025 white collara [-5.826] [1.327] [0.223] [0.772] [0.864] [1.600] Controlsb Yes Yes Yes Yes Yes Yes Number of observations 51,895 51,895 51,895 51,895 51,895 26,462
Panel B: Subsample of low-skilled blue collars Overtime 0.197*** 0.173*** -0.115* -0.005 -0.113** -0.188** [5.237] [3.715] [-2.428] [-0.133] [-2.973] [-3.095] Work intensity 0.351*** 0.174*** -0.241*** -0.158*** -0.106*** -0.187*** [15.907] [7.758] [-10.876] [-8.028] [-5.651] [-7.278] Work discretion -0.247** 0.097 0.195 -0.050 0.212* -0.066 [-2.684] [0.812] [1.884] [-0.503] [2.093] [-0.497] Schedule discretion -0.082 0.066 0.390** 0.097 0.207 0.755*** [-0.680] [0.467] [2.679] [0.729] [1.516] [4.251] Overtime × Work discretion 0.030 -0.000 -0.111 0.030 -0.003 0.038 [0.551] [-0.004] [-1.801] [0.544] [-0.055] [0.410] Overtime × Schedule 0.030 -0.058 0.107 0.022 0.088 0.120 discretion [0.455] [-0.688] [1.355] [0.330] [1.224] [0.997] Work intensity × Work 0.056* -0.001 0.071** 0.111*** 0.024 0.115* discretion [2.016] [-0.024] [2.580] [4.288] [0.852] [2.463] Work intensity × Schedule -0.064 -0.080* 0.078 0.124*** 0.004 -0.014 discretion [-1.661] [-2.188] [1.827] [3.359] [0.093] [-0.265] Controlsb Yes Yes Yes Yes Yes Yes Number of observations 9,242 9,242 9,242 9,242 9,242 4,494
Panel C: Subsample of high-skilled white collars Overtime 0.310*** 0.215*** -0.219*** -0.019 0.014 -0.218*** [8.410] [5.515] [-5.470] [-0.586] [0.421] [-4.431]

36
Work intensity 0.336*** 0.188*** -0.248*** -0.094*** -0.092*** -0.183*** [13.115] [7.386] [-10.922] [-4.128] [-4.231] [-6.153] Work discretion 0.020 0.093 0.159 0.225** 0.261** 0.092 [0.240] [0.908] [1.925] [2.929] [3.246] [0.789] Schedule discretion -0.283** -0.082 0.331*** 0.099 0.287*** 0.358** [-3.131] [-0.779] [3.941] [1.273] [3.507] [3.291] Overtime × Work discretion -0.098* -0.068 0.115** -0.056 0.020 0.149** [-2.457] [-1.547] [2.734] [-1.510] [0.582] [2.627] Overtime × Schedule 0.042 0.061 0.004 0.099*** -0.098** -0.010 discretion [1.399] [1.447] [0.088] [3.400] [-2.966] [-0.203] Work intensity × Work -0.013 -0.033 0.117*** 0.103*** 0.025 0.094** discretion [-0.473] [-1.148] [4.233] [3.877] [1.009] [2.649] Work intensity × Schedule 0.001 -0.031 0.050 0.027 0.015 0.046 discretion [0.056] [-1.198] [1.897] [1.078] [0.665] [1.473] Controlsb Yes Yes Yes Yes Yes Yes Number of observations 19,911 19,911 19,911 19,911 19,911 10,221 Notes: *Statistically significant at the .05 level; ** at the .01 level; *** at the .001 level. Coefficients are from ordered (models 1, 3-6) and binary (model 2) logit regressions, with t-statistics in brackets, based on robust standard errors clustered by country × industry pairs. Each column contains three separate models, one estimated for the full sample, one for the subsample of low-skilled blue collars, and one for the subsample of high-skilled white collars. Low-skilled blue collars are plant and machine operators and assemblers and individuals in elementary occupations (ISCO88 codes 8 and 9). High-skilled white collars are legislators, senior officials and managers, professionals, technicians, and associate professionals (ISCO88 codes 1, 2, and 3). Estimates in columns (1) to (5) are for the pooled sample (2010-2015); estimates in column (6) are for 2015. a. High-skilled white collar is a dummy variable set to 1 for legislators, senior officials and managers, professionals, technicians, and associate professionals (ISCO88 codes 1, 2, and 3), and 0 otherwise. b. Except for occupation fixed effects, all models include control variables as in Table 2. Models of panel A also include fixed effects for ISCO88 codes 4-7 and 10 and so coefficients on High-skilled white collar are relative to low-skilled blue collars. Due to collinearity, an ordinal measure for education level substitutes education level fixed effects in column (6) of panel C.

37
Online Appendix
Table A.1. Variable Definitions and Sources
Question # Variable Question(s) Scales EWCS 2010 EWCS 2015
Stress You experience stress in your work 0 (never) - 4 (always) 51N 61M
Fatigue Over the last 12 months, did you suffer from overall fatigue?
0 = no; 1 = yes 69L 78I
Satisfaction On the whole, are you very satisfied, satisfied, not very satisfied or not at all satisfied with working conditions in your main paid job?
0 (not at all satisfied) - 3 (very satisfied)
76 88
Career My job offers good prospects for career advancement 0 (strongly disagree) - 4 (strongly agree)
77C 89B
Security I might lose my job in the next 6 months 0 (strongly agree) - 4 (strongly disagree)
77A 89G
Recognition I receive the recognition I deserve for my work 0 (strongly disagree) - 4 (strongly agree)
― 89C
Overtime Over the last 12 months, how often have you worked in your free time to meet work demands?
0 (never) - 4 (every day) 42 46
Work intensity Simple average of answers to:
Does your job involve working at very high speed? 0 (never) - 6 (all of the time) 45A 49A
Does your job involve working to tight deadlines? 0 (never) - 6 (all of the time) 45B 49B
Work discretion Simple average of answers to:
Are you able to choose or change your order of tasks? 0 = no; 1 = yes 50A 54A
Are you able to choose or change your methods of work?
0 = no; 1 = yes 50B 54B
Are you able to choose or change your speed or rate of work?
0 = no; 1 = yes 50C 54C
Schedule discretion Simple average of answers to:
Can you adapt or entirely determine your working hours?
0 = no; 1 = yes 39 42
You can take a break when you wish 0 = rarely or never; 1 = sometimes or always
51F 61F

38
Employer-provided training Over the past 12 months, have you undergone training paid for or provided by your employer to improve your skills?
0 = no; 1 = yes 61A 65A
Employee-funded training Over the past 12 months, have you undergone training paid for by yourself to improve your skills?
0 = no; 1 = yes 61B 65B
On-the-job training Over the past 12 months, have you undergone on-the-job training to improve your skills?
0 = no; 1 = yes 61C 65C
Task rotation Does your job involve rotating tasks between yourself and colleagues?
0 = no; 1 = yes 53 55
Productivity pay Do the earnings from your main job include piece rate or productivity payments?
0 = no; 1 = yes EF7B 101B
Teamwork Do you work in a group or team that has common tasks and can plan its work?
0 = no; 1 = yes 56 58
Paid overtime Do the earnings from your main job include extra payments for additional hours of work/overtime?
0 = no; 1 = yes EF7C 101C
Pace of work dependent on colleagues
On the whole, is your pace of work dependent on the work done by colleagues?
0 = no; 1 = yes 46A 50A
Pace of work dependent on equipment
On the whole, is your pace of work dependent on the automatic speed of a machine or movement of a product?
0 = no; 1 = yes 46D 50D
Task uncertainty How often do you have to interrupt a task you are doing in order to take on an unforeseen task?
0 (never) - 3 (very often) 47 51
Male Gender 0 = female; 1 = male HH2a 2a
Age Age in years Continuous HH2b 2b
Log firm tenure Natural logarithm of answer (+1) to:
How many years have you been in your company or organization?
Continuous 12 17
Log subordinates Natural logarithm of answer (+1) to:
How many people work under your supervision, for whom pay increases, bonuses or promotion depend directly on you?
Continuous 17 23
Year 2015 Survey year 0 = 2010; 1 = 2015 ― ―
Country Dummy variables for country of interview
― ―
Industry Dummy variables for one-digit NACE industry sections
9 13

39
Sector Dummy variables for private, public, joint private-public, not-for-profit, and other sectors
10 14
Occupation Dummy variables for one-digit ISCO88 occupations
2, 3 5, 6
Education level Dummy variables for one-digit ISCED education levels
EF1 106
Contract type Dummy variables for permanent contract, fixed term contract, temporary employment agency contract, apprenticeship or other training scheme, no contract, and other contract
7 11
Establishment size Dummy variables for establishments with 2-9, 10-249, and 250+ employees
11 16a, 16b
Notes: All variables are based on the fifth and sixth European Working Condition Surveys (EWCS 2010 and EWCS 2015). The last two columns refer to the specific questions in the two surveys.
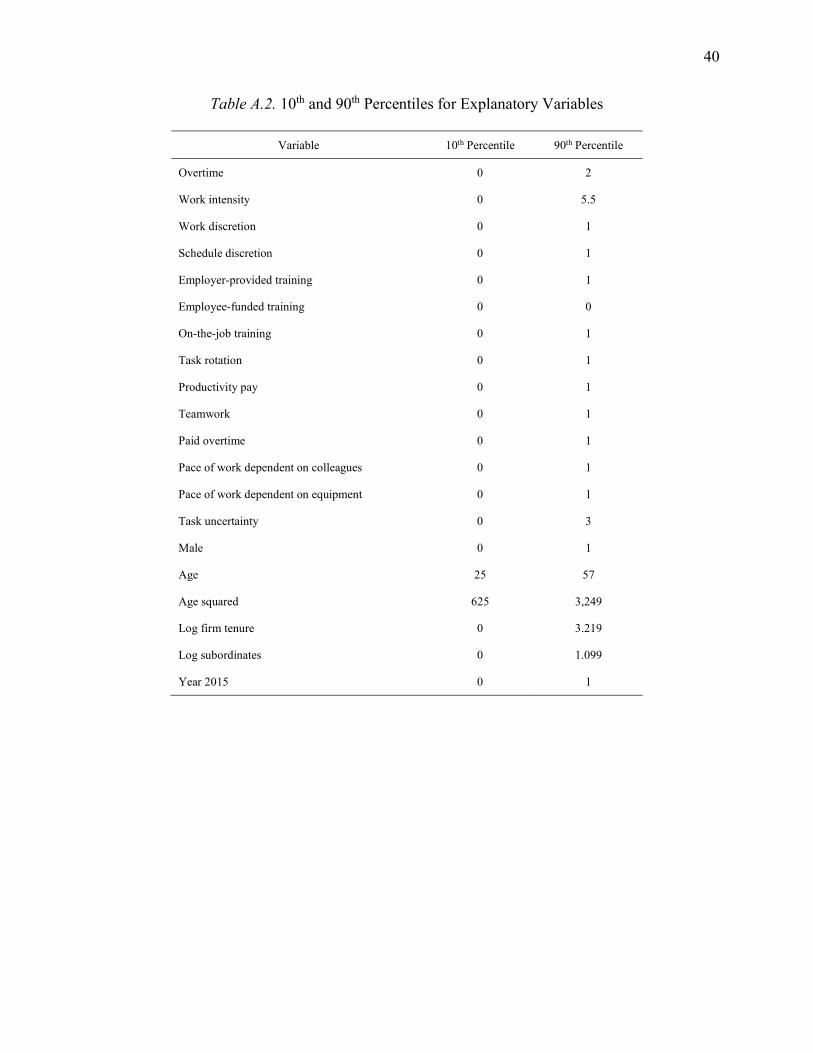
40
Table A.2. 10th and 90th Percentiles for Explanatory Variables
Variable 10th Percentile 90th Percentile
Overtime 0 2
Work intensity 0 5.5
Work discretion 0 1
Schedule discretion 0 1
Employer-provided training 0 1
Employee-funded training 0 0
On-the-job training 0 1
Task rotation 0 1
Productivity pay 0 1
Teamwork 0 1
Paid overtime 0 1
Pace of work dependent on colleagues 0 1
Pace of work dependent on equipment 0 1
Task uncertainty 0 3
Male 0 1
Age 25 57
Age squared 625 3,249
Log firm tenure 0 3.219
Log subordinates 0 1.099
Year 2015 0 1

41
Table A.3. Unstandardized Odds Ratios for Estimates in Table 2
Employee well-being Career-related outcomes
Ordered
logit Binary logit
Ordered logit
Ordered logit
Stress Fatigue Satisfac
tion Career Security
Recognition
Variable (1) (2) (3) (4) (5) (6)
Overtime 1.268 1.200 0.853 0.961 0.959 0.854
Work intensity 1.392 1.154 0.861 0.979 0.933 0.905
Work discretion 0.844 1.014 1.633 1.480 1.339 1.576
Schedule discretion 0.791 0.900 1.848 1.486 1.309 1.858
Employer-provided training 1.089 0.975 1.252 1.424 1.197 1.275
Employee-funded training 1.124 1.087 0.962 1.030 0.827 0.881
On-the-job training 1.012 1.083 1.134 1.256 1.012 1.182
Task rotation 1.073 1.116 0.944 1.005 1.009 1.005
Productivity pay 1.016 1.011 1.021 1.148 0.937 1.132
Teamwork 0.993 1.017 1.137 1.195 1.071 1.203
Paid overtime 0.981 1.051 1.154 1.294 1.152 1.130
Pace of work dependent on colleagues
1.103 1.043 0.914 1.038 0.895 0.928
Pace of work dependent on equipment
0.991 1.056 0.948 1.032 0.956 0.971
Task uncertainty 1.376 1.237 0.803 0.878 0.937 0.801
Male 0.898 0.716 0.964 1.198 0.944 0.956
Age 1.047 1.034 0.953 0.958 0.942 0.948
Age squared 0.999 1.000 1.001 1.000 1.001 1.001
Log firm tenure 1.124 1.006 0.990 0.953 1.364 0.955
Log subordinates 1.046 0.921 1.165 1.266 1.057 1.148
Year 2015 1.090 0.965 1.175 1.312 1.637 ―
Notes: Unstandardized odds ratios are shown, calculated as exp[β], based on the β coefficients in Table 2.

42
Table A.4. Odds Ratios for Overtime and Work Intensity in Employees with/without Discretion
Employee well-being Career-related outcomes
Ordered logit Binary logit Ordered logit Ordered logit
Stress Fatigue Satisfaction Career Security Recognition
(1) (2) (3) (4) (5) (6)
Overtime
Without discretion 1.750 1.633 0.643 0.918 0.885 0.654
With Work discretion 1.577 1.373 0.746 0.918 0.993 0.780
With Schedule discretion 1.750 1.633 0.643 0.918 0.885 0.654
Work intensity
Without discretion 6.960 2.591 0.310 0.567 0.621 0.431
With Work discretion 6.960 2.591 0.463 0.948 0.621 0.628
With Schedule discretion 6.960 2.024 0.405 0.789 0.621 0.431
Notes: Values are odds ratios associated with an increase in each predictor from its 10th percentile to its 90th percentile. For interactions that are indistinguishable from 0 at the 95% level, odds ratios with discretion are equal to odds ratios without discretion. All predictions are based on the estimates in Table 3.

43
Table A.5. Summary Statistics by Occupationa
High-skilled white collars Low-skilled blue collars (N=19,911) (N=9,242)
Variable Mean SD Mean SD
Stress 2.05 1.07 1.71 1.25
Fatigue 0.40 0.49 0.44 0.5
Satisfaction 2.16 0.66 1.85 0.74
Career 2.22 1.22 1.35 1.22
Security 3.05 1.18 2.55 1.33
Recognitionb 2.77 1.09 2.38 1.25
Overtime 1.18 1.21 0.57 0.94
Work intensity 2.55 1.75 2.88 1.96
Work discretion 0.78 0.33 0.51 0.42
Schedule discretion 0.52 0.38 0.32 0.31
a. High-skilled white collars are legislators, senior officials and managers, professionals, technicians, and associate professionals (ISCO88 codes 1, 2, and 3). Low-skilled blue collars are plant and machine operators and assemblers and elementary occupations (ISCO88 codes 8 and 9). b. Recognition is available only in EWCS 2015 and so sample sizes are N=10,221 for high-skilled white collars and N=4,494 for low-skilled blue collars.

44
Table A.6. Tests of Differences in Effort-by-Discretion Interactions between Low-Skilled Blue Collars and High-Skilled White Collars
Stress Fatigue Satisfaction Career Security Recognition
Overtime × Work discretion 3.56 0.74 9.71 1.60 0.12 1.08
[0.059] [0.390] [0.002] [0.205] [0.731] [0.299]
Overtime × Schedule discretion 0.03 1.54 1.25 1.07 5.48 1.00
[0.874] [0.214] [0.263] [0.301] [0.019] [0.318]
Work intensity × Work discretion 2.98 0.55 1.33 0.05 0.00 0.12
[0.084] [0.458] [0.248] [0.820] [0.977] [0.730]
Work intensity × Schedule discretion 2.03 1.23 0.31 4.69 0.06 1.01
[0.155] [0.268] [0.577] [0.030] [0.812] [0.315] Notes: χ2-statistics (1df) are shown, with p-values in brackets, testing differences in the magnitudes of the effort-by-discretion interactions across models for low-skilled blue collars (Table 4, Panel B) and high-skilled white collars (Table 4, Panel C).


![CVRUZ X A]R - s3.amazonaws.com · o 1hk &ru Ó Þ Õ â o 1hk &ru o 1hk &ru o (vwkhu &ru o (vwkhu &ru o (vwkhu &ru](https://static.fdocuments.net/doc/165x107/5af182d17f8b9abc788e85aa/cvruz-x-ar-s3-1hk-ru-o-1hk-ru-o-1hk-ru-o-vwkhu-ru-o-vwkhu-ru-o-vwkhu-ru.jpg)