City Research Onlineopenaccess.city.ac.uk/2070/1/The Characterisation of Diesel... · A...
16
City, University of London Institutional Repository Citation: Lockett, R. D., Liverani, L., Thaker, D. & Arcoumanis, C. (2009). The characterisation of diesel cavitating flow using time-resolved light scattering. Paper presented at the IMechE Conference on Injection Systems for IC Engines, 13 - 14 May 2009, London, UK. This is the unspecified version of the paper. This version of the publication may differ from the final published version. Permanent repository link: http://openaccess.city.ac.uk/2070/ Link to published version: Copyright and reuse: City Research Online aims to make research outputs of City, University of London available to a wider audience. Copyright and Moral Rights remain with the author(s) and/or copyright holders. URLs from City Research Online may be freely distributed and linked to. City Research Online: http://openaccess.city.ac.uk/ [email protected] City Research Online
Transcript of City Research Onlineopenaccess.city.ac.uk/2070/1/The Characterisation of Diesel... · A...

City, University of London Institutional Repository
Citation: Lockett, R. D., Liverani, L., Thaker, D. & Arcoumanis, C. (2009). The characterisation of diesel cavitating flow using time-resolved light scattering. Paper presented at the IMechE Conference on Injection Systems for IC Engines, 13 - 14 May 2009, London, UK.
This is the unspecified version of the paper.
This version of the publication may differ from the final published version.
Permanent repository link: http://openaccess.city.ac.uk/2070/
Link to published version:
Copyright and reuse: City Research Online aims to make research outputs of City, University of London available to a wider audience. Copyright and Moral Rights remain with the author(s) and/or copyright holders. URLs from City Research Online may be freely distributed and linked to.
City Research Online: http://openaccess.city.ac.uk/ [email protected]
City Research Online
The Characterisation of Diesel
Cavitating Flow using Time-
Resolved Light Scattering
R.D. Lockett, L. Liverani, D. Thaker, C. Arcoumanis
School of Engineering & Mathematical Sciences
City University London
Northampton Square, EC1V 0HB
London, UK
ABSTRACT
A conventional six-hole valve-covered orifice (VCO) injector nozzle
has been modified in order to provide optical access to the region
below the needle, and the nozzle passages. This has been
achieved through the removal of the metal tip, and its replacement
with a transparent acrylic tip of identical geometry.
Elastic scattering of light obtained from the internal cavitating flow
inside the nozzle holes of the optically accessible diesel injector tip
was captured on a high speed electronic camera. The optical
image data was obtained from a nozzle with a common rail
pressure of 400 bar, and for two diesel fuels, in order to identify
differences in cavitation behaviour.
A set of 100 mean diesel fuel injection images were obtained from
30 fuel injection pulses, for each operating condition. The imaged
mean cavitation occurring in the nozzle holes was converted to the
mean proportion of nozzle hole area producing cavitation
scattering. The mean cavitation area images were then analysed,
and were able to demonstrate the inverse relationship between
fuel mass injected and the relative area producing cavitation
scattering.
Key Words: diesel nozzle flow, cavitation, VCO diesel injector,
elastic light scattering, imaging.
1 INTRODUCTION
Modern common rail direct injection diesel engines operate
through the injection of high pressure liquid diesel fuel into the
engine combustion chamber. The fuel is normally injected
through a number of nozzle holes located at the base of an
injector. The liquid fuel is subjected to large pressure gradients
inside the injector and the nozzle passages, which often causes
local boiling of the fuel to create local pockets of fuel vapour. This
type of flow is called cavitating flow, and is associated with
unstable, unsteady vapour cavities forming inside the flowing fuel.
Several groups have identified the likelihood of cavitation occurring
in the internal fuel flow inside these injector nozzles[1–3].
Internal cavitating flow occurring inside fuel injectors is believed to
produce a number of effects on the internal fuel flow and the
injector such as those listed below:
(1) Nozzle cavitation reduces the injected fuel mass in an
unpredictable manner, which can result in poor fuel/air mixture
formation in the engine, unstable combustion and/or higher
engine-out emissions [4–8].
(2) Nozzle cavitation affects the atomisation of the fuel jets into
droplets as the jets [2,9,10].
(3) Cavitation may cause surface erosion and, ultimately injector
failure [11].
(4) Cavitation may induce chemical changes in the fuel, resulting
in either the formation of internal deposits [12] or the prevention
of such deposits.
Recent research in cavitation flow relevant to high pressure diesel
injection systems has developed in two complementary directions,
which are firstly, the characterisation of cavitation flows in large
scale injectors that offer full optical access, and secondly, studies
of cavitation occurring in real size injectors under realistic
operating conditions.
Two clearly distinguishable types of cavitating flow have been
identified in large scale nozzle studies. These are geometric-
induced cavitation and vortex or string cavitation. Geometric
cavitation forms at orifice inlets and it is due to the abrupt
acceleration of the fuel flow as it enters the nozzle holes. The local
pressure gradient gives rise to conditions that facilitate local
boiling. Geometric cavitation appears to be initiated as a dense
foam of micro-bubbles developing in the liquid phase, which
evolves into a connected volume of fuel vapour running from the

hole inlet to the hole exit. On the other hand, string cavitation is a
highly transient phenomenon which occurs inside the nozzle sac
volume. They appear as thin strings of fuel vapour, usually
connecting two adjacent holes. They are associated with low
pressure regions where the local flow is subjected to large vorticity
such as the vortex core [13–19].
Geometric cavitation and string cavitation have both been
observed in optically accessible real-size injectors [20–26],
confirming previous studies in large scale transparent model
injectors.
It is interesting to note that a number of experiments have been
conducted on biodiesel injection, atomisation and mixing in diesel
engines [27,28]. Their authors have reported that the spray
characteristics of biodiesel are somewhat different to those of
conventional diesel, and have suggested that the susceptibility of
biodiesel to develop internal cavitation flow may be lower than
conventional diesel fuel.
The objective of this work was to establish whether it was possible
to identify whether different diesel fuels produced different
cavitation flow inside the injector nozzles. In order to achieve this,
it was necessary to obtain time-resolved elastic back-scattering
images of cavitation occurring within the nozzle passages of an
optically accessible Valve-Covered-Orifice (VCO) injector operating
near realistic injection conditions. The time-resolved back-
scattered images obtained from the cavitating diesel in the nozzles
were assumed to be approximately proportional to the local
surface area defining the boundary between the liquid and vapour
present in the flow.
2 EXPERIMENTAL ARRANGEMENTS
2.1 The Optically Accessible Injector
A conventional VCO injector had its metal tip (including the nozzle
holes) machined off. The replacement optically accessible acrylic
injector tip was manufactured by hand at City University’s
engineering workshop, reproducing the exact internal geometry of
the VCO nozzle tip. A schematic of the arrangement is shown in
Figure 1. It is important to note that the acrylic tip attached to the
injector below the needle seat, ensuring that the acrylic tip did not
suffer any damage during needle opening and closure.
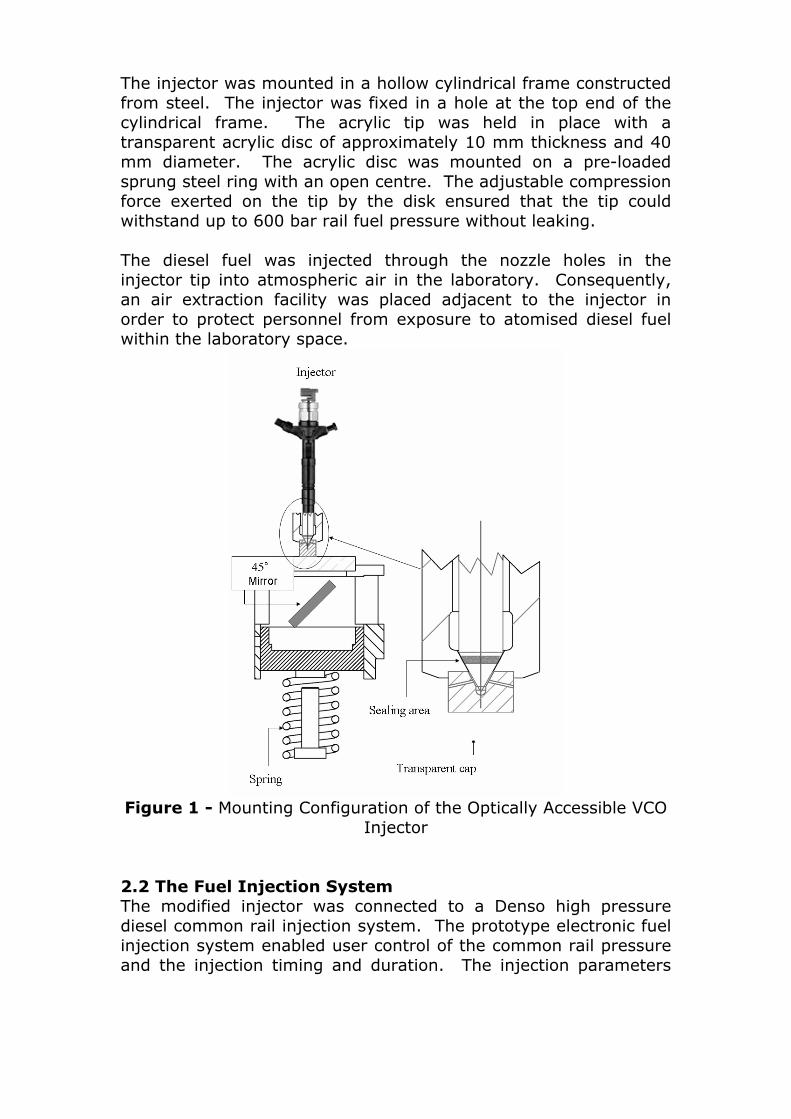
The injector was mounted in a hollow cylindrical frame constructed
from steel. The injector was fixed in a hole at the top end of the
cylindrical frame. The acrylic tip was held in place with a
transparent acrylic disc of approximately 10 mm thickness and 40
mm diameter. The acrylic disc was mounted on a pre-loaded
sprung steel ring with an open centre. The adjustable compression
force exerted on the tip by the disk ensured that the tip could
withstand up to 600 bar rail fuel pressure without leaking.
The diesel fuel was injected through the nozzle holes in the
injector tip into atmospheric air in the laboratory. Consequently,
an air extraction facility was placed adjacent to the injector in
order to protect personnel from exposure to atomised diesel fuel
within the laboratory space.
Figure 1 - Mounting Configuration of the Optically Accessible VCO
Injector
2.2 The Fuel Injection System
The modified injector was connected to a Denso high pressure
diesel common rail injection system. The prototype electronic fuel
injection system enabled user control of the common rail pressure
and the injection timing and duration. The injection parameters
were controlled from a personal computer equipped with National
Instruments data control cards, which controlled the electronic
injector driver. The electronic injector driver sent a high voltage
square wave pulse to a magnetic solenoid, located in the injector.
The switching of the magnetic solenoid actuated the injector
needle, allowing high pressure fuel to pass through the injector.
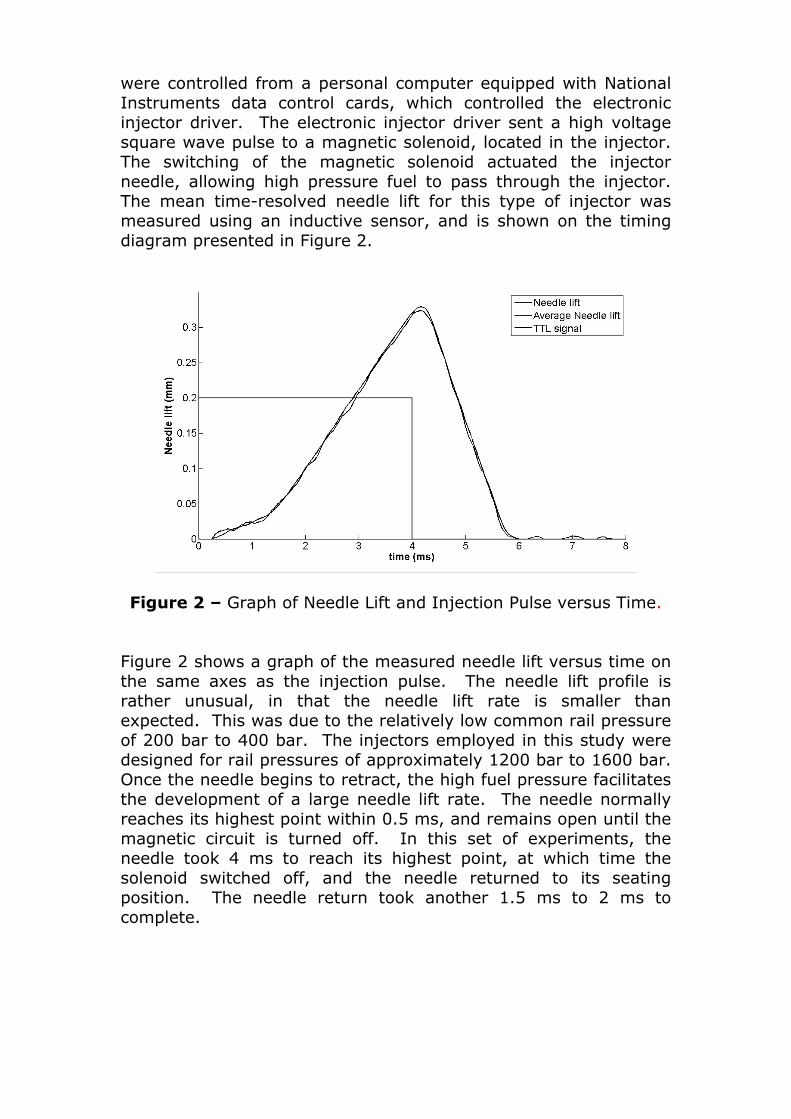
The mean time-resolved needle lift for this type of injector was
measured using an inductive sensor, and is shown on the timing
diagram presented in Figure 2.
Figure 2 – Graph of Needle Lift and Injection Pulse versus Time.
Figure 2 shows a graph of the measured needle lift versus time on
the same axes as the injection pulse. The needle lift profile is
rather unusual, in that the needle lift rate is smaller than
expected. This was due to the relatively low common rail pressure
of 200 bar to 400 bar. The injectors employed in this study were
designed for rail pressures of approximately 1200 bar to 1600 bar.
Once the needle begins to retract, the high fuel pressure facilitates
the development of a large needle lift rate. The needle normally
reaches its highest point within 0.5 ms, and remains open until the
magnetic circuit is turned off. In this set of experiments, the
needle took 4 ms to reach its highest point, at which time the
solenoid switched off, and the needle returned to its seating
position. The needle return took another 1.5 ms to 2 ms to
complete.

A variable speed motor was employed to drive a Denso diesel
common rail pump. A laptop computer was employed to control a
prototype programmable electronic control unit, which in turn,
controlled the fuel pressure in the common rail. The diesel fuel
temperature could be controlled by passing the diesel fuel through
a heat exchanger sited between the fuel tank and the high
pressure pump, although this facility was bypassed in these
experiments.
2.3 The Optical Arrangement
The optical arrangement is shown in Figure 3. Continuous white
light obtained from a collimated Arri 400 W lamp was passed
though a 150 mm diameter glass lens with 25 cm focal length.
The focussed light was reflected up though the hollow metal tube
using a 45 deg mirror. The light was further focussed onto the
acrylic tip, by passing it through an infra-red filter and a 40 mm
diameter lens with 50 mm focal length, followed by a beam splitter
plate arranged at 45 deg.
Figure 3 - Schematic of Optical Arrangement
Back-scattered light obtained from the cavitating diesel in the
nozzle passages was reflected onto a high speed Photron Ultima
APX–RS video camera using a Nikon 50 mm f1.2 camera lens,
reverse coupled to 60 mm lens extension tubes. This arrangement
facilitated high resolution imaging of approximately 10 µm/pixel.
The Photron APX–RS camera was configured to obtain 512 pixel x
Injector Convergent lens (focal
length
250mm)
Intense light
Light diverging cone
Camera Reversed
50mm lens
45 degrees
mirror
Visualization

512 pixel images at 10 kHz. The use of this camera in this manner
facilitated real-time capture of individual injection events.
The camera was configured to begin capturing images synchronous
with the leading edge of the electronic pulse sent to the injector.
On receipt of the injector pulse, the camera took 100 frames at 10
kHz frame rate for 10 ms duration. Each frame had an exposure
duration of 1.0 µs. In order to protect the camera and the camera
lens from exposure to atomised diesel oil, absorbent paper was
placed around the injection region.
3 EXPERIMENTAL METHODOLOGY
The main objective of the experiment was to determine whether
different diesel fuel samples produced identifiably different
cavitation inside the nozzle holes. In this regard, two diesel fuel
samples were employed in this study. One of the samples was a
prototype diesel (Fuel A), while the other was a bio-diesel (Fuel B).
Modern high pressure common rail diesel injection systems
operate at pressures of between 1400 bar and 2000 bar. Due to
the properties of acrylic, the maximum operating rail pressure that
could be achieved during this study was 400 bar. Operating at
lower pressure therefore required longer injection duration in order
to inject a comparable quantity of diesel.
It was considered desirable to examine the internal flow during
needle lift and return, and steady-state maximum lift.
Consequently a fixed fuel injection pulse of 4 ms was employed for
all tests. The needle lift and the injector pulse are shown in Figure
2.
It was observed that the acrylic injector tips experienced
significant erosion when subjected to multiple injections of fuel at
400 bar rail pressure. The ongoing erosion of the acrylic surface at
the inner entrance to the nozzle holes caused the cavitation flow
inside the nozzle passages to change over time. These changes
were assessed over time by subjecting a small number of test
injector tips to approximately 1000 injections each at 400 bar rail
pressure. Based on the cavitation behaviour, an injector lifetime
of approximately 200 injections was conservatively estimated
when injecting at 400 bar rail pressure.
An experimental session combining a new injector tip with a single
fuel consisted of firstly obtaining 40 background images of the

injector tip containing 100 % liquid fuel, followed by obtaining 30
sets of 100 images synchronous with 30 injections at 400 bar, 300
bar and 200 bar respectively.
Following each experimental session, the mean injected fuel mass
was measured for each diesel fuel sample. This was achieved by
firstly changing the optical accessible injector with a conventional
one, followed by injecting the diesel fuel sample though the
conventional injector for 1000 injections into a sealed receiving
vessel. The number of injections was electronically counted. The
mean injected mass was determined by dividing the net mass of
fuel by the total number of injections. The results of these
measurements are presented in Table 1.
Table 1 - Injected Fuel Mass for Tested Diesel Samples
Fuel
type
Density
(g/cm3)
Fuel mass
per
injection
(mg)
Mass
Flow
Rate
(g/sec)
Volumetric
Flow Rate
(cm3/s)
FUEL A 0.82 (est.) 54.63 13.66 16.53
FUEL B 0.83 55.40 13.85 16.60
The diesel fuel required changing following an experimental
session. The fuel system was drained, and then refilled with the
new diesel fuel sample. This fuel sample was passed through the
system, and then drained. This was defined as one flush. The fuel
system was flushed in this manner four times, before the new fuel
was used for the next experimental session. This flushing process
ensured that less than 1 % of the original diesel fuel remained in
the system from session to session.
4 IMAGE PROCESSING
Each experimental session involved the injection of one of the
diesel fuel samples into laboratory air, using 400 bar common rail
pressure. The camera was configured to capture 100 time-
resolved images of the internal cavitating flow at 0.10 ms intervals
for 10 ms duration, for each injection. Image data was obtained
from 30 injections, making a total of 3000 images per fuel sample.

Each set of 3000 images were numbered frame 1 to frame 3000.
Frames 1, 101, 201, 301, 401 … 2901 made up a subset of 40
images of the diesel fuel inside the injector passages obtained at
0.1 ms after the leading edge of the start-of-injection (ASOI)
electronic pulse. Frames 2, 102, 202, 302, 402 … 2903 made up a
subset of 40 images obtained at 0.2 ms after the leading edge of
the SOI pulse, and so on to the subset of images defined by frame
100, 200, 300 … 3000.
In order to express the processing of the data images
mathematically, the pixel intensity on the raw data images is
represented byklm
ijS , where klm
ijS represents the intensity of the
pixel located on the CCD chip at the position defined by the row
index i and the column index j, { }512,...3,2,1, ∈ji . The index
number k represents the frame number within a set of 100 time-
resolved images for a single injection event, ranging from frame 1
to frame 100; while the index number l refers to the specific
injection event, ranging from injection 1 to injection 30. The index
number m refers to the diesel fuel sample tested, and ranges from
1 to 2, representing fuel samples A and B.
For each fuel sample and each rail pressure, a set of 100 mean
time-resolved cavitation images were determined by finding the
mean images associated with frames 1, 101, 201, 301 … 2901,
frames 2, 102, 202, 302, … 2902, frames 3, 103, 203, 303, …
2903, and so on up to frames 100, 200, 300, … 3000. This is
expressed mathematically by
∑=
=30
130
1
l
klm
ij
km
ij SS . (1)
Standard deviation images were also computed from the above
data. These are expressed by
( )229
129
1∑
=
−=l
km
ij
klm
ij
km
ij SSX . (2)
40 background images were obtained for each experimental
session. These pixel intensity data are represented by the indexed
intensity variable mp
ijB , where the index numbers i, j, and m retain
their meaning from above, while the index number p refers to

background image 1 to 40. A mean background image was
calculated for each experimental session. This is expressed by
∑=
=40
140
1
p
mp
ij
m
ij BB . (3)
Processed data images were generated by subtracting the mean
background images from the mean time-resolved cavitation
images. These are expressed by
m
ij
km
ij
km
ij BSI −= . (4)
An example of this form of image processing is shown in Figure 4.
In order to process the captured optical data properly from the raw
data image (the image on the left of Figure 4), the background
image must be subtracted (the middle image). The processed
image on the right is the final image obtained after background
subtraction.
The mean image frame intensity data defined by km
ijI were
subjected to a threshold test as to whether cavitation was present
or absent. This consisted of setting pixel values to zero where the
actual intensity was smaller than 10 % of the mean intensity.
Mathematically, this is expressed by determining the image mean
intensity
∑∑= =
=N
i
M
j
km
ij
kmI
NMI
1 1
1, (5)
and then applying the cavitation threshold test, expressed by the
conditional
If 10
kmkm
ij
II < , then set 0=
km
ijI . (6)
The mean image frame intensity data was then analysed in terms
of ranges of signal intensity. The pixels were placed in 64 bins
representing equal ranges of intensity from minimum to
maximum. The bins were then integrated to obtain the total
number of pixels producing cavitation scattering data. This

number was then divided by the total number of pixels in the
nozzle passages to obtain the relative proportion of area within the
imaged nozzle passage area producing optical scattering.
Figure 4 - Images showing Image Processing Methodology.
The mean time resolved, normalised, cavitation scattering area
has been represented as histograms. A tenth order polynomial
has been fitted to the histogram data in order to achieve the best
possible polynomial fit. These graphs are presented in Figure 5.
5 RESULTS AND DISCUSSION
The right hand image in Figure 4 is an image of the mean
cavitation scattering obtained from the cavitating flow occurring in
the nozzle passages of the optically accessible injector tip after
background subtraction. The optical scattering captured on the
video camera was being back-scattered from the cavitating diesel
fuel, and appears as the six bright streaks pointing away from the
centre of the image.
Figure 5 shows the graphs of the time-resolved relative
proportions of area within the injector nozzle passages producing
back-scattered light as a result of diesel fuel cavitation, obtained
at 400 bar rail pressure. It can be seen that fuel sample A
produces consistently greater cavitation-induced optical scattering
than fuel sample B. These results reveal an inverse correlation
with the injected mass results from Table 1.
This confirms the hypothesis that cavitation occurring within the
nozzle passages results in a reduced discharge coefficient as a
Raw mean data image Mean background Processed image

result of partially choking the liquid flow. Hence an increase in
cavitation is likely to result in a lower discharge coefficient.
One of the diesel samples tested was a prototype diesel fuel
(Sample A), while the other was a biodiesel fuel (Sample B). The
time-resolved scattering data presented in Figure 5 suggests that
the biodiesel sample produced significantly less cavitation
scattering than the prototype diesel. This result suggests that the
cavitation surface area is smaller for the biodiesel sample when
compared with the prototype diesel sample.
Figure 5 - Graphs of Relative Mean Cavitation Scattering Area as
a Function of Injection Timing at 400 bar Rail Pressure.
6 CONCLUSIONS
A novel methodology that provides the ability to discriminate
between the cavitation volume occupied by different diesel fuels
during the fuel injection process has been developed and
described. The methodology should also offer persuasive evidence
of the correct link between occupied cavitation volume and
injected fuel mass. Ideally the methodology should also be able to
explain the relationship between occupied cavitation volume during
fuel injection and the physical properties of the injected diesel fuel.
The experimental methodology reported here has been partially
successful, in that the measurement data has been able to identify
differences between the fuel samples through back-scattering of
1.0
0.8
0.6
0.4
0.2
0.0
Fuel A+ Fuel B
1.0 2.0 3.0 4.0 5.0(ms)
1.0
0.8
0.6
0.4
0.2
0.0
Fuel A+ Fuel B
1.0 2.0 3.0 4.0 5.0(ms)
light from cavitating flow, and is able to predict that elevated
levels of cavitation in the nozzle passages results in reduced
injected fuel mass.
Finally, it was observed that the biodiesel sample produced
significantly less cavitation scattering than prototype diesel
sample, suggesting that the biodiesel sample produced a smaller
cavitation boundary surface area than the prototype diesel.
Further work is required in order to investigate whether this
approach will be able to identify and correctly predict the
dependence of the propensity of diesel to develop nozzle cavitation
flow as a function of its physical properties.
ACKNOWLEDGEMENTS
The authors would like to acknowledge Shell Global Solutions for
support for this project. In addition, the authors would like to
acknowledge the valuable assistance of School of Engineering
technical staff, particularly Jim Ford, Tom Fleming, Mike Smith and
John Kenny.
REFERENCE LIST
1. Arcoumanis, C. and M. Gavaises, Cavitation in diesel injectors:
modelling and experiments. Proceedings of the 14th ILASS-Europe
Annual Conference, Manchester, England, 1998.
2. Kim, J.H., K. Nishida, H. Hiroyasu, Characteristics of the
Internal Flow in a Diesel Injection Nozzle. ICLASS-97, 1997.
3. Soteriou, C., R. Andrews, M. Smith, Direct Injection Diesel
Sprays and the Effect of Cavitation and Hydraulic Flip on
Atomization. . SAE paper, 1995 (950080).
4. Soteriou, C., M. Smith, R.J. Andrews, Cavitation Hydraulic Flip
and Atomization in Direct Injection Diesel Sprays. IMechE Paper
C465/051/93, 1993.
5. Arcoumanis, C., M. Gavaises, J.M. Nouri, E. Abdul-Wahab,
Analysis of the flow in the nozzle of a vertical multi-hole diesel
engine injector, . SAE paper, 1998 (980811).

6. Soteriou, C., R. Andrews, M. Smith, N. Torres, S. Sankhalpara,
The Flow Patterns and Sprays of Variable Orifice Nozzle
Geometries for Diesel Injection. SAE paper, 2000 (2000-01-0943).
7. Desantes, J.M., R. Payri, F.J. Salvador, J. Gimeno,
Measurements of Spray Momentum for the Study of Cavitation in
Diesel Injection Nozzles. SAE paper, 2003 (2003-01-0703).
8. Payri, F., V. Bermudez, R. Payri, F.J. Salvador, The influence of
cavitation on the internal flow and the spray characteristics in
diesel injection nozzles. Fuel. Vol. 83. 2004, 419-431.
9. Nishida, K., S. Ceccio, D. Assanis, N. Tamaki, H. Hiroyasu,
Characterization of Cavitation Flow in a Simple Hole Nozzle.
ICLASS-97, 1997.
10. Soteriou, C., M. Smith, R. Andrews, Diesel injection: laser light
sheet illumination of the development of cavitation in orifices.
IMECHE conference transactions, 1998 (C529/018/98).
11. Osman A., Failure of a diesel engine injector nozzle by
cavitation damage, Engineering Failure Analysis vol. 13 issue 7,
October 2006, 1126 – 1133.
12. N. Tait, Shell Global Solutions, Personal Communication, 2008.
13. Arcoumanis, C., H. Flora, M. Gavaises, N. Kampanis, R.
Horrocks, Investigation of Cavitation in a Vertical Multi-Hole Diesel
Injector. 1999.
14. Roth, H., M. Gavaises, C. Arcoumanis, Cavitation Initiation, its
Development and Link with Flow Turbulence in Diesel Injector
Nozzles. SAE paper, 2002 (2002-01-0214).
15. Roth, H., Experimental and Computational Investigation of
Cavitation in Diesel Injector Nozzles. Imperial College PhD Thesis.,
2004.
16. Mitroglou, N., Multi-hole Injectors for Direct-Injection Gasoline
Engines PhD Thesis, City University London, 2005.
17. Gavaises, M. and A. Andriotis, Cavitation Inside Multi-hole
Injectors for Large Diesel Engines and its Effects on the Near-
nozzle Spray Structure. SAE paper, 2006 (2006-01-1114).
18. Nouri, J.M., N. Mitroglou, N. Yan, C. Arcoumanis, Internal flow
and cavitation in a multi-hole injector for gasoline direct injection
engines. SAE paper, 2007.
19. Andriotis, A., M. Spathopoulou, M. Gavaises, Effect of Nozzle
Flow and Cavitation Structures on Spray Development in Low-
speed Two-Stroke Diesel Engines. International Council on
Combustion Engines, CIMAC Congress, Vienna, 2007 (Paper 262).
20. Badock, C. , R. Wirth, A. Fath, A. Leipertz, Investigation of
cavitation in real size diesel injection nozzles. International Journal
of Heat and Fluid Flow, 1999.
21. Arcoumanis, C., H. Flora, M. Gavaises, M. Badami, Cavitation
in Real-Size, Multi-Hole Diesel Injector Nozzles. SAE paper, 2000
(2000-01-1249).
22. Arcoumanis, C., M. Gavaises, H. Flora, H. Roth, Visualisation of
cavitation in diesel engine injectors. Mecanique & Industries,
2001(5).
23. Blessing, M., G. Konig, C. Kruger, U. Michels, and V. Schwarz,
Analysis of Flow and Cavitation Phenomena in Diesel Injection
Nozzles and its Effects on Spray and Mixture Formation. SAE
paper, 2003 (2003-01-1358).
24. Miranda, R., H. Chaves, U. Martin, F. Obermeier, Cavitation in
Transparent Real Size VCO Injection Nozzle. ICLASS, 2003.
25. Roth, H., E. Giannadakis, M. Gavaises, C. Arcoumanis, K.
Omae, I. Sakata, M. Nakamura, and H. Yanagihara, Effect of Multi-
Injection Strategy on Cavitation Development in Diesel Injector
Nozzle Holes. SAE paper, 2005 (2005-01-1237).
26. Gilles-Birth, I., M. Rechs, U. Spicher, and S. Bernhardt,
Experimental Investigation of the In-Nozzle Flow of Valve Covered
Orifice Nozzles for Gasoline Direct Injection. 7th International
Symposium on Internal Combustion Diagnostics, Kurhaus Baden-
Baden, 2006.
27. Li, L., Experimental Study of Biodiesel Spay and Combustion
Characteristics. SAE paper, 2006.
28. Postrioti, L., C.N. Grimaldi, M. Ceccobello, and R. DiGioia,
Diesel Common Rail Injection System Behaviour with Different
Fuels. SAE paper, 2004 (2004-01-0029).


![Visualization of Unsteady Behavior of Cavitation in ... · cavitation state, transition-cavitation state, and super-cavitation state in the orifice throat [5]. Under relative high](https://static.fdocuments.net/doc/165x107/5b4f673e7f8b9a166e8c4c74/visualization-of-unsteady-behavior-of-cavitation-in-cavitation-state-transition-cavitation.jpg)