CITY PLANNING LABS - World Bank
143
CITY PLANNING LABS A CONCEPT FOR STRENGTHENING CITY PLANNING CAPACITY IN INDONESIA PREPARED BY THE CITY FORM LAB, SINGAPORE UNIVERSITY OF TECHNOLOGY AND DESIGN (SUTD) FOR WORLD BANK INDONESIA Public Disclosure Authorized Public Disclosure Authorized Public Disclosure Authorized Public Disclosure Authorized
Transcript of CITY PLANNING LABS - World Bank
CITY PLANNING LABS
A CONCEPT FOR STRENGTHENING CITY PLANNING CAPACITY
IN INDONESIA
PREPARED BY THE CITY FORM LAB, SINGAPORE UNIVERSITY OF TECHNOLOGY AND DESIGN (SUTD)
FOR WORLD BANK INDONESIA
Pub
lic D
iscl
osur
e A
utho
rized
Pub
lic D
iscl
osur
e A
utho
rized
Pub
lic D
iscl
osur
e A
utho
rized
Pub
lic D
iscl
osur
e A
utho
rized
WB406484
Typewritten Text
93689
WB406484
Typewritten Text

© 2013 The International Bank of Reconstruction and Development/ The World Bank East Asia and Pacific Region/East Asia Infrastructure Sector (EASIS) 1818 H St., NW Washington, DC 20433 USA All rights reserved This volume is a joint publication of the staff of the International Bank for Reconstruction and Development/The World Bank and the Australian Aid. The findings, interpretations, and conclusions expressed in this volume do not necessarily reflect the views of the Executive Directors of the World Bank, the governments they represent or of Australian Aid. The World Bank does not guarantee the accuracy of the data included in this work. Rights and Permissions The material in this publication is copyrighted. Copying and/or transmitting portions or all of this work without permission may be a violation of applicable law. The International Bank for Reconstruction and Development/The World Bank encourages dissemination of its work and will normally grant permission to reproduce portions of the work promptly. All queries should be addressed to the Task Team Leader, Thalyta Yuwono: The World Bank Jakarta Office Indonesia Stock Exchange Building Tower II, 12th Floor. Jalan Jenderal Sudirman Kav. 52-53, Jakarta 12190, Indonesia e-mail: [email protected]. Disclaimer The views expressed in this publication are those of the authors and not necessarily those of the Australian Aid.
CITY PLANNING LABS
A CONCEPT FOR STRENGTHENING CITY PLANNING CAPACITY
IN INDONESIA
PREPARED BY THE CITY FORM LAB, SINGAPORE UNIVERSITY OF TECHNOLOGY AND DESIGN (SUTD)
FOR WORLD BANK INDONESIA


i
TABLE OF CONTENTS
Acknowledgement ................................................................................................................................ v
Abbreviation and Acronyms ............................................................................................................. vi
Executive Summary ............................................................................................................................ vii
Introduction ............................................................................................................................................ 1
1.1 Background .......................................................................................................................... 3
1.2 Rationale ............................................................................................................................... 5
1.3 Objectives ............................................................................................................................. 6
1.4 Scope of Activities ............................................................................................................... 7
Sector Module A: City Planning Labs and Spatial Growth Analytics ........................................ 9
2.1 Background ....................................................................................................................... 11
2.1.1 Context ...................................................................................................................... 11
2.1.2 Implementing P3N Technical Assistance through City Planning Labs ............. 11
2.2 Objectives .......................................................................................................................... 12
2.3 Scope of Activities ............................................................................................................ 13
2.3.1 Establishing the City Planning Lab ........................................................................ 14
2.3.2 Spatial Growth and Change Analytics ................................................................ 18
2.3.3 Planning Enforcement .............................................................................................. 21
2.4 Risks .................................................................................................................................... 24
2.5 Outputs ............................................................................................................................... 24
2.6 Team and Timeline ........................................................................................................... 26
Sector Module B: City Economic Competitiveness ....................................................................... 27
3.1 Background ....................................................................................................................... 29
3.2 Objectives .......................................................................................................................... 29
3.3 Scope of Activities ............................................................................................................ 30
3.4 Risks and Mitigation ......................................................................................................... 37
3.5 Outputs ............................................................................................................................... 37
3.6 Team ................................................................................................................................... 37
3.7 Resource Allocation and Timeline .................................................................................. 38
Annex Module B: Assessment of Data Environment ................................................................ 39
Sector Module C: Slum Analytics and Management Systems ................................................... 41
4.1 Background ....................................................................................................................... 43
4.2 Objectives .......................................................................................................................... 44
4.3 Scope of Activities ............................................................................................................ 44
4.4 Risks and Mitigation ......................................................................................................... 49
4.5 Outputs ............................................................................................................................... 49

ii
4.6 Team ................................................................................................................................... 50
4.7 Timeline .............................................................................................................................. 50
Annex Module C: Data Collection ............................................................................................. 51
Sector Module D: Disaster and Climate Resilient Planning Analytics ...................................... 55
5.1 Background ....................................................................................................................... 57
5.2 Objectives .......................................................................................................................... 58
5.3 Scope of Activities ............................................................................................................ 60
5.4 Risks and Mitigation ......................................................................................................... 63
5.5 Outputs ............................................................................................................................... 63
5.6 Team ................................................................................................................................... 64
5.7 Timeline .............................................................................................................................. 64
Annex Module D: Data Collection ............................................................................................. 65
Sector Module E: Monitoring Land and Real Estate Markets ................................................... 67
6.1 Background ....................................................................................................................... 69
6.2 Objective ........................................................................................................................... 70
6.3 Scope of Activities ............................................................................................................ 70
6.4 Risks and Mitigation ......................................................................................................... 75
6.5 Outputs ............................................................................................................................... 75
6.6 Team ................................................................................................................................... 76
6.7 Timeline .............................................................................................................................. 76
References .......................................................................................................................................... 77
Annex 1: Demonstration Report of Spatial Growth Analytics Module ..................................... ix
iii
LIST OF TABLES
Table 1. Characteristics of Pilot Cities ............................................................................................. 5
Table 2. Scope of Activities and Timeline .................................................................................... 30
Table 3. Example of Analysis: Ratings of Indonesian Cities on Economic Performance
(2000 – 2010) .................................................................................................................................. 35
Table 4. Risks and Mitigation of Economic Competitiveness Module ...................................... 37
Table 5. Inventory of Data for Economic Competitiveness Module ......................................... 39
Table 6. Inventory of Data for Disaster and Climate Resilient Module ................................. 65
Table 7. Example Dataset: Price Range of Flats Offered by Housing Development Board
in Singapore (in Thousand SGD) .................................................................................................... 72
LIST OF FIGURES
Figure 1. Screen Capture of a QGIS Open-source Data Platform Work Environment ...... 15
Figure 2. City Planning Lab Partnership Framework ................................................................. 16
Figure 3. City Planning Lab Staffing ............................................................................................. 17
Figure 4. Example Analysis Output: Accessibility to Jobs ......................................................... 18
Figure 6. Methodology Illustration: Export Performance Tool.................................................. 35
Figure 7. Methodology Illustration: Value Chain Mapping Tool .............................................. 36
Figure 8. Methodology Illustration: Cost Structure Analysis Tool ............................................. 36
Figure 9 A,B. Example of Analysis: Sao Paulo HABISP Online Housing Information System
............................................................................................................................................................. 47
Figure 10 A,B. The InaSAFE Tool .................................................................................................... 59
Figure 11. Example Analysis: Distribution of Building Types in Singapore ........................... 71

iv

v
ACKNOWLEDGEMENT The City Planning Labs provide a concept to build capacity for an integrated, evidence-based spatial planning and investment decision making to help cities in Indonesia to achieve sustainable and inclusive economic growth. This concept was prepared through a consultative process in Indonesia which included meetings with Central and Local Government authorities and site visits to pilot cities. The City Planning Lab Concept has been prepared by a core team led by Thalyta Yuwono (EASIS) in collaboration with The City Form Lab, Singapore University of Technology and Design. Andres Sevtsuk and Reza Amindarbari from The City Form Lab were the main authors of this concept. Inputs have been provided by Chandan Deuskar (EASIN), Renata Simatupang (EASIS), Connor Spreng (EASFP), and Pranav Kumar (FCDKP), under the guidance of Taimur Samad (EASIS) and Nathan Belete (Sector Manager, EASIS). Wilmar Salim and Ari Kuncoro, consultants, provided important contribution to the preparation of this concept. The team benefited from wide range of consultation with the Government of Indonesia: Ms. Hayu Parasati (National Planning Agency/Bappenas), Mr. Basuki Hadimuljono (Ministry of Public Works), Mr. Dadang Sumantri Mochtar (Ministry of Home Affairs), Mr. Dodi Sukmayadi Wiradisastra (Geospatial Information Agency/BIG); and also with the Mayors and local agencies in Surabaya, Denpasar, Balikpapan and Palembang. The team greatly appreciates technical contribution from various stakeholders who were consulted during the preparation of this concept. Finally, the team would like to acknowledge the generous support provided by Australian Aid.

vi
ABBREVIATION AND ACRONYMS
Bappeda Badan Perencanaan Daerah/ Local Planning Agency
Bappenas Badan Perencanaan Nasional/ National Planning Agency
BMKG Badan Meteorologi, Klimatologi, dan Geofisika/ National Agency for
Meteorology, Climatology, and Geophysics
BNPB Badan Nasional Penanggulangan Bencana/ National Agency for Disaster
Management
BIG Badan Informasi Geospasial/ National Agency of Geospatial Information
BPBD Badan Penanggulangan Bencana Daerah/ Regional Agency for Disaster
Management
BPN Badan Pertanahan Nasional/ National Land Agency
BPS Badan Pusat Statistik/ Statistics Indonesia
C/K City (urban municipality) and Kabupaten (rural municipality)
CCA Climate Change Adaptation
CPL City Planning Labs
DRR Disaster Risk Reduction
GDP Gross Domestic Product
GIS Geographic Information System
GRDP Gross Regional Domestic Product
IDR Indonesian Rupiah
IFC International Financial Corporation
KPI Key Performance Indicators
KPPOD Komite Pemantauan Pelaksanaan Otonomi Daerah/ Regional Autonomy Watch
LMA Land Market Assessment
MOF Ministry of Finance
MoU Memorandum of Understanding
MP3EI Masterplan Percepatan dan Perluasan Pembangunan Ekonomi Indonesia/
Masterplan for Acceleration and Expnsion of Indonesian Economic Development
MPW Ministry of Public Works
MUDP Metropolitan and Urban Development Program, or P3N
NGO Non-governmental Organization
P3N Program Pembangunan Perkotaan Nasional, or MUDP
RPJMN Rencana Pembangunan Jangka Menengah Nasional/ National Midterm
Development Plan
RT Rukun Tetangga
RW Rukun Warga
SGD Singapore Dollar
SME Small and Medium Enterprises
SNDB Subnational Doing Business Report
SNG Subnational Government

vii
EXECUTIVE SUMMARY
The cities that emerge from Indonesia’s rapid urbanization will be key determinants of the country’s overall economic development and competitiveness, as well as their inclusiveness and environmental sustainability. However, without strategically planned investments, policy interventions, and institutional capacity, mismanaged urbanization could become an obstacle to sustainable growth. Indonesia has been no exception to the rapid urbanization experienced in many East Asian countries. With average annual urbanization rate estimated at 4.2% between 1993 and 2007, Indonesia is urbanizing faster than its Asian counterparts. This has made Indonesia one of the most urbanized countries in Asia, with an urban population share of 51% in 2011. Projections of urbanization suggest that this figure will increase to 68 % by 2025. However, Indonesia has yet to achieve the economic returns to urbanization that other countries have achieved. For every additional 1% that the country urbanizes, it achieves just 2% of additional GDP growth, whereas other countries in the region achieve 6-10% GDP growth per 1% of urbanization. Under the Metropolitan and Urban Development Program (MUDP/P3N), currently under preparation, the World Bank is engaging directly with large cities through investments in transformative infrastructure. The Bank has initiated direct engagements with local governments, targeting large and medium cities and metropolitan areas with populations over 500,000 to prepare and facilitate investments in transformative infrastructure. In addition to investment support, a key component P3N is building technical and institutional capacity in cities and metropolitan authorities, which will take the form of City Planning Labs. The City Planning Lab (CPL) is envisioned as the driver of improved integrated and evidence-based spatial, development and investment planning. The City Planning Labs core module will be initially implemented in four cities: Surabaya, Palembang, Denpasar and Balikpapan, with two additional modules in each city. In the short term, the CPL will (i) provide “just in time”, demand driven data and analysis that can feed into immediate decisions, and (ii) streamline ongoing urban management functions, such as building permitting and tax-related functions. In the medium term, it will provide cost-effective analytics to cities that can feed into planning and investment decisions, reducing the expense involved in contracting consultants during each planning cycle. In the long term, the CPL will build local technical capacity, by gathering expertise from Indonesia and international sources to work closely with local staff. Over time, external involvement will diminish as local capacity strengthens.
viii
The proposed activities of the CPL will be conducted in modular fashion, each pertaining to a different sector. The proposed sector modules are: A. Instituting the City Planning Lab & Spatial Growth Analytics (Core Module) B. City Economic Competitiveness C. Slum Analytics and Management Systems D. Climate and Risk Resilience Planning Systems E. Monitoring Land and Real Estate Markets
While the details of the activities will differ, they will all take a common approach, which will involve (i) data gathering; (ii) inputting new and existing data into an integrated cross-sectoral data platform; (iii) using data in ongoing urban management functions; (iv) analyzing the data; and (v) working with city leaders to help them use the insights from data analysis in planning and decision-making.

1
INTRODUCTION

2

3
1.1 BACKGROUND The cities that emerge from Indonesia’s rapid urbanization will be key determinants of the country’s overall economic development and competitiveness, as well as their inclusiveness and environmental sustainability. There is reason to be cautiously optimistic about Indonesia’s urban future. However, without strategically planned investments, policy interventions, and institutional capacity, mismanaged urbanization could become an obstacle to sustainable growth. Indonesia has been no exception to the rapid urbanization experienced in many East Asian countries. With average annual urbanization rate estimated at 4.2% between 1993 and 2007, Indonesia is urbanizing faster than its Asian counterparts, such as China (3.8%), India (3.1%) and Thailand (2.8%). This has made Indonesia one of the most urbanized countries in Asia, with an urban population share of 51% in 2011. Projections of urbanization suggest that this figure will increase to 68 % by 2025. These statistics tell a powerful story of structural transition in Indonesian society, from predominantly rural and agricultural society into more urban, manufacture and service based economy. However, Indonesia has yet to achieve the economic returns to urbanization that other countries have achieved. For every additional 1% that the country urbanizes, it achieves just 2% of additional GDP growth, whereas other countries in the region achieve 6-10% GDP growth per 1% of urbanization. Under the Metropolitan and Urban Development Program (MUDP/P3N), currently under preparation, the World Bank is engaging directly with large cities through investments in transformative infrastructure. The Bank has initiated direct engagements with local governments, targeting large and medium cities and metropolitan areas with populations over 500,000 to prepare and facilitate investments in transformative infrastructure. In addition to investment support, a key component P3N is building technical and institutional capacity in cities and metropolitan authorities, which will take the form of City Planning Labs. The City Planning Labs core module will be initially implemented in four cities: Surabaya, Palembang, Denpasar and Balikpapan, with two additional modules in each city. CITIES: Surabaya: Surabaya is the second largest city in Indonesia, and the capital of East Java Province. The city has become one of the main ports of Java, which connects the western to eastern part of Indonesia. Surabaya comprises of 31 kecamatan (sub district), with total area of 326.81 Km2. The city is the core of Gerbangkertosusila metropolitan (Gresik, Bangkalan, Mojokerto, Surabaya, Sidoarjo and Lamongan), with estimated total metro population of 9.1 million people. In 2010, the population of Surabaya was 2.76 million people, with population density of 8,462 people per Km2. The average population growth rate from 2000 to 2010 is
4
0.63% annually, and average size of household is 3.6 people per household. Its unemployment rate in 2010 was 10%, which was higher than the national average. The economy of Surabaya is dominated by hotel, trade and restaurant sector (43%), followed by manufacture (22%) and transport and communication (10%). GRDP per capita in current price for 2010 was IDR 64,279,710 (USD 6,766), which was significantly higher than Indonesia’s GDP per capita (USD 2,850). The city has experience relatively constant economic growth in the last five years. In 2010, the economic growth was 7.1%, which was higher than national growth rate of 6.1%. The economy is expected to continue to grow, albeit at slightly lower rate, since Surabaya is struggling to create jobs for the existing work force and immigrants that come into the city. Palembang: Palembang is the capital of South Sumatera province. The city comprises 16 kecamatan (sub-district), with a total area of 400.61 Km2. Palembang borders Kabupaten Banyu Asin to the east, west and north, and Muara Enim to the south. The topography of Palembang is mostly flat lowlands, located at 8 meter above sea level. There are four rivers passing through the city: Musi (the largest), Komering, Ogan, and Keramasan, with total of 108 tributaries. In 2011, the population of Palembang was 1,481,814 people, with an average annual growth rate of 1.76% over the last decade. The population density is 3,698 people per Km2. The unemployment rate of Palembang in 2011 was 10%, and most of the population works in tertiary sector. The economy of Palembang is dominated by manufacture sector (43.8%), trade, hotel and restaurant sector (17%), followed by service sector (12.8%). GRDP per capita in current price for 2010 was IDR 32.6 million (USD 3,430), which is higher than the national GDP per capita (USD 2,850). The economy grew at 7.4% in 2010, and 10.8% in 2011. Oil refinery and fertilizer are the most prominent industries of the city. As with other oil related economies, Palembang is also susceptible to energy price fluctuation and was deeply affected by 2008 global economy crisis. Denpasar: Denpasar is the capital of Bali province, making it an important hub to other tourism sites in Bali island. The city comprises 4 kecamatan (sub-district), with total area of 127.98 Km2. The city had reclaimed land of 380 Ha, or 2.27% of its total area. Denpasar is bordered by Kabupaten Badung to the west and north, and Kabupaten Gianyar to the east, with Badung Strait to the south. The topography of Denpasar is mostly sloping to the south, between 0 – 75 meter above sea level. Denpasar has 10 Km of coastline, which is prone to abrasion. The city also makes an effort to maintain the 10 rivers that pass through the city through community participation in keeping the rivers clean. In 2010, the population of Denpasar was 788,589 people, with a population density of 6,171people per Km2. 31% of the population lives in Kecamatan Denpasar Selatan (South Denpasar), 29% lives in Denpasar Barat (West Denpasar), while North and East Denpasar house 22% and 15.5% of total population, respectively. The unemployment rate of Denpasar in 2011 was 6%, and 79.8% of the population works in tertiary sector.

5
The economy of Denpasar is dominated by trade, hotel and restaurant sector (37.4%), followed by finance sector (14%) and transport and communication (12.8%). GRDP per capita in current price for 2010 was IDR 15.85 million (USD 1,668), which is lower than national GDP per capita (USD 2,850). The economy grew rapidly at 16.2% in 2010, and has always been growing above 13% annually over the last 4 years. As the economy relies heavily on tourism, it is susceptible to global economic downturn and security issues.
Table 1. Characteristics of Pilot Cities
City Province Area (Km2)
Population (2010)
Population Density
(people/ Km2)
GRDP per capita
(2010, USD)
Surabaya East Java 327 2,765,908 8,462 6,766
Palembang South Sumatera 401 1,481,814 3,698 3,430
Denpasar Bali 128 788,589 6,171 1,668
Balikpapan East Kalimantan 503 557,579 1,108 4,721 Source: BPS, 2011
Balikpapan: Balikpapan is the second largest city in East Kalimantan province, which gains its economic importance as the oil refinery and base operation for multinational mining service companies. The city comprises of 5 kecamatan (sub districts), with a total area of 503.3 Km2. Balikpapan is bordered by Kabupaten Kutai to the north, with Makassar Strait to the south and east side, and Kabupaten Penajam Paser Utara to the west. 85% of Balikpapan’s area is hilly, while flat planes are mostly located along the coast. Due to its topography, the land is prone to erosion. To avoid landslide, the government of Balikpapan plan to limit development to only 48% of its area, leaving 52% as green space (Spatial Plan 2012-2032). In 2010, the population of Balikpapan was 557,579 people, with a population density of 1,108 people per Km2 and average annual population growth of 2.1% in the last five years. Most of Balikpapan’s population is in the productive age group (15-64 years old), where the workforce constituted of 46.5% of population. The economy of Balikpapan is dominated by manufacture sector (51%), followed by trade, hotel and restaurant (16%) and construction (15%). GRDP per capita in current price for 2010 was IDR 44,850,051 (USD 4,721), which was significantly higher than Indonesia’s GDP per capita (USD 2,850). As a refinery and mining services city, Balikpapan’s economy is susceptible to global energy prices. Economic growth has fluctuated heavily during the last five years, with growth at 12.4% in 2008, followed by 1.7% in 2009, due to global oil crisis. The economy has bounced back, with 5.19% growth rate in 2010 and 9.7% (preliminary figure) in 2011.
1.2 RATIONALE The City Planning Lab (CPL) is envisioned as the driver of improved integrated and evidence-based spatial, development and investment planning. Local governments in Indonesia understand the importance of improved data and technical analysis for strategic, evidence-based, integrated planning and decision-making. In the

6
attempt to address this need, technical assistance to cities usually takes the form of isolated studies which, while they may be helpful in the short term, often do not systematically increase cities’ technical capacity, or improve urban management on an ongoing basis. Instead, in order to make technical assistance under P3N more sustainable, it will be anchored in a dedicated facility in each partner city, called the City Planning Lab. The CPLs aim to establish technical capacity at the municipal level to provide reliable analytic support to a city’s planning, policy and infrastructure decisions, and to enable access to leading technical assistance in urban management, analytics and planning systems. The focus of the facilities will be to build up technical and institutional capacity in city planning and regulatory agencies to produce reliable and up-to-date data about the cities, well-informed plans, effective public investments, and to support the enforcement of development regulations. The facilities will operate by offering a menu of technical engagements for immediate as well as long-term projects on a demand-driven basis. CPLs will seek strong support and cooperation from the City Government with the aim of becoming technically and materially self-sustainable within two to three years. By acting as a single ‘nerve center’ or focal point for analytical work across a range of sectors, touching on spatial growth, land use, land markets, slums, economic competitiveness, and climate and risk resilience, the CPL will help to habituate city leaders to thinking about urban management in an integrated, holistic way, allowing them to meet a range of needs through select but strategic interventions. As described in detail under the ‘core’ module, the CPL will facilitate coordination through various agencies, with the Directorate General of Spatial Planning, Ministry of Public Works (MPW) at the center of the technical engagement at the national level, and Bappenas playing an important coordinating and advisory role, and donor support from the World Bank. At the local level, the CPL will have dedicated staff from various local government agencies, as well as external experts with long-term commitments to working with the Lab. It will also establish working relationships with academic and research institutions. It will conduct technical studies in modular form to respond to immediate needs, while also serving as the venue for the transfer of technical knowledge and the building of local capacity in the longer term.
1.3 OBJECTIVES In the short term, the CPL will (i) provide “just in time”, demand driven data and analysis that can feed into immediate decisions, and (ii) streamline ongoing urban management functions, such as building permitting and tax-related functions. In the medium term, it will provide cost-effective analytics to cities that can feed into planning and investment decisions, reducing the expense involved in contracting consultants during each planning cycle. In the long term, the CPL will build local technical capacity, by gathering expertise from Indonesia and international sources to work closely with local staff. Over time, external involvement will diminish as local capacity strengthens.

7
MPW will facilitate an ongoing objective alongside those mentioned above will be to work with MPW to demonstrate and disseminate the value of this approach more broadly to local governments throughout the country.
1.4 SCOPE OF ACTIVITIES The proposed activities of the CPL will be conducted in modular fashion, each pertaining to a different sector. The proposed sector modules are: F. Instituting the City Planning Lab & Spatial Growth Analytics (core module) G. City Economic Competitiveness H. Slum Analytics and Management Systems I. Climate and Risk Resilience Planning Systems J. Monitoring Land and Real Estate Markets
While the details of the activities will differ, they will all take a common approach, which will involve (i) data gathering; (ii) inputting new and existing data into an integrated cross-sectoral data platform; (iii) using data in ongoing urban management functions; (iv) analyzing the data; and (v) working with city leaders to help them use the insights from data analysis in planning and decision-making. In addition, the Ministry of Public Works will lead an overarching component involving three key activities: (i) preparation of guidelines for establishing CPL, (ii) a capacity building program beyond the core cities, and (iii) dissemination activities. The detailed outputs, budget, timeline and potential risks for each module are discussed separately. A summary is provided below: A. City Planning Labs & Spatial Growth Analytics (core module)
Four cities (Surabaya, Palembang, Denpasar, and Balikpapan)
Major outputs:
Geospatial database
Support to detail planning process
Pilot of a new permitting decision support platform.
Report on spatial accessibility of urban services
Report on urban expansion trends, 2000-2010
Report on land value impacts of infrastructure
Report on infrastructure demands over 10 years
B. City Economic Competitiveness Two cities
Major outputs:
City economic competitiveness review
City economic planning and decision support capacity building

8
2-4 Workshops for public-private dialogues
City economic competitiveness dashboard C. Slum Analytics and Management Systems
Two cities
Major outputs:
Slum Information Database, incorporating all collected data
Survey materials
Report outlining slum management strategies
Planning of pilot implementing programs for selected sites
Report outlining (a) the process of slum formation, as observed through case studies; and (b) recommendations for strategies for preventing slum growth in specified areas
D. Climate and Risk Resilience Planning Systems Two cities
Major outputs:
Data inputs on disaster risk into city’s geospatial database
Customization of the InaSAFE software tool based on user needs
Report outlining the drivers of disaster and climate risk to core sectors and areas/neighborhoods, with risk-sensitive micro zoning maps, and recommendations for resilient land use and infrastructure investment planning
E. Monitoring Land and Real Estate Markets
Two Cities Major outputs:
Cadastral real-estate database, showing each land parcel with its associated buildings, occupants’ demographics, accessibility characteristics and valuation estimates.
Land and property market assessment report
Housing segmentation study report
Impact analysis report, documenting the observed real estate value impacts of selected infrastructure investment projects
Real Estate Financing Analysis
Hedonic pricing analysis, explaining variations in land and real estate values based on the spatial attributes and accessibility

9
SECTOR MODULE A: CITY PLANNING LABS AND SPATIAL GROWTH
ANALYTICS

10

11
2.1 BACKGROUND 2.1.1 CONTEXT As Indonesia urbanizes, the forms of its metropolitan areas will have profound and long-lasting socio-economic and environmental consequences. Present urban expansion can, on the one hand, foster economic growth, offer better opportunities to citizens and improve regional and international connectivity. On the other hand, rapid urban expansion also brings about important challenges, such poor integration of complementary land uses, exhaustion of urban resources and social inequality. In order to overcome such challenges and harness the opportunities, Indonesian cities need a capacity to analyze the current growth trends, understand their underlying forces and forecast their future consequences. At present, a number of medium and large-scale cities in Indonesia, where a large share of urban growth is occurring, lack the analytic capacity to examine how and much they are growing, what factors drive the growth and change, where and what types of public infrastructure investments are needed, how well past policies and investments have performed, and how future plans can be informed by current development trends. This leads to uncoordinated planning and enforcement efforts, inefficient use of scarce resources, and poor returns on infrastructure investments. The lack of basic urban information systems impedes the necessary information sharing across different city departments, making decision coordination and planning enforcement difficult to achieve. Without reliable information and analytics, scarce public resources cannot be effectively allocated and policies cannot be effectively designed nor enforced to address key urbanization issues. In order to support efficient, sustainable and equitable urban growth in the next decade, it is critical for Indonesia’s cities to invest into new information, analytic and regulatory systems of urban planning and development. 2.1.2 IMPLEMENTING P3N TECHNICAL ASSISTANCE THROUGH CITY PLANNING LABS As part of the Metropolitan and Urban Development Program (P3N), the World Bank aims to support the Government of Indonesia in establishing City Planning Labs (CPLs) in medium and large-scale cities, starting with four pilot cities in 2013 – Denpasar, Palembang, Surabaya and Balikpapan1. The CPLs will house a number of planning support activities for a wide range of urban problems that are divided into several modules. The central focus of the labs is to provide reliable Urban Spatial Growth Analytics and to upgrade information management for Regulatory Enforcement Systems. The focus of the Spatial Growth Analytics Module will be on analysis that provides a clear practical benefit to cities, which can serve as inputs into decision-making around policies and investments, and which can eventually be carried on by the cities independently. Provisioning the right amount of land and utility systems for future housing needs, for instance, can reduce the development of slums and save costly
1 Denpasar (metro population 1.8 million), Palembang (metro population 1.6 million), Balikpapan
(population 0.6 million) and Surabaya (metro population 5.6 million) have been selected due to their their
existing planning efforts, their fair results in coordinating planning efforts with the central government, and
their keen interest in the initiative.

12
legal land readjustments later. Positioning key infrastructure, such as new roads, in places that generate the greatest and the most equitable benefits to landowners, can lead to a rise in land values and rental incomes that greatly exceed the initial investment. Paralleling analytic work, the technical facility will also assist city planning enforcement agencies to transition into a transparent, electronic permitting and enforcement workflows. A great deal of planning and development regulation today is paper based and fragmented between different approval processes, making it difficult to have a holistic overview of developments that are being approved. A number of spatial planning agencies have voiced that the present enforcement system also fails to integrate critical information between enforcement and planning groups in local governments, hampering their capacity to carry out approved plans. These two activities are described as part of the core CPL concept note below. Additional CPL activity modules are described in separate concept notes as follows: A) Land and Real Estate Market Monitoring Module; B) City Economic Competitiveness Analytics Module; C) Slum Analytics and Management Systems Module; D) Climate and Risk Resilience Planning Systems Module. Human resources, technical infrastructure and data management systems will be hosted by a single CPL facility in each city and shared by the activities of all analytic modules. Section three of this note describes three related steps of the proposed CPL implementation process:
i. Developing City Planning Labs as institutionalized municipal platforms for spatial analysis, integrated and evidence-based spatial development and investment planning.
ii. Implementing core urban spatial growth analytics (as well as other analytic modules described in separate concept notes) and using the outputs in planning activities.
iii. Establishing an effective data exchange system between spatial planning and enforcement agencies for an improved and automated planning enforcement framework for core urban land use and construction permitting functions.
2.2 OBJECTIVES
The primary objective of setting up the support facilities at municipal governments is to establish technical capacity to measure, analyze and respond to urban development pressures in an evidence-based and timely manner. By supporting evidence-based decision making, capacity building in urban analytics and more seamless information sharing across city departments, we expect the CPLs to lead to substantial cost savings in spatial management and enforcement, plans that are aligned with the city’s aspirations, more effective enforcement of planning goals, as well as greater multiplier effects on infrastructure investments in the medium and long run. The initial core activity of the facility is urban growth analysis, the objectives of which include to:

13
Project future growth, based on existing trends, and forecast the future demand for land uses and amenities.
Help integrate projected demographic and economic changes into Masterplans and Detail Plans.
Communicate information relating to future spatial plans over web-based maps to other related agencies to strengthen regulatory enforcement.
Foresee infrastructure requirements from current trends and help avoid supply shortages by proposing possible planning responses.
Conduct spatial cost-benefit analyses of public investment decisions.
Evaluate the social and environmental impacts of public investments.
Assess the equality of public investment distribution across all demographic and income groups.
Provide accurate and reliable geospatial data to private sector developers and individual stakeholders.
The upgrading of regulatory enforcement systems module of the facility aims to improve information sharing and information capture between planning and regulating arms of the local government in order to develop a more effective and transparent decision chain for carrying out the city’s planning intentions. The objectives of the proposed regulatory technical assistance are to:
Analyze the present paper-based regulatory processes for building permits and change-of-use permits in local spatial planning offices.
Develop a comprehensive action plan to upgrade the present permitting system to computerized databases that allow permitting officers to instantly access approved planning information about parcels under question via a simple web interface.
Implement a pilot data capture system for building permits and change-of-use permits that will record each approved permit in a database and automatically update the city’s GIS parcel and building map layers with accurate information.
Display Masterplan and Detailed plan information to landowners publicly over a web-based map server, without requiring personal consultations to find out the allowable buildable volumes on site.
Evaluate the effectiveness of the above pilot schemes with respect to more effective regulation and adjust the system implementation accordingly.
The CPLs will additionally offer the World Bank and other donor organizations a valuable platform for predicting and tracking the impacts of transformative infrastructure investments in Indonesian cities.
2.3 SCOPE OF ACTIVITIES
Addressing the goals and challenges discussed above, the three steps to implement the CPL activities outlined in this note are:
i. Establishing City Planning Labs: This involves providing assistance to the city on
institutional setup, data collection, software and hardware and human capacity.

14
ii. Implementing Spatial Growth and Change Analytics: This involves developing the preliminary analytical work on spatial growth monitoring, and proposing activities for future phases, to be conducted by the City Planning Lab with external assistance.
iii. Improving Planning Enforcement Systems: This involves assisting the cities’ spatial regulatory agencies to implement computerized information and permitting systems that are synchronized with spatial information with other city agencies.
2.3.1 ESTABLISHING THE CITY PLANNING LAB
2.3.1.1 Software and Data Platform To fulfill their primary goal of assembling, maintaining and distributing large geospatial databases, the City Planning Labs need a data platform that satisfies four fundamental requirements. The platform should:
Allow the data to be stored and management in a well-organized way
Allow the data to be shared across different departments or with members of the public over internet browsers
Enable all data management operations to be performed from a local networked computer
Enable the end-users to interact with the datasets, by querying their attributes, overlaying different data layers, using simple base-maps to situate the information, and sharing personal information layers on published maps.
The capacity to operate basic spatial functions (e.g. spatial search, measurement or proximity search, attribute table joining etc.), would be desirable additional functions for the end users, though not a first-order priority. Combined, these basic requirements necessitate setting up a GIS map server platform. There is a considerable list of open source and proprietary GIS server technologies. Proprietary technologies include ArcGIS Server, ArcGIS Online and MapInfo Spatial Server, while open source options include GeoServer, GeoNode, and PostGIS. The World Bank’s Platform for Urban Management and Analysis (PUMA), currently under development, is also a potential open source option for the City Planning Labs. Based on the vital and desired functionalities, cost and budget limits, and the platform’s flexibility for scaling up, a few options will be introduced to the Lab. While setting up the data platform should be tackled at the outset of the lab, its maintenance and potential expansion – given the envisioned collaboration with a larger number of government departments – will continue throughout later phases. It is possible, for instance, to start off with a proprietary off-the-shelf system that requires little setup time, such as ArcGIS Online, while the staff are technically trained to set up a more long-term open-source system. Apart from the platform for geographic data, general software (e.g. text editors) and operating system, the lab requires two types of desktop software tools for assembling data and conducting analysis:

15
Spreadsheet software with basic statistical analysis capabilities (e.g. Microsoft Office Excel, Access; Open Office Calc, Base)
GIS desktop software (e.g. ArcGIS, MapInfo, QGIS) These desktop tools are available both as proprietary and open source, with different functionality. The potential options will be introduced to the lab, based on the required capacities.
Figure 1. Screen Capture of a QGIS Open-source Data Platform Work Environment
2.3.1.2 Institutional Arrangements Organizational location: A few different options are available in terms of situating the City Planning Lab within the existing local government. The exact institutional setup would be tailored to the preferences of the local governments. An effective institutional model would be to have the Lab located within Bappeda, who would provide the physical space and some of the basic investments in setting up the Lab. It is recommended that both

16
Bappeda, as well as the Department of Spatial Planning, would provide two full time staff members to work as part of the Lab team. In order to ensure coordination across agencies, it is recommended that the Lab be advised by an Advisory Committee convened by the Mayor, with members from Bappeda, Spatial Planning, Public Works, Revenue, BPS, BPN and other planning related agencies or city departments. The committee may also include representatives from neighboring jurisdictions or regional governments, in order to ensure coordination across the whole metropolitan area. In addition to coordinating between city agencies and departments, the advisory committee will liaise between CPL and the Ministry of Public Works in order to inform the national level spatial planning by local analysis, data and plans. CPL in each pilot city will also assist the local governments by informing their planning enforcement systems of national plans. This committee would likely meet once every month or two in order to set the strategic direction for the work of the Lab. It is not recommended that the advisory committee intervene with the daily operations of the lab, which could be done more efficiently by the CPL staff.
Figure 2. City Planning Lab Partnership Framework
Partnerships: The Lab would establish institutional partnerships with external entities in order to facilitate knowledge exchange. For example, there may be MoUs signed with Indonesian universities to foster collaborative projects between students and the Lab, internships or part-time positions for students who may work at the Lab for short periods, or research projects conducted by universities that complement Lab activities. MoUs may also be signed with agencies at other levels of government, including data sharing agreements with BPS or BPN. In addition, consultants would be hired to work closely on specific analytical areas on a project basis. During the first two years of the implementation phase, outside consultants and partner organizations will be required to collaborate closely and transfer knowledge and skills to the CPLs. The World Bank team would play an ongoing advisory role, which would phase out over time. In this way the Lab would gradually become technically proficient and self-sufficient to support all
17
necessary spatial analytic support function for the cities, and form the means by which the city interacts with key partners in urban planning and management.
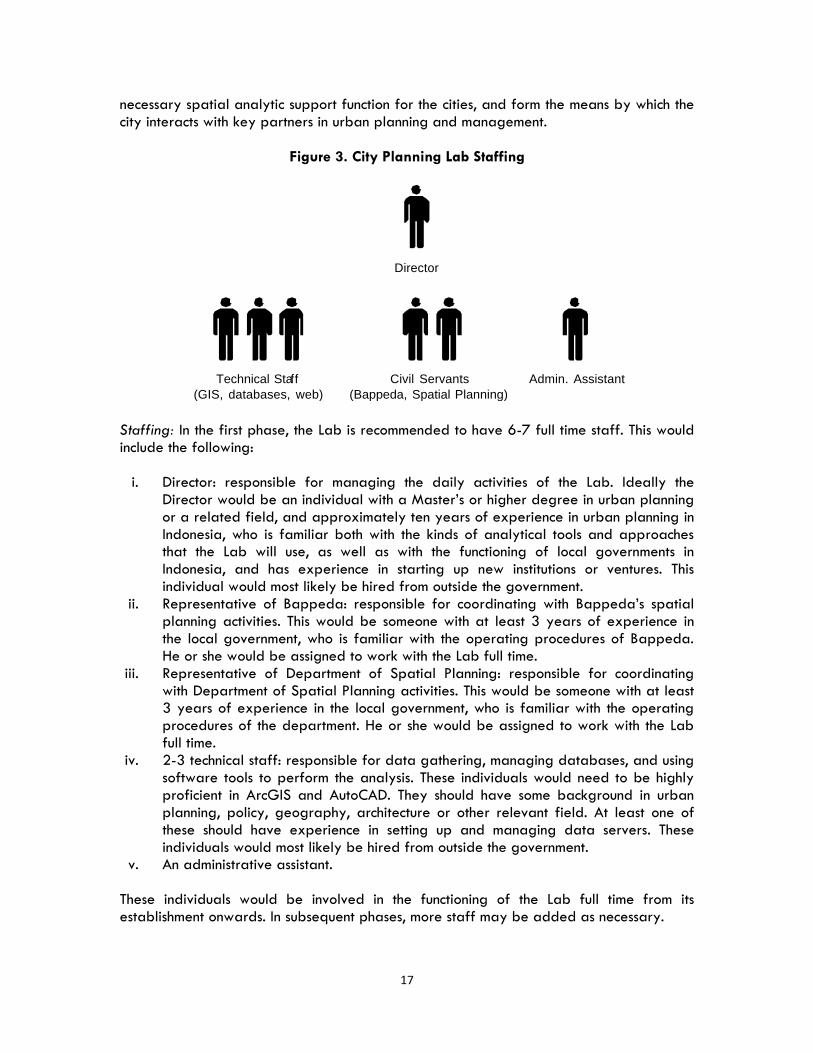
Figure 3. City Planning Lab Staffing
Staffing: In the first phase, the Lab is recommended to have 6-7 full time staff. This would include the following:
i. Director: responsible for managing the daily activities of the Lab. Ideally the Director would be an individual with a Master’s or higher degree in urban planning or a related field, and approximately ten years of experience in urban planning in Indonesia, who is familiar both with the kinds of analytical tools and approaches that the Lab will use, as well as with the functioning of local governments in Indonesia, and has experience in starting up new institutions or ventures. This individual would most likely be hired from outside the government.
ii. Representative of Bappeda: responsible for coordinating with Bappeda’s spatial planning activities. This would be someone with at least 3 years of experience in the local government, who is familiar with the operating procedures of Bappeda. He or she would be assigned to work with the Lab full time.
iii. Representative of Department of Spatial Planning: responsible for coordinating with Department of Spatial Planning activities. This would be someone with at least 3 years of experience in the local government, who is familiar with the operating procedures of the department. He or she would be assigned to work with the Lab full time.
iv. 2-3 technical staff: responsible for data gathering, managing databases, and using software tools to perform the analysis. These individuals would need to be highly proficient in ArcGIS and AutoCAD. They should have some background in urban planning, policy, geography, architecture or other relevant field. At least one of these should have experience in setting up and managing data servers. These individuals would most likely be hired from outside the government.
v. An administrative assistant. These individuals would be involved in the functioning of the Lab full time from its establishment onwards. In subsequent phases, more staff may be added as necessary.
City Planning Lab
Director
Technical Staff
(GIS, databases, web)
Civil Servants
(Bappeda, Spatial Planning)
Admin. Assistant

18
Equipment and Space: In its first phase, it is recommended that the Lab be situated in a space of approximately 40 sq. m., with a desk and a computer station for each full-time staff as well as one additional work station for visiting consultants, and a small meeting area. The equipment necessary would include a computer for each work station, a laser color printer / scanner, a 36-in color plotter, a large-format scanner, and a 46-in flat-screen display for presentations.
Figure 4. Example Analysis Output: Accessibility to Jobs
Source: City Form Lab Note: Accessibility to jobs within a 10 minutes walking range from each building in Cambridge and Sommervile, MA, USA
2.3.2 SPATIAL GROWTH AND CHANGE ANALYTICS
2.3.2.1 Analytics A core objective of the SP Module is to provide spatial analyses and evidence-based decision support to different city agencies and outside constituencies. The CPL will play an important role here. The spatial information gathered and analyzed by the CPL should enable the city to keep track of the growth and changes in its overall development, to monitor its land and real-estate markets, and to forecast and monitor the impacts of its planning interventions. The analytics performed by the CPL will be used as a basis for the city’s Masterplanning and detailed planning efforts, for setting the priorities and predicting the impacts of public financing and infrastructure investments, and for making reliable spatial information available to various planning and enforcement decision

19
makers (i.e. building permitting office) on a continuous basis. The Bank’s staff and outside technical experts will work closely with the local CPL teams over the first two years to transfer technical knowledge and to build up the skills needed to perform the information management and analytics autonomously. For the first year of operations, the CPL aims to achieve the following analytic outcomes: Phase 1 (Months 1 to 6):
- Creating interactive geospatial databases: Existing spatial datasets are uploaded to an online map server for interactive viewing by different city departments. The interactive viewing should be web browser-based, not require any additional software from end users. This will allow stakeholders to overlay different spatial data (e.g. current built-out areas and the existing Masterplan) and to query simple attributes about the map elements by clicking on them (e.g. click on a parcel to see its area, ID, etc.). The exact list of existing datasets to be uploaded will be decided together with the city planning agencies based on availability (e.g. high-resolution satellite image, street centerlines, building footprints, parcels, schools, hospitals etc.).
- Urban growth analysis: The growth of the metropolitan area and its corresponding population from year 2000 to 2010 will be obtained (from the World Bank’s ongoing East Asia and Pacific Urban Flagship activity) and used to analyze the spatial extent and rate of the city’s growth in the past decade. The previous decade’s expansion areas will be overlaid with current building and land-use data in order to analyze how much land was consumed by different land-use categories. This analysis, combined with regional economic and demographic forecasts, will subsequently be used as a reference to develop likely estimates for growth in the current decade, from 2010 to 2020.
Phase 2 (Months 7 to 12):
- Accessibility analysis: Existing spatial information on public facilities and resources (e.g. drinking water sources; drainage points; schools; hospitals; markets; transit stops) will be used to estimate accessibility to these resources in different parts of the city. This analysis should illustrate underserved areas and provide an empirical basis for future public investments.
- Support to planning: As the planning agencies (Bappeda) of the participating cities engage in developing detailed plans (1:5,000 scale) from their current Masterplans (1:25,000 scale), the CPL will help develop the supporting spatial analysis required to achieve the goals of detailed plans. Palembang planners indicated that they need to develop 16 detailed plans for the different parts of the city, indicating the allowable land-uses, building heights, building coverage, infrastructure changes and buildable areas in different parts of the city. CPL analyses will help choose the areas in need for public investments (i.e. new roads, transit stops, schools, flood protection, etc.); for determining the likely economic growth poles in the city; and for forecasting the needs for different land-uses at the detailed plan scale during the next five years. The planning agency (Bappeda) can integrate these inputs to detailed plans and associated legal development regulations.
20
- Impact analysis: CPL will additionally develop impact analyses for ongoing public investment projects, such as choosing the exact location for the second bridge in Palembang, for locating sanitation and water facilities in Denpasar, collaborating with Public Works in choosing the placement of a new toll road, etc. on a per need basis.
Phase 3 (Months 13 to 18):
- Projections: More accurate and up-to-date spatial data will allow the CPL to start developing more accurate forecasts for near-term and long-term projections on land use requirements, housing needs, transportation demand, infrastructure needs etc. Analytics outlining such needs will help the cities prepare for potential problems (i.e. housing shortages, congestion) before they occur in the future. CPL staff will a long term (20 year) forecast for the city’s growth and start analyzing planning and policy responses needed to accommodate the projected growth.
2.3.2.2 Data Spatial and development plans cannot achieve their envisioned goals without accurate projections of supply and demand for housing, infrastructure and services, and forecasts for broader socio-economic and environmental situations to which planners must respond. Private sector developers and individuals can also make better decisions and contribute to the progress of the city if they have access to accurate data on how the city is growing and changing, and potential risks and bottlenecks. One of the primary objectives of the City Planning Lab in the four pilot cities is piecing together a comprehensive geospatial database from both the existing data and new data sources. A large body of data currently exists in local and national agencies; however, the absence of a well-structured collaborative information system has obstructed the flow of appropriate information among the government departments and the public. A considerable amount of data has not yet been digitized, prohibiting the data from being shared or used for computer-based analysis. The City Planning Lab aims to fill this gap by assembling existing data through a close collaboration with municipal agencies, and initiating collection mechanisms for new datasets. The Lab will develop an online platform to which government departments can contribute data they collect or record. The contributors, in return, will have access to more comprehensive and linked datasets, benefiting their own operations.
Apart from continuous updating of the database, another important task for database maintenance is the verification of the accuracy of data. Accuracy verification will be a continuous task for CPL staff. The first phase of data collection will involve identifying existing datasets, obtaining data from multiple departments, and integrating the data to standardized formats. This process will involve a significant digitization effort – e.g. generating GIS maps with useful attribute tables from the current paper maps showing allowable building regulations. Some early data collection activities will require external support. In the second phase, the Lab will start to build databases by joining different datasets together – e.g. adding land

21
values, land uses and establishment locations to the building dataset. The third phase will be mostly dedicated to field surveys for filling in the missing data and collecting new data. The use of government accounting and registries (e.g. data recorded for permitting or land and real estate transaction taxation) constitute an important future source of reliable and up-to-date data. Piloting the collection of such data is discussed further below.
2.3.2.3 Communicating Planning Goals Beyond performing analytic work to support ongoing planning, development and regulation work in the city, the CPL also aims to gather, document and visualize the planning goals that form the basis of Masterplans, Detail Plans and other spatial development initiatives. CPL’s analytic work is impactful only if it is well aligned with the city’s goals and initiatives. Yet such goals are often unclear and dispersed among multiple agencies. CPL could provide a venue that collects and visualizes the different initiatives and goals graphically in order to help disseminate the ideas across departments and to the general public. This can be done through web-maps, info-graphics and printed publications that are shared across the city’s departments. 2.3.3 PLANNING ENFORCEMENT
2.3.3.1 Restructuring the Planning Enforcement Procedures: Any government accounting and registry procedure naturally leaves a trace of data behind, which could be effectively used if a proper structure for the flow of data is developed. The structure of the existing planning enforcement systems in Indonesian cities, however, does not allow for the effective and efficient utilization of these registry and accounting records. Planning enforcement procedures are still paper-based and the lack of a standardized national addressing system makes it difficult to integrate them with other spatial databases. This concept note proposes restructuring three planning enforcement procedures – building permitting, change-of-use permitting and the communication of zoning regulations – as a pilot initiative in the four cities. CPLs will develop a detailed assessment of the current enforcement mechanisms at the local spatial planning agencies and propose comprehensive improvements to digitize and streamline development-permitting processes. CPLs will carry out a pilot implementation of a data capture system in building permitting and change-of-use application procedures that will demonstrate an integrated information flow for keeping a city’s geospatial building and land-use data up to date. Building and Change-of-Use Permitting (Phases 1 and 2):
Building and change-of-use permits are potentially the best source of data for keeping a city’s spatial database up to date, as such permits capture changes in all legal development activities. In order to actively harness these data, the permit issuance procedures in Indonesian cities need to be restructured.

22
During the first two phases, the CPL will perform a detailed assessment of the present permitting procedures in the Department of Spatial Planning and develop a plan for updating the processes to digital standards. The new procedures will allow each permit to be recorded in a digital database, which can be referenced via parcel and address indicators and geographic coordinates to other existing databases (e.g. parcel, building and business location databases). This is expected to produce two important benefits. First, linking permitting with existing geospatial data will allow permitting officers to instantaneously retrieve approved planning information about the permit sites under question, eliminating an information gap between planning goals and enforcement. Second, a continuous updating of building and use data based on permitting procedures will also significantly lower the on-ground or aerial surveys required in the future for data updating. Phase 1 (Months 1 to 6) deliverables:
- Assessment of new building and change-of-use permitting. CPL will document and evaluate the current procedures for issuing new building permits and change-of-use permits at the local spatial planning agencies, producing a report of the current workflows and potential opportunities for improvement. The report will also outline the success rate of the current planning enforcement system, overlaying legal spatial plans with issued permits on the ground.
Phase 2 (Months 7 to 12) deliverables:
- Recommendations and activity plan for a new permitting decision support platform. CPL will produce a report outlining recommendations for a new, digital permitting decision support platform that will allow permitting and enforcement agents to seamlessly access cross-linked information about planning regulations for parcels, buildings, zones in the city. The report will also outline a proposal for making general planning and zoning regulations accessible to land-owners and developers via an online portal.
Zoning Regulations and Spatial Plans (Phase 3):
Zoning regulations and spatial plans are currently not fully shared with the public, which has imposed an unnecessary work load on the Department of Spatial Planning, who communicates this information on a case-by-case basis to interested property owners. Prior to applying for any building permit, property owners are required to submit an inquiry about allowable coverage, height, use, and setbacks for each property. A planning officer retrieves this information from paper-based documents and communicates back to the requestor in written form. Such zoning information, which is publicly available in most developed countries, can also be made publicly available in Indonesia. Integrating Registry and Accounting Records into the cities Spatial Database (Phase 3)
As discussed above, one of the primary objectives of The City Planning Labs is to piece together and maintain a comprehensive geospatial database. In addition to readily available data, additional spatial information harnessed from the government accounting and registry documents offer important potential sources for expanding the datasets and
23
keeping them up-to-date. Building permits, for instance, can be used for updating the building dataset in real time and in the most accurate and cost-efficient way. This requires proper digital and spatially referenced registries that could be linked with the CPL databases. Transaction data from local tax services or notary offices could allow land and real estate value datasets to be updated each time a transaction is made. Such mechanisms are common in developed countries’ planning systems. The City Planning Labs will not only be collectors of data, but they will also provide participating government departments (local and national) with integrated and updated geospatial databases, built upon the data provided by individual agencies themselves. Bappeda, for instance, will benefit significantly from registry and permit data from the Department of Spatial Planning (Dinas Tata Kota), which can be used for preparing the detail plan of sub-districts. As the permit information is currently not transferred to Bappeda in a ready-to-use manner (it is not digital nor spatially referenced), Bappeda instead uses open-source satellite images to update its building datasets, leading to outdated and inaccurate information.
Phase 3 (Months 12 to 18) deliverables:
- Planning enforcement portal. By the end the third phase the CPL, in collaboration with Bappeda and Department of Spatial Planning, will prepare and publish currently available maps of zoning regulations and spatial plans to the general public on designated websites. Since the information is legal and explicitly stated, this upgrade is expected to relieve an unnecessary burden of private consultancies.
- Pilot program for permitting decision support platform. CPL will implement a pilot program for permitting decision support that will test an integrated digital workflow for permitting officers. The platform should allow permitting officers to instantaneously retrieve approved planning information about the permit sites under question, providing a more integrated planning and reinforcement workflow. Each issued permit should automatically update building and land-use data in the city’s building and parcel databases. This pilot program will be implemented on two permitting procedures in each city: new building permits and change-of-use permits. The pilot program seeks to understand the existing data flows, and the required procedures for integrating and maintaining a real-time database between different city departments. After evaluating the first phase pilots, CPL aims to scale such efforts up in the second phase.
2.3.3.2 Digitizing Historic Data While keeping track of the registry and accounting records offers an up-to-date capture of the existing condition of a city, it is not sufficient for understanding the current trends and forecasting their future changes. This requires several datasets of spatial conditions over time. These snapshots can be collected gradually over time. The existing planning enforcement systems have been collecting valuable data, although many of them are not digital or in an appropriate format for analytical purposes. During the first and second phases of the project, the City Planning Lab will collaborate with municipal government departments and

24
agencies to first map available historic data, and to then digitize and integrate these historic data with current conditions.
2.3.3.3 Planning Tools The availability of close partnerships with outside institutions (e.g. CPLs in other cities, the World Bank, outside consultants) also offers a unique opportunity to collect and document information about planning tools and implementation mechanisms in other successful cases. Such tools may include zoning regulations, incentive systems, building guidelines etc., which could potentially be implemented in the city as part of planning initiatives. CPL can help disseminate knowledge about such tools to different stakeholders in online and print publications. Keeping an up-to-date overview of planning goals and their related implementation tools will help CPL ensure that the analytics performed are aligned with the city’s needs.
2.4 RISKS Potential risks include the following:
i. Difficulty in transferring skills in a sustainable manner: Local governments in Indonesia
often lack the technical expertise necessary to perform the kinds of analytical work proposed for the Lab. For this reason, much of the work in the early phases will be done by external consultants. There is a risk that knowledge will not be sufficiently transferred to the local government counterparts involved in the Lab. In order to address this risk, the Lab will involve local officials as key team members from the beginning, and will be overseen by the mayor or a local government agency. Any external consultants will be required to work closely with the local officials in the Lab. Every technical assistance activity will have the dual objective of producing the analytical output itself while simultaneously training local staff to perform such analysis. This will ensure sustainability of skills in the Lab.
ii. Lack of coordination with other agencies: There is a risk that while the local staff directly involved in the Lab will adopt new analytical approaches, the overall urban planning and management systems will carry on with business as usual. This risk will be most effectively mitigated if there is a high-level champion for the Lab, ideally the mayor, the head of Bappeda, or a board consisting of heads of various departments (see section on institutional arrangements), to ensure the proliferation of analytical approaches and operating procedures developed in Lab throughout the rest of the government.
2.5 OUTPUTS PHASE 1 At the end of Phase 1, the Lab should have a physical space, with hardware and software equipment with full-time staff set up. The outputs of the phase 1 analytical activities will be as follows:

25
- An interactive online geospatial database, featuring datasets that are already available for the lab, will be ready for use for different city departments on web-browsers.
- A short report will outline the 2000-2010 urban expansion increase in the given city and the likely growth scenario for the current decade based on urban extent and population data from World Bank’s ongoing East Asia and Pacific Urban Flagship activity.
- A report assessing the current procedures for issuing new building permits and change-of-use permits at the local spatial planning agencies, describing the current workflows and potential opportunities for improvement.
PHASE 2
- A spatial accessibility databases will be analyzed at the individual building level, illustrating how easily households in different parts of the city can access critical urban resources – drinking water sources; drainage points; schools; hospitals; markets; transit stops. The results will be described in a short report and in graphic material (e.g. paper-based and online maps) that can be shared with various city departments.
- Based on collaboration with the detailed planning team in the respective city, CPL staff will support the development of the detailed plans with spatial analyses. CPL analyses can help choose the areas in need for public investments (i.e. new roads, transit stops, schools, flood protection, etc.); for determining the likely economic growth poles in the city; and for forecasting the needs for different land-uses at the detailed plan scale during the next five years. These analyses will be determined on a per-need basis and documented in written and online reports with supporting geospatial evidence.
- CPL will produce a report and supporting geospatial data, outlining the likely land-value impacts of ongoing public investment projects, such as the addition of a second bridge in Palembang, for locating sanitation and water facilities in Denpasar, choosing the placement of a new toll road, etc.
- Recommendations and activity plan for a new permitting decision support platform. CPL will produce a report outlining recommendations for a new, digital permitting decision support platform that will allow permitting and enforcement agents to seamlessly access cross-linked information about planning regulations for parcels, buildings, zones in the city.
PHASE 3
- CPL will produce a report, which analyzes the directions and magnitudes of the effects that different land improvement strategies have on land and real-estate values in the respective cities. The report, based on hedonic price models, will indicate how access to critical infrastructure (roads, water, transit) and land-use linkages (commerce, jobs, parks) affect land prices and real estate sales.

26
- Forecasts will be prepared in the form of a written report and supporting graphic material to describe land use requirements, housing needs, transportation demand and infrastructure needs for the next 10 years in the city.
- CPL will compose a report and hold a workshop with various city planning related departments to describe the results of the digital data integration and capture pilot program through planning enforcement mechanisms. The report will outline the successes and shortcoming of the pilot program and make concrete recommendations for the expansions and automation of the data capture system in the future.
- CPL, in collaboration with Bappeda and Department of Spatial Planning, will prepare and publish currently available maps of zoning regulations and spatial plans to the general public on designated websites.
- CPL will implement a pilot program for permitting decision support that will test an integrated digital workflow for permitting officers. The platform should allow permitting officers to instantaneously retrieve approved planning information about the permit sites under question, providing a more integrated planning and reinforcement workflow. Each issued permit should automatically update building and land-use data in the city’s building and parcel databases. This pilot program will be implemented on two permitting procedures in each city: new building permits and change-of-use permits.
2.6 TEAM AND TIMELINE This module will be carried out in three phases of six months each. In addition to full time staff members listed above, additional expertise required for providing consultation to the spatial growth analytics module will include:
i. IT/GIS Server Specialist ii. Urban Economist iii. Urban and Regional Planner

27
SECTOR MODULE B: CITY ECONOMIC COMPETITIVENESS

28

29
3.1 BACKGROUND Indonesia’s cities remain a challenge – and a major opportunity. The Indonesian economy has performed strongly over the past decade. The country has also been rapidly urbanizing, but has been unable to fully capture the productivity benefits from agglomeration. Improved capabilities at the municipal/urban level are the key to unlocking the potential for improved economic competitiveness of Indonesian cities, since i. The size and diversity of Indonesia calls for customized strategies for sustained
economic growth. This is true particularly in the current political environment where risk aversion among decision makers at the national level ahead of the 2014 elections means that reforms at the city-level have a greater chance for success.
ii. Cities can influence the business environment considerably, thanks to decentralization and partial devolution of regulatory authority. According to the Subnational DB study (2012), obtaining a construction permit in the city of Bandung, for example, takes on average 44 days, while in the capital Jakarta, less than 150 Km away, the same procedure takes on average 158 days, more than 3 times as long. To start a business in the city of Palangkaraya, 27 days are needed for the official procedures, while the same steps in Jakarta take almost twice as long, 45 days. These variations indicate that cities have the ability to improve the regulatory environment independent of reforms (or lack thereof) at the national level.
iii. City land use and infrastructure planning can directly and significantly impact the cost of doing business especially rental cost, ease and cost of brownfield expansion of businesses and access to last mile infrastructure (road, power, broadband, etc)
Examples of notable success (and failure) of international cities can provide guidance as to what can be done to enhance city competitiveness and make best use of comparative advantages. Locally appropriate policies are needed to provide the simple, transparent, and supportive operating environment that businesses need to succeed and grow.
3.2 OBJECTIVES The objective of the City Economic Competitiveness Module of the Metropolitan and Urban Development Program (P3N) is to enable client cities to actively guide and foster their municipal and regional economic development through superior planning and decision making and deep consultation with private sector stakeholders. Success indicators include the number and quality of jobs available in the city (and surrounding areas, as applicable), the improvement of productivity in targeted sectors, and the inclusiveness of economic growth (target measure TBD) within the city. The module’s components will be achieved by helping cities (i) get smarter about understanding trends in their regional economy, and the impacts that public policy, investment and planning decisions have on their economic prospects; and (ii) work with the private sector to leverage this newfound understanding to initiate a series of local reforms/policies/investments. Activities will focus on building institutional capacity to

30
significantly strengthen the targeted cities’ competitiveness planning and analysis capability, as part of the City Planning Labs (CPL), as well as on market sensing and working closely with the private sector to ensure that the cities’ efforts on planning and analysis are well targeted. Since the achievement of this component’s objectives ultimately depends on the private sector’s response to the cities’ improved planning, the involvement of and dialogue with the private sector from the start is critical.
3.3 SCOPE OF ACTIVITIES In keeping with the other CPL modules, the activities in this module will be conducted in three phases of six months each. The module comprises four components, which will span all three phases, though at varying intensity. The module is designed on the basis on World Bank’s past experience with such programs, latest literature on the subject, and our own initial assessment of the cities. An overview of the key products that will be produced under the four components is in the table below.
i. City Economic Competitiveness Review: city-level economic review and comparison
across cities, sectoral studies and in-depth analysis.
ii. Capacity building: building city economic planning and decision support capacity at a local level
iii. Consultative workshops and Public-Private Dialogue (PPD): 2-4 workshops for public-private dialogues; from early consultations to institutionalized, regular dialogue and fine-tuning of policy initiatives.
iv. City initiatives and dashboard: from considering external case studies, to finalizing decisions on policy initiatives and implementation, including joint action plan with private sector and dashboard to communicate initiatives and monitor progress.
Table 2. Scope of Activities and Timeline
Phase 1: 0-6 months
Phase 2: 7-12 months
Phase 3: 12-18 months
City economic competitiveness review
City Economic Competitiveness Review of pilot cities including comparative analysis
Sectoral studies, possibly based on additional data
In-depth analysis
Capacity building
Integrating city economic data with the core spatial planning platform; map economic analysis to core spatial data platform
Building analytical capacity at CPL; map economic analysis to decisions at city level
Transferring lead of activities to CPL
Consultative workshops / PPD
Early consultations with private sector; formulating top hypotheses on constraints and policy levers
Decision on key sectors and policy options
Institutionalizing dialogue; decision on action plan for policy initiative
City initiatives and dashboard
External case studies Policy options Policy finalization and decision, incl. action plan

31
Component 1: City Economic Competitiveness Review Local government intervention to boost competitiveness should start with a clear understanding of the market and the main spatial and sectoral drivers of city economic growth. This report aims to do an in-depth study of the city’s economy. Description: The City Economic Competitiveness Review attempts to answer the following questions – (a) what is the state of the local city economy in terms of GRDP, GRDP per capita (as a proxy for productivity), GRDP mix, total jobs, average wages, and exports and their growth over last 10 - 20 years; (b) how does the economic performance of the city compare to peers and what are city’s strengths and weaknesses including education and skill level of workforce, land pricing, regulatory environment; (c) what are the spatial and sectoral drivers of city’s economic performance and competitiveness; (d) which are the sectors where the city can be considered or has potential to be nationally and globally competitive; (e) for the top sectors, what are the market failures and major barriers to growth across regulation/policy, skills, infrastructure (including land), technology and access to finance? Methodology: To answer the different questions stated above, the work on the report will consist of both quantitative and qualitative studies. It will build on existing work and on expertise by the World Bank and development partners. It will also involve collaboration with stakeholders from different government agencies, private sector, universities, and industry associations.
Trends in city’s economic performance will be based on data from statistical agency (BPS) and data available with local government agencies. For example, it is instructive to contrast the rate of growth in jobs, productivity and exports of a given city with its peers in Indonesia and potentially from outside Indonesia to determine a city’s strengths and weaknesses and their key drivers. Based on data from BPS, we have compared the growth trajectories of top Indonesian cities in Figure 1. Between 2000 and 2010, Palembang’s real GRDP grew 3.3 percent per annum (behind most cities) due to only 2.1 percent per annum growth in productivity (using the proxy of real GRDP/capita). Denpasar’s productivity growth was even lower at 1.7 percent per annum between 2000 and 2010. Denpasar’s GRDP growth is more respectable at 6 percent per annum driven by 4.2 percent per year growth in population.
Sector specific analysis: To analyze drivers of economic performance, sector specific data will be used. In particular, we would like to identify the traded and resource based industries2 that are true source of competitiveness. World Bank has developed
2 Michael Porter's work on competitiveness and clusters (e.g., US Cluster mapping project) talks about 3
types of industries -
Local industries - customers are local e.g., construction, retail
Traded industries - goods and services traded across regions/nations due to higher productivity achieved in the cluster/city (e.g., Auto components)
Resource based industries - raw materials and other resources are local (e.g., Oil and gas)

32
tools and surveys which can be used to drive this analysis. Some of the major tools, which we are likely to use for this analysis will include Sector feasibility checklist, Enterprise Survey, Value chain mapping, Porter’s five forces, Market trends, and Cost Analysis (same as cost-structure benchmarking). Figure 2, 3 and 4 are illustrative slides on methodology used for sector analysis.
Leveraging Sub-national Doing Business (SNDB) database and insights, which was earlier work done by World Bank and IFC with the pilot cities
Interviews with mayors, planners on top economic priorities, initiatives underway, challenges faced, city administration organization structure, decision rights, KPIs and incentives
Interviews with industry associations, major private sector players, investors, banking analysts, and central bank
Literature and case study survey of work done by World Bank, donors, partner institutions, academics, Indonesian think tanks
Study of government masterplans including MP3EI (Masterplan for Acceleration of Regional Economic Development), RPJMN and city plans
Additional, targeted data collection for in-depth and sectoral studies, if needed and as agreed to with all stakeholders
Timeline and phases: The work on the City Economic Competitiveness Review will span across all three phases. However, the first version of the report, based on existing data and key informant interviews only, will be completed during Phase 1, in order to support the dialogue and generation of policy options during the subsequent phases. The analysis will then be deepened and focused on agreed-upon sectors during phases 2 and 3. This may include additional data collection in the cities, if it turns out that such data is needed to complete the analytical work. Component 2: Capacity building Description: This part of the module links CPL outputs to the planning process, budget and resource allocation, land use, governance, and private sector decision support. The completion of the City Economic Competitiveness Review should translate into an ongoing capability and become an input into all the planning related to the cities’ economic development. The new analysis and insights from the review should be linked to action on the ground by (a) agreement on immediate initiatives and (b) permanent linking of new data and analyses to ongoing decision making by the city government and other players.
Competitiveness may come initially by exploiting resource advantage (resource based industries), and may come sustainably by developing traded industries. One way to analyze these local versus non-local industry concentration in a given city or cluster is to look at industry share of total output of the cluster and compare it to national averages. Palembang’s share of rubber and palm oil industry output to total Palembang GRDP would be way above the national average across clusters – making them Palembang’s competitive sectors.
33
This can be achieved by capacity building at Bappeda and other relevant institutions through on-the-job personnel training, setting up appropriate decision analysis tools, and institutional changes to ensure application of results. Methodology:
Map all controllable decisions at a city level, current data and facts used for those decisions, current information gaps, and specific lab outputs that will bridge this gap. This step will use process maps/ decision rights and other tools
One-time intervention to agree on immediate initiatives for private sector development followed by other institutional interventions that improve decision making to support private sector development on an going basis. This is essentially transforming the way Bappeda works and will be typically achieved through internal decision making workshops involving all relevant stakeholders.
Timeline and phases: The work on capacity building in this module will be especially closely coordinated with the activities of other modules, which also have capacity building as a key component across the three phases. It should be noted that the goal is to transfer the lead of the city economic competitiveness work to the CPL during Phase 3. Support of the work and of the CPL can continue, but the aim is to have the city government fully in the driver seat by that time. Component 3: Consultative workshops and Public-Private Dialogue (PPD) Description: The consultation with the private sector is critical throughout, since the success of this module is particularly dependent on the private sector’s reaction to the policy initiatives (and, later on, to the associated infrastructure investments). This module envisions, in addition to ongoing, informal consultations, 3-4 workshops that will involve all key stakeholders, including government agencies, private sector players of companies of different sizes (large, medium and small), representation from all major sectors, industry associations and other experts and academics. The workshops should serve the purpose of both information sharing (from the City Economic Competitiveness Review) and getting feedback. Timeline and phases: Proposed workshops and touch points (including timeline) include:
During Phase 1: initial work shop to discuss project setup, objective and vision sharing, collecting top hypothesis on challenges faced and solutions (in terms of controllable local decisions)
During Phase 2: work shop to discuss initial results from the City Economic Competitiveness Review, including comparison to peers; seeking input and agreement on sector prioritization. In addition, methodology and approach for remaining work can be shared and feedback sought
During Phase 3: After the expanded version of the City Economic Competitiveness Review has been finalized, this workshop is the major event that discusses results,

34
implications, city’s plans going forward and gets feedback from players. Subsequent formal periodic PPD program will be established.
Component 4: City initiatives and dashboard Description: This component represents in effect the culmination and combination of the first three components. The output of this component puts the insights and recommendations into practice in the form of policy decisions and other initiatives that are agreed upon and an implementation plan to execute the initiatives. The proposed dashboard is a tool to achieve these objectives by bringing the critical information together, while the content of the actual policy decisions and initiatives will of course be customized to each city. Eventually, it is expected that the City Planning Lab will help prioritize and structure the investment projects for the city. The dashboard will have three sections:
city overall economic indicators;
city top sectors indicators;
city economic competitiveness initiatives scorecard While the final policy formulation itself is an output that will be developed during Phase 3, this component offers the opportunity to demonstrate what the City Economic Competitiveness module can do from the very beginning. During Phase 1, case studies of successful cities can be discussed with stakeholders to illustrate what might be possible and to motivate the stakeholders’ further engagement. During phases 2 and 3, the development, discussion and finalization of policy options are a culmination of the work done as part of the analysis, capacity building and dialogue. The dashboard itself will be generated starting during Phase 3 and periodically by CPL thereafter. There will be formal setting (perhaps a quarterly steering committee review) where the Mayor of the city will review the dashboard with all relevant stakeholders to take stock of progress and make important decisions. This could be combined with review of other modules of the P3N Methodology: For city wide economic indicators and sector specific indicators, we will leverage Bank’s deep experience in helping cities and creating Mayor’s dashboards along with deep consultation with all stakeholders. For the third aspect on initiatives, World Bank has significant experience in design and delivery of project monitoring and evaluation (M&E) framework. Typically, the framework includes metrics at input, output, outcome and impact level. Timeline and phases: While some discussion of case studies will take part in Phase 1, the work of this component will start in earnest during Phase 2 and intensify during Phase 3.

35
Table 3. Example of Analysis: Ratings of Indonesian Cities on Economic Performance
(2000 – 2010)
Rank Real GRDP 2010 (IDR Tril)
Population 2010 (Mil)
GRDP/capita 2010
(IDR Mil)
Real GRDP growth (% p.a)
Population growth (% p.a)
GDRGP/cap growth (% p.a)
Jobs 2010 (Mil)
1 Jakarta (JKT) 396 JKT 9.6 JKT 41 BDG 16.1 BDG 8.1 MDN 9.3 JKT 4.3
2 Surabaya (SBY) 86 SBY 2.8 SBY 32 MDN 9.1 BTM 8.0 BDG 7.4 SBY 1.2
3 Medan (MDN) 36 BDG 2.4 BTM 30 SBY 6.5 DPS 4.2 SBY 5.9 BDG 1.0
4 Bandung (BDG) 32 MDN 2.1 MDN 17 DPS 6.0 BGR 2.4 JKT 4.2 MDN 0.8
5 Batam (BTM) 28 SMG 1.6 SMG 14 BTM 5.8 JKT 1.4 MKS 4.1 SMG 0.7
6 Semarang (SMG) 21 PLB 1.5 BDG 13 JKT 5.7 PLB 1.1 SMG 3.3 PLB 0.5
7 Palembang (PLB) 18 MKS 1.3 MKS 12 BGR 5.6 MKS 0.9 BGR 3.1 MKS 0.4
8 Makassar (MKS) 16 BGR 1.0 PLB 11 MKS 5.1 SBY 0.5 PLB 2.1 BGR 0.4
9 Denpasar (DPS) 6 BTM 0.9 DPS 7 PLB 3.3 MDN -0.2 DPS 1.7 BTM 0.4
10 Bogor (BGR) 5 DPS 0.8 BGR 5 SMG 1.2 SMG -2.0 BTM -2.0 DPS 0.4
Source: Team’s analysis from BPS data (various years)
Figure 5. Methodology Illustration: Export Performance Tool
An analysis of Indonesian cities reveals wide variation in economic performance. A more nuanced story of Indonesian growth over the last decade (2000 – 2010)
- Palembang real GRDP grew 3.3% p.a (lower than national average) driven one third by population growth and two third by productivity growth
- Denpasar real GRDP grew 6%, but most of it came from population growth
(4.2% p.a) with productivity growth declining (1.7% p.a)

36
Figure 6. Methodology Illustration: Value Chain Mapping Tool
Figure 7. Methodology Illustration: Cost Structure Analysis Tool

37
3.4 RISKS AND MITIGATION The project has a few key risks which have been highlighted in the table below, along with mitigation measures.
Table 4. Risks and Mitigation of Economic Competitiveness Module
Key Risks Potential Mitigation
The data for comprehensive analysis does not exist (i.e. quality of analysis is limited due to data gaps)
Creative combination of different data sources will seek to quantify any remaining data gaps and the resulting uncertainty in the analyses
The data exists but is not delivered, due to coordination failures
Getting a client owner, possibly at MoF or MPW, to act as influential coordinator between agencies
The data is of poor quality Data quality tests underway and design of project contingent on agreement on data quality
Delays or failure to adequately staff the CPL with right talent
Availability of CPL physical space and staff commitment to be used as an engagement criteria with clients
Project monitoring and governance risk (e.g. Mayor’s dashboard is not used in practice)
Bank will insist on formal institutional arrangements to ensure project monitoring discipline
3.5 OUTPUTS As indicated above, the following outputs will be produced as part of the City Economic Competitiveness Module: i. City economic competitiveness review
ii. City economic planning and decision support capacity building
iii. 2-4 Workshops for public-private dialogues
iv. City economic competitiveness initiative roll out and monitoring dashboard
3.6 TEAM In addition to the regular staff of the City Planning Lab, the expected composition of the technical assistance team specific to this activity is as follows: (i) Senior Economist, team leader, (ii) Finance and PSD Specialist, (iii) Economist, (iv) Competitive Industries Practice Specialist

38
3.7 RESOURCE ALLOCATION AND TIMELINE Significant emphasis is being put on design and implementation rather than data analysis. Approximately two-third of cost is concentrated for travel and on the ground work, while a third is for pre and post mission desk based analytics. Implementation of the module emphasizes using local expertise complemented with the World Bank’s international knowledge and experience. The module envisages 8 week-long missions to the two cities. To maintain the momentum and continue to build the needed relationships, as well as to provide capacity building on the competitiveness module to the city planners in the City Planning Lab, a local consultant will be hired to be the person on the ground in both cities.
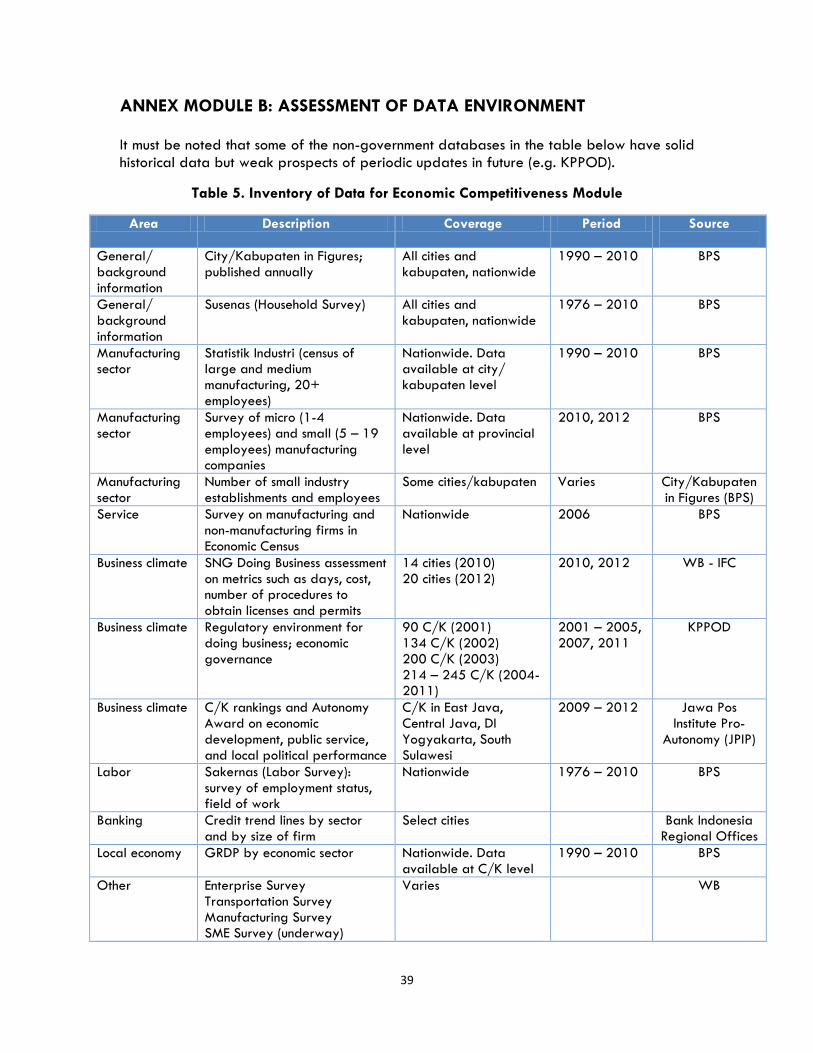
39
ANNEX MODULE B: ASSESSMENT OF DATA ENVIRONMENT It must be noted that some of the non-government databases in the table below have solid
historical data but weak prospects of periodic updates in future (e.g. KPPOD).
Table 5. Inventory of Data for Economic Competitiveness Module
Area Description Coverage Period Source
General/ background information
City/Kabupaten in Figures; published annually
All cities and kabupaten, nationwide
1990 – 2010 BPS
General/ background information
Susenas (Household Survey) All cities and kabupaten, nationwide
1976 – 2010 BPS
Manufacturing sector
Statistik Industri (census of large and medium manufacturing, 20+ employees)
Nationwide. Data available at city/ kabupaten level
1990 – 2010 BPS
Manufacturing sector
Survey of micro (1-4 employees) and small (5 – 19 employees) manufacturing companies
Nationwide. Data available at provincial level
2010, 2012 BPS
Manufacturing sector
Number of small industry establishments and employees
Some cities/kabupaten Varies City/Kabupaten in Figures (BPS)
Service Survey on manufacturing and non-manufacturing firms in Economic Census
Nationwide 2006 BPS
Business climate SNG Doing Business assessment on metrics such as days, cost, number of procedures to obtain licenses and permits
14 cities (2010) 20 cities (2012)
2010, 2012 WB - IFC
Business climate Regulatory environment for doing business; economic governance
90 C/K (2001) 134 C/K (2002) 200 C/K (2003) 214 – 245 C/K (2004-2011)
2001 – 2005, 2007, 2011
KPPOD
Business climate C/K rankings and Autonomy Award on economic development, public service, and local political performance
C/K in East Java, Central Java, DI Yogyakarta, South Sulawesi
2009 – 2012 Jawa Pos Institute Pro-
Autonomy (JPIP)
Labor Sakernas (Labor Survey): survey of employment status, field of work
Nationwide 1976 – 2010 BPS
Banking Credit trend lines by sector and by size of firm
Select cities Bank Indonesia Regional Offices
Local economy GRDP by economic sector Nationwide. Data available at C/K level
1990 – 2010 BPS
Other Enterprise Survey Transportation Survey Manufacturing Survey SME Survey (underway)
Varies WB

40
41
SECTOR MODULE C: SLUM ANALYTICS AND MANAGEMENT
SYSTEMS

42

43
4.1 BACKGROUND Like many rapidly urbanizing countries, Indonesia has seen the growth of informal settlements in many of its cities. The Ministry of Public Work estimates that a quarter of the urban population (roughly 25 million people) lives in slums and informal settlements. While the growth of slums is an indicator of the economic draw of urban areas, it is also a sign of inefficient land and housing markets, and unequal access to urban services. Addressing existing slums is critical to alleviating urban inequality, while prevention of future slum growth and protection of land rights is essential to attracting investment to cities. Some Indonesian cities have taken innovative and progressive approaches to slum upgrading, and through policies and small investments have managed to upgrade slums into viable neighborhoods for poor urban communities. In-situ upgrading of slums is not always possible, however, since they are often located on risk-prone or contested land. Most cities are forced to try to address the issue of slums in the absence of vital information. Cities often have no systematic way to answer basic questions about slums, such as: i. What are the primary causes of slum formation in the city?
ii. How do slum dwellers make location choices?
iii. How have recent government policies or actions (e.g. housing policies, infrastructure
and service provision, slum upgrading, formalization, land sales, etc.) affected slum residents and the formation of new slums?
iv. How does a slum household’s intention to invest in or otherwise upgrade their dwelling correlate with other factors, such as tenure security, income, duration of residence, etc.?
v. What determines prices/ rents in slums, e.g. tenure security, distance from various amenities, etc.?
vi. How can slum areas be classified in terms of their origins, characteristics, or expectations of future growth, in order to devise the most appropriate government responses?
In order to answer these and other questions, slum analytics and management systems will be a key strategic activity of the City Planning Lab (CPL). The slum information database produced as part of this work will be an important input into decisions on investments in basic infrastructure and services, helping devise appropriate interventions and target them to areas of greatest need. It will also help cities devise more effective slum policies and regulations. Performing this activity as part of the broader City Planning Lab initiative will take advantage of several synergies, as the findings will both feed into and benefit from the analytical work in parallel modules. The findings on distribution of slums will support the work on spatial growth analytics, which in turn will help provide spatial context to the growth of slums. It will also be a strong indicator of where the demand for affordable
44
land is likely to be highest, which will add value to the land market analytics module. The slum analytics and land market analytics together can help the city identify and proactivity respond to high demand for land before new slums emerge. The module on disaster and climate risk resilience will help identify vulnerable slums. Not only will these synergies provide efficiency through shared data and analysis, they will also ensure that the analysis done by the CPL as a whole puts special emphasis on the most disadvantaged populations.
4.2 OBJECTIVES The main objective of this module is to assist partner cities in improving the management of slum areas, using detailed information and mapping of slum areas and vacant lands. Technical assistance provided under the module will consist of three components with specific objective as follows: Component 1: Slum mapping and information systems: The objective of this component is to help the city develop and maintain a geo-referenced database of slums, using satellite imagery and other data sources to provide an overview of the slum situation, as well as a survey in selected areas recording attributes such as legal status, year of construction, quality of construction, disaster risk, price/rent, access to urban services, access to transportation networks, etc. This database would be managed and maintained within the City Planning Lab, and would allow slum-related policies to be informed by an empirical understanding of the needs of slum communities. Component 2: Slum management framework: The objective of this component is to use the analysis emerging from the City Planning Lab’s database developed in component 1 to formulate a medium-term program for a citywide strategy and investment program targeting existing slum areas. This includes identifying slum areas that are suitable for in-situ upgrading, and those which are vulnerable to disaster risk and where resettlement may be required. This slum management framework would outline strategies for community participation, institutional capacity building, and investments. Component 3: Managing new slum growth: The objective of this component is to work with city leaders to develop strategies to prevent growth of new slums in areas identified as vulnerable to disaster risk or planned for public use.
4.3 SCOPE OF ACTIVITIES In keeping with the other CPL modules, the activities in this module will be conducted in three phases of six months each. Component 1 will be completed at the end of phase 1. Components 2 and 3 will begin at the start of phase 2 and will carry over into phase 3 (see timeline below). The duration of the complete module is 18 months.

45
Component 1: Slum Mapping and Information Systems This component will be divided into three stages, as follows: 1A: Creation of a basic Slum Information Database This stage will involve the creation of a basic version of the GIS database on slums (a part of the CPL’s broader database) populating it with all information on slums that can be derived from satellite imagery and field visits. The goal will be to develop a preliminary picture of the situation in the city with regard to slums. The tasks for this component in this stage would include:
i. Gathering existing spatial data on the location of slums in the city from government
and other sources; ii. Converting the above data into standard, non-proprietary formats (e.g. shape files,
KML files), digitizing paper maps where necessary, and recording the associated metadata;
iii. Using satellite imagery (e.g. Google Earth) to identify possible slum areas in the city; iv. Conducting field visits to these areas for verification (with photographic documentation
of slum areas during visits); v. Using data collected from all the preceding steps to create a GIS map of slums in the
city. Each slum area will be represented as a polygon depicting the boundaries of the slum area, and associated with a table of attributes reflecting all the available data for each slum; and
vi. Uploading all unclassified data to the local government website in the form of PDFs and GIS files, as well as to an open source web-based mapping service (e.g. OpenStreetMap).
1B: Additional secondary data collection This stage will involve gathering additional secondary data that can help develop a more complete picture of the characteristics of slums and slum households, and inputting this data into the Slum Information Database. Tasks during this phase will include:
i. Gathering and inputting into the database, in the standard format, all available data
on demographic and socio-economic characteristics of slum and non-slum households, citywide land ownership, zoning, disaster risk, transportation infrastructure and routes, utilities (water, sanitation, drainage), and other relevant data;
ii. Adding all unclassified data collected during this phase to the open source web-based mapping service used in component 1A.
1C: Primary data collection and analysis This stage will involve conducting household surveys to collect primary data in selected slum areas, to further develop the database and contribute to a more robust understanding of the slum areas. Tasks during this phase will include:

46
i. Designing a methodology and questionnaire for a household survey, covering a significant number of random households in selected, high-priority slum areas. (See Annex section for an indicative list of the kinds of household attributes that may be included.)
ii. Gathering feedback on the survey design and site selection from local government counterparts and external stakeholders and refining it accordingly;
iii. Conducting the household survey, while also recording constraints faced while conducting the survey (e.g. households inaccessible, households declining to respond, gender/age bias in respondents, etc.);
iv. Adding all information to the Slum Information Database, with metadata; v. Analyzing the data obtained from all phases, through regression analysis and other
means, in order to answer the questions listed in the ‘Rationale’ section above and others.
Component 2: Slum Management Framework This component aims to formulate a medium-term program for a citywide strategy and investment program targeting existing slum areas. Activities in this component would include: i. Identifying slum areas that are suitable for in-situ upgrading, and those which are
vulnerable to disaster risk and where resettlement may be required.
ii. Creating the typology of existing slum areas based on its characteristics such as type of dwelling, dwellers, tenure status, land ownership, etc., identified and analyzed in Component 1 above.
iii. Developing strategies based on the typology of area, which includes site analysis, building and urban design, land management, financial assessment, and temporary shelter. This would utilize the phase 1 outputs of the other CPL modules.
iv. Outlining strategies for community participation, institutional capacity building, and investments for pilot sites, selected based on discussion with the city government.
v. Developing a program of future activities to implement the selected strategies, in coordination with related government agencies.
An example of output produced by similar activity is HABISP, a sophisticated housing information system in City of Sao Paulo, Brazil. The system features maps with data on slums and other low income housing.
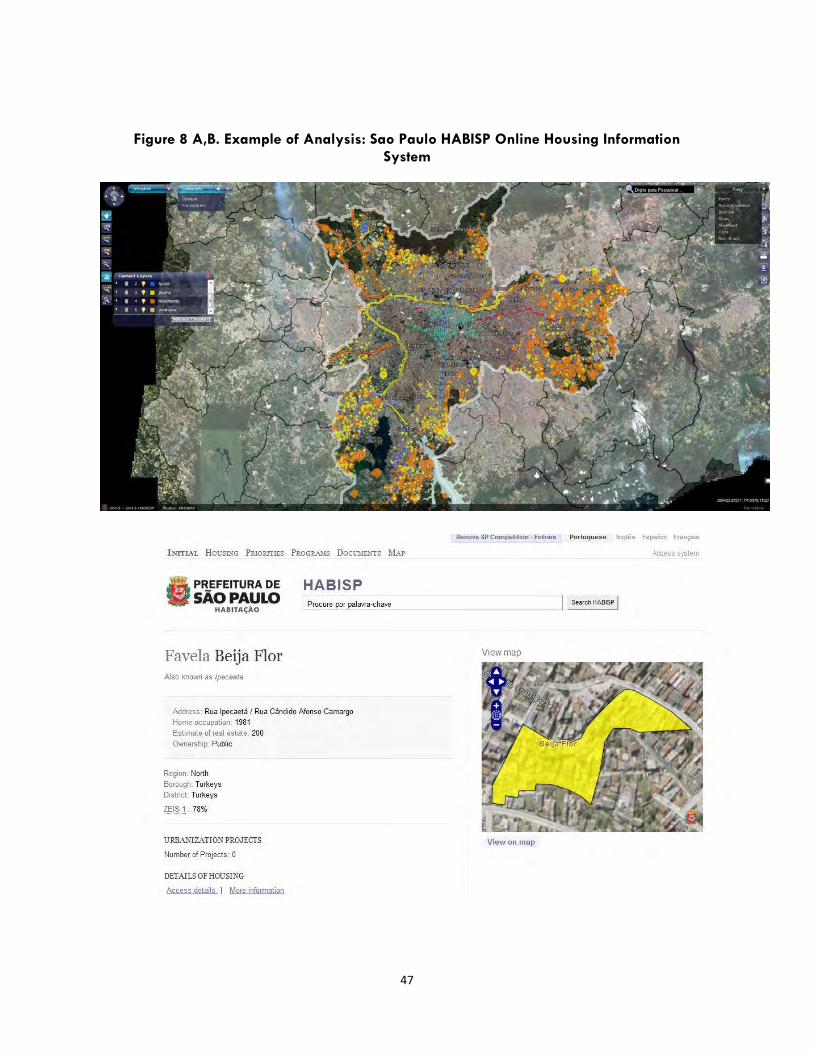
47
Figure 8 A,B. Example of Analysis: Sao Paulo HABISP Online Housing Information
System

48
Component 3: Managing New Slum Growth This component aims to develop strategies to prevent the formation of new slums in areas of high risk or those reserved for public use. Activities in this component will include:
i. Together with the team working on the disaster risk module of the CPL, identifying all
currently vacant land in the city that is: (a) prone to disaster risk (using existing data); or (b) identified in the current city spatial plan as usable for public purposes, documenting the ownership status of all such land (private or public, and if public, which agency), and inputting this data into the Slum Information Database described above;
ii. Developing an understanding of the process by which land is encroached by slums in the city, using case studies or other means;
iii. On the basis of this understanding, making recommendations for strategies to safeguard the land identified in task (i) above. These recommendations should address:
a) reforms to regulations; b) reforms to enforcement procedures; c) capacity building of relevant institutions; d) reforms to the process of land use planning; e) public awareness strategies; and f) community-based prevention and participation strategies.
iv. Working with local government agencies to help them implement the recommended
strategies.
Workshops
In order to ensure that the technical assistance activity is useful to the city at every stage, the team will conduct workshops in order to share the results of the work done so far, as well as to receive guidance from government leaders on future directions.
i. A kick-off workshop will be held in order to discuss the work ahead and establish
working procedures;
ii. An interim workshop will be held in month 7, to share the findings and recommendations of all activities completed up to that point, including all of component 1, and to develop plans for the collaboration with the counterparts for the remaining duration.
iii. A wrap-up workshop will be held at the completion of all activities, to discuss plans for
government agencies and/or donors to carry on the work, and reflect on lessons learned.
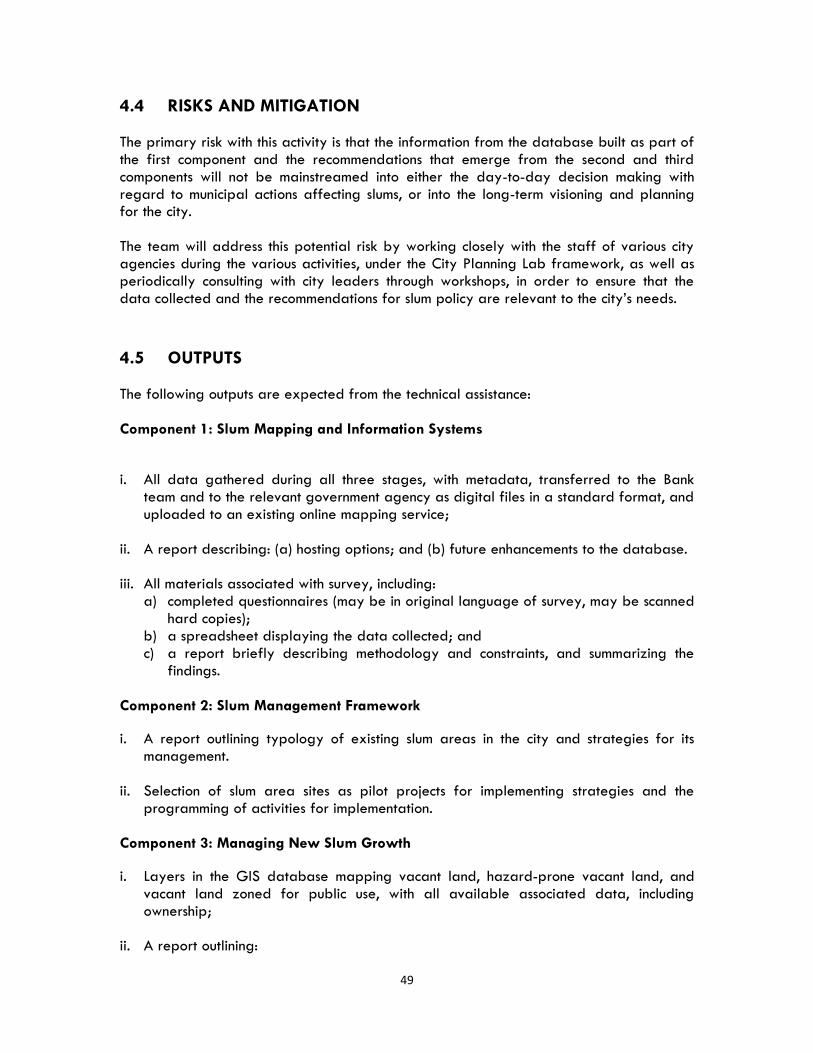
49
4.4 RISKS AND MITIGATION The primary risk with this activity is that the information from the database built as part of the first component and the recommendations that emerge from the second and third components will not be mainstreamed into either the day-to-day decision making with regard to municipal actions affecting slums, or into the long-term visioning and planning for the city. The team will address this potential risk by working closely with the staff of various city agencies during the various activities, under the City Planning Lab framework, as well as periodically consulting with city leaders through workshops, in order to ensure that the data collected and the recommendations for slum policy are relevant to the city’s needs.
4.5 OUTPUTS The following outputs are expected from the technical assistance:
Component 1: Slum Mapping and Information Systems
i. All data gathered during all three stages, with metadata, transferred to the Bank
team and to the relevant government agency as digital files in a standard format, and uploaded to an existing online mapping service;
ii. A report describing: (a) hosting options; and (b) future enhancements to the database.
iii. All materials associated with survey, including: a) completed questionnaires (may be in original language of survey, may be scanned
hard copies); b) a spreadsheet displaying the data collected; and c) a report briefly describing methodology and constraints, and summarizing the
findings.
Component 2: Slum Management Framework
i. A report outlining typology of existing slum areas in the city and strategies for its management.
ii. Selection of slum area sites as pilot projects for implementing strategies and the programming of activities for implementation.
Component 3: Managing New Slum Growth
i. Layers in the GIS database mapping vacant land, hazard-prone vacant land, and vacant land zoned for public use, with all available associated data, including ownership;
ii. A report outlining:
50
a) the process of slum formation, as observed through case studies; and b) recommendations for strategies for preventing slum growth in disaster-prone or
strategic areas, as described earlier.
4.6 TEAM In addition to the regular staff of the City Planning Lab, the expected composition of the technical assistance team specific to this activity is as follows: i. Urban Planner as Team Leader ii. Social/Low-income Housing Specialist iii. Economist iv. Community Development Specialist v. GIS Specialist vi. Urban Design Specialist vii. Governance/Institutional Specialist
4.7 TIMELINE This module will be carried out in three phases of six months each.
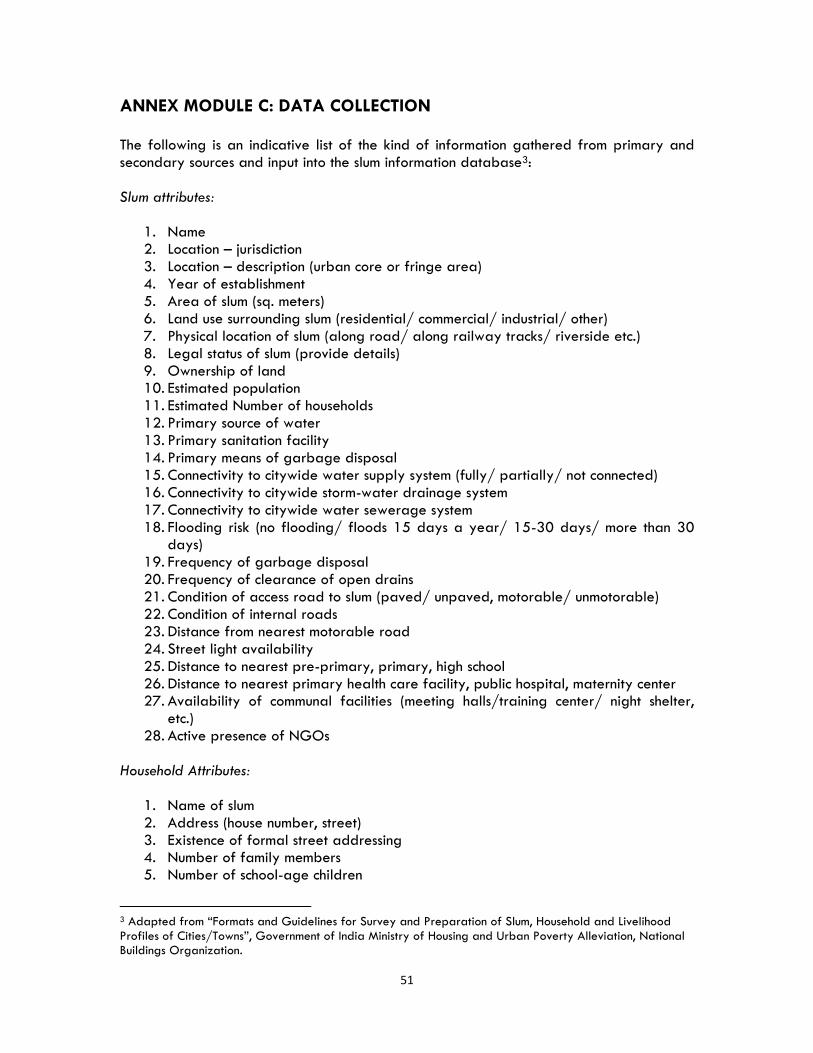
51
ANNEX MODULE C: DATA COLLECTION The following is an indicative list of the kind of information gathered from primary and secondary sources and input into the slum information database3: Slum attributes:
1. Name 2. Location – jurisdiction 3. Location – description (urban core or fringe area) 4. Year of establishment 5. Area of slum (sq. meters) 6. Land use surrounding slum (residential/ commercial/ industrial/ other) 7. Physical location of slum (along road/ along railway tracks/ riverside etc.) 8. Legal status of slum (provide details) 9. Ownership of land 10. Estimated population 11. Estimated Number of households 12. Primary source of water 13. Primary sanitation facility 14. Primary means of garbage disposal 15. Connectivity to citywide water supply system (fully/ partially/ not connected) 16. Connectivity to citywide storm-water drainage system 17. Connectivity to citywide water sewerage system 18. Flooding risk (no flooding/ floods 15 days a year/ 15-30 days/ more than 30
days) 19. Frequency of garbage disposal 20. Frequency of clearance of open drains 21. Condition of access road to slum (paved/ unpaved, motorable/ unmotorable) 22. Condition of internal roads 23. Distance from nearest motorable road 24. Street light availability 25. Distance to nearest pre-primary, primary, high school 26. Distance to nearest primary health care facility, public hospital, maternity center 27. Availability of communal facilities (meeting halls/training center/ night shelter,
etc.) 28. Active presence of NGOs
Household Attributes:
1. Name of slum 2. Address (house number, street) 3. Existence of formal street addressing 4. Number of family members 5. Number of school-age children
3 Adapted from “Formats and Guidelines for Survey and Preparation of Slum, Household and Livelihood Profiles of Cities/Towns”, Government of India Ministry of Housing and Urban Poverty Alleviation, National Buildings Organization.

52
6. Number of disabled people 7. Land tenure status 8. Type of structure (permanent/ temporary) 9. Construction material used in floor 10. Construction material used in roof 11. Source of light 12. Source of cooking fuel 13. Source of drinking water 14. If piped water, duration of availability during the day 15. If outside source of water, distance from dwelling 16. Existence of toilet facility 17. Bathroom facility 18. Condition of road in front of house 19. Vehicle ownership (none/ bicycle/ motorcycle/ care/ truck) 20. Number of years in current dwelling 21. Migrated from (urban/ rural) 22. Reason for migration 23. Migration type (seasonal/ permanent) 24. Number of earning adult family members 25. Number of earning non-adult family members 26. Number of non-family adult members (specify if renter) 27. Average monthly income of household 28. Average monthly expenditure of household 29. Debt outstanding as on date of survey 30. Educational qualifications/ training of adult members 31. Employment status (self-employed/ salaried/ casual labor/ others) 32. Place of work (within/ outside slum) 33. Length of daily commute 34. Mode of daily commute 35. Monthly earning 36. Source of income 37. Income-generating activity within dwelling unit (home-based industry/ commerce) 38. If unemployed, main reason for unemployment 39. Acquisition of dwelling unit (self-built/ bought/ rented) 40. Price / rent of dwelling unit 41. Income from renting space in dwelling unit 42. Intention to invest/ upgrade dwelling 43. Intention to move away 44. Major constraints to formal housing
Business attributes
1. Type of business 2. Average monthly/ annual earnings 3. Seasonal/ regular 4. Number of household members employed 5. Number of hired employees 6. Resource needs of business (water/ power) 7. Waste produced by business

53
8. Means of waste disposal 9. Spatial needs of business (must be easily accessible to public, e.g. in a market
place/ space needed for production or processing/ other) 10. Intention to expand (none/ more employees/ more space)

54

55
SECTOR MODULE D: DISASTER AND CLIMATE RESILIENT
PLANNING ANALYTICS

56
57
5.1 BACKGROUND Indonesia’s rapidly growing urban population is particularly vulnerable to natural disasters. More than 110 million people in roughly 60 cities, mostly located in coastal areas are exposed to hazards including tsunamis, earthquakes, flooding and impacts of climate change. With nearly 70 percent of Indonesia’s population expected to live in urban areas by 2025, coupled with the increasing wealth of the population, Indonesian cities are increasingly vulnerable to both large-scale and persistent natural hazard events. The limited capacity of urban centers to absorb new residents because of lack of fundamental infrastructure investments has also resulted in the creation of many unplanned settlements. Inadequate zoning and lax enforcement led to the occupation of many hazard-prone locations. The Ministry of Public Work estimates that a quarter of the urban population (roughly 25 million people) lives in slums and informal settlements. Indonesia’s unique geological setting and the complexity of its population settlements has generally led to more disasters causing greater damage (loss of life, economic impacts etc). Although hazardous natural events cannot be prevented, the severity of their consequences can be minimized or even avoided through disaster and climate sensitive urban development coupled with better community preparedness and enhanced coping capacity to achieve greater city/urban resilience. Climate change and variability in the near and long term can only increase the level of risk. In addition to higher intensity meteorological events such as floods and droughts, the climate also influences food production patterns and outputs, creating additional uncertainty in the event of a disaster that further exacerbates its impact. While there is growing awareness of the need to address the impact of climate variability and change, more accurate identification of vulnerability and evidence-based response and adaptation measures must be developed. Cities also often lack the fiscal capacity to initiate programs that require sophisticated technical expertise and dedicated investment. In preparation for addressing topic, World Bank team has engaged in disaster and climate risk reviews in six cities. The purpose was to take stock of the baseline information on climate and disaster risks and identify critical gaps in addressing the cities’ risk sensitive planning and investment needs thereby setting the priorities for this proposed module on disaster and climate resilient planning analytics. The current urban planning practice in Indonesia still consider hazards and risks from disaster and climate change only as constraining parameters in the selection of sites suitable for development. Where the risks originate and how existing growth trends and investment will impact or be impacted by the pattern of disasters have not been thoroughly analyzed during the planning process. As part of the objective of Metropolitan and Urban Development Program (P3N) to establish technical capacity to measure, analyze and respond to urban development pressures in evidence-based and timely manner, a Disaster and Climate Resilient Planning Module is needed to address the following challenges:
58
The gap in high-resolution hazard and exposure information required for a detailed city-level planning;
The absence of policy instruments and practical guidelines to introduce disaster and climate resilient practices into detailed spatial plans and city level infrastructure investments decisions.
The lack of customized geospatial analytical tools to conduct risk analysis that can easily integrate various data sources and facilitate the implementation of risk sensitive planning;
Addressing these issues will be a key strategic activity of the City Planning Lab (CPL) to take advantage of several synergies, as the findings will both feed into and benefit from the analytical work in parallel modules. The Spatial Growth Analytics and Slum Analytics and Management Systems modules provide data that when combined with the climate and disaster risk analytics can provide valuable insights into the largest potential threats to the city’s future growth.
5.2 OBJECTIVES The primary objective of the Disaster and Climate Resilient Planning Module is to provide essential risk information and analytics to measure, analyze and identify options to address urban development pressures from disaster and climate related hazards. The overarching objective of the work across the three components will be building the capacity of local agencies in undertaking thorough and integrated but practical analysis incorporating disaster and climate risk management options into city investment program. The methods and approaches used during these activities may be adopted and continued by local agencies beyond the timeframe of this engagement and become standard practice in the city’s approach to resilient urban management inclusive of land use and infrastructure planning. The specific goals that will be fulfilled include: Component 1: Filling risk information and data gaps This component will compile or develop baseline hazard and asset exposure data as essential inputs for climate and disaster risk analyses that inform planning and investment decisions. Priority areas identified in the climate and disaster risk review through area-focused and risk-based approach as needing higher resolution data will be addressed developed by combining several potential information sources. Expert sources at technical agencies or universities, as well as participatory methods to engage the community and civil society are critical to developing robust hazard and exposure data. There will be an element focused on improved data sharing and management. In coordination with the core CPL, this will include both the platform software that can integrate with other P3N activities and the policies that can be established for city agencies in line with the guidelines set out in the National One Map Initiative of the Geospatial Information (BIG). Component 2: Establishing capacity to carry out detailed land use planning and infrastructure investment screening This component will specifically build the capacity of targeted cities to implement the three options for disaster and climate risk management through translating the preventive,
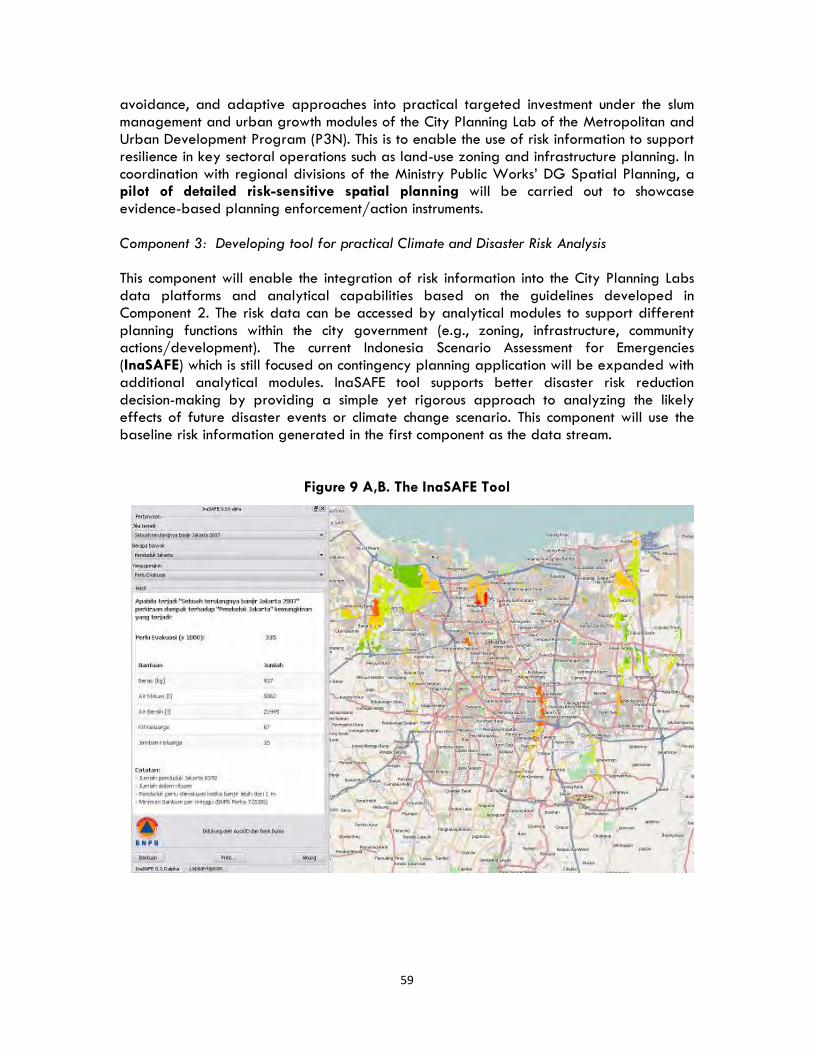
59
avoidance, and adaptive approaches into practical targeted investment under the slum management and urban growth modules of the City Planning Lab of the Metropolitan and Urban Development Program (P3N). This is to enable the use of risk information to support resilience in key sectoral operations such as land-use zoning and infrastructure planning. In coordination with regional divisions of the Ministry Public Works’ DG Spatial Planning, a pilot of detailed risk-sensitive spatial planning will be carried out to showcase evidence-based planning enforcement/action instruments. Component 3: Developing tool for practical Climate and Disaster Risk Analysis This component will enable the integration of risk information into the City Planning Labs data platforms and analytical capabilities based on the guidelines developed in Component 2. The risk data can be accessed by analytical modules to support different planning functions within the city government (e.g., zoning, infrastructure, community actions/development). The current Indonesia Scenario Assessment for Emergencies (InaSAFE) which is still focused on contingency planning application will be expanded with additional analytical modules. InaSAFE tool supports better disaster risk reduction decision-making by providing a simple yet rigorous approach to analyzing the likely effects of future disaster events or climate change scenario. This component will use the baseline risk information generated in the first component as the data stream.
Figure 9 A,B. The InaSAFE Tool

60
5.3 SCOPE OF ACTIVITIES The activities in this module will be conducted over a span of 18 months split into three month increments for initial planning purposes. Component 1: Baseline Risk Information and Participatory Mapping This component will be divided into three sub components, as follows: 1A. Baseline information on hazards This sub-component will involve the creation of a basic version of the GIS database, and populating it with all information on key hazards. National-level agencies such as BNPB, Badan Geologi, and BMKG as well as Universities are producing highly technical, scientific information on hazards and risk. However, with improved coordination and capacity development, cities can take better advantage of existing information and be aware of gaps and need to invest in better data to support local level resilience activities. New hazard information needs will be identified during phase 1 of the risk review. For example, if a city is planning micro drainage investments, ideally there needs to be a detailed flood hazard model to develop risk-sensitive design standards as well as the necessary micro zoning in the surrounding areas. The tasks for this component in this phase would include:

61
i. Gather existing spatial data on hazards affecting the city from government and
other sources identified in the risk review; Convert the above data into standard, non-proprietary formats (e.g. shapefiles, KML files), digitizing paper maps if necessary, and recording the associated metadata;
ii. Develop new scenario or probabilistic hazard data based on the specific needs defined in scoping phase;
iii. Confirm that all hazard data is formatted in InaSAFE- compatible files; iv. Determine data sustainability issues including methods for updating, guidelines for
licensing and official usage. This activity would be coordinated with the core CPL components.
1B. Participatory mapping to develop baseline administrative boundaries, public asset inventory of critical infrastructure, and past hazard event or hazard prone data. This sub-component will involve gathering information to create a GIS enabled database of Kelurahan and RT-RW (ward/neighborhood) boundaries, public assets including critical infrastructure, and detailed GIS data of past hazard events. The methodology will follow BIG’s draft Standard Operating Procedures developed under the Participatory One Map Initiative (POMI). Tasks during this phase will include: i. Evaluate the resolution of freely available satellite imagery through OpenStreetMap
platform; ii. Establish working group of technical stakeholders for the participatory mapping,
provide training for group to learn OpenStreetMap tools and platform; iii. Gather existing spatial data on RW-RT, public assets from government and other
sources, perform basic validation and/or conversion into standardized GIS format; iv. Organize community workshop with OpenStreetMap training to gathering
information on critical infrastructure for baseline data; v. Collect data on past hazards to develop maps of hazard prone areas at the RW-RT
level; vi. Conduct quality assurance and validation of each data set. 1C. Institutional data management and sharing It is necessary to establish good protocols for data sharing between government stakeholders and with the broader community of civil society, private sector. i. Workshop with key stakeholders to review existing data sharing process and to
present options for implementing; ii. Customization of data sharing agreements based on workshop feedback.
Component 2: Resilient Land Use Planning and Infrastructure Investment Guidelines The risk-based and area focused land use planning component aims to: i) identify and mitigate the root cause of disaster risks embedded in existing land development practices through regulated use of land in hazard-prone areas and building codes, ii) promote controlled urban growth without generating new risks, ‘building back better’ through

62
rebuilding and upgrading infrastructure using hazard-resistant construction in accordance with a comprehensive plan. In close coordination with an operationalized risk-based land use planning mechanism supported by the Ministry Public Work’s Directorate General of Spatial Planning, cities can be supported in make detailed spatial plan as the basis for locational decision of investments that have the primary purpose of risk reductions such as urban drainage and flood control or screening mechanisms that would introduce resilience criteria in infrastructure design, construction and economic development more broadly.
The activities under this component will include:
i. Dissemination of the detailed risk-sensitive spatial planning principles and guidelines and their practical implications to city operations and urban management;
ii. Visioning exercises and mentoring to catalyze a holistic analytical-based planning process informed by the data developed in Component 1 in which disaster and climate risk management serve as the norm for balancing city’s growth and community resilience (i.e., green development) for key investment in city services such as utility, transport/mobility and natural landscape and water management;
iii. Conduct participatory planning workshop targeting selected high-risk areas in the cities to present sectoral implications and options for rezoning, redevelopment and adaptive investment.. This exercise will reinforce the use of detailed spatial planning process as action instrument to ‘enforce’ the spatial plan;
iv. Develop risk-sensitive planning and investment guidelines through the translation of the vulnerability and site planning spatial analysis into detailed zoning map and its descriptive land use designation and restriction.
Component 3: Climate and Disaster Risk Analysis Tools Using the hazard and asset exposure data collected in Component 1, it will be possible to conduct a baseline risk analysis for the city. It is important that capacity be built within the CPL to easily use the results and conduct various secondary analyses related to planning and urban management. This project will leverage the InaSAFE tool which supports better disaster risk reduction decision-making by providing a simple yet rigorous approach to analyzing the likely effects of future disaster events or climate change scenarios. Under this component, this tool will be adapted and applied in support of analytics for various risk sensitive land use and infrastructure investment planning. The activities under this component will include: i. Expand user need assessment based on priorities identified in the risk review for
spatial analysis of disaster and climate risk impacts to support various city level sectoral and area-based planning;
ii. Design of user-friendly GIS functionality within the software architecture of InaSAFE that is compatible with the spatial data infrastructure of the CPL;
iii. Develop demonstration version testing of InaSAFE in the CPL to show results of baseline analysis;
iv. Customize modular tools to support integration of risk analytics into detailed spatial planning and infrastructure investment screening as defined by the guidelines in Component 2; and
v. Training and integration of the tool into the CPL’s core functions.

63
Workshops In order to ensure that the technical assistance activity is useful to the city at every stage, the team will conduct overview workshops in order to share the results of the work done so far, as well as to receive guidance from government leaders on future directions. The workshops are also important opportunities to foster partnerships between the local government leaders, CPL, Universities, and Civil Society groups. These meetings will be in addition to the participatory activities embedded within individual components.
i. A kick-off workshop will be held in order to discuss the work ahead and establish
working procedures including government leadership for the participatory mapping exercises of Component 1;
ii. An interim workshop will be held in month 7, to share the findings and recommendations of all activities completed up to that point, including all of component 1 and 2, and to develop plans for the collaboration with the counterparts for the remaining duration.
iii. A wrap-up workshop will be held at the completion of all activities, to discuss plans for
government agencies and/or donors to carry on the work, and reflect on lessons learned.
5.4 RISKS AND MITIGATION The primary risk with this activity is that the information from the database built as part of the first component, the analytics from the second and the recommendations that emerge from third components will not be mainstreamed into either the day-to-day decision making with regard to municipal actions building disaster and climate resilience, or into the long-term visioning and planning for the city. The team will address this potential risk by working closely with the staff of various city agencies during the various activities, under the City Planning Lab framework, as well as periodically consulting with city leaders through workshops, in order to ensure that the disaster and climate risk data collected and resilient planning guidelines are relevant to the city’s needs.
5.5 OUTPUTS The following outputs are expected from the technical assistance: Component 1: Baseline Risk Information and Participatory Mapping i. All data gathered during all three stages, with metadata, transferred to the Bank
team and to the relevant government agency as (a) digital files in a standard format,
64
(b) uploaded to an existing online mapping service, (c) selection of hard copy maps for key data sets professionally designed for display in city offices;
ii. Partnership agreements, data sharing between key data providers and the CPL.
Establish an extended network of technical experts to provide future advisory services on climate and disaster risk assessments.
iii. A report describing: (a) hazard modeling methodology, including resolution and limits of use for output hazard maps data, (b) strategy for the maintenance and/or updating of the data, (c) summary of the data sharing and management workshop;
iv. Materials associated with the participatory mapping exercise, including: a) Field survey templates; b) Extracted and GIS files; c) Customized training materials ; and d) A report briefly describing survey and quality assurance methodology, roster of
trained volunteers and city staff, and summarizing the findings. Component 2: Resilient Land Use Planning and Infrastructure Investment Guidelines
A report outlining:
a) the drivers of disaster and climate risk to core sectors and areas/neighborhoods; b) risk-sensitive micro zoning maps; and c) recommendations and practical roadmap for implementing the resilient landuse
and infrastructure investment guidelines.
Component 3: Climate and Disaster Risk Analysis Tools i. A report outlining the users’ needs assessment findings and design criteria for the
customization of the InaSAFE tool. ii. Users’ manual, support documentation, and detailed training materials for InaSAFE. iii. Fully deployed and bug tested installation of InaSAFE software on CPL servers.
5.6 TEAM In addition to the regular staff of the City Planning Lab, the expected composition of the technical assistance team specific to this activity is as follows: i. Disaster Risk Management Specialist as Team Leader ii. Climate and Natural Disaster Hazard Specialist x 2 iii. Community Mapping Specialist x 2 iv. GIS Specialist
5.7 TIMELINE This module will be carried out in three phases of six months each.
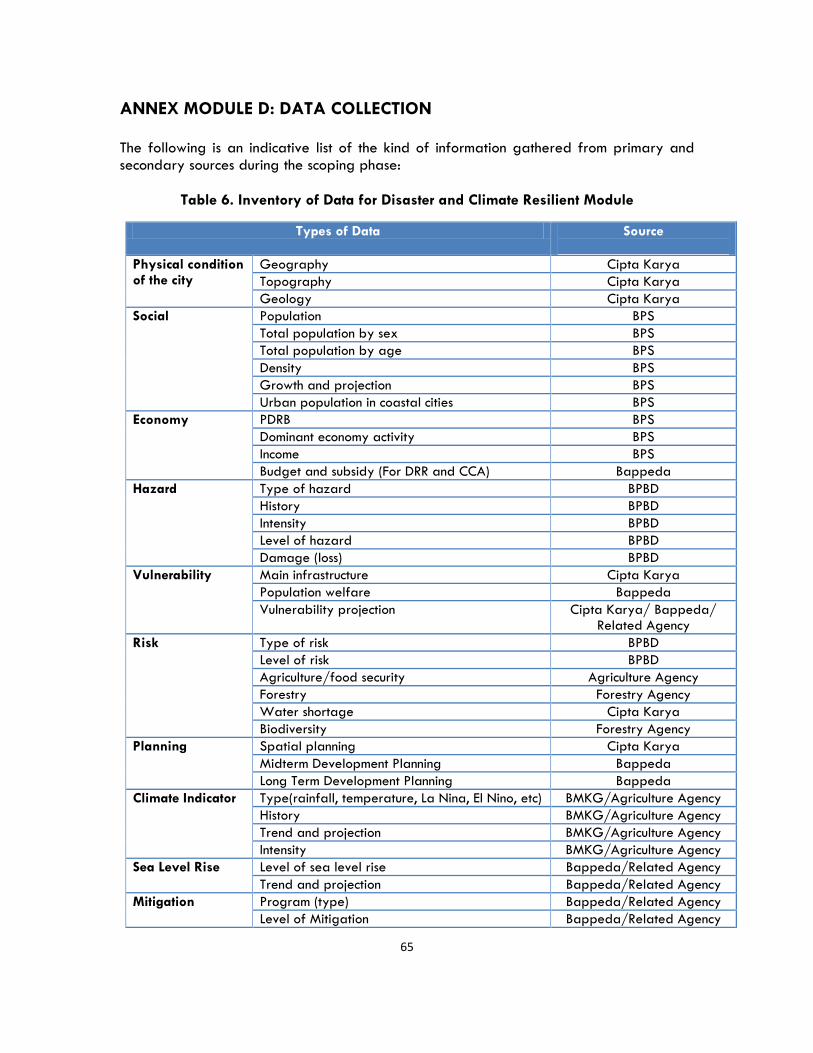
65
ANNEX MODULE D: DATA COLLECTION The following is an indicative list of the kind of information gathered from primary and secondary sources during the scoping phase:
Table 6. Inventory of Data for Disaster and Climate Resilient Module
Types of Data Source
Physical condition of the city
Geography Cipta Karya
Topography Cipta Karya
Geology Cipta Karya
Social Population BPS
Total population by sex BPS
Total population by age BPS
Density BPS
Growth and projection BPS
Urban population in coastal cities BPS
Economy PDRB BPS
Dominant economy activity BPS
Income BPS
Budget and subsidy (For DRR and CCA) Bappeda
Hazard Type of hazard BPBD
History BPBD
Intensity BPBD
Level of hazard BPBD
Damage (loss) BPBD
Vulnerability Main infrastructure Cipta Karya
Population welfare Bappeda
Vulnerability projection Cipta Karya/ Bappeda/ Related Agency
Risk Type of risk BPBD
Level of risk BPBD
Agriculture/food security Agriculture Agency
Forestry Forestry Agency
Water shortage Cipta Karya
Biodiversity Forestry Agency
Planning Spatial planning Cipta Karya
Midterm Development Planning Bappeda
Long Term Development Planning Bappeda
Climate Indicator Type(rainfall, temperature, La Nina, El Nino, etc) BMKG/Agriculture Agency
History BMKG/Agriculture Agency
Trend and projection BMKG/Agriculture Agency
Intensity BMKG/Agriculture Agency
Sea Level Rise Level of sea level rise Bappeda/Related Agency
Trend and projection Bappeda/Related Agency
Mitigation Program (type) Bappeda/Related Agency
Level of Mitigation Bappeda/Related Agency

66
Types of Data Source
Mainstreaming to other planning document Bappeda/Related Agency
Adaptation Program (type) Bappeda/Related Agency
Level of adaptation Bappeda/Related Agency
Mainstreaming to other planning document Bappeda/Related Agency
Community education Bappeda
Community preparedness Bappeda
Institution Government agency (collaboration) Bappeda, BPBD
Local NGO Bappeda, BPBD
National NGO Bappeda, BPBD
International NGO Bappeda, BPBD
Local University/research center Bappeda, BPBD
Related research document Bappeda, University

67
SECTOR MODULE E: MONITORING LAND AND REAL ESTATE
MARKETS

68
69
6.1 BACKGROUND As in many rapidly urbanizing economies, the net worth of new constructions in the real estate market of Indonesia constitutes one of the largest sectors of annual investment and contributors to the GDP. The share of the construction sector in the GDP was 10.4 percent in 2012 – approximately a 90% increase from a 5.5-percent share in 2000 (Bank Indonesia, 2013). Real estate and construction sectors are among the major drivers of economic growth, along with transportation, communication and finance sectors. Growth in the construction sector, for instance, has outpaced the total annual GDP growth between 2000 and 2012 been by a factor of 1.45 times on average (Bank Indonesia, 2013). Between 2007 and 2011, 36 to 43 percent of all annual construction occurred in real estate products (Suraji, Pribadi & Ismono, 2012). Although an accurate assessment of the total value of the real estate market in Indonesia is not available due to lack of reliable data, a rudimentary estimation based on The Wealth of Nations Dataset of the World Bank (2005) suggests that urban land and structures that occupy it constitute approximately 20 percent of Indonesia’s $4.36 trillion total wealth.4 Given its durability, this large bundle of assets forms an important part of long-term national assets in Indonesia. Given the considerable importance of the land and real estate market for the economy, Indonesia’s cities would benefit from ensuring their efficient functioning. At present, however, most medium and large-scale municipal governments in Indonesia lack the institutional capacity to monitor the performance of their land and real estate market, or assess the impact of their policies and regulatory decisions on this market. The cities are unable to forecast the rapidly increasing demand for residential, commercial and industrial land for Masterplans and land use plans, and supply consequently does not meet demand. Resilient economic growth in Indonesia cannot be achieved without informed land and real estate policies that guarantee the availability of affordable space in demanded locations for living, working as well as recreation. As land and real estate markets provide space for all economic activities, they naturally impact various sectors of the economy. An inadequate provision of residential land, for instance, may inflate housing prices everywhere and trigger an increase in informal settlements, which in turn reduce the population’s spending capacity for transportation and other vital expenditures. In the absence of an understating of how real estate and land markets function, rapidly urbanizing cities of Indonesia expand on natural resources and agricultural land even before all existing urban land and infill development sites are exploited. Furthermore, lacking reliable data and analytics on land and real estate markets, Indonesian cities are unable to foresee and prevent abrupt fluctuations and bubbles in these markets. Lacking an empirical understanding of metropolitan growth, argues David E. Dowall (1995), leads to a “blind flight” for local governments and a failure to effectively deal with rapid population change and land development. In order to address these limitations and necessities, this concept note proposes to integrate a Land and Real Estate Market Monitoring Module to the planned activities for the P3N City Planning Lab facilities in two pilot cities in Indonesia. It discusses the needs
4 The total wealth estimate includes human and natural resources.

70
and objectives for necessary land and real estate market monitoring and lay out the proposed activities. This module is envisioned to be closely integrated with CPL’s core Spatial Growth Analytics module, since the way that physical expansion and internal restructuring take place, is largely determined by and reflected in the land and real estate market. Cities grow or change internally when the supply side of the market responds to changes in demand for different land uses by a) converting peripheral non-urban land to urban use, b) changing land-use designations internally, c) adding infill development and densifying, or d) changing occupancy levels on existing land uses. All these scenarios are monitored in the proposed Spatial Growth Analytics module. The present module is also connected to the Slum Analytics and Management Systems module, which collects and analyzes data on the informal housing and commercial land uses.
6.2 OBJECTIVE The primary objective of CPL’s land and real estate market monitoring module is to enhance the resilience and efficiency of these markets through supporting evidenced-based planning, policy and investment decisions. This includes projecting future demand for land and different types of real estate products – residential, commercial, industrial, institutional – and integrating the projection into Masterplans, detailed plans and regulatory development policies. Reliable information about the projected demand will allow municipal planning agencies to make sure that enough affordable land and real estate will be supplied in desired locations, and that the agricultural to urban land use conversion along with the destruction of natural resources is not over exploited. The module will also help cities foresee and prevent potential bubbles and sudden fluctuations in the land and real estate market. This requires an understanding of how the land and real estate market performs in the context of the broader capital market, and how the real estate space and asset markets are related. The module will help local governments of the pilot cities foresee the impact of shifts in other sectors of the economy on the real estate market, and conversely predict shifts in other sectors of the economy triggered by real estate and land market changes. The module will also inform the local finance and tax agencies of the current and projected state of the land and real estate market, and of investment/revenue opportunities, which can help improve the efficiency of their mortgage plans and taxation systems respectively. CPL staff, together with infrastructure and transportation departments, will explore value capture taxation systems as potential ways of unlocking financing for much needed infrastructure improvements.
6.3 SCOPE OF ACTIVITIES Addressing the objectives above, the activities for the Land and Real Estate Market Monitoring module in the two pilot cities are proposed as follows:
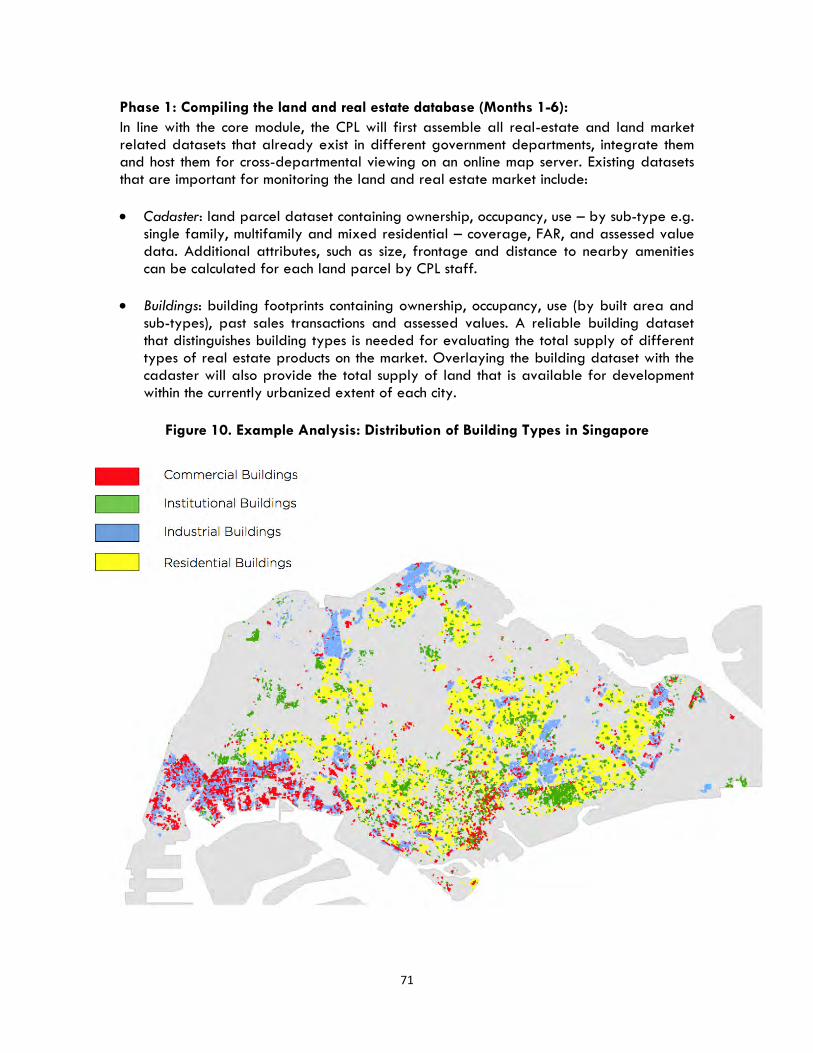
71
Phase 1: Compiling the land and real estate database (Months 1-6):
In line with the core module, the CPL will first assemble all real-estate and land market related datasets that already exist in different government departments, integrate them and host them for cross-departmental viewing on an online map server. Existing datasets that are important for monitoring the land and real estate market include:
Cadaster: land parcel dataset containing ownership, occupancy, use – by sub-type e.g. single family, multifamily and mixed residential – coverage, FAR, and assessed value data. Additional attributes, such as size, frontage and distance to nearby amenities can be calculated for each land parcel by CPL staff.
Buildings: building footprints containing ownership, occupancy, use (by built area and sub-types), past sales transactions and assessed values. A reliable building dataset that distinguishes building types is needed for evaluating the total supply of different types of real estate products on the market. Overlaying the building dataset with the cadaster will also provide the total supply of land that is available for development within the currently urbanized extent of each city.
Figure 10. Example Analysis: Distribution of Building Types in Singapore

72
Table 7. Example Dataset: Price Range of Flats Offered by Housing Development Board in Singapore (in Thousand SGD)
Town
2 Rooms 3 Rooms 4 Rooms 5 Rooms
Selling price
Selling price less
AHG/SHG5
Selling price
Selling price less
AHG/SHG
Selling price
Selling price less AHG/SHG
Selling price
Selling price less AHG/SHG
Bukit Panjang
- - 137 – 189 107 – 159 217 – 298 207 – 288 274 – 386 274 – 386
Choa Chu Kang
- - 146 – 172 116 – 142 229 - 284 219 – 274 295 – 364 295 – 364
Punggol 85 - 111 25 - 51 150 – 242 120 – 212 257 – 390 247 – 380 335 – 484 335 – 484
Sembawang 92 - 116 32 - 56 158 – 191 128 – 161 255 – 310 245 – 300 - -
Sengkang 83 - 112 23 - 52 134 – 220 104 – 190 255 – 370 215 – 360 283 – 456 283 – 456
Yishun - - 156 – 193 126 – 163 234 – 296 224 – 286 277 – 381 277 – 381
Source: Singapore Housing Development Board
Road Network: the road network is essential for performing accessibility measurements for each building and parcel. Location, or more accurately the accessibility of a location, is the main indicator of land and real estate value.
Public Transit networks: In addition to road-level accessibility, land values also depend on available transit options. All forms of public transit (e.g. bus, minibus, regional lines) can impact land and real estate values.
Points of Interest: accessibility to amenities and businesses is also known to impact land and real estate values. Proximity to commercial destinations and other desirable venues or establishments, such as parks, hospitals, or museums – can be measured on the available road and transit networks in different parts of the city.
Census and Household Survey Data: these datasets are essential for estimating the demand side of the market.
Rents and prices: Available sales and rental prices for different property types (e.g. housing, retail) and subtypes (e.g. 1-Bedroom Apartment) will be collected from the main brokerage firms in each city. If possible, then each observed transaction should also indicate how long the unit was on the market and illustrate other general characteristics of the larger building complex the unit is part of. This data may be available at address level resolution, at a zone or street-level resolution.
Upcoming developments: Information should also be collected about all real estate development projects that are currently under construction or otherwise planned to be completed. Approximate type and size of each development should be listed and an approximate date of delivery recorded. This will allow the CPL staff to account for
5 AHG: The Additional Central Provident Fund/CPF Grant, given to eligible first-timer families who are applying to buy a 2-room or bigger flat who are able to meet the eligibility conditions. SHG: The Special CPF Housing Grant, given to eligible first-timer families who are applying to buy a 2-room, 3-room or 4-room flat in a non-mature estate and who are able to meet the eligibility conditions.

73
future supply additions in estimating the needs for land and real estate products in five-year and twenty-year master plans.
Defining Analytic Zones: The first step for conducting property market analysis is to divide the cities into value zones based on their location, accessibility, uses, assessed values, and morphological properties – e.g. plot size, frontage, floor area ratio. The type of land and buildings in each zone should be as homogenous as possible. The census data and household survey data will be associated to each zone.
Supply and Demand Estimation: The data collection efforts in Phase One will be concluded by developing a supply and demand estimation for different real estate products in each zone, providing a fundamental basis for both real estate analysis and spatial planning. The supply of land includes non-developed lands that are available for development, as well as lands that can be converted to other uses or densities – e.g. conversion of single family housing to multifamily housing. The analysis will yield an estimated supply and demand overview for different real estate products in different parts of the city based on assessed values. The estimation of the demand side of the market, however, will rely on census data and household surveys (e.g. household size, and household income), as well as financing options. The latter will require collecting data from local banks and mortgage brokers. Although the assessed values may be significantly lower than the real values, they can provide an indication of spatial shifts in the market. The results will be later compared to and synthesized with the land and property market surveys in Phase Two.
Phase 2: Surveys (Months 6-12):
In the second phase of the project, CPL will carry out two surveys with local real estate brokers to compile a database of observed real estate market transactions and to develop an understanding of the segmentation of households by housing market access.
Land and Property Market Assessment: CPL will carry out a land and property market assessment survey using the methodology outlined in Dowall’s 1995 Land Market Assessment (LMA) and a simplified update from 2010. The survey involves interviewing experienced land brokers in each city to determine the prices for prototypical land parcels in different parts of the city. These property values are expected to differ from official assessment estimations, which often undervalue properties for tax reasons. One additional improvement to Dowall’s original LMA strategy is to exploit more easily accessed satellite imagery in the categorization of housing stock. Bertaud (2008) outlines this approach and draws attention to the importance of incorporating considerations for transportation infrastructure and urban growth patterns in LMA. CPL staff will be trained to carry out the survey periodically in the future and to use the results of the surveys as the basis for evidence based policy recommendations in the land and housing sectors, and to also enable infrastructure projects to be developed and financed in a more integrated manner from the outset.
Housing Market Segmentation Study: CPL will perform a household survey that assesses the mechanisms through which people access housing in different income groups. The study is expected to yield important information about actual housing demand and supply for different unit types. Disaggregating housing demand into market segments
74
(based on income or on other criteria) is an important step in understanding how the housing market functions as a whole, and in identifying the distribution and trends of demand across segments. Different segments of the population access and combine the basic inputs into housing (Land, Finance, Materials and Labor) using a range of different methods. Analyzing these different variables and streams of supply, as well as the bottlenecks they face, is a crucial step in formulating more precise and targeted Government housing programs.
These two survey activities will follow the approach outlined in the recent World Bank document, “Land and Property Market Assessment - Housing Market Segmentation Study: Existing Tools and Survey Strategy”.
Phase 3: Land and Real Estate Analytics (Months 12-18):
The analytics proposed below will form the basis for real estate and spatial planning in the pilot cities. In addition to being a platform for conducting land and real estate analytics, CPL will assist the pilot cities in incorporating the analysis into their real estate and spatial planning.
Accessibility and Land/Real Estate Value analysis: Along with the accessibility analysis in the core module, CPL will analyze the impact of accessibility to surrounding land uses and amenities on land and real estate values. This analysis will extend in the final phase to a full hedonic pricing model that takes into account all major determinants of land and real estate value.
Impact analysis – before-after comparison: CPL will evaluate the impact of key infrastructure investments on land prices – e.g. a new road or a public hospital – by comparing historic land value data before and after development. Controlling for other factors that can affect land values (e.g. city-wide shifts, inflation), the before and after comparisons offers a useful methodology for evaluating the multiplier effects of public infrastructure, which can be used for supporting investment decisions in the future.
Hedonic Pricing Model: The full hedonic land price model is an extension of two pervious analyses – impact analysis and accessibility analysis described above. When a sufficient amount of spatial information and land / real-estate market data have been collected, CPL will be able to develop spatial hedonic pricing models to analyze variations in land and real estate values. Initially, the analysis could focus on explaining the direction and magnitude of infrastructure and service amenities on land values. How do new roads, sanitation facilities, transit systems, plot sizes and demographic characteristics impact land values? How far in space do such effects reach (e.g. how far can a parcel be from a paved road to have a value impact)? Such analyses should become regular activities at the CPL, accompanying all significant public investment projects and planning initiatives. Hedonic land value analyses can also form a basis for potential value capture regulations in the future.
Projections: Using the hedonic model and examining the current trends in the land and real estate markets, CPL staff will develop evidence-based forecasts for near-term and long-term changes in land and real estate values that are likely to result from

75
foreseen developments. Additionally, using hedonic pricing models, CPL staff will work across municipal departments to investigate the financial feasibility of a pilot value capture taxation program around a planned infrastructure investment project.
6.4 RISKS AND MITIGATION The primary risk concerning the activities proposed above involve the reliability of the gathered land and real estate market data and the validity of the estimations that result from these data. In order to address this risk, we have proposed to collect the data from various sources, which will allow CPL staff to cross check the results. In Phase One, various datasets are collected from existing sources, including the assessed land and real estate values from DG Tax and BPN. In Phase Two, similar information is collected through personal surveys with experienced local real estate brokers. Even though the surveys can only cover limited parts of the city, consistent offsets and interpolations can be used to adjust all officially assessed data accordingly.
6.5 OUTPUTS The following outputs are expected from the land and real estate market module: A cadastral real-estate database. All spatial data gathered in the first phase of the project will be compiled into an online geodatabase, showing each land parcel with its associated buildings, occupants’ demographics, accessibility characteristics and valuation estimates. A land and property market assessment report. The report will present the findings on demand and supply for different real estate products (e.g. residential, commercial, industrial land) and provide the basis for evidence based policy recommendations in the land and real estate sectors. A housing segmentation study report. The report will outline the demand and supply for different types of housing units and outline discrepancies between availability and need. The segmentation study will enable policy makers to detect which demand categories (e.g. low income residents) are most burdened by inefficiencies in the market and point to solutions that can be used to address these inefficiencies. Impact Analysis Report. The report documents the observed real estate value impacts of selected infrastructure investment projects undertaken by the city. The exact choice of projects (e.g. road construction, bridge or a facility) will be made together with local planning agencies on a per-need basis. The results of the study are expected to inform what multiplier effects future investments could have and how the benefits are spatial distributed. Real Estate Financing Analysis. The study will outline existing options and conditions that are available for short term, medium term and long term real estate financing, outlining potential shortcomings and improvement opportunities for desirable financing options.

76
Hedonic Pricing Model Results. A report describing the controlled multivariate analysis results of land and real estate values in the respective cities. Hedonic price models explain variations in land and real estate values based on the spatial attributes and accessibility conditions of buildings and land parcels. These results can be used to estimate the likely market effects of future plans and infrastructure investments, forming the foundations of a sound real estate market policy.
6.6 TEAM
In addition to full time staff members listed above, additional expertise required for providing consultation to this module will include:
i. Urban Economist ii. Housing and Real Estate Planner iii. Market Analyst Specialist
6.7 TIMELINE This module will be carried out in three phases of six months each.

77
REFERENCES
Bank Indonesia. Economic and Financial Data for Indonesia:
http://www.bi.go.id/sdds/series/NA/index_NA.asp , Accessed on April 8, 2013 Bertaud, A. 2008. Spatial Tools to Analyze the Impact of Land Markets on Affordability and
Urban Spatial Structures. Presentation at the World Bank, Washington, DC, February 28th.
Dowall, D. 2010. Literature Review and Proposed Methodological Approach, Land Markets
in Latin American and Caribbean Cities. Inter-American Development Bank: Washington, DC.
Dowall, D.E., 1995. The Land Market Assessment: A New Tool for Urban Management.
Washington, D.C.: Published for the Urban Management Programme by the World Bank.
Suraji, A, Pribadi SK., Ismono, (2012). The Indonesia Construction Sector. The Proceeding of
the Asia Construct Conference 18th, Singapore The World Bank, 2005. The Wealth of Nations Dataset:
http://data.worldbank.org/sites/default/files/total_and_per_capita_wealth_of_nations.xls , Accessed on April 8, 2013
The World Bank, 2013. Land and Property Market Assessment - Housing Market Segmentation Study: Existing Tools and Survey Strategy

78
ix
ANNEX 1: DEMONSTRATION REPORT OF
SPATIAL GROWTH ANALYTICS MODULE

x

DEM
ON
STR
ATI
ON
REP
OR
T SP
ATI
AL
GR
OW
TH A
NA
LYTI
CS
TE
CH
NIC
AL
SU
PP
OR
T F
AC
ILIT
Y
FO
R N
AT
ION
AL
UR
BA
N D
EV
ELO
PM
EN
T P
RO
GR
AM
IN IN
DO
NE
SIA
2
Con
tact
S
UT
D C
ity
For
m L
ab
20 D
ove
r D
rive
13
868
2 S
ing
apor
e +6
5-6
3036
60
0
city
form
lab
@m
it.e
du
Dat
e: J
uly
14, 2
013
And
res
Sevt
suk
PI,
Cit
y F
orm
Lab
S
ing
apo
re U
nive
rsit
y o
f T
echn
olo
gy
and
Des
ign
Rez
a A
min
dar
bar
i R
esea
rche
r, C
ity
Fo
rm L
ab
Sin
gap
ore
Uni
vers
ity
of
Tec
hno
log
y an
d D
esig
n Ta
imur
Sam
ad
Sen
ior
Urb
an E
cono
mis
t W
orl
d B
ank-
Ind
one
sia
Wilm
ar S
alim
U
nive
rsit
y o
f B
and
ung
C
hand
an D
eusk
ar
Urb
an D
evel
op
men
t A
naly
st
Wo
rld
Ban
k
Ren
ata
Sim
atup
ang
Eco
nom
ist
Wo
rld
Ban
k-In
do
nesi
a D
EMO
NST
RA
TIO
N O
F A
NA
LYTI
CS
SPA
TIA
L G
RO
WTH
AN
ALY
TIC
S
Aut
hors
: C
olla
bor
ator
s:

3
SEC
TIO
NS
1 IN
TR
OD
UC
TIO
N
2 G
EO
SP
AT
IAL
DA
TA
3 S
PA
TIA
L G
RO
WT
H A
ND
CH
AN
GE
AN
ALY
TIC
S
4
PLA
NN
ING
DE
CIS
ION
S S
UP
PO
RT

4
INTR
OD
UC
TIO
N

5
1. IN
TRO
DU
CTI
ON
A k
ey e
ngag
emen
t o
f th
e W
orl
d B
ank
und
er t
he N
atio
nal U
rban
Dev
elo
pm
ent
Pro
gra
m (
P3N
) is
tec
hnic
al a
nd i
nsti
tuti
ona
l ca
pac
ity
bui
ldin
g f
or
sup
po
rtin
g
evid
ence
-bas
ed s
pat
ial
and
dev
elo
pm
ent
pla
nnin
g i
n In
do
nesi
a. T
his
acti
vity
w
ill t
ake
pla
ce t
hro
ugh
new
per
man
ent
tech
nica
l as
sist
ance
fac
iliti
es –
Cit
y P
lann
ing
Lab
s (C
PLs
) –
that
are
pro
po
sed
wit
hin
Bap
ped
a in
fo
ur p
arti
cip
atin
g
citi
es –
Den
pas
ar, S
urab
aya,
Pal
emb
ang
and
Bal
ikp
apan
. Pro
po
sed
CP
L te
ams,
su
per
vise
d b
y a
dir
ecto
r, in
clud
e ci
vil s
erva
nts
fro
m B
app
eda,
Din
as T
ata
Ko
ta
and
oth
er r
elat
ed c
ity
dep
artm
ents
, an
d t
echn
ical
sta
ff w
ith
bac
kgro
und
s in
ur
ban
pla
nnin
g,
geo
gra
phi
c in
form
atio
n sy
stem
s (G
IS),
and
sp
atia
l an
alys
is
hire
d
fro
m
out
sid
e th
e lo
cal
go
vern
men
t.
In
ord
er
to
bui
ld
the
esse
ntia
l ca
pab
iliti
es
at
CP
Ls,
team
s o
f in
tern
atio
nal
Wo
rld
B
ank
cons
ulta
nts
will
co
llab
ora
te c
lose
ly w
ith
CP
Ls in
the
fir
st e
ight
een
mo
nths
of
the
pro
ject
.
CP
Ls’ p
rim
ary
go
al is
to
co
llect
geo
spat
ial d
ata,
and
to
co
nduc
t an
alys
es t
hat
can
info
rm s
pat
ial
pla
nnin
g d
ecis
ions
in
the
abo
vem
enti
one
d c
itie
s. C
PLs
’ an
alyt
ic
acti
viti
es
will
b
e st
ruct
ured
ar
oun
d
a co
re
mo
dul
e an
d
four
su
pp
lem
enta
ry m
od
ules
. The
co
re m
od
ule
aim
s to
est
ablis
h th
e C
PL
faci
litie
s,
inst
itut
iona
l str
uctu
res
and
dat
a p
latf
orm
s, a
nd t
o t
rain
CP
L st
aff
to im
ple
men
t b
asic
urb
an g
row
th a
nd c
hang
e an
alys
is i
n ea
ch r
esp
ecti
ve c
ity.
The
op
tio
nal
mo
dul
es i
nclu
de:
(1)
cit
y ec
ono
mic
co
mp
etit
iven
ess,
(2)
slu
m a
naly
tics
and
m
anag
emen
t sy
stem
s, (
3) c
limat
e an
d r
isk
resi
lienc
e p
lann
ing
sys
tem
s, (
4)
and
m
oni
tori
ng la
nd a
nd r
eal e
stat
e m
arke
ts.
A
sep
arat
e W
orl
d
Ban
k co
ncep
t no
te
des
crib
es
the
anal
ytic
ac
tivi
ties
p
rop
ose
d
for
each
m
od
ule.
T
he
pur
po
se
of
the
pre
sent
re
po
rt
is
to
dem
ons
trat
e th
e im
ple
men
tati
on
and
sp
ecifi
cati
on
of
the
anal
yses
pro
po
sed
in
the
core
urb
an g
row
th a
naly
sis
mo
dul
e. T
he i
ssue
s an
d o
pp
ort
unit
ies
that
In
do
nesi
an c
itie
s in
gen
eral
, an
d t
he f
our
pilo
t ci
ties
in
par
ticu
lar,
fac
e d
ue t
o
rap
id
urb
an
gro
wth
ar
e d
iver
se
and
lo
cally
sp
ecifi
c.
The
lis
t o
f an
alyt
ic
acti
viti
es n
eed
ed t
o u
nder
stan
d a
nd a
dd
ress
all
of
them
wit
h ap
pro
pri
ate
pla
nnin
g t
oo
ls a
nd p
olic
ies
is t
oo
exh
aust
ive
to b
e ca
ptu
red
her
e. T
his
rep
ort
fo
cuse
s o
n a
few
b
asic
, b
ut
usef
ul
spat
ial
anal
ysis
te
chni
que
s th
at
are
pro
po
sed
as
par
t o
f th
e co
re C
PL
mo
dul
e in
eac
h ci
ty.
Fig
ure
1. P
alem
ban
g i
s a
city
of
1.7M
inh
abit
ants
in
Sum
atra
. Due
to
the
pre
senc
e of
fre
que
nt e
arth
qua
kes
and
the
lac
k of
inv
estm
ent
in c
omm
erci
al r
eal
esta
te,
the
city
ce
nter
re
mai
ns
hori
zont
ally
d
ense
b
ut
vert
ical
ly lo
w r
ise.

6
The
re
po
rt
first
d
iscu
sses
es
sent
ial
dat
a re
qui
rem
ents
fo
r th
e p
rop
ose
d
anal
ytic
s an
d t
he n
eed
ed g
eosp
atia
l d
ata
pla
tfo
rm f
or
shar
ing
geo
gra
phi
c in
form
atio
n am
ong
go
vern
men
t ag
enci
es, s
take
hold
ers
and
the
gen
eral
pub
lic.
The
fir
st s
ecti
on
of
the
rep
ort
fo
cuse
s o
n d
ata
pre
par
atio
n, a
pp
rop
riat
e un
its
of
anal
ysis
, req
uire
d a
ttri
but
es f
or
each
dat
aset
, and
po
tent
ial s
our
ces
for
the
corr
esp
ond
ing
dat
a in
Ind
one
sia.
The
sec
ond
sec
tio
n co
ncen
trat
es o
n th
e an
alyt
ic a
ctiv
itie
s. T
he a
naly
tic
acti
viti
es w
e d
iscu
ss a
nd d
emo
nstr
ate
incl
ude
spat
ial
gro
wth
an
d
chan
ge
anal
ysis
, sp
atia
l ac
cess
ibili
ty
anal
ysis
, im
pac
t an
alys
is,
and
sp
atia
l-st
atis
tica
l m
od
els.
Tec
hnic
al i
mp
lem
enta
tio
n d
etai
ls a
nd
req
uire
d g
eo-p
roce
ssin
g t
oo
ls a
re d
iscu
ssed
thr
oug
h a
seri
es o
f ex
amp
les
usin
g d
ata
fro
m o
ther
cit
ies
and
co
untr
ies.
The
thi
rd a
nd f
inal
par
t o
f th
e re
po
rt f
ocu
ses
on
po
tent
ial
pla
nnin
g a
pp
licat
ions
of
the
pro
po
sed
ana
lysi
s te
chni
que
s.
Dev
elo
pin
g a
n ev
iden
ce-b
ased
pla
nnin
g d
ecis
ion
sup
po
rt s
yste
m t
hat
relie
s o
n em
pir
ical
and
up
-to
-dat
e d
ata
and
uti
lizes
po
wer
ful s
pat
ial a
naly
sis
too
ls c
oul
d
mak
e a
sig
nific
ant
cont
rib
utio
n to
war
ds
turn
ing
th
e ra
pid
ur
ban
izat
ion
in
Ind
one
sian
ci
ties
in
to
a va
st
op
po
rtun
ity
for
eco
nom
ic
gro
wth
, eq
uita
ble
re
sour
ce d
istr
ibut
ion
and
acc
ess
to h
uman
dev
elo
pm
ent
op
po
rtun
itie
s. T
he
dat
a an
d a
naly
sis
tech
niq
ues
des
crib
ed i
n th
is r
epo
rt a
re,
how
ever
, no
t o
nly
app
licab
le t
o I
ndo
nesi
an c
itie
s –
they
co
uld
als
o b
enef
it a
num
ber
of
oth
er
rap
idly
urb
aniz
ing
co
untr
ies
in S
out
h E
ast
Asi
a an
d b
eyo
nd. T
he C
ity
Pla
nnin
g
Lab
s p
roje
ct
in
Ind
one
sia
will
te
st
the
imp
lem
enta
tio
n o
f g
eosp
atia
l d
ata
syst
ems
and
ana
lysi
s te
chni
que
s in
fo
ur m
ediu
m-s
cale
cit
ies,
whi
ch w
ill o
ffer
a
uniq
ue o
pp
ort
unit
y to
lear
n an
d im
pro
ve f
rom
the
exp
erie
nce.
Ano
ther
rep
ort
w
ill b
e co
mp
iled
at
the
end
of
a 12
or
18 m
ont
h en
gag
emen
t w
ith
the
CP
Ls in
In
do
nesi
a, d
escr
ibin
g h
ow
the
im
ple
men
tati
on
unro
lled
and
wha
t co
uld
be
do
ne b
ette
r ne
xt t
ime.
GEO
SPA
TIA
L D
ATA

7
2.1.
GEO
SPA
TIA
L D
ATA
The
fir
st r
esp
ons
ibili
ty o
f C
PLs
is
to c
olle
ct a
nd d
isse
min
ate
geo
spat
ial
dat
a re
qui
red
fo
r su
pp
ort
ing
pla
nnin
g d
ecis
ions
in
citi
es.
A l
arg
e am
oun
t o
f d
ata
that
C
PLs
re
qui
re
for
thei
r an
alyt
ical
ac
tivi
ties
al
read
y ex
ists
in
d
iffer
ent
agen
cies
and
dep
artm
ents
at
the
loca
l an
d n
atio
nal
leve
l in
Ind
one
sia.
We
pro
vid
e a
tab
le a
t th
e en
d o
f th
is s
ecti
on
sho
win
g a
ll th
e d
atas
ets
that
are
re
com
men
ded
to
be
colle
cted
at
each
CP
L, w
here
we
also
ind
icat
e w
heth
er
and
whe
re w
e ha
ve w
itne
ssed
the
ava
ilab
ility
of
such
dat
a. N
ot
all
of
thes
e d
ata
will
be
avai
lab
le in
eac
h o
f th
e fo
ur c
itie
s. D
urin
g t
he f
irst
yea
r, t
he t
able
ca
n b
e us
ed a
s a
wis
h-lis
t fo
r g
eosp
atia
l dat
a fo
r th
e co
re C
PL
mo
dul
e.
CP
Ls w
oul
d b
enef
it f
rom
est
ablis
hing
a s
usta
inab
le l
ong
-ter
m c
olla
bo
rati
on
wit
h ag
enci
es w
ho g
ener
ate
or
harv
est
geo
spat
ial
dat
a in
Ind
one
sia,
in
ord
er
to h
ave
acce
ss t
o t
he m
ost
up
-to
-dat
e in
form
atio
n an
d t
o a
lso
sha
re t
he d
ata
they
co
mp
ile w
ith
oth
er a
gen
cies
. M
uch
of
the
exis
ting
dat
a, h
ow
ever
, is
no
t d
igit
ized
or
attr
ibut
ed f
or
GIS
. C
ons
truc
tio
n an
d c
hang
e-o
f-us
e p
erm
its,
lan
d
use
map
s, c
adas
tral
rec
ord
s, M
aste
rpla
ns a
nd s
urve
y re
cord
s ca
n b
e p
aper
-b
ased
, m
akin
g r
efer
enci
ng a
nd d
ata
shar
ing
diff
icul
t. C
AD
dra
win
gs,
whe
re
they
exi
st,
oft
en c
om
e w
itho
ut a
sp
atia
l re
fere
nce
for
geo
gra
phi
c lo
cati
on.
In
crea
sing
ly,
Ind
one
sian
cit
ies
have
sta
rted
co
llect
ing
the
se d
ata
dig
ital
ly a
nd
som
e ha
ve a
cces
s to
rem
ote
-sen
sing
inf
orm
atio
n, s
uch
as m
ediu
m o
r hi
gh-
reso
luti
on
aeri
al o
r sa
telli
te i
mag
ery,
LiD
AR
sca
ns, o
r sa
telli
te s
tere
o i
mag
ery.
A
nu
mb
er
of
citi
es
have
g
one
th
roug
h in
itia
l ef
fort
s to
d
igit
ize
bui
ldin
g
foo
tpri
nts,
st
reet
ne
two
rks
and
la
nd-u
se
clas
sific
atio
n zo
nes,
al
bei
t w
ith
rela
tive
ly l
imit
ed a
ttri
but
e in
form
atio
n d
escr
ibin
g t
he c
hara
cter
isti
cs o
f th
e g
eom
etri
c el
emen
ts.
In t
he f
irst
pro
ject
pha
se,
CP
L st
aff
will
nee
d t
o c
olle
ct,
org
aniz
e an
d s
tand
ard
ize
a b
road
ran
ge
of
exis
ting
dat
aset
s av
aila
ble
in e
ach
city
.
As
exis
ting
dat
a ar
e o
ften
par
tial
, C
PLs
will
als
o n
eed
to
ob
tain
so
me
dat
a,
such
as
re
mo
tely
se
nsed
to
po
gra
phi
c d
ata
thro
ugh
spec
ializ
ed
serv
ice
pro
vid
ers.
Gro
und
sur
veys
sho
uld
be
pre
par
ed f
or
bui
ldin
g u
se a
nd c
ond
itio
n m
aps
or
add
itio
nal
soci
o-e
cono
mic
d
ata
gat
heri
ng.
CP
Ls
sho
uld
d
evel
op
ro
utin
e p
roce
sses
fo
r im
ple
men
ting
an
nual
g
roun
d
surv
eys
for
accu
racy
Fig
ure
2. H
igh-
reso
luti
on s
atel
lite
imag
e, L
ond
on, O
xfor
d C
ircus
.

8
veri
ficat
ion
and
fo
r co
mp
leti
ng o
r up
dat
ing
exi
stin
g d
atas
ets.
The
Wo
rld
Ban
k co
nsul
tant
s in
thi
s p
roje
ct w
ill p
rop
ose
sta
ndar
ds
and
gui
del
ines
fo
r su
ch d
ata
colle
ctio
n d
urin
g t
he f
irst
imp
lem
enta
tio
n p
hase
.
2.1.
1. U
nits
of A
naly
sis
All
geo
spat
ial
dat
a is
ass
oci
ated
wit
h g
eom
etri
c sp
atia
l un
its
(e.g
. ad
dre
ss
po
ints
, b
uild
ing
o
r p
arce
l p
oly
go
ns,
stre
et
cent
erlin
es),
w
hich
ar
e g
eog
rap
hica
lly
refe
renc
ed.
Eac
h in
div
idua
l sp
atia
l un
it
cont
ains
ce
rtai
n at
trib
utes
ab
out
the
env
iro
nmen
tal
feat
ure
it s
ymb
oliz
es (
e.g
. b
uild
ing
flo
or
area
, cen
sus
blo
ck p
op
ulat
ion,
par
cel v
alue
etc
.). T
he s
pat
ial u
nits
fo
r av
aila
ble
d
ata
typ
ical
ly d
epen
d o
n b
oth
the
geo
met
ric
elem
ents
ob
serv
ed i
n th
e b
uilt
en
viro
nmen
t (s
tree
ts, b
uild
ing
s, p
arce
ls),
the
eas
e w
ith
whi
ch t
he d
ata
can
be
phy
sica
lly s
urve
yed
on
gro
und
(ce
nsus
blo
cks
can
be
typ
ical
ly s
urve
yed
in le
ss
then
a d
ay),
as
wel
l as
the
gra
phi
c re
pre
sent
atio
n co
nstr
aint
s (e
.g. s
lop
ing
land
is
usu
ally
sym
bo
lized
wit
h ho
rizo
ntal
ele
vati
on
lines
tha
t ar
e no
t w
itne
ssed
in
real
ity)
. F
or
pri
vacy
and
sec
urit
y re
aso
ns,
or
tech
nica
l lim
itat
ions
, ag
enci
es
that
co
llect
dat
a d
o n
ot
alw
ays
rele
ase
spat
ial i
nfo
rmat
ion
at t
he s
ame
spat
ial
reso
luti
on
or
wit
h th
e sa
me
unit
s o
f an
alys
is
that
d
ata
was
o
rig
inal
ly
asse
mb
led
. Sta
tist
ic In
do
nesi
a (B
PS
), f
or
inst
ance
, co
llect
s al
l cen
sus
dat
a at
a
cens
us b
lock
leve
l (o
ften
co
mp
arab
le t
o a
cit
y b
lock
), b
ut o
nly
rele
ases
dat
a at
th
e vi
llag
e, s
ub-d
istr
ict
and
hig
her
leve
ls.
Ori
gin
al s
pat
ial
unit
s o
f d
ata,
as
dis
sem
inat
ed b
y d
iffer
ent
dat
a co
llect
ion
agen
cies
, d
o
not
nece
ssar
y m
atch
th
e ne
eds
for
urb
an
gro
wth
an
alys
es
pro
po
sed
in
the
core
mo
dul
e.
An
imp
ort
ant
par
t o
f C
PL’
s ac
tivi
ties
will
be
ded
icat
ed
to
com
pili
ng
and
d
eriv
ing
ne
w
dat
aset
s,
usin
g
geo
-pro
cess
ing
te
chni
que
s fo
r ag
gre
gat
ing
or
dis
agg
reg
atin
g r
aw d
ata
to d
esir
ed s
pat
ial u
nits
. F
or
bui
ldin
g le
vel a
naly
sis,
fo
r ex
amp
le, l
and
use
dat
a o
r ec
ono
mic
cen
sus
dat
a sh
oul
d b
e d
isag
gre
gat
ed f
rom
ori
gin
al t
ract
leve
ls t
o in
div
idua
l bui
ldin
g le
vels
(d
iscu
ssed
bel
ow
).
To
cla
ssify
sp
atia
l d
ata
in t
his
rep
ort
we
focu
s o
n th
e sp
atia
l un
it r
athe
r th
an
the
cont
ent
of
attr
ibut
e fie
lds.
Dat
aset
s w
ith
diff
eren
t sp
atia
l un
its
may
hav
e
Fig
ure
3. D
iffer
ent
spat
ial u
nits
of
anal
ysis
and
the
ir r
esp
ecti
ve
attr
ibut
es

9
sim
ilar
attr
ibut
es –
par
cels
, bui
ldin
gs,
cen
sus
blo
cks
and
vill
ages
can
all
cont
ain
info
rmat
ion
abo
ut t
he r
esid
enti
al p
op
ulat
ion,
the
bui
lt a
rea,
or
the
num
ber
of
bus
ines
s es
tab
lishm
ents
the
y ac
com
mo
dat
e (F
igur
e 3)
.
The
fo
llow
ing
list
of
dat
a is
see
n as
mo
st e
ssen
tial
fo
r C
PLs
to
co
llect
, in
ord
er
to c
arry
out
the
ana
lyti
cs p
rop
ose
d i
n th
e co
re m
od
ule.
Fo
r ea
ch d
atas
et,
des
ired
att
rib
utes
, req
uire
d r
aw d
ata,
and
po
tent
ial d
ata
sour
ces
are
exp
lain
ed
whe
re p
oss
ible
.
2.1.
1.1.
Bui
ldin
gs a
nd a
ddre
ss p
oint
s
Ind
ivid
ual
bui
ldin
gs
are
amo
ng t
he f
ines
t sp
atia
l un
it o
f an
alys
is c
om
mo
nly
used
in
citi
es.
A s
ubst
anti
al p
art
of
hum
an a
ctiv
itie
s ta
kes
pla
ce i
n b
uild
ing
s;
the
peo
ple
tha
t b
uild
ing
s ac
com
mo
dat
e an
d t
he a
ctiv
itie
s th
ey e
ngag
e in
, g
ener
ate
the
ori
gin
s an
d
des
tina
tio
ns
of
mo
st
ped
estr
ian
and
ve
hicu
lar
mo
vem
ent
on
city
str
eets
.
Bui
ldin
gs
are
typ
ical
ly r
epre
sent
ed a
s p
oly
go
n fe
atur
es (
bui
ldin
g f
oo
tpri
nts)
. P
oly
go
n fe
atur
es
illus
trat
e th
e re
alis
tic
geo
met
ry
of
the
actu
al
bui
ldin
g
foo
tpri
nts
and
al
low
va
luab
le
po
st-p
roce
ssin
g
anal
ysis
th
at
may
no
t b
e in
clud
ed i
n th
e o
rig
inal
att
rib
utes
(b
uild
ing
are
a o
r p
erim
eter
cal
cula
tio
ns,
3d
heig
ht
extr
usio
ns,
volu
me
calc
ulat
ions
).
Ho
wev
er,
bui
ldin
gs
can
also
b
e re
pre
sent
ed a
s p
oin
t fe
atur
es,
pla
ced
at
eith
er t
he c
entr
oid
of
the
actu
al
foo
tpri
nt o
r at
one
or
mo
re e
xter
ior
entr
ance
lo
cati
ons
of
the
bui
ldin
g.
Po
int
rep
rese
ntat
ion
of
bui
ldin
gs
can
be
usef
ul f
or
anal
yzin
g a
cces
sib
iliti
es b
etw
een
bui
ldin
gs
on
the
netw
ork
of
city
str
eets
tha
t re
qui
res
dis
cret
e lo
cati
ons
(F
igur
e 4
). P
oly
go
ns c
an e
asily
be
conv
erte
d t
o p
oin
ts,
but
no
t vi
ce v
ersa
. C
entr
oid
p
oin
ts,
may
fai
l ho
wev
er,
to c
aptu
re t
he a
ccur
ate
rela
tio
nshi
p b
etw
een
a b
uild
ing
and
its
stre
et(s
) o
r th
e vi
sual
sig
htlin
es a
vaila
ble
bet
wee
n b
uild
ing
s. It
is
the
refo
re p
refe
rab
le t
o r
epre
sent
bui
ldin
gs
wit
h re
alis
tic
po
lyg
ons
.
Ad
dre
ss p
oin
ts, d
iscu
ssed
her
eaft
er, c
an b
e p
lace
d a
t en
tran
ces
to a
ccur
atel
y ca
ptu
re
the
rela
tio
nshi
p
bet
wee
n b
uild
ing
s an
d
stre
ets.
T
he
geo
met
ry
of
bui
ldin
gs
(fo
otp
rint
s o
r 3D
vo
lum
es)
are
typ
ical
ly
ob
tain
ed
fro
m
sate
llite
im
ager
y o
r ae
rial
sca
ns (
e.g
. Li
DA
R,
ster
eo i
mag
ery)
. A
hig
h-re
solu
tio
n g
eo-
refe
renc
ed
sate
llite
im
age
can
be
used
as
a
bas
e fo
r d
raw
ing
b
uild
ing
Fig
ure
4.
Bui
ldin
g
foo
tpri
nts
and
th
eir
cent
roid
s,
Har
vard
Sq
uare
, Cam
brid
ge
MA
.
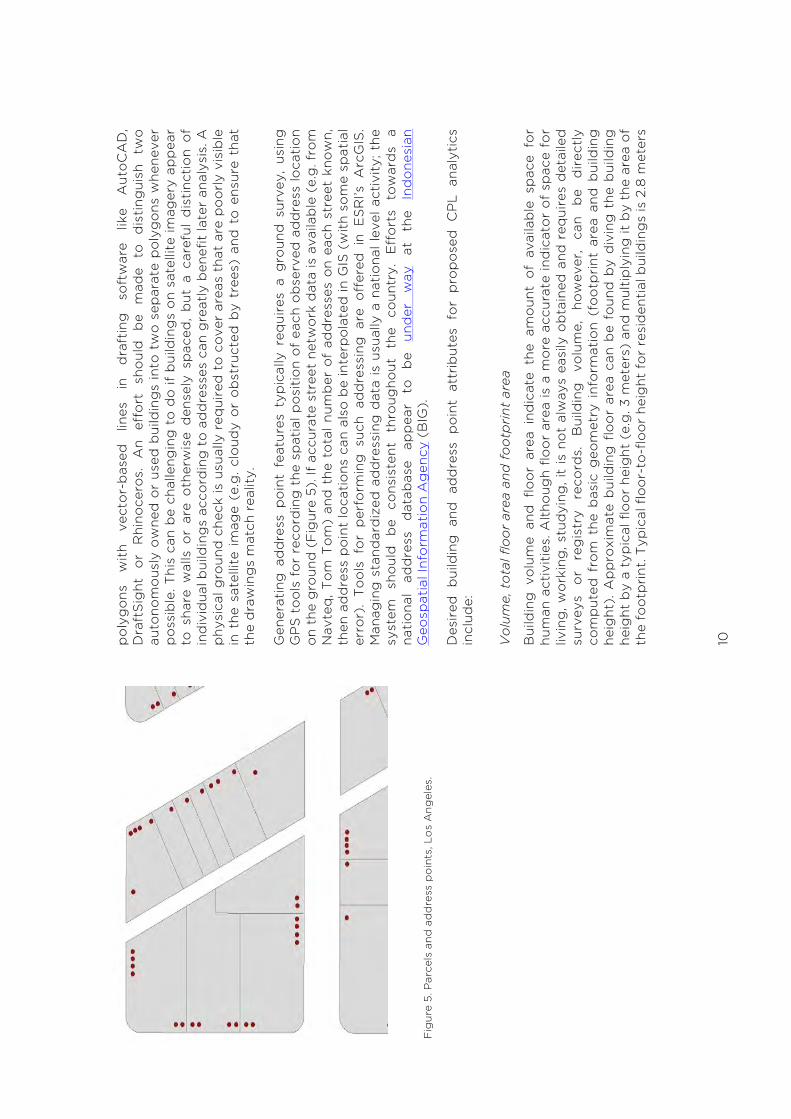
10
po
lyg
ons
w
ith
vect
or-
bas
ed
lines
in
d
raft
ing
so
ftw
are
like
Aut
oC
AD
, D
raft
Sig
ht
or
Rhi
noce
ros.
A
n ef
fort
sh
oul
d
be
mad
e to
d
isti
ngui
sh
two
au
tono
mo
usly
ow
ned
or
used
bui
ldin
gs
into
tw
o s
epar
ate
po
lyg
ons
whe
neve
r p
oss
ible
. Thi
s ca
n b
e ch
alle
ngin
g t
o d
o if
bui
ldin
gs
on
sate
llite
imag
ery
app
ear
to s
hare
wal
ls o
r ar
e o
ther
wis
e d
ense
ly s
pac
ed,
but
a c
aref
ul d
isti
ncti
on
of
ind
ivid
ual b
uild
ing
s ac
cord
ing
to
ad
dre
sses
can
gre
atly
ben
efit
late
r an
alys
is. A
p
hysi
cal g
roun
d c
heck
is u
sual
ly r
equi
red
to
co
ver
area
s th
at a
re p
oo
rly
visi
ble
in
the
sat
ellit
e im
age
(e.g
. cl
oud
y o
r o
bst
ruct
ed b
y tr
ees)
and
to
ens
ure
that
th
e d
raw
ing
s m
atch
rea
lity.
Gen
erat
ing
ad
dre
ss p
oin
t fe
atur
es t
ypic
ally
req
uire
s a
gro
und
sur
vey,
usi
ng
GP
S t
oo
ls f
or
reco
rdin
g t
he s
pat
ial p
osi
tio
n o
f ea
ch o
bse
rved
ad
dre
ss lo
cati
on
on
the
gro
und
(F
igur
e 5)
. If
accu
rate
str
eet
netw
ork
dat
a is
ava
ilab
le (
e.g
. fro
m
Nav
teq
, To
m T
om
) an
d t
he t
ota
l nu
mb
er o
f ad
dre
sses
on
each
str
eet
kno
wn,
th
en a
dd
ress
po
int
loca
tio
ns c
an a
lso
be
inte
rpo
late
d in
GIS
(w
ith
som
e sp
atia
l er
ror)
. T
oo
ls f
or
per
form
ing
suc
h ad
dre
ssin
g a
re o
ffer
ed i
n E
SR
I’s A
rcG
IS.
Man
agin
g s
tand
ard
ized
ad
dre
ssin
g d
ata
is u
sual
ly a
nat
iona
l lev
el a
ctiv
ity;
the
sy
stem
sh
oul
d
be
cons
iste
nt
thro
ugho
ut
the
coun
try.
E
ffo
rts
tow
ard
s a
nati
ona
l ad
dre
ss
dat
abas
e ap
pea
r to
b
e un
der
w
ay
at
the
Ind
one
sian
G
eosp
atia
l Inf
orm
atio
n A
gen
cy (
BIG
).
Des
ired
bui
ldin
g a
nd a
dd
ress
po
int
attr
ibut
es f
or
pro
po
sed
CP
L an
alyt
ics
incl
ude:
Vo
lum
e, t
ota
l flo
or
area
and
fo
otp
rint
are
a
Bui
ldin
g v
olu
me
and
flo
or
area
ind
icat
e th
e am
oun
t o
f av
aila
ble
sp
ace
for
hum
an a
ctiv
itie
s. A
ltho
ugh
floo
r ar
ea is
a m
ore
acc
urat
e in
dic
ato
r o
f sp
ace
for
livin
g, w
ork
ing
, stu
dyi
ng, i
t is
no
t al
way
s ea
sily
ob
tain
ed a
nd r
equi
res
det
aile
d
surv
eys
or
reg
istr
y re
cord
s.
Bui
ldin
g
volu
me,
ho
wev
er,
can
be
dir
ectl
y co
mp
uted
fro
m t
he b
asic
geo
met
ry i
nfo
rmat
ion
(fo
otp
rint
are
a an
d b
uild
ing
he
ight
). A
pp
roxi
mat
e b
uild
ing
flo
or
area
can
be
foun
d b
y d
ivin
g t
he b
uild
ing
he
ight
by
a ty
pic
al f
loo
r he
ight
(e.
g. 3
met
ers)
and
mul
tip
lyin
g it
by
the
area
of
the
foo
tpri
nt. T
ypic
al f
loo
r-to
-flo
or
heig
ht f
or
resi
den
tial
bui
ldin
gs
is 2
.8 m
eter
s
Fig
ure
5. P
arce
ls a
nd a
dd
ress
poi
nts,
Lo
s A
ngel
es.
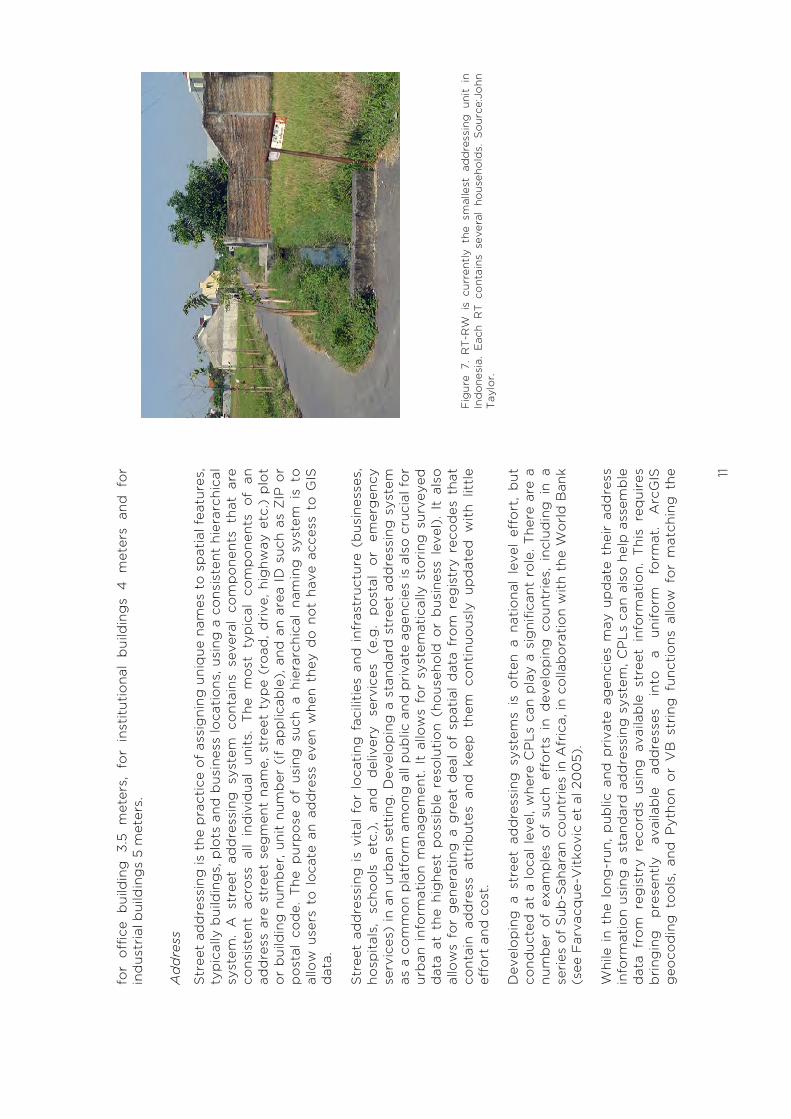
11
for
off
ice
bui
ldin
g 3
.5 m
eter
s, f
or
inst
itut
iona
l b
uild
ing
s 4
met
ers
and
fo
r in
dus
tria
l bui
ldin
gs
5 m
eter
s.
Ad
dre
ss
Str
eet
add
ress
ing
is t
he p
ract
ice
of
assi
gni
ng u
niq
ue n
ames
to
sp
atia
l fea
ture
s,
typ
ical
ly b
uild
ing
s, p
lots
and
bus
ines
s lo
cati
ons
, usi
ng a
co
nsis
tent
hie
rarc
hica
l sy
stem
. A
str
eet
add
ress
ing
sys
tem
co
ntai
ns s
ever
al c
om
po
nent
s th
at a
re
cons
iste
nt a
cro
ss a
ll in
div
idua
l un
its.
The
mo
st t
ypic
al c
om
po
nent
s o
f an
ad
dre
ss a
re s
tree
t se
gm
ent
nam
e, s
tree
t ty
pe
(ro
ad, d
rive
, hig
hway
etc
.) p
lot
or
bui
ldin
g n
umb
er, u
nit
num
ber
(if
app
licab
le),
and
an
area
ID
suc
h as
ZIP
or
po
stal
co
de.
The
pur
po
se o
f us
ing
suc
h a
hier
arch
ical
nam
ing
sys
tem
is
to
allo
w u
sers
to
lo
cate
an
add
ress
eve
n w
hen
they
do
no
t ha
ve a
cces
s to
GIS
d
ata.
Str
eet
add
ress
ing
is
vita
l fo
r lo
cati
ng f
acili
ties
and
inf
rast
ruct
ure
(bus
ines
ses,
ho
spit
als,
sc
hoo
ls
etc.
),
and
d
eliv
ery
serv
ices
(e
.g.
po
stal
o
r em
erg
ency
se
rvic
es)
in a
n ur
ban
set
ting
. Dev
elo
pin
g a
sta
ndar
d s
tree
t ad
dre
ssin
g s
yste
m
as a
co
mm
on
pla
tfo
rm a
mo
ng a
ll p
ublic
and
pri
vate
ag
enci
es is
als
o c
ruci
al f
or
urb
an i
nfo
rmat
ion
man
agem
ent.
It
allo
ws
for
syst
emat
ical
ly s
tori
ng s
urve
yed
d
ata
at t
he h
ighe
st p
oss
ible
res
olu
tio
n (h
ous
eho
ld o
r b
usin
ess
leve
l).
It a
lso
al
low
s fo
r g
ener
atin
g a
gre
at d
eal
of
spat
ial
dat
a fr
om
reg
istr
y re
cod
es t
hat
cont
ain
add
ress
att
rib
utes
and
kee
p t
hem
co
ntin
uous
ly u
pd
ated
wit
h lit
tle
effo
rt a
nd c
ost
.
Dev
elo
pin
g a
str
eet
add
ress
ing
sys
tem
s is
oft
en a
nat
iona
l le
vel
effo
rt,
but
co
nduc
ted
at
a lo
cal l
evel
, whe
re C
PLs
can
pla
y a
sig
nific
ant
role
. The
re a
re a
nu
mb
er o
f ex
amp
les
of
such
eff
ort
s in
dev
elo
pin
g c
oun
trie
s, i
nclu
din
g i
n a
seri
es o
f S
ub-S
ahar
an c
oun
trie
s in
Afr
ica,
in c
olla
bo
rati
on
wit
h th
e W
orl
d B
ank
(see
Far
vacq
ue-V
itko
vic
et a
l 20
05)
.
Whi
le i
n th
e lo
ng-r
un,
pub
lic a
nd p
riva
te a
gen
cies
may
up
dat
e th
eir
add
ress
in
form
atio
n us
ing
a s
tand
ard
ad
dre
ssin
g s
yste
m, C
PLs
can
als
o h
elp
ass
emb
le
dat
a fr
om
reg
istr
y re
cord
s us
ing
ava
ilab
le s
tree
t in
form
atio
n. T
his
req
uire
s b
ring
ing
p
rese
ntly
av
aila
ble
ad
dre
sses
in
to
a un
iform
fo
rmat
. A
rcG
IS
geo
cod
ing
to
ols
, an
d P
ytho
n o
r V
B s
trin
g f
unct
ions
allo
w f
or
mat
chin
g t
he
Fig
ure
7. R
T-R
W i
s cu
rren
tly
the
smal
lest
ad
dre
ssin
g u
nit
in
Ind
ones
ia.
Eac
h R
T co
ntai
ns s
ever
al h
ouse
hold
s. S
ourc
e:Jo
hn
Tay
lor.

12
exis
ting
ad
dre
sses
tha
t co
me
in d
iffer
ent
form
ats:
“20
Do
ver
Dr.
” to
“20
Do
ver
Dri
ve”
or
“20
do
ver
dri
ve.”
Bus
ines
ses
esta
blis
hmen
ts a
nd E
mp
loym
ent
Bus
ines
ses
acti
viti
es o
ften
tak
e p
lace
in b
uild
ing
s; b
uild
ing
, thu
s, o
ffer
a n
atur
al
unit
of
rep
rese
ntat
ion
for
the
dis
trib
utio
n o
f b
usin
esse
s in
a c
ity.
Bus
ines
s es
tab
lishm
ent
and
em
plo
ymen
t d
ata
at a
n in
div
idua
l b
uild
ing
lev
el s
houl
d
idea
lly i
nclu
de
the
tota
l nu
mb
er o
f b
usin
esse
s an
d e
mp
loye
es c
lass
ified
by
diff
eren
t in
dus
try
cate
go
ries
(e.
g. r
etai
l es
tab
lishm
ents
or
serv
ices
), a
s sh
ow
n in
fig
ure
7.
Raw
b
usin
ess
loca
tio
n d
ata
typ
ical
ly
com
es
at
add
ress
o
r g
eog
rap
hic
coo
rdin
ate
(po
int)
lev
el,
as e
xpla
ined
fur
ther
bel
ow
. A
gg
reg
atin
g
such
po
int
dat
a to
bui
ldin
g f
oo
tpri
nts,
ho
wev
er,
pro
vid
es c
onv
enie
nt u
nits
of
anal
yses
and
allo
ws
bui
ldin
gs
to b
e us
ed a
s in
put
s in
mul
tip
le t
ypes
of
spat
ial
anal
yses
.
Bus
ines
s es
tab
lishm
ent
and
em
plo
ymen
t d
ata
are
usua
lly a
vaila
ble
in
two
d
iffer
ent
form
s. T
hey
may
be
avai
lab
le i
n ag
gre
gat
e ce
nsus
tra
ct l
evel
(o
r o
ther
sta
tist
ical
bo
und
arie
s),
ind
icat
ing
the
to
tal
num
ber
of
bus
ines
ses
wit
hin
each
ag
gre
gat
ed a
rea.
Sto
ring
det
aile
d b
usin
ess
clas
sific
atio
n in
form
atio
n is
no
t ty
pic
ally
fea
sib
le in
thi
s ca
se. S
eco
nd, e
very
bus
ines
s ca
n b
e sh
ow
n as
an
ind
ivid
ual
unit
, re
pre
sent
ed
by
po
ints
w
ith
attr
ibut
e in
form
atio
n (s
ee
2.1.1
.3.b
usin
ess
loca
tio
ns).
W
hen
bus
ines
s es
tab
lishm
ents
are
sho
wn
at t
he
bui
ldin
g le
vel,
the
bus
ines
s at
trib
utes
sho
uld
be
sum
mar
ized
, sho
win
g t
he s
um
tota
l of
all e
stab
lishm
ents
tha
t o
ccup
y ea
ch b
uild
ing
.
BP
S c
olle
cts
dat
a o
n m
ediu
m a
nd l
arg
e b
usin
ess
esta
blis
hmen
ts w
ith
mo
re
than
20
em
plo
yees
, w
hich
co
nsti
tute
s a
smal
l p
erce
ntag
e o
f al
l b
usin
esse
s in
In
do
nesi
a. B
PS
als
o s
urve
ys s
mal
l sa
mp
les
of
all
bus
ines
s ev
ery
year
, w
hich
ca
nno
t b
e d
isag
gre
gat
ed l
ow
er t
han
city
sca
le.
CP
Ls m
ay n
eed
to
co
nduc
t g
roun
d
surv
eys
to
colle
ct
mo
re
com
pre
hens
ive
dat
a o
n b
usin
ess
esta
blis
hmen
ts.
…
33 M
anuf
actu
ring
4
2 W
hole
sale
Tra
de
44
Ret
ail T
rad
e
44
1 M
oto
r V
ehic
le a
nd P
art
Dea
lers
44
11 A
uto
mo
bile
Dea
lers
…
.
44
12 O
ther
Mo
tor
Veh
icle
Dea
lers
4
412
1 R
ecre
atio
nal V
ehic
le D
eale
rs
4
412
10 R
ecre
atio
nal V
ehic
le D
eale
rs
44
122
Mo
torc
ycle
s, B
oat
, and
Oth
er M
oto
r V
ehic
le D
eale
rs
4
412
22 B
oat
Dea
lers
44
1228
Mo
torc
ycle
, AT
V a
nd a
ll o
ther
Mo
tor
Dea
lers
4
5 R
etai
l Tra
de
48
Tra
nsp
ort
atio
n an
d W
areh
ous
ing
…
Fig
ure
7:
NA
ICS
bus
ines
s cl
assi
ficat
ion;
b
usin
ess
esta
blis
hmen
ts s
houl
d b
e g
roup
ed a
nd c
ateg
oriz
ed b
ased
on
stan
dar
d
syst
ems
such
as
N
orth
A
mer
ican
In
dus
ial
Cla
ssifi
cati
on
Syst
ems
(NA
ICS)
, or
S
tand
ard
In
dus
tria
l C
lass
ifica
tion
Sys
tem
s (S
IC).
Dep
end
ing
on
the
anal
ytic
al t
ask
that
is
cond
ucte
d,
the
clas
sific
atio
n d
epth
wou
ld v
ary;
e.g
. in
N
AIC
S t
he s
ix-d
igit
lev
el i
s th
e m
ost
det
aile
d c
lass
ifica
tion,
ho
wev
er,
the
first
tw
o d
igits
are
eno
ugh
to d
istin
gui
sh r
etai
l tr
ade
bus
ines
s es
tab
lishm
ents
.

13
Num
ber
s o
f re
sid
ents
/ h
ous
eho
lds
Po
pul
atio
n is
the
key
det
erm
inan
t o
f d
eman
d f
or
a ci
ty’s
res
our
ces.
Det
aile
d
dat
a o
n sp
atia
l d
istr
ibut
ion
of
po
pul
atio
n –
and
dem
og
rap
hic
sub
-gro
ups
– al
low
s fo
r ef
ficie
nt
esti
mat
es
for
a ci
ty’s
re
sour
ce
need
s.
Po
pul
atio
n an
d
dem
og
rap
hic
dat
a ar
e no
t co
mm
onl
y d
isse
min
ated
at
the
bui
ldin
g l
evel
, b
ut
agg
reg
ated
to
ce
nsus
b
lock
o
r tr
act
leve
ls.
In
Ind
one
sia,
B
PS
co
nduc
ts
hous
eho
ld
surv
eys
and
p
rovi
des
ce
nsus
d
ata
at
the
villa
ge
(Des
a o
r K
elur
ahan
) le
vel.
If in
div
idua
l bui
ldin
gs’
typ
e (e
.g. r
esid
enti
al, c
om
mer
cial
etc
.),
and
flo
or
area
or
volu
me
are
kno
wn,
the
n p
op
ulat
ion
valu
es f
rom
hig
her-
leve
l sp
atia
l un
its
can
be
dis
agg
reg
ated
to
th
e b
uild
ing
le
vel
wit
h re
aso
nab
le
accu
racy
. T
he t
ota
l nu
mb
er o
f re
sid
ents
in
a ce
nsus
blo
ck c
an t
here
by
be
allo
cate
d b
etw
een
resi
den
tial
str
uctu
res,
wei
ghi
ng t
he a
lloca
tio
ns b
y th
e si
ze
of
each
bui
ldin
g (
Fig
ure
8).
Bui
ldin
g t
ype
and
sub
typ
e
Bui
ldin
g t
ype
des
crib
es t
he t
ypes
of
acti
viti
es t
hat
take
pla
ce i
n th
e b
uild
ing
(F
igur
e 9
). R
elia
ble
ass
essm
ent
of
the
real
est
ate
mar
ket
(ass
et a
nd u
se)
is n
ot
feas
ible
wit
hout
bui
ldin
g t
ype
and
sub
typ
e in
form
atio
n. B
uild
ing
typ
es o
r su
bty
pes
do
no
t ne
cess
ary
shar
e th
e sa
me
mar
ket.
Co
mm
erci
al a
nd r
esid
enti
al
spac
es
bel
ong
to
se
par
ate
mar
kets
an
d
sep
arat
e d
eman
d
seg
men
ts.
To
d
eter
min
e th
e su
pp
ly s
ide
of
each
mar
ket,
it
is e
ssen
tial
to
kee
p t
rack
of
bui
ldin
g s
tock
by
typ
e.
Bui
ldin
g s
ubty
pes
(e.
g.
hous
ing
) ca
n al
so h
ave
sep
arat
e m
arke
ts (
Fig
ure
10).
T
he
dem
and
fo
r la
rge
land
ed
hous
es
is
com
po
sed
o
f a
diff
eren
t so
cio
-ec
ono
mic
gro
up o
f b
uyer
s an
d r
ente
rs t
han
the
dem
and
fo
r sm
all
stud
ios
or
pub
lic h
ous
ing
uni
ts.
The
tw
o m
ain
sour
ces
for
bui
ldin
g t
ype
dat
a ar
e zo
ning
map
s, w
hich
usu
ally
d
o n
ot
cont
ain
sub
typ
e in
form
atio
n, a
nd g
roun
d s
urve
ys.
Dev
elo
pin
g a
nd
mai
ntai
ning
an
accu
rate
bui
ldin
g t
ype
dat
abas
e ca
n b
e ve
ry l
abo
r in
tens
ive,
b
ut t
he p
ay-o
ffs
are
also
hig
h si
nce
bui
ldin
g le
vel d
ata
allo
ws
for
man
y us
eful
an
alys
es a
bo
ut c
ity’
s re
al e
stat
e m
arke
t.
Fig
ure
8: D
isag
gre
gat
ing
pop
ulat
ion
info
rmat
ion
from
cen
sus
trac
t le
vel t
o b
uild
ing
s. T
he p
op
ulat
ion
of t
he c
ensu
s tr
act
is
allo
cate
d o
nly
amo
ng b
uild
ing
s th
at c
ont
ain
resi
den
tial
use
s,
wei
ghi
ng t
he a
lloca
tion
by
the
bui
ldin
g v
olum
es.
Nat
ural
ly
som
e sp
atia
l er
ror
is g
ener
ated
in
the
pro
cess
, b
ut s
tori
ng
pop
ulat
ion
esti
mat
es a
t an
ind
ivid
ual
bui
ldin
g l
evel
is
usef
ul
for
a nu
mb
er o
f hi
gh
-res
olu
tion
ana
lyse
s.

14
Onc
e a
relia
ble
bui
ldin
g t
ype
and
sub
typ
e d
atab
ase
is a
ssem
ble
d t
hro
ugh
gro
und
sur
veys
, it
is
pra
ctic
al t
o m
aint
ain
and
up
dat
e it
via
bui
ldin
g p
erm
it,
mo
difi
cati
on
per
mit
, dem
olit
ion
per
mit
and
cha
nge-
of-
use
per
mit
dat
abas
es. I
f a
new
p
erm
it
is
issu
ed,
the
finis
hed
b
uild
ing
o
ccup
ancy
p
erm
it
can
auto
mat
ical
ly s
igna
l to
the
bui
ldin
g d
atab
ase
man
ager
s th
at a
new
bui
ldin
g
has
bee
n ad
ded
to
the
sto
ck. T
he b
uild
ing
typ
e d
atab
ase
can
then
ver
ify t
he
dat
a an
d a
dd
the
new
bui
ldin
g t
o t
he r
epo
sito
ry.
A s
imila
r p
roce
dur
e ca
n fo
llow
oth
er t
ypes
of
bui
ldin
g p
erm
its.
2.1.
1.2.
Par
cels
Par
cel
geo
met
ry r
eco
rds
land
ow
ners
hip
bo
rder
s. T
he g
eom
etry
of
par
cel
bo
rder
s is
oft
en p
rovi
ded
by
nati
ona
l lan
d a
gen
cies
(e.
g. B
PN
in In
do
nesi
a). I
n In
do
nesi
a, T
ax D
irec
tora
te G
ener
al a
lso
pre
par
es p
arce
l p
oly
go
n d
atas
ets,
fo
r it
s o
wn
land
val
ue a
sses
smen
t p
urp
ose
s. T
he t
wo
par
cel
dat
abas
es c
urre
ntly
re
mai
n se
par
ate,
b
ut
BP
N
app
ears
to
b
e w
ork
ing
o
n a
join
t d
atab
ase1 .
Att
rib
utes
tha
t p
arce
ls s
houl
d c
ont
ain
incl
ude:
Ass
esse
d v
alue
and
tra
nsac
tio
n hi
sto
ry
Par
cel i
s an
intu
itiv
e un
it f
or
land
mar
ket
rela
ted
ana
lyse
s, a
s tr
ansa
ctio
ns a
nd
valu
e as
sess
men
ts
are
cond
ucte
d
at
the
par
cel
leve
l. In
In
do
nesi
a,
Tax
D
irec
tora
te G
ener
al k
eep
s tr
ack
of
land
tra
nsac
tio
ns, a
nd a
sses
ses
land
val
ues.
Zo
ning
Par
cel
is t
he a
pp
rop
riat
e un
it f
or
cont
aini
ng z
oni
ng a
ttri
but
es,
such
as
land
us
e, p
lot
rati
o,
heig
ht l
imit
and
set
bac
ks,
as b
uild
ing
per
mit
s ar
e is
sued
fo
r sp
ecifi
c p
arce
ls.
Zo
ning
inf
orm
atio
n p
rese
nted
in
mas
terp
lans
and
det
aile
d
pla
ns,
whi
ch a
re p
rep
ared
by
Bap
ped
a in
eac
h ci
ty i
n In
do
nesi
a, t
ypic
ally
sp
ecify
zo
ning
reg
ulat
ions
fo
r ea
ch p
arce
l.
1 S
our
ce: p
erso
nal c
om
mun
icat
ion
wit
h B
PN
Com
mer
cial
Bui
ldin
gs
(10
,912
) In
stit
utio
nal B
uild
ing
s (1
2,4
01)
In
dus
tria
l Bui
ldin
gs
(7,0
48)
R
esid
enti
al B
uild
ing
s (5
8,56
6)
Fig
ure
10: H
ous
ing
seg
men
tatio
n (s
ubty
pes
of
resi
den
tial
bui
ldin
g
cate
gor
ies)
in S
ing
apor
e.
Pub
lic H
ousi
ng (
916,
842
unit
s)
Con
do
min
ium
s (2
00
,00
0 u
nits
) La
nded
Hou
ses
(70
, 00
0 u
nits
)
Fig
ure
9: B
uild
ing
sto
ck b
y ty
pe
in S
ing
apor
e; m
arke
ts f
or d
iffer
ent
bui
ldin
g t
ypes
are
to
a la
rge
exte
nt in
dep
end
ent
of e
ach
othe
r.
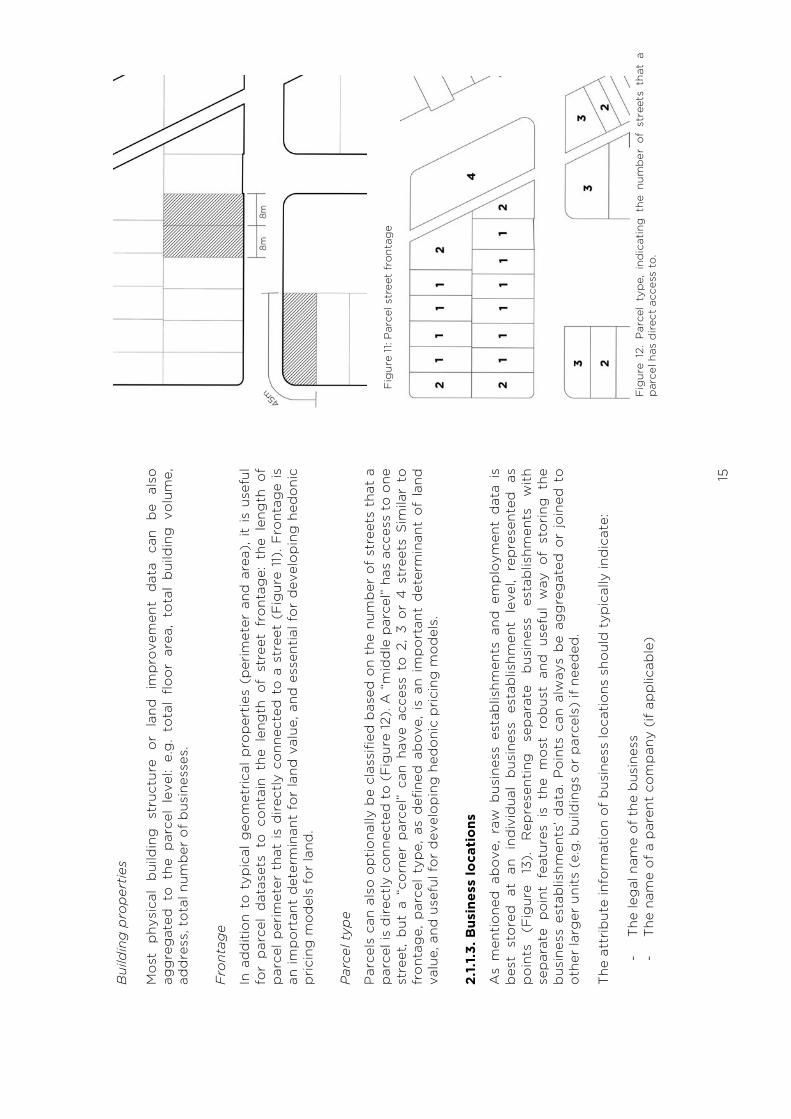
15
Bui
ldin
g p
rop
erti
es
Mo
st
phy
sica
l b
uild
ing
st
ruct
ure
or
land
im
pro
vem
ent
dat
a ca
n b
e al
so
agg
reg
ated
to
the
par
cel
leve
l: e.
g.
tota
l flo
or
area
, to
tal
bui
ldin
g v
olu
me,
ad
dre
ss, t
ota
l num
ber
of
bus
ines
ses.
Fro
ntag
e
In a
dd
itio
n to
typ
ical
geo
met
rica
l p
rop
erti
es (
per
imet
er a
nd a
rea)
, it
is
usef
ul
for
par
cel
dat
aset
s to
co
ntai
n th
e le
ngth
of
stre
et f
ront
age:
the
len
gth
of
par
cel
per
imet
er t
hat
is d
irec
tly
conn
ecte
d t
o a
str
eet
(Fig
ure
11).
Fro
ntag
e is
an
imp
ort
ant
det
erm
inan
t fo
r la
nd v
alue
, and
ess
enti
al f
or
dev
elo
pin
g h
edo
nic
pri
cing
mo
del
s fo
r la
nd.
Par
cel t
ype
Par
cels
can
als
o o
pti
ona
lly b
e cl
assi
fied
bas
ed o
n th
e nu
mb
er o
f st
reet
s th
at a
p
arce
l is
dir
ectl
y co
nnec
ted
to
(F
igur
e 12
). A
“m
idd
le p
arce
l” h
as a
cces
s to
one
st
reet
, b
ut a
“co
rner
par
cel”
can
hav
e ac
cess
to
2,
3 o
r 4
str
eets
Sim
ilar
to
fro
ntag
e, p
arce
l ty
pe,
as
def
ined
ab
ove
, is
an
imp
ort
ant
det
erm
inan
t o
f la
nd
valu
e, a
nd u
sefu
l fo
r d
evel
op
ing
hed
oni
c p
rici
ng m
od
els.
2.1.
1.3.
Bus
ines
s lo
cati
ons
As
men
tio
ned
ab
ove
, ra
w b
usin
ess
esta
blis
hmen
ts a
nd e
mp
loym
ent
dat
a is
b
est
sto
red
at
an
in
div
idua
l b
usin
ess
esta
blis
hmen
t le
vel,
rep
rese
nted
as
p
oin
ts
(Fig
ure
13).
R
epre
sent
ing
se
par
ate
bus
ines
s es
tab
lishm
ents
w
ith
sep
arat
e p
oin
t fe
atur
es i
s th
e m
ost
ro
bus
t an
d u
sefu
l w
ay o
f st
ori
ng t
he
bus
ines
s es
tab
lishm
ents
’ d
ata.
Po
ints
can
alw
ays
be
agg
reg
ated
or
join
ed t
o
oth
er la
rger
uni
ts (
e.g
. bui
ldin
gs
or
par
cels
) if
need
ed.
The
att
rib
ute
info
rmat
ion
of
bus
ines
s lo
cati
ons
sho
uld
typ
ical
ly in
dic
ate:
- T
he le
gal
nam
e o
f th
e b
usin
ess
- T
he n
ame
of
a p
aren
t co
mp
any
(if
app
licab
le)
Fig
ure
11: P
arce
l str
eet
fron
tag
e
Fig
ure
12.
Par
cel
typ
e, i
ndic
atin
g t
he n
umb
er o
f st
reet
s th
at a
p
arce
l has
dir
ect
acce
ss t
o.

16
- D
etai
led
ind
ustr
y cl
assi
ficat
ion
cod
e (e
.g. N
AIC
S)
at a
s d
etai
led
leve
l as
avai
lab
le (
e.g
. 6 d
igit
s), s
ee F
igur
e 7.
-
Yea
r es
tab
lishe
d a
t th
e p
rese
nt lo
cati
on
- N
umb
er o
f em
plo
yees
-
Long
itud
e an
d la
titu
de
coo
rdin
ates
-
Ad
dre
ss
- Z
IP c
od
e -
To
wn,
Reg
ion
CP
Ls m
ay c
ond
uct
gro
und
sur
veys
to
co
llect
bus
ines
s lo
cati
on
dat
a as
BP
S
colle
cts
dat
a o
nly
on
med
ium
and
lar
ge
bus
ines
s es
tab
lishm
ents
wit
h m
ore
th
an 2
0 e
mp
loye
es.
In t
he l
ong
er r
un,
accu
rate
bus
ines
s lo
cati
on
dat
a ca
n b
e co
llect
ed f
rom
DG
T
ax r
eco
rds
that
sho
uld
acc
oun
t fo
r al
l b
usin
ess
loca
tio
ns f
or
inco
me
tax
and
sa
les
tax
reas
ons
. A g
oo
d t
ax s
yste
m c
an p
rod
uce
amp
le s
pat
ial d
ata
annu
ally
, at
alm
ost
no
ext
ra c
ost
.
2.1.
1.4
. Tra
nspo
rtat
ion
netw
ork
The
mo
vem
ent
of
go
od
s an
d p
eop
le in
cit
ies
take
s p
lace
thr
oug
h th
ree
laye
rs
of
netw
ork
s: v
ehic
ular
ro
ads,
ped
estr
ian
pat
hs,
and
pub
lic t
rans
it n
etw
ork
s.
The
lat
ter
is o
ften
use
d t
og
ethe
r w
ith
the
ped
estr
ian
netw
ork
, an
d f
orm
s a
mul
ti-m
od
al n
etw
ork
. A
naly
ses
that
hel
p u
s un
der
stan
d h
ow
res
our
ces
and
fa
cilit
ies
are
acce
ssib
le t
o u
sers
thr
oug
h th
e m
enti
one
d n
etw
ork
s re
qui
re d
ata.
M
ost
ci
ties
co
llect
an
d
pre
par
e ro
ad
cent
erlin
e d
atas
ets
(Fig
ure
14)
and
so
met
imes
pub
lic t
rans
it n
etw
ork
dat
aset
s, b
ut o
ften
ove
rlo
ok
the
ped
estr
ian
netw
ork
. R
oad
ce
nter
lines
ar
e th
e m
ost
co
mm
onl
y us
ed
GIS
d
ata
for
acce
ssib
ility
ana
lyse
s, n
ot
onl
y fo
r ve
hicu
lar
mo
vem
ent,
but
als
o f
or
ped
estr
ian
mo
vem
ent.
A la
rge
par
t o
f p
edes
tria
n flo
w t
akes
pla
ce a
long
str
eets
. Ho
wev
er,
stre
et c
ente
rlin
es d
o n
ot
cap
ture
ped
estr
ian
rout
es t
hat
are
not
alo
ng r
oad
s (e
.g.
thro
ugh
uno
ccup
ied
par
cels
in
info
rmal
set
tlem
ents
). P
urel
y ve
hicu
lar
rout
es, s
uch
as t
oll
road
s, d
o n
ot
have
sid
ewal
ks. I
t is
, thu
s, r
eco
mm
end
ed t
hat
the
CP
Ls p
rep
are
geo
spat
ial d
atas
ets
of
stre
et c
ente
rlin
es, p
ublic
tra
nsit
line
s,
as w
ell
as s
idew
alks
and
oth
er p
edes
tria
n p
aths
(F
igur
e 13
). A
gre
at d
eal
of
a
Fig
ure
13.
Ped
estr
ian
Net
wor
k an
d
bus
ines
s lo
cati
ons,
B
ugis
, Si
ngap
ore
. S
ourc
e: C
ity
Fo
rm L
ab.
Eac
h b
usin
ess
esta
blis
hmen
t p
oint
co
ntai
ns a
set
of
attr
ibut
es d
escr
ibin
g t
he b
usin
ess.

17
city
’s c
ircu
lati
on
in I
ndo
nesi
a o
ccur
s o
n fo
ot.
Bey
ond
acc
essi
bili
ty a
naly
ses,
si
dew
alk
dat
abas
es w
ill b
e al
so u
sefu
l fo
r si
dew
alk
imp
rove
men
t p
lans
.
Str
eet
netw
ork
cen
terl
ine
dat
a m
ay b
e av
aila
ble
in
Ind
one
sian
cit
ies
via
thir
d-
par
ty d
ata
pro
vid
ers,
suc
h as
NA
VT
EQ
.
Po
tent
ial a
ttri
but
es f
or
road
net
wo
rk d
atas
ets
incl
ude:
- W
idth
or
num
ber
of
lane
s -
Typ
e (e
.g. p
aved
or
unp
aved
) -
Str
eet
nam
e -
Ro
ad c
lass
ifica
tio
n -
Tra
ffic
dir
ecti
ona
lity
Des
ired
att
rib
utes
fo
r p
edes
tria
n ne
two
rk d
atas
ets
incl
ude:
- W
idth
-
Typ
e (e
.g. i
ndo
or,
out
do
or,
out
do
or
but
she
lter
ed)
Po
tent
ial a
ttri
but
es f
or
pub
lic t
rans
po
rt n
etw
ork
dat
aset
s in
clud
e:
- Li
st o
f b
uses
usi
ng t
he s
egm
ent
- A
vera
ge
tim
e co
nsum
ed o
n th
e se
gm
ent
- F
req
uenc
y (o
f b
us o
r tr
ain
on
the
seg
men
t)
- S
tart
and
end
sta
tio
ns o
f th
e se
gm
ent
2.1.
1.5.
Adm
inis
trat
ive
boun
dari
es
Ad
min
istr
ativ
e b
oun
dar
ies
are
abst
ract
ex
tent
s th
at
def
ine
the
spat
ial
auth
ori
ty o
f g
ove
rnan
ce o
f co
mm
unit
ies
in a
hie
rarc
hica
l o
rder
fro
m n
atio
nal
leve
l to
sm
alle
st g
roup
ing
s in
nei
ghb
orh
oo
ds
e.g
. R
T o
r R
W i
n In
do
nesi
an
citi
es).
Ad
min
istr
ativ
e b
oun
dar
ies
are
com
mo
n sp
atia
l un
its
for
sto
ring
so
cio
-ec
ono
mic
dat
a.
Fig
ure
14:
Stre
et
cent
erlin
es,
Los
Ang
eles
, C
A,
and
th
eir
attr
ibut
es: d
rive
dir
ectio
n, r
oad
typ
e, r
oad
sur
face
typ
e, a
nd r
oad
se
gm
ent
leng
th.

18
BP
S p
rovi
des
cen
sus
dat
a at
the
vill
age
leve
l, as
wel
l as
hig
her
agg
reg
atio
n le
vels
suc
h as
cit
y, d
istr
ict,
or
pro
vinc
e. M
icro
dat
a in
Ind
one
sian
cit
ies
is
typ
ical
ly c
olle
cted
by
the
head
of
villa
ge
at t
he R
T le
vel (
Fig
ure
15).
The
CP
Ls
sho
uld
dig
itiz
e an
d d
istr
ibut
e th
e fo
llow
ing
set
of
adm
inis
trat
ive
bo
und
arie
s:
- R
egen
cy (
Kab
upat
en)
or
Cit
y (K
ota
) -
Sub
-dis
tric
t (K
ecam
atan
) -
Nei
ghb
orh
oo
d/v
illag
e (D
esa
or
Kel
urah
an)
- B
lock
(R
T/R
W)
Eac
h ad
min
istr
ativ
e p
oly
go
n sh
oul
d c
arry
a u
niq
ue id
enti
fier
nam
e. L
ow
er le
vel
po
lyg
ons
sho
uld
als
o i
ndic
ate
the
nam
es o
r ID
s o
f th
e hi
ghe
r le
vel
po
lyg
ons
th
ey a
re p
art
of.
The
po
lyg
on
shap
efile
s ca
n b
e lik
ely
ob
tain
ed f
rom
the
loca
l B
PS
off
ice
up t
o t
he n
eig
hbo
rho
od
lev
el.
Map
pin
g t
he R
T-R
W b
oun
dar
ies
coul
d r
equi
re c
olla
bo
rati
on
wit
h th
e he
ads
of
villa
ges
. Suc
h m
app
ing
has
bee
n p
revi
ous
ly im
ple
men
ted
in S
olo
.
2.1.
1.6.
Oth
er s
pati
al d
ata
The
dat
aset
s d
iscu
ssed
ab
ove
co
nsti
tute
s o
nly
the
mo
st e
ssen
tial
dat
a th
at
can
be
used
in
the
core
mo
dul
e o
f C
PLs
. M
uch
of
the
dat
a is
als
o d
irec
tly
usef
ul f
or
oth
er o
pti
ona
l CP
L m
od
ules
. The
list
of
spat
ial d
ata
that
cit
ies
colle
ct
or
alre
ady
have
can
be
very
exh
aust
ive.
Man
y o
f th
ose
dat
a ca
n b
e as
soci
ated
to
one
or
seve
ral s
pat
ial u
nits
men
tio
ned
ab
ove
; e.g
. ene
rgy
cons
ump
tio
n ca
n b
e as
soci
ated
to
bui
ldin
gs
and
par
cels
, cr
ime
rate
s to
any
ad
min
istr
ativ
e b
oun
dar
ies.
Ho
wev
er, t
here
are
so
me
oth
er d
ata
that
req
uire
the
ir o
wn
spat
ial
unit
s: f
or
exam
ple
, d
ata
on
wat
er i
nfra
stru
ctur
e o
r W
i-F
i ho
tsp
ot.
A l
ist
of
spat
ial
dat
a th
at C
PLs
are
rec
om
men
ded
to
co
llect
is
pro
vid
ed i
n th
e ta
ble
b
elo
w.
Kot
a:
Cit
y
Kec
amat
an:
Dis
tric
t
Kel
urah
an o
r D
esa:
V
illag
e
RT
-RW
: S
mal
lest
ad
dre
ssin
g u
nit
Fig
ure
15: A
dm
inis
trat
ive
sub
div
isio
ns in
Ind
ones
ia.
Sour
ce: J
ohn
T
aylo
r.

19
bla
nk
No
t av
aila
ble
but
des
ired
for
pro
po
sed
ana
lyti
cs
!!
!!
!!
!!
! A
vaila
ble
!
!!
!!
!!
!"
Ava
ilab
le in
som
e of
the
par
tici
pat
ing
cit
ies
!!
!!
!!
!!
!!
!!
!!
!!
!!IN
DO
NES
IA U
RB
AN
DA
TA
BP
N
BP
S
Bap
ped
a D
G
Spat
ial
Pla
nnin
g
DG
T
ax
Oth
er
Po
tent
ial
Sour
ces
BIG
N
ote
s
!!D
AT
A
1!IM
AG
ER
Y
!!H
igh-
reso
luti
on s
atel
lite
imag
e !!
!!"
"
!!
"
!!A
eria
l pho
tog
rap
hy
!!!!
"
"
!!
"
!!D
igit
al E
leva
tion
Mo
del
(D
EM
) o
f ur
ban
top
ogra
phy
!!
!!!!
!!!!
!!O
vera
ll ur
ban
ext
ent
(bui
lt-u
p a
rea
in t
he m
etro
are
a)
!!!!
!!!!
!!W
orld
B
ank
"
2!P
LA
NN
ING
RE
GU
LA
TIO
NS
!!
!!!!
!!!!
!!Z
onin
g p
lans
!!
!!!
! !!
!!F
loo
r ar
ea r
atio
s (g
ross
plo
t ra
tios)
, as
spec
ified
in r
egul
atio
ns
!!!!
! !
!!
!!La
nd u
se a
s sh
ow
n in
city
mas
ter
pla
n
!!!!
! !
!!
!!B
uild
ing
hei
ght
s lim
it, a
s sp
ecifi
ed in
reg
ulat
ions
!!
!!!
! !!

20
3!S
TA
TIS
TIC
AL
BO
UN
DA
RIE
S
!!!!
!!!!
!!
!!P
rovi
ncia
l ad
min
istr
ativ
e b
ound
arie
s !!!
!!!!
!!
!!M
unic
ipal
ad
min
istr
ativ
e b
ound
arie
s
!!!
!!!!
!!
!!D
istr
ict
adm
inis
trat
ive
bou
ndar
ies
!!!
!!!!
!!
!!S
ub-d
istr
ict
adm
inis
trat
ive
bou
ndar
ies
!!!
!!!!
!!
!!Z
ip c
od
e ar
eas
!!!!
!!!!
!!
!!C
ensu
s tr
acts
(V
illag
e)
!!!
!!!!
!!
4!D
EM
OG
RA
PH
IC C
HA
RA
CT
ER
IST
ICS
!!!!
!!!!
!!
!!R
esid
enti
al p
op
ulat
ion
(cen
sus)
!!!
!!!!
!!
B
PS
dat
a ar
e ag
gre
gat
ed a
t vi
llag
e le
vel
!!R
esid
enti
al p
op
ulat
ion
by
sex
!!!
!!!!
!!
B
PS
dat
a ar
e ag
gre
gat
ed a
t vi
llag
e le
vel
!!R
esid
enti
al p
op
ulat
ion
by
age
gro
up
!!!
!!!!
!!
B
PS
dat
a ar
e ag
gre
gat
ed a
t vi
llag
e le
vel
!!R
esid
enti
al p
op
ulat
ion
by
resi
den
ce t
ype
!!!
!!!!
!!
B
PS
dat
a ar
e ag
gre
gat
ed a
t vi
llag
e le
vel
!!H
ous
ehol
d s
urve
ys: h
ouse
hold
inco
me
!!!
!!!!
!!
B
PS
dat
a ar
e ag
gre
gat
ed a
t vi
llag
e le
vel
!!H
ous
ehol
d s
urve
ys: f
amily
siz
e !!!
!!!!
!!
B
PS
dat
a ar
e ag
gre
gat
ed a
t vi
llag
e le
vel

21
5!U
RB
AN
FO
RM
!!
!!!!
!!!!
!!O
bse
rved
flo
or
area
rat
ios
!!!!
!!!!
!!
!!O
bse
rved
land
use
!!
!!
!!
!!O
ffic
ially
rec
og
nize
d in
form
al s
ettl
emen
ts
!!!!
"
"
!!W
orld
B
ank
!!B
uild
ing
flo
or a
reas
!!
!!"!
!!!!
!!C
ity b
lock
s !!
!!"
"
!!
!!P
arce
l bou
ndar
ies,
ow
ners
hip
!
!!"
"
!
!!B
uild
ing
foo
tpri
nts
!!!!
"
"
!!
!!B
uild
ing
hei
ght
s !!
!!!!
!!!!
!!B
uild
ing
ag
es
!!!!
!!!!
!!
!!B
uild
ing
use
s (e
.g. r
esid
entia
l, co
mm
erci
al, e
tc.)
!!
!!
!!
!!B
uild
ing
typ
es (
e.g
. wal
k-up
, con
do,
ro
w-h
ous
e, k
amp
ong
, in
form
al)*
!!
!!!!
!!!!
!!B
uild
ing
ad
dre
sses
/ZIP
Cod
es
!!!!
!!!!
!!
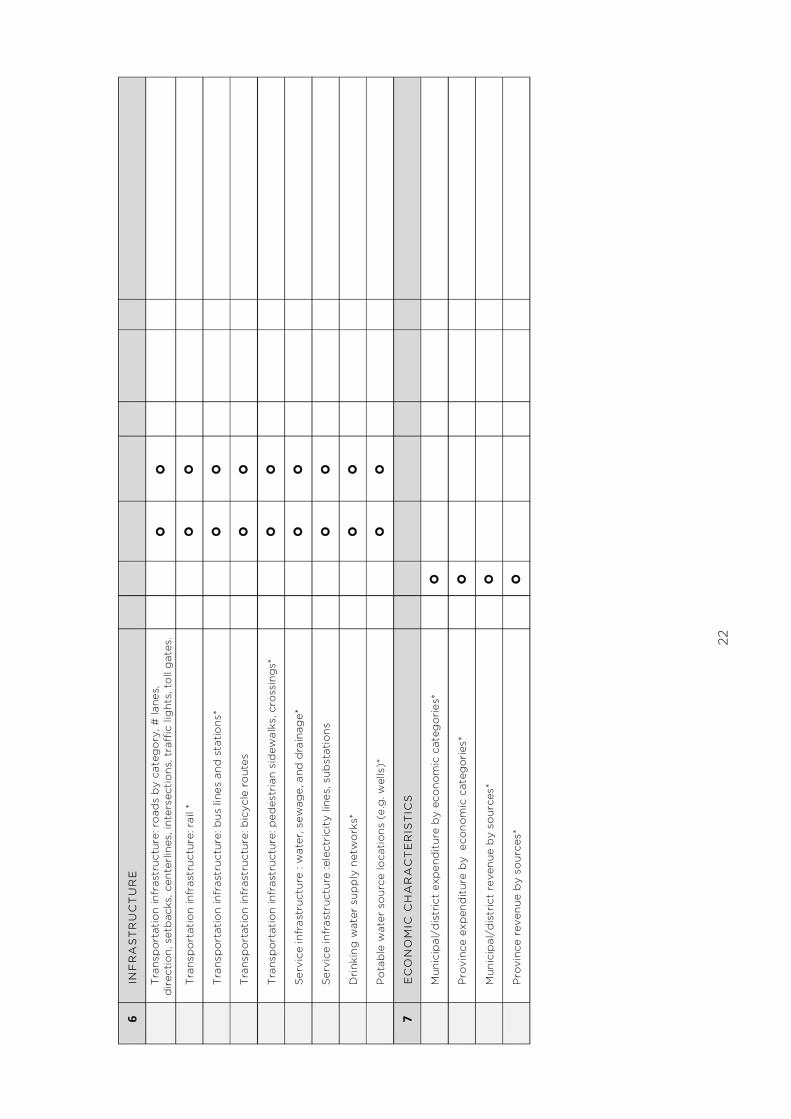
22
6!IN
FR
AS
TR
UC
TU
RE
!!
!!!!
!!!!
!!T
rans
por
tati
on in
fras
truc
ture
: ro
ads
by
cate
gor
y, #
lane
s,
dir
ecti
on, s
etb
acks
, cen
terl
ines
, int
erse
ctio
ns, t
raff
ic li
ght
s, t
oll
gat
es.
!!!!
"
"
!!
!!T
rans
por
tati
on in
fras
truc
ture
: rai
l *
!!!!
"
"
!!
!!T
rans
por
tati
on in
fras
truc
ture
: bus
line
s an
d s
tatio
ns*
!!!!
"
"
!!
!!T
rans
por
tati
on in
fras
truc
ture
: bic
ycle
ro
utes
!!
!!"
"
!!
!!T
rans
por
tati
on in
fras
truc
ture
: ped
estr
ian
sid
ewal
ks, c
ross
ing
s*
!!!!
"
"
!!
!!Se
rvic
e in
fras
truc
ture
: w
ater
, sew
age,
and
dra
inag
e*
!!!!
"
"
!!
!!Se
rvic
e in
fras
truc
ture
:ele
ctri
city
line
s, s
ubst
atio
ns
!!!!
"
"
!!
!!D
rink
ing
wat
er s
upp
ly n
etw
ork
s*
!!!!
"
"
!!
!!P
ota
ble
wat
er s
our
ce lo
cati
ons
(e.g
. wel
ls)*
!!
!!"
"
!!
7!E
CO
NO
MIC
CH
AR
AC
TE
RIS
TIC
S
!!!!
!!!!
!!
!!M
unic
ipal
/dis
tric
t ex
pen
dit
ure
by
econ
omic
cat
egor
ies*
!!
"
!!!!
!!
!!P
rovi
nce
exp
end
itur
e b
y e
cono
mic
cat
egor
ies*
!!
"
!!!!
!!
!!M
unic
ipal
/dis
tric
t re
venu
e b
y so
urce
s*
!!"
!!!!
!!
!!P
rovi
nce
reve
nue
by
sour
ces*
!!
"
!!!!
!!

23
8!E
ST
AB
LIS
HM
EN
TS
!!
!!!!
!!!!
!!F
irm d
istr
ibut
ion
(Ind
ivid
ual e
stab
lishm
ent
loca
tion
s)*
!!!!
!!!!
!!
!!Jo
b d
istr
ibut
ion
(job
s p
er a
rea/
typ
e)*
!!!!
!!!!
!!
!!P
oin
ts o
f in
tere
st (
mus
eum
s, in
stit
utio
ns)*
!!
!!"
"
!!
!!P
ublic
inst
itut
ions
(ho
spita
ls, p
olic
e st
atio
ns, l
ibra
ries
etc
.)*
!!!!
"
"
!!
!!P
ublic
inst
itut
ions
: sch
ools
(w
ith le
vels
, and
no.
stu
den
ts)*
!!
!!"
"
!!
!!P
ublic
inst
itut
ions
: ho
spit
als
(wit
h sp
ecia
ltie
s, a
nd c
apac
itie
s)*
!!!!
"
"
!!
!!P
ublic
inst
itut
ions
: oth
ers
(det
aile
d)*
!!
!!"
"
!!
9!N
AT
UR
AL
HA
ZA
RD
!!
!!!!
!!!!
!!Se
ism
ic h
azar
d z
ones
!!
!!
!!
Wor
ld
Ban
k
!!F
loo
d z
one
s !!
!!"
"
!!W
orld
B
ank
!!La
nd t
opog
rap
hy (
poi
nts
/ to
po
lines
) !!
!!"
"
!!W
orld
B
ank

24
10!
LA
ND
AN
D R
EA
L E
ST
AT
E M
AR
KE
T
!!!!
!!!!
!!
!!La
nd c
adas
ter:
par
cels
(ta
x, t
rans
acti
ons,
etc
.)*
! !!
!!!!
!
!!La
nd p
rice
s*
!!
!!!!
! D
evel
oper
s &
Bro
kers
DG
Tax
est
imat
es d
o no
t o
ften
ind
icat
e re
al m
arke
t va
lue
!!H
ous
ing
pri
ces*
!!!!
!!!
Dev
elop
ers
& B
roke
rs
D
G T
ax e
stim
ates
do
not
oft
en in
dic
ate
real
mar
ket
valu
e
!!C
omm
erci
al r
eal e
stat
e p
rice
s*
!!!!
!!!!
! D
evel
oper
s &
Bro
kers
DG
Tax
est
imat
es d
o no
t o
ften
ind
icat
e re
al m
arke
t va
lue
!!H
ous
ing
Ren
ts*
!!!!
!!!!
! D
evel
oper
s &
Bro
kers
DG
Tax
est
imat
es d
o no
t o
ften
ind
icat
e re
al m
arke
t va
lue
!!C
omm
erci
al r
ents
* !!
!!!!
!!!
Dev
elop
ers
& B
roke
rs
D
G T
ax e
stim
ates
do
not
oft
en in
dic
ate
real
mar
ket
valu
e
!!La
nd r
ents
* !!
!!!!
!!!
Dev
elop
ers
& B
roke
rs
D
G T
ax e
stim
ates
do
not
oft
en in
dic
ate
real
mar
ket
valu
e
!!H
ous
ing
ten
ure
(vac
ant,
ow
ner-
occu
pie
d, r
enta
l occ
upie
d)
!!!!
!!!!
Dev
elop
ers
& B
roke
rs
!!R
esid
enti
al u
nit
size
s/ n
o. o
f ro
om
s !!
!!!!
!!!!
Dev
elop
ers
& B
roke
rs
!!Is
sued
bui
ldin
g p
erm
its
wit
hin
the
pas
t x
per
iod
* !!
!!!!
! !!
!!Is
sued
dem
olit
ion
per
mit
s w
ithi
n th
e p
ast
x p
erio
d*
!!!!
!!!
!!
!!P
roje
cts
curr
ently
in c
onst
ruct
ion
(res
iden
tial
/com
mer
cial
/ind
ustr
ial/
off
ice/
oth
er)
!!!!
!!!
!!D
evel
oper
s &
Bro
kers
!!Sa
les
Pri
ces
/ R
ate
of
Sale
s at
eac
h ne
w d
evel
opm
ent
curr
entl
y on
the
mar
ket
!!!!
!!!!
!!D
evel
oper
s &
Bro
kers
!!Li
st o
f al
l per
mit
s re
qui
red
for
new
dev
elop
men
ts b
y la
nd u
se
typ
e an
d t
ypic
al d
urat
ions
. !!
!!!!
! !!

25
2.2.
DA
TA P
LATF
OR
M
To
ful
fill
thei
r p
rim
ary
go
al o
f as
sem
blin
g,
mai
ntai
ning
and
dis
trib
utin
g l
arg
e g
eosp
atia
l d
atab
ases
, th
e C
ity
Pla
nnin
g L
abs
need
a d
igit
al g
eosp
atia
l d
ata
pla
tfo
rm t
hat
sati
sfie
s fiv
e fu
ndam
enta
l req
uire
men
ts. T
he p
latf
orm
sho
uld
:
! A
llow
dat
a to
be
effic
ient
ly a
nd c
onv
enie
ntly
sto
red
and
man
aged
! A
llow
dat
a to
be
shar
ed a
cro
ss d
iffer
ent
city
dep
artm
ents
or
wit
h m
emb
ers
of
the
pub
lic o
ver
Inte
rnet
bro
wse
rs
! E
nab
le a
ll d
ata
man
agem
ent
op
erat
ions
to
be
per
form
ed f
rom
a l
oca
l ne
two
rked
co
mp
uter
! E
nab
le u
sers
to
do
wnl
oad
dat
a la
yers
tha
t th
ey h
ave
secu
rity
cle
aran
ce t
o
acce
ss
! E
nab
le t
he e
nd-u
sers
to
int
erac
t w
ith
the
dat
aset
s o
n a
web
-bro
wse
r, b
y q
uery
ing
the
ir a
ttri
but
es,
ove
rlay
ing
diff
eren
t d
ata
laye
rs,
usin
g s
imp
le b
ase-
map
s to
sit
uate
the
info
rmat
ion,
and
ove
rlay
ing
per
sona
l inf
orm
atio
n la
yers
on
pub
lishe
d m
aps.
The
ca
pac
ity
to
op
erat
e b
asic
sp
atia
l fu
ncti
ons
(e
.g.
spat
ial
sear
ch,
mea
sure
men
t o
r p
roxi
mit
y se
arch
, o
verl
ay f
unct
ion
etc.
) w
oul
d b
e d
esir
able
ad
dit
iona
l fun
ctio
ns f
or
the
end
use
rs, t
houg
h no
t a
first
-ord
er p
rio
rity
.
The
re
is
a co
nsid
erab
le
list
of
op
en
sour
ce
and
p
rop
riet
ary
GIS
se
rver
te
chno
log
ies
avai
lab
le
for
man
agin
g
spat
ial
dat
a.
Arc
GIS
S
erve
r,
Arc
GIS
O
nlin
e,
and
M
apIn
fo
Sp
atia
l S
erve
r ar
e am
ong
th
e m
ost
co
mm
onl
y us
ed
pro
pri
etar
y o
pti
ons
. O
n th
e o
ther
ha
nd,
Geo
Ser
ver,
O
pen
Geo
S
uite
o
r G
eoN
od
e ar
e so
me
exam
ple
s o
f w
idel
y us
ed
op
en
sour
ce
web
-bas
ed
geo
spat
ial
cont
ent
man
agem
ent
pla
tfo
rms.
The
Wo
rld
Ban
k’s
Pla
tfo
rm f
or
Urb
an M
anag
emen
t an
d A
naly
sis
(PU
MA
), c
urre
ntly
und
er d
evel
op
men
t, i
s al
so a
po
tent
ial o
pen
so
urce
op
tio
n fo
r th
e C
ity
Pla
nnin
g L
abs.
Ap
art
fro
m t
he
init
ial c
ost
diff
eren
ce, f
ast
setu
p t
ime,
and
off
-the
-she
lf av
aila
bili
ty o
f fu
ncti
ons
Fig
ure
16.
New
Yo
rk C
ity
Op
enD
ata.
Mor
e th
an 1
500
sp
atia
l d
atas
ets
are
pub
lic a
vaila
ble
thr
oug
h th
is g
eosp
atia
l p
latf
orm
, so
me
upd
ated
d
aily
. So
ftw
are:
O
pen
Geo
S
uite
E
nter
pri
se
Ed
itio
n.

26
are
the
mai
n ad
vant
ages
of
pro
pri
etar
y p
latf
orm
s. O
n th
e o
ther
han
d,
op
en
sour
ce p
latf
orm
s al
low
fo
r a
hig
her
leve
l of
cust
om
izat
ion.
So
me
Ind
one
sian
ci
ties
an
d
agen
cies
ha
ve
alre
ady
dev
elo
ped
th
eir
ow
n p
latf
orm
s (F
igur
e 17
) us
ing
bo
th p
rop
riet
ary
and
op
en s
our
ce o
pti
ons
. F
or
exam
ple
fo
r th
eir
per
mit
ting
sys
tem
s, S
urab
aya
has
utili
zed
Arc
GIS
Onl
ine,
w
hile
Bal
ikp
apan
has
dev
elo
ped
its
op
en s
our
ce p
latf
orm
. At
the
nati
ona
l lev
el,
BIG
, ha
s d
evel
op
ed a
n in
teg
rate
d o
pen
-so
urce
/pro
pri
etar
y (A
rcG
IS o
nlin
e)
dat
a-sh
arin
g p
latf
orm
. In
thei
r d
ecis
ion
for
dat
a p
latf
orm
op
tio
ns, C
PLs
’ sho
uld
co
nsid
er p
latf
orm
s th
e re
spec
tive
cit
ies
are
curr
entl
y us
ing
.
In a
dd
itio
n to
geo
spat
ial
cont
ent
man
agem
ent
soft
war
e, e
ach
CP
L re
qui
res
serv
er s
pac
e fo
r st
ori
ng it
s g
eosp
atia
l co
nten
t. C
PLs
can
ho
st t
heir
geo
spat
ial
dat
a o
n lo
cal
serv
ers
or
use
netw
ork
ed e
nter
pri
se s
tora
ge
syst
ems,
suc
h as
cl
oud
sto
rag
e o
n A
maz
on
Web
Ser
vice
s (A
WS
). W
hile
sto
ring
dat
a o
n a
clo
ud
can
be
mo
re e
xpen
sive
tha
n st
ora
ge
on
a lo
cal s
erve
r, o
utso
urci
ng c
oul
d a
lso
p
rovi
de
oth
er b
enef
its.
Clo
ud s
tora
ge
syst
ems
are
typ
ical
ly m
ore
sta
ble
tha
n lo
cal
host
s,
par
ticu
larl
y re
silie
nt
to
po
wer
sh
utd
ow
ns
and
hu
man
er
rors
, ke
epin
g
dat
a co
nsta
ntly
o
nlin
e.
Usi
ng
clo
ud
sto
rag
e al
so
shift
s th
e m
aint
enan
ce b
urd
en f
rom
CP
Ls t
o t
he s
ervi
ce p
rovi
der
. P
rofe
ssio
nal
dat
a st
ora
ge
syst
ems
off
er q
ualif
ied
tec
hnic
al a
ssis
tant
s w
ith
serv
ice
cont
ract
s.
Geo
spat
ial
cont
ent
man
agem
ent
soft
war
e ca
n b
e us
ed t
o s
et u
p d
iffer
ent
leve
ls o
f se
curi
ty a
cces
s to
diff
eren
t d
ata
user
s.
It is
po
ssib
le t
hat
CP
Ls u
se a
diff
eren
t p
latf
orm
s in
sho
rt a
nd lo
ng r
un. A
rcG
IS
onl
ine
in c
om
bin
atio
n w
ith
Am
azo
n cl
oud
sto
rag
e, f
or
inst
ance
, co
uld
be
an
op
tio
n fo
r sh
ort
ter
m, a
s it
is e
asy
and
fas
t to
set
up
wit
h lo
w in
itia
l co
st, w
hile
C
PLs
dev
elo
p t
heir
cus
tom
ized
op
en-s
our
ce p
erm
anen
t p
latf
orm
s.
Fig
ure
17. S
olo
Kit
a K
ota,
the
inte
ract
ive
web
-bas
ed m
ap f
or
the
city
of
Sura
kart
a (S
olo
). S
oftw
are:
Go
ogle
Map
s A
PI.
Fig
ure
18. M
IT G
eoW
eb d
ata
shar
ing
and
vis
ualiz
atio
n p
latf
orm
.

27
Fig
ure
19.
One
o
f th
e d
ata
pla
tfor
ms
of
the
Cit
y of
C
amb
rid
ge
– C
amb
rid
ge
City
Vie
wer
– t
hrou
gh
whi
ch a
la
rge
amou
nt
of
geo
spat
ial
dat
a in
clud
ing
b
uild
ing
s,
par
cels
, p
aved
su
rfac
es,
sid
ewal
ks,
stre
et
cent
erlin
es,
tree
s, a
nd in
fras
truc
ture
sys
tem
s is
pub
lishe
d.
Fig
ure
20.
Cen
sus
blo
ck
leve
l d
emo
gra
phi
c d
ata
of
Cam
bri
dg
e, B
osto
n an
d S
omer
ville
, fr
om C
ensu
s B
urea
u p
latf
orm
.

28
SPA
TIA
L G
RO
WTH
AN
D C
HA
NG
E A
NA
LYTI
CS

29
3.1.
SPA
TIA
L G
RO
WTH
AN
D C
HA
NG
E
Mo
nito
ring
tre
nds
in s
pat
ial d
ata
is a
ver
y us
eful
ana
lyti
cal t
echn
ique
tha
t ca
n p
rovi
de
valu
able
inf
orm
atio
n fo
r p
lann
ers.
Eff
ecti
ve p
lann
ing
dec
isio
ns a
re
bui
lt
upo
n sh
ort
an
d
long
-ter
m
pro
ject
ions
o
f th
e sp
atia
l d
istr
ibut
ion
of
reso
urce
s an
d d
eman
d.
The
se p
roje
ctio
ns a
re o
ften
mad
e b
y ex
trap
ola
ting
cu
rren
t tr
end
s in
sp
atia
l dat
a. F
ore
cast
ing
the
sp
atia
l dis
trib
utio
n o
f re
sour
ces
(e.g
. ho
usin
g,
job
s, a
gri
cult
ural
lan
d)
and
dem
and
(re
pre
sent
ed,
for
inst
ance
, b
y p
op
ulat
ion
and
inc
om
e) r
elie
s o
n an
und
erst
and
ing
of
curr
ent
and
pas
t tr
end
s.
Whi
le p
roje
cted
sp
atia
l va
lues
are
cru
cial
inp
uts
for
mo
re c
om
ple
x st
atis
tica
l m
od
els,
a s
imp
le c
om
par
iso
n o
f p
roje
cted
val
ues
wit
h b
ench
mar
ks f
rom
oth
er
citi
es
or
exis
ting
co
ndit
ions
ca
n p
rovi
de
a g
roun
d
for
evid
ence
-bas
ed
dec
isio
n-m
akin
g.
Bas
ed o
n p
roje
cted
val
ues,
pla
nner
s ca
n d
ecid
e w
heth
er
inte
rven
ing
act
ions
sho
uld
be
take
n to
str
eng
then
, sl
ow
do
wn
or
reve
rse
curr
ent
tren
ds.
Mo
nito
ring
the
shi
fts
in d
emo
gra
phi
c d
ata,
fo
r in
stan
ce, c
an r
evea
l a s
igni
fican
t in
crea
se i
n th
e nu
mb
er o
f ho
useh
old
s w
ith
youn
g c
hild
ren
in p
erip
hera
l ar
eas
of
a ci
ty,
whi
ch
can
incr
ease
th
e d
eman
d
for
scho
ols
, ho
spit
als,
o
r fo
od
re
sour
ces.
Evi
den
ce o
f su
ch a
gro
win
g d
eman
d a
llow
s p
lann
ers
to d
ecid
e if
new
fac
iliti
es a
re n
eed
ed t
o s
upp
ort
thi
s tr
end
or
if p
olic
ies
are
req
uire
d s
low
it
do
wn.
Und
erst
and
ing
the
rat
e o
f p
op
ulat
ion
gro
wth
sho
uld
fo
rm t
he b
asis
fo
r la
nd-u
se p
lann
ing
.
Alt
houg
h m
oni
tori
ng t
rend
s in
sp
atia
l d
ata
do
es n
ot
exp
lain
the
ir u
nder
lyin
g
caus
es, a
nd t
hus
cann
ot
sug
ges
t w
hat
inte
rven
tio
ns w
ill a
ffec
t th
em, i
t ca
n at
le
ast
fram
e th
e is
sues
tha
t p
lann
ers
sho
uld
fo
cus
on.
Fig
ure
21.
Ind
ones
ian
citi
es a
re f
acin
g r
apid
gro
wth
wit
h an
av
erag
e an
nual
urb
aniz
atio
n ra
te o
f 4
.2%
bet
wee
n 19
93 a
nd
200
7.

30
3.1.
1. M
appi
ng C
hang
e in
Spa
tial
Val
ues
A c
onv
enie
nt w
ay o
f m
oni
tori
ng,
sto
ring
, an
d r
epre
sent
ing
cha
nge
in s
pat
ial
pro
per
ties
is t
o in
clud
e ch
ang
e va
lues
– e
ithe
r ab
solu
te c
hang
e o
r it
s ra
te –
in
the
attr
ibut
es o
f ea
ch s
pat
ial
feat
ure
(Fig
ure
26).
Fo
r ex
amp
le, c
ensu
s b
lock
s ca
n co
ntai
n at
trib
utes
th
at
rep
rese
nt
the
chan
ge
in
thei
r b
uild
ing
st
ock
, p
arti
cula
r d
emo
gra
phi
c g
roup
, em
plo
ymen
t,
land
us
e co
vera
ge,
en
erg
y co
nsum
pti
on
or
per
cap
ita
area
of
gre
en s
pac
e in
a g
iven
per
iod
of
tim
e.
3.1.
2. S
pati
otem
pora
l dat
a If
eve
ry s
pat
ial
feat
ure
cont
ains
sta
rt a
nd e
nd t
ime
dat
a, w
e ca
n vi
sual
ize
snap
sho
ts o
f d
iffer
ent
po
ints
of
tim
e, u
sing
onl
y o
ne d
atas
et (
Fig
ure
22).
S
pat
iote
mp
ora
l d
atab
ases
are
use
ful
whe
n sp
atia
l un
its
them
selv
es c
hang
e o
ver
tim
e, n
ot
mer
ely
the
valu
e o
f th
eir
attr
ibut
es. C
hang
es in
bui
ldin
g s
tock
or
bus
ines
s es
tab
lishm
ents
can
be
bes
t st
ore
d b
y sp
atio
tem
po
ral
dat
abas
es,
as
the
spat
ial
feat
ures
cha
nge
ove
r ti
me
– so
me
bui
ldin
gs
are
dem
olis
hed
and
so
me
are
add
ed t
o t
he b
uild
ing
sto
ck o
ver
tim
e.
3.1.
3. T
he e
xpan
sion
of u
rban
ext
ent
The
mo
st f
und
amen
tal a
spec
t o
f g
row
th a
nd c
hang
e in
cit
ies
is h
ow
muc
h an
d
whe
re u
rban
are
as a
re e
mer
gin
g.
The
exp
ansi
on
in t
he b
oun
dar
y o
f ci
ties
re
pre
sent
s a
shift
in
land
use
co
vera
ge.
T
he m
ain
sour
ce o
f la
nd f
or
a ci
ty’s
g
row
th
is
usua
lly
agri
cult
ural
o
r fo
rest
la
nd.
Giv
en
the
sig
nific
ant
role
o
f ag
ricu
ltur
e se
cto
r in
Ind
one
sia’
s ec
ono
my,
ann
ual
loss
of
agri
cult
ural
lan
d c
an
sig
nific
antl
y re
duc
e it
s ci
ties
’ fo
od
sec
urit
y.
Fig
ure
22. S
pat
iote
mp
oral
dat
aset
s. E
ach
feat
ure
have
sta
rt
and
end
tim
e, a
llow
ing
for
mon
itor
ing
cha
nge
in s
pat
ial
feat
ures
: for
exa
mp
le in
the
ir si
ze, l
ocat
ion
or e
xist
ence
.

31
Ove
rlay
ing
sna
psh
ots
of
the
city
’s e
xten
t o
ver
tim
e ca
n ca
ptu
re t
rend
s in
p
hysi
cal
exp
ansi
on.
A f
utur
e ex
tent
can
be
pro
ject
ed b
ased
on
the
pas
t2 . H
ow
ever
, dis
ting
uish
ing
the
urb
an l
and
co
vera
ge
fro
m n
on-
urb
an l
and
ext
ent
of
a m
etro
po
litan
are
a is
no
t a
triv
ial
task
, an
d d
epen
ds
on
the
def
init
ion
of
“urb
an la
nd”.
Enh
ance
men
ts in
rem
ote
-sen
sing
tec
hno
log
ies
and
ava
ilab
ility
of
hig
h-re
solu
tio
n sa
telli
te im
ager
y ha
ve m
ade
accu
rate
geo
-ref
eren
ced
map
s o
f ur
ban
ext
ent
avai
lab
le f
or
man
y ci
ties
. Ext
ent
bo
und
arie
s fo
r m
ost
med
ium
to
la
rge
citi
es in
Asi
a ca
n b
e o
bta
ined
up
on
req
uest
fro
m A
nnem
arie
Sch
neid
er a
t th
e U
nive
rsit
y o
f W
isco
nsin
. By
ove
rlay
ing
diff
eren
t sn
apsh
ots
of
urb
an e
xten
t o
ver
tim
e ca
n no
t o
nly
cap
ture
the
gro
wth
rat
e, b
ut a
lso
its
char
acte
r. W
e ca
n d
isti
ngui
sh b
etw
een
leap
fro
g g
row
th, e
dg
e g
row
th o
r in
fill
dev
elo
pm
ents
jus
t b
y o
verl
ayin
g t
he e
xten
t m
aps
of
diff
eren
t ti
mes
(F
igur
e 23
).
Pro
ject
ing
the
fut
ure
exte
nt o
f a
city
als
o r
equi
res
info
rmat
ion
abo
ut b
uild
able
ar
ea a
roun
d it
. Geo
gra
phi
cal c
ons
trai
nts
such
as
wat
er b
od
ies,
ste
ep la
nds,
or
pro
tect
ed f
ore
sts
po
se a
bar
rier
to
gro
wth
and
sho
uld
be
acco
unte
d f
or
in
gro
wth
p
roje
ctio
ns.
The
av
aila
bili
ty
of
spac
e no
t o
nly
affe
cts
the
rate
o
f p
oss
ible
g
row
th
but
al
so
its
char
acte
r.
Cit
ies
that
ar
e co
nstr
aine
d
by
geo
gra
phi
c fe
atur
es,
such
as
wat
er b
od
ies
or
stee
ply
slo
ped
lan
d,
gro
w v
ery
diff
eren
tly
fro
m t
hose
wit
h no
bar
rier
s ar
oun
d t
hem
. The
fo
rmer
, fo
r in
stan
ce,
leav
e no
ro
om
fo
r le
apfr
og
dev
elo
pm
ent,
set
ser
ious
lim
its
on
spra
wl,
and
ten
d
to d
evel
op
at
hig
her
den
siti
es (
e.g
. H
ong
Ko
ng).
The
lat
ter
allo
w f
or
low
er
den
sity
dev
elo
pm
ent
and
fra
gm
ente
d g
row
th (
e.g
. Lo
s A
ngel
es).
No
te t
hat
The
gro
wth
and
cha
nge
map
pin
g w
e ha
ve d
iscu
ssed
so
far
, exa
min
ed t
rend
s in
a s
ing
le v
aria
ble
ove
r ti
me.
Ana
lyti
cal t
echn
ique
s th
at a
re p
rese
nted
in t
he -
follo
win
g, A
cces
sib
ility
Ana
lysi
s, Im
pac
t an
alys
is, a
nd s
pat
ial s
tati
stic
al m
od
els,
ca
n b
e us
ed t
o s
tud
y ch
ang
e am
ong
mul
tip
le s
ets
of
spat
ial d
ata.
2 A
m
ore
ac
cura
te
pro
ject
ion
of
bo
und
ary
req
uire
s co
ntro
lling
fo
r d
eter
min
ants
su
ch
as
po
pul
atio
n, a
nd e
cono
mic
per
form
ance
of
the
city
. T
his
req
uire
s re
gre
ssio
n m
od
els,
whi
ch a
re
exp
lain
ed la
ter
in t
his
rep
ort
.
Fig
ure
23:
Jaka
rta
200
0-2
010
: ur
ban
ex
pan
sion
, ca
teg
oriz
ed b
y ex
pan
sio
n ty
pe
(fro
m 1
,158k
m2
to 1,
520
km2)
Ed
ge
gro
wth
262
Sq
.Km
Le
apfr
og g
row
th 7
3 Sq
.Km
In
fill g
row
th 2
4 S
q.K
m

32
Fig
ure
26.
Pop
ulat
ion
gro
wth
bet
wee
n 19
90 a
nd 2
00
0 i
n C
amb
rid
ge,
Blo
cks
rep
rese
nted
in
whi
te e
xper
ienc
ed t
he lo
wes
t ch
ang
e (g
row
th o
r d
eclin
e) in
the
pop
ulat
ion
amo
ng a
ll ce
nsus
b
lock
s of
Cam
brid
ge.
Fig
ure
24. P
opul
atio
n of
cen
sus
blo
cks
in C
amb
ridg
e, 19
90.
Fig
ure
25. P
opul
atio
n of
cen
sus
blo
cks
in C
amb
ridg
e, 2
00
0.

33
3.2.
AC
CES
SIB
ILIT
Y A
NA
LYSI
S
Und
erst
and
ing
ho
w a
cces
sib
le t
he r
eso
urce
s o
f a
city
are
to
peo
ple
is
key
to
pla
nnin
g n
ew i
nfra
stru
ctur
es.
Acc
essi
bili
ty a
naly
ses
inve
stig
ate
how
lo
cati
ons
o
f o
ne
gro
up
of
phe
nom
ena
(ori
gin
s)
are
rela
ted
to
an
oth
er
gro
up
of
phe
nom
ena
(des
tina
tio
ns).
The
se s
pat
ial r
elat
ions
can
be
des
crib
ed in
var
ious
w
ays.
Acc
essi
bili
ty c
an b
e as
sess
ed a
long
tra
nsp
ort
atio
n ne
two
rks,
or
alo
ng
idea
lized
co
ntin
uous
sp
ace
that
sim
plif
ies
cons
trai
nts
to m
ove
men
t (F
igur
e 27
).
It
can
also
b
e d
escr
ibed
g
eom
etri
cally
(b
ased
o
n d
ista
nce)
o
r to
po
log
ical
ly (
e.g
. bas
ed o
n nu
mb
er o
f tu
rns
on
a ne
two
rk, o
r nu
mb
er o
f st
eps
in a
to
po
log
ical
gri
d).
In
this
rep
ort
we
focu
s o
n ex
amp
les
of
acce
ssib
ility
an
alys
es t
hat
are
cond
ucte
d o
ver
urb
an t
rans
po
rtat
ion
netw
ork
s. A
cces
sib
ility
m
easu
res
such
as
Gra
vity
and
Rea
ch a
re c
om
put
ed a
t a
fine
reso
luti
on
for
ind
ivid
ual b
uild
ing
s o
r ad
dre
ss p
oin
ts o
ver
a ne
two
rk o
f ci
ty s
tree
ts.
Acc
essi
bili
ty a
naly
sis
help
s us
id
enti
fy u
nder
serv
ed a
reas
, fo
r in
stan
ce,
area
s w
ith
low
p
edes
tria
n ac
cess
ibili
ty
to
scho
ols
(F
igur
e 31
).
Co
mp
arin
g
acce
ssib
ility
val
ues
of
ind
ivid
ual
ori
gin
s ac
ross
the
cit
y, o
r co
mp
arin
g t
heir
va
lues
to
b
ench
mar
ks
fro
m
oth
er
citi
es,
allo
ws
us
to
det
ect
area
s w
ith
pro
ble
mat
ic a
cces
sib
ility
val
ues.
Acc
essi
bili
ty a
naly
ses
also
pro
vid
e in
put
s to
oth
er a
naly
tics
pro
po
sed
in
this
re
po
rt.
The
y ar
e ke
y d
eter
min
ants
of
land
and
rea
l p
rop
erty
val
ues,
lan
d u
se
pat
tern
s, a
nd b
usin
ess
clus
teri
ng.
Acc
essi
bly
val
ues
can
be
used
in
hed
oni
c p
rici
ng m
od
els
for
land
and
rea
l pro
per
ties
. Po
tent
ial i
mp
acts
of
new
net
wo
rk
infr
astr
uctu
re,
such
as
b
rid
ges
, ro
ads,
b
us
rout
es,
or
sid
ewal
ks,
can
be
anal
yzed
usi
ng b
efo
re a
nd a
fter
acc
essi
bili
ty v
alue
s.
3.2.
1.A
cces
sibi
lity
Mea
sure
s A
mo
ng a
cces
sib
ility
met
rics
, R
each
and
Gra
vity
met
rics
are
sim
ple
to
sp
ecify
an
d c
an b
e in
terp
rete
d m
ost
int
uiti
vely
. R
each
and
Gra
vity
met
rics
can
be
com
put
ed o
ver
real
tra
nsp
ort
atio
n ne
two
rks,
and
be
imp
lem
ente
d f
or
vari
ous
sp
atia
l un
its,
in
clud
ing
b
uild
ing
s,
add
ress
p
oin
ts,
par
cels
o
r K
T
zone
s.
Fig
ure
27.
Acc
essi
bili
ty
typ
es.
Euc
lidea
n d
ista
nce,
ne
twor
k d
ista
nce,
num
ber
of
turn
s (t
opo
log
ical
), n
umb
er
of s
tep
s in
a g
rid
sp
ace
(top
olog
ical
)
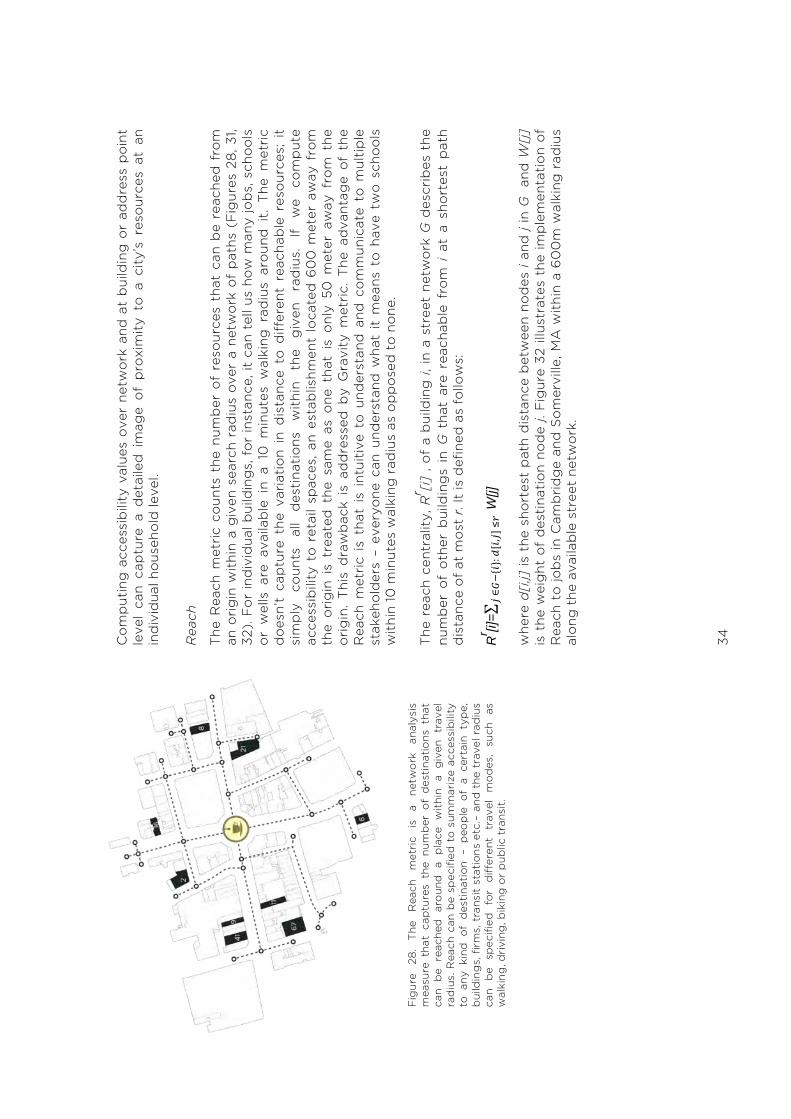
34
Co
mp
utin
g a
cces
sib
ility
val
ues
ove
r ne
two
rk a
nd a
t b
uild
ing
or
add
ress
po
int
leve
l ca
n ca
ptu
re a
det
aile
d i
mag
e o
f p
roxi
mit
y to
a c
ity’
s re
sour
ces
at a
n in
div
idua
l ho
useh
old
leve
l.
Rea
ch
The
Rea
ch m
etri
c co
unts
the
num
ber
of
reso
urce
s th
at c
an b
e re
ache
d f
rom
an
ori
gin
wit
hin
a g
iven
sea
rch
rad
ius
ove
r a
netw
ork
of
pat
hs (
Fig
ures
28
, 31,
32).
Fo
r in
div
idua
l bui
ldin
gs,
fo
r in
stan
ce, i
t ca
n te
ll us
ho
w m
any
job
s, s
cho
ols
o
r w
ells
are
ava
ilab
le i
n a
10 m
inut
es w
alki
ng r
adiu
s ar
oun
d i
t. T
he m
etri
c d
oes
n’t
cap
ture
the
var
iati
on
in d
ista
nce
to d
iffer
ent
reac
hab
le r
eso
urce
s; i
t si
mp
ly
coun
ts
all
des
tina
tio
ns
wit
hin
the
giv
en
rad
ius.
If
w
e co
mp
ute
acce
ssib
ility
to
ret
ail
spac
es,
an e
stab
lishm
ent
loca
ted
60
0 m
eter
aw
ay f
rom
th
e o
rig
in i
s tr
eate
d t
he s
ame
as o
ne t
hat
is o
nly
50 m
eter
aw
ay f
rom
the
o
rig
in.
Thi
s d
raw
bac
k is
ad
dre
ssed
by
Gra
vity
met
ric.
The
ad
vant
age
of
the
Rea
ch m
etri
c is
tha
t is
int
uiti
ve t
o u
nder
stan
d a
nd c
om
mun
icat
e to
mul
tip
le
stak
eho
lder
s –
ever
yone
can
und
erst
and
wha
t it
mea
ns t
o h
ave
two
sch
oo
ls
wit
hin
10 m
inut
es w
alki
ng r
adiu
s as
op
po
sed
to
no
ne.
The
rea
ch c
entr
alit
y, R
r [i]
, of
a b
uild
ing
i, in
a s
tree
t ne
two
rk G
des
crib
es t
he
num
ber
of
oth
er b
uild
ing
s in
G t
hat
are
reac
hab
le f
rom
i a
t a
sho
rtes
t p
ath
dis
tanc
e o
f at
mo
st r
. It
is d
efin
ed a
s fo
llow
s:
Rr [i]
=!
!!∈!!
{!}:!![!,!]!!!
W[j]
whe
re d
[i,j]
is t
he s
hort
est
pat
h d
ista
nce
bet
wee
n no
des
i an
d j
in G
an
d W
[j]
is t
he w
eig
ht o
f d
esti
nati
on
nod
e j.
Fig
ure
32 il
lust
rate
s th
e im
ple
men
tati
on
of
Rea
ch t
o jo
bs
in C
amb
rid
ge
and
So
mer
ville
, MA
wit
hin
a 6
00
m w
alki
ng r
adiu
s al
ong
the
ava
ilab
le s
tree
t ne
two
rk.
Fig
ure
28.
The
R
each
m
etri
c is
a
netw
ork
an
alys
is
mea
sure
tha
t ca
ptu
res
the
num
ber
of
des
tina
tions
tha
t ca
n b
e re
ache
d
aro
und
a
pla
ce w
ithi
n a
giv
en
trav
el
rad
ius.
Rea
ch c
an b
e sp
ecifi
ed t
o su
mm
ariz
e ac
cess
ibili
ty
to a
ny k
ind
of
des
tinat
ion
– p
eop
le o
f a
cert
ain
typ
e,
bui
ldin
gs,
fir
ms,
tra
nsit
stat
ions
etc
.– a
nd t
he t
rave
l rad
ius
can
be
spec
ified
fo
r d
iffer
ent
trav
el
mod
es,
such
as
w
alki
ng, d
rivi
ng, b
ikin
g o
r p
ublic
tra
nsit.

35
Gra
vity
Sim
ilar
to R
each
, the
Gra
vity
met
ric
coun
ts t
he n
umb
er o
f re
sour
ces
that
can
b
e re
ache
d
fro
m
an
ori
gin
w
ithi
n a
sear
ch
rad
ius
ove
r a
netw
ork
, b
ut
add
itio
nally
acc
oun
ts f
or
thei
r d
ista
nce
fro
m t
he o
rig
in (
Fig
ure
30).
A b
uild
ing
w
ith
a fe
w s
hop
s lo
cate
d n
ext
do
or
will
get
a h
ighe
r ac
cess
ibili
ty v
alue
to
co
mm
erci
al
esta
blis
hmen
ts
than
a
bui
ldin
g
wit
h a
larg
e nu
mb
er
of
reta
il es
tab
lishm
ents
tha
t ar
e lo
cate
d f
ar a
way
.
The
att
ract
ion
of
des
tina
tio
ns d
oes
no
t d
rop
line
arly
whe
n th
eir
dis
tanc
e fr
om
th
e o
rig
in i
ncre
ases
, b
ut a
t an
exp
one
ntia
l ra
te,
and
it
vari
es f
or
diff
eren
t m
od
es o
f tr
ansp
ort
. The
inve
rse
exp
one
nt o
f d
ista
nce
is o
ften
use
d in
stea
d o
f si
mp
le in
vers
e d
ista
nce
for
wei
ghi
ng d
esti
nati
ons
, and
the
dis
tanc
e d
ecay
rat
e is
co
ntro
lled
by
a co
effic
ient
fo
r ea
ch m
od
e o
f tr
ansp
ort
. Gra
vity
of
po
int
i, in
g
rap
h G
, can
be
spec
ified
as:
Gra
vity
[i]r =
!![!]
!!.![!,!]
!!∈!!
{!}:!![!,!]!!!
whe
re G
ravi
ty[i
]r is
the
gra
vity
ind
ex a
t p
oin
t i
in n
etw
ork
G w
ithi
n se
arch
ra
diu
s r,
W[j
] is
the
wei
ght
of
des
tina
tio
n j,
d[i
,j] i
s th
e sh
ort
est
dis
tanc
e b
etw
een
i an
d j
, an
d b
is
the
exp
one
nt f
or
adju
stin
g t
he e
ffec
t o
f d
ista
nce
dec
ay.
The
se a
cces
sib
ility
mea
sure
s ca
n b
e sp
ecifi
ed i
n th
e U
rban
Net
wo
rk A
naly
sis
To
olb
ox
in A
rcG
IS.
A m
ore
exc
lusi
ve h
elp
do
cum
ent
is a
vaila
ble
wit
h th
e to
olb
ox
to e
xpla
in t
he s
pec
ifica
tio
ns i
n d
etai
l. In
ord
er t
o r
un t
he t
oo
lbo
x,
Arc
GIS
10
and
the
net
wo
rk A
naly
st e
xten
sio
n ar
e re
qui
red
.
Fig
ure
30. I
llust
ratio
n of
the
Gra
vity
met
ric.
Less
Gra
vity
Mo
re G
ravi
ty

36
Fig
ure
31.
Und
erse
rved
are
as;
the
area
s in
ora
nge
do
n’t
have
ac
cess
to
pub
lic s
choo
ls w
ithi
n a
120
0 m
eter
net
wor
k ra
diu
s.
Ove
rlay
ing
the
und
erse
rved
are
as a
nd c
ensu
s d
ata
show
s th
at
app
roxi
mat
ely
10,0
00
p
eop
le
do
n’t
have
w
alki
ng
acce
ss
to
pub
lic s
choo
ls

37
F
igur
e 32
. Rea
ch t
o jo
bs
loca
ted
with
in 6
00
met
er n
etw
ork
rad
ius
(ap
pro
xim
atel
y 10
min
utes
wal
k) in
Cam
bri
dg
e, M
A.

38
3.3.
SPA
TIA
L-ST
ATI
STIC
AL
MO
DEL
S
Unl
ike
acce
ssib
ility
an
d
gro
wth
an
alyt
ics,
sp
atia
l-st
atis
tica
l m
od
els
can
exam
ine
rela
tio
nshi
ps
bet
wee
n m
ore
tha
n tw
o s
pat
ial
valu
es.
Gro
wth
and
ch
ang
e an
alyt
ics
each
cap
ture
ove
r-ti
me
chan
ge
in o
nly
one
pro
per
ty o
f a
spat
ial
unit
. S
pat
ial-
stat
isti
cal
mo
del
s, h
ow
ever
, ca
n ex
amin
e th
e re
lati
ons
hip
o
f o
ne s
pat
ial
valu
e to
a n
umb
er o
f o
ther
var
iab
les,
and
are
the
reb
y b
ette
r su
ited
fo
r p
roje
ctin
g c
hang
es u
nder
mo
re r
ealis
tic
mul
tiva
riab
le s
cena
rio
s.
Sta
tist
ical
mo
del
s ca
n b
e d
evel
op
ed t
o e
xam
ine
the
rela
tio
nshi
p o
f la
nd p
rice
s to
va
rio
us
det
erm
inan
ts
incl
udin
g
acce
ssib
ility
(e
.g.
to
bus
st
op
s,
reta
il es
tab
lishm
ents
etc
.),
fro
ntag
e, a
rea,
or
par
cel
typ
e. H
avin
g s
uch
exp
lana
tory
m
od
els,
one
can
the
n p
red
ict
how
the
val
ue o
f ea
ch i
ndiv
idua
l p
arce
l is
lik
ely
to
chan
ge
whe
n,
for
exam
ple
, a
new
b
us
sto
p
or
road
is
co
nstr
ucte
d,
cont
rolli
ng f
or
cova
riat
es.
3.3.
1.R
egre
ssio
n A
naly
sis
In
st
atis
tics
, re
gre
ssio
n an
alys
is
exam
ines
w
heth
er
and
ho
w
a d
epen
den
t va
riab
le i
s re
late
d t
o o
ne o
r m
ore
ind
epen
den
t va
riab
les.
The
res
ults
of
a re
gre
ssio
n fu
ncti
on
gen
erat
e co
effic
ient
s fo
r th
e ef
fect
s th
at
each
o
f th
e in
dep
end
ent
vari
able
s ha
s o
n th
e d
epen
den
t va
riab
le a
nd a
n in
dic
atio
n o
f w
heth
er a
nd h
ow
sig
nific
ant
thes
e ef
fect
s ar
e. T
he m
od
els
also
tel
l us
ho
w
muc
h o
f th
e to
tal v
aria
tio
n in
the
dep
end
ent
vari
able
is e
xpla
ined
by
vari
atio
ns
in t
he g
iven
ind
epen
den
t va
riab
les.
Tho
se c
oef
ficie
nts
that
are
fo
und
to
be
sig
nific
ant
can
be
used
to
pre
dic
t fu
ture
cha
nges
und
er s
imila
r co
ndit
ions
.
Hed
oni
c p
rici
ng m
od
els,
whi
ch f
orm
one
typ
e o
f re
gre
ssio
n m
od
els,
are
wid
ely
used
fo
r p
roje
ctin
g la
nd o
r re
al e
stat
e va
lue.
In
thes
e m
od
els,
the
sel
ling
pri
ce
of
a re
al p
rop
erty
(e.
g. a
ho
usin
g u
nit)
is p
red
icte
d b
ased
on
a lin
ear
func
tio
n o
f th
e ch
arac
teri
stic
s o
f th
e un
it –
ag
e, s
ize,
num
ber
of
roo
ms,
str
uctu
ral
qua
lity,
acc
essi
bili
ty, o
wne
rshi
p s
truc
ture
, lo
t si
ze e
tc.

39
An
accu
rate
sp
ecifi
cati
on
of
reg
ress
ion
mo
del
s re
qui
res
the
use
of
spec
ializ
ed
soft
war
e lik
e S
AS
, S
tata
or
SP
SS
and
nec
essi
tate
s a
clea
r un
der
stan
din
g o
f co
ncep
ts
and
as
sum
pti
ons
th
at
reg
ress
ion
anal
ysis
is
g
roun
ded
o
n.
It
is
reco
mm
end
ed t
hat
thes
e m
od
els
be
spec
ified
by
onl
y st
aff
who
hav
e ha
d
pro
per
tr
aini
ng
in
reg
ress
ion
anal
ysis
an
d
und
erst
and
th
eir
foun
dat
ions
th
oro
ughl
y. S
imp
le m
ulti
ple
reg
ress
ions
and
biv
aria
te s
catt
er p
lots
can
als
o b
e sp
ecifi
ed in
MS
Exc
el, u
sing
the
ana
lysi
s to
olb
ox.
3.3.
2.Tr
end
Esti
mat
ion
and
Aut
oreg
ress
ive
Mod
els
Tre
nd e
stim
atio
n is
a f
orm
of
reg
ress
ion
anal
ysis
, whe
re t
ime
is t
he o
nly
linea
r p
red
icto
r o
f th
e d
epen
dab
le v
aria
ble
. Tre
nd e
stim
atio
n ex
amin
es a
co
rrel
atio
n b
etw
een
the
out
com
e va
lues
an
d
tim
e at
w
hich
th
ey
too
k p
lace
. T
rend
es
tim
atio
n is
sui
tab
le f
or
pro
ject
ing
the
long
-ter
m t
rend
in v
aria
ble
s w
hose
key
d
eter
min
ants
are
no
t fu
lly k
now
n b
ut a
pat
tern
in t
heir
val
ues
can
be
iden
tifie
d
ove
r ti
me.
We
may
no
t kn
ow
, fo
r in
stan
ce,
wha
t va
riab
les
can
pre
dic
t th
e in
crea
se o
f tr
avel
ers
to t
he c
ity
cent
er,
but
a t
rend
wit
h a
sig
nific
ant
year
ly
tim
e co
effic
ient
may
be
used
to
ob
serv
ed p
roje
ct t
he n
umb
er b
ased
on
pas
t o
bse
rvat
ions
. Eve
n if
the
dat
a o
scill
ated
up
and
do
wn,
a t
rend
reg
ress
ion
can
help
us
det
erm
ine
whe
ther
a s
igni
fican
t lo
ng-t
erm
inc
reas
e o
r d
ecre
ase
is
pre
sent
(F
igur
e 33
).
The
val
ue o
f va
riab
les
som
etim
es f
ollo
ws
a cy
clic
al p
atte
rn o
ver
tim
e, w
here
va
riab
les
at
one
o
bse
rvat
ion
per
iod
ar
e d
epen
den
t o
n va
lues
d
urin
g
the
pre
vio
us p
erio
d.
Ene
rgy
cons
ump
tio
n in
a c
ensu
s b
lock
, fo
r in
stan
ce,
may
fo
llow
a
cycl
ical
p
atte
rn,
follo
win
g
the
win
ter-
sum
mer
cy
cle
in
the
envi
ronm
ent.
Cyc
lical
pat
tern
s in
dat
a m
ay b
e in
dep
end
ent
of
the
ove
rall
long
-te
rm
tren
d.
Whi
le
ther
e m
ay
be
a w
inte
r-su
mm
er
cycl
e in
th
e en
erg
y co
nsum
pti
on
at t
he h
ous
eho
ld l
evel
, the
lo
ng-t
erm
tre
nd m
ay b
e in
sig
nific
ant
(the
to
tal
annu
al e
nerg
y co
nsum
pti
on
not
chan
gin
g),
eve
n w
hen
the
ener
gy
cons
ump
tio
n at
a p
arti
cula
r p
erio
d (
spri
ng)
may
exh
ibit
a c
yclic
al d
ecre
ase.
Aut
ore
gre
ssiv
e m
od
els
are
used
to
pre
dic
t o
ver-
tim
e ch
ang
es in
var
iab
les
wit
h cy
clic
al
pat
tern
s,
whe
re
ind
epen
den
t va
riab
les
incl
ude
the
valu
e o
f th
e
Fig
ure
33. T
rend
est
imat
ion
of g
row
th i
n to
tal
resi
den
tial
flo
or a
rea
in C
hina
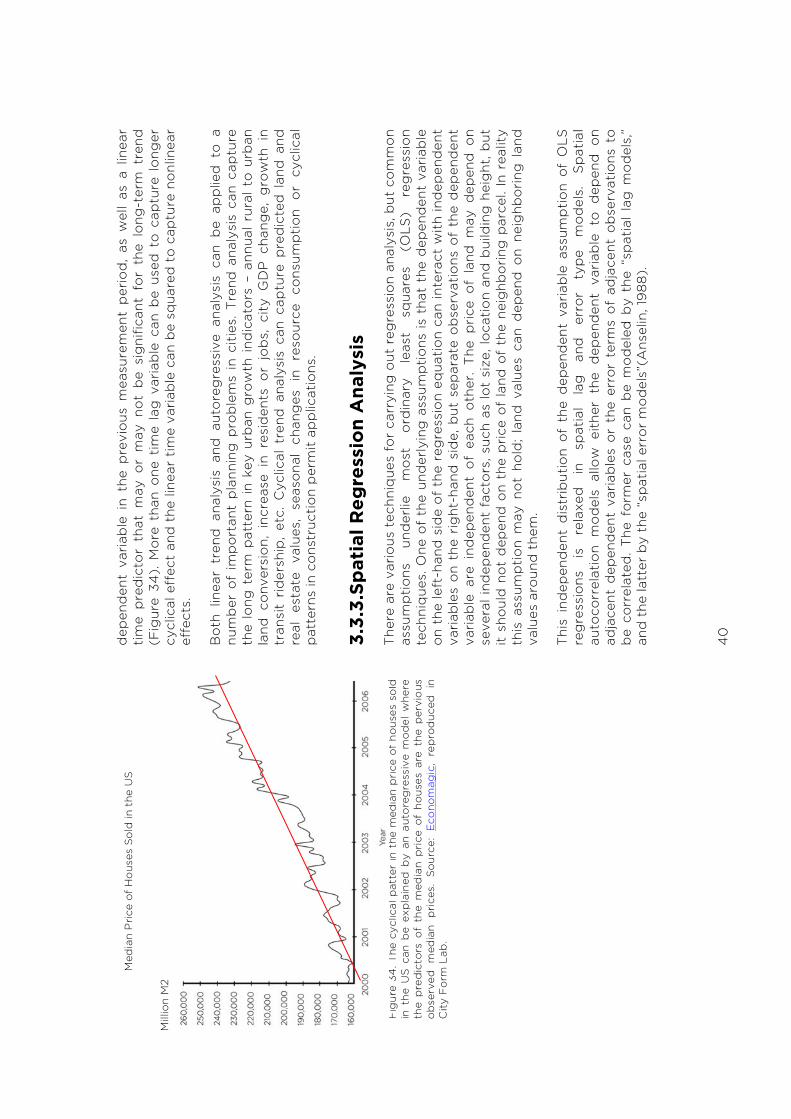
4
0
dep
end
ent
vari
able
in
the
pre
vio
us m
easu
rem
ent
per
iod
, as
wel
l as
a l
inea
r ti
me
pre
dic
tor
that
may
or
may
no
t b
e si
gni
fican
t fo
r th
e lo
ng-t
erm
tre
nd
(Fig
ure
34).
Mo
re t
han
one
tim
e la
g v
aria
ble
can
be
used
to
cap
ture
lo
nger
cy
clic
al e
ffec
t an
d t
he li
near
tim
e va
riab
le c
an b
e sq
uare
d t
o c
aptu
re n
onl
inea
r ef
fect
s.
Bo
th l
inea
r tr
end
ana
lysi
s an
d a
uto
reg
ress
ive
anal
ysis
can
be
app
lied
to
a
num
ber
of
imp
ort
ant
pla
nnin
g p
rob
lem
s in
cit
ies.
Tre
nd a
naly
sis
can
cap
ture
th
e lo
ng t
erm
pat
tern
in
key
urb
an g
row
th i
ndic
ato
rs –
ann
ual
rura
l to
urb
an
land
co
nver
sio
n, i
ncre
ase
in r
esid
ents
or
job
s, c
ity
GD
P c
hang
e, g
row
th i
n tr
ansi
t ri
der
ship
, et
c. C
yclic
al t
rend
ana
lysi
s ca
n ca
ptu
re p
red
icte
d l
and
and
re
al
esta
te
valu
es,
seas
ona
l ch
ang
es
in
reso
urce
co
nsum
pti
on
or
cycl
ical
p
atte
rns
in c
ons
truc
tio
n p
erm
it a
pp
licat
ions
.
3.3.
3.Sp
atia
l Reg
ress
ion
Ana
lysi
s T
here
are
var
ious
tec
hniq
ues
for
carr
ying
out
reg
ress
ion
anal
ysis
, but
co
mm
on
assu
mp
tio
ns
und
erlie
m
ost
o
rdin
ary
leas
t sq
uare
s (O
LS)
reg
ress
ion
tech
niq
ues.
One
of
the
und
erly
ing
ass
ump
tio
ns is
tha
t th
e d
epen
den
t va
riab
le
on
the
left
-han
d s
ide
of
the
reg
ress
ion
equa
tio
n ca
n in
tera
ct w
ith
ind
epen
den
t va
riab
les
on
the
rig
ht-h
and
sid
e, b
ut s
epar
ate
ob
serv
atio
ns o
f th
e d
epen
den
t va
riab
le a
re i
ndep
end
ent
of
each
oth
er.
The
pri
ce o
f la
nd m
ay d
epen
d o
n se
vera
l ind
epen
den
t fa
cto
rs, s
uch
as lo
t si
ze, l
oca
tio
n an
d b
uild
ing
hei
ght
, but
it
sho
uld
no
t d
epen
d o
n th
e p
rice
of
land
of
the
neig
hbo
ring
par
cel.
In r
ealit
y th
is a
ssum
pti
on
may
no
t ho
ld;
land
val
ues
can
dep
end
on
neig
hbo
ring
lan
d
valu
es a
roun
d t
hem
.
Thi
s in
dep
end
ent
dis
trib
utio
n o
f th
e d
epen
den
t va
riab
le a
ssum
pti
on
of
OLS
re
gre
ssio
ns
is
rela
xed
in
sp
atia
l la
g
and
er
ror
typ
e m
od
els.
S
pat
ial
auto
corr
elat
ion
mo
del
s al
low
eit
her
the
dep
end
ent
vari
able
to
dep
end
on
adja
cent
dep
end
ent
vari
able
s o
r th
e er
ror
term
s o
f ad
jace
nt o
bse
rvat
ions
to
b
e co
rrel
ated
. T
he f
orm
er c
ase
can
be
mo
del
ed b
y th
e “s
pat
ial
lag
mo
del
s,”
and
the
latt
er b
y th
e “s
pat
ial e
rro
r m
od
els”
(Ans
elin
, 19
88
).
Fig
ure
34. T
he c
yclic
al p
atte
r in
the
med
ian
pri
ce o
f ho
uses
sol
d
in t
he U
S c
an b
e ex
pla
ined
by
an a
uto
reg
ress
ive
mod
el w
here
th
e p
red
icto
rs o
f th
e m
edia
n p
rice
of
hous
es a
re t
he p
ervi
ous
ob
serv
ed m
edia
n p
rice
s.
Sour
ce:
Eco
nom
agic
, re
pro
duc
ed
in
City
For
m L
ab.
Mill
ion
M2
Med
ian
Pric
e of
Ho
uses
Sol
d in
the
US

4
1
Sp
atia
l re
gre
ssio
ns
can
be
spec
ified
in
G
eoD
a o
r G
eoD
a S
pac
e so
ftw
are
pac
kag
es t
hat
are
free
ly d
istr
ibut
ed.
Man
y p
heno
men
a in
sp
atia
l an
alys
es
exhi
bit
sp
atia
l au
toco
rrel
atio
n w
hich
su
ch
mo
del
s ca
ptu
re.
If
spat
ial
auto
corr
elat
ion
is
pre
sent
th
en
OLS
au
tore
gre
ssiv
e m
od
els
yiel
d
a b
ette
r ex
pla
nati
on
to t
he v
aria
tio
ns in
ob
serv
ed d
ata
(Fig
ures
35,
36
& 3
7).
Fig
ures
35
and
36
pro
vid
e an
exa
mp
le o
f as
sed
lan
d v
alue
dis
trib
utio
n in
C
amb
rid
ge,
MA
. A s
pat
ial
lag
reg
ress
ion
is s
pec
ified
in
Geo
Da
to p
red
ict
how
th
e p
er-s
qua
re-f
oo
t va
lue
of
land
dep
end
s o
n fo
ur in
dep
end
ent
vari
able
s: p
lot
rati
on,
par
cel
size
, ac
cess
to
str
eets
and
dis
tanc
e fr
om
the
nea
rest
sub
way
st
atio
n. In
Fig
ure
35 (
top
) an
OLS
mo
del
is s
pec
ified
wit
h al
l fo
ur v
aria
ble
s, b
ut
wit
hout
allo
win
g f
or
auto
corr
elat
ion
bet
wee
n ne
ighb
ori
ng p
arce
ls.
Bel
ow
, a
spat
ial
lag
m
od
el
is
spec
ified
, w
hich
ad
ds
spat
ial
auto
corr
elat
ion
in
the
dep
end
ent
vari
able
(p
rice
per
sq
uare
fo
ot)
to
the
est
imat
ion
(“W
_LV
_PS
F”
in
the
mo
del
). T
he h
igh
z-va
lues
sug
ges
t th
at l
and
val
ues
in C
amb
rid
ge
are
ind
eed
str
ong
ly c
orr
elat
ed w
ith
neig
hbo
rs –
bea
utifu
l im
pro
vem
ents
in
the
neig
hbo
rs’
yard
can
sig
nific
antl
y in
crea
se s
urro
und
ing
lan
d v
alue
s. F
igur
e 36
p
lots
the
biv
aria
te e
ffec
t o
f p
roxi
mit
y to
sub
way
sta
tio
ns,
sho
win
g h
ow
lan
d
valu
es d
ecre
ase
as t
he d
ista
nce
to t
he n
eare
st s
ubw
ay s
tati
on
incr
ease
s,
cont
rolli
ng f
or
oth
er v
aria
ble
s.
Fig
ure
35.
Hed
onic
pric
ing
mod
el f
or L
and
val
ue i
n C
amb
ridg
e:.
The
d
epen
den
t va
riab
le i
s th
e as
sess
ed p
rice
of
land
is
US
$ p
er s
qua
re
foo
t, an
d p
red
icto
rs a
re p
lot
rati
o, la
nd a
rea,
par
cel t
ype
(nr.
Of
stre
ets
dir
ectl
y ac
cess
ed t
o fr
om p
arce
l),
and
dis
tanc
e to
sub
way
sta
tion
. U
nlik
e th
e sp
atia
l la
g
mod
el
(bot
tom
),
the
ord
inar
y le
ast
squa
re
reg
ress
ion
mo
del
(t
op)
do
es
not
acco
unt
for
the
spat
ial
auto
corr
elat
ion
amo
ng t
he la
nd v
alue
s of
nei
ghb
orin
g p
arce
ls.
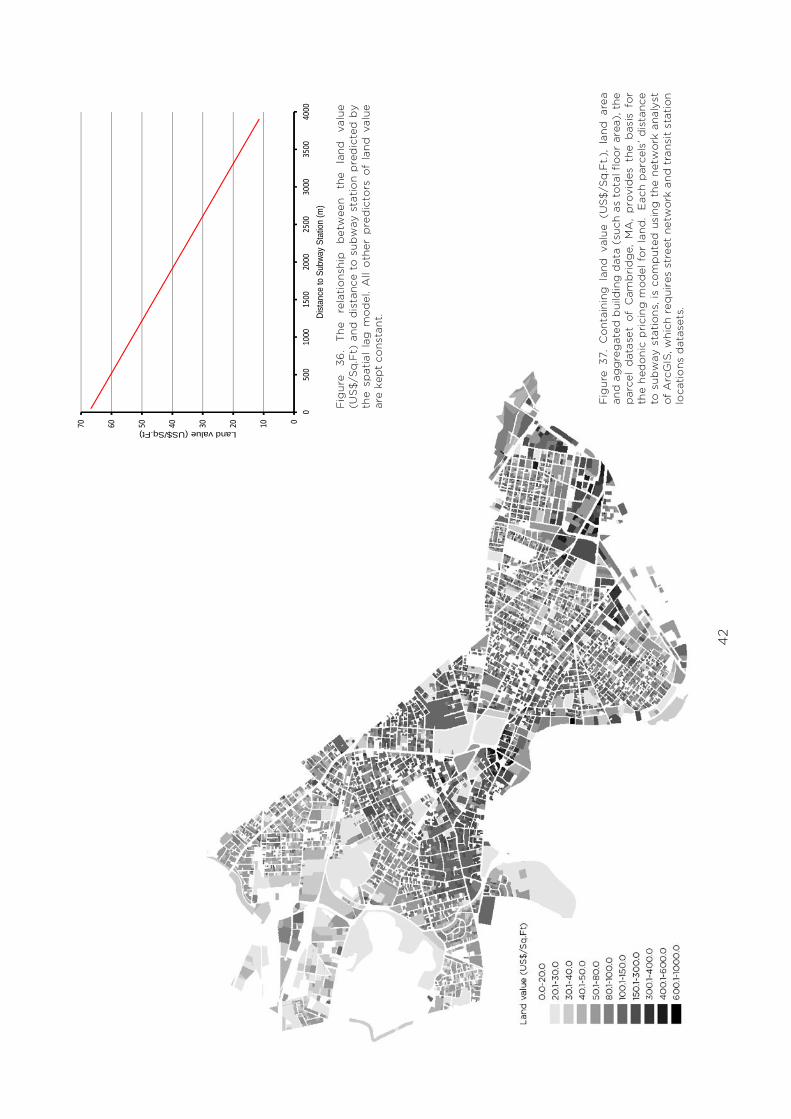
4
2
Fig
ure
36.
The
rela
tion
ship
b
etw
een
the
land
va
lue
(US$
/Sq
.Ft)
and
dis
tanc
e to
sub
way
sta
tion
pre
dic
ted
by
the
spat
ial
lag
mod
el.
All
oth
er p
red
icto
rs o
f la
nd v
alue
ar
e ke
pt
cons
tant
.
010203040506070
050
010
0015
0020
0025
0030
0035
0040
00
Land value (US$/Sq.Ft)
Dis
tanc
e to
Sub
way
Sta
tion
(m)
Fig
ure
37.
Con
tain
ing
lan
d v
alue
(U
S$/S
q.F
t.),
land
are
a an
d a
gg
reg
ated
bui
ldin
g d
ata
(suc
h as
tot
al f
loor
are
a), t
he
par
cel
dat
aset
of
Cam
bri
dg
e, M
A,
pro
vid
es t
he b
asis
for
th
e he
don
ic p
rici
ng m
odel
fo
r la
nd.
Eac
h p
arce
ls’ d
ista
nce
to s
ubw
ay s
tati
ons,
is c
omp
uted
usi
ng t
he n
etw
ork
anal
yst
of A
rcG
IS, w
hich
req
uire
s st
reet
net
wor
k an
d t
rans
it st
atio
n lo
catio
ns d
atas
ets.

4
3
3.4
.IMPA
CT
AN
ALY
SIS
Eff
ecti
ve d
ecis
ions
in p
olic
y an
d s
pat
ial p
lann
ing
nee
d t
o b
e ev
alua
ted
bef
ore
th
eir
imp
lem
enta
tio
n.
Suc
h ev
alua
tio
ns
req
uire
an
un
der
stan
din
g
of
the
po
tent
ial i
mp
acts
of
the
dec
isio
ns. C
om
par
ing
the
pro
bab
le im
pac
ts o
f a
seri
es
of
alte
rnat
ive
dec
isio
ns t
o t
he e
xist
ing
co
ndit
ions
allo
ws
pla
nner
s to
est
ablis
h a
conc
rete
bas
e fo
r in
form
ed d
ecis
ion-
mak
ing
.
Imp
act
anal
ysis
in
clud
es
two
b
road
g
roup
s o
f an
alyt
ics.
T
he
first
g
roup
in
clud
es a
naly
tics
and
sta
tist
ical
mo
del
s th
at c
an p
red
ict
the
imp
act
of
a p
rop
ose
d
po
licy
(e.g
. zo
ning
) o
r sp
atia
l in
terv
enti
on
(e.g
. si
dew
alk
imp
rove
men
t) o
n an
out
com
e va
riab
le, s
uch
as la
nd v
alue
, acc
essi
bili
ty, c
rim
e ra
te o
r em
plo
ymen
t. T
he s
eco
nd t
ype
of
anal
ysis
kee
ps
trac
k o
f ch
ang
es i
n q
uest
ion
vari
able
s (e
.g.
land
val
ue,
or
ped
estr
ian
mo
vem
ent)
bef
ore
, d
urin
g
and
aft
er a
n in
terv
enti
on.
The
lat
ter
pro
vid
es u
sefu
l em
pir
ical
evi
den
ce u
po
n w
hich
fut
ure
pla
nnin
g d
ecis
ions
can
be
mad
e.
Acc
essi
bili
ty
anal
yses
an
d
reg
ress
ions
ca
n b
e us
ed
as
inp
uts
to
imp
act
anal
ysis
, sin
ce t
hey
can
cap
ture
cha
nges
in a
var
iab
le w
hen
spat
ial c
ond
itio
ns
chan
ge.
To
ana
lyze
the
im
pac
t o
f a
new
bri
dg
e o
r b
us r
out
e, f
or
inst
ance
, ac
cess
ibili
ty a
naly
ses
can
be
used
to
mea
sure
the
cha
nge
in a
cces
sib
ility
va
lues
– h
ow
muc
h th
e ci
tize
ns’
acce
ssib
ility
to
jo
bs
chan
ges
whe
n a
new
b
rid
ge
is b
uilt
ove
r th
e ri
ver.
Uti
lizin
g a
hed
oni
c p
rici
ng m
od
el a
llow
s us
to
ass
ess
the
imp
act
of
the
sam
e b
rid
ge
on
land
val
ues
acro
ss t
he c
ity.
The
out
put
of
acce
ssib
ility
ana
lysi
s,
whi
ch
com
put
es
the
chan
ges
in
ac
cess
ibili
ty
valu
es,
can
be
used
in
th
e he
do
nic
pri
cing
m
od
el
for
land
, in
w
hich
ac
cess
ibili
ty
valu
es
form
ke
y in
dep
end
ent
vari
able
s. I
f o
ther
var
iab
les
are
kep
t co
nsta
nt,
the
refle
cted
lan
d
valu
e ch
ang
e re
veal
s th
e p
ure
imp
act
of
the
new
bri
dg
e o
n la
nd v
alue
s.
Fig
ure
38 i
llust
rate
s th
e im
pac
t o
f ho
w a
hyp
oth
etic
al h
ighw
ay t
hat
cuts
th
roug
h th
e G
eyla
ng
neig
hbo
rho
od
in
S
ing
apo
re,
on
the
acce
ssib
ility
o
f b
uild
ing
s to
b
usin
esse
s.
Co
mp
arin
g
the
gra
vity
in
dex
fr
om
b
uild
ing
s to
b
usin
esse
s b
efo
re a
nd a
fter
the
pro
po
sed
hig
hway
in
a lo
cal
1km
wal
king

4
4
rang
e sh
ow
s a
56%
d
eclin
e,
on
aver
age,
in
ac
cess
ibili
ty
to
bus
ines
s es
tab
lishm
ents
. T
he i
mp
act
of
chan
ge
in a
cces
sib
ility
on
oth
er k
ey v
aria
ble
s su
ch a
s la
nd v
alue
can
be
then
ana
lyze
d b
y a
spat
ial s
tati
stic
al m
od
el (
Fig
ure
39).
Fig
ures
39
and
40
bel
ow
mo
del
the
po
tent
ial i
mp
act
of
a ne
w s
ubw
ay s
tati
on
on
land
val
ues
in C
amb
rid
ge,
MA
, usi
ng t
he h
edo
nic
pri
cing
mo
del
fo
r la
nd i
n C
amb
rid
ge,
bas
ed o
n th
e p
rese
nt la
nd v
alue
s (S
ee F
igur
e 35
). T
he e
xam
ple
in
Fig
ure
39 d
emo
nstr
ates
the
est
imat
ed d
iffer
ence
in
land
val
ues
bef
ore
and
af
ter
the
pro
po
sed
sub
way
sta
tio
n. U
sing
co
effic
ient
est
imat
ed i
n th
e sp
atia
l la
g m
od
el o
f F
igur
e 35
, the
to
tal h
ypo
thet
ical
cha
nge
in la
nd v
alue
s th
at c
oul
d
resu
lt
fro
m
add
ing
th
e ne
w
sub
way
st
op
is
ar
oun
d
$20
m
illio
n.
The
d
istr
ibut
ion
of
the
new
per
sq
uare
fo
ot
pri
ces
is s
how
n in
Fig
ure
40
.

4
5
F
igur
e 38
. Com
par
ison
of
the
acce
ssib
ility
val
ues
bef
ore
(lef
t) a
nd a
fter
a h
ighw
ay c
ut t
hrou
gh
Gey
lang
, Sin
gap
ore
show
s a
sig
nific
ant
dro
p i
n th
e lo
cal
gra
vity
to
bus
ines
s es
tab
lishm
ents
(ce
nter
). S
uch
com
par
ison
s in
acc
essi
bili
ty v
alue
s ca
n b
e us
ed a
s in
put
to
reg
ress
ion
mod
els
for
pre
dic
ting
the
oth
er i
mp
acts
of
a sp
atia
l int
erve
ntio
n (s
ee F
igur
e 39
and
40
). T
he
per
cent
age
chan
ge
in a
cces
sib
ility
to
bus
ines
ses
as a
res
ult
of t
he p
rop
ose
d h
ighw
ay is
sho
wn
on t
he r
ight
.
Per
cent
age
ch
ang
e
Gra
vity
in
dex

4
6
`
Fig
ure
39. A
naly
zing
the
imp
act
of a
pro
po
sed
sub
way
sta
tion
in n
orth
Cam
bri
dg
e on
the
val
ue (
US
$/S
q.F
t)
of l
and
s w
ithi
n 10
-min
ute
wal
k ar
ound
the
pro
pos
ed s
tati
on,
usin
g t
he h
edon
ic p
rici
ng m
odel
for
lan
d
dev
elop
ed in
the
pre
viou
s se
ctio
n (s
ee F
igur
e 35
). T
he f
igur
e sh
ows
a co
mp
aris
on b
etw
een
the
pre
sent
val
ues
(lef
t) a
nd t
he p
red
icte
d v
alue
s (r
ight
).
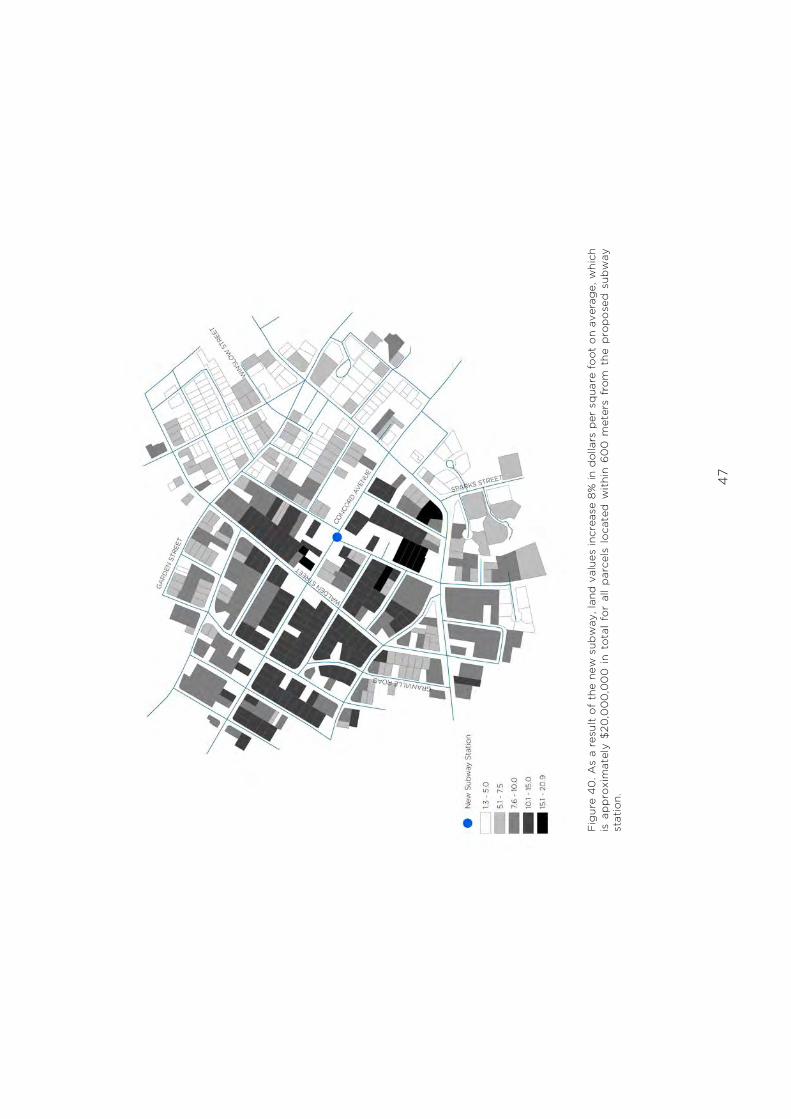
4
7
Fig
ure
40
. As
a re
sult
of
the
new
sub
way
, lan
d v
alue
s in
crea
se 8
% in
dol
lars
per
sq
uare
fo
ot o
n av
erag
e, w
hich
is
ap
pro
xim
atel
y $2
0,0
00
,00
0 i
n to
tal
for
all
par
cels
loc
ated
wit
hin
600
met
ers
from
the
pro
po
sed
sub
way
st
atio
n.

4
8
PLA
NN
ING
DEC
ISIO
NS
SUPP
OR
T

4
9
4.P
LAN
NIN
G D
ECIS
ION
SU
PPO
RT
The
ult
imat
e g
oal
of
CP
L d
ata
colle
ctio
n an
d s
pat
ial
gro
wth
ana
lyse
s is
to
su
pp
ort
cit
ies
in t
heir
pla
nnin
g d
ecis
ions
wit
h co
ncre
te e
vid
ence
. In
form
ing
p
lann
ing
dec
isio
ns b
y m
easu
rab
le e
vid
ence
do
es n
ot
alw
ays
req
uire
co
mp
lex
anal
ytic
s; p
lann
ing
evi
den
ce c
an s
om
etim
es b
e d
irec
tly
extr
acte
d f
orm
raw
sp
atia
l dat
a.
In t
he p
revi
ous
sec
tio
ns w
e d
iscu
ssed
geo
spat
ial
dat
a, a
num
ber
of
anal
ytic
al
acti
viti
es a
nd t
heir
po
tent
ial
app
licat
ions
fo
r ur
ban
pla
nnin
g.
The
way
the
se
anal
ytic
al t
echn
ique
s ca
n in
form
pla
nnin
g d
ecis
ions
can
be
sum
mar
ized
as
follo
ws:
1)
By
des
crib
ing
qua
litie
s o
f sp
ace
in m
easu
reab
le t
erm
s, a
naly
sis
of
spat
ial
dat
a m
akes
it
po
ssib
le t
o c
om
par
e ex
isti
ng c
ond
itio
n to
ce
rtai
n b
ench
mar
ks,
and
to
the
reb
y in
form
pla
nner
s o
f p
rese
nt
chal
leng
es.
Sp
atia
l d
ata
and
ana
lyti
cs h
elp
cit
ies
iden
tify
pro
ble
ms
and
fra
me
que
stio
ns t
hey
sho
uld
fo
cus
on.
Ben
chm
arks
can
be
cho
sen
to m
eet
a ci
ty’s
go
als
and
id
eals
bas
ed o
n na
tio
nal
or
inte
rnat
iona
l ex
amp
les,
o
r b
ased
o
n m
ore
co
mp
lex
und
erly
ing
ca
uses
of
the
ob
serv
ed p
atte
rns.
F
or
exam
ple
, by
loo
king
at
rent
al p
aym
ents
as
a sh
are
of
hous
eho
ld
inco
me
in c
ensu
s tr
acts
and
co
mp
arin
g t
hat
to d
esir
ed r
atio
s, o
ne
can
dir
ectl
y as
sess
whe
ther
so
me
hous
eho
ld i
nco
me
gro
ups
are
pay
ing
to
o l
arg
e a
po
rtio
n o
f th
eir
mo
nthl
y in
com
e o
n ho
usin
g.
In
oth
er c
ases
, th
e as
sess
men
t m
ay r
equi
re s
ever
al a
naly
tica
l st
eps.
A
cces
sib
ility
ana
lysi
s, f
or
inst
ance
, ca
n in
form
pla
nner
s w
heth
er
acce
ss t
o k
ey i
nfra
stru
ctur
es o
r fa
cilit
ies
is u
nder
serv
ed i
n ce
rtai
n ar
ea, a
nd if
so
, inf
orm
s p
lann
ers
whe
re s
uch
area
s ar
e lo
cate
d.
2)
In
ad
dit
ion
to
iden
tify
ing
ex
isti
ng
chal
leng
es,
spat
ial
dat
a an
d
anal
ytic
s ca
n b
e us
ed t
o i
den
tify
fo
rthc
om
ing
cha
lleng
es.
Tre
nd
esti
mat
ion
anal
yses
can
des
crib
e p
rob
able
fo
rthc
om
ing
iss
ues
by
com
par
ing
th
e p
red
icte
d
valu
e o
f a
vari
able
to
it
s d
esir
ed

50
ben
chm
ark
valu
e. K
eep
ing
tra
ck o
f tr
end
s in
the
num
ber
of
mul
ti-
fam
ily
bui
ldin
g
per
mit
s th
at
are
annu
ally
is
sued
, an
d
tren
ds
in
dem
og
rap
hic
gro
ups
that
fo
rm t
ypic
al o
ccup
ants
fo
r su
ch u
nits
, p
lann
ers
can
pre
dic
t w
heth
er t
he c
ity
is h
ead
ed t
ow
ard
sho
rtag
es
or
ove
rsup
ply
in t
he m
arke
t fo
r m
ulti
-fam
ily h
ous
ing
.
3)
Geo
spat
ial
dat
a an
d a
naly
tics
can
inf
orm
pla
nner
s o
f un
der
lyin
g
inte
ract
ions
an
d
corr
elat
ions
b
etw
een
spat
ial
vari
able
s.
Rep
rese
ntin
g s
pat
ial q
ualit
ies
wit
h nu
mer
ic d
ata
allo
ws
us t
o u
tiliz
e st
atis
tica
l re
gre
ssio
n an
alys
is t
o e
xpla
in r
elat
ions
hip
bet
wee
n su
ch
vari
able
s.
Sp
atia
l-st
atis
tica
l m
od
els
can
be
used
to
id
enti
fy
the
det
erm
inan
ts
of
ob
serv
ed
soci
o-e
cono
mic
va
riab
les.
S
tati
stic
al
mo
del
s ca
n o
utlin
e sp
atia
l co
ndit
ions
tha
t re
qui
re c
hang
e in
ord
er
to i
mp
rove
so
cio
-eco
nom
ic i
ndic
ato
rs.
If a
mo
del
sho
ws
a st
rong
ne
gat
ive
corr
elat
ion
bet
wee
n th
e ex
iste
nce
of
com
mer
cial
es
tab
lishm
ents
tha
t fa
ce d
irec
tly
to s
tree
ts a
nd c
rim
e ra
tes
on
thes
e st
reet
s, p
lann
er m
ay u
se t
his
evid
ence
fo
r d
ecid
ing
whe
re t
o
allo
cate
co
mm
erci
al s
pac
e in
zo
ning
pla
ns.
A
sta
tist
ical
mo
del
tha
t an
alyz
es p
revi
ous
sid
ewal
k im
pro
vem
ent
out
com
es
may
re
veal
a
po
siti
ve
corr
elat
ion
bet
wee
n si
dew
alk
qua
lity
and
bus
ines
s re
venu
e al
ong
sid
ewal
ks. O
ne in
terp
reta
tio
n o
f th
is c
orr
elat
ion
is t
hat
sid
ewal
k im
pro
vem
ent
can
be
an e
ffec
tive
to
ol
for
incr
easi
ng
bus
ines
s re
venu
e in
ar
eas
whe
re
pro
per
si
dew
alks
do
no
t ex
ist
but
oth
er p
reco
ndit
ions
fo
r co
mm
erce
are
in
pla
ce.
The
co
rrel
atio
n co
effic
ient
of
the
mo
del
can
be
used
to
es
tim
ate
how
m
uch
bus
ines
s o
wne
rs
coul
d
ben
efit
fr
om
su
ch
pub
lic in
vest
men
t, a
nd w
heth
er t
hey
coul
d b
e in
volv
ed in
fin
anci
ng
sid
ewal
ks t
hro
ugh
taxa
tio
n.
4)
Imp
act
anal
yses
al
low
p
lann
ers
to
asse
ss
diff
eren
t fu
ture
in
vest
men
t o
r im
pro
vem
ent
scen
ario
s b
ased
on
a ke
y o
utco
me
vari
able
. A
co
mp
aris
on
of
diff
eren
t al
tern
ativ
es c
an a
llow
one
to
id
enti
fy t
he m
ost
imp
actf
ul s
cena
rio
.

51
The
sp
atia
l an
alys
is t
echn
ique
s th
at f
orm
the
fo
cus
of
the
CP
Ls’ c
ore
mo
dul
e in
clud
e a)
sp
atio
-tem
po
ral
chan
ge
map
pin
g,
b)
acce
ssib
ility
ass
essm
ent,
c)
tren
d a
naly
sis,
d)
spat
ial
reg
ress
ion
anal
ysis
and
e)
imp
act
anal
ysis
. R
athe
r th
an e
lab
ora
ting
on
any
one
ap
plic
atio
n o
f th
ese
tech
niq
ues
at g
reat
er le
ngth
, w
e ha
ve t
ried
to
pro
vid
e a
bri
ef o
verv
iew
of
the
natu
re a
nd u
tilit
y o
f ea
ch
tech
niq
ue,
po
inti
ng
tow
ard
s ap
plic
atio
ns
for
vari
ous
ur
ban
p
lann
ing
an
d
man
agem
ent
task
s. T
he e
xact
ap
plic
atio
n fo
cus
of
the
tech
niq
ues
in t
he f
our
p
arti
cip
atin
g C
PL
citi
es –
Sur
abay
a, D
enp
asar
, P
alem
ban
g a
nd B
alik
pap
an –
sho
uld
be
iden
tifie
d t
og
ethe
r w
ith
the
loca
l g
ove
rnm
ent
rep
rese
ntat
ives
and
C
PL
staf
f. T
he a
naly
sis
sho
uld
be
cho
sen
to a
dd
ress
the
mo
st i
mp
ort
ant
spat
ial a
naly
sis
and
pla
nnin
g q
uest
ions
sp
ecifi
c to
eac
h ci
ty.
5.R
efre
nces
Ans
elin
, L.
(19
98
). E
xplo
rato
ry s
pat
ial
dat
a an
alys
is i
n a
geo
com
put
atio
nal
envi
ronm
ent.
In
P.
Long
ley,
S.
Bro
oks
, B
. M
acm
illan
and
R.
McD
onn
ell
(Ed
s.),
G
eoC
om
put
atio
n, a
Pri
mer
, 77-
94
. New
Yo
rk: W
iley.
Far
vacq
ue-V
itko
vic,
C.,
Go
din
, L.
, Le
roux
, H
., V
erd
et,
F.,
& C
have
z, R
. (2
00
5).
Str
eet
Ad
dre
ssin
g
and
th
e M
anag
emen
t o
f C
itie
s.
The
W
orl
d
Ban
k,
Was
hing
ton,
D.C
.
Sch
neid
er,
A,
Fri
edl,
M.
A.,
& P
ote
re,
D.
(20
09
). A
new
map
of
glo
bal
urb
an
exte
nt
fro
m
MO
DIS
sa
telli
te
dat
a.
Env
iro
nmen
tal
Res
earc
h Le
tter
s,
4(4
),
44
00
3.
Sch
neid
er,
A.,
Fri
edl,
M.
A.,
& P
ote
re,
D.
(20
10).
Map
pin
g g
lob
al u
rban
are
as
usin
g
MO
DIS
50
0-m
d
ata:
N
ew
met
hod
s an
d
dat
aset
s b
ased
o
n “u
rban
ec
ore
gio
ns”.
Rem
ote
Sen
sing
of
Env
iro
nmen
t, 1
14(8
), 1
733–
174
6.