City of York Council Retail Analysis and Forecasting
74
City of York Council Retail Analysis and Forecasting June 2013
Transcript of City of York Council Retail Analysis and Forecasting
City of York CouncilRetail Analysis andForecastingJune 2013


Contents Page
1 Introduction .............................................................................. 2
2 Baseline Audit .......................................................................... 3
3 Comparators ........................................................................... 24
4 Comparitor Analysis .............................................................. 37
5 Sector Trends ......................................................................... 46
6 Forecasting Growth................................................................ 52
7 Role of the Centres................................................................. 62
8 Planning Toolkit ..................................................................... 63
9 Summary................................................................................. 66


List of Figures
Figure 1: Character Areas
Figure 2: Map showing Vacant properties (2012)
Figure 3: Heat map of Rent in York
Figure 4: Sectors comparisons
Figure 5: Floorspace per sector Leeds v’s York
Figure 6: Comparator Locations
Figure 7: Apple Store, Bath Southgate
Figure 8: Grand Arcade – Cambridge
Figure 9: Northgate scheme indicative
Figure 10: UK GDP Growth
Figure 11:UK Consumer Spending growth year on year
Figure 12: Category spending in the last three months
Figure 13: Sector Growth 2010 – 2015 (source Verdict)
Figure 14: Sales growth by location (excludes online sales)
Figure 15: Verdict Forecasts for each sector
Figure 16: Expenditure share per sector - 2012
Figure 17: Expenditure share per sector – 2020
Figure 18: Indicative Market Share increase

List of Tables
Table 1: Retailer Requirements
Table 2: Retail Indicators
Table 3: GOAD Data used and survey dates
Table 4: Comparison of Floorspace Comparator’s and GB Average
Table 5: Comparison of Floorspace Leeds v York
Table 6: Vacancy rates
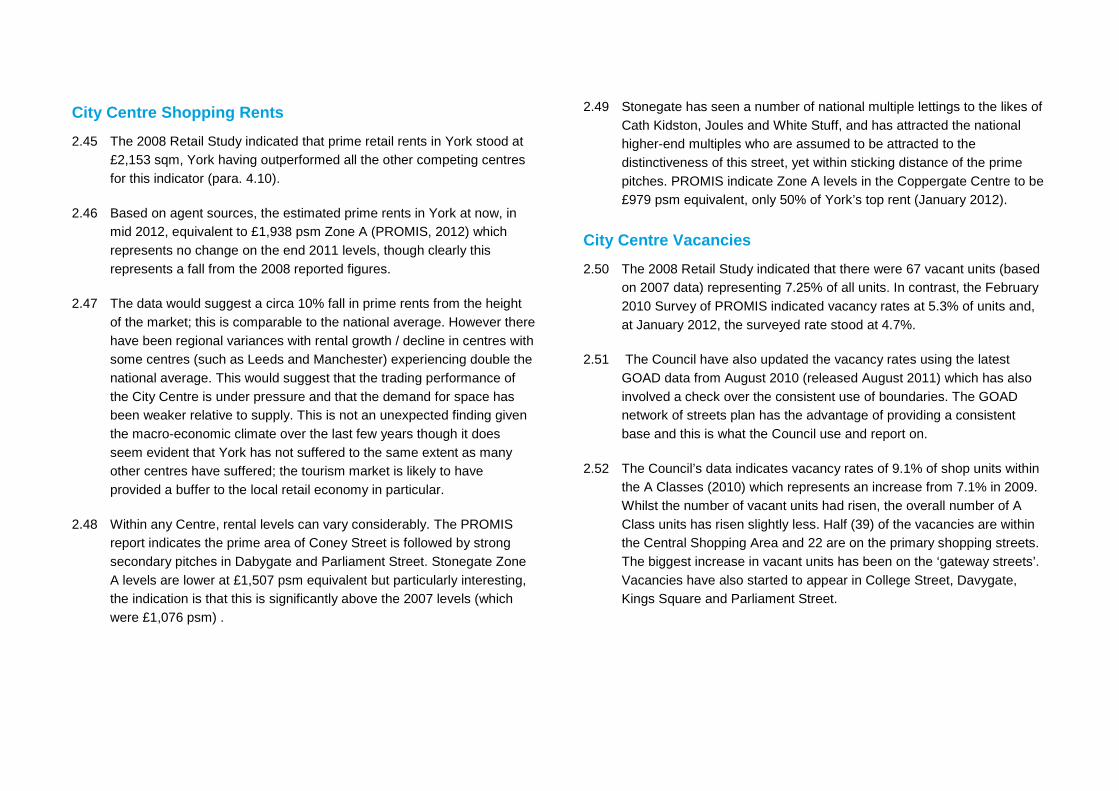
Table 7: Total Floorspace requirements (need)
Table 8: Planning Policy Options

1.1 This document provides the evidence base and analysis for the Vision
document.
1.2 The report is split into the following sections:
Baseline Audit – This section provides a detailed analysis of the
current vitality and viability of the City Centre;
Comparators – The section provides an overview of the centres
intital studied to create a short list of comparible centres;
Comparators Analysis – The section benchmarks Yorks
performance against those of the comparators and provides
context to the comparible centres.
Sector Trends – This section provides an overview of national
trends and emerging themes within retail;
Forecasting Growth – The section provides analysis on the
anticipated growth of the City Centre and retailing in general,
providing commentary on the sector trends and the needs of
the City Centre;
Role of the Centres – This section gives an overview of the
roles of the defined centre within the City.
Planning Toolkit – This section provides a a summary of the
planning policy and options which can be used as guided by
the National Planning Policy Framework
1 Introduction

Health Checks
2.1 ‘Health check’ is a term commonly referred to in retail and planning
policy planning. The role and importance of health checks are
referenced in the Government’s Practice Guidance: ‘Planning for town
centres: practice guidance on need, impact and the sequential
approach’ (PG). Together with the Government’s Planning Policy
Statement 4 (PPS4), this did set a basic framework for the matters that
should be considered when reviewing the health of a particular centre.
In particular, healthy town centres are seen as having a ‘critical mass’
and diversity of retail development; to remain competitive, they are seen
to need a good mix of different types of multiple and independent
retailers and the core retail offer may be reinforced by a range of
tourism, leisure and cultural activities (PG, para. 3.14).
PPS4 has now been withdrawn and replaced by the National
Planning Policy Framework (NPPF). The NPPF does not explicitly
comment on the role of health checks but does seek to ensure the
vitality of town centres (as set out particularly in para. 23). The
NPPF requires that planning policies should be positive, promote
competitive town centre environments and set out policies for the
management and growth of centres over the plan period. In
drawing up Local Plans, local planning authorities are specifically
advised to promote competitive town centres that provide
customer choice and a diverse retail offer which reflect the
individuality of town centres.
2.2 The following assessment takes into account the general considerations
of ‘centre health’ that are commonly used in retail planning exercises.
2.3 Sources of material and evidence include:
City of York Council data sources, including footfall, vacancy and
planning application data;
EGi, an on-line information resource from the Estates Gazette;
CoStar Focus, an on-line information resource;
GOAD, specialist retail data providers;
PMA, providers of provides regular forecasts of commercial
property market performance through PROMIS Reports1; and
Visual inspection.
1 PROMIS Report of 29 November 2012
2 Baseline Audit

York as a Retail Centre
2.4 The City of York as a whole has an extensive and diverse array of retail
facilities, comprised of stores within the City Centre, two District
Centres, shopping and retail warehouse parks, a factory outlet centre
and a collection of smaller local and neighbourhood / village centres
together with free-standing food and retail warehouse stores.
2.5 York is considered to be a Regional Centre and geographically, sits
centrally to a large rural catchment area. Leeds lies about 25 miles to
the west and is the main commercial centre for Yorkshire.
Middlesbrough is the main large centre to the north, about 50 miles
distant. Hull is some 40 miles to the south east and Sheffield is about 60
miles to the south. There are smaller towns in the catchment area such
as Easingwold, Tadcaster, Selby and Thirsk.
2.6 Its geography results in York being a dominant centre for its immediate
catchment area, given the distances involved in travelling to and from
other main centres. However as a major tourist and visitor destination,
due its heritage and cultural offer in particular, York can be expected to
draw spend from well beyond its primary catchment area.
A Multi-Layered Offer
2.7 As such, York provides a ‘multi-layered’ retail offer, fulfilling the following
roles:
A day to day convenience shopping role for the resident and
worker population (i.e. the City and its hinterland population, long-
stay visitors, students and in-commuters);
A general comparison shopping role for the resident and worker
population, primarily delivered through the national multiples in the
City Centre and out-of-centre stores at Clifton Moor and Monks
Cross;
A specialist retail role which also has a wider regional draw,
through the variety of shops on offer in particular in the City Centre
and at the York Designer Outlet factory outlet centre; and
The leisure-orientated role with has a regional, national and
international draw, primarily to the City Centre, its attractions and
its food and drink offer, with spin-off retail expenditure from day-
trippers and short-stay visitors.
2.8 The strengths especially of the City Centre as a visitor draw results in a
large number of cafes, restaurants and bars that support the City Centre
economy.
2.9 As well as the heritage offer, the City also provides:
Various cultural attractions, such as the York Theatre Royal,
Grand Opera House, York Art Gallery and Barbican Centre; and
A sporting and recreation offer, through the York Races as well as
being home to league football and rugby league teams.

2.10 The City does not have a dedicated shopping mall, the nearest ones
being at the White Rose Centre, Leeds (c. 35 miles to the west),
Meadowhall, Sheffield (c. 56 miles to the south-west) and the Trafford
Centre, Greater Manchester (c. 78 miles to the west). Other major
draws in the wider area include the Ikea Store at Batley, Leeds (c. 37
miles away) and the Xscape ski slope and leisure complex at
Glasshoughton (c. 30 miles). Leeds City Centre is a major retail
destination for the region and a new shopping centre is being created at
Trinity Leeds by the developer, Land Securities, which will include
stores for Cult, H&M, Hollister, Mango, Topshop, Topman, Next and
River Island, and anchored by Marks & Spencer.
York City Centre
Overview
2.11 The 2008 City of York Retail Study (paras. 6.45 to 6.48) provided an
overview of the City Centre, which can be summarised as:
The City Centre is an attractive and vibrant retail destination;
There is a good range of major mainstream multiple retailers in
York, as well as numerous special interests;
Independent local shops contribute greatly to the distinctive
individual character of the area and provides York will a
differentiated retail offer;
There is evidence of a large catchment area;
The health check indicator assessment indicates that York is
performing well;
It is clear that the City is not capturing the full social grade A / B
shoppers;
The greatest threat to York is growing competition in the wider
sub-region and lack of space to offer to higher quality, variety and
department store operators to ensure the City Centre can compete
effectively;
It is crucial that new modern retail space is created to attract a
broader range and quality of multiple retailers; and
The historic centre is one of York’s strengths; however, it presents
barriers to expansion and the introduction of modern units.
2.12 These conclusions albeit dating to 2008 can be seen to largely hold in
2012. Influencing factors since then in particular are:
Recessionary economic conditions with a significant impact on
consumer spending and also a number of corporate failures in the
retail sector;
The growing importance of the internet as a retail channel; and
The recent approval of additional out-of-centre retailing at Monks
Cross, including a major store for John Lewis, which will have a
bearing in the City’s potential as a whole to capture the full social
grade of shoppers.
2.13 The historic characteristics of the Centre continue to represent one of
York’s key strengths but still present a barrier to expansion. A
consequence of this is that development schemes, such as on
Spurriergate and Davygate, have been relatively small-scale
interventions with no significant increase in retail floorspace.

2.14 The 2008 Study provides part of the evidence base for understanding
the nature of the City Centre but requires a refresh and update of the
key performance indicators in a consideration of the Centre’s current
health.
Characteristics
2.15 The 2008 Study, based on 2007 data, showed there to be 392
comparison units, 63 convenience and 67 vacant units in the City
Centre, out of a total of 924.

Figure 1: Character Areas

2.16 The 2008 Retail Study provided a review of the Centre split into seven
areas. We would summarise the characteristics of these areas, with our
commentary on diversity, as follows:
Central Shopping Areas - The prime areas of retail activity are
focused around Coney Street and Parliament Street. This area
has a strong national multiple retailer and leisure offer, high footfall
and an attractive mix of buildings with a good pedestrian
environment, though many units are historic and constrained in
layout terms. The ‘national multiple’ stores are concentrated on
Coney Street, which is pedestrianised. The other major stores are
concentrated on an axis which leads from Davygate in the west,
along Parliament Street, and southwards into the Coppergate
Centre. The Davygate Centre, in the northern area, was a small
arcade and was redeveloped to form space for BhS, Gap and
others. Davygate has a strong collection of fashion retailers and
two department stores. Parliament Street provides a central public
space within what is in effect a wider street and accommodates
events and specialist markets including an annual St Nicholas
Fayre. The Swinegate / Market / Shambles Area lies to the east of
this and is very distinctive, readily recognised as ‘York’. The
development of the Swinegate area has effectively linked Low
Petergate and Grape Lane into the Markets area and includes
mainly independent shops, restaurants and bars. The Market is an
open air market which operates from the public space between the
rear of Parliament Street and the Shambles.
Aldwark Area – This area lies between the main retail streets and
the City Walls to the east and is largely characterised by
residential infill developments amongst historic assets. There are
examples of good quality infill schemes epotified by the wording of
a local plaque which points to a particular residential scheme as
the ‘first major implementation of the recommendation in the
Report of Lord Esher (1968) that a return to living within the city
walls should be encouraged’.
Foss Islands – The Stonebow area is dominated by Stonebow
House and the Telephone Exchange building, which mark a
distinctive ‘edge’ to the retail core of the City, around the rear
entrance to the main Marks & Spencer store. It forms a secondary
area which acts as a linking route between the Hungate
development area and Foss Islands beyond into the City Centre.
The Hungate area has been largely developed for housing
including proposed student housing as well as office use including
the proposed Hiscox office building. The Foss Islands area beyond
includes the large Government building at Kings Pool but is
primarily characteristics by large retail stores, including
superstores and retail warehouses. Being less constrained by
heritage assets and existing residential streets, the area has
developed incrementally as a location for large-format retailing.
Castle Sector – This Sector includes the Coppergate Centre and
historic assets including the City Museum and Cliffords Tower.
The area around the Tower is characterised by car parking and
underutilised land. There have been proposals over time for the
expansion of the retail core southwards to form a ‘Coppergate II’
including the expansion over the River Foss southwards, towards
Piccadilly. The Coppergate Centre is largely retail focused but
includes the Jorvik Viking Centre, together with a multi-storey car
park and housing. There is a Hilton Hotel and a variety of
restaurants in this area, and further west towards the River Ouse,
is the Grand Opera House.

Walmgate – This street connects into Fossgate which in turn
connects into the heart of the City Centre and the primary retail
core. Together these streets form a linear secondary retail area
characterised by non-retail uses, particularly cafes and
restaurants. The street stretches from in effect the rear of the
Marks and Spencer store and Stonegate, all the way southwards
to the City Walls, with the uses becoming more diverse in that
direction. The York Press is a major employer that is based on
Walmgate.
Micklegate – This is a secondary retail area on the western side of
the City Centre, across the River Ouse. It is an historic street
which is characterised by a range of small retail units but has a
particular focus on restaurants, bars and leisure uses within the
historic buildings. The new Council Offices are situated to the
north of this street, between in effect Micklegate and the City Walls
/ Railway Station. Micklegate, linking to Bridge Street, is the main
focus of retailing to the west of the River.
Minster – The retail element of this part of the City is characterised
by higher end quality retailers and independent shops. It has a
strong tourist pull due to the attraction of the York Minster itself.
The area connects via Stonegate, one of the City’s iconic
thoroughfares, which has a variety of smaller national chains and
independent stores as well as public house and cafes. A number
of operators in the Minster area have formed a ‘Minster Quarter’
group to promote this part of the City.
Retail Provision
2.17 In terms of department stores, the City Centre includes stores for BhS,
Browns of York, Debenhams, Fenwick and Marks and Spencer. Notable
stores that are not represented are John Lewis, House of Fraser and
Selfridges (John Lewis have consent for a store in the Monks Cross
area). Browns have a store at the corner of Davygate and St Sampsons
Square which includes a range of middle and up-market fashion brands.
Fenwick, within the Coppergate Centre, also retails a number of high-
end brands. The Debenhams store on Davygate is within a historic
building with a relatively constrained floorplate. Marks and Spencer
have two stores, the larger Parliament Street Store which includes food
and clothing and which was extended in 1996, and the Coppergate
Centre Store, with a focus on household goods (the latter store is
however due to close due to lease expiry).
2.18 Key fashion multiples include Evans, Fat Face, French Connection,
H&M, Jack Wills, Monsoon, Next, Reiss, River Island, TM Lewin,
Topshop / Topman, Urban Outfitters and Zara. A relatively recent
development on ‘Coney Street’, at its southern end (Spurriergate), has
created space which has been occupied by newcomers to the City,
notably H&M and Zara. Other multiples in the Centre include Boots,
HMV, Waterstone’s and WHSmith.
2.19 York has a strong reputation for its specialist shopping. These shops are
generally concentrated on the streets that link into Davygate and
Parliament Street (i.e. the Shambles, Swinegate and Stonegate). These
streets also include some national names and national specialist shops,
such as Joules, as well as local independent specialist shops, such as
Mulberry Hall.

2.20 Convenience goods provision includes a Marks & Spencer food hall, two
Tesco Express style stores (soon to be three), as well as the Newgate
Market and small specialist outlets. Budgens have a city-centre style
food store to the south of the main retail area, off Micklegate.
Sainsbury’s have a Local store on Bootham, close to the City Centre.
Further out from the City Centre, Sainsbury’s have a superstore at Foss
Bank and Morrison’s have a large superstore at Foss Islands, as do
Waitrose. Also within the Foss Islands area are smaller food stores for
ASDA (a converted Netto supermarket) and Aldi.
Leisure Provision
2.21 The City Centre includes two cinemas. The CityScreen cinema is
located in the heart of the City Centre, off Coney Street, and offers three
screens, within an award-winning designed building. The Reel cinema is
on the periphery of the Centre, to the west on Blossom Street, and also
offers three screens within the former Odeon building. There is a Mecca
Bingo Hall and the Barbican entertainment venue to the east of the City
Centre, outwide of the City Walls, and two theatres within the Centre
itself.
2.22 The City has a strong array of food and drink outlets, with bars, cafes
and restaurants, both national and local operations, together with
various hotels such as the Hilton, Hampton Inn, Cedar Court and Dean
Court. Wagamamas, Jamie’s Italian and Yo Sushi are three new notable
recent additions to the City Centre. Bettys is a strong regional brand and
who have a main tea room off St Helen’s Square and a smaller café on
Stonegate.
Service and Employment Provision
2.23 The City Centre includes the major banks and building societies,
predominantly located around the Parliament Street area. The main City
Library (Explore Centre) is also located in the City Centre, off Museum
Street.
2.24 Major employers include the City of York Council, shortly due to move to
new accommodation at Toft Green, and the Department of Environment
Food and Rural Affairs, at Kings Pool. Network Rail have offices near
the railway station and the rail industry provides support for a number of
related companies and consultancy businesses. The York Teaching
Hospital at Wigginton Road, Nuffield Health at Haxby Road and the
Bootham Park Hospital on Bootham are within reasonable distance from
the City Centre, to the north / north west. The University of York, whilst
largely out of centre, has accommodation at Kings Manor in the City
Centre and the York St John University is based on the eastern edges
of the City Centre, just beyond the City Walls.
Edge and Out of Centre Retail and Leisure Provision
2.25 Retail warehouse provision is generally located on the periphery of the
City but within the outer ring road, particularly around the Clifton Moor
and Monks Cross areas. A variety of ‘high street’ fascia’s are
represented across both locations and there are food stores for Tesco at
Clifton Moor and for Aldi, ASDA, Marks & Spencer and Sainsbury’s at
Monks Cross. To the east of the City Centre, the Foss Islands area
includes a number of retail warehouse units, including a retail park and
various food stores (Aldi, ASDA, Morrison’s, Sainsbury’s and Waitrose).
2.26 B&Q, in addition to their Clifton Moor store, have a large free-standing
Warehouse format store at Hull Road.

2.27 Large food store provision in York is generally concentrated in out-of-
centre locations, with the exception of the Morrison’s store at Acomb. All
of the main food store operators are represented within the City.
2.28 The York Designer Outlet is to the south of the City and includes around
300,000 sqft (27,871 sqft) of comparison retail floorspace (Promis,
2011) in the form of a covered mall. It provides a modern, purpose-built
shopping experience with outlets for a range of national names as well
as up-market fashion outlets.
Leisure facilities that are out-of-centre include a Vue multi-
screen cinema and Megabowl bowling alley at Clifton Moor
together with various large health clubs.
Potential for Change
Planning Permissions
2.29 Recent planning permissions provide an indicator of potential change.
Large-scale applications in relation to retail uses, as provided by the
City of York Council, are summarised as following:
City Centre:
Argos, 19 Bridge Street (Ref: 08/02809/FUL) - change of
use from retail to 2 no. restaurants (not yet implemented)
77 - 81 Goodramgate (Ref: 11/00009/FUL) - change of
use from retail to restaurant (now occupied by
Wagamamas)
White Swan Hotel (ref: 12/03155/FULM) - change of use
of existing ground floor retail units (A1) to flexible
A1,A2,A3 or A4 use with change of use from former White
Swan Hotel (C1) to residential (C3) to form 14 apartments.
Includes 461 sq m commerical space (Permission granted
on 28.09.12)
Foss Islands:
Site adjacent To Frog Hall Public House, Layerthorpe
(Ref: 11/02210/FULM) – hotel, pub/restaurant, retail and
drive-through restaurant (not yet implemented)
Monks Cross:
Carphone Warehouse, Unit 1 Julia Avenue (Ref
10/01014/FUL) - construction of mezzanine floor and
external alterations (not yet implemented)
Arabesque House, Monks Cross Drive (Ref:
11/01468/OUTM) - retail warehouse (5574 sqm) (not yet
implemented)
Land to the West Of Jockey Lane (Ref: 11/02581/OUTM) -
community stadium, retail and food and drink uses
(including 22,868 sqm retail) (not yet implemented though
which reported interest from John Lewis Partnership,
Marks & Spencer and Next)

City Centre Proposals
2.30 A combination of a tightly grained street pattern with a large array of
historic buildings and a major river results in few opportunities for
wholesale redevelopment in the City Centre. The main area that has
been the focus of development proposals over recent years is Castle
Piccadilly, in previous iterations known as Coppergate Phase II.
2.31 The last major comprehensive development scheme was the
Coppergate Centre, built in 1984. Recent developments have been
related to the reconfiguration and redevelopment of existing space.
These include the redevelopment of the former Davygate Arcade in
1999 which provided an extension for BhS and stores for Austin Reed
and Gap, a redevelopment on Coney Street / Spurriergate which
provided stores for H&M Hennes and Zara amongst others, and the
redevelopment on Davygate which now includes stores for Cult and
Sports Direct. A significant re-development scheme was the Swinegate
Quarter, built in 1991, which provided a range of new smaller shops and
eating places on the route between Grape Lane / Low Petergate and
Church Street.
2.32 Retail activity is largely concentrated on the eastern side of the River
Ouse (albeit that the Railway Station, the bus interchange on Rougier
Street and various car parks are all on the western side, creating a
strong flow of pedestrian movement across the two key river bridges).
The prime retail areas are on the eastern side of the River. Retail-led
opportunities would need to be focused in areas where high values can
be extracted. With Coney Street backing on to the River, the Museum
Gardens to the north and the historic Shambles area to the immediate
east, it is inevitable that the focus of opportunity has been southwards.
The former industrial and warehouse buildings in and around the River
Foss area are much less constrained in physical terms and as stated
have been the focus of re-development proposals over the years, along
with the Hungate area moving eastwards out of the City.
2.33 The Piccadilly and Hungate areas continue to offer the most opportunity
for change, albeit that the Hungate development is well advanced with
only certain land parcels left available. The Stonebow House and
Telephone Exchange buildings could also offer future development
potential and are located in strong edge of centre sites.
2.34 Other than these two main areas, development opportunities are
expected to continue to be small-scale in nature, limited to the
redevelopment of individual properties or groups of properties, such as
the White Swan Hotel scheme on the corner of Piccadilly and
Coppergate.
Retailer Representation and Requirements
2.35 The PROMIS Report indicates that at November 2012 there were 47
reported requirements for York, against a UK average of 13 (which is in
improvement on statistics for November 2011) (it should be noted
however that not all retailers publish their requirement lists).

2.36 In comparison to other centres, notable retailers that are absent from
the City Centre include All Saints, Calvin Klein, Diesel, Harvey Nichols,
Hollister, House of Fraser, Jack and Jones, John Lewis, Primark,
Selfridges and Ted Baker.
2.37 A review of the 2005 GOAD Plans illustrates that store closures since
2005 include stores for Borders (books), Virgin (music), Woolworths
(variety), Oddbins (off-licence), Alison Holmes (china and glass),
Toyworld (toys), Habitat (household goods) and JJB (sports). Some of
these store closures have been as a result of corporate failures in the
UK (e.g. Borders and Woolworths). New occupiers to the City Centre
since then include Cult, Hennes, TK Maxx, Urban Outfitters and Zara.
Large floorplate stores that have become available (eg Woolworths,
Habitat) have attracted new occupiers within a relatively short period of
time. Vacancies on the whole continue to the more limited to small
shops in peripheral streets.
2.38 A review of existing provision would illustrate that:
The majority of key multiples are represented in the City Centre
and a large number also have an out of centre as well as in centre
offer;
Many of those multiples could be considered to be in less than
ideal accommodation in terms of modern standards although they
are clustered around Coney Street and the prime streets;
There has been ‘development churn’ on Coney Street through the
Zara redevelopment, BhS, Boots re-fit etc. and this may happen in
the future when buildings become particular tired, rather than a
wholesale ‘shift of pitch’ occurring; and
The in centre department store offer is compromised by the size
and configuration of existing stores but the main change is the
proposal by John Lewis for a store in an out of centre location.
2.39 In terms of the potential for change, the opportunity to plan for a new
‘shopping centre’ would largely depend upon attracting national
multiples of the right calibre in order to create value as well as footfall.
2.40 Typically, in-town shopping centre developments are anchored by a
department store (eg John Lewis at Liverpool One, Debenhams at
Princesshay in Exeter, John Lewis in Cambridge). We would expect an
anchor to occupy 50,000 sqft upwards, with different anchors providing
different offers. Reviewing the retailer requirements below, there are no
names which we considered suitable and as such there is no immediate
opportunity.
2.41 However, there are a number of potential anchor operators who are not
contained on the list (such as Debenhams, House of Frasier, Next, H
and M, Fenwick’s, Primark etc) or which are already contained within
the Centre and could re-locate to provide an anchor role within a large
scale development (such as Castle Piccadilly) should the opportunity
and circumstance suit their needs. Whilst this may create churn in the
centre, if managed proactively the helath of the centre can be
maintained in the short term and enhance in the medium to long term by
the new development.
2.42 The opportunities for a more mixed scheme (eg Cathedral Street in
Manchester, Trinity Leeds) tend to be focused on locations which are in,
or connect into, existing prime retail pitches. This approach given the
prestige of York and the calibre of some of the retailer requirements
provides an alternative to the typical in-centre development.

2.43 The investment and offer (along with the potential impact upon the City
Centre) which has occurred at Monks Cross is likely to make potential
investors cautious in the short term until the impact of Monks Cross can
be assessed.
2.44 A review of requirements at 750 sqft or above (as at 20 November 2012
(source: CoFocus)) would indicate that those requirements are City
Centre focused. Some of the requirements are new fascias. York has a
key advantage over many provincial towns because it is likely to be on
the target lists by new operations given its ‘brand’, with the potential to
attract new operations into the City, particular in the fashion / high-end
sectors.
Table 1: Retailer Requirements
OccupierSpace
RequirementLocation Sub-Sector
Aagrah 4000-6000 sqft Prime in town Food and drink
Austin Reed 650-6250 sqft Prime in town Clothing
Bargain Book Time 800-3000 sqft Prime in town Books
Bensons for Beds 3000-5000 sqft Prime out of town Household goods
Blue Apple 800-3700 sqftPrime in town – high
street / shopping centreClothing
Blue Inc 2500-4000 sqft Prime in town Clothing
BrewDog 750-2000 sqft Prime / secondary in town Food and drink
OccupierSpace
RequirementLocation Sub-Sector
Brighthouse 2250-3500 sqftPrime in town – high
street / shopping centreElectricals
Brora1200-1400 sqft +
ancillaryPrime in town Clothing
Café M 1700-3000 sqft
Prime in town / good
secondary – high street /
shopping centre
Food and drink
Cosmo Restaurants 8000-20000 sqft
Prime – in town / retail
parks / leisure parks etc.
(stand alone unit)
Food and drink
Costa 750-2000 sqft Prime in town Food and drink
Everything
Everywhere700 sqft +
Prime – high street /
shopping centre / fashion
park
Electricals
GNC 650-850 sqft Prime in town Health
Golfino 1000 sqft Prime in town - outlet Clothing / sport
Grainger Games 720-1250 sqft Prime in town Entertainment
H&D Fashionista
Ltd800-3000 sqft
Prime in town – high
street / shopping centreClothing

OccupierSpace
RequirementLocation Sub-Sector
High and Mighty 1000-2500 sqft Prime in town Clothing
Jessops 2 1000-1500 sqft Prime in town Cameras
JoJo Maman Bebe 800-1000 sqft Prime in town Clothing
Liz Earle 1000-4000 sqft Prime in town Health
Matalan Retail 20000-35000 sqft Prime out of town Clothing
Moo Moo’s 350-1000 sqft Prime in town ?Food and drink?
Moshulu 500-1000 sqft Prime – high street Clothing
Neal’s Yard
Remedies
800-1000 sqft +
ancillaryPrime in town Health
Panasonic 1200-2000 sqftPrime / secondary – high
street / shopping centreElectricals
Phase Eight 700-2000 sqft Prime in town Clothing
Premier Inn 10000-50000 sqftPrime in town / edge of
town / out of town
Food and drink /
hotel
Sandinista! Cantina1200-3000 sqft Prime in town Food and drink
2 This operatore has a new store on Coney St. so requirement may be satisfied.
OccupierSpace
RequirementLocation Sub-Sector
Bar
Soletrader 1000-1500 sqftPrime / edge of prime high
street / shopping centre
Clothing /
footwear
Sweaty Betty700-1000 sqft +
ancillaryPrime in town Clothing
Talarius 1000-2000 sqft Secondary in town Gaming
The Chinese Buffet 6000-15000 sqftPrime – town centre /
leisure parkFood and drink
Warren James 800-1200 sqftPrime in town – high
street / shopping centreJewellery
Wok and Go 800-1500 sqft Secondary in town Food and drink
Xercise4less 20000-35000 sqftPrime in town / large units
/ close to urban centreLeisure
Zouk Deli 600-1200 sqft Prime in town Food and drink
(Unnamed) 1400-2500 sqft Prime in town Clothing
(Unnamed) 800-1500 sqft Prime (Stonegate only) A1
City Centre Shopping Rents
2.45 The 2008 Retail Study indicated that prime retail rents in York stood at
£2,153 sqm, York having outperformed all the other competing centres
for this indicator (para. 4.10).
2.46 Based on agent sources, the estimated prime rents in York at now, in
mid 2012, equivalent to £1,938 psm Zone A (PROMIS, 2012) which
represents no change on the end 2011 levels, though clearly this
represents a fall from the 2008 reported figures.
2.47 The data would suggest a circa 10% fall in prime rents from the height
of the market; this is comparable to the national average. However there
have been regional variances with rental growth / decline in centres with
some centres (such as Leeds and Manchester) experiencing double the
national average. This would suggest that the trading performance of
the City Centre is under pressure and that the demand for space has
been weaker relative to supply. This is not an unexpected finding given
the macro-economic climate over the last few years though it does
seem evident that York has not suffered to the same extent as many
other centres have suffered; the tourism market is likely to have
provided a buffer to the local retail economy in particular.
2.48 Within any Centre, rental levels can vary considerably. The PROMIS
report indicates the prime area of Coney Street is followed by strong
secondary pitches in Dabygate and Parliament Street. Stonegate Zone
A levels are lower at £1,507 psm equivalent but particularly interesting,
the indication is that this is significantly above the 2007 levels (which
were £1,076 psm) .
2.49 Stonegate has seen a number of national multiple lettings to the likes of
Cath Kidston, Joules and White Stuff, and has attracted the national
higher-end multiples who are assumed to be attracted to the
distinctiveness of this street, yet within sticking distance of the prime
pitches. PROMIS indicate Zone A levels in the Coppergate Centre to be
£979 psm equivalent, only 50% of York’s top rent (January 2012).
City Centre Vacancies
2.50 The 2008 Retail Study indicated that there were 67 vacant units (based
on 2007 data) representing 7.25% of all units. In contrast, the February
2010 Survey of PROMIS indicated vacancy rates at 5.3% of units and,
at January 2012, the surveyed rate stood at 4.7%.
2.51 The Council have also updated the vacancy rates using the latest
GOAD data from August 2010 (released August 2011) which has also
involved a check over the consistent use of boundaries. The GOAD
network of streets plan has the advantage of providing a consistent
base and this is what the Council use and report on.
2.52 The Council’s data indicates vacancy rates of 9.1% of shop units within
the A Classes (2010) which represents an increase from 7.1% in 2009.
Whilst the number of vacant units had risen, the overall number of A
Class units has risen slightly less. Half (39) of the vacancies are within
the Central Shopping Area and 22 are on the primary shopping streets.
The biggest increase in vacant units has been on the ‘gateway streets’.
Vacancies have also started to appear in College Street, Davygate,
Kings Square and Parliament Street.

2.53 In all centres there is a ‘churn’ of units and a healthy retail market
requires some level of vacancies to function. Research reported in
November 2012 by the Local Data Company illustrates a town centre
GB vacancy rate of 14.5% and thus York performs
against this indicator.
Figure 2: Map showing Vacant properties (2012)
healthy retail market
requires some level of vacancies to function. Research reported in
November 2012 by the Local Data Company illustrates a town centre
GB vacancy rate of 14.5% and thus York performs particularly well
2.54 Vacancy levels as a whole indicate a positive health of the City Centre;
the issues are more complex in terms of geography and use type
however. Whichever source of data is used, the City
performs well relatively to others as a whole.
change of type of certain units such as Greggs occupation of the former
Faith Shoes unit on Coney Street, Miss Selfridges being replaced by
Caffe Nero in Coppergate and Wagamama taking the former JJB
on Goodramgate, as well as concern over the
secondary and gateway streets, as indicated by the Council’s survey
results.
Commercial Yields
2.55 Commercial yields on non-domestic property can provide an indicator of
investor confidence. However, the yields achieved on investment sales
can reflect a multitude of factors, ranging from the strength of
covenant, the quality of the property, the general market sentiment, as
well as the locational factors associated with the pr
in general and as such the indicator needs to
2.56 Agent sources indicate prime retail yields at 5% in Autumn 2012,
showing no change on the level 6 months previous (PROMIS, 2012).
The 2008 Retail Study reference
as being on a par with Harrogate and second to Leeds at 4.75%.
yields for York have been slightly improving
reported transaction (CoFocus) for a unit on Coney Street
a 4.85% net yield.
2.57 This indicator would suggest that York continues to be an attractive
place for investment and may refle
recession, for investment to flow towards attractive, high demand areas.
Vacancy levels as a whole indicate a positive health of the City Centre;
the issues are more complex in terms of geography and use type
however. Whichever source of data is used, the City does indeed
elatively to others as a whole. Specific issues are the
change of type of certain units such as Greggs occupation of the former
Faith Shoes unit on Coney Street, Miss Selfridges being replaced by
Caffe Nero in Coppergate and Wagamama taking the former JJB Unit
on Goodramgate, as well as concern over the rates on certain
, as indicated by the Council’s survey
domestic property can provide an indicator of
wever, the yields achieved on investment sales
can reflect a multitude of factors, ranging from the strength of a tenant’s
covenant, the quality of the property, the general market sentiment, as
well as the locational factors associated with the property and the area
in general and as such the indicator needs to be used with care.
Agent sources indicate prime retail yields at 5% in Autumn 2012,
showing no change on the level 6 months previous (PROMIS, 2012).
referenced a standard York retail yield at 5.5%
on a par with Harrogate and second to Leeds at 4.75%. The
yields for York have been slightly improving over recent years and a
reported transaction (CoFocus) for a unit on Coney Street was based on
indicator would suggest that York continues to be an attractive
place for investment and may reflect a general trend, in times of
, for investment to flow towards attractive, high demand areas.

Land Values and Undeveloped Land
2.58 Although land value information is a referenced indicator of the health of
a centre, the information is generally quite limited in relation to
development sites and indeed for city centre sites, the site-specific
factors means that it is difficult to make any meaningful comparative
exercise. The physical factors relating to York also compound the
problem. Sites on Piccadilly and on Hungate remain to be redeveloped
though the issues relating to that are relatively complex.
Figure 3: Heat map of Rent in York
Footfall
2.59 Footfall data is collected on behalf of the Council at two key points in the
City Centre, namely Coney Street and Parliament Street. Time-series
data is available from January 2009 for Coney Street and March 2009
onwards for Parliament Street.
2.60 A full three years can be analysed for Coney Street, with overall footfall
levels being at 12.54m in 2009, falling to 12.35m in 2010 and rising back
to 12.45m in 2011. Full year data is not yet available for 2012 but the
equivalent figures to week 49 show a decline between 2011 and 2012 of
11.32m down to 10.60m.
2.61 Overall, the figures indicate that footfall levels on Parliament Street have
fallen. The total figure for 2010 for Parliament Street at 8.59m was
higher than the 2011 figure of 8.44m. Equivalent figures to week 49 in
2012 show a decline of 7.4m from 7.8m in 2012.
2.62 The footfall indicators show a concerning trend of reducing footfall in
both of the main prime streets.
2.63 The national trend for footfall (as identified by Experian ‘Footfall’, up to
and including the w/c 22/10/2012) shows a fall of 3% from 2011 to 2012
on the year to date cumulative figures.

Accessibility
2.64 The City of York Annual Parking Report 2010-11 provides a
comprehensive review of car parking. The key areas of the York
Transport Plan 2006-11 are referenced which are to ease congestion
and improve accessibility, air quality and safety (Section 3). Off-street,
there are 14 Council-run car parks with 2,569 spaces plus two coach
parks. There is also on-street parking in certain streets and private car
parks operated by for instance National Car Parks and Q Parks. Parking
costs vary from facility to facility. As an example, parking at Marygate,
one of the largest surface car parks, is £1.90 an hour and £9.50 for 5
hours, with discounts for City residents. Certain, more peripheral, car
parks are lower priced, such as 90p an hour at Foss Bank. Castle is a
popular car park that serves the Coppergate area of the City, with a
premium rate of £2.20 per hour for non-residents.
2.65 The City benefits from extensive park and ride services and facilities,
with five park and ride sites that provide access to the City Centre, from
Askham Bar in the west, Designer Outlet in the south, Grimston Bar in
the east, Monks Cross to the north-east and Rawcliffe Bar to the north.
A replacement facility at Askham Bar is proposed together a new site at
Poppleton Bar. More than 4 million trips are expected to be made on
Park & Ride services in 2012 (source: itravelyork.com).
2.66 The City Centre is served by an extensive range of bus services
although there is no dedicated City Centre bus station. There are
however planned initiatives to improve bus facilities within the City.
2.67 The York Railway Station is to the south-west of the Central Shopping
Area, served by East Coast Mainline services and regional services.
2.68 The City Centre is also served by an extensive array of cycle routes with
cycle parking facilities across various locations.
Customer and Residents’ Views and Behaviour
2.69 The Big York Survey (BYS) is a Council-led initiative to gather views.
Some of the key indicators are (percentages are based on
respondents):
92% are ‘satisfied’ with York as a place to live;
Low crime levels, health services, good schools, good public
transport links and clean streets represent the ‘top five’ of things
that are most important in making somewhere a good place to live.
53% consider that a ‘wide range of shopping facilities’ is one such
thing;
Good traffic flow (54%), well maintained roads / pavements (46%)
and affordable decent housing (46%) stand out as the things that
need improving, followed by job prospects (37%) and good public
transport links (30%). Only 11% referenced a ‘wide range of
shopping facilities’ as needing to be improved most;
66% mainly shop in the City Centre for non-food items, with 48%
out of town / retail outlets, 20% locally (within a mile) and 18%
online; and
49% mainly shop in the City Centre for food, with 61% shopping
locally and 23% in the City Centre.
Retailer Survey
2.70 A Survey prepared for the City Centre Manager in November 2012
provides information on shopper behaviour and shopping patterns,
trading parameters and trends and perceived City Centre strengths and
weaknesses. Key findings include:

Working people and retired groups are key consumer groups;
Shoppers are considered to be ‘affluent’ and ‘comfortable’ with the
Centre less attractive to ‘value seekers’ and those ‘on a budget’;
Over half of respondents are trading in line with or better than last
year - just over a quarter are more than 10% down;
The City is successfully appealing to local residents and workers,
albeit not at levels seen in other city centres;
The City Centre is considered to be a good place to meet friends
and has a nice environment but ‘choice of shops’ and ‘specific
stores’ were rated relatively poorly;
The ‘markets’ rate almost as highly as specific stores;
Underperforming areas are the facilities, leisure, convenience, car
parking and ease of access;
Core strengths are seen as the history, character and atmosphere
in the City, which is considered to have a good choice of shops,
with speciality stores / independents being specifically named as a
strength;
More than two-thirds of respondents cited parking provision / cost
as weaknesses, with just less than a quarter citing access /
transport links;
Weak product categories are seen as menswear and white goods
as well as catering provision; and
When asked about different aspects of the City Centre, parking
provision, promotional activity and destination stores are
considered to be poor relative to the ‘scores’ for customer
experience, retail mix and shopper facilities.
The survey identifies a series of areas for further investigation or
potential improvement initiatives. These relate to growing
customer numbers including local workers, car park pricing /
promotions, improving variety of the offer and the appeal to
teenagers, retirees and students, events / promotions and
marketing activity.
Safety and Crime
2.71 An extensive amount of data is available from Police indicators including
information on the level of crime in the City Centre. However the level of
crime will need to be considered on a relative basis (City Centre crime
rates are likely to be higher than suburban locations).
2.72 The Big York Survey posed a series of questions in relation to crime.
Circa 74% considered York (as a whole) to be a safe city to live in with
circa 11% disagreeing. 23% considered the level of ‘rubbish or litter
lying around’ to be a problem, which was the highest problem issue
identified through a series of questions. Nearly 91% are satisfied with
their local area as a place to live with only just over 4% being
dissatisfied.

City Centre Environmental Quality
2.73 The 2008 Retail Study considered the quality and character of the built
environment to be of a high standard and the age, design and
arrangement of the buildings gives York a distinctive character that
underpins its tourist and leisure economy (para. 6.26). Investment in
public realms in places could benefit from additional investment
although streets are well maintained, litter levels are negligible and
graffiti is minimal, with the built environment forming a vibrant and
pleasant shopping experience (paras. 6.25-6.27).
2.74 Our own assessment would support the 2008 Retail Study findings; the
City Centre offers a unique and distinctive shopping environment
through its vast array of historic buildings and spaces. There are certain
buildings and spaces within the Centre which detract from the overall
environment but these relate to specific parts of the Centre and do not in
our view detract from the overall experience of the place.
2.75 The BYS posed some questions over the quality of certain areas in the
City. In terms of ‘good’ areas, the following performed particularly well:
Duncombe Place / Minster area;
The route from the station to the city centre; and
The Shamblers and Whip-ma-whop-ma Gate.
The following areas performed ‘poor’:
Piccadilly / Pavement;
King’s Square; and
Castlegate.
2.76 Particular suggested improvements relate to litter, free and clean
pavements and more seating. Only 2% suggested that ‘some decent
shops – not just tourist ones’ were needed.
Findings
2.77 The health check indicator reviews can be summarised as follows:
Diversity
There is a strong mix of City Centre retail provision and diversity;
The department store offer is good but certain stores are
constrained by their building form and there are notable
absentees;
Representation by multiples is good and newcomers such as H&M
Hennes, Urban Outfitters and Zara have been attracted into the
Centre;
Market provision and festival / street activity is very good, the latter
being a major strength;
The specialist shopping provision is very strong;
The convenience goods offer has significantly improved with a
number of smaller format stores;
Cinema and entertainment provision is good, although there is no
major in-centre ‘multiplex’ cinema;

The provision of cafes, restaurants and public houses is strong
and continues to grow;
The main deficiency is the lack of a wide variety of large floorplate
stores; and
Menswear and white goods sectors are particular areas for
improvement.
Floorspace in edge-of-centre and out-of-centre locations
There is an extensive amount of retail, leisure and office
floorspace outside of the City Centre and this is planned to grow;
There are no specific sectors which are currently deficient, with the
possible exception of furniture / homeware stores;
All of the main foodstore operators are represented in the City;
The Foss Island area has been a focus for large floorplate
operators within a reasonable distance of the Central Shopping
Area;
The main out-of-centre shopping parks also include Open A1 /
fashion goods retailers; and
The Designer Outlet provides the City with a modern factory outlet
centre.
Potential for Change
The Coppergate Centre was the last major development, built over
25 years ago. More recent development activity has involved the
re-development of existing space and older properties;
The main recent changes in the City Centre have been the
introduction of new small format convenience stores plus new
restaurants, including changes of use from previous retail units;
There are opportunities for small scale interventions, through
redevelopment of tired and 1960s/1970s buildings; and
Castle Piccadilly has been a focus of development proposals and
is the main, and arguably only, potential development area that
could enable the centre to expand significantly in retail terms.
Retail and Leisure Requirements
There is a reasonable list of potential requirements although a
number would be relocations;
There are requirements from new and growing retailers that offer
the potential to add to the diversity of the City Centre offer;
There continues to be further interest from food and drink
operators wanting representation primarily in the City Centre; and
The relative demand for space, to other centres, is reasonably
strong.

Rents
Prime rents have fallen in recent years though relative decline is
less pronounced;
There has been particular growth in some of the off-prime streets,
due to an increasingly national multiple presence, indicating a
‘spread’ of prime; and
A lack of larger floorplate buildings may have placed a constraint
on declining rents.
Vacancies
Vacancy rates are below the national averages as a whole;
Many of the larger stores that have been made available (some
through company failures) have now been re-occupied; and
The main concern is on the ‘gateway’ streets as well as the
specialist shopping streets.
Yields
There is some indication that York is maintaining its attraction as a
place to invest.
Pedestrian Flows
Footfall statistics indicate a concerning trend of reduced footfall in
2012.
Accessibility
Public Transport and park-and-ride accessibility to the City Centre
is strong; and
Car parking availability and pricing is a focus of negative
commentary.
Residents Views
There are concerns in relation to the City Centre relate to
environmental quality, particular in certain parts of the City.
Retailers Views
The history, character and atmosphere in the City are core
strengths but there are concerns over parking provision / cost.
Environmental Quality
The City Centre is an attractive place to shop and visit;
Any weakness relates to specific buildings and spaces, as
opposed to any generalised concern;
The distinctiveness of different catchment areas is a significant
asset; and
There are parts of the City, particular the Piccadilly and Castlegate
area, which are poorly perceived.

3.1 In order to establish which Cities and Towns which represented
appropriate retail benchmarks we undertook a sieving exercise, initially
the Cities / Towns identified were as follows:
Aberdeen;
Aldershot;
Bath;
Brighton;
Cambridge;
Durham;
Edinburgh;
Exeter;
Guildford;
Leeds; and
Norwich.
3.2 Retail indicators (including Demographic) were used to assess the
relevance of each of these centres against that of York, the full set of
indicators are provided in Appendix 1. A summary of these are provided
below:
3 Comparators

Table 2: Retail Indicators
Ab
erd
een
Ald
ers
ho
t
Bath
Bri
gh
ton
Cam
bri
dg
e
Ch
este
r
Du
rham
Ed
inb
urg
h
Exete
r
Gu
ild
ford
Leed
s
No
rwic
h
Yo
rk
Demographic Information
CB Richard Ellis Shopping Population (000s)331 32 207 307 324 333 69 464 327 244 665 510 297
Total in-store comparison retail expenditure 2011 (Rank out of 200,1=Best) 29 n/a 43 41 24 15 176 9 36 32 2 12 35
Per capita in-store comparison retail expenditure £20112,597 2,489 2,523 2,416 2,582 2,300 2,332 2,611 2,392 2,600 2,419 2,387 2,533
Forecast growth in comparison retail expenditure 2011-16 (%pa real)1.1 1.3 1.3 0.9 1.6 0.7 1.0 1.1 1.2 1.3 1.3 1.3 1.4
Town Centre Floorspace (000s sq ft)2,214 661 1,494 1,466 526 2,092 1,389 1,433 1,583 2,223 1,495
Town Centre Floorspace (Rank out of 200, 1=Best)10 n/a 39 25 33 37 195 15 43 92 11 8 32
Number of TC Multiples165 43 172 207 202 162 74 216 137 169 208 190 155
PMA Retail Provision Score335 63 405 440 430 345 118 508 282 362 433 367 318
PMA Retail Provision Score (Rank out of 200, 1=Best)20 n/a 12 7 9 18 132 4 28 16 8 14 25
Change in PMA Retail Provision Score (2005 - 2010)72 -32 130 15 117 -55 -1 10 62 -30 12 14 24

3.3 From the comparison of the centres, from the data available (including the
economic data) and our knowledge of these centres, it was established
that the following centres would researched in further detail:
Bath – a strong City of heritage, with a similar retail expenditure
profile to York, providing a high end offer, which has shown
significant enhancement since 2005;
Cambridge – a leading academic centre, with a historic core
expected to experience both population and expenditure growth in
the coming years;
Chester – a City which is facing similar threats to York, competition
from out of centre developments, and the constraints of providing for
retailer requirements through new development within an historic
City;
Edinburgh – an aspirational target for York, Edinburgh representing
an historic powerful city;
Exeter – a historic City, which has overcome the historic constraints
to enable development within the City Core; and
Leeds – has been used in part to assess the position of Leeds
relative to York.
Table 3: GOAD Data used and survey dates
3Edinburgh City Centre retail offer also includes outlets within Old Town,
Tollcross and other locations which are recorded separately by GOAD.
GOAD Data for the Centres
GB Average – as of September 2012
Bath – survey date 30 Jul 2012
Cambridge Central – survey date 20 Jun 2012
Chester – survey date 23 Jul 2012
Edinburgh – Princes Street3 – survey date 11 March 2012
Exeter – survey date 20 June 2012
York – survey date 03 Jul 2012

Table 4: Comparison of Floorspace Comparator’s and GB Average
GB
AverageBath Cambridge Chester
Convenience 17.22 11.12 3.83 11.09
Comparison 45.91 53.14 60.89 53.26
Service 25.63 22.72 24.41 19.84
Restaurants,
cafés, fast
food (part of
Service)
11.26 12.75 14.32 10.13
Vacant 12.21 12.21 10.07 15.11
and GB Average
Edinburgh Exeter York
3.42 7.96 5.30
55.92 56.84 53.95
29.18 24.30 30.46
14.97 13.58 19.59
10.26 8.35 8.70
3.4 All the centres which have been assessed are higher order centres, which
feature less convenience retail than
exception of Exeter, have a lower than GB a
vacancies.
3.5 York has the highest percentage of restaurant
of the centres identified.
3.6 The below charts represent the sector percentage comparisons:
Figure 4: Sectors comparisons
All the centres which have been assessed are higher order centres, which
feature less convenience retail than district and local centres, and with the
exception of Exeter, have a lower than GB average in respect of
York has the highest percentage of restaurants, cafes and fast food outlets
The below charts represent the sector percentage comparisons:

Table 5: Comparison of Floorspace Leeds v York
Leeds York
Sq m % Sq m %
Convenience 29,766 13.89 7,404 5.30
Comparison 95,526 45.05 75,381 53.95
Service 52,890 24.68 42,568 30.46
Restaurants, cafés, fast
food (part of Service)27,834 12.99 27,379 19.59
Vacant 30,900 14.42 12,152 8.70
3.7 The floorspace within the centres given over to restaurants, cafes and fast
food is nearly identical to that in Leeds retail core. However it is important
to consider that the surveyed area for Leeds does not include
congregations of bars / restaurants (i.e. Call Lane and Greek Street) which
lie just outside the core shopping area.
Figure 5: Floorspace per sector Leeds v’s York
0
20,000
40,000
60,000
80,000
100,000
120,000
Convenience Comparison Service Restaurants, cafés,fast food (part of
Service)
Vacant
Leeds
York

4 Comparitor Analysis
4.1 In order to understand the Centre’s further, we provide an overview of the
Centre along with details of recent projects and development which have
influenced the expansion / provision within the centre.
Figure 6: Comparator Locations
Bath
4.2 Bath is an attractive historic city, famed for its Roman spa and Georgian
architecture. Conservation restrictions limit the scope for development in
and around Bath: The City itself is a designated UNESCO “World Heritage
Site”, while most of the surrounding rural area is within either the
Bath/Bristol Green Belt or the Cotswolds Area of Outstanding Natural
Beauty.
4.3 Bath has a linear central retail area. The principal shopping streets of
Milsom Street, Union Street, Stall Street and Southgate form a north-south
axis running parallel to the River Avon. The key tourist attractions are the
Pump Rooms, Roman Baths and Bath Abbey, all located within the main
shopping area.
4.4 There is no additional city centre floorspace currently under construction
within Bath City Centre and no additional floorspace with full or outline
planning consent (net additional), despite the City Centre having 30
requirements (above average for a centre of its size).
4.5 Bath's special retail offer, with its high quality/upmarket shopping in a
historic setting, means that it provides an attractive alternative to provision
in the neighbouring centres of Bristol and Swindon. However, Bath does
face strong and growing competition for comparison shopping trips from
these centres, particularly given their superior department and variety
store provision.

Southgate
4.6 Southgate is the first major city centre development in Bath since the
1970’s. It was over 15 years in the pipeline and was delivered by a joint
venture partnership between AVIVA Investors and Multi Investment. The
development consisted of:
440,000 sq ft of retail and leisure;
Department Store, 7 Mid Size Units’s, 49 Shops and 2 Office units;
13 Cafes and restaurants;
860 space underground car park;
New Bus Interchange (£14m build cost);
Investment in Bath Spa Railway Station (£12m build cost); and
99 Apartments.
Figure 7: Apple Store, Bath Southgate
Cambridge
4.7 Cambridge is an historic centre with considerable character, and is a
major university city and is also a major research and development centre.
In addition the City acts as the administrative centre for Cambridgeshire.
4.8 The University colleges, churches and other historic buildings / structures
influence the type of retailing available within the City, and modern shop
units do not fit easily. The historic core is centred around Petty Cury,
Market Hill and Market Street; along with Trinity Street to the west and St
Andrews Street and Sidney Street to the east. Lion Yard and Grand
Arcade to the south provide provision for new retailer and further provision
for modern retail units are located approximately 10 minutes walk to the
south east of the core area in the form of the Grafton Centre.
Recent Developments
4.9 The Grand Arcade is Cambridge’s most recent addition to shopping
provision in the historic part of the City. This comprises a two-level arcade
and a functional covered thoroughfare between St Andrew’s Street and
Lion Yard. The centre opened on 27th March 2008 comprising a total retail
floorspace of approximately 41,805 sqm gross across 52 units; largely
dedicated to a higher quality retail offer which includes designer retailers
All Saints and Gerry Weber. Other retailers represented in the centre
include Links of London, Laura Ashley, Castle Galleries, Topshop,
Warehouse, Coast, River Island, Apple, Vision Express and Clinton Cards.

Figure 8: Grand Arcade – Cambridge
4.10 The centre is anchored by a 19,509 sqm net John Lewis which opened in
advance of the rest of the centre in November 2007. At the time of our site
visit, approximately twenty units in the centre were vacant however
was a clear indication that some were being prepared for occupation or
had been let to retailers ‘coming soon’ including Ted Baker, L.K Bennett,
Crew Clothing Co., The White Company and Quicksilver.
4.11 Grafton Centre – Prudential Property Investment Man
the centre, have submitted an application to refurbish the centre, provide
additional A3 units, and improve retail frontages on the nearby streets.
Chester
4.12 Chester’s primary retail area is concentrated along the streets radiating
outwards from The Cross, namely Eastgate Street, Northgate Street,
Bridge Street and Watergate Street. Along these main streets are the
distinctive two-level timber-framed units known as The Rows, which create
The centre is anchored by a 19,509 sqm net John Lewis which opened in
advance of the rest of the centre in November 2007. At the time of our site
visit, approximately twenty units in the centre were vacant however there
was a clear indication that some were being prepared for occupation or
had been let to retailers ‘coming soon’ including Ted Baker, L.K Bennett,
Crew Clothing Co., The White Company and Quicksilver.
Prudential Property Investment Managers, the owners of
the centre, have submitted an application to refurbish the centre, provide
additional A3 units, and improve retail frontages on the nearby streets.
Chester’s primary retail area is concentrated along the streets radiating
ards from The Cross, namely Eastgate Street, Northgate Street,
Bridge Street and Watergate Street. Along these main streets are the
framed units known as The Rows, which create
a shopping environment of considerable character.
from much of the core area; Watergate Street is fully pedestrianised, parts
of Northgate Street and Eastgate Street are also fully pedestrianised,
whilst access to Bridge Street is restricted.
4.13 Chester, like many historic cities, suffers
parking problems. Similar to York, Chester operates four Park and Ride
facilities.
Out of centre competition
4.14 Located at Little Stanney, to the north of Chester, is Cheshire Oaks
Designer Outlet. This 360,000 sq ft scheme has a
retailers including All Saints, Lacoste, Burberry, Marks & Spencer Outlet,
Karen Millen, Kurt Muller, Diesel, Jaeger and Coast. Marks & Spencer
opened a flagship store at Cheshire Oaks in August 2012, at 148,000 sq ft
it's their second largest store.
4.15 Adjacent to Cheshire Oaks is The Coliseum Leisure Park, a 170,000 sq ft
leisure park which opened in 1999; occupiers include a Vue multiplex,
Tenpin, a nightclub and restaurants including Bella Italia, Frankie &
Benny’s and Nando's. A further phase of development including a hotel
and restaurants is underway.
4.16 In addition to Cheshire Oaks and The Coliseum, to the west of the City
Centre are three retail parks which have some 520,00 sq ft of retail
warehousing:
a shopping environment of considerable character. Traffic is excluded
from much of the core area; Watergate Street is fully pedestrianised, parts
of Northgate Street and Eastgate Street are also fully pedestrianised,
whilst access to Bridge Street is restricted.
Chester, like many historic cities, suffers from traffic congestion and
parking problems. Similar to York, Chester operates four Park and Ride
Located at Little Stanney, to the north of Chester, is Cheshire Oaks
Designer Outlet. This 360,000 sq ft scheme has a good tenant line-up with
retailers including All Saints, Lacoste, Burberry, Marks & Spencer Outlet,
Karen Millen, Kurt Muller, Diesel, Jaeger and Coast. Marks & Spencer
opened a flagship store at Cheshire Oaks in August 2012, at 148,000 sq ft
Adjacent to Cheshire Oaks is The Coliseum Leisure Park, a 170,000 sq ft
leisure park which opened in 1999; occupiers include a Vue multiplex,
Tenpin, a nightclub and restaurants including Bella Italia, Frankie &
further phase of development including a hotel
In addition to Cheshire Oaks and The Coliseum, to the west of the City
Centre are three retail parks which have some 520,00 sq ft of retail

Greyhound Retail Park is the largest park within the Chester catchment
area and was developed in two phases in 1987 and 1991, both under
separate ownership. The park is located approximately one mile to the
west of Chester city centre on the site of a former greyhound stadium, off
Sealand Road (A548); the park is easily accessed and is highly visible.
The park benefits from open A1 consent, although most of its occupiers
are traditional bulky goods operators with the notable exceptions of
Argos and Next. Other occupiers at the park include Comet, Wren, PC
World, John Lewis at Home, Pets At Home and Halfords, as well as
several furnishing retailers. In addition to the retail warehousing on the
park, there is also a free-standing Frankie & Benny's restaurant, a
Cineworld multiplex and Tenpin bowling at the rear.
Adjacent to Greyhound Retail Park is Chester Retail Park, which also
benefits from open A1 consent and has reasonably good parking
provision. The park is anchored by Tesco Homeplus, trading alongside
The Outfit, Peacocks, TK Maxx, Hobbycraft, Maplin, Mothercare, Toys R
Us and Sports Direct.
Deva Retail Centre opened in 2002 and is also situated close to
Greyhound Retail Park - just off Sealand Road and opposite Chester
Retail Park. Occupiers at this bulky goods park include Currys/PC World,
Kutchenhaus, Harveys, Furniture Village and Magnet.
4.17 The Council have emphasised their support to the proposed Northgate
scheme staing in the Report to the Executive (November 2012):
Northgate is considered critical to the future economic success of Chesterin which the City is competing in an increasingly competitive andpolarised retail environment.
4.18 The proposed scheme comprises:
580,000 sq ft of retail and leisure space on two main levels;
A new department store and 10 MSUs – large retail stores to
satisfy unfulfilled retailer demand;
80 retail units and 13 restaurants;
A 40,000 sq ft multiplex cinema on the upper level ;
A relocated market hall;
1,100 high quality car spaces – 200 underground and the majority
in a multi-storey car park at the north of the site; and
Underground servicing.

Figure 9: Northgate scheme indicative
Edinburgh
4.19 Edinburgh is the historic, administrative and financial capital of Scotland.
This position was reinforced by devolution, with the establishment of the
Scottish Parliament in 2000.
4.20 In addition to a large catchment area, the available expenditure is
supplemented by both UK and overseas visitors to the city. Visitors are
attracted throughout the year but particularly during the late summer
International and Fringe Festivals and for the New Year celebrations.
According to the Scottish Tourist Board there were 1.9 million trips
Edinburgh is the historic, administrative and financial capital of Scotland.
This position was reinforced by devolution, with the establishment of the
In addition to a large catchment area, the available expenditure is
supplemented by both UK and overseas visitors to the city. Visitors are
attracted throughout the year but particularly during the late summer
Fringe Festivals and for the New Year celebrations.
there were 1.9 million trips
(excluding day trips) to Edinburgh by UK visitors and 1.3 million trips by
overseas tourists in 2010. Total expenditure by tourists (e
visitors) was just over £1 billion.
4.21 Like many cities it suffers from congestion and has planned the re
introduction of the tram. However due to funding issues and political
disputes the scale of the tram network has been significantly reduced.
With the current proposal providing a line from the City Centre to the
Airport, which is due for completion by 2014 (three years later than the
larger original scheme was due to be operational).
4.22 City Centre retail provision has historically been dominated
Street, which is characterised by its unusual
the north side, with Princes Street Gardens to the south. However, in
recent years the parallel running George Street has become an
increasingly important destination
undoubtedly become a strong complimentary pitch to Princes Street. The
centre is linear in form and constrained by the heritage of the City and its
World Heritage Status.
4.23 There are several large modern retail parks within an
Edinburgh and by far the largest is Fort Kinnaird, which is owned by a joint
venture between British Land's Hercules Unit Trust and The Crown Estate.
The shopping park comprises around 490,000 sq ft of retail floorspace and
is situated to the south-east of the city centre, adjacent to the A1.
Operators include Marks and Spencer’s
Boots.
(excluding day trips) to Edinburgh by UK visitors and 1.3 million trips by
overseas tourists in 2010. Total expenditure by tourists (excluding day
visitors) was just over £1 billion.
Like many cities it suffers from congestion and has planned the re-
introduction of the tram. However due to funding issues and political
disputes the scale of the tram network has been significantly reduced.
With the current proposal providing a line from the City Centre to the
Airport, which is due for completion by 2014 (three years later than the
larger original scheme was due to be operational).
City Centre retail provision has historically been dominated by Princes
Street, which is characterised by its unusual single sided retail frontage on
the north side, with Princes Street Gardens to the south. However, in
recent years the parallel running George Street has become an
increasingly important destination for upmarket retailers and has
undoubtedly become a strong complimentary pitch to Princes Street. The
centre is linear in form and constrained by the heritage of the City and its
There are several large modern retail parks within and around the City of
Edinburgh and by far the largest is Fort Kinnaird, which is owned by a joint
venture between British Land's Hercules Unit Trust and The Crown Estate.
The shopping park comprises around 490,000 sq ft of retail floorspace and
east of the city centre, adjacent to the A1.
Spencer’s, Trespass, Monsoon, Next and

4.24 Princes Street is the 'front line' between Edinburgh's Old and New Towns
Despite its location, the retail sector has been under performing in recent
years. It was identified that there was simply not enough space for the
number of retailers who want to trade in the City Centre. Those wh
take units within the City Centre are often compromised
stores that are too small for their needs or are poorly configured for
modern retailing.
'front line' between Edinburgh's Old and New Towns.
n under performing in recent
simply not enough space for the
entre. Those which do
take units within the City Centre are often compromised trading from
are too small for their needs or are poorly configured for
4.25 In other cities, the solution to these problems would be large
demolitions and construction of shopping malls. However this is difficult in
a World Heritage Site. The String
greater architectural quality and better shopping provision by developing
the unique character of each block, rationalising the retail floor plates and
providing tenable occupation in the vacant upper stories.
4.26 Under the project, Princes Street has been divided into
representing a ‘pearl’, with a number of planned and live interconnected
developments stretching from Calton Hill to Haymarket.
Recent Developments4
4.27 121-123 Princes Street (West) are to be re
hotel and retail scheme by Deramore Properties
30,000 sq ft retail unit while Premier
incorporated into the upper floors. This
on Princes Street since the completion of the Mount
for completion in 2012 the new development
4.28 Global fashion retailer Primark is
Princes Street. The 6,500 sq m store
feature frontages on both Princes Street and Rose Street, encouraging the
circulation of shoppers between the two retail destinations.
4Source: Edinburgh Council Website
In other cities, the solution to these problems would be large-scale
demolitions and construction of shopping malls. However this is difficult in
String of Pearls project aims to generate
greater architectural quality and better shopping provision by developing
the unique character of each block, rationalising the retail floor plates and
providing tenable occupation in the vacant upper stories.
project, Princes Street has been divided into ten sections, each
representing a ‘pearl’, with a number of planned and live interconnected
developments stretching from Calton Hill to Haymarket.
are to be redeveloped into a £40 million
Deramore Properties. New Look has pre-let the
Premier Inn; 103-room hotel will be
incorporated into the upper floors. This heralds the first hotel development
Street since the completion of the Mount Royal in 1955. Due
completion in 2012 the new development will create around 200 jobs.
is redeveloping a retail unit at 91-93
Princes Street. The 6,500 sq m store - Primark's first in the capital - will
feature frontages on both Princes Street and Rose Street, encouraging the
circulation of shoppers between the two retail destinations.

4.29 The NHS and Creative Scotland have taken space at the Waverley Gate
office development at 2-4 Waterloo Place, joining Microsoft UK and
Amazon whilst Travelodge is to re-enforce its position as the largest
accommodation provider in Edinburgh with the opening of a 93 bedroom
hotel in an existing 'A' listed building.
4.30 Recently, within the development brief, the City of Edinburgh Council
announced plans to bring the former Royal High School building on Calton
Hill back into public use for the first time in almost 40 years. The iconic
building is to undergo a £35 million redevelopment into an "arts hotel"
which will have public gallery space. Following a European wide tendering
process, the Council awarded the project to Duddingston House
Properties, who will now submit designs.
Exeter
4.31 Exeter is another historic university city which form the administrative
centre for the county in which it lies (in this case Devon).
4.32 Exeter has a large retail core, which is formed in a broadly linear fashion
from the junction of South Street, North Street and Fore Street in the west,
to the intersection of Sidwell Street and York Road in the east. The
opening of Princesshay centre in 2007 (as detailed below), replaced a
1960’s development and extended the core retail area southwards,
improving one of the less attractive parts of the city centre.
4.33 Outside the prime pitch, side streets such as Gandy Street (an attractive,
cobbled, pedestrian street) provide smaller units which have become
occupied by upmarket fashion retailers, jewellers and bars.
4.34 Exeter also has a representation of being a ‘clone town’ with reputedly
only one independent retailer in the city.
City Centre Development – Princesshay
4.35 Princesshay, which contains more than 60 shops and cafés, 122 flats and
several new public art pieces; replaced a post-war development which had
been Britain’s first pedestrian shopping mall but had become dated and
unattractive for modern retailers.
4.36 The scheme replaced a post-war development which had been Britain’s
first pedestrian shopping mall but had become dated and unattractive for
modern retailers.
4.37 Land Securities (the developers of the scheme) were able to attract a
number of fashion retailers previously not represented in the City,
including Zara, Reiss, Crew and All Saints.

Summary
4.38 The analysis of the comparable centres demonstrates that the majority
gained significant investment into developments within their centres,
namely through the provision of covered shopping centres / arcade.
4.39 These developments provided the ability for the centres, many of which
face similar heritage constraints as York to provide modern (often large
scale) retail units which could accommodate new entrants to the centre. In
addition the developments increased the overall floorspace available
within the centres and although created churn within the centres showed
no visible negative effects or increased long term vacancy.
Table 6: Vacancy rates
2006 2007 2008 2009 2010 2011 2012
Bath 9.0% 7.1% 5.9% 8.4%
Cambridge 2.2% 15.8% 10.9% 3.8%
Chester 7.0% 6.9% 12.7% 10.2%
Edinburgh 8.9% 7.2% 6.8% 7.4% 7.6% 9.0%
Exeter 1.5% 6.6% 9.0% 8.7%
Leeds 12.4% 8.0% 8.5% 12.2% 10.7%
York 3.9% 5.8% 5.3% 4.7%
Source: PMA
4.40 However, these developments where proposed and built during a period of
economic prosperity with strong retailer requirements.
4.41 Edinburgh is a good example of where even with the potential for major
scheme within the City Centre (St James Quarter and St Andrew’s Square
– both of which are currently on hold) they have been proactive to promote
sustainable change of on of their prime retail streets, through plan lead
change which has been successful in securing high profile occupiers such
as Apple, New Look and Primark.
4.42 Chester has suffered similar problems to that which is currently facing
York and whilst the impact of the new flag ship Marks and Spencer’s to the
already strong out of town offer can not be fully understood until trading
patterns normalise, the approach of Chester has been to fully support the
redevelopment of Northgate area describing the scheme as a critical
redevelopment which will bring vibrancy back to the City.

Lesson Learnt
New development and new retail
footprints results in new entrants to
the market
Historic City Centre large scale
retail developments take time
Architectural betterment and
redevelopment can have a
significant positive impact upon the
centre. Schemes for which can be
achieved / implemented in shorter
timescales compared to large scale
redevelopment.
Others City Centre who are under
pressure from out of centre
developments are emphasising the
need for new development in the
City Centre to counteract the draw /
offer of out of centre developments.

5 Sector Trends
National Trends
5.1 Most economists believe, at least for now, that the worst is over for the UK
economy. All 37 independent forecasting groups that provide GDP
forecasts to the Treasury expect UK growth to recover only in 2013.
5.2 Consensus forecasts for UK GDP growth for 2013 have dropped from 1.8
per cent to 1.3 per cent in the past four months – a weak rate for an
economy accustomed to growing at 2.5 per cent a year.
5.3 Consumer spending has been turbulent since Q4 of 2007, but has
stabilised recently showing very weak growth in the last two quarters.
Figure 10: UK GDP Growth
Retail Expenditure
5.4 The Experian Retail Planner Briefing Note 10 of September 2012 provides
data on trends and forecasts in expenditure on retail goods.
5.5 The Note identifies that the economy has severely constrained household
spending in recent years. Inflation has run ahead of earnings growth which
has resulted in the decline of real household income; in 2011 it declined by
1.2%.
5.6 Expenditure on retail goods has remained more resilient that consumer
spending. ‘Big ticket’ items (such as expensive holidays and expenditure
on recreation and culture) have been the main casualties. However, other
sectors of the markets have been affected with consumers shopping more
carefully; opting for cheaper lines and buying less.

Figure 11: UK Consumer Spending growth year on year
5.7 The consumer sediment (shown right) was taken from the latest Deloitte
Consumer Review (released in January 2013) which illustrates consumer
attitudes towards spending.
5.8 Pressure on retailers from weak sales has resulted in a further rise over
the past year in the number of vacant shops. However, the increase from
a vacancy rate of 14% in July 2011 to 14.4% in July 2012 according to
Experian data was much less sharp than the surge from a vacancy rate of
7% to 12% in the year to mid-2009 when the deep recession took its toll.
5.9 Experian provide forecasts of future retail sales density (the amount of
sales derived from retail floorspace). On an increasing floorspace basis,
(allowing for additions to floorspace, which would naturally temper future
efficiency growth) the quoted comparison goods density growth rates are
1.8% for 2012, 1.5% for 2013, 1.7% per annum for 2014-18 and 1.7% per
annum for 2019-28. For convenience goods they are -1.7% for 2012, 0.4%
for 2013, 0.4% per annum for 2014-18 and 0.2% per annum for 2019-28.
5.10 Long-term sales growth forecasts from Experian for 2012-21 are at 2.8%
for comparison goods and 0.5% for convenience goods.

Figure 12: Category spending in the last three months (as of November
2012)

Figure 13: Sector Growth 2010 – 2015 (source: Verdict)
Multi-Channel Retailing
5.11 An increasing amount of sales are now being derived from non-store
means. Experian (2012) report that the Internet sales share of total retail
sales stood at near 9% in 2012 against 4.7% in June 2008 and just 2.9%
as recently as March 2007, its value being estimated at £29.6bn.
5.12 Experian forecasts for non-store comparison goods retailing market
shares as a whole range from 10.9% in 2012, to 21% in 2028, predicted to
peak in 2023.
5.13 Some stores, particularly the main food store operators, sell online but the
sales are sourced from actual stores, as opposed to warehouses; as such,
a rising trend for on-line sales will also impact upon the demand for retail
floorspace. This also affects the sale of non-food items from food stores,
for instance being able to order John Lewis items for collection from
Waitrose.
5.14 Research from Deloitte (2011) indicates that about a fifth of all internet
transactions involve some research in-store and that a multi-channel
strategy will also impact on the demand for retail space. House of Fraser
are an example of a retailer which has embraced the multi-channel
environment through a new store offer; two concept stores have been
opened, in Aberdeen and in Liverpool, which are circa 139 sqm in size and
where customers order for home delivery or alternatively order at home for
in-store collection.
5.15 Other online and catalogue retailers are investing in bricks and mortar
stores to provide a multi-channel offer, using the stores as showrooms for
products, a service location and a collection point for online orders.
5.16 Deloitte Digital undertook a survey to assess smartphone (excluding
tablets) usage among customers, the survey found that 46% of
smartphone owners have used it for store related shopping. The analysis
-19.6
-11.9
-5.8
-2.1
-1.6
2.8
3.7
9.8
16.3
16.8
16.9
Music & Video
Books, news & stationery
Furniture & floorcoverings
Other
DIY & gardening
Electricals
Homewares
Total retail
Health & beauty
Clothing & footwear
Food & grocery

found that smartphones influence 5.8% of all retail store sales, an
estimated value of £15.2 billion.
5.17 The research found that once smartphones have been used for shopping
they tend to increase their use – estimating typically 30-40% of consumers
store shopping trips. With the increasing functionality and developments
such as mobile payment and customer service portals the use of
smartphones in retail is set to increase further. Add to this increased
availability of wi-fi, the development of 4G technology, and ownership set
to rise to 95% by 2020 (ownership currently stands at 58%). The
smartphone is and will be an important and significant influence on store
sales.
5.18 The increasingly demanding consumer will require retailers to have
presences on all channels and media in order to allow them to engage and
create ownership with stores, brands and locations.
Figure 14: Sales growth by location (excludes online sales)
Aging Population
5.19 Experian (September 2012) anticipate that between 2012 and 2020, 79%
of town centres in Great Britain will experience 10% or more growth in
their over 50 population.
5.20 Town and City Centres need to ensure that this growing market is catered
for with regard to the retail provision and offer which will attract this
growing demographic group.
5.21 In addition Town and City Centres need to ensure that there are no
barriers to the aging population from accessing the City and its facilities.
Implications for York City Centre
5.22 The continued increase in out of town floorspace is a concern for all
centres but particularly York given it constrained nature and ability to
provide large footplate units for modern retailers. This combined with the
forcasts anticipated a slow road back to growth it is now vital to the health
of York maintain / increase its market share through improvements /
developments in the Centre.

5.23 It is clear that for retailers to survive they will have to increase their
competitiveness against the competition from online, adapting their
business models and store portfolios to incorporate multi-channel retailing
or to enhance their offer / service in the face of competition.
5.24 The constrained nature of the centre may mean that the retailers which
wish to make changes to units may be resisted due to heritage or design
concerns. A policy presumption in favour of changes required to retail
units to enhance trade offerings should be considered.
5.25 In addition and in line with the improvements proposed by the
Reinvigorate York scheme, further assessments of York’s accessibility for
all sections of society (with particular focus on the mobility impaired)
should be planned to ensure that any barriers to accessibility within the
centre are addressed.

6 Forecasting Growth
Introduction
6.1 This section idenitifeis the work which has been carried out to date in
respect of the forecast for growth of the City Centre and seeks to inform
the economic vision on potential scale and form of retail growth.
6.2 The analysis (which does not replace the need to keep updated district
wide retail analysis) provides, using national trends and identification of
impacts the likely sector growths and trends which York may experience
over the next 18 years. Although the analysis will need to be revisted at
regular intervals.
6.3 The Council have committed to updating the District Wide Retail Study, in
the time between the Prefferred Option being released (April 2013) and
the Submission consultation (expected to be at the end of 2013).
City Wide Growth
6.4 Previous district wide assessments have been undertaken and updated for
analysis of scenarios and developments, these have also been used to
inform floorspace requirements.
6.5 Floorspace requirements - The 2008 GVA Study found that based on
the current market shares, there would be theoretical capacity to support
an additional 9,245 sq m net of comparison goods floorspace by 2012,
increasing to 31,361 sq m net by 2017, 56,254 sq m net by 2022 and
95,742 sq m net by 2029. This was based on baseline scenario (of 15%
population growth).
6.6 The June 2009 update produced for City of York Counicl by GVA and
published in the Core Strategy Retail Topic Paper (released in 0ctober
2010) updated the quantitative model to look at the impact of the
recession and revised the growth rates to 3.8% (2005-08); 0.3% (2008-
11); 2.5% (2011-16) and 4.6% 2016 onwards (based on the ultra long term
trend 1967-2007).
6.7 The revised capacity figures for comparison goods were 5,491 sq m net of
comparison goods floorspace to 2012 (-3,754 from previous); increasing to
23,731 sq m net by 2017 (-7,624 from previous); 56,348 sq m net by 2022
(+94 from previous) and 106,664 sq m net to 2029 (+10,922 from
previous).

6.8 Since the above assessment was undertaken Impacts upon City Centre
retail growth include:
Monks Cross expansion (Oakgate / Stadium proposal, received
planning permission and is due for completion in 2014, the promotion
of increased floorspace in existing parks, including Monks Cross II
proposal and enhanced offer of extended facilities);
Expansion of Sub-regional centres:
Leeds – Trinity (opening March 2013, providing circa
74,880 sqm of new floorspace and uplift of 13,935 sqm); and
Hull – St Stephens (opened in September 2007, creating
160,000 sqm of new retail floorspace)
6.9 Potential impacts upon the retail growth of the City Centre include:
Further developments in the pipeline:
Expansion of the White Rose Centre which would create
circa 12,000 sqm of new retail floorspace and improve the offer
of the centre to include a cinema and other leisure uses);
Proposals at Thorpe Park in Leeds (determination
expected in early 2013, which could create 21,360 sqm of new
retail floorspace of which circa 10,000 sqm is a foodstore);
Eastgate Quarter in Leeds – received planning
permission, development timescale unknown;
Princes Quay Centre extension (57,000 sq m gross) and
North Point Shopping Centre (15,700 sq m gross) in Hull –
both with planning permission, development timescales
unknown; and
Harrogate Town Centre and transport interchange –
development brief has been adopted, development timescales
unknown.
6.10 There are also several opportunities for growth in City Centre retail,
these include:
Castle Piccadilly scheme;
Increased student population;
Increasing tourism spend within the City on retail (currently is
£32.95 – as defined by Visit York);
Increased employment in the City; and
Housing growth in the City region, creating higher population and
greater availability of spend.
6.11 Further discussion on the ways in which the City Centre can adapt and
strengthern the offer within the City Centre are contained within the vision

document and economic forecasting. Further detailed work is needed in
order to determine the likely impacts of these developments on the trade
within York.
Quantitative Assessment
Method
6.12 We have derived the floorspace of the City Centre by assigning the 18
GOAD centre categories to the relevant goods questions asked by the
Household Survey (HHS), assumptions regarding the split of the
floorspace within certain categories have been made. This allows an
amount of floorspace to be assigned to the expenditure identified by the
HHS.
6.13 The sector expenditure has been taken from the HHS which was
undertaken in September 2010, on behalf of HOW Planning LLP (the
planning and retail consultants on behalf of Oakgate). The HHS results
represent the most up to date data in respect of shopping patterns within
the Catchment, whilst this data was obtained and produced for the
purpose of assessing the impact of a particular Development and although
the raw data is not available. The survey was undertaken by an
independent survey company (NEMs) and based on the previous 2007
survey (undertaken by GVA Grimley) for the 2008 York Retail Study,
furthermore HOW agreed the methodology with the Council prior to
undertaking the survey.
6.14 The Expenditure derived from the catchment area of each sector (taking
account of inflows where applicable) has then been grown per annum by
the rates identified in the Verdict UK Retail Forecasts (produced in 2012)
for 2010 to 2015, this sector growth has been applied from 2011 to 2030.

Figure 15: Verdict Forecasts for each sector
6.15 The overall expenditure in the years 2017 and 2020 has been rebased to
reflect adjustments made for commitments (including the Monks Cross
development) which effect the City Centre market share changes.
so it has neutralised some of the negative growth within sectors.
17 and 2020 has been rebased to
reflect adjustments made for commitments (including the Monks Cross
market share changes. In doing
so it has neutralised some of the negative growth within sectors.
6.16 Sector benchmarks growth has also been grown by 2% for comparison
and 0.15% for convenience per annum, as identified by in Figure 4a and
4b of the Experian Retail Planner Brief. Comparison density growth is not
broken down into sectors.
Limitations of the Model
6.17 The following provides a summary of the limitation of the forecasting
model, the source data is stated in the notes of the tables and the
assumptions are listed:
The sector growth was identified for the period up to 2015, the
model assumes the same growth for the plan period;
GOAD Centre surveys are not available for all centres; and
The Market share adjustments to account for commitments and
recently completed develo
not been taken into account.
6.18 In addition to the limitations of the data used we would highlight the
following changes which we consider
outcome of the model:
Updated population data for
the 2011 census; and
Expenditure per capita based upon data generated in October 2010
growth has also been grown by 2% for comparison
and 0.15% for convenience per annum, as identified by in Figure 4a and
4b of the Experian Retail Planner Brief. Comparison density growth is not
ing provides a summary of the limitation of the forecasting
model, the source data is stated in the notes of the tables and the
sector growth was identified for the period up to 2015, the
model assumes the same growth for the plan period;
Centre surveys are not available for all centres; and
Market share adjustments to account for commitments and
development outside the catchment are have
not been taken into account.
In addition to the limitations of the data used we would highlight the
changes which we consider could significantly influence the
data for the catchment area, taking into account
based upon data generated in October 2010.

Results
6.19 The results represent the base figure for the resultant floorspace and
should be considered the lowest floorspace requirements for the City
Centre. The floorspace requirements have not been assessed against the
City Centre’s physical capacity, nor have they accounted for potential
floorspace changes (i.e. increase in A3 uses).
Sector Changes
6.20 The varying sector growths for comparison identified within the Verdict
report has been applied to the existing floorspace within the City Centre,
thus taking account of sectors potential to grow or decline. This creates a
percentage shift in sectors, demonstrated below:
Figure 16: Expenditure share per sector - 2012
34%
10%
1%
8%
16%
31%
Anticipated Expenditure share persector 2012
Clothing and Footwear
Furniture
DIY
Electricals
Recreational
Luxury / Jewellery

Figure 17: Expenditure share per sector – 2020
Summary
6.21 The current City Centre offer which comprises approximately a third of
clothing and footware will allow this offer to grow in line with the sector
forecasting.
6.22 The sectors which are due to decline or reduce in floorspace are those
which do not have a particular dominance within the Centre. These sector
forecastings are based on the national average and do not take account of
specific impacts (such as the influence on sectors caused by Monks Cross
and how retailers respond to the introduction of the offer).
Floorspace Requirement
6.23 With regard to the City Centres floorspace requirements the summary
table outline below (the full version can be found within Appendix 2) the
anticipated floorspace requirements for the City Centre, based on the
above methodology and limitiations.38%
8%
1%
8%
15%
30%
Anticipated Expenditure share persector in 2020
Clothing and Footwear
Furniture
DIY
Electricals
Recreational
Luxury / Jewellery
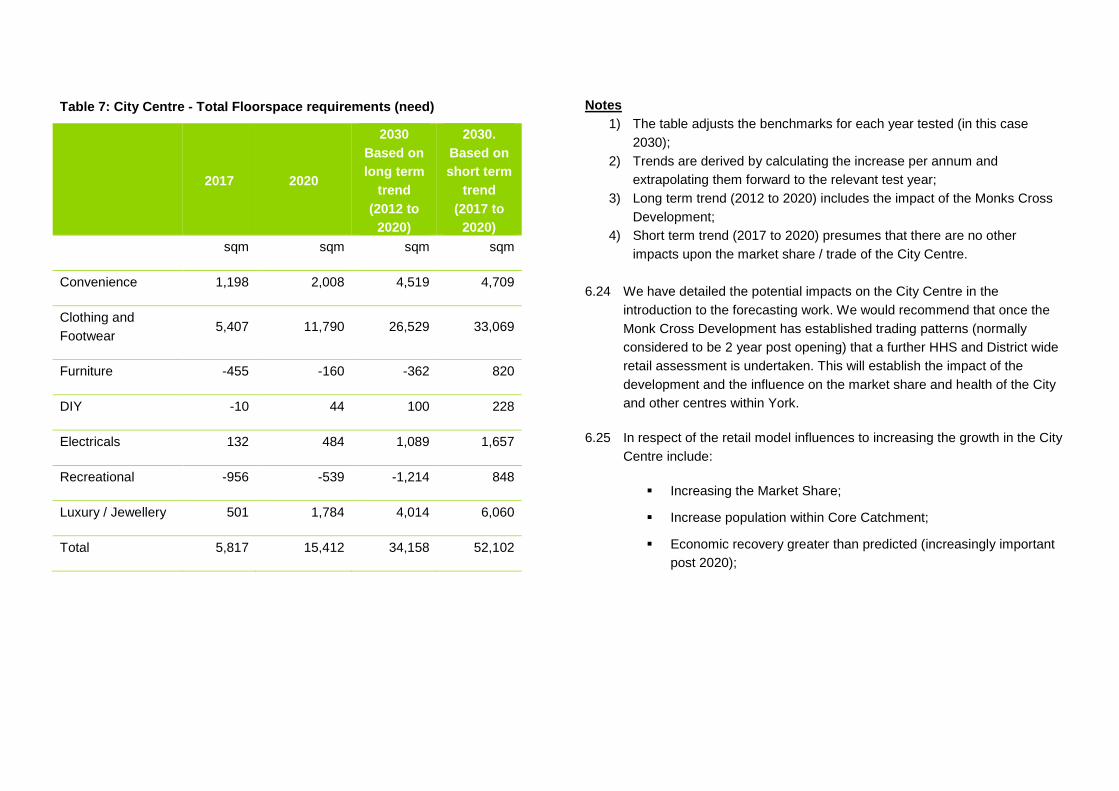
Table 7: City Centre - Total Floorspace requirements (need)
2017 2020
2030
Based on
long term
trend
(2012 to
2020)
2030.
Based on
short term
trend
(2017 to
2020)
sqm sqm sqm sqm
Convenience 1,198 2,008 4,519 4,709
Clothing and
Footwear5,407 11,790 26,529 33,069
Furniture -455 -160 -362 820
DIY -10 44 100 228
Electricals 132 484 1,089 1,657
Recreational -956 -539 -1,214 848
Luxury / Jewellery 501 1,784 4,014 6,060
Total 5,817 15,412 34,158 52,102
Notes
1) The table adjusts the benchmarks for each year tested (in this case
2030);
2) Trends are derived by calculating the increase per annum and
extrapolating them forward to the relevant test year;
3) Long term trend (2012 to 2020) includes the impact of the Monks Cross
Development;
4) Short term trend (2017 to 2020) presumes that there are no other
impacts upon the market share / trade of the City Centre.
6.24 We have detailed the potential impacts on the City Centre in the
introduction to the forecasting work. We would recommend that once the
Monk Cross Development has established trading patterns (normally
considered to be 2 year post opening) that a further HHS and District wide
retail assessment is undertaken. This will establish the impact of the
development and the influence on the market share and health of the City
and other centres within York.
6.25 In respect of the retail model influences to increasing the growth in the City
Centre include:
Increasing the Market Share;
Increase population within Core Catchment;
Economic recovery greater than predicted (increasingly important
post 2020);

Increased inflow from outside the Catchment Area (Model
assumes 10% inflow to the City Centre), for example this could be
derived from increased business activity in the Catchment co
increased number of visitor, increased visitor spend;
Demographic changes within the Catchment;
Restriction of out of centre floorspace growth and diversion of this
expenditure growth to the City centre; and
Depression of surrounding centres.
6.26 To demonstrate the impact of the small gains within the Catchment, the
below chart details the floorspace requirements should the Market share
of the City Centre be 1% more in 2020. Resulting in an increased
floorspace requirement of over 4,000 sqm.
outside the Catchment Area (Model
assumes 10% inflow to the City Centre), for example this could be
derived from increased business activity in the Catchment core,
increased visitor spend;
nt;
Restriction of out of centre floorspace growth and diversion of this
To demonstrate the impact of the small gains within the Catchment, the
e requirements should the Market share
of the City Centre be 1% more in 2020. Resulting in an increased to the
Figure 18: Indicative Market Share increase
Commentary
6.27 However based on the work undertaken by the 2008 GVA retail study
and knowledge of the trends and market shares which were identified by
the Oakgate submission and assessed by ourselves, we can assume the
following:
Indicative Market Share increase
However based on the work undertaken by the 2008 GVA retail study and
and knowledge of the trends and market shares which were identified by
the Oakgate submission and assessed by ourselves, we can assume the

The Monks Cross expansion will have a detrimental impact
upon the City Centre in the long term and will also have a ‘wow factor’
impact in the first 6 / 12 months of trading. It has been previously
anticipated that the market share of the City Centre would reduce to
19%, this will have a further effect on the anticipated additional
floorspace the City Centre could support (as demonstrated by the
quantitative exercise), without an increase in market share;
The enhanced offer in Leeds (created by Trinity) will increase
the catchment area of the City and infringe on York’s market share of
the wider catchment area especially in populations between Leeds and
York;
Further expansion of the out of town offerings of White Rose
and Meadowhall both of which are currently being promoted would
also impact upon the trade within York City Centre and also the current
out of centre destinations in York, particularly in respect of the Designer
Outlet;
The decision of where people spend within the wider catchment
will also be influenced by the increased offer at Wakefield and other
centres which are on the periphery of the York Catchment; and
Thorpe Park - Whilst the mix of retailers is not known for the
Thorpe Park proposal in detail this proposal could create a new sub-
regional out of centre destination on the eastern edge of Leeds, the site
which is highly accessible (adjacent to the M1) and may attract trade
from south western portion of the Catchment Area.
Sector Forecasting
6.28 The sector mix identified by the most recent GOAD, demonstrates that
York has a higher than national representation (both in terms of units and
floorspace) of clothing retailers (in all categories). This would indicate that
inline with the anticipated growth in clothing and footwear (over the period
2010 to 2015) that this sector should remain strong in York City Centre
and has the potential for expansion. However, the additional competition
from the recent approval of John Lewis, Marks and Spencer’s and Next at
Monks Cross will divert some of this trade growth to this development.
6.29 A growing number of high street clothing and footwear retailers have
established an online presence, and are likely to continue to benefit from
broadening their offers to rival both the depth and breadth of those in
store. The manner in which these retailers utilise and use their existing
floorspace and also adapt their new store models to accommodate the
growth of multi channel retailing and provide for facilities, such as click and
collect, may create conflict with their existing portfolio.
6.30 The health and beauty sector is also anticipated to grow over the coming
years and this may influence the make up of the department stores (of
which York has a higher than national average) within York. Department
Stores are now entering the market with smaller format stores, either by
utilising technology available to reduce the physical floorspace needed or

by providing separate elements of their stores, such as John Lewis and
Next ‘at home’ stores.
6.31 The food and grocery sector is also expected to grow through to 2015,
much of the food and grocery sector which is catered for in the City Centre
are occasional offers such as bakeries and others which cater for the
tourism / visitor trade. An indication of this is the percentage of floorspace
taken by grocers and frozen foods which accounts for 1.24% compared to
the national average of 12.54%.
6.32 This sector is expected to rise with the introduction of two Tesco stores
and a Sainsbury into the City Centre. This increased provision will bring
York in line with other centres which have increased their convenience
offering in recent years.
6.33 Contraction in the other sectors such as DIY, furniture, books and music
and videos will create pressure on existing retailers within the centre and it
may influence the mix within the department stores in York. The City
Centre has a lower than national representation within the City Centre of
DIY and furniture retailers (0.67% compared to the national average of
4.8%), which is indicative of the floor plates available and the constraints
of the City Centre.
6.34 The reduction in these sectors will have a greater impact upon the
operators located in the out of centre parks, such as Clifton Moor and
Monks Cross.

7 Role of the Centres
York City Centre
7.1 A comprehensive health check has been undertaken in section 1. The
focus for the City Centre should be to support and enhance its role as a
shopping destination, along with supporting the tourism and evening
economies. As identified, there are barriers to the provision of modern
retail units within the City Centre and focus should be on innovative ways
in which the City Centre can adapt to support both the existing retailers,
new entrants, and also the evolving retail model of existing and new
stores.
7.2 Utilising the existing assets, including the heritage of the City will be key in
order to provide the right environment to ensure that the Cities retailers
can continue to thrive in the face of competition from other Centres (such
as Leeds and Hull) and out of centre destinations (such as Monks Cross,
Clifton Moor, the Designer Outlet, White Rose, Junction 32 and others).
District Centres
Haxby
7.3 Haxby is situated to the north of the City and provides a range of shops
and services for the local community. It is under pressure from the
expansion and increased offer at Monks Cross and Clifton Moor (located
to the South) and will need to concentrate on retaining the market share
and enhancing the offer in line with the character of the centre. The lack of
a main foodstore offer within the town centre and the competition from
large foodstores in Monks Cross and Clifton Moor would indicate that the
location is likely to remain as a top-up shopping destination.
Acomb
7.4 Acomb is situated to the west of the City Centre and is the larger of the
two district centres, offering both a main food shopping destination (in the
form of Morrisons) and a good range of comparison shops. The main shop
units are situated around Front Street (part of which is pedestrainised).
7.5 In line with national policy these centres should be promoted to
accommodate additional retail facilities where it is physically possible to do
so. Expansion of existing out of centre facilities, above those already
committed should be resisted in support of these centres. Incentives to
drive existing custom and footfall, to these centres, should be encouraged.

8.1 The following table provides a summary of the planning interventions
available, to address either positively or restrictively the trends and
impacts identified within the existing national framework and local policy.
Table 8: Planning Policy Options
Positive Planning Policy Options Restrictive Planning Policy Options
Include a generalpresumption in favour ofsustainable development
Model local planpolicy asadvocated by thePlanningInspectorate
Define a network of Centres andtheir respective roles
NPPF para.23
Set criteria and identifystrategic sites for local andinward investment acrossthe City
NPPF para. 21
Define a town centre andprimary shopping area (basedon a clear definition of primaryand secondary frontages) andset policies that make clearwhich uses will be permitted insuch locations
NPPF para.23
Positive Planning Policy Options Restrictive Planning Policy Options
Identify and plan foreconomic development landacross the City, particularlyfor new or emerging sectors(including clusters ornetworks of knowledgedriven, creative or hightechnology industries)
NPPF paras. 21 &161
Include a policy on how toconsider proposals for maintown centre uses which cannotbe accommodated in oradjacent to centres
NPPF para.23
Identify priority areas foreconomic regeneration,infrastructure provision andenvironmentalenhancement
NPPF para. 21
Include a sequential test policyto be applied for main towncentre uses that are in anexisting centre and are not inaccordance with the Local Plan
NPPF para.23
Promote the City andDistrict Centres and supporttheir viability and vitality
NPPF para. 23
Include an impact test policy tobe applied for retail, leisure andoffice development outside oftown centres which are not inaccordance with the Local Plan,based on an appropriatefloorspace threshold (the defaultis 2,500 sqm)
NPPF para.23
Provide for customer choice
and a diverse retail offer
which reflects the
individuality of each Centre
NPPF para. 23
Include a policy to support a
pattern of development which
facilities the use of sustainable
modes of transport
NPPF para.
30
Retain and enhance the
City Centre Market and
promote new ones
NPPF para. 23
Set local parking standards that
take into account local
circumstances
NPPF para.
39
8 Planning Toolkit

Positive Planning Policy Options Restrictive Planning Policy Options
Allocate suitable sites in the
City and District Centres to
meet the scale and type of
retail, leisure, commercial,
office, tourism, cultural,
community and residential
development needed in
town centres (meeting
needs in full, not
compromised by site
availability)
NPPF paras. 23 &
161
Have robust and comprehensive
policies that set out the quality
of development that will be
expected including the
promotion of local
distinctiveness
NPPF
paras. 58-
66
Allocate appropriate well
connected edge of City and
District Centre sites for main
town centres where suitable
and viable town centre sites
are not available (or if
insufficient sites, set policies
for meeting identified needs
in other accessible
locations, well connected to
centres)
NPPF para. 23
Include a policy to guard against
the unnecessary loss of valued
facilities and services
NPPF para.
70
Promote residential
development on sites within
the Centres
NPPF para. 23
Positive Planning Policy Options Restrictive Planning Policy Options
Promote the retention and
development of local
services and community
facilities in identified local
centres (encouraging
appropriate new small scale
retail facilities)
NPPF para. 28
Improve the quality of
parking in the Centres with
charges that do not
undermine their vitality
NPPF para. 40
Promote mixed use
developments, strong
neighbourhood centres and
active street frontages
generally
NPPF para. 69
Promote safe and
accessible environments
and developments generally
NPPF paras. 69-
70
Plan for the provision and
use of shared space and
community facilities
NPPF para. 70
Ensure that established
shops, facilities and
services are able to develop
and modernise in a way that
is sustainable and retained
for the benefit of the
community
NPPF para. 70

Positive Planning Policy Options Restrictive Planning Policy Options
Ensure an integrated
approach to considering the
location of housing,
economic uses and
community facilities and
services
NPPF para. 70
Use of Neighbourhood
Plans
Use of Supplementary
Planning Documents
Compulsory Purchase
Powers
Repairs Notices
Note:
Main town centre uses include retail development, leisure, entertainmentfacilities, the more intensive sport and recreation uses, offices, and arts, cultureand tourism development. The needs for these uses should be objectivelyassessed and planned for in full. This may require allocations of land within in,edge and out of centre locations. Out of centre developments, including officedevelopments should not then be required to satisfy the sequential and impacttests if allocated within an up-to-date Plan. A general policy can then be used tocontrol the development of non-allocated sites outside of centres.

9.1 The majority of the summary and outcomes of this document are reported
within the Vision document for which this document provides an evidence
base.
9.2 It is clear that the general economic conditions will dictate future consumer
spending patters, retailers will continue to find trading condition difficult
with those competing with growing e-retailing markets continuing to suffer
most. The recent administrations of HMV and Blockbusters demonstrate
this.
9.3 The future health of the City Centre will depend on the ability to protect
and enhance the market share and make the most from opportunities
which arise. Maximising the potential for growth in the City as a whole will
continue to support the growth and success of the City Centre.
9.4 Whilst public policy and strategy cannot direct consumer spending it can
influence and maximise the potential to retain and attract consumers, by
removing barriers and creating the right environment.
9.5 Policy and Strategies in York should focus on emphasising the already
strong competitive advantages and playing to the strengths of York as a
City, but also as a retail destination.
9.6 Given the historic constraints of York, the delivery of strategies are most
likely to be in small steps and through support to existing retailers and
those wishing to invest.
9.7 The following tables outline some of the key thoughts in these areas.
9 Summary


A Growing City = more spend
Response Housing Growth Implications on housing policies –new housing, intrinsically connected into the ‘Centre’City centre living
Issues Market Share Capture Ability of the City Centre to attract growth – combination of ‘pull’ (positive planning) and‘push’ (restrictive planning) policies
Impact Consumer Spending Growth A ‘growing’ York = bigger market place
Factor Population In-migration and retaining graduate talent as future drivers of change.An ageing population with different needs
A Customer-centric City = repeat visits
Response Skills Academy Centres of Excellence in retailing and catering
Issues Collaboration Multi-agency response to enhancing skills, working collaboratively.City Charters.
Impact Attracting More Visits and More Spend Putting the customer first. A programme of continuous improvement
Factor Service Service excellence as a competitive strength

An Attractive City = stay longer
Response Quality Indicators Using standards without stifling creativity. Showcasing best practice.
Issues Delivery Working with the private sector to deliver public benefit changeInnovative approaches to urban improvement projectsCreative use of public sector land and assets
Impact Improved city centre ambience A ‘world-class public realm’ York
Factor Environment Attention to detail in public spaces – pavements, spaces, cleansing, art
A Distinctive City = stronger draw
Response Experience World-class programme of events and festivals Pop-up shops Independent operatorsupport Role of Markets City Centre AppsNurturing innovation
Issues Fusing the online / on-street offer The City Centre as the ‘stage’ Maximising the benefits of ‘offline’ retail
Change A different role for the high street Commodities available cheaper and quicker on-line. A need to differentiate the highstreet offer but embrace multi-channel retailing and the technology

Factor Technology Rapid access to pricing and availability
A Connected City = easier to get to
Response Infrastructure Bus infrastructure investment Cycle routes and parking Footpath investment Routes toand from the station ‘Smart’ car parking strategies
Issues Funding Improved train, bus, coach, cycle and foot offer. The role of the Community InfrastructureLevy
Change Sustainable travel patterns York as the ‘connected city’
Factor Accessibility The competitive advantage of out of town / the long-term trend of rising travel costs
A Diverse City = resilience
Response Infrastructure Business support
Issues Ensuring choice Protecting retail assets in core streets. Ensuring competitiveness in key sectors (egclothing. Footwear). Use of planning policies.
Change Accommodating Change The City Centre as a place to get what you want / get what you need

Factor Multi-dimensional Delivering to a wide audience

Appendix 1–Retail Indicators
Aberdeen Aldershot Bath Brighton Cambridge Chester Durham Edinburgh Exeter Guildford Leeds Norwich York
Retail PROMIS 200
centres average
Primary Catchment Population 2011 (000s)487 110 447 476 537 792 121 903 503 475 1,481 882 476 345
Primary Catchment Population 2011 (Rank out of 200, 1=Best) 37 n/a 48 41 31 15 174 11 34 42 3 12 40
Projected Population Growth 2011-16 (% pa)0.6 0.5 0.7 0.5 1.0 0.3 0.6 0.7 0.7 0.6 1.0 1.0 0.9 0.6
Projected Population Growth 2011-16 (Rank out of 200, 1=Best) 122 n/a 95 130 26 181 126 94 76 117 16 18 34
Social Structure AB 2001 (%)24 30 28 28 33 26 25 27 23 38 23 22 26 25
Social Structure C1 2001 (%)28 31 31 35 30 28 28 31 32 32 29 29 29 29
Social Structure C2 2001 (%)20 20 19 16 17 19 18 15 21 14 18 23 21 19
Social Structure DE 2001 (%)27 19 22 21 20 27 30 28 25 16 29 27 23 27
Average House Prices Q4 2011 (£)186,800 311,000 277,700 268,900 329,900 182,700 122,700 226,000 198,500 390,100 164,400 161,000 200,300 196,700
Unemployment Rate September 2012 (Claimants as % population aged 16-64) 2.1 1.4 2.0 3.4 1.8 2.6 3.0 3.2 2.4 1.7 4.5 4.3 2.2 3.8
CB Richard Ellis Shopping Population (000s)331 32 207 307 324 333 69 464 327 244 665 510 297 182
CB Richard Ellis Shopping Population (Rank out of 200, 1=Best) 25 n/a 57 30 27 24 165 12 26 45 4 9 32
Total in-store comparison retail expenditure 2011 (£m)1,265 275 1,128 1,149 1,387 1,821 282 2,357 1,203 1,234 3,582 2,106 1,205 821
Total in-store comparison retail expenditure 2011 (Rank out of 200, 1=Best) 29 n/a 43 41 24 15 176 9 36 32 2 12 35
Per capita in-store comparison retail expenditure £2011 2,597 2,489 2,523 2,416 2,582 2,300 2,332 2,611 2,392 2,600 2,419 2,387 2,533 2,392
Per capita RW retail expenditure £2011506 504 508 484 538 442 470 502 485 527 491 504 518 476
Forecast growth in comparison retail expenditure 2011-16 (%pa real) 1.1 1.3 1.3 0.9 1.6 0.7 1.0 1.1 1.2 1.3 1.3 1.3 1.4 1.0
Forecast growth in comparison retail expenditure 2011-16 (%pa real) (Rank out of 200, 1=Best) 81 n/a 41 134 10 156 112 92 68 45 47 52 27
Town Centre Floorspace (000s sq ft)2,214 661 1,433 1,583 1,494 1,466 526 2,092 1,389 1,028 2,208 2,223 1,495 1,110
Town Centre Floorspace (Rank out of 200, 1=Best)10 n/a 39 25 33 37 195 15 43 92 11 8 32
Town Centre Floorspace Under Construction (000s sq ft) 0 61 0 0 0 0 0 0 0 0 82 0 0 4
Town Centre Floorspace with Planning Permission (000s sq ft) 0 0 0 0 0 0 0 353 0 202 900 0 0 58
Number of TC Multiples165 43 172 207 202 162 74 216 137 169 208 190 155 97
PMA Retail Provision Score335 63 405 440 430 345 118 508 282 362 433 367 318 177
PMA Retail Provision Score (Rank out of 200, 1=Best)20 n/a 12 7 9 18 132 4 28 16 8 14 25
PMA Fashion Score226 35 299 310 293 234 61 354 171 243 290 224 210 97
PMA Anchor Stores Score40 0 30 28 42 30 10 74 34 32 46 58 34 23
PMA Retail Provision Score 2005288 94 295 418 310 394 121 472 235 378 450 357 286 181
PMA Retail Provision Score 2007280 91 291 428 294 389 123 483 231 378 468 400 302 184
PMA Retail Provision Score 2010360 62 425 433 427 339 120 482 297 348 462 371 310 181
Change in PMA Retail Provision Score (2005 - 2010)72 -32 130 15 117 -55 -1 10 62 -30 12 14 24
Town Centre Vacant Units(%) 10.1 n/a 8.4 7.4 3.8 10.2 n/a 9.0 8.7 8.0 10.7 7.6 4.7
Town Centre Prime Vacant Units (%)0.0 n/a 11.8 3.7 0.0 3.7 n/a 3.0 4.7 0.0 0.0 0.0 1.8
Town Centre Retailer Requirements October 201218 n/a 36 47 42 29 14 38 33 50 49 17 47 13
Town Centre Retailer Requirements October 2012 (Rank out of 200, 1=Best) 45 n/a 15 4 6 24 57 11 19 2 3 47 4
Prime Town Centre Rents mid 2012 (£psf Zone A)140 n/a 200 215 250 205 100 200 175 330 210 180 180 111
Prime Town Centre Yields Spring 2012 (%)6.75 n/a 5.50 5.25 4.75 5.25 5.75 5.25 5.75 4.75 5.50 5.50 5.00 6.96
Total RW Floorspace (000s sqft)1,291 114 841 933 731 2,613 464 3,035 1,097 912 3,892 2,511 1,504 917
Total RW Floorspace (Rank out of 200, 1=Best)40 n/a 75 63 89 11 141 8 52 66 5 12 29
Retail Warehouse Floorspace Space Under Construction (000s sq ft) 0 0 0 0 0 125 0 14 0 0 0 0 10 5
Retail Warehouse Floorspace Space with Planning Permission (000s sq ft) 269 0 111 26 128 249 258 405 113 68 177 198 36 113
Total Foodstore Floorspace (000s sqft)1,798 236 1,251 1,221 1,447 2,470 302 3,153 1,271 1,085 3,349 2,643 1,279 960
Total Foodstore Floorspace (Rank out of 200, 1=Best)20 n/a 47 50 33 12 180 8 45 59 7 11 42
Total Leisure Floorspace (000s sqft)147 0 90 250 153 250 148 734 25 5 1,125 202 95 149
Total Leisure Park Floorspace (000s sqft)125 0 90 248 140 170 130 626 0 0 1,035 190 75 119
Number of Cinemas4 0 4 5 6 4 1 11 9 2 9 10 4 3
Top Achieved Retail Park Rent (£psf)30.00 n/a 24.50 37.50 35.00 47.00 n/a 55.00 35.00 50.00 55.00 35.00 48.50
RW Retailer Demand by Total Floorspace (Index 200 reported centres=100) 122 n/a 214 192 119 71 170 59 120 253 190 22 141 100
PMA Classified Parks Vacancy Rate (% of units)14.3 n/a 9.5 0.0 8.8 3.9 n/a 7.5 8.1 0.0 8.5 7.6 2.9
PMA Competition Indicator (Rank out of 200, 1=Best) 17 n/a 51 22 12 90 140 52 10 67 92 19 74
Venuescore 2011378 86 324 446 268 274 143 504 289 282 500 440 304
Venuescore 2011 Rank14 309 22 8 36 33 158 5 27 31 6 9 23
Tourist Orientation (Avg = 100) 148 26 215 176 225 204 183 185 173 226 175 158 229Notes
Retail Information
Demographic Information
Venuescore
3. Tourist Orientation Index = Indexed measure of the degree to which the venue's offer is biased towards retailers with a Tourist focus (High=Bias towards Tourist-focused retailers; Low=Bias away from Tourist-focused retailers)
1. Colours are indicative and provided as a visual aid only, comparisons should be made between the actual figures2. VENUESCORE = Weighted count of multiple retailer presence by venue

Appendix 2- Forecast Table

Job title:Retail Planning Consultancy, City Centre Forecast - City of York Council
Client: City of York Council
DJD ref file: C-0217813
Date: Jan-13
This spreadsheet has been prepared for the City of York Council
The format and content are the copyright of Deloitte.
The spreadsheet is intended for the sole use of the City of York Council. Any redirection to others should only be made with our prior knowledge and consent.
No responsibility can be taken by Deloitte as a result of any action taken by the recipient or any third party on the basis of the draft spreadsheet whether in the form submitted or as altered, intentionally or otherwise.
Neither this draft spreadsheet, nor any versions of it, should be reproduced in any document, circular or statement, whether or not published, without our prior written consent.
Deloitte LLP is the UK member firm of DTT.

Table 1 - Sector Forecasts for York City Centre
Growth per annum - 2010 to
2015
Expenditure - 2012
Floorspace - 2012
Benchmark - 2012
Anticipated Expenditure based
on sector forecasts - 2017
As percentage of total in 2017
2017 Expenditure Rebased
(accounting for Growth and
commitments including Monks
Cross)
Revised 2017 benchmarks
Floorspace Increase (need)
based on revised 2017 benchmarks
Anticipated Expenditure
based on sector forecasts - 2020
As percentage of expenditure
total in 2020
2020 Expenditure Rebased
(accounting for Growth)
Revised 2020 benchmarks
FS Increase (need) from 2012 based on revised 2020
benchmarks
Per annum Floorspace
(need) period 2012 to 2020
Floorspace Increase (need) to
2030 based on long term trend 2012 to
2020
Per annum Floorspace
(need) period - 2017 to 2020
FS increase (need) to 2030 based on short term trend -
2017 to 2020
Floorspace Total in 2030
(based on short term trend)
£m £ per sqm £m % £m £ per sqm sqm £m % £m £ per sqm sqm sqm per year sqm sqm per yearConvenience 3.20% 39.17 7404.00 5,291.02 45.86 5,330.82 1,198.21 50.40 5,354.85 2,008.31 251.04 4,518.70 270.03 4,708.65 12,112.65
Clothing and Footwear 3.20% 163.31 30,908.50 5,283.60 191.16 38.56% 211.85 5,833.53 5,407.09 232.84 40.73% 264.33 6,190.58 11,790.73 1,473.84 26,529.14 2,127.88 33,069.53 63,978.03Furniture -1.10% 45.16 9,056.10 4,987.17 42.73 8.62% 47.36 5,506.24 -455.29 45.78 8.01% 51.98 5,843.27 -160.96 -20.12 -362.17 98.11 820.12 9,876.22
DIY -0.30% 6.95 938.00 7,404.87 6.84 1.38% 7.58 8,175.57 -10.54 7.51 1.31% 8.53 8,675.98 44.67 5.58 100.51 18.40 228.70 1,166.70Electricals 0.60% 37.42 3,874.00 9,660.09 38.56 7.78% 42.73 10,665.52 132.51 43.45 7.60% 49.33 11,318.34 484.43 60.55 1,089.96 117.31 1,657.49 5,531.49
Recreational -2.40% 74.00 8,608.45 8,596.49 65.54 13.22% 72.63 9,491.22 -956.17 71.59 12.52% 81.27 10,072.16 -539.64 -67.45 -1,214.18 138.85 848.82 9,457.27Luxury / Jewellery 0.65% 146.11 13,634.20 10,716.45 150.92 30.44% 167.25 11,831.83 501.43 170.53 29.83% 193.60 12,556.03 1,784.38 223.05 4,014.86 427.65 6,060.88 19,695.08
Total Comparison 472.95 67,019.25 495.76 549.40 4,619.03 571.71 649.03 13,403.61 30,158.12 47,394.18 121,817.43Total 512.13 74,423.25 541.62 5,817.25 622.11 15,411.92 34,676.83 52,102.83 133,930.08
Notes
1) 2012 Expenditure derived from 2011 Expenditure captured by York City Centre (as identified by HOW HHS 2010)2) Sector Growth taken from Verdict 2010 to 2015 forcasts, which takes account of inflation / deflation and volume growth and has been extended to 20303) Sector Growth Assumptions a) Recreational a combination of Total Retail and Music and Video b) Luxury / Jewellery a combination of Total Retail, Health and Beauty, Homewares and Books, News and Stationary 4) Tables assumes a constant Market Share (19.11%) post 20175) Commitments identified in 2011 taken into account, these include:
Debenhams - MCSPNext at Home - Clifton MoorWaitrose, Foss IslandLidl, Former Edmund Wilson Pool Go Outdoors, YorkTesco, Portholme Road - On Site Replacement Lidl, Welham Road, MaltonLidl Coal Depot Sorthgate PickeringTesco Portholme Road ExtensionAldi, Robertson Close, Pocklington
6) Growth in E retailing per sector not factored in7) Floorspace derived from GOAD survey undertaken in 03.07.12, DJD assumptions used in order to allocate floorspace to sectors8) Rebased expenditure figures (2017 and 2020 figures) for City Centre comparison goods are based on catchment area expenditure (as identified by HOW HHS 2012), anticipated market share (and inflow of 10%)9) New census data should be used in order to determine up to date catchment area popultation and expenditure10) Revised Floorspace Benchmarks obtained applying 2% density growth for comparison and 0.15% for convenience (per annum)11) This table has been provided to inform the development of the Local Plan and further evidence base reports will be required 12) Two scenario's for growth from 2020 onwards have been presented, a long term trend 2012 to 2020 (accounting for the impact of Monks Cross) and a short term trend 2017 to 2020. Retail forecasts should be reviewed regularly.
Fig 1: Original Verdict Forecast Table

Deloitte refers to one or more of Deloitte Touche Tohmatsu Limited (“DTTL”), a UK private company limited byguarantee, and its network of member firms, each of which is a legally separate and independent entity.Please see www.deloitte.co.uk/about for a detailed description of the legal structure of DTTL and its memberfirms.Deloitte LLP is the United Kingdom member firm of DTTL.This Report has been prepared in accordance with the terms of our contract with City of York Council (“theClient”) dated 18 December 2012 (“the Contract”), and is subject to the restrictions on use specified in theContract. No party other than the Client is entitled to rely on this Report for any purpose whatsoever and weaccept no responsibility or liability to any party other than the Client in respect of the contents of this Report.All copyright and other proprietary rights in the Report remain the property of Deloitte and any rights notexpressly granted in these terms or in the Contract are reserved. This Report and its contents do notconstitute financial or other professional advice. Specific advice should be sought about your specificcircumstances. To the fullest extent possible, both Deloitte and the Client disclaim any liability arising out ofthe use (or non-use) of the Report and its contents, including any action or decision taken as a result of suchuse (or non-use).
Deloitte LLP is a limited liability partnership registered in England and Wales with registered number
OC303675 and its registered office at 2 New Street Square, London EC4A 3BZ, United Kingdom. Tel: +44 (0) 20
7936 3000 Fax: +44 (0) 20 7583 1198


![[]Oracle® Retail Demand Forecasting Cloud Service ... · 1[]Oracle® Retail Demand Forecasting Cloud Service Administration Guide Release 16.0 E73319-04 June 2017](https://static.fdocuments.net/doc/165x107/6003a3b88a99563daf4e9bdd/oracle-retail-demand-forecasting-cloud-service-1oracle-retail-demand.jpg)