IP Routing. Overview Static routing Default routing Dynamic routing.
Upload
kevin-callenCategory
view
329download
1
SOLID WASTE COLLECTION
ROUTING OPTIMIZATION:
THE CITY OF VIRGINIA BEACH
STORY
Robert B. Gardner, PE,
BCEE
Senior Vice President
SCS Engineers
Norfolk, Virginia
John C. Barnes, PE
Waste Management
Administrator
Virginia Beach, Virginia
Kevin Callen
Principal
Route Optimization
Consultants
Manassas, Virginia

Overview
• Background
• Demographics and Approach
• Routing Evaluations and Results

Background• Why was route optimization needed?
– Early completion times due to:
• Reduction in tonnage
• Increased collection capacity due to switch
from single axle to tandem
– Workload imbalance
– Stewards of the citizens money
– Potential for privatization

Background
• Prior to 2008 - Route boundaries
understood by operators; but not
drawn
• 2008 - Manually balanced routes
• 2012 –Route Optimization and Right
Size Study initiated

Background
• Routing Options
– Don’t Route or balance
– Manual balance routes
– Route Optimization
• Perform In house
– Limited staff availability and computer expertise
• Contract
– Expertise with collections, software, data analysis,
safety, equipment, and industry practices
– Improved confidence in results

Demographics and Approach
• Demographics
• Collection Service

Rural areas
Beach areas
Urban areas


Demographics and Approach
• Demographics
• Collection Service
• Pre-study statistics
– Equipment mix
– Coordinator boundaries


Tandem Axel– Red
Single Axel - Green
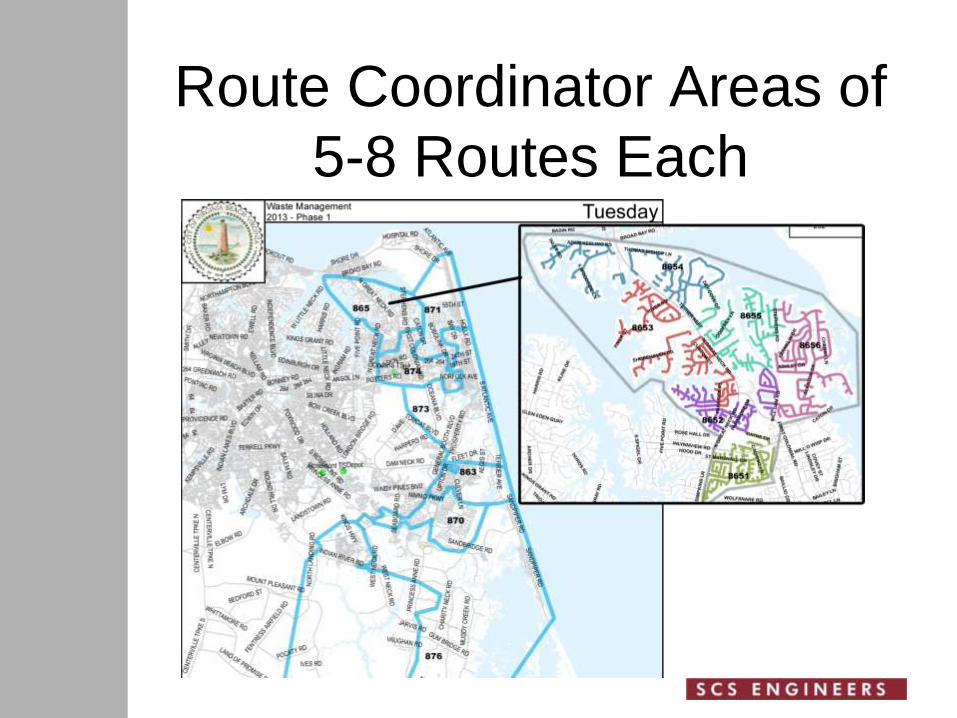
Route Coordinator Areas of
5-8 Routes Each
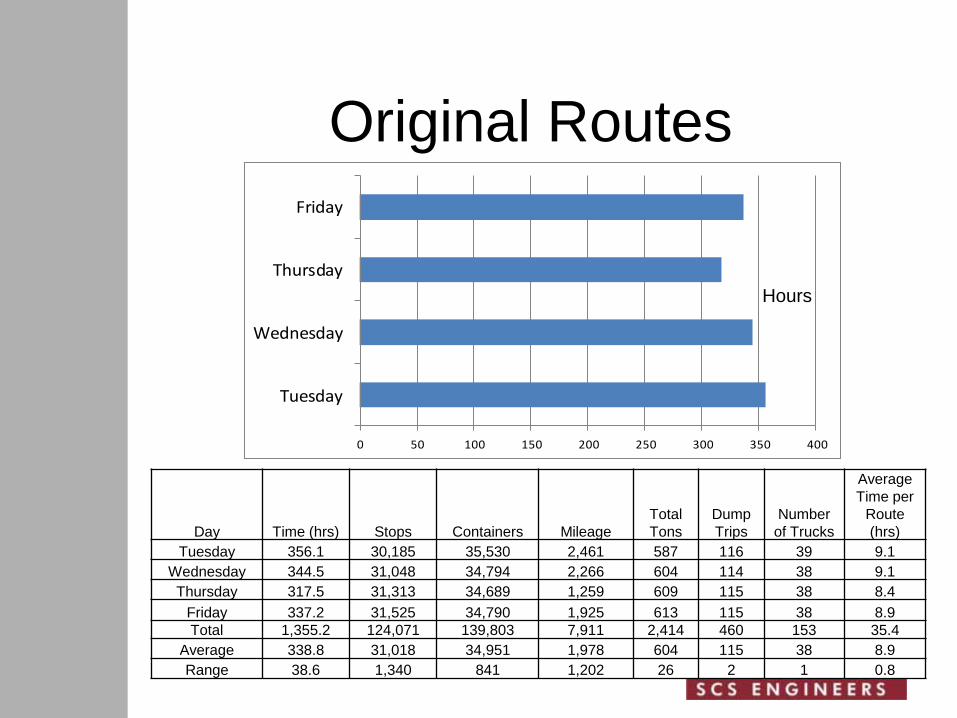
Original Routes
Day Time (hrs) Stops Containers Mileage
Total
Tons
Dump
Trips
Number
of Trucks
Average
Time per
Route
(hrs)
Tuesday 356.1 30,185 35,530 2,461 587 116 39 9.1
Wednesday 344.5 31,048 34,794 2,266 604 114 38 9.1
Thursday 317.5 31,313 34,689 1,259 609 115 38 8.4
Friday 337.2 31,525 34,790 1,925 613 115 38 8.9
Total 1,355.2 124,071 139,803 7,911 2,414 460 153 35.4
Average 338.8 31,018 34,951 1,978 604 115 38 8.9
Range 38.6 1,340 841 1,202 26 2 1 0.8
0 50 100 150 200 250 300 350 400
Tuesday
Wednesday
Thursday
Friday
Hours

Three Phase Implementation
Plan• Phase I – 2013 - Complete
• 22 tandem trucks and 13 single axle trucks
• 35 routes per day
• 27 total tandem trucks in fleet
• Phase II – 2014 – Complete • 27 tandem trucks and 5 single axle trucks
• 32 routes
• 32 total tandem trucks in fleet
• Phase III – 2015 – Under Design• Estimated 30 routes per day (Tuesday with 5
single axles; Friday with none)
• 37 total tandem trucks in fleet

Data Set-up Between Phases 1,
II, & III
• Generating Baseline Statistics for
Comparison
– Phase I
– Phases II & III

Phase I
• Route for mix of Tandem and Single
Axle
• Model calibrated to match existing
production rates
• Conducted area routing and path
routing

Phase I Results
• Reduced weekly routes from 153 to
143
• 11% reduction in route hours
• 12% reduction in mileage
• 17% reduction in dump trips
• Path routing done, but not used
• Operational adjustments were
“bumpy”

Phase II
• Route for additional Tandems
• Did not do complete re-route
• Improved accuracy of address data
• Improved weight ticket data
• GPS installed and available

Phase II Results
• Reduced routes from 143 to 128
• Additional 9% reduction in the number
of routes
• Additional10% reduction in labor hours
• Improved mapping
• Operators easily adapted

3rd and Final Phase
(Under Design)
• Review Day boundaries for
workload imbalance and future
development
• All required tandems available
• Complete re-route
• Safety and limited access streets
inventoried

Comparison of Route
Optimization Software
• Common Features– Did not create highly usable travel paths
– Provided unique modeling of the waste routes
• FleetRoute– No historical route productivity data needed
– Better handling of mixed density areas with rural and
suburban neighborhoods
• WMDesign– Processed route solutions significantly faster
– More accurate setup using actual productivity rates

Safety Improvements
• Identified limited access streets
• Established routes for dedicated back-
down truck with spotter
• Identified streets with service time
constraints
• Some single axles required to service
limited access and backing streets

Additional Tasks
• Routing for bulk item collections (point
to point)
• Yard debris routes; vary by
subdivision, tree cover, grass, season,
etc

Lessons Learned
• Safety Improvements
• Change is hard; expect resistance
• Anticipate ripple effects as much as
possible
• Need good maps
• Path routing not useful

Overall Results
• Reduced routes from 38 to 30
• Cost savings :
– $2,000,000 reduction in equipment
inventory
– $784,000 annual savings in personnel,
equipment maintenance and fuel
• Completion time
• City leadership and Collection Fee
Customers