City of Virginia Beach Compressed Natural Gas Vehicle ... · Compressed Natural Gas Vehicle...
69
Final Report City of Virginia Beach Compressed Natural Gas Vehicle Conversion Feasibility Study Presented to: City of Virginia Beach Municipal Center, Building 1 2401 Courthouse Drive Virginia Beach, Virginia 23456 Presented by: SCS ENGINEERS 6330 North Center Drive, Building 13, Suite 100 Norfolk, VA 23502 (757) 466-3361 & GeoEnvironmental Resources Inc. 2712 Southern Boulevard, Suite 101 Virginia Beach, VA 23452 (757) 463-3200 August 15, 2011 File No. 02211006.00 Offices Nationwide www.scsengineers.com
-
Upload
truongkiet -
Category
Documents
-
view
217 -
download
0
Transcript of City of Virginia Beach Compressed Natural Gas Vehicle ... · Compressed Natural Gas Vehicle...
F ina l Repor t
Ci ty of Vi rg in ia Beach Compressed Natura l Gas Vehic le
Convers ion Feas ib i l i ty S tudy
Presented to:
C i t y o f V i r g i n i a Be ac h
Municipal Center, Building 1
2401 Courthouse Drive Virginia Beach, Virginia 23456
Presented by:
S C S E N G I N E E R S
6330 North Center Drive, Building 13, Suite 100 Norfolk, VA 23502 (757) 466-3361
& G e o E n v i r o n m e n t a l R e s o u r c e s I n c .
2712 Southern Boulevard, Suite 101 Virginia Beach, VA 23452
(757) 463-3200
August 15, 2011 File No. 02211006.00
Offices Nationwide
www.scsengineers.com
F i n a l R e p o r t
C i t y o f V i r g i n i a B e a c h C o m p r e s s e d N a t u r a l G a s V e h i c l e C o n v e r s i o n F e a s i b i l i t y S t u d y
Presented to:
C i t y o f V i r g i n i a B e a c h Municipal Center, Building 1
2401 Courthouse Drive Virginia Beach, Virginia 23456
Presented by:
S C S E N G I N E E R S 6330 North Center Drive, Building 13, Suite 100
Norfolk, VA 23502 (757) 466-3361
& G e o E n v i r o n m e n t a l R e s o u r c e s I n c .
2712 Southern Boulevard, Suite 101 Virginia Beach, VA 23452
(757) 463-3200
August 15, 2011 File No. 02211006.00
C N G F e a s i b i l i t y S t u d y , F i n a l v 1 . 0 i 8 / 1 5 / 2 0 1 1
T a b l e o f C o n t e n t s
Section Page
Executive Summary ...................................................................................................................................... ES-1
1.0 Introduction .............................................................................................................................................. 1
1.1 Purpose and Scope of Study ..................................................................................................... 1
1.2 Historical Use of CNG by City Department of Public works ............................................... 1
2.0 Technology Review ................................................................................................................................ 3
2.1 Alternative Fuel Vehicles Types and Information ................................................................... 3 2.1.1 Compressed Natural Gas (CNG) ................................................................................. 3
2.1.1.1 Status of Deployment in US ....................................................................... 3 2.1.1.2 Types of Vehicles Typically in This Category ......................................... 4 2.1.1.3 CNG Fuel Dispensing Requirements/Types ............................................ 4 2.1.1.4 CNG Fuel Station Costs .............................................................................. 7 2.1.1.5 CNG Vehicles Cost ...................................................................................... 8 2.1.1.6 CNG Vehicle Maintenance ......................................................................... 9 2.1.1.7 Maintenance Facility Requirements .......................................................... 9 2.1.1.8 Resale Value of Vehicles .......................................................................... 10 2.1.1.9 Incentive Programs..................................................................................... 10 2.1.1.10 Advantages and Disadvantages of CNG ............................................. 11
2.1.2 Electric/Hybrids ............................................................................................................ 13 2.1.2.1 Status of Deployment in US ..................................................................... 13 2.1.2.2 Types of Vehicles Typically in this Category ........................................ 14 2.1.2.3 Fuel Dispensing Requirements/Types ..................................................... 14 2.1.2.4 Costs ............................................................................................................. 14 2.1.2.5 Incentive Programs..................................................................................... 14 2.1.2.6 Advantages and Disadvantages ............................................................ 15
2.1.3 Electric ............................................................................................................................. 15 2.1.3.1 Status of Deployment in US ..................................................................... 15 2.1.3.2 Types of Vehicles Typically in this Category ........................................ 16 2.1.3.3 Vehicle Charging Requirements/Types ................................................. 16 2.1.3.4 Costs ............................................................................................................. 17 2.1.3.5 Incentive Programs..................................................................................... 17 2.1.3.6 Advantages and Disadvantages ............................................................ 18
2.2 Survey of Users of Alternative Fuel Vehicles ....................................................................... 18 2.2.1 Agencies/Cities/Businesses Contacted ..................................................................... 18
2.2.1.1 City of Richmond ........................................................................................ 18 2.2.1.2 City of Chesapeake .................................................................................. 21 2.2.1.3 HRT ............................................................................................................... 23 2.2.1.4 City of Smithtown, New York ................................................................... 23 2.2.1.5 Lake Jackson, Texas .................................................................................. 24
2.3 2011 Federal Initiative for Fuel Efficiency .......................................................................... 25
2.4 Natural Gas Supply in City .................................................................................................... 26
3.0 City of Virginia Beach Fleet Management ..................................................................................... 28
3.1 Fleet Management .................................................................................................................... 28
C N G F e a s i b i l i t y S t u d y , F i n a l v 1 . 0 i i 8 / 1 5 / 2 0 1 1
3.2 Inventory of Refuse Collection Vehicles ................................................................................ 29
3.3 Fueling Operations ................................................................................................................... 29 3.3.1 Vehicle Database Management System .................................................................. 32
3.4 Modifications to Maintenance Facilities ................................................................................ 32 3.4.1 Gas Detection System .................................................................................................. 32 3.4.2 Electrical System Upgrades ........................................................................................ 34 3.4.3 Mechanical Ventilation System ................................................................................... 35 3.4.4 Cost Estimate for Modifications to Maintenance Facility ...................................... 35
3.5 Replacement Policy/Approach .............................................................................................. 35
4.0 Evaluation of CNG Conversion for City’s Solid Waste collection Fleet .................................... 36
4.1 Scenarios and Assumptions...................................................................................................... 36 4.1.1 Assumptions and Variables ......................................................................................... 37 4.1.2 Pro Forma Model Results ............................................................................................. 42
4.2 Observations/Conclusions ....................................................................................................... 44
5.0 References ............................................................................................................................................. 53
L i s t o f E x h i b i t s No. Page
Exhibit 1. Former City of Virginia Beach Landstown CNG Facility .................................................. 2 Exhibit 2. Alternative Fuel Vehicles ........................................................................................................ 3 Exhibit 3. CNG Time-Fill Station ............................................................................................................. 6 Exhibit 4. CNG Quick-Fill Station ........................................................................................................... 6 Exhibit 5. CNG Combination Fill Station ............................................................................................... 7 Exhibit 6. CNG Prices in Hampton Roads, Virginia ............................................................................ 8 Exhibit 7. Maintenance Intervals Comparing CNG to Diesel Engines ............................................. 9 Exhibit 8. Electric Vehicle Charging Station (Level 2) ...................................................................... 17 Exhibit 9. Virginia Natural Gas Supply Network, State-wide ....................................................... 26 Exhibit 10. Virginia Natural Gas City Supply Network Near Holland Road and Landstown
Facilities .................................................................................................................................. 27 Exhibit 11. Virginia Beach Holland Road Solid Waste Management Facility ............................... 30 Exhibit 12. City Public Utilities Landstown Facility .............................................................................. 31 Exhibit 13. Department of Solid Waste Refuse Collection Fleet ..................................................... 31 Exhibit 14. Location of City’s Fueling Facilities .................................................................................... 33 Exhibit 15. Public Works Landstown Fueling Facility .......................................................................... 34 Exhibit 16. Planned Vehicle Replacement ............................................................................................ 35 Exhibit 17. Solid Waste Collection Vehicle Replacement Schedule ............................................... 37 Exhibit 18. Conceptual Layout of CNG Fueling Station, Holland Road Site .................................. 40 Exhibit 19. City of Richmond CNG Facility ........................................................................................... 41 Exhibit 20. Diesel and CNG Price Projections ...................................................................................... 43 Exhibit 21. Estimated O&M Costs for a CNG Time Fill/Quick Fill Station ..................................... 43 Exhibit 22. Input Assumptions Table (Partial) ....................................................................................... 46 Exhibit 23. Example Output of the Pro Forma Model, Diesel Escalator 5%,
CNG Escalator 3% ............................................................................................................... 47
C N G F e a s i b i l i t y S t u d y , F i n a l v 1 . 0 i i i 8 / 1 5 / 2 0 1 1
Exhibit 24. “Base Case” Scenario Pro Forma Analysis for Time-Fill/Quick-Fill Combination Station, 20% Vehicle Purchase Premium, 15% Vehicle Maintenance Factor, Variable Fuel Escalator ........................................................................................................ 48
Exhibit 25. “Best Case” Scenario Pro Forma Analysis for Time-Fill/Quick-Fill Combination Station, 15% Vehicle Purchase Premium, 10%Vehicle Maintenance Factor, 9% Fuel Efficiency Penalty Variable Fuel Escalators .................................................................... 48
Exhibit 26. Sensitivity Analysis, Higher Starting Diesel Price Pro Forma Analysis for Time-Fill/Quick-Fill Combination Station, 20% Vehicle Purchase Premium, 15% Vehicle Maintenance Factor, 13% Fuel Efficiency Penalty Variable Fuel Escalators(Base Case Scenario) ....................................................................................................................... 49
Exhibit 27. Sensitivity Analysis, Higher Starting Diesel Price Pro Forma Analysis for Time-Fill/Quick-Fill Combination Station, 15% Vehicle Purchase Premium, 10% Vehicle Maintenance Factor, 9% Fuel Efficiency Penalty Variable Fuel Escalators(Best Case Scenario) ................................................................................................................................. 50
Exhibit 28. Diesel and CNG Pricing Trends 2006 - 2011 ................................................................ 51 Exhibit 29. Projected Diesel/CNG Fuel Usage Trends for Transition to CNG Fleet .................... 52 A p p e n d i c e s A City of Virginia Beach Department of Solid Waste Refuse
Collection Vehicle Inventory, (January 31, 2011)
C N G F e a s i b i l i t y S t u d y , F i n a l v 1 . 0 E S - 1 8 / 1 5 / 2 0 1 1
EXECUT IVE SUMMARY
Private and municipal enterprises across North America have successfully converted their light
and heavy duty truck and bus fleets (in whole or in part) to alternative fuel vehicles such as
natural gas vehicles (NGV), compressed natural gas (CNG), liquefied natural gas (LNG),
hybrids, and electric. The reasons for the conversion include economic, philosophical, political,
and environmental considerations. There are concerns regarding the rising costs of petroleum
fuels, stability of the Middle East countries, and dependence on foreign oil. Natural gas (CNG or
LNG) can be supplied primarily from sources in North America, and is expected in the near-term
to be a lower cost alternative fuel source. According to Washington, DC-based NGV America, a
non-profit organization that advocates for greater use of NGVs, the price of a barrel of oil
historically has been about six times that of a thousand cubic feet of natural gas. Today, that ratio
has jumped to as high as 12-to-1. Stricter federal vehicle emissions requirements and concerns
regarding greenhouse gas emissions also are factors. Alternative fuel vehicles are reported to
have lower emissions compared to diesel and gasoline counterparts.
Natural gas is abundant and domestic. Roughly 85 percent (%) of the natural gas used in the
United States is produced in the United States. Natural gas is mostly methane, a simple molecule
comprising of just one carbon atom and four hydrogen atoms, making it an extremely clean and
energy dense fuel with very few emissions. This is increasingly important as tough new federal
emissions guidelines kick in on medium- and heavy-duty trucks and buses. Natural gas vehicles
also produce far fewer greenhouse gas emissions than either diesel or gasoline vehicles. The
clean burning attributes of NGVs are a significant reason some transit agencies – and a growing
number of airport and refuse fleets – are opting to switch to run on natural gas. An NGV’s
purchase price is more than that of its gas or diesel counterpart, but fuel costs are typically lower
so that the savings over the life of the vehicle may pay back the premium depending on a number
of factors as discussed in this report. Recently enacted federal tax incentives for vehicles,
fueling stations and natural gas fuel use – including measures that allow local governments to
capture their value – have improved NGVs’ economic advantage, although most of these expired
at the end of December 2010 or will expire at the end of 2011.
While the 2,500 natural gas refuse trucks currently on the road account for only a small
percentage of the 175,000 collection, recycling and transfer trucks in service today, a synergy of
market factors is prompting municipal refuse departments and contract haulers that already use
them to order more and catalyzing those that don’t use them to rethink their position. One of the
most important reasons for the move to natural gas is the cost of the fuel compared to diesel on
an equivalent energy basis. Refuse truck duty-cycles, low mileage-per-gallon ratings and yearly
engine operating hours translate into high fuel use. Typical refuse truck fuel use averages
between 8,500-10,000 gallons per year. With the growing differential between natural gas and
diesel fuel (on an equivalent energy basis), city or contractor-operated trucks can save as much
as 30-50% on fuel costs. Previous federal tax incentives of up to $32,000 per truck significantly
reduced the purchase price premium for natural gas trucks so the remaining premium is quickly
paid back in operating savings, generating savings over the rest of the life of the vehicle.
However, the incentives have expired. The payback and life-cycle savings will vary based on
local fuel costs, tax incentives, credits and available federal, state and regional grants. Other
market drivers favoring natural gas refuse trucks include the fact that they have lower air
C N G F e a s i b i l i t y S t u d y , F i n a l v 1 . 0 E S - 2 8 / 1 5 / 2 0 1 1
pollutant emissions and are 90% quieter than diesel powered trucks, two attributes that resonate
with city and county residents. Most of the major refuse truck chassis suppliers offer factory-
installed natural gas engine options. Peterbilt, Crane Carrier, Autocar, McNeilus, and American
LaFrance-Condor all offer the Cummins Westport 8.9-liter ISL-G natural gas engine. In addition,
Emission Solutions Inc and Baytech Corporation have 7.6-liter and 8.1-liter gaseous fuel options
to retrofit International or GMC refuse trucks, respectively, and Westport Innovations offers the
powerful 15-liter ISX-G for larger transfer truck applications.
The following advantages and disadvantages have been identified if the City were to transition
its current diesel-fuel refuse collection fleet to CNG-fueled vehicles:
Advantages of CNG
- Lower fuel costs. CNG fuel prices are lower compared to diesel on an equivalent
energy basis (the price depends on the price of the natural gas and electricity at
the point of refueling). For example, the City of Virginia Beach currently pays
$3.017 per gallon for diesel (DGE), and CNG is approximately $0.86 DGE at
$6.64/MMBtu (this price does not include the storage, capital, and O&M for the
fuel station). The price of CNG at the one commercial station in Norfolk as of
August 2011 was approximately $1.88/DGE ($1.66/gasoline gallon equivalent
(GGE)). Use of CNG potentially provides a hedge against accelerating fossil fuel
costs. Energy forecasts are highly variable and there appears to be no discernable
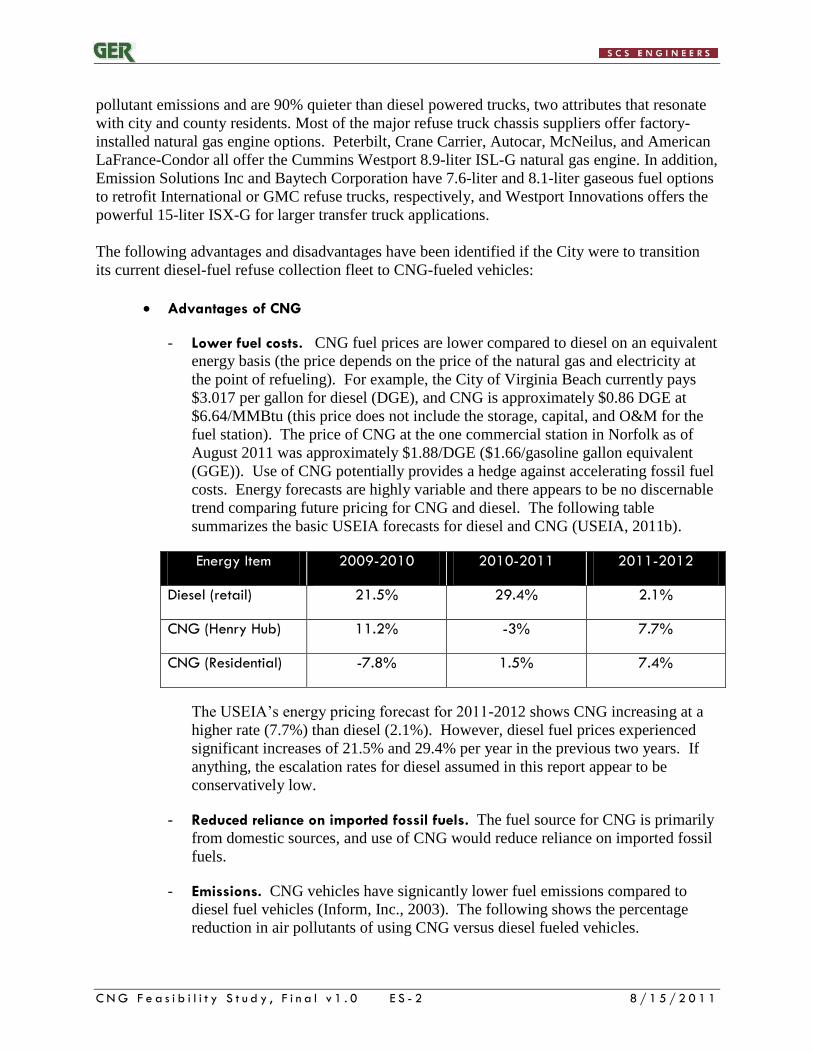
trend comparing future pricing for CNG and diesel. The following table
summarizes the basic USEIA forecasts for diesel and CNG (USEIA, 2011b).
The USEIA’s energy pricing forecast for 2011-2012 shows CNG increasing at a
higher rate (7.7%) than diesel (2.1%). However, diesel fuel prices experienced
significant increases of 21.5% and 29.4% per year in the previous two years. If
anything, the escalation rates for diesel assumed in this report appear to be
conservatively low.
- Reduced reliance on imported fossil fuels. The fuel source for CNG is primarily
from domestic sources, and use of CNG would reduce reliance on imported fossil
fuels.
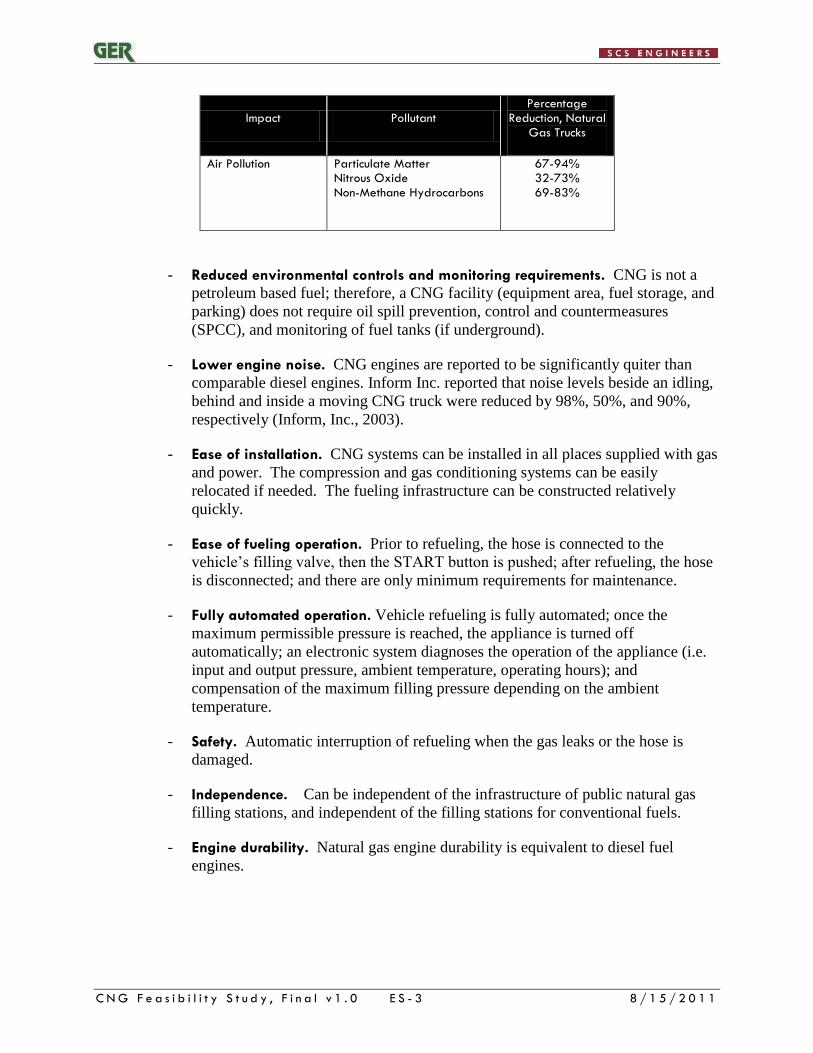
- Emissions. CNG vehicles have signicantly lower fuel emissions compared to
diesel fuel vehicles (Inform, Inc., 2003). The following shows the percentage
reduction in air pollutants of using CNG versus diesel fueled vehicles.
Energy Item 2009-2010 2010-2011 2011-2012
Diesel (retail) 21.5% 29.4% 2.1%
CNG (Henry Hub) 11.2% -3% 7.7%
CNG (Residential) -7.8% 1.5% 7.4%
C N G F e a s i b i l i t y S t u d y , F i n a l v 1 . 0 E S - 3 8 / 1 5 / 2 0 1 1
Impact Pollutant Percentage
Reduction, Natural Gas Trucks
Air Pollution Particulate Matter Nitrous Oxide Non-Methane Hydrocarbons
67-94% 32-73% 69-83%
- Reduced environmental controls and monitoring requirements. CNG is not a
petroleum based fuel; therefore, a CNG facility (equipment area, fuel storage, and
parking) does not require oil spill prevention, control and countermeasures
(SPCC), and monitoring of fuel tanks (if underground).
- Lower engine noise. CNG engines are reported to be significantly quiter than
comparable diesel engines. Inform Inc. reported that noise levels beside an idling,
behind and inside a moving CNG truck were reduced by 98%, 50%, and 90%,
respectively (Inform, Inc., 2003).
- Ease of installation. CNG systems can be installed in all places supplied with gas
and power. The compression and gas conditioning systems can be easily
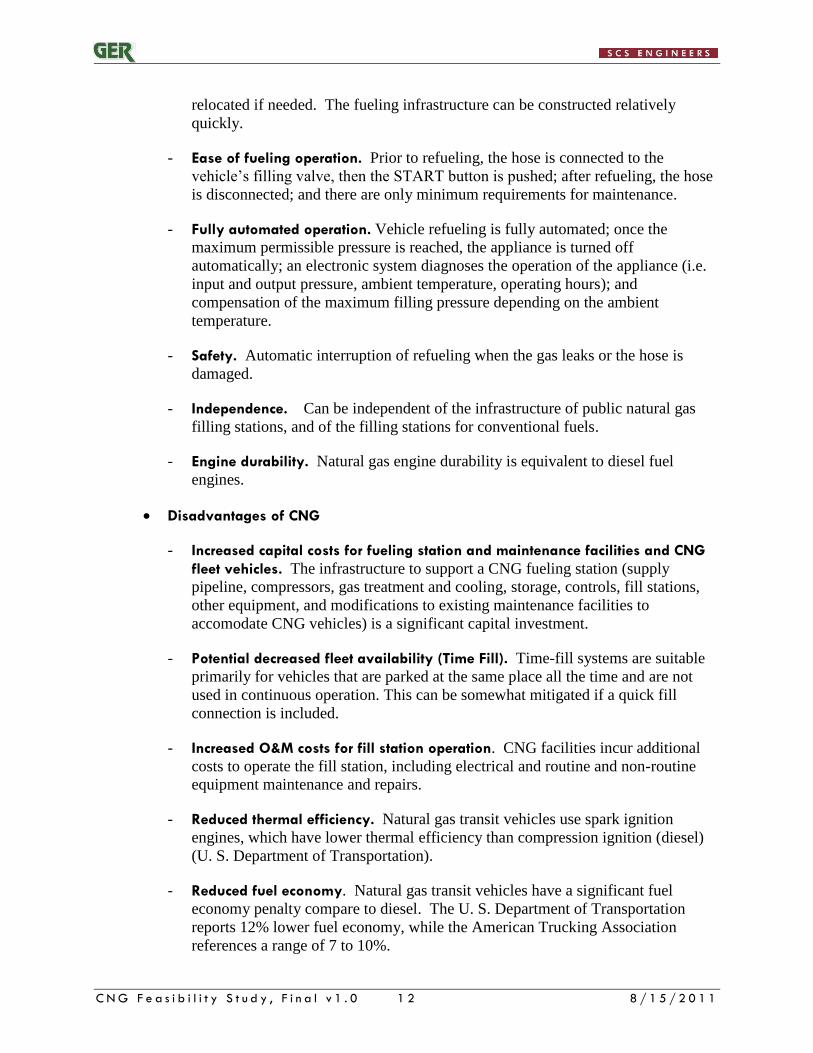
relocated if needed. The fueling infrastructure can be constructed relatively
quickly.
- Ease of fueling operation. Prior to refueling, the hose is connected to the
vehicle’s filling valve, then the START button is pushed; after refueling, the hose
is disconnected; and there are only minimum requirements for maintenance.
- Fully automated operation. Vehicle refueling is fully automated; once the
maximum permissible pressure is reached, the appliance is turned off
automatically; an electronic system diagnoses the operation of the appliance (i.e.
input and output pressure, ambient temperature, operating hours); and
compensation of the maximum filling pressure depending on the ambient
temperature.
- Safety. Automatic interruption of refueling when the gas leaks or the hose is
damaged.
- Independence. Can be independent of the infrastructure of public natural gas
filling stations, and independent of the filling stations for conventional fuels.
- Engine durability. Natural gas engine durability is equivalent to diesel fuel
engines.
C N G F e a s i b i l i t y S t u d y , F i n a l v 1 . 0 E S - 4 8 / 1 5 / 2 0 1 1
Disadvantages of CNG
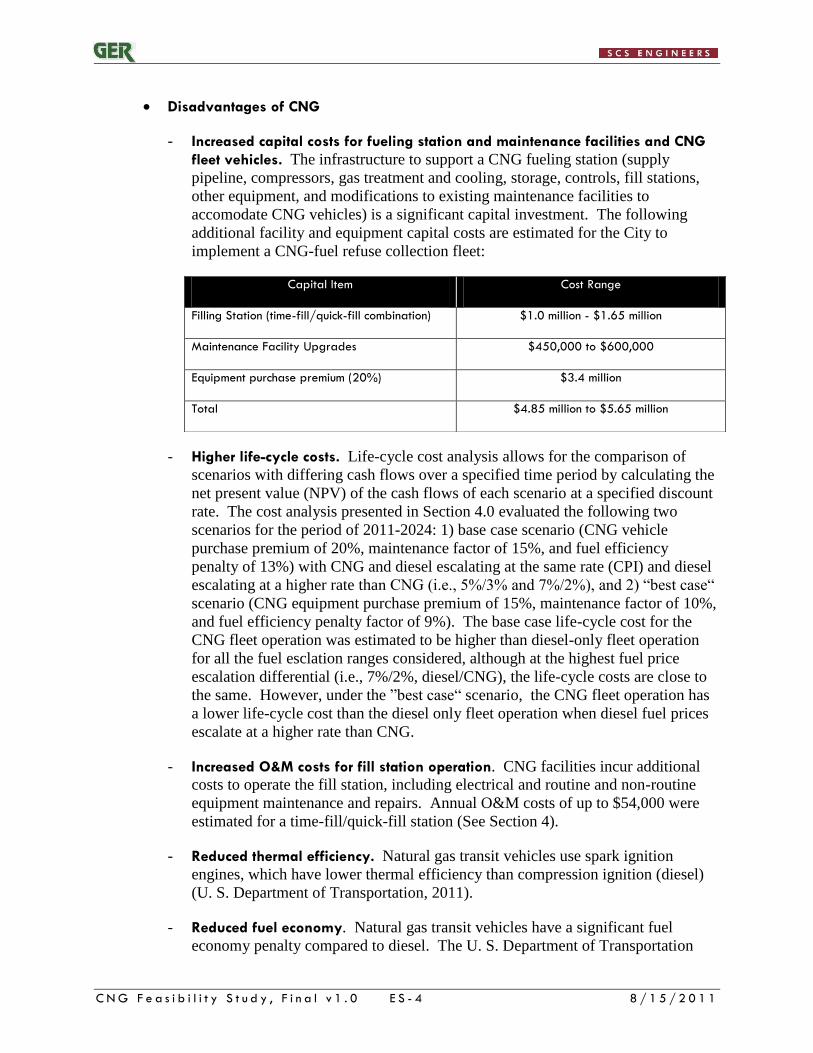
- Increased capital costs for fueling station and maintenance facilities and CNG
fleet vehicles. The infrastructure to support a CNG fueling station (supply
pipeline, compressors, gas treatment and cooling, storage, controls, fill stations,
other equipment, and modifications to existing maintenance facilities to
accomodate CNG vehicles) is a significant capital investment. The following
additional facility and equipment capital costs are estimated for the City to
implement a CNG-fuel refuse collection fleet:
- Higher life-cycle costs. Life-cycle cost analysis allows for the comparison of
scenarios with differing cash flows over a specified time period by calculating the
net present value (NPV) of the cash flows of each scenario at a specified discount
rate. The cost analysis presented in Section 4.0 evaluated the following two
scenarios for the period of 2011-2024: 1) base case scenario (CNG vehicle
purchase premium of 20%, maintenance factor of 15%, and fuel efficiency
penalty of 13%) with CNG and diesel escalating at the same rate (CPI) and diesel
escalating at a higher rate than CNG (i.e., 5%/3% and 7%/2%), and 2) ―best case―
scenario (CNG equipment purchase premium of 15%, maintenance factor of 10%,
and fuel efficiency penalty factor of 9%). The base case life-cycle cost for the
CNG fleet operation was estimated to be higher than diesel-only fleet operation
for all the fuel esclation ranges considered, although at the highest fuel price
escalation differential (i.e., 7%/2%, diesel/CNG), the life-cycle costs are close to
the same. However, under the ‖best case― scenario, the CNG fleet operation has
a lower life-cycle cost than the diesel only fleet operation when diesel fuel prices
escalate at a higher rate than CNG.
- Increased O&M costs for fill station operation. CNG facilities incur additional
costs to operate the fill station, including electrical and routine and non-routine
equipment maintenance and repairs. Annual O&M costs of up to $54,000 were
estimated for a time-fill/quick-fill station (See Section 4).
- Reduced thermal efficiency. Natural gas transit vehicles use spark ignition
engines, which have lower thermal efficiency than compression ignition (diesel)
(U. S. Department of Transportation, 2011).
- Reduced fuel economy. Natural gas transit vehicles have a significant fuel
economy penalty compared to diesel. The U. S. Department of Transportation
Capital Item Cost Range
Filling Station (time-fill/quick-fill combination) $1.0 million - $1.65 million
Maintenance Facility Upgrades $450,000 to $600,000
Equipment purchase premium (20%) $3.4 million
Total $4.85 million to $5.65 million
C N G F e a s i b i l i t y S t u d y , F i n a l v 1 . 0 E S - 5 8 / 1 5 / 2 0 1 1
reports 12% lower fuel economy, while the American Trucking Association
references a range of 7 to 10% (American Trucking Association, 2010).
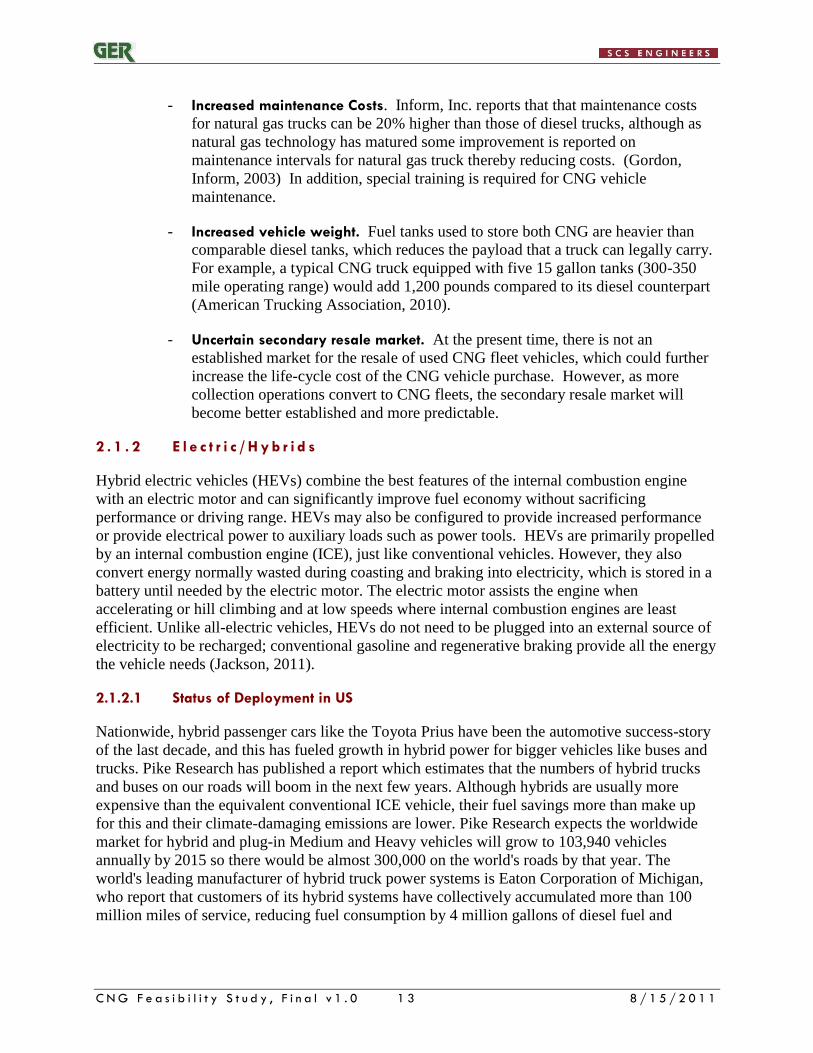
- Increased vehicle maintenance costs. Inform, Inc. reports that that maintenance
costs for natural gas trucks can be 20% higher than those of diesel trucks,
although as natural gas technology has matured some improvement is reported on
maintenance intervals for natural gas trucks thereby reducing costs. (Inform, Inc.,
2003)
- Dual fuel operation. If the City converted its refuse collection fleet to CNG, it
would still need to maintain its diesel fuel transfer and storage facilities to service
its other fleet vehicles that use diesel fuel.
- Increased vehicle weight. Fuel tanks used to store CNG are heavier than
comparable diesel tanks, which reduces the payload that a truck can legally carry.
For example, a typical CNG truck equipped with five 15 gallon tanks (300-350
mile operating range) would add 1,200 pounds compared to its diesel counterpart
(American Trucking Association, 2010).
- Uncertain secondary resale market. At the present time, there is not an
established market for the resale of used CNG fleet vehicles, which could further
increase the life-cycle cost of the CNG vehicle purchase. However, as more
collection operations convert to CNG fleets, the secondary resale market will
become better established and more predictable.
C N G F e a s i b i l i t y S t u d y , F i n a l v 1 . 0 1 8 / 1 5 / 2 0 1 1
1 .0 INTRODUCT ION
1 . 1 P U R P OS E A ND S C OP E O F S T U D Y
The City of Virginia Beach was awarded a federal grant under the Federal Stimulus Package to
study the feasibility of replacing its current diesel-fueled solid waste refuse collection fleet with
CNG-fueled vehicles. These fleet vehicles are assigned to the City’s Holland Road facility.
GeoEnvironmental Resources (GER) and SCS Engineers (SCS) were retained by the City under
a subcontract with HDR Engineering, Inc. to conduct the study. The purpose of this report is to
present the findings of the study. The City also manages other vehicle fleets (cars, light and
heavy duty trucks, heavy equipment, and buses) to support its public utilities and school
operations; however, the feasibility of replacing these fleet vehicles is beyond the scope of this
study, although some discussion of these fleets is provided in this report.
This feasibility study addresses the historical and current uses of compressed natural gas vehicles
throughout North America, with an emphasis on refuse collection trucks. Background on other
alternative fuel vehicles such as hybrids and electric vehicles also is provided, although the
economic feasibility of replacing existing vehicles with these alternative vehicles is beyond the
scope of this study. The age and replacement schedule for the City’s refuse vehicles is
considered. Life cycle cost analysis is presented comparing the options of keeping the current
diesel-fueled truck fleet to phasing in CNG-fueled vehicles as new vehicles are purchased in the
normal replacement cycle. The capital costs for a new CNG fueling station(s), increased costs
for the purchase and operation and maintenance of CNG vehicles, required upgrades to the
City’s maintenance facilities to manage a CNG fleet, and potential fuel cost savings is estimated.
Logistical factors such as the availability of CNG (location and capacity), and site features at the
City’s Holland Road Facility are also addressed. The study provides a summary of the
advantages and disadvantages of converting to a CNG fleet.
1 . 2 H I S T OR I C A L U S E O F C NG B Y C I T Y D EP A R TM E NT O F P U B L I C W OR K S
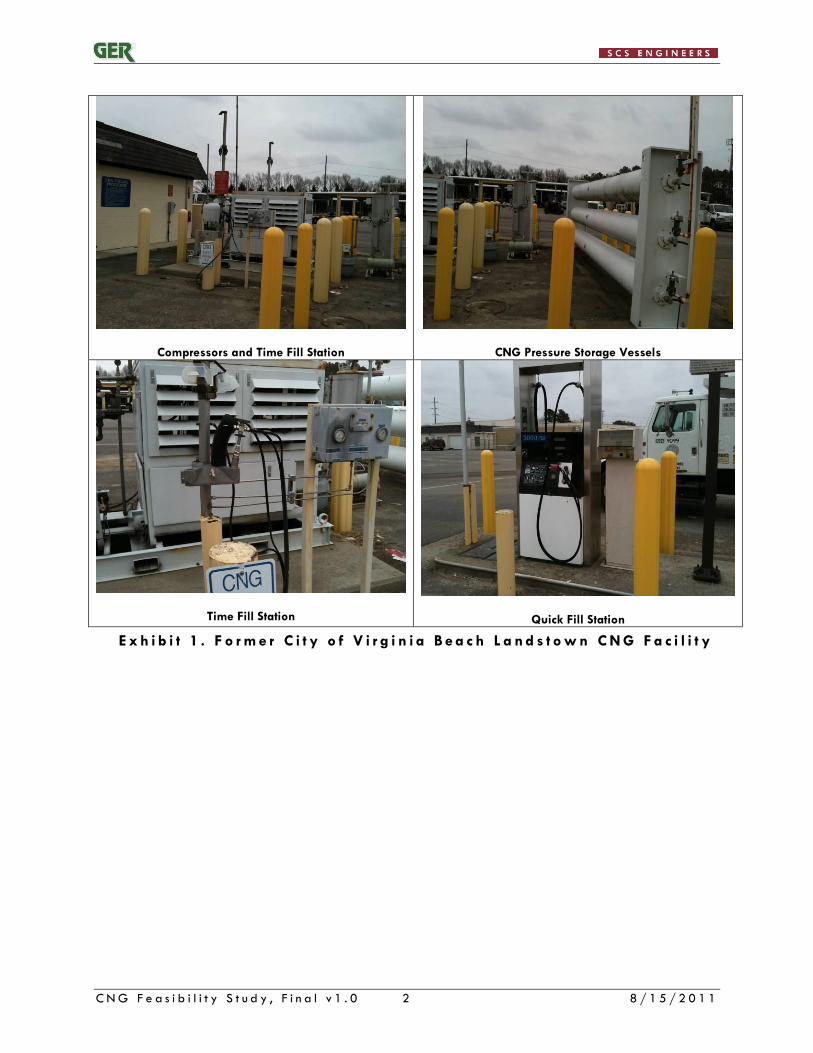
The City previously constructed and operated a CNG fueling facility at the Dam
Neck/Landstown Facility. The facility had time fill and quick fill connections and was used by
several vehicles and equipment. The CNG facility currently is not operational (See Exhibit 1)
and is in disrepair. Its only value at this juncture is as scrap metal and possibly reuses of the
pressure storage vessels (assuming they were tested).
C N G F e a s i b i l i t y S t u d y , F i n a l v 1 . 0 2 8 / 1 5 / 2 0 1 1
Compressors and Time Fill Station
CNG Pressure Storage Vessels
Time Fill Station
Quick Fill Station
E x h i b i t 1 . F o r m e r C i t y o f V i r g i n i a B e a c h L a n d s t o w n C N G F a c i l i t y
C N G F e a s i b i l i t y S t u d y , F i n a l v 1 . 0 3 8 / 1 5 / 2 0 1 1
2 .0 TECHNOLOGY REV I EW
2 . 1 A LT ER NA T I V E F U E L V EH I C L ES TY P ES A ND I N FOR MA T I ON
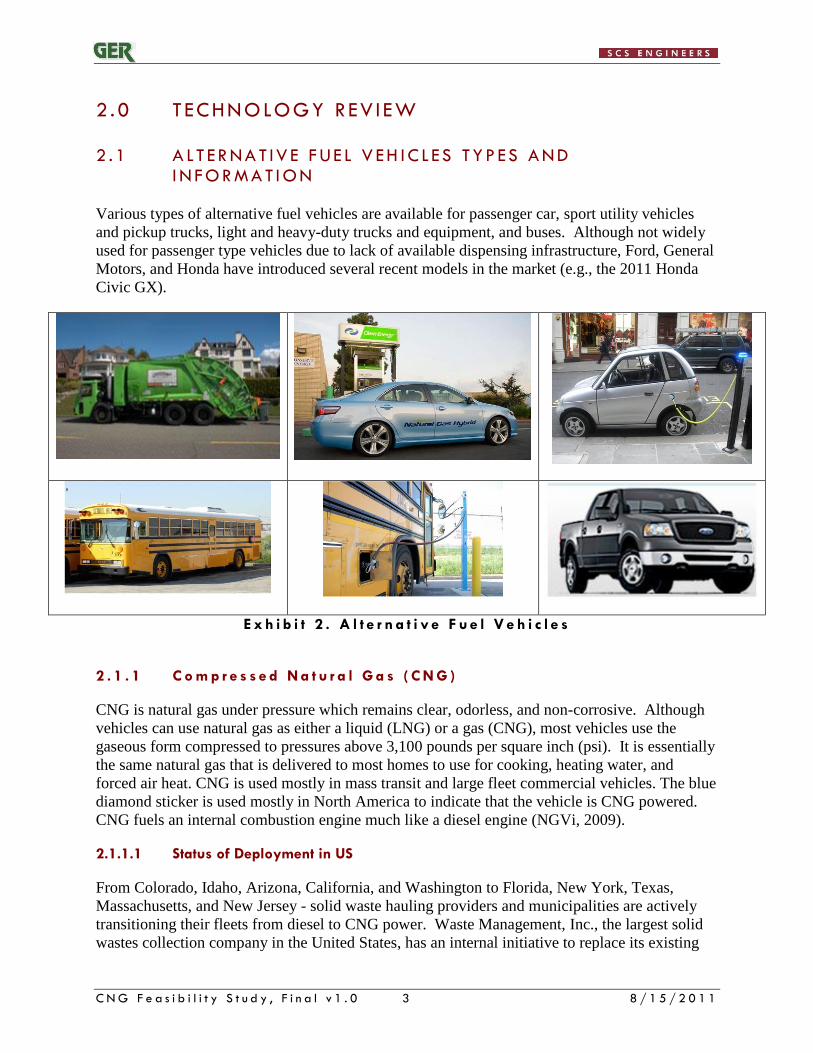
Various types of alternative fuel vehicles are available for passenger car, sport utility vehicles
and pickup trucks, light and heavy-duty trucks and equipment, and buses. Although not widely
used for passenger type vehicles due to lack of available dispensing infrastructure, Ford, General
Motors, and Honda have introduced several recent models in the market (e.g., the 2011 Honda
Civic GX).
E x h i b i t 2 . A l t e r n a t i v e F u e l V e h i c l e s
2 . 1 . 1 C o m p r e s s e d N a t u r a l G a s ( C N G )
CNG is natural gas under pressure which remains clear, odorless, and non-corrosive. Although
vehicles can use natural gas as either a liquid (LNG) or a gas (CNG), most vehicles use the
gaseous form compressed to pressures above 3,100 pounds per square inch (psi). It is essentially
the same natural gas that is delivered to most homes to use for cooking, heating water, and
forced air heat. CNG is used mostly in mass transit and large fleet commercial vehicles. The blue
diamond sticker is used mostly in North America to indicate that the vehicle is CNG powered.
CNG fuels an internal combustion engine much like a diesel engine (NGVi, 2009).
2.1.1.1 Status of Deployment in US
From Colorado, Idaho, Arizona, California, and Washington to Florida, New York, Texas,
Massachusetts, and New Jersey - solid waste hauling providers and municipalities are actively
transitioning their fleets from diesel to CNG power. Waste Management, Inc., the largest solid
wastes collection company in the United States, has an internal initiative to replace its existing
C N G F e a s i b i l i t y S t u d y , F i n a l v 1 . 0 4 8 / 1 5 / 2 0 1 1
diesel-fuel refuse collection vehicles with natural gas (LNG or CNG) vehicles as they are
scheduled for replacement. For example, in 2009, Waste Management invested $29 million in
106 new vehicles and an additional $7.5 million to build a compressed natural gas fueling station
in Seattle. The facility is open to the public and within five years all 180 collection trucks in the
Seattle fleet will be fueled by CNG. Waste Management reported that it expected to have 500
LNG vehicles and 299 CNG vehicles in service (Hurst, 2009).
2.1.1.2 Types of Vehicles Typically in This Category
CNG vehicles have been introduced in a wide variety of commercial applications:
Light-duty trucks and sedans (i.e. taxi cabs, maintenance trucks, and small city
vehicles)
Medium-duty trucks (i.e. delivery vans and large equipment trucks)
Heavy-duty vehicles (i.e. transit buses, street sweepers, refuse trucks, and school
buses)
2.1.1.3 CNG Fuel Dispensing Requirements/Types
CNG is dispensed either through a time fill, quick fill station, or combination time fill and quick
fill. Basic schematics of each type fill station are presented in Exhibit 3, Exhibit 4, and Exhibit
5, respectively. A time fill station slowly fills the vehicle fleet over an extended period (8 to 12
hours). A quick fill station performs similar to a normal diesel or gasoline pump. The number of
vehicles, the filling frequency, and the total quantity of fuel to be dispensed during the filling
period is used to size the facility compression and storage components.
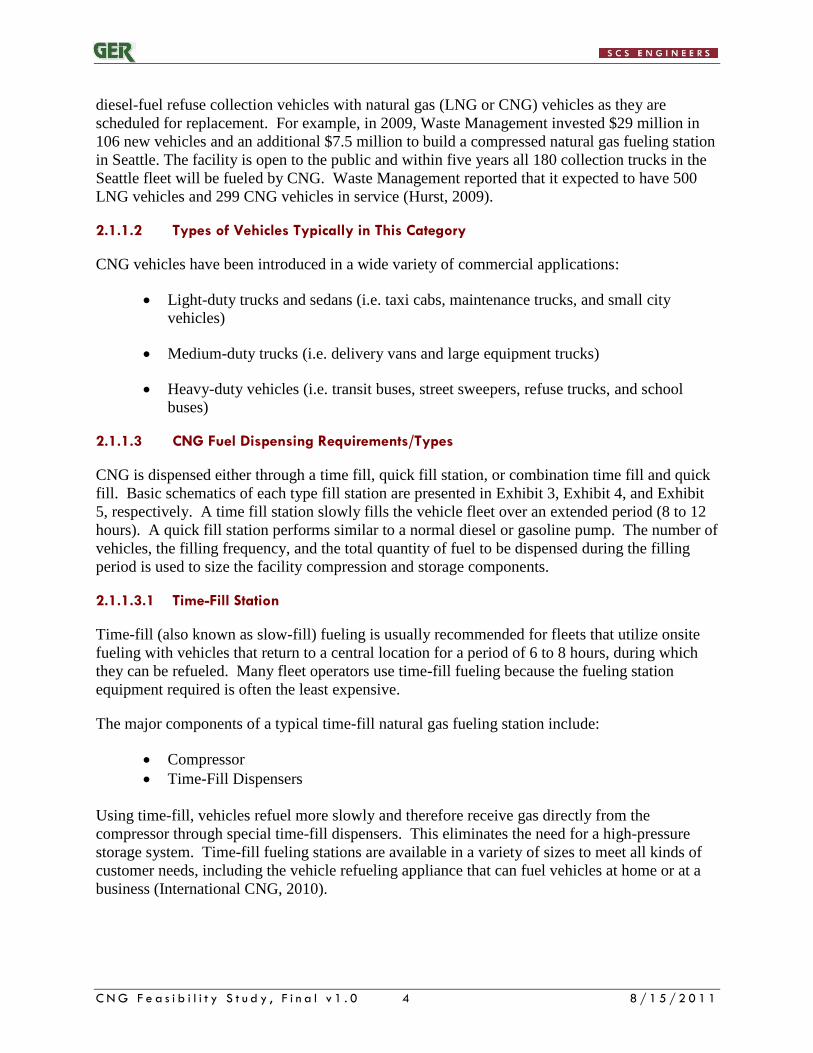
2.1.1.3.1 Time-Fill Station
Time-fill (also known as slow-fill) fueling is usually recommended for fleets that utilize onsite
fueling with vehicles that return to a central location for a period of 6 to 8 hours, during which
they can be refueled. Many fleet operators use time-fill fueling because the fueling station
equipment required is often the least expensive.
The major components of a typical time-fill natural gas fueling station include:
Compressor
Time-Fill Dispensers
Using time-fill, vehicles refuel more slowly and therefore receive gas directly from the
compressor through special time-fill dispensers. This eliminates the need for a high-pressure
storage system. Time-fill fueling stations are available in a variety of sizes to meet all kinds of
customer needs, including the vehicle refueling appliance that can fuel vehicles at home or at a
business (International CNG, 2010).
C N G F e a s i b i l i t y S t u d y , F i n a l v 1 . 0 5 8 / 1 5 / 2 0 1 1
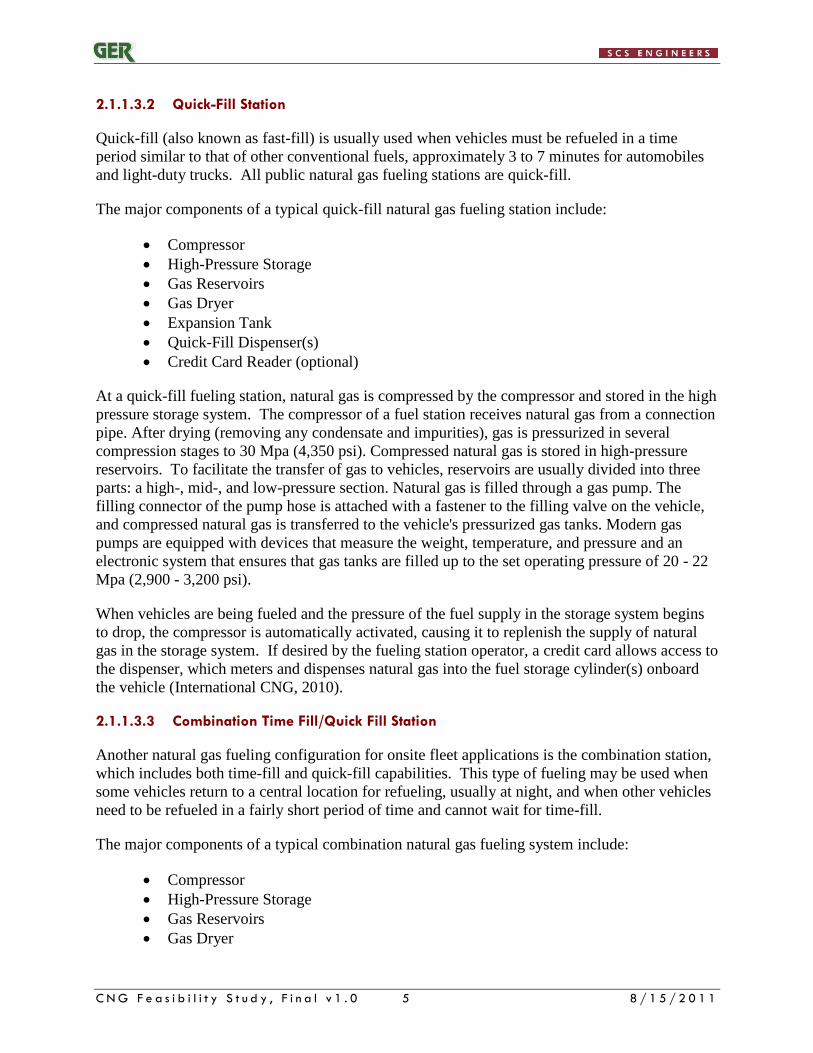
2.1.1.3.2 Quick-Fill Station
Quick-fill (also known as fast-fill) is usually used when vehicles must be refueled in a time
period similar to that of other conventional fuels, approximately 3 to 7 minutes for automobiles
and light-duty trucks. All public natural gas fueling stations are quick-fill.
The major components of a typical quick-fill natural gas fueling station include:
Compressor
High-Pressure Storage
Gas Reservoirs
Gas Dryer
Expansion Tank
Quick-Fill Dispenser(s)
Credit Card Reader (optional)
At a quick-fill fueling station, natural gas is compressed by the compressor and stored in the high
pressure storage system. The compressor of a fuel station receives natural gas from a connection
pipe. After drying (removing any condensate and impurities), gas is pressurized in several
compression stages to 30 Mpa (4,350 psi). Compressed natural gas is stored in high-pressure
reservoirs. To facilitate the transfer of gas to vehicles, reservoirs are usually divided into three
parts: a high-, mid-, and low-pressure section. Natural gas is filled through a gas pump. The
filling connector of the pump hose is attached with a fastener to the filling valve on the vehicle,
and compressed natural gas is transferred to the vehicle's pressurized gas tanks. Modern gas
pumps are equipped with devices that measure the weight, temperature, and pressure and an
electronic system that ensures that gas tanks are filled up to the set operating pressure of 20 - 22
Mpa (2,900 - 3,200 psi).
When vehicles are being fueled and the pressure of the fuel supply in the storage system begins
to drop, the compressor is automatically activated, causing it to replenish the supply of natural
gas in the storage system. If desired by the fueling station operator, a credit card allows access to
the dispenser, which meters and dispenses natural gas into the fuel storage cylinder(s) onboard
the vehicle (International CNG, 2010).
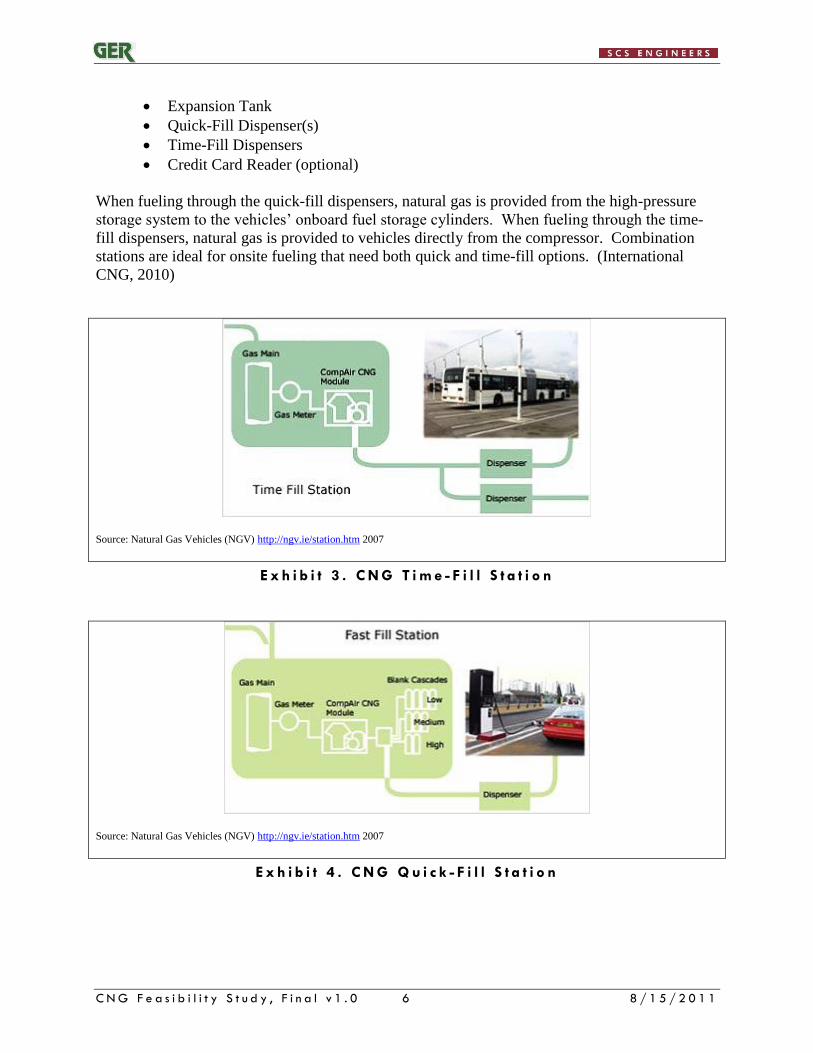
2.1.1.3.3 Combination Time Fill/Quick Fill Station
Another natural gas fueling configuration for onsite fleet applications is the combination station,
which includes both time-fill and quick-fill capabilities. This type of fueling may be used when
some vehicles return to a central location for refueling, usually at night, and when other vehicles
need to be refueled in a fairly short period of time and cannot wait for time-fill.
The major components of a typical combination natural gas fueling system include:
Compressor
High-Pressure Storage
Gas Reservoirs
Gas Dryer
C N G F e a s i b i l i t y S t u d y , F i n a l v 1 . 0 6 8 / 1 5 / 2 0 1 1
Expansion Tank
Quick-Fill Dispenser(s)
Time-Fill Dispensers
Credit Card Reader (optional)
When fueling through the quick-fill dispensers, natural gas is provided from the high-pressure
storage system to the vehicles’ onboard fuel storage cylinders. When fueling through the time-
fill dispensers, natural gas is provided to vehicles directly from the compressor. Combination
stations are ideal for onsite fueling that need both quick and time-fill options. (International
CNG, 2010)
Source: Natural Gas Vehicles (NGV) http://ngv.ie/station.htm 2007
E x h i b i t 3 . C N G T i m e - F i l l S t a t i o n
Source: Natural Gas Vehicles (NGV) http://ngv.ie/station.htm 2007
E x h i b i t 4 . C N G Q u i c k - F i l l S t a t i o n
C N G F e a s i b i l i t y S t u d y , F i n a l v 1 . 0 7 8 / 1 5 / 2 0 1 1
Source: Norwalk Compressors http://www.norwalkcompressor.com/html/ngv.html
E x h i b i t 5 . C N G C o m b i n a t i o n F i l l S t a t i o n
2.1.1.4 CNG Fuel Station Costs
The cost of a CNG fuel depends on the following factors:
The number of vehicles to be fueled, total daily fuel requirements and maximum
hourly flow rate.
Whether time-fill, fast-fill or both capabilities are needed.
The level of remote station monitoring and diagnostics capability desired.
The type and sophistication of data collection/payment processing system at the
dispenser.
The land area required.
The availability, quality and pressure of gas service.
The amount of back-up fueling or required system redundancy.
Site-specific factors such as permitting, site improvements and/or other requirements.
C N G F e a s i b i l i t y S t u d y , F i n a l v 1 . 0 8 8 / 1 5 / 2 0 1 1
The basic cost components of the CNG fueling station are:
Natural gas – either purchased on the open market through a broker or via the local
distribution company (LDC) bundled rate.
The LDC’s delivery charge and related meter and account fees.
Compression.
Station equipment (or the cost of capital to buy it).
Service and maintenance.
Local, state and federal taxes (if applicable).
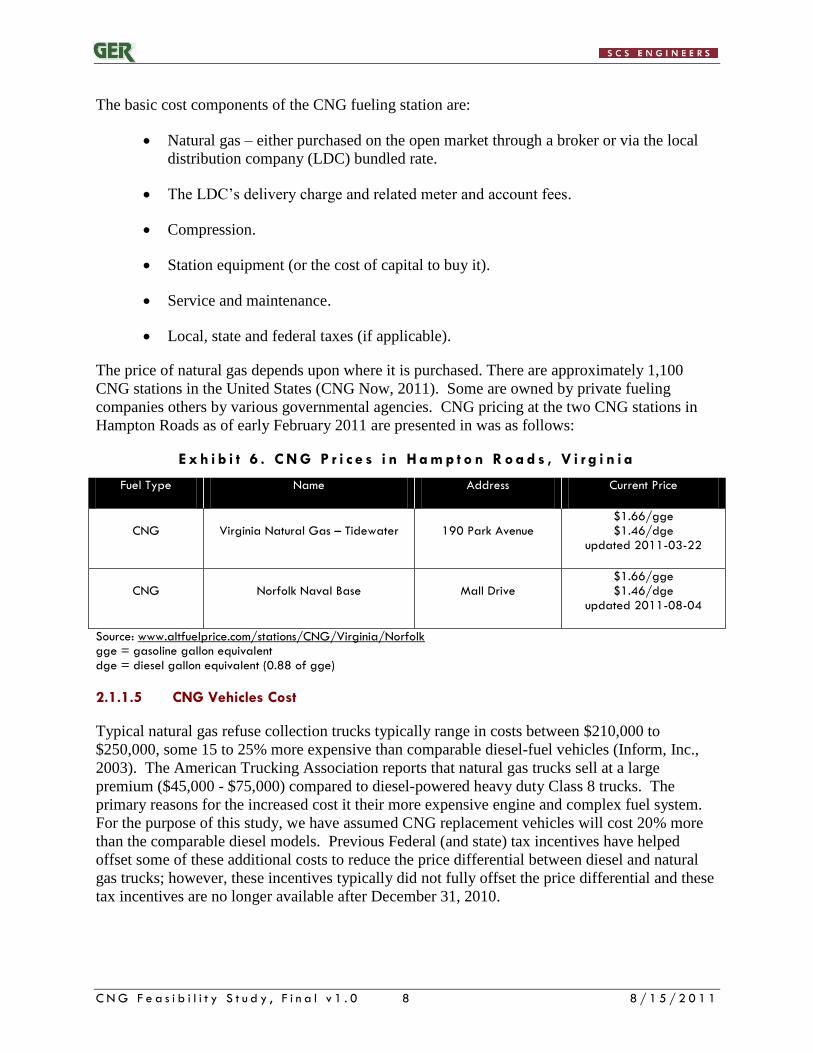
The price of natural gas depends upon where it is purchased. There are approximately 1,100
CNG stations in the United States (CNG Now, 2011). Some are owned by private fueling
companies others by various governmental agencies. CNG pricing at the two CNG stations in
Hampton Roads as of early February 2011 are presented in was as follows:
E x h i b i t 6 . C N G P r i c e s i n H a m p t o n R o a d s , V i r g i n i a
Fuel Type Name Address Current Price
CNG Virginia Natural Gas – Tidewater 190 Park Avenue $1.66/gge $1.46/dge
updated 2011-03-22
CNG Norfolk Naval Base Mall Drive $1.66/gge $1.46/dge
updated 2011-08-04
Source: www.altfuelprice.com/stations/CNG/Virginia/Norfolk gge = gasoline gallon equivalent dge = diesel gallon equivalent (0.88 of gge)
2.1.1.5 CNG Vehicles Cost
Typical natural gas refuse collection trucks typically range in costs between $210,000 to
$250,000, some 15 to 25% more expensive than comparable diesel-fuel vehicles (Inform, Inc.,
2003). The American Trucking Association reports that natural gas trucks sell at a large
premium ($45,000 - $75,000) compared to diesel-powered heavy duty Class 8 trucks. The
primary reasons for the increased cost it their more expensive engine and complex fuel system.
For the purpose of this study, we have assumed CNG replacement vehicles will cost 20% more
than the comparable diesel models. Previous Federal (and state) tax incentives have helped
offset some of these additional costs to reduce the price differential between diesel and natural
gas trucks; however, these incentives typically did not fully offset the price differential and these
tax incentives are no longer available after December 31, 2010.
C N G F e a s i b i l i t y S t u d y , F i n a l v 1 . 0 9 8 / 1 5 / 2 0 1 1
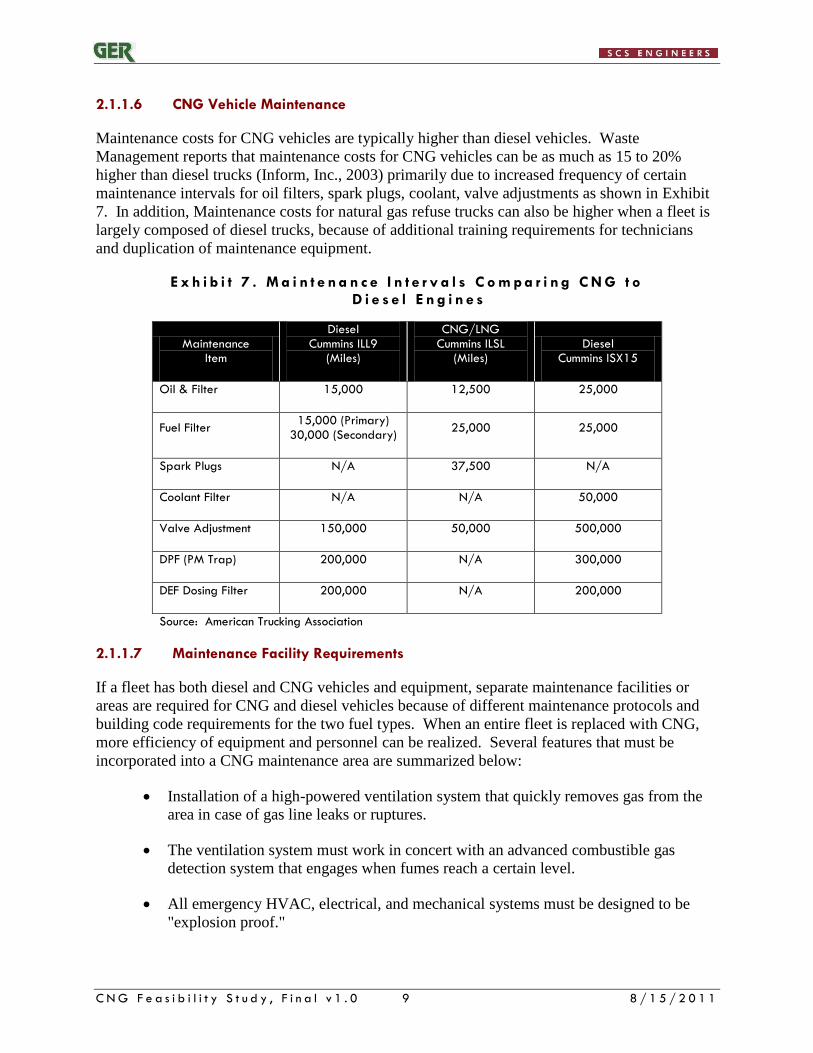
2.1.1.6 CNG Vehicle Maintenance
Maintenance costs for CNG vehicles are typically higher than diesel vehicles. Waste
Management reports that maintenance costs for CNG vehicles can be as much as 15 to 20%
higher than diesel trucks (Inform, Inc., 2003) primarily due to increased frequency of certain
maintenance intervals for oil filters, spark plugs, coolant, valve adjustments as shown in Exhibit
7. In addition, Maintenance costs for natural gas refuse trucks can also be higher when a fleet is
largely composed of diesel trucks, because of additional training requirements for technicians
and duplication of maintenance equipment.
E x h i b i t 7 . M a i n t e n a n c e I n t e r v a l s C o m p a r i n g C N G t o D i e s e l E n g i n e s
Maintenance Item
Diesel Cummins ILL9
(Miles)
CNG/LNG Cummins ILSL
(Miles) Diesel
Cummins ISX15
Oil & Filter 15,000 12,500 25,000
Fuel Filter 15,000 (Primary)
30,000 (Secondary) 25,000 25,000
Spark Plugs N/A 37,500 N/A
Coolant Filter N/A N/A 50,000
Valve Adjustment 150,000 50,000 500,000
DPF (PM Trap) 200,000 N/A 300,000
DEF Dosing Filter 200,000 N/A 200,000
Source: American Trucking Association
2.1.1.7 Maintenance Facility Requirements
If a fleet has both diesel and CNG vehicles and equipment, separate maintenance facilities or
areas are required for CNG and diesel vehicles because of different maintenance protocols and
building code requirements for the two fuel types. When an entire fleet is replaced with CNG,
more efficiency of equipment and personnel can be realized. Several features that must be
incorporated into a CNG maintenance area are summarized below:
Installation of a high-powered ventilation system that quickly removes gas from the
area in case of gas line leaks or ruptures.
The ventilation system must work in concert with an advanced combustible gas
detection system that engages when fumes reach a certain level.
All emergency HVAC, electrical, and mechanical systems must be designed to be
"explosion proof."
C N G F e a s i b i l i t y S t u d y , F i n a l v 1 . 0 1 0 8 / 1 5 / 2 0 1 1
The design of the building must also incorporate the conversion of existing
maintenance bays to support CNG vehicles, erecting a firewall to separate that area
from the diesel bays.
2.1.1.8 Resale Value of Vehicles
The resale market for used CNG vehicles is unknown at this juncture. The City of Richmond,
which recently purchased 24 McNeilius CNG refuse trucks to replace its aging diesel fleet (and
constructed a 24-station time fill refueling facility), indicated concern over the maturity and
viability of the secondary re-sale market when it comes time to replace the vehicles they just
purchased (City of Richmond, February 3, 2011). However, for the purpose of this study, we
have assumed that all vehicles, regardless of type, will have a minimum salvage value of 10% of
the original purchase price.
2.1.1.9 Incentive Programs
Over the last several years there have been several grant and tax incentive programs available to
private and municipal entities considering converting or purchasing alternative fuel vehicles such
as CNG, most of which expired at the end of 2010 or are scheduled to expire at the end of 2011,
unless Congress votes to extend them. The primary programs are summarized below:
Qualified Alternative Fuel Motor Vehicle (QAFMV) Tax Credit (Note: This incentive
expired December 31, 2010, but was posted until the federal tax filing deadline). A
tax credit was available toward the purchase of QAFMVs. It was applicable to new,
original equipment manufacturer vehicles or vehicles that have been repowered by an
aftermarket conversion company to operate on an alternative fuel. Qualifying
alternative fuels included those powered by natural gas, liquefied petroleum gas,
hydrogen, and fuel containing at least 85% methanol. The vehicle had to be placed in
service as an alternative fuel vehicle on or after January 1, 2006. This tax credit
expired December 31, 2010, and the amount varied by vehicle type (Reference 26
U.S. Code 30B).
Alternative Fuel Excise Tax Credit. A tax incentive is available for alternative fuel
that is sold for use or used as a fuel to operate a motor vehicle. Under current law, this
incentive is scheduled to expire December 31, 2011. A tax credit in the amount of
$0.50 per gallon is available for the following alternative fuels: compressed natural
gas (based on 121 cubic feet), liquefied natural gas, liquefied petroleum gas, P-Series
fuel, liquid fuel derived from coal through the Fischer-Tropsch process, and
compressed or liquefied gas derived from biomass. For an entity to be eligible to
claim the credit they must be liable for reporting and paying the federal excise tax on
the sale or use of the fuel in a motor vehicle. Tax exempt entities such as state and
local governments that dispense qualified fuel from an on-site fueling station for use
in vehicles qualify for the incentive. Eligible entities must be registered with the
Internal Revenue Service (IRS). The incentive must first be taken as a credit against
the entity's alternative fuel tax liability; any excess over this fuel tax liability may be
claimed as a direct payment from the IRS. The tax credit is not allowed if an
incentive for the same alternative fuel is also determined under the rules for the
C N G F e a s i b i l i t y S t u d y , F i n a l v 1 . 0 1 1 8 / 1 5 / 2 0 1 1
ethanol or biodiesel tax credits. For more information, see IRS Publication 510 and
IRS Forms 637, 720, 4136, and 8849, which are available via the IRS website.
Alternative Fuel Infrastructure Tax Credit. A tax credit is available for the cost of
alternative fueling equipment placed into service after December 31, 2005. Qualified
alternative fuels are natural gas, liquefied petroleum gas, hydrogen, electricity, E85,
or diesel fuel blends containing a minimum of 20% biodiesel. The credit amount is up
to 30% of the cost, not to exceed $30,000 for equipment placed into service in 2011.
Equipment placed into service in 2009 and 2010 may receive a credit in the amount
of 50% of eligible costs not to exceed $50,000. Fueling station owners who install
qualified equipment at multiple sites are allowed to use the credit towards each
location. Consumers who purchase qualified residential fueling equipment may
receive a tax credit of up to $1,000. The maximum credit amount for hydrogen
fueling equipment placed into service before January 1, 2015, is $200,000. Under
current law, the credit expires December 31, 2011, for all other eligible fuel types.
Unused credits that qualify as general business tax credits, as defined by the IRS, may
be carried backward one year and carried forward 20 years (Reference H.R. 4853,
2010, Section 711; and 26 U.S. Code 30C and 38B).
2.1.1.10 Advantages and Disadvantages of CNG
Advantages of CNG
- Lower fuel costs. Lower price of the fuel compared to diesel on an equivalent
energy basis (the price depends on the price of the natural gas and electricity at
the point of refueling).
- Reduced reliance on imported fossil fuels. The fuel source for CNG is primarily
from domestic sources, and use of CNG would reduce reliance on imported fossil
fuels.
- Emissions. CNG vehicles have signicantly lower fuel emissions compared to
diesel fuel vehicles.
- Reduced environmental controls and monitoring requirements. CNG is not a
petroleum based fuel; therefore, a CNG facility (equipment area, fuel storage, and
parking) does not require oil spill prevention, control and countermeasures
(SPCC), and monitoring of fuel tanks (if underground).
- Lower engine noise. CNG engines are reported to be significantly quiter than
comparable diesel engines. Inform Inc. reported that noise levels beside an idling,
behind and inside a moving CNG truck were reduced by 98%, 50%, and 90%,
respectively (Inform, Inc., 2003).
- Ease of installation. CNG systems can be installed in all places supplied with gas
and power. The compression and gas conditioning systems can be easily
C N G F e a s i b i l i t y S t u d y , F i n a l v 1 . 0 1 2 8 / 1 5 / 2 0 1 1
relocated if needed. The fueling infrastructure can be constructed relatively
quickly.
- Ease of fueling operation. Prior to refueling, the hose is connected to the
vehicle’s filling valve, then the START button is pushed; after refueling, the hose
is disconnected; and there are only minimum requirements for maintenance.
- Fully automated operation. Vehicle refueling is fully automated; once the
maximum permissible pressure is reached, the appliance is turned off
automatically; an electronic system diagnoses the operation of the appliance (i.e.
input and output pressure, ambient temperature, operating hours); and
compensation of the maximum filling pressure depending on the ambient
temperature.
- Safety. Automatic interruption of refueling when the gas leaks or the hose is
damaged.
- Independence. Can be independent of the infrastructure of public natural gas
filling stations, and of the filling stations for conventional fuels.
- Engine durability. Natural gas engine durability is equivalent to diesel fuel
engines.
Disadvantages of CNG
- Increased capital costs for fueling station and maintenance facilities and CNG
fleet vehicles. The infrastructure to support a CNG fueling station (supply
pipeline, compressors, gas treatment and cooling, storage, controls, fill stations,
other equipment, and modifications to existing maintenance facilities to
accomodate CNG vehicles) is a significant capital investment.
- Potential decreased fleet availability (Time Fill). Time-fill systems are suitable
primarily for vehicles that are parked at the same place all the time and are not
used in continuous operation. This can be somewhat mitigated if a quick fill
connection is included.
- Increased O&M costs for fill station operation. CNG facilities incur additional
costs to operate the fill station, including electrical and routine and non-routine
equipment maintenance and repairs.
- Reduced thermal efficiency. Natural gas transit vehicles use spark ignition
engines, which have lower thermal efficiency than compression ignition (diesel)
(U. S. Department of Transportation).
- Reduced fuel economy. Natural gas transit vehicles have a significant fuel
economy penalty compare to diesel. The U. S. Department of Transportation
reports 12% lower fuel economy, while the American Trucking Association
references a range of 7 to 10%.
C N G F e a s i b i l i t y S t u d y , F i n a l v 1 . 0 1 3 8 / 1 5 / 2 0 1 1
- Increased maintenance Costs. Inform, Inc. reports that that maintenance costs
for natural gas trucks can be 20% higher than those of diesel trucks, although as
natural gas technology has matured some improvement is reported on
maintenance intervals for natural gas truck thereby reducing costs. (Gordon,
Inform, 2003) In addition, special training is required for CNG vehicle
maintenance.
- Increased vehicle weight. Fuel tanks used to store both CNG are heavier than
comparable diesel tanks, which reduces the payload that a truck can legally carry.
For example, a typical CNG truck equipped with five 15 gallon tanks (300-350
mile operating range) would add 1,200 pounds compared to its diesel counterpart
(American Trucking Association, 2010).
- Uncertain secondary resale market. At the present time, there is not an
established market for the resale of used CNG fleet vehicles, which could further
increase the life-cycle cost of the CNG vehicle purchase. However, as more
collection operations convert to CNG fleets, the secondary resale market will
become better established and more predictable.
2 . 1 . 2 E l e c t r i c / H y b r i d s
Hybrid electric vehicles (HEVs) combine the best features of the internal combustion engine
with an electric motor and can significantly improve fuel economy without sacrificing
performance or driving range. HEVs may also be configured to provide increased performance
or provide electrical power to auxiliary loads such as power tools. HEVs are primarily propelled
by an internal combustion engine (ICE), just like conventional vehicles. However, they also
convert energy normally wasted during coasting and braking into electricity, which is stored in a
battery until needed by the electric motor. The electric motor assists the engine when
accelerating or hill climbing and at low speeds where internal combustion engines are least
efficient. Unlike all-electric vehicles, HEVs do not need to be plugged into an external source of
electricity to be recharged; conventional gasoline and regenerative braking provide all the energy
the vehicle needs (Jackson, 2011).
2.1.2.1 Status of Deployment in US
Nationwide, hybrid passenger cars like the Toyota Prius have been the automotive success-story
of the last decade, and this has fueled growth in hybrid power for bigger vehicles like buses and
trucks. Pike Research has published a report which estimates that the numbers of hybrid trucks
and buses on our roads will boom in the next few years. Although hybrids are usually more
expensive than the equivalent conventional ICE vehicle, their fuel savings more than make up
for this and their climate-damaging emissions are lower. Pike Research expects the worldwide
market for hybrid and plug-in Medium and Heavy vehicles will grow to 103,940 vehicles
annually by 2015 so there would be almost 300,000 on the world's roads by that year. The
world's leading manufacturer of hybrid truck power systems is Eaton Corporation of Michigan,
who report that customers of its hybrid systems have collectively accumulated more than 100
million miles of service, reducing fuel consumption by 4 million gallons of diesel fuel and
C N G F e a s i b i l i t y S t u d y , F i n a l v 1 . 0 1 4 8 / 1 5 / 2 0 1 1
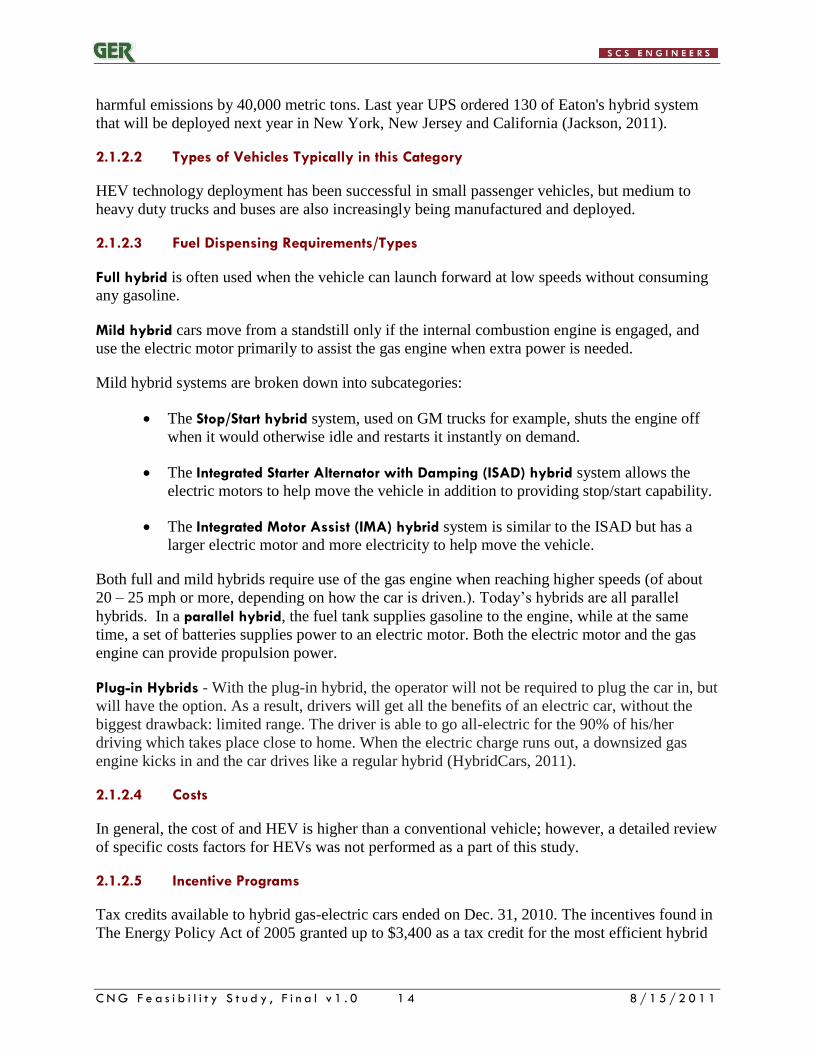
harmful emissions by 40,000 metric tons. Last year UPS ordered 130 of Eaton's hybrid system
that will be deployed next year in New York, New Jersey and California (Jackson, 2011).
2.1.2.2 Types of Vehicles Typically in this Category
HEV technology deployment has been successful in small passenger vehicles, but medium to
heavy duty trucks and buses are also increasingly being manufactured and deployed.
2.1.2.3 Fuel Dispensing Requirements/Types
Full hybrid is often used when the vehicle can launch forward at low speeds without consuming
any gasoline.
Mild hybrid cars move from a standstill only if the internal combustion engine is engaged, and
use the electric motor primarily to assist the gas engine when extra power is needed.
Mild hybrid systems are broken down into subcategories:
The Stop/Start hybrid system, used on GM trucks for example, shuts the engine off
when it would otherwise idle and restarts it instantly on demand.
The Integrated Starter Alternator with Damping (ISAD) hybrid system allows the
electric motors to help move the vehicle in addition to providing stop/start capability.
The Integrated Motor Assist (IMA) hybrid system is similar to the ISAD but has a
larger electric motor and more electricity to help move the vehicle.
Both full and mild hybrids require use of the gas engine when reaching higher speeds (of about
20 – 25 mph or more, depending on how the car is driven.). Today’s hybrids are all parallel
hybrids. In a parallel hybrid, the fuel tank supplies gasoline to the engine, while at the same
time, a set of batteries supplies power to an electric motor. Both the electric motor and the gas
engine can provide propulsion power.
Plug-in Hybrids - With the plug-in hybrid, the operator will not be required to plug the car in, but
will have the option. As a result, drivers will get all the benefits of an electric car, without the
biggest drawback: limited range. The driver is able to go all-electric for the 90% of his/her
driving which takes place close to home. When the electric charge runs out, a downsized gas
engine kicks in and the car drives like a regular hybrid (HybridCars, 2011).
2.1.2.4 Costs
In general, the cost of and HEV is higher than a conventional vehicle; however, a detailed review
of specific costs factors for HEVs was not performed as a part of this study.
2.1.2.5 Incentive Programs
Tax credits available to hybrid gas-electric cars ended on Dec. 31, 2010. The incentives found in
The Energy Policy Act of 2005 granted up to $3,400 as a tax credit for the most efficient hybrid
C N G F e a s i b i l i t y S t u d y , F i n a l v 1 . 0 1 5 8 / 1 5 / 2 0 1 1
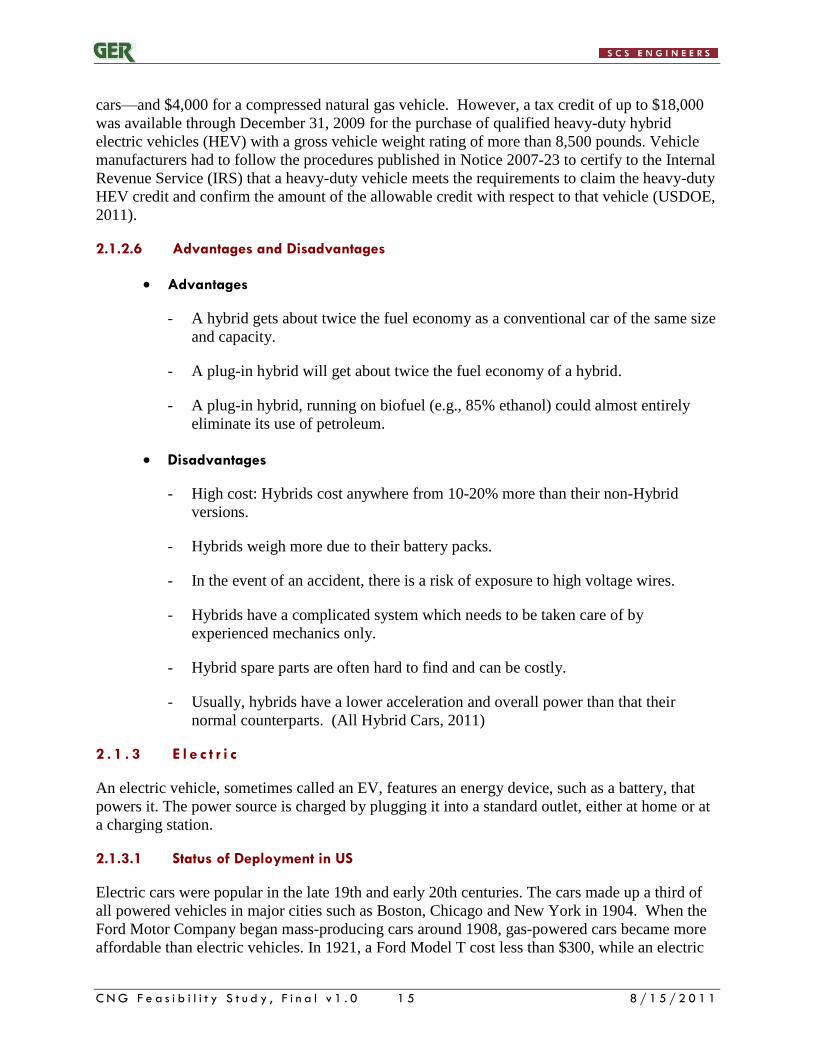
cars—and $4,000 for a compressed natural gas vehicle. However, a tax credit of up to $18,000
was available through December 31, 2009 for the purchase of qualified heavy-duty hybrid
electric vehicles (HEV) with a gross vehicle weight rating of more than 8,500 pounds. Vehicle
manufacturers had to follow the procedures published in Notice 2007-23 to certify to the Internal
Revenue Service (IRS) that a heavy-duty vehicle meets the requirements to claim the heavy-duty
HEV credit and confirm the amount of the allowable credit with respect to that vehicle (USDOE,
2011).
2.1.2.6 Advantages and Disadvantages
Advantages
- A hybrid gets about twice the fuel economy as a conventional car of the same size
and capacity.
- A plug-in hybrid will get about twice the fuel economy of a hybrid.
- A plug-in hybrid, running on biofuel (e.g., 85% ethanol) could almost entirely
eliminate its use of petroleum.
Disadvantages
- High cost: Hybrids cost anywhere from 10-20% more than their non-Hybrid
versions.
- Hybrids weigh more due to their battery packs.
- In the event of an accident, there is a risk of exposure to high voltage wires.
- Hybrids have a complicated system which needs to be taken care of by
experienced mechanics only.
- Hybrid spare parts are often hard to find and can be costly.
- Usually, hybrids have a lower acceleration and overall power than that their
normal counterparts. (All Hybrid Cars, 2011)
2 . 1 . 3 E l e c t r i c
An electric vehicle, sometimes called an EV, features an energy device, such as a battery, that
powers it. The power source is charged by plugging it into a standard outlet, either at home or at
a charging station.
2.1.3.1 Status of Deployment in US
Electric cars were popular in the late 19th and early 20th centuries. The cars made up a third of
all powered vehicles in major cities such as Boston, Chicago and New York in 1904. When the
Ford Motor Company began mass-producing cars around 1908, gas-powered cars became more
affordable than electric vehicles. In 1921, a Ford Model T cost less than $300, while an electric
C N G F e a s i b i l i t y S t u d y , F i n a l v 1 . 0 1 6 8 / 1 5 / 2 0 1 1
vehicle made by the Automatic Transmission Company cost $1,200, according to Michael H.
Westbrook, author of "The Electric Car: Development and Future of Battery, Hybrid and Fuel-
Cell Cars." By the mid-1920s, most manufacturers had stopped producing electric cars. The
electric car resurfaced in the 1960s because of concerns about pollution, Westbrook states. Major
American car manufacturers, such as General Motors and Ford, developed electric vehicles
during the decade. Because of the costs and other disadvantages when compared with gas-
powered vehicles, the electric car didn't make it into the mainstream. The United States
government, through state and federal laws, grants and initiatives, has been pushing for car
manufacturers and consumers to reconsider electric cars (Livestrong, 2010).
2.1.3.2 Types of Vehicles Typically in this Category
As of May 2010, most electric cars on the road are neighborhood electric vehicles, or NEVs, the
United States Department of Energy Alternative Fuels & Advanced Vehicles Data Center
reports. These vehicles can only be driven in areas with speed limits up to 35 miles per hour, and
are mainly used for short-distance travel. One highway-capable electric car is the Tesla
Roadster, which can travel more than 200 miles on a single charge, but costs more than
$100,000. In 2012, Tesla will produce a Model S, which seats seven and will cost about $50,000.
Ford, Toyota, General Motors, Nissan and Chrysler plan to produce electric cars in 2011 and
2012 (Livestrong, 2010).
2.1.3.3 Vehicle Charging Requirements/Types
Plug-in electric vehicles (PEVs) are powered by rechargeable onboard battery packs, which use
stored electricity to propel the vehicle. The battery packs can be charged from two types of
outlets: Level 1 (120 volts) and Level 2 (240 volts). The difference in voltage does not affect the
amount of energy stored in the battery, but the rate at which the battery is charged.
Level 1 charging is done using a standard 120-volt outlet, which is the most commonly found
outlet in a household. They supply alternating current (AC), which is used to power everything
from alarm clocks to desktop computers. PEVs may be plugged into a 120 volt outlet, providing
a convenient, "anytime, anywhere" power source. Depending on the battery size and how far the
vehicle was driven (e.g., how low the battery's charge is), Level 1 charging takes about 8 – 15
hours to fully charge the vehicle's battery. Level 1 charging requires a dedicated 15 or 20 Amp
outlet in the garage or other location where the vehicle will be charged.
Level 2 charging is done using a 240 volt circuit, much like that used for an electric dryer,
electric stove, or a central air conditioning system. Most garages don’t have a 240 volt circuit so
one would need to be installed to facilitate faster charging. The vehicle manufacturer may
specify what Electrical Vehicle Supply Equipment (EVSE) should be used with their vehicle
which will determine the exact equipment you should install. If the vehicle is kept outdoors,
special, weather-proof, equipment may be needed. Depending on the battery size and how far
the vehicle was driven, Level 2 charging takes between 3 and 8 hours to fully charge a battery, or
half the time of Level 1 charging (DTE Energy, 2011).
C N G F e a s i b i l i t y S t u d y , F i n a l v 1 . 0 1 7 8 / 1 5 / 2 0 1 1
2.1.3.4 Costs
Electric and many partial-electric cars generally remain priced outside the mainstream market,
with a price premium of at least several thousand dollars compared to a comparable ICE-driven
car. The all-electric Tesla Roadster, for example, starts at more than $100,000, while the
upcoming Tesla Model S sedan starts near $50,000. The upcoming partial-electric Chevrolet
Volt is projected to start near $40,000. Many ICE-powered sedans, by contrast, start just above
$10,000. The battery pack, like all batteries, loses capacity over time and needs eventual
replacement. Most hybrid vehicle batteries contain substantial amounts of rare earth elements
such as cerium and lanthanum, raising cost and adding supply uncertainty (Livestrong, 2010).
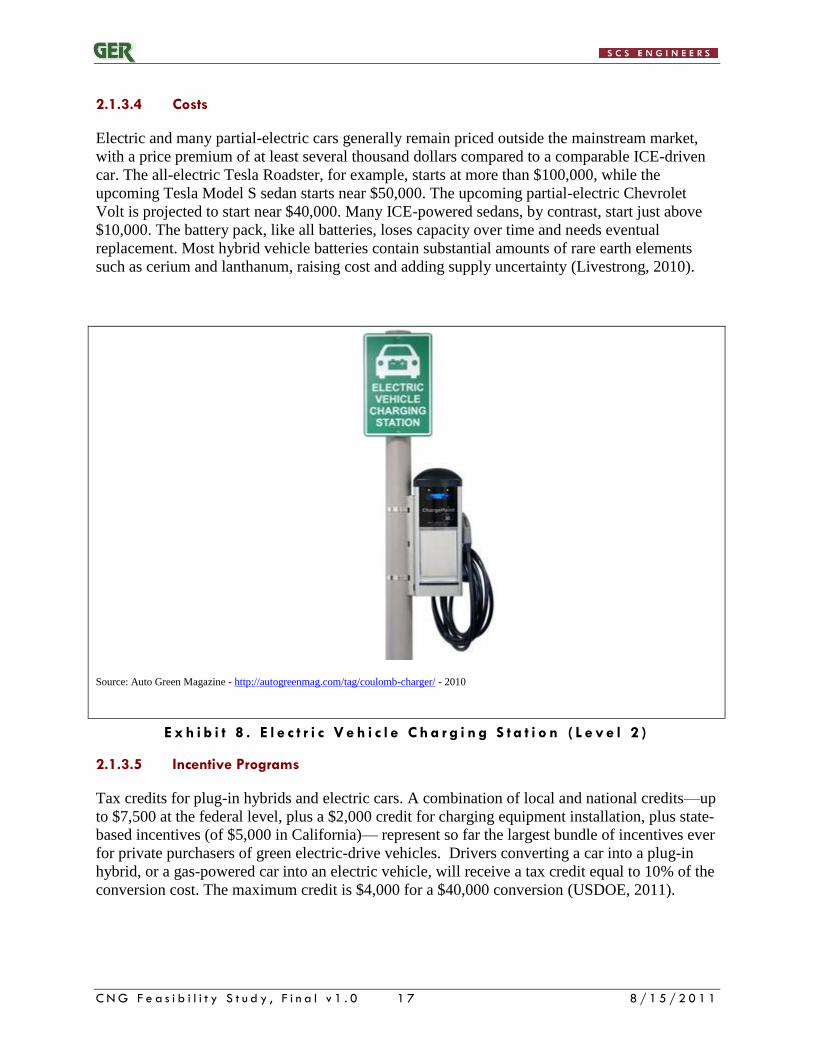
Source: Auto Green Magazine - http://autogreenmag.com/tag/coulomb-charger/ - 2010
E x h i b i t 8 . E l e c t r i c V e h i c l e C h a r g i n g S t a t i o n ( L e v e l 2 )
2.1.3.5 Incentive Programs
Tax credits for plug-in hybrids and electric cars. A combination of local and national credits—up
to $7,500 at the federal level, plus a $2,000 credit for charging equipment installation, plus state-
based incentives (of $5,000 in California)— represent so far the largest bundle of incentives ever
for private purchasers of green electric-drive vehicles. Drivers converting a car into a plug-in
hybrid, or a gas-powered car into an electric vehicle, will receive a tax credit equal to 10% of the
conversion cost. The maximum credit is $4,000 for a $40,000 conversion (USDOE, 2011).
C N G F e a s i b i l i t y S t u d y , F i n a l v 1 . 0 1 8 8 / 1 5 / 2 0 1 1
2.1.3.6 Advantages and Disadvantages
Advantages
- Energy efficient. Electric motors convert 75% of the chemical energy from the
batteries to power the wheels—ICEs only convert 20% of the energy stored in
gasoline.
- Environmentally friendly. EVs emit no tailpipe pollutants, although the power
plant producing the electricity may emit them. Electricity from nuclear-, hydro-,
solar-, or wind-powered plants causes no air pollutants.
- Performance benefits. Electric motors provide quiet, smooth operation and
stronger acceleration and require less maintenance than ICEs.
- Reduce energy dependence. Electricity is a domestic energy source. EVs face
significant battery-related challenges.
Disadvantages
- Driving range. Most EVs can only go about 100–200 miles before recharging—
gasoline vehicles can go over 300 miles before refueling.
- Recharge time. Fully recharging the battery pack can take 4 to 8 hours. Even a
"quick charge" to 80% capacity can take 30 min.
- Battery cost. The large battery packs are expensive and may need to be replaced
one or more times.
- Bulk & weight. Battery packs are heavy and take up considerable vehicle space
(US DOE, 2011).
2 . 2 S U R V EY OF U S ER S O F A L T ER NA T I V E FU E L V EH I C L ES
2 . 2 . 1 A g e n c i e s / C i t i e s / B u s i n e s s e s C o n t a c t e d
2.2.1.1 City of Richmond
Date of Meeting: February 3, 2011
Attendees:
Bob Gardner (SCS Engineers)
Diane Groom (SSC Engineers)
Nelson Adcock (GER)
Marvin Williams (Richmond Public Utilities)
Mike Kearns (Richmond Public Utilities)
C N G F e a s i b i l i t y S t u d y , F i n a l v 1 . 0 1 9 8 / 1 5 / 2 0 1 1
General Discussion/Notes from Meeting
16-18 CNG Refuse Trucks currently in Fleet, with 8 back-up diesel vehicles. The
City of Richmond also has a sub-contractor for additional rental refuse trucks in
emergency situations, which provides 100% redundancy.
Fuel Station was up and running during our visit- 12 pumps and 24 access lines –
Slow-fill only. Also, the City has 100% redundancy on compressor.
The City is looking into fast-fill fueling station, with option for public use. City
would like to distribute natural gas, but have a third party build and operate.
Possible fast-fill facility consideration for school buses & other vehicles – No set
plans.
The City developed the CNG project quickly. The Mayor asked for feasibility study
in Jan 2010, construction began in Feb 2010.
Vehicles are metered manually by driver. Example: Driver leaves with 3,000 psi,
drives, 52 miles, returns with 1800 psi. 1200 psi used - Therefore…refuse truck uses
23 psi/mile Driver logs this information and returns information to fueling facility.
20 psi delivery at meter. Trucks highest capacity is 3800 psi.
4-inch diameter service lines from Hopkins (plastic) – 8-inch diameter line at
Hopkins (Intermediate).
City procurement – Over $1.5 million. Does not include $450,000 for compressors.
Possibly $1.5 to $2.0 million when complete. (Trucks and fueling station
construction).
Richmond is its own gas utility, and serves several surrounding counties. Their
supplier is primarily Columbia Gas, with some from Virginia Natural Gas.
Transit Authority considered CNG at one time.
Richmond is not completely ruling out electric vehicles, as well.
Currently, refuse diesel trucks do not meet 2010 emission standards by a long shot.
Ford engines do, but must inject urea.
There is reportedly a public CNG station in Greenfield.
Advantages
$0.50/gallon tax credit through 2011.
Grants available, although difficult to process.
Significantly less GH emissions (~25%) & 50% reduction in NOx.
Significantly better gas mileage (~30%).(note: this differs from published data on fuel
efficiency as discussed in Section 2.1.1.10).
Significant price reduction in fuel costs – Currently CNG ~$2.50/gallon (plus
$0.50/gallon ―tax‖ incentive through 2011), as opposed to our fluctuating diesel
prices.
A significant supply of NG exists in the U.S., which can reduce dependency on
foreign oil.
Current fleet will pay for itself in 5-6 years according to City’s calculations.
McNeilus will allow trade in of current diesel trucks. Obviously, Richmond will not
want to trade in the diesel trucks that have been recently purchased.
McNeilus has a maintenance facility in Ashland, VA and is contracted to conduct
basically all maintenance on trucks, including hydraulics.
C N G F e a s i b i l i t y S t u d y , F i n a l v 1 . 0 2 0 8 / 1 5 / 2 0 1 1
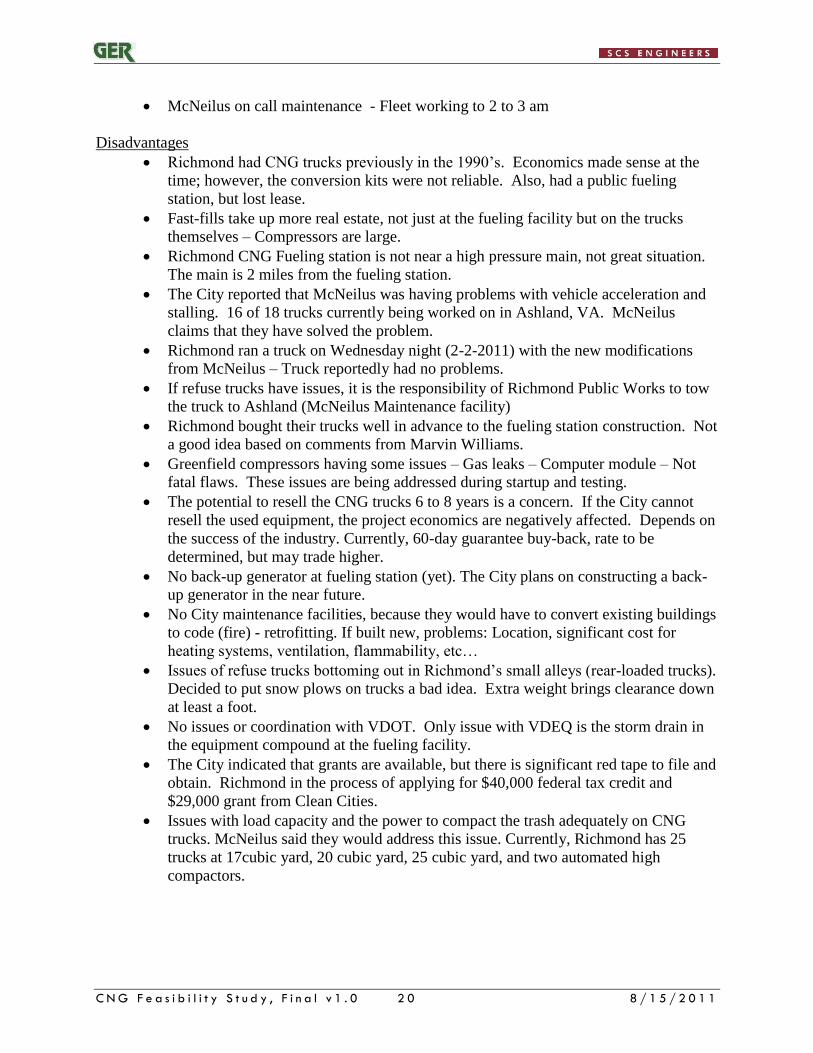
McNeilus on call maintenance - Fleet working to 2 to 3 am
Disadvantages
Richmond had CNG trucks previously in the 1990’s. Economics made sense at the
time; however, the conversion kits were not reliable. Also, had a public fueling
station, but lost lease.
Fast-fills take up more real estate, not just at the fueling facility but on the trucks
themselves – Compressors are large.
Richmond CNG Fueling station is not near a high pressure main, not great situation.
The main is 2 miles from the fueling station.
The City reported that McNeilus was having problems with vehicle acceleration and
stalling. 16 of 18 trucks currently being worked on in Ashland, VA. McNeilus
claims that they have solved the problem.
Richmond ran a truck on Wednesday night (2-2-2011) with the new modifications
from McNeilus – Truck reportedly had no problems.
If refuse trucks have issues, it is the responsibility of Richmond Public Works to tow
the truck to Ashland (McNeilus Maintenance facility)
Richmond bought their trucks well in advance to the fueling station construction. Not
a good idea based on comments from Marvin Williams.
Greenfield compressors having some issues – Gas leaks – Computer module – Not
fatal flaws. These issues are being addressed during startup and testing.
The potential to resell the CNG trucks 6 to 8 years is a concern. If the City cannot
resell the used equipment, the project economics are negatively affected. Depends on
the success of the industry. Currently, 60-day guarantee buy-back, rate to be
determined, but may trade higher.
No back-up generator at fueling station (yet). The City plans on constructing a back-
up generator in the near future.
No City maintenance facilities, because they would have to convert existing buildings
to code (fire) - retrofitting. If built new, problems: Location, significant cost for
heating systems, ventilation, flammability, etc…
Issues of refuse trucks bottoming out in Richmond’s small alleys (rear-loaded trucks).
Decided to put snow plows on trucks a bad idea. Extra weight brings clearance down
at least a foot.
No issues or coordination with VDOT. Only issue with VDEQ is the storm drain in
the equipment compound at the fueling facility.
The City indicated that grants are available, but there is significant red tape to file and
obtain. Richmond in the process of applying for $40,000 federal tax credit and
$29,000 grant from Clean Cities.
Issues with load capacity and the power to compact the trash adequately on CNG
trucks. McNeilus said they would address this issue. Currently, Richmond has 25
trucks at 17cubic yard, 20 cubic yard, 25 cubic yard, and two automated high
compactors.
C N G F e a s i b i l i t y S t u d y , F i n a l v 1 . 0 2 1 8 / 1 5 / 2 0 1 1
Follow-up with City of Richmond – June 15, 2011
SCS spoke with Marvin Williams from the City of Richmond Public Works on June 15, 2011, as
a follow-up to the initial meeting on February 3, 2011.
CNG Fueling Station
The City of Richmond decided to buy a used CNG compressor instead of a new
compressor, which resulted in an inappropriate methane mix and resulted in the CNG
gas being too rich.
The City is having some issues with the dispensers and nozzles. Mr. Williams stated
that on average 4 of the 25 dispensers are not working properly. All nozzles had to be
replaced, as leaks were occurring at the connection site between the nozzle and the
refuse truck.
The fueling station also was reported to have random leaks throughout the system in
equipment parts such as hoses and couplings.
The City of Richmond has only one maintenance contractor (Clean Energy), which
sometimes causes a lapse in productivity, as they are located in Washington DC. In
addition, waiting for replacement parts has caused downtime with the fueling station.
CNG Refuse Trucks
As of June 15, 2011, all 25 trucks have yet to be in service at the same time.
Mechanical issues with the CNG refuse trucks include problems with the engines, air
conditioning systems, electrical and hydraulic systems.
Mr. Williams stated that the City of Richmond has had communication issues
between Crane (Cab & Chassis) and McNeilus (Engine) and that the trucks
manufacturers have had quality control issues such as, doors not closing properly,
faulty axels, window leaks, and mechanical arm problems.
The trucks engines were all overheating so the City of Richmond dedicated a
technician solely to recalibrate each engine.
As the Richmond typically receives more snow than the Hampton Roads area,
Richmond decided to install snowplow adapters to the front of the trucks. As a result,
the trucks required the installation of lifts due to the extra weight of the snowplow
adapters. This, in turn, caused the CNG trucks to be too high to move underneath
power lines in some alleys in the city.
Mr. Williams stated that although they have had initial start-up problems, the new
CNG refuse trucks are averaging approximately 2-3 more tons of waste materials per
truck. Data on CNG refuse truck fuel mileage has not yet been determined.
2.2.1.2 City of Chesapeake
Date of Meeting: February 8, 2011
Attendees:
Bob Gardner (SCS Engineers)
Diane Groom (SCS Engineers)
George S. Hrichak (City of Chesapeake)

C N G F e a s i b i l i t y S t u d y , F i n a l v 1 . 0 2 2 8 / 1 5 / 2 0 1 1
Meeting Notes
Mr. Krichak believes that CNG is more cost effective for the government, considering the
overall stability of projected natural gas prices over the last decade. According to Mr.
Hrichak, CNG is currently ~ $0.77/gallon minus $0.50/gallon tax credit = $0.27/gallon
The City of Chesapeake has completed a cost analysis for transitioning refuse trucks from
diesel to CNG. The analysis is being verified by the National Renewable Energies Lab
(Division of the Department of Energy). The analysis report should be back before the
end of February.
Mr. Hrichak stated that the City should see a return on their investment in 7 years.
The City currently has 53 refuse trucks in their fleet. Chesapeake’s transition includes
replacing 6 solid waste trucks per year.
The CNG fueling station would be located at their current waste facility at 956
Greenbrier Parkway, Chesapeake. It will have slow-fill for solid waste trucks and fast-
fill for the public and other city vehicles. Mr. Hrichak does not believe that congestion at
the fueling station will be a problem.
According to Mr. Hrichak, the estimated cost of the fueling station would be in the
neighborhood of $500,000. (Note: Based on our research up to this point, this number
seems to be fairly low)
The City of Chesapeake City Garage/Fleet Management has unfunded fleet
reimbursement. All purchases are cash, no lease purchases.
Mr. Hrichak emphasized the importance of having a Fleet Defect Clause with the
manufacturer.
The CNG truck maintenance will be performed in Chesapeake at the current facility. The
City will convert their current structures to meet applicable fire codes.
Mr. Hrichak stated that the grant process was not worth the effort. A lot of red tape for
very little return. He suggested getting a sponsor such as Virginia Clean Cities to help
with the grant paperwork, if we decided to go that route.
Chesapeake proposes to use Virginia Natural Gas (VNG) and tap into the main which
runs just behind the fueling station.
The fuel station construction is being bid out.
According to Mr. Hrichak, the City Council is in support of the CNG transition.
We asked about the proposed stages of development for the fueling station. Mr. Hrichak
replied that the % of slow-fill vs. fast-fill pumps will be left up to the design engineers.
What is the current capacity of Chesapeake’s refuse trucks? 32 cubic yards/truck
The transition of Chesapeake’s school bus fleet is not currently being considered, as the
many of the bus drivers take the buses home with them. Only a fast-fill fueling situation
would be practical for the school buses. Too complicated right now.
Mr. Hrichak also brought up operator savings. With slow-fill the operator would just
attach the nozzle to the vehicle and leave. No standing around (wasting time and money)
waiting for the trucks to fill up with diesel.
What maintenance costs might increase? The CNG tanks would require regular
inspections, but basically the maintenance cost (i.e. engine maintenance, hydraulics, etc.)
would be comparable.
C N G F e a s i b i l i t y S t u d y , F i n a l v 1 . 0 2 3 8 / 1 5 / 2 0 1 1
8/4/2011 Update Presentation to City Joint Energy Committee
SCS and GER attended the City of Virginia Beach’s Joint Energy Commission meeting on
8/24/2011. Chesapeake’s Fleet Manager, George Hrichak, made a presentation explaining the
recent decision by the City of Chesapeake to transition its refuse collection fleet to CNG fuel
vehicles. He indicated that he hopes to purchase six vehicles a year to replace his aging diesel
fleet. Mr. Hrichak indicated he had been working on this initiative for the past seven years. He
stated that an engineering feasibility study was conducted for the City of Chesapeake by the
National Renewable Energy Laboratory (NREL, 2011). The feasibility study indicated that the
payback period for the project was 4.1 years. Reduced fuel costs were one of the major reasons
cited for the City’s decision to make the transition to CNG vehicles. However, the feasibility
study conducted by NREL did not consider increased maintenance costs for CNG vehicles, the
cost for retrofitting the City’s maintenance facilities for CNG vehicles, and estimated only a
$15,000 per vehicle premium on the purchase of new CNG vehicles compared to equivalent
diesel vehicles, which is less that the reported purchase premium cited in this report. Mr.
Hrichak also noted that Tidewater Fiber Corporation (TFC) has also recently made the decision
to purchase CNG vehicles, and the City and TFC plan to cooperate on the construction of a
commercial fueling station that will service both the City’s and TFC’s fleet. Only the executive
summary of the report was provided for SCS/GER to review, although the full report, including
the detailed economic analysis has been requested.
2.2.1.3 HRT
Attendees:
Bob Gardner (SCS Engineers)
Keith Matteson (SCS Engineers)
Sybil Papas (HRT)
Date of Meeting: May 2011
Discussion Notes:
HRT operates diesel and hybrid buses in its fleet.
Ms. Papas indicated that she is considering evaluation of other alternative such as
CNG in the future; however, they are fairly constrained from a real estate perspective
for development of a fueling station and staging area.
HRT is completing the construction of a new vehicle maintenance facility. Ms. Papas
indicated that she felt it probably would not be difficult to retrofit for maintenance of
CNG vehicles if in the future HRT purchases CNG vehicles.
The location and availability of reliable and accessible fueling facilities would be
critical to the HRT.
2.2.1.4 City of Smithtown, New York
Russell K. Barnett, Director
Department of Environment & Waterways
124 West Main Street
C N G F e a s i b i l i t y S t u d y , F i n a l v 1 . 0 2 4 8 / 1 5 / 2 0 1 1
Smithtown, NY 11787
631-360-7514 [email protected]
Area: 56 Sq. miles
Population: 116,000
Households: 36,000
2001-2006 Contract Refuse Diesel Fleet
Average Age = 15 years
Average Price of Diesel in 2008 = ~$4.75/gallon
Reasons for Increased Interest:
Reduced risk due to natural gas fuel price stability
Even playing field for all vendors, due to the universal need for new equipment
Desire not to be left behind by changing technology
Cleaner – Less Emissions
Free publicity and possible new business
CNG Refuse Vehicle Type:
CNG fueled Autocar Xpeditor, Cummins Westport l Gas Plus Engine, FAB Industries
Fuel System – Roof Mounted
CNG fueled Crane Carrier LET2 with Cummins L Gas Plus Engine. Dynetek Industries
Fuel System – Pedestal Mounted
CNG Fueling Station Type:
Clean Energy Public Access CNG Motor Vehicle Fueling Station – Hauppauge, New
York – (2) 2,000 SCFM (1,000 GGE/Hr Capacity) ANGI International Compressors
Other Smithtown CNG Vehicles:
John Deer Freightliner M2 Dump/Plows
Honda Civic GX Sedans
Schwarze M6000 Street Sweeper
Cummins Westport ISLG Powered Freightliner M2 Dump/Plows
ESI Phoenix Repowered International Dump/Plows
2.2.1.5 Lake Jackson, Texas
Craig Nisbett, Director of Public Works
101 Canna Lane
Lake Jackson, TX 77566
979-415-2430 [email protected]
Area: 19 square miles
Population: 27,000
Fleet: 14 CNG Heavy Duty Trucks
Maintenance: In-House
C N G F e a s i b i l i t y S t u d y , F i n a l v 1 . 0 2 5 8 / 1 5 / 2 0 1 1
Decision to go CNG was primarily driven by Clean Air-Low Emissions, not money. At the time,
cities all over Harris County and surrounding counties were being urged to adopt programs to
relieve pollution, because the area did not meet federal pollution guidelines.
Initial Costs:
$250,000 for fueling station (2003) and another $200,000 in 2008 to upgrade
Refuse trucks $50,000 more per vehicle
Completed On-Site Station w/ Timed and Quick-Fill in July 2003
Light Duty vehicles use Quick-Fill
CNG Refuse Vehicle Type:
8 Residential Rear Loaders, Autocar with Cummins Engine – Crane Carrier with John
Deere
4 Commercial Side Load
2 Commercial Roll-Off
Challenges:
Equipment Availability
Fueling Infrastructure
Stations costly to build
Vehicles cost more
On-Board Fuel Storage
Vehicles have less range
Opportunities:
Lower Fuel Cost
Grant Funding for Incremental Cost/Tax Incentives
Operator and Citizen Satisfaction
Other Fort Jackson CNG Vehicles
14 Pick-ups – Ford F150, 7700 Series, 5.4 Liter Dedicated (No longer offered)
5 Honda Civics
Daewoo Forklift
2 . 3 2 0 1 1 F ED ER A L I N I T I A T I V E F OR FU E L E F F I C I E NC Y
In early August 2011, President Obama announced the first of their kind fuel efficiency and
greenhouse gas pollution standards for work trucks, buses, and other heavy duty vehicles. The
U.S. Department of Transportation (DOT) and the Environmental Protection Agency (EPA)
developed the standards in close coordination with the trucking industry. The joint DOT/EPA
program will include a range of targets which are specific to the diverse vehicle types and
purposes. Vehicles are divided into three major categories: combination tractors (semi-trucks),
heavy-duty pickup trucks and vans, and vocational vehicles (like transit buses and refuse trucks).
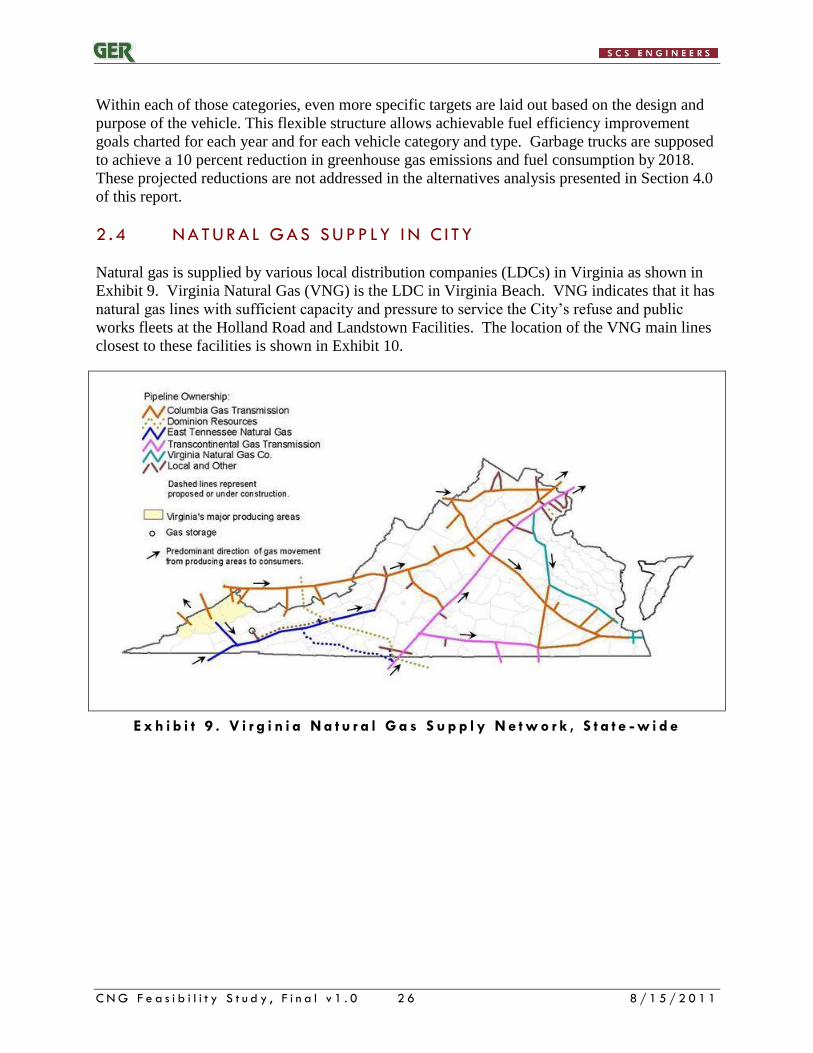
C N G F e a s i b i l i t y S t u d y , F i n a l v 1 . 0 2 6 8 / 1 5 / 2 0 1 1
Within each of those categories, even more specific targets are laid out based on the design and
purpose of the vehicle. This flexible structure allows achievable fuel efficiency improvement
goals charted for each year and for each vehicle category and type. Garbage trucks are supposed
to achieve a 10 percent reduction in greenhouse gas emissions and fuel consumption by 2018.
These projected reductions are not addressed in the alternatives analysis presented in Section 4.0
of this report.
2 . 4 N A T U R A L GA S S U P P LY I N C I TY
Natural gas is supplied by various local distribution companies (LDCs) in Virginia as shown in
Exhibit 9. Virginia Natural Gas (VNG) is the LDC in Virginia Beach. VNG indicates that it has
natural gas lines with sufficient capacity and pressure to service the City’s refuse and public
works fleets at the Holland Road and Landstown Facilities. The location of the VNG main lines
closest to these facilities is shown in Exhibit 10.
E x h i b i t 9 . V i r g i n i a N a t u r a l G a s S u p p l y N e t w o r k , S t a t e - w i d e
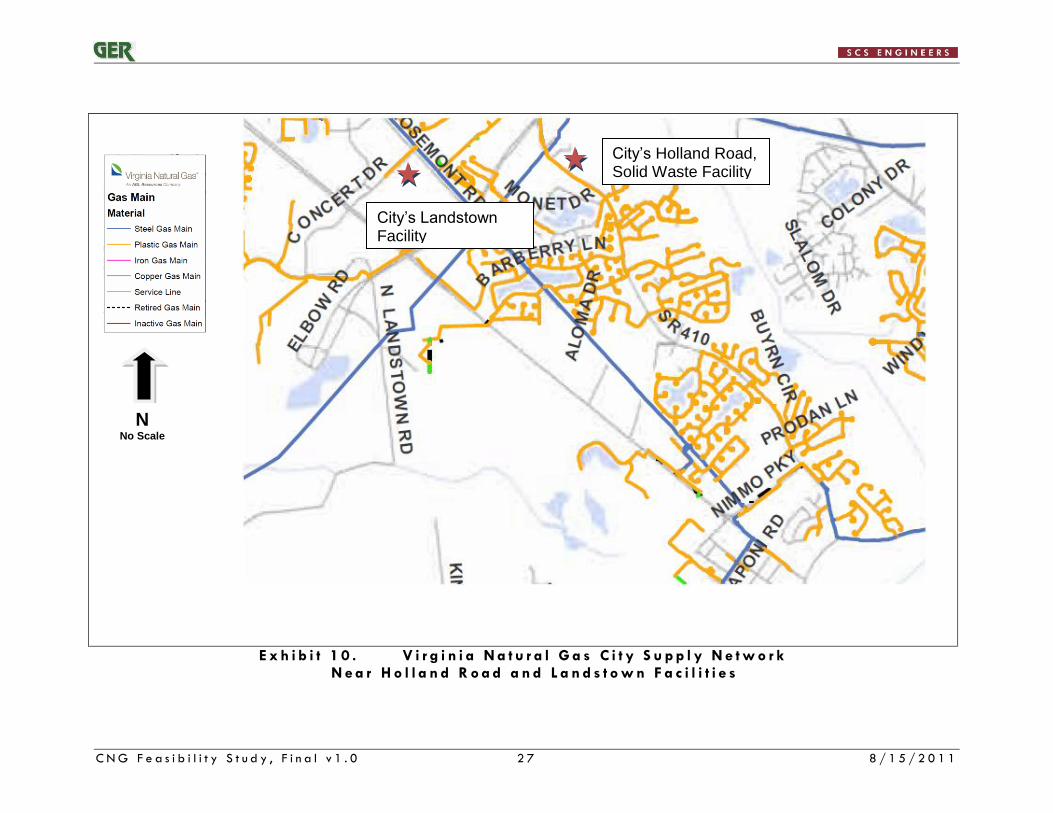
C N G F e a s i b i l i t y S t u d y , F i n a l v 1 . 0 2 7 8 / 1 5 / 2 0 1 1
E x h i b i t 1 0 . V i r g i n i a N a t u r a l G a s C i t y S u p p l y N e t w o r k N e a r H o l l a n d R o a d a n d L a n d s t o w n F a c i l i t i e s
N No Scale
City’s Holland Road, Solid Waste Facility
City’s Landstown Facility
C N G F e a s i b i l i t y S t u d y , F i n a l v 1 . 0 2 8 8 / 1 5 / 2 0 1 1
3 .0 C ITY OF V IRG IN IA BEACH F LEET MANAGEMENT
3 . 1 F L E E T MA NA GEM E N T
The Department of Public Works Fleet Management is responsible for management of over
3,600 major pieces of equipment for the following City fleet assets.
Police Vehicles
Fire and Rescue Apparatus
Refuse Collection Trucks
Beach Cleaners/Sewer Cleaners/Street Sweepers
Construction Equipment (Dump Trucks, Bulldozers, etc.)
Roadway Equipment (Asphalt Pavers, etc.)
Traffic Message Boards/Arrow Boards
Bookmobile
Lawn Equipment
Aviation Equipment
Marine Equipment
Generators (stationary and portable)
Pumps
Fleet Management acquires, maintains, fuels, repairs, and disposes of the fleet.
A brief description of Solid Waste and Public Works fleets and associated fueling facilities is
provided below.
Solid Waste Department. The City’s solid waste collection vehicles are parked and maintained
at its Holland Road Facility (See Exhibit 11). The City services 123,600 municipal solid waste
(MSW) residential customers which average a total of 6.4 million collections per year (152,000
tons/year) (Briefing to City Council, 1/25/2011). The City provides MSW collection service
Tuesdays through Fridays which includes thirty-eight (38) routes per day using 42 full-time
employees. The City owns, operates, and maintains a fleet of approximately 100 refuse
collection vehicles (rear loading, side loading, and grapple trucks for bulky waste) ranging in
capacity from 18 to 29 cubic yards. MSW collection and disposal costs average $14.8 million
per year which breaks down into $104.00 per ton ($39.00 collection/$65.00 disposal). The
average collection truck runs about 127 miles per day. Their tank size allows the trucks to run
1.25 days between fill-ups. The City indicates that its collection vehicles consume
approximately 70 gallons of diesel between fills. Routine and major maintenance is provided at
the Holland Road Facility. The Holland Road Facility does not have any fueling operations.
Refuse vehicles are fueled at the fueling facility at the Public Works Facility off Dam Neck
Road.
Public Works Department (Landstown Facility). The City’s Public Works Department parks
and maintains its light and heavy duty trucks and equipment that are used to maintain roads and
other public works facilities at the Landstown Facility, which is located directly across from the
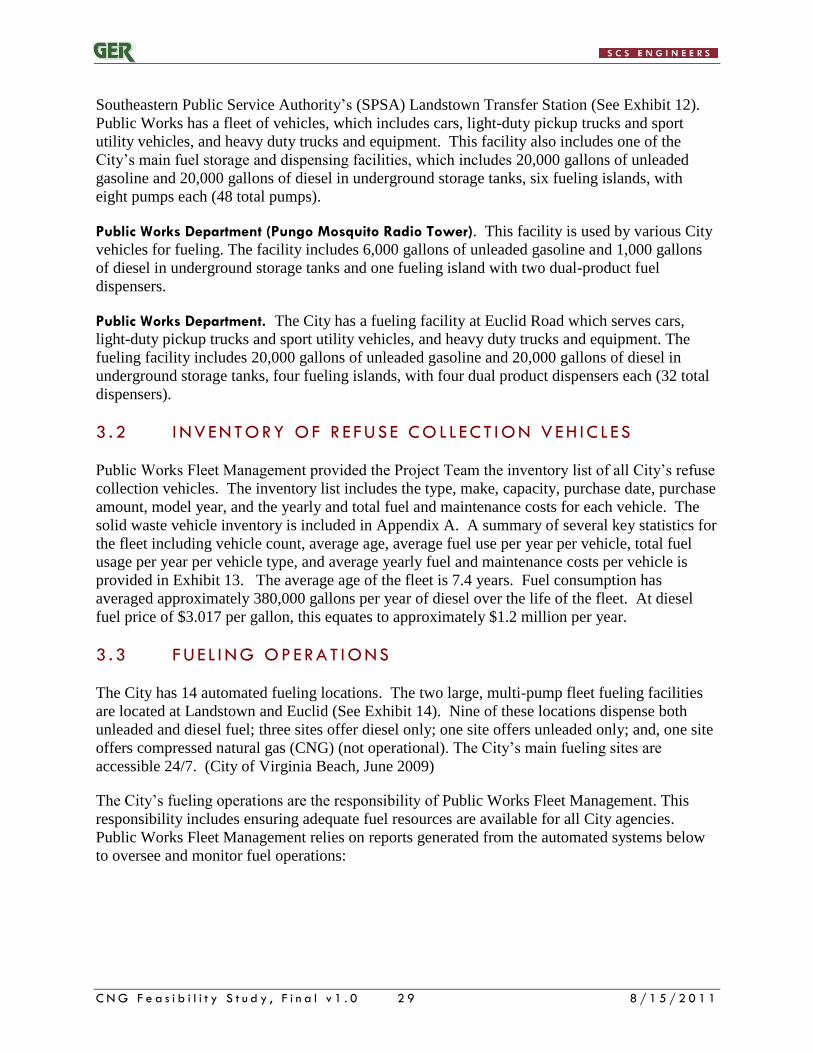
C N G F e a s i b i l i t y S t u d y , F i n a l v 1 . 0 2 9 8 / 1 5 / 2 0 1 1
Southeastern Public Service Authority’s (SPSA) Landstown Transfer Station (See Exhibit 12).
Public Works has a fleet of vehicles, which includes cars, light-duty pickup trucks and sport
utility vehicles, and heavy duty trucks and equipment. This facility also includes one of the
City’s main fuel storage and dispensing facilities, which includes 20,000 gallons of unleaded
gasoline and 20,000 gallons of diesel in underground storage tanks, six fueling islands, with
eight pumps each (48 total pumps).
Public Works Department (Pungo Mosquito Radio Tower). This facility is used by various City
vehicles for fueling. The facility includes 6,000 gallons of unleaded gasoline and 1,000 gallons
of diesel in underground storage tanks and one fueling island with two dual-product fuel
dispensers.
Public Works Department. The City has a fueling facility at Euclid Road which serves cars,
light-duty pickup trucks and sport utility vehicles, and heavy duty trucks and equipment. The
fueling facility includes 20,000 gallons of unleaded gasoline and 20,000 gallons of diesel in
underground storage tanks, four fueling islands, with four dual product dispensers each (32 total
dispensers).
3 . 2 I NV EN T OR Y O F R E FU S E C O L L EC T I ON V EH I C L ES
Public Works Fleet Management provided the Project Team the inventory list of all City’s refuse
collection vehicles. The inventory list includes the type, make, capacity, purchase date, purchase
amount, model year, and the yearly and total fuel and maintenance costs for each vehicle. The
solid waste vehicle inventory is included in Appendix A. A summary of several key statistics for
the fleet including vehicle count, average age, average fuel use per year per vehicle, total fuel
usage per year per vehicle type, and average yearly fuel and maintenance costs per vehicle is
provided in Exhibit 13. The average age of the fleet is 7.4 years. Fuel consumption has
averaged approximately 380,000 gallons per year of diesel over the life of the fleet. At diesel
fuel price of $3.017 per gallon, this equates to approximately $1.2 million per year.
3 . 3 F U E L I N G OP ER A T I ONS
The City has 14 automated fueling locations. The two large, multi-pump fleet fueling facilities
are located at Landstown and Euclid (See Exhibit 14). Nine of these locations dispense both
unleaded and diesel fuel; three sites offer diesel only; one site offers unleaded only; and, one site
offers compressed natural gas (CNG) (not operational). The City’s main fueling sites are
accessible 24/7. (City of Virginia Beach, June 2009)
The City’s fueling operations are the responsibility of Public Works Fleet Management. This
responsibility includes ensuring adequate fuel resources are available for all City agencies.
Public Works Fleet Management relies on reports generated from the automated systems below
to oversee and monitor fuel operations:

C N G F e a s i b i l i t y S t u d y , F i n a l v 1 . 0 3 0 8 / 1 5 / 2 0 1 1
E x h i b i t 1 1 . V i r g i n i a B e a c h H o l l a n d R o a d S o l i d W a s t e M a n a g e m e n t F a c i l i t y
Refuse Vehicle
Parking Area
Ops Support
And Admin Bldgs
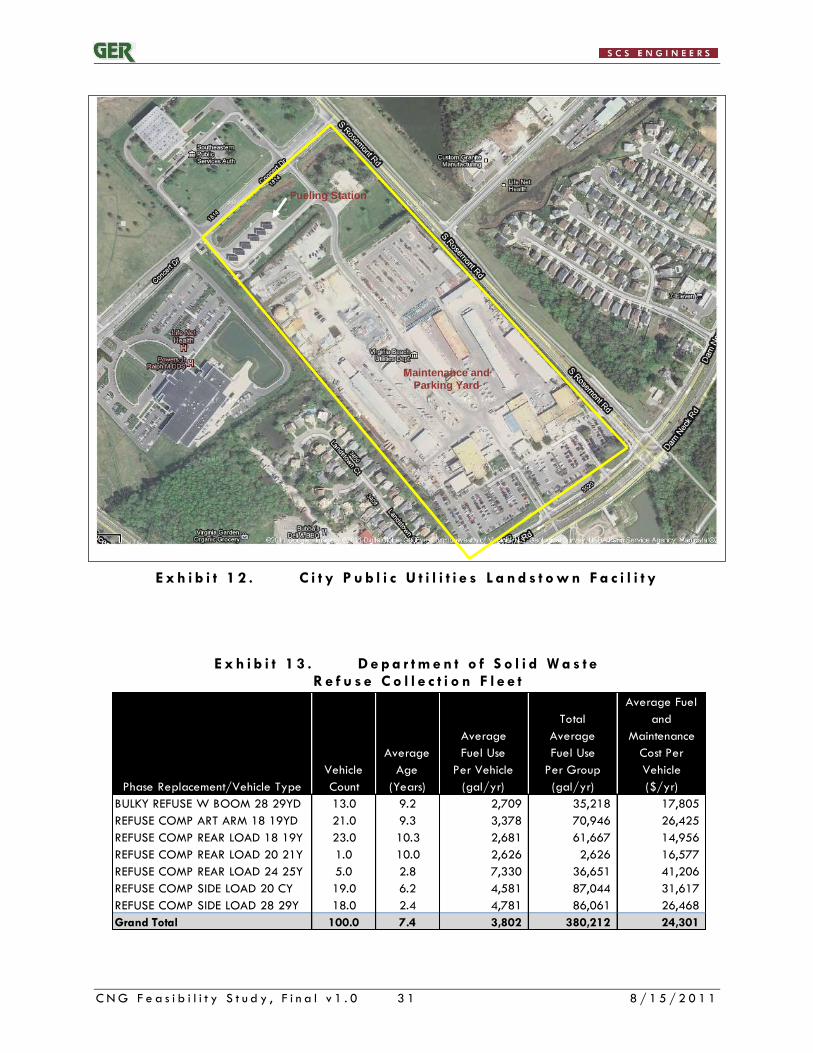
C N G F e a s i b i l i t y S t u d y , F i n a l v 1 . 0 3 1 8 / 1 5 / 2 0 1 1
E x h i b i t 1 2 . C i t y P u b l i c U t i l i t i e s L a n d s t o w n F a c i l i t y
E x h i b i t 1 3 . D e p a r t m e n t o f S o l i d W a s t e R e f u s e C o l l e c t i o n F l e e t
Phase Replacement/Vehicle Type
Vehicle
Count
Average
Age
(Years)
Average
Fuel Use
Per Vehicle
(gal/yr)
Total
Average
Fuel Use
Per Group
(gal/yr)
Average Fuel
and
Maintenance
Cost Per
Vehicle
($/yr)
BULKY REFUSE W BOOM 28 29YD 13.0 9.2 2,709 35,218 17,805
REFUSE COMP ART ARM 18 19YD 21.0 9.3 3,378 70,946 26,425
REFUSE COMP REAR LOAD 18 19Y 23.0 10.3 2,681 61,667 14,956
REFUSE COMP REAR LOAD 20 21Y 1.0 10.0 2,626 2,626 16,577
REFUSE COMP REAR LOAD 24 25Y 5.0 2.8 7,330 36,651 41,206
REFUSE COMP SIDE LOAD 20 CY 19.0 6.2 4,581 87,044 31,617
REFUSE COMP SIDE LOAD 28 29Y 18.0 2.4 4,781 86,061 26,468
Grand Total 100.0 7.4 3,802 380,212 24,301
Fueling Station
Maintenance and
Parking Yard
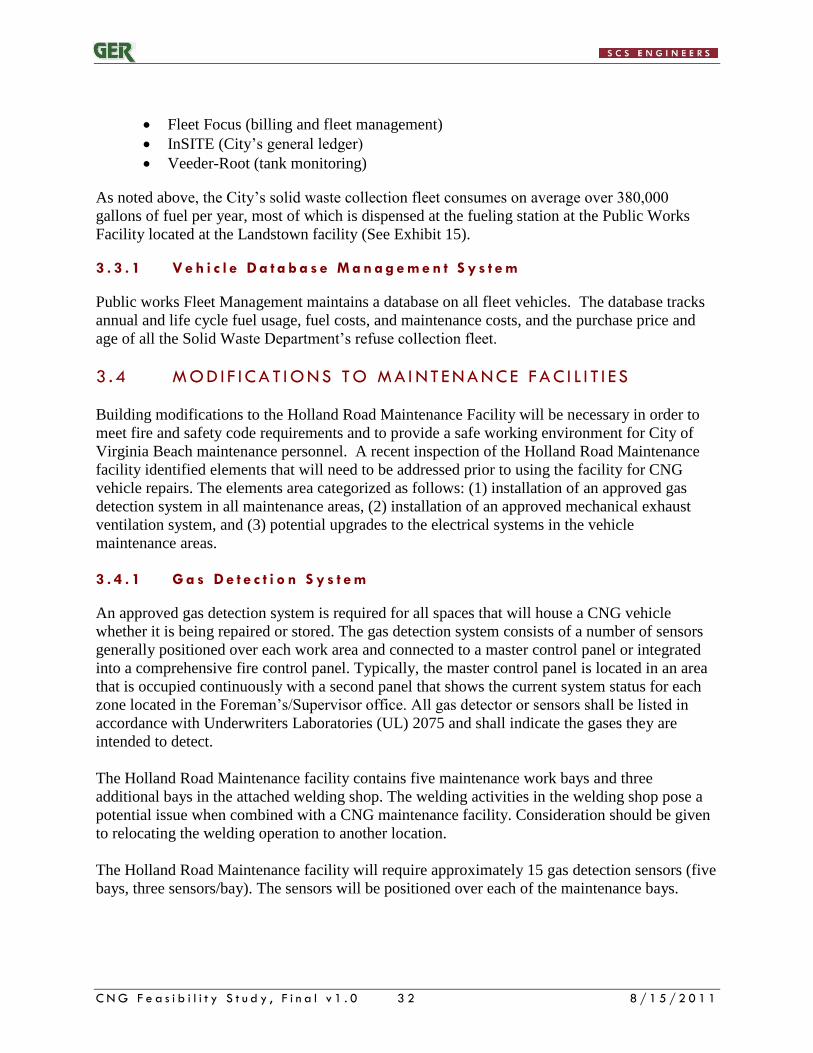
C N G F e a s i b i l i t y S t u d y , F i n a l v 1 . 0 3 2 8 / 1 5 / 2 0 1 1
Fleet Focus (billing and fleet management)
InSITE (City’s general ledger)
Veeder-Root (tank monitoring)
As noted above, the City’s solid waste collection fleet consumes on average over 380,000
gallons of fuel per year, most of which is dispensed at the fueling station at the Public Works
Facility located at the Landstown facility (See Exhibit 15).
3 . 3 . 1 V e h i c l e D a t a b a s e M a n a g e m e n t S y s t e m
Public works Fleet Management maintains a database on all fleet vehicles. The database tracks
annual and life cycle fuel usage, fuel costs, and maintenance costs, and the purchase price and
age of all the Solid Waste Department’s refuse collection fleet.
3 . 4 M OD I F I C A T I ONS T O MA I NT E NA NC E FA C I L I T I E S
Building modifications to the Holland Road Maintenance Facility will be necessary in order to
meet fire and safety code requirements and to provide a safe working environment for City of
Virginia Beach maintenance personnel. A recent inspection of the Holland Road Maintenance
facility identified elements that will need to be addressed prior to using the facility for CNG
vehicle repairs. The elements area categorized as follows: (1) installation of an approved gas
detection system in all maintenance areas, (2) installation of an approved mechanical exhaust
ventilation system, and (3) potential upgrades to the electrical systems in the vehicle
maintenance areas.
3 . 4 . 1 G a s D e t e c t i o n S y s t e m
An approved gas detection system is required for all spaces that will house a CNG vehicle
whether it is being repaired or stored. The gas detection system consists of a number of sensors
generally positioned over each work area and connected to a master control panel or integrated
into a comprehensive fire control panel. Typically, the master control panel is located in an area
that is occupied continuously with a second panel that shows the current system status for each
zone located in the Foreman’s/Supervisor office. All gas detector or sensors shall be listed in
accordance with Underwriters Laboratories (UL) 2075 and shall indicate the gases they are
intended to detect.
The Holland Road Maintenance facility contains five maintenance work bays and three
additional bays in the attached welding shop. The welding activities in the welding shop pose a
potential issue when combined with a CNG maintenance facility. Consideration should be given
to relocating the welding operation to another location.
The Holland Road Maintenance facility will require approximately 15 gas detection sensors (five
bays, three sensors/bay). The sensors will be positioned over each of the maintenance bays.
C N G F e a s i b i l i t y S t u d y , F i n a l v 1 . 0 3 3 8 / 1 5 / 2 0 1 1
E x h i b i t 1 4 . L o c a t i o n o f C i t y ’ s F u e l i n g F a c i l i t i e s
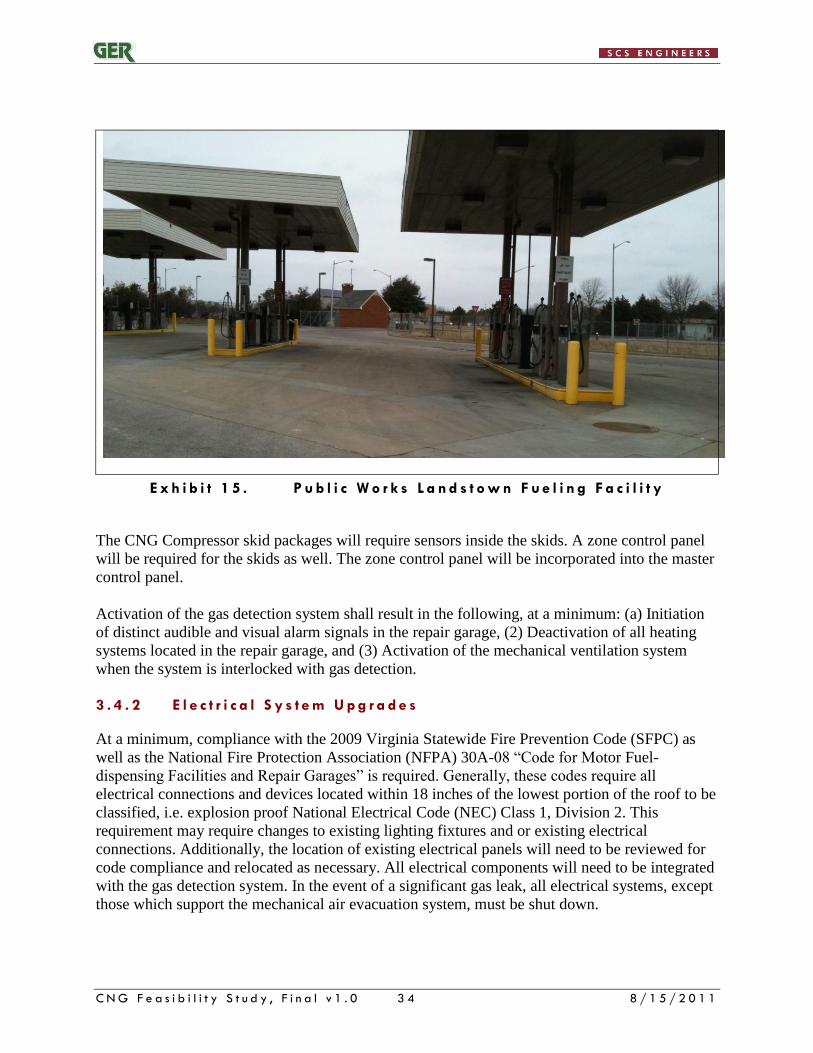
C N G F e a s i b i l i t y S t u d y , F i n a l v 1 . 0 3 4 8 / 1 5 / 2 0 1 1
E x h i b i t 1 5 . P u b l i c W o r k s L a n d s t o w n F u e l i n g F a c i l i t y
The CNG Compressor skid packages will require sensors inside the skids. A zone control panel
will be required for the skids as well. The zone control panel will be incorporated into the master
control panel.
Activation of the gas detection system shall result in the following, at a minimum: (a) Initiation
of distinct audible and visual alarm signals in the repair garage, (2) Deactivation of all heating
systems located in the repair garage, and (3) Activation of the mechanical ventilation system
when the system is interlocked with gas detection.
3 . 4 . 2 E l e c t r i c a l S y s t e m U p g r a d e s
At a minimum, compliance with the 2009 Virginia Statewide Fire Prevention Code (SFPC) as
well as the National Fire Protection Association (NFPA) 30A-08 ―Code for Motor Fuel-
dispensing Facilities and Repair Garages‖ is required. Generally, these codes require all
electrical connections and devices located within 18 inches of the lowest portion of the roof to be
classified, i.e. explosion proof National Electrical Code (NEC) Class 1, Division 2. This
requirement may require changes to existing lighting fixtures and or existing electrical
connections. Additionally, the location of existing electrical panels will need to be reviewed for
code compliance and relocated as necessary. All electrical components will need to be integrated
with the gas detection system. In the event of a significant gas leak, all electrical systems, except
those which support the mechanical air evacuation system, must be shut down.
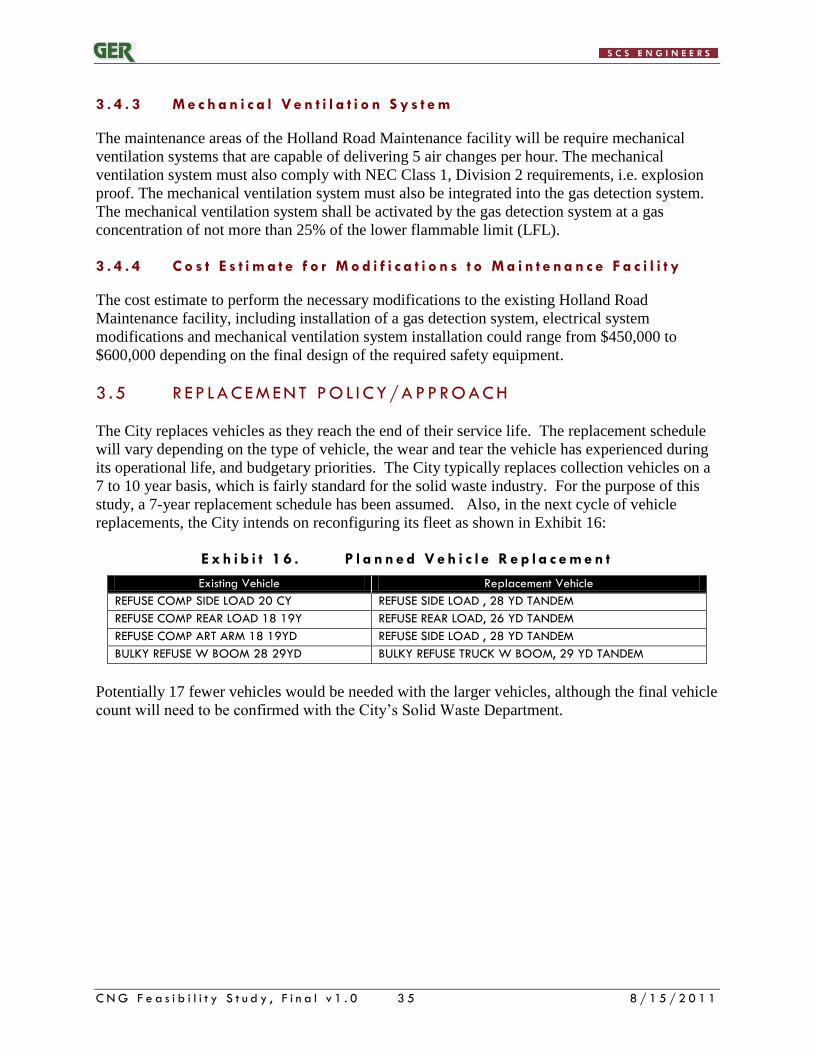
C N G F e a s i b i l i t y S t u d y , F i n a l v 1 . 0 3 5 8 / 1 5 / 2 0 1 1
3 . 4 . 3 M e c h a n i c a l V e n t i l a t i o n S y s t e m
The maintenance areas of the Holland Road Maintenance facility will be require mechanical
ventilation systems that are capable of delivering 5 air changes per hour. The mechanical
ventilation system must also comply with NEC Class 1, Division 2 requirements, i.e. explosion
proof. The mechanical ventilation system must also be integrated into the gas detection system.
The mechanical ventilation system shall be activated by the gas detection system at a gas
concentration of not more than 25% of the lower flammable limit (LFL).
3 . 4 . 4 C o s t E s t i m a t e f o r M o d i f i c a t i o n s t o M a i n t e n a n c e F a c i l i t y
The cost estimate to perform the necessary modifications to the existing Holland Road
Maintenance facility, including installation of a gas detection system, electrical system
modifications and mechanical ventilation system installation could range from $450,000 to
$600,000 depending on the final design of the required safety equipment.
3 . 5 R EP LA C E M EN T P O L I C Y / A P P R O A C H
The City replaces vehicles as they reach the end of their service life. The replacement schedule
will vary depending on the type of vehicle, the wear and tear the vehicle has experienced during
its operational life, and budgetary priorities. The City typically replaces collection vehicles on a
7 to 10 year basis, which is fairly standard for the solid waste industry. For the purpose of this
study, a 7-year replacement schedule has been assumed. Also, in the next cycle of vehicle
replacements, the City intends on reconfiguring its fleet as shown in Exhibit 16:
E x h i b i t 1 6 . P l a n n e d V e h i c l e R e p l a c e m e n t
Existing Vehicle Replacement Vehicle
REFUSE COMP SIDE LOAD 20 CY REFUSE SIDE LOAD , 28 YD TANDEM
REFUSE COMP REAR LOAD 18 19Y REFUSE REAR LOAD, 26 YD TANDEM
REFUSE COMP ART ARM 18 19YD REFUSE SIDE LOAD , 28 YD TANDEM
BULKY REFUSE W BOOM 28 29YD BULKY REFUSE TRUCK W BOOM, 29 YD TANDEM
Potentially 17 fewer vehicles would be needed with the larger vehicles, although the final vehicle
count will need to be confirmed with the City’s Solid Waste Department.
C N G F e a s i b i l i t y S t u d y , F i n a l v 1 . 0 3 6 8 / 1 5 / 2 0 1 1
4 .0 EVALUAT ION OF CNG CONVERS ION FOR C I TY ’ S SOL ID WASTE COLLECT I ON FLEET
The primary objective of this study is to assess the feasibility of replacing the City’s existing
diesel-fuel refuse collection vehicles with CNG-fuel vehicles when new vehicles are purchased.
The general conclusions from this analysis may be applicable to the City’s other fleet vehicles.
The state of the technology and general advantages and disadvantages of CNG vehicles
compared to diesel vehicles (as well as other alternative fuel technologies) is presented in
Section 2.0. This section (Section 4.0) presents the scenarios that have been developed and
evaluated specific to the City’s phasing in CNG-fuel solid waste collection vehicles as new
vehicles are purchased.
A pro forma model was developed to estimate the annual capital and operational costs for each
scenario. A life-cycle, net present value cost approach is used to compare the financial
performance of each scenario over time. The scenario with the lowest net present value is
theoretically the most cost-effective. A period of 2011 through 2024 was selected for the
evaluation because it allows for a complete cycle of fleet replacement.
4 . 1 S C EN A R I OS A ND A S S U MP T I ONS
For the purpose of evaluating the economic feasibility of transitioning the City’s refuse
collection fleet to CNG vehicles, a time fill/quick fill station configuration was compared against
the status quo of maintaining and operating a diesel fuel only fleet for the following scenarios:
Diesel Only Operation (status quo), with fuel escalation rates of 3%, 5%, and 7%
Base Case, CNG. The base scenario assumptions and the key variables are listed
below:
- Fuel escalators (Diesel/CNG): 3%/3%, 5%/3%, 7%/2%
- Maintenance Factor: 15%
- CNG Purchase Premium: 20%
- CNG Fuel Efficiency Penalty: 13%
- Target Vehicle Replacement Age: 7 years
- Beginning Diesel Fuel Price: $3.017/gallon
- Beginning CNG Fuel Price: $6.64/MMBtu ($0.86/DGE)
Best Case, CNG. The ―best case‖ scenario assumes a lower CNG purchase premium
factor (15%), maintenance factor (10%), and fuel efficiency penalty factor (9%).
This scenario may reflect the ―best case‖ scenario where purchase prices for CNG
vehicles begin to decrease as demand for these vehicles increases, maintenance
requirements reduce over time as the City gains more experience with the vehicles
and procedures are established, and CNG engine performance improves as
technology advances.

C N G F e a s i b i l i t y S t u d y , F i n a l v 1 . 0 3 7 8 / 1 5 / 2 0 1 1
Sensitivity Analysis for Higher Initial Diesel Price. The current diesel price paid by
the City is $3.017 per gallon. The City will likely have to pay higher fuel prices in
the future. The above scenarios were rerun with a fuel surcharge of $0.50, $0.75, and
$1.00 per gallon. These model runs were made to assess the sensitivity of the
beginning fuel price on the NPV analysis.
4 . 1 . 1 A s s u m p t i o n s a n d V a r i a b l e s
The analysis considered the following primary assumptions and variables.
Vehicle replacement date. The City has indicated that it would prefer to replace its
vehicles on a 7-year time interval; however, the actual age of the City’s refuse
collection fleet ranges averages 7.4 years and ranges from 1 to 16 years. For the
purpose of this study, we have assumed that vehicles would be replaced on a 7-year
time interval. If the existing vehicle age is greater than 7 years, but less than 10
years, we assumed the vehicle would be replaced at 10 years. We assume a vehicle
greater than 10 years old would be replaced in the next year.
Vehicle replacement costs. The City keeps track of original purchase costs and date
for each vehicle type. The City provided estimated replacement costs for each
vehicle in its inventory. The replacement purchase price was escalated by the CPI for
the projected year of the replacement (e.g., replacement cost in 2014 would be the
2011 cost times (1+CPI)3). CNG vehicles cost more than comparable diesel models.
For this study, we evaluated the change to the net present value of the scenarios
assuming a purchase price premium increase of 20% (Base Case) and 15% (Best
Case). For this study, we assume that the existing diesel-fuel vehicles would be
replaced with CNG-fueled vehicles during the normal replacement cycle of each
vehicle. A schedule for replacement is presented in Appendix A. A summary of the
number and type of vehicles schedule for replacement each year if presented in
Exhibit 17.
E x h i b i t 1 7 . S o l i d W a s t e C o l l e c t i o n V e h i c l e R e p l a c e m e n t S c h e d u l e
Target Replacement Year/Vehicle Type Number/Year
2012 26
BULKY REFUSE W BOOM 28 29YD 6
REFUSE COMP ART ARM 18 19YD 4
REFUSE COMP REAR LOAD 18 19Y 15
REFUSE COMP REAR LOAD 20 21Y 1
2013 23
BULKY REFUSE W BOOM 28 29YD 5
REFUSE COMP ART ARM 18 19YD 17
REFUSE COMP REAR LOAD 18 19Y 1
2014 22
BULKY REFUSE W BOOM 28 29YD 2
REFUSE COMP REAR LOAD 18 19Y 2
REFUSE COMP SIDE LOAD 20 CY 8
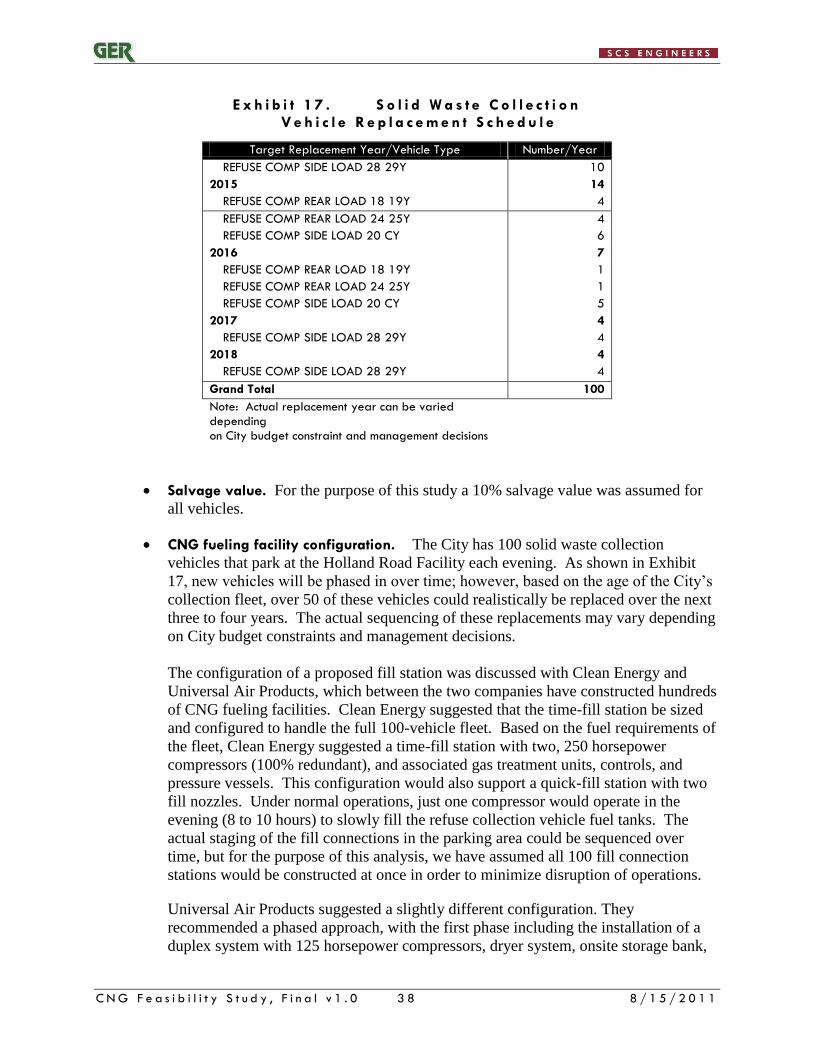
C N G F e a s i b i l i t y S t u d y , F i n a l v 1 . 0 3 8 8 / 1 5 / 2 0 1 1
E x h i b i t 1 7 . S o l i d W a s t e C o l l e c t i o n V e h i c l e R e p l a c e m e n t S c h e d u l e
Target Replacement Year/Vehicle Type Number/Year
REFUSE COMP SIDE LOAD 28 29Y 10
2015 14
REFUSE COMP REAR LOAD 18 19Y 4
REFUSE COMP REAR LOAD 24 25Y 4
REFUSE COMP SIDE LOAD 20 CY 6
2016 7
REFUSE COMP REAR LOAD 18 19Y 1
REFUSE COMP REAR LOAD 24 25Y 1
REFUSE COMP SIDE LOAD 20 CY 5
2017 4
REFUSE COMP SIDE LOAD 28 29Y 4
2018 4
REFUSE COMP SIDE LOAD 28 29Y 4
Grand Total 100
Note: Actual replacement year can be varied depending
on City budget constraint and management decisions
Salvage value. For the purpose of this study a 10% salvage value was assumed for
all vehicles.
CNG fueling facility configuration. The City has 100 solid waste collection
vehicles that park at the Holland Road Facility each evening. As shown in Exhibit
17, new vehicles will be phased in over time; however, based on the age of the City’s
collection fleet, over 50 of these vehicles could realistically be replaced over the next
three to four years. The actual sequencing of these replacements may vary depending
on City budget constraints and management decisions.
The configuration of a proposed fill station was discussed with Clean Energy and
Universal Air Products, which between the two companies have constructed hundreds
of CNG fueling facilities. Clean Energy suggested that the time-fill station be sized
and configured to handle the full 100-vehicle fleet. Based on the fuel requirements of
the fleet, Clean Energy suggested a time-fill station with two, 250 horsepower
compressors (100% redundant), and associated gas treatment units, controls, and
pressure vessels. This configuration would also support a quick-fill station with two
fill nozzles. Under normal operations, just one compressor would operate in the
evening (8 to 10 hours) to slowly fill the refuse collection vehicle fuel tanks. The
actual staging of the fill connections in the parking area could be sequenced over
time, but for the purpose of this analysis, we have assumed all 100 fill connection
stations would be constructed at once in order to minimize disruption of operations.
Universal Air Products suggested a slightly different configuration. They
recommended a phased approach, with the first phase including the installation of a
duplex system with 125 horsepower compressors, dryer system, onsite storage bank,
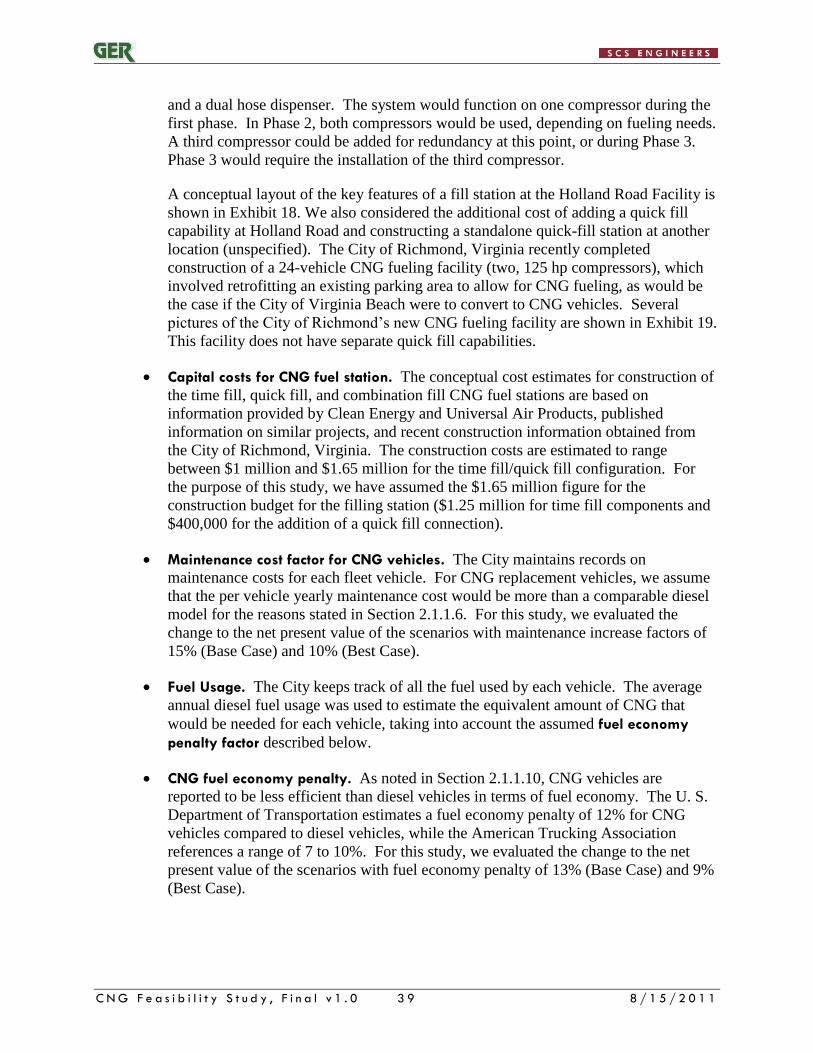
C N G F e a s i b i l i t y S t u d y , F i n a l v 1 . 0 3 9 8 / 1 5 / 2 0 1 1
and a dual hose dispenser. The system would function on one compressor during the
first phase. In Phase 2, both compressors would be used, depending on fueling needs.
A third compressor could be added for redundancy at this point, or during Phase 3.
Phase 3 would require the installation of the third compressor.
A conceptual layout of the key features of a fill station at the Holland Road Facility is
shown in Exhibit 18. We also considered the additional cost of adding a quick fill
capability at Holland Road and constructing a standalone quick-fill station at another
location (unspecified). The City of Richmond, Virginia recently completed
construction of a 24-vehicle CNG fueling facility (two, 125 hp compressors), which
involved retrofitting an existing parking area to allow for CNG fueling, as would be
the case if the City of Virginia Beach were to convert to CNG vehicles. Several
pictures of the City of Richmond’s new CNG fueling facility are shown in Exhibit 19.
This facility does not have separate quick fill capabilities.
Capital costs for CNG fuel station. The conceptual cost estimates for construction of
the time fill, quick fill, and combination fill CNG fuel stations are based on
information provided by Clean Energy and Universal Air Products, published
information on similar projects, and recent construction information obtained from
the City of Richmond, Virginia. The construction costs are estimated to range
between $1 million and $1.65 million for the time fill/quick fill configuration. For
the purpose of this study, we have assumed the $1.65 million figure for the
construction budget for the filling station ($1.25 million for time fill components and
$400,000 for the addition of a quick fill connection).
Maintenance cost factor for CNG vehicles. The City maintains records on
maintenance costs for each fleet vehicle. For CNG replacement vehicles, we assume
that the per vehicle yearly maintenance cost would be more than a comparable diesel
model for the reasons stated in Section 2.1.1.6. For this study, we evaluated the
change to the net present value of the scenarios with maintenance increase factors of
15% (Base Case) and 10% (Best Case).
Fuel Usage. The City keeps track of all the fuel used by each vehicle. The average
annual diesel fuel usage was used to estimate the equivalent amount of CNG that
would be needed for each vehicle, taking into account the assumed fuel economy
penalty factor described below.
CNG fuel economy penalty. As noted in Section 2.1.1.10, CNG vehicles are
reported to be less efficient than diesel vehicles in terms of fuel economy. The U. S.
Department of Transportation estimates a fuel economy penalty of 12% for CNG
vehicles compared to diesel vehicles, while the American Trucking Association
references a range of 7 to 10%. For this study, we evaluated the change to the net
present value of the scenarios with fuel economy penalty of 13% (Base Case) and 9%
(Best Case).
C N G F e a s i b i l i t y S t u d y , F i n a l v 1 . 0 4 0 8 / 1 5 / 2 0 1 1
E x h i b i t 1 8 . C o n c e p t u a l L a y o u t o f C N G F u e l i n g S t a t i o n , H o l l a n d R o a d S i t e

C N G F e a s i b i l i t y S t u d y , F i n a l v 1 . 0 4 1 8 / 1 5 / 2 0 1 1
E x h i b i t 1 9 . C i t y o f R i c h m o n d C N G F a c i l i t y
Diesel fuel price. The City has a contract for diesel fuel. The current price is $3.017
per gallon. The diesel price was escalated between 3% and 7% as discussed under
―Escalators‖ below.
CNG/Natural Gas price. Natural gas pricing was obtained from the City of Virginia
Beach. The City purchases natural gas either through a commodity broker (Compass
Gas) or directly from Virginia Natural Gas. The City last purchased brokered gas at
$4.81 per MMBTU in May 2011. This price is locked for a year. If gas prices fall,
the City pays the higher price, but if gas prices increase, then the City benefits.
Natural gas purchased directly from Virginia Natural Gas is at the market price at the
time of delivery, which at the present time is approximately, $4.65 per MMBTU,
including transport charges and fees. The $4.81 per MMBTU value was used as the
base price for natural gas and was escalated as discussed below under ―Escalators‖.
CNG Fuel Credit. The $0.50/GGE ($0.44/DGE) CNG fuel credit is set to expire
December 31, 2011. The variable is included in the pro forma model, but is set to
zero for the analysis, since if the City were to elect to go forward with replacing its
C N G F e a s i b i l i t y S t u d y , F i n a l v 1 . 0 4 2 8 / 1 5 / 2 0 1 1
diesel refuse collection fleet with CNG vehicles, the facility likely would not be
constructed and operational before the end of 2011.
CNG Vehicle Purchase Incentive Credit. These credits expired as of December 31,
2010; however, the pro forma includes this variable if such credits become available
in the future.
Escalators. The pro forma model considers the following fuel escalator rates (See
Exhibit 20).
- Diesel/CNG: 3%/3%; 3%/5%, 2%/7%. These ranges were selected to assess the
impact on the net present value estimates if diesel fuel prices escalate at different
rates.
- CPI yearly increase: 3%. This factor is applied to all non-fuel costs for future
projections.
O&M costs for CNG stations. O&M costs include electrical costs, consumables,
replacement parts, and routine and non-routine maintenance costs. Exhibit 21
presents the estimated annual O&M costs for a filling station based on hours of
operation. For the pro forma analysis, we assumed the 10-hr/day fill operation
budget.
Upgrades to existing maintenance facility. The City’s solid waste department
maintenance facility at Holland Road will need to be modified if CNG vehicles are
deployed. The potential facility modifications that would be required are discussed in
Sections 2.1.1.7 and 3.4
4 . 1 . 2 P r o F o r m a M o d e l R e s u l t s
The pro forma model is structured to allow for easy adjustment of key assumptions and variables
through an input assumption table as shown in Exhibit 22. This exhibit shows only the base case
scenarios (Diesel compared to CNG). The pro forma model includes capital costs for vehicle
purchases, the CNG fueling station, required upgrades to the City’s maintenance facility to work
on CNG vehicles, annual fuel and O&M costs for the vehicles, and O&M costs for the CNG
station or diesel station. A sample of the output of the pro forma model is provided in Exhibit
23. The net present value (NPV) of the yearly costs for 2011 through 2024 for each scenario is
calculated at a discount rate of 5%. The NPV calculation allows for the comparison of the
various scenarios. A lower NPV indicates a lower life-cycle cost. The summary results of the
pro form model runs for the base case scenarios are presented in Exhibit 24.
The results of the pro forma analysis for the scenarios evaluated are presented in the following
exhibits:
Diesel only (status quo) - Exhibit 24
CNG, Base Case - Exhibit 24
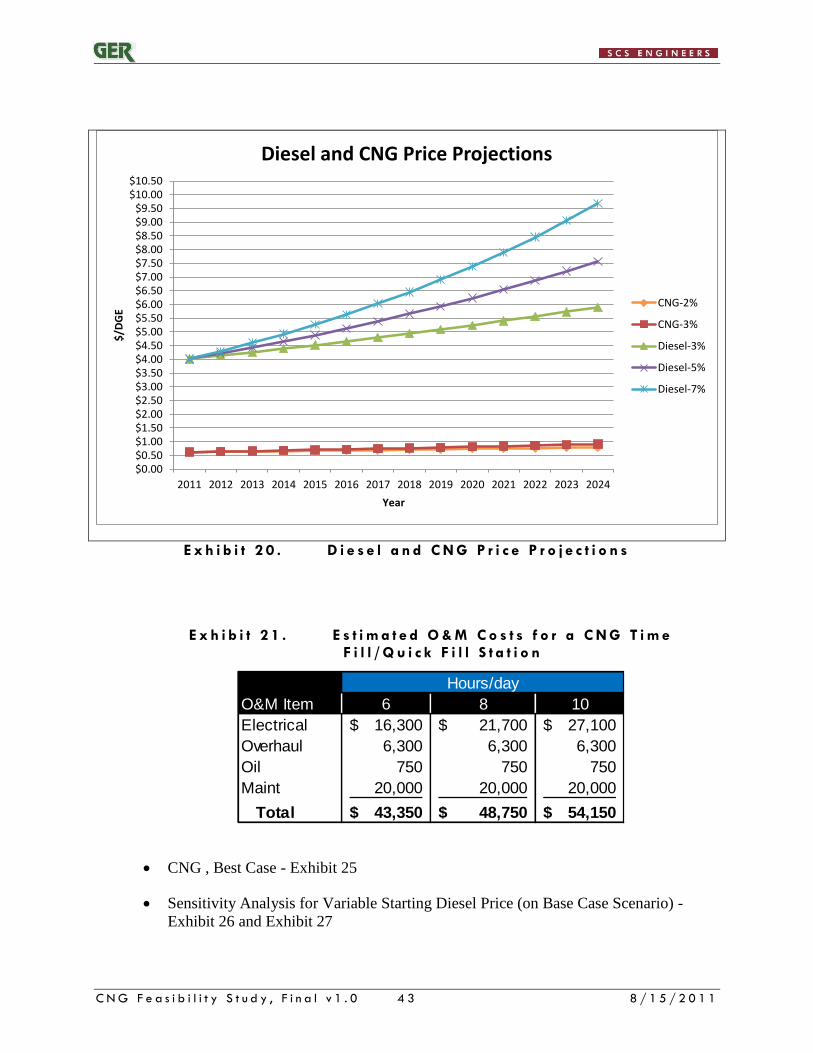
C N G F e a s i b i l i t y S t u d y , F i n a l v 1 . 0 4 3 8 / 1 5 / 2 0 1 1
$0.00$0.50$1.00$1.50$2.00$2.50$3.00$3.50$4.00$4.50$5.00$5.50$6.00$6.50$7.00$7.50$8.00$8.50$9.00$9.50
$10.00$10.50
2011 2012 2013 2014 2015 2016 2017 2018 2019 2020 2021 2022 2023 2024
$/D
GE
Year
Diesel and CNG Price Projections
CNG-2%
CNG-3%
Diesel-3%
Diesel-5%
Diesel-7%
E x h i b i t 2 0 . D i e s e l a n d C N G P r i c e P r o j e c t i o n s
E x h i b i t 2 1 . E s t i m a t e d O & M C o s t s f o r a C N G T i m e F i l l / Q u i c k F i l l S t a t i o n
Hours/day
O&M Item 6 8 10
Electrical 16,300$ 21,700$ 27,100$
Overhaul 6,300 6,300 6,300
Oil 750 750 750
Maint 20,000 20,000 20,000
Total 43,350$ 48,750$ 54,150$
CNG , Best Case - Exhibit 25
Sensitivity Analysis for Variable Starting Diesel Price (on Base Case Scenario) -
Exhibit 26 and Exhibit 27
C N G F e a s i b i l i t y S t u d y , F i n a l v 1 . 0 4 4 8 / 1 5 / 2 0 1 1
4 . 2 O B S ER V A T I O NS / C ONC LU S I ONS
Base Case Scenario. The economic analysis for the base case scenarios suggests that
the life-cycle cost (i.e., NPV) for diesel-only fleet operations would be lower than a
CNG fleet operation for the time period considered (2011-2024), except in the case
where diesel fuel prices escalate at a significantly higher rate than CNG prices. For
the scenarios where the diesel to CNG fuel price escalator ratio is 3%/3% and
5%/3%, the life-cycle cost for the CNG fleet operation are higher than the diesel-only
fleet by 4% to 2%, respectively. However, if diesel fuel price escalates significantly
faster than CNG (7%/2% scenario), the life-cycle cost for the two fleet types begins
to converge, and the CNG scenario has a lower projected life cycle cost.
Best Case Scenario. Under the ―best case‖ scenario, the life-cycle cost for the CNG
fleet operations would be lower than the diesel-only fleet operations when the price of
diesel fuel escalates at a higher rate than CNG fuel prices.
Sensitivity to NPV Analysis for Higher Starting Diesel Prices. The starting price and
escalation rates for diesel versus CNG fuel pricing are significant factors in the
overall financial evaluation. As the beginning price for diesel fuel increases and the
delta between diesel and CNG fuel prices increases, the CNG scenarios become more
cost-effective (lower NPV). Exhibit 26 and Exhibit 27 illustrate the affect that
changing the starting price of diesel fuel has on the estimated NPV of the Base Case
and Best Case scenarios. A $0 per gallon to $1.00 per gallon surcharge on the
assumed initial diesel fuel pricing was evaluated. For example, for the Base Case
scenario, with Diesel/CNG escalation rates of 5%/3%, respectively, a $0.50 to $0.60
per gallon increase in the beginning price for diesel fuel would result in a lower NPV
for the CNG scenarios. For the 3%/3% Diesel/CNG escalation ratio, a $1.00 per
gallon increase in the assumed initial price of diesel fuel would result in a lower NPV
for the CNG scenario.
Energy Pricing Trends. SCS reviewed the pricing trends for diesel and CNG between
April 2006 and April 2011. This review was performed to assess the reasonableness
of the assumptions presented in the pro forma analysis. The five-year and two-year
pricing trends between 2006-2011 and April 2009 to April 2011 are presented in
Exhibit 29. For both the five-year and two-year periods, diesel fuel prices have
increased at a compounded escalation rate of 7.8% and 35.3% rate, respectively based
on the actual prices reported in April of 2006, April 2009, and April 2011. Diesel
pricing experienced a significant spike in pricing in 2008. For CNG, the five-year
pricing data shows a downward trend, while the two-year pricing shows an increasing
trend at a compounded escalation rate of 10% per year. The one-year change
between 2010 and 2011 was half the two-year trend at approximately 5%. What this
data suggests is that all energy pricing is highly volatile and difficult to project based
on past trends, and diesel pricing seems to be more variable than CNG pricing. The
U. S. Energy Information Agency provides the following highlights on the future
prices for diesel and CNG (USEIA, 2011).
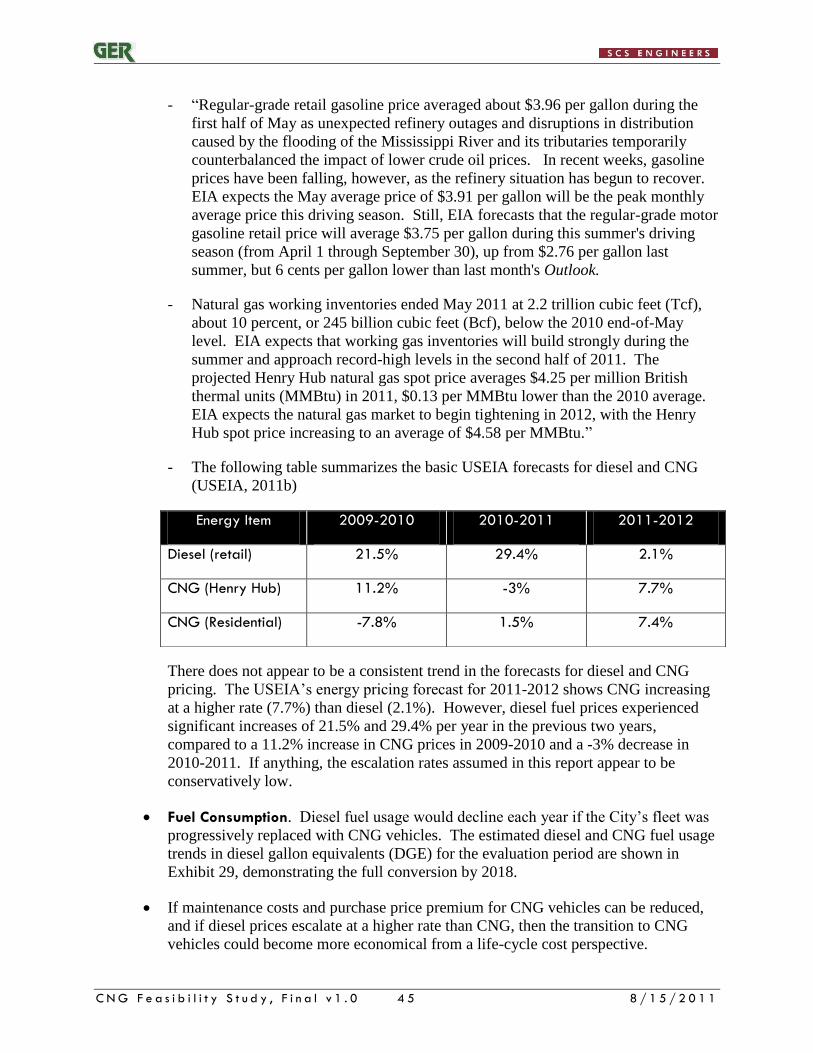
C N G F e a s i b i l i t y S t u d y , F i n a l v 1 . 0 4 5 8 / 1 5 / 2 0 1 1
- ―Regular-grade retail gasoline price averaged about $3.96 per gallon during the
first half of May as unexpected refinery outages and disruptions in distribution
caused by the flooding of the Mississippi River and its tributaries temporarily
counterbalanced the impact of lower crude oil prices. In recent weeks, gasoline
prices have been falling, however, as the refinery situation has begun to recover.
EIA expects the May average price of $3.91 per gallon will be the peak monthly
average price this driving season. Still, EIA forecasts that the regular-grade motor
gasoline retail price will average $3.75 per gallon during this summer's driving
season (from April 1 through September 30), up from $2.76 per gallon last
summer, but 6 cents per gallon lower than last month's Outlook.
- Natural gas working inventories ended May 2011 at 2.2 trillion cubic feet (Tcf),
about 10 percent, or 245 billion cubic feet (Bcf), below the 2010 end-of-May
level. EIA expects that working gas inventories will build strongly during the
summer and approach record-high levels in the second half of 2011. The
projected Henry Hub natural gas spot price averages $4.25 per million British
thermal units (MMBtu) in 2011, $0.13 per MMBtu lower than the 2010 average.
EIA expects the natural gas market to begin tightening in 2012, with the Henry
Hub spot price increasing to an average of $4.58 per MMBtu.‖
- The following table summarizes the basic USEIA forecasts for diesel and CNG
(USEIA, 2011b)
There does not appear to be a consistent trend in the forecasts for diesel and CNG
pricing. The USEIA’s energy pricing forecast for 2011-2012 shows CNG increasing
at a higher rate (7.7%) than diesel (2.1%). However, diesel fuel prices experienced
significant increases of 21.5% and 29.4% per year in the previous two years,
compared to a 11.2% increase in CNG prices in 2009-2010 and a -3% decrease in
2010-2011. If anything, the escalation rates assumed in this report appear to be
conservatively low.
Fuel Consumption. Diesel fuel usage would decline each year if the City’s fleet was
progressively replaced with CNG vehicles. The estimated diesel and CNG fuel usage
trends in diesel gallon equivalents (DGE) for the evaluation period are shown in
Exhibit 29, demonstrating the full conversion by 2018.
If maintenance costs and purchase price premium for CNG vehicles can be reduced,
and if diesel prices escalate at a higher rate than CNG, then the transition to CNG
vehicles could become more economical from a life-cycle cost perspective.
Energy Item 2009-2010 2010-2011 2011-2012
Diesel (retail) 21.5% 29.4% 2.1%
CNG (Henry Hub) 11.2% -3% 7.7%
CNG (Residential) -7.8% 1.5% 7.4%
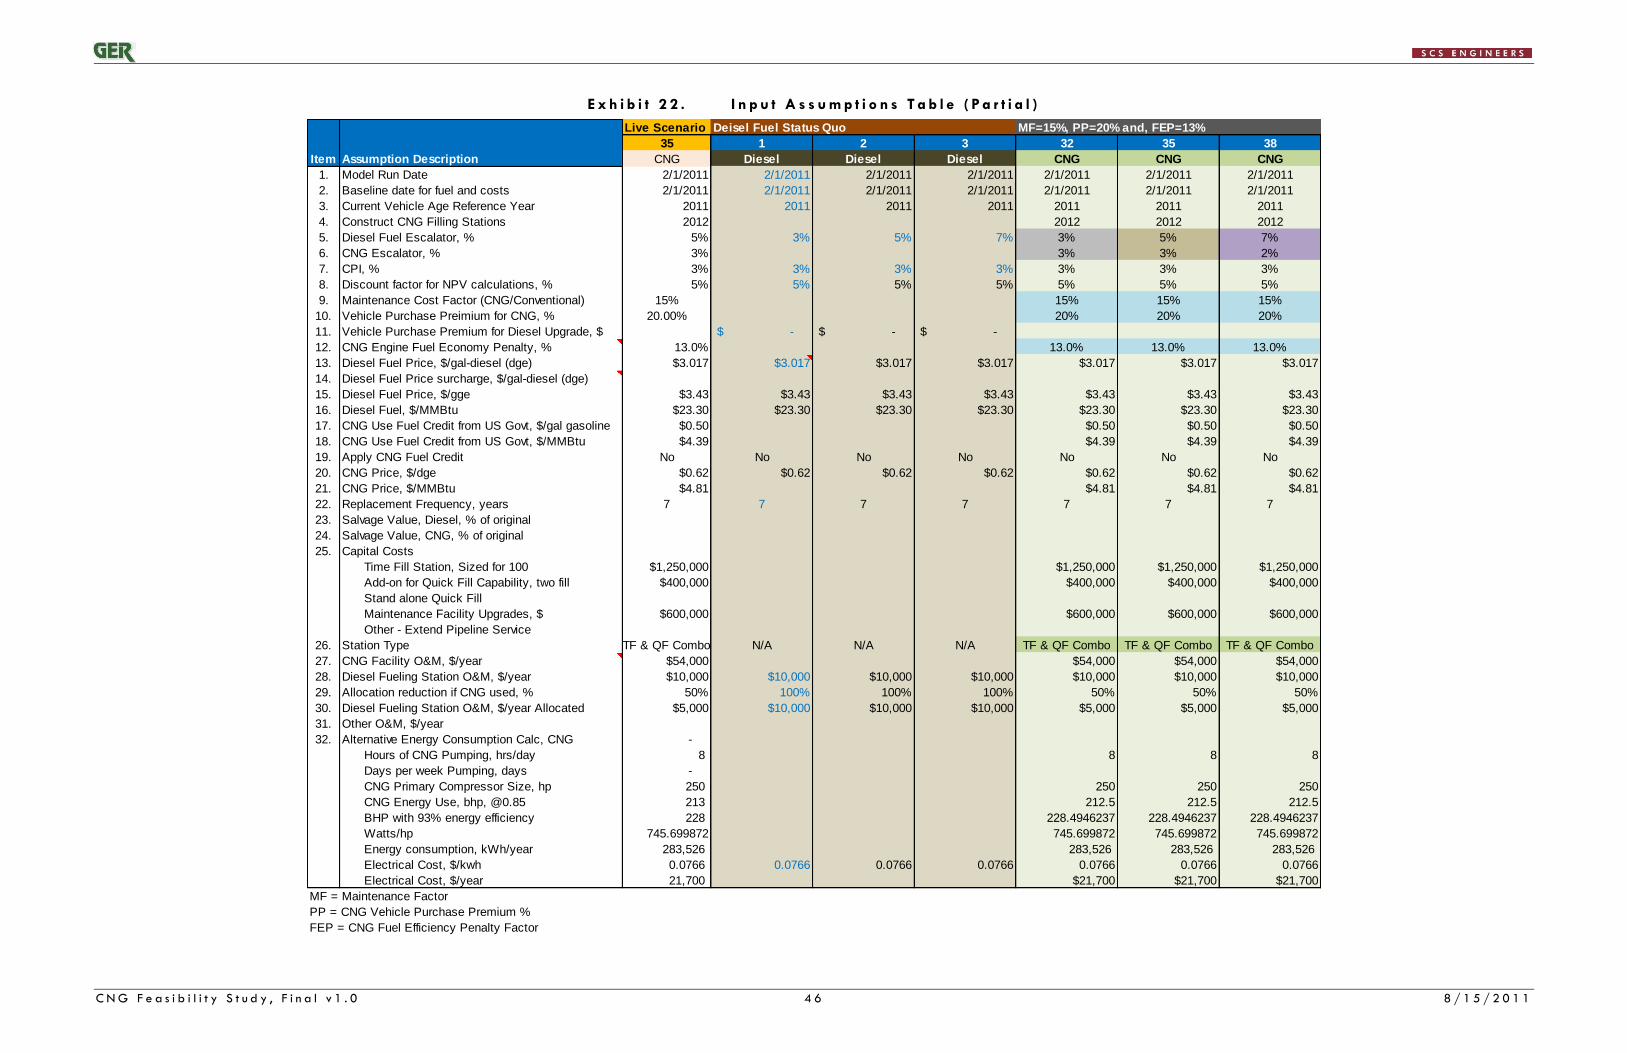
C N G F e a s i b i l i t y S t u d y , F i n a l v 1 . 0 4 6 8 / 1 5 / 2 0 1 1
E x h i b i t 2 2 . I n p u t A s s u m p t i o n s T a b l e ( P a r t i a l )
Live Scenario Deisel Fuel Status Quo MF=15%, PP=20% and, FEP=13%
35 1 2 3 32 35 38
Item Assumption Description CNG Diesel Diesel Diesel CNG CNG CNG
1. Model Run Date 2/1/2011 2/1/2011 2/1/2011 2/1/2011 2/1/2011 2/1/2011 2/1/2011
2. Baseline date for fuel and costs 2/1/2011 2/1/2011 2/1/2011 2/1/2011 2/1/2011 2/1/2011 2/1/2011
3. Current Vehicle Age Reference Year 2011 2011 2011 2011 2011 2011 2011
4. Construct CNG Filling Stations 2012 2012 2012 2012
5. Diesel Fuel Escalator, % 5% 3% 5% 7% 3% 5% 7%
6. CNG Escalator, % 3% 3% 3% 2%
7. CPI, % 3% 3% 3% 3% 3% 3% 3%
8. Discount factor for NPV calculations, % 5% 5% 5% 5% 5% 5% 5%
9. Maintenance Cost Factor (CNG/Conventional) 15% 15% 15% 15%
10. Vehicle Purchase Preimium for CNG, % 20.00% 20% 20% 20%
11. Vehicle Purchase Premium for Diesel Upgrade, $ -$ -$ -$
12. CNG Engine Fuel Economy Penalty, % 13.0% 13.0% 13.0% 13.0%
13. Diesel Fuel Price, $/gal-diesel (dge) $3.017 $3.017 $3.017 $3.017 $3.017 $3.017 $3.017
14. Diesel Fuel Price surcharge, $/gal-diesel (dge)
15. Diesel Fuel Price, $/gge $3.43 $3.43 $3.43 $3.43 $3.43 $3.43 $3.43
16. Diesel Fuel, $/MMBtu $23.30 $23.30 $23.30 $23.30 $23.30 $23.30 $23.30
17. CNG Use Fuel Credit from US Govt, $/gal gasoline $0.50 $0.50 $0.50 $0.50
18. CNG Use Fuel Credit from US Govt, $/MMBtu $4.39 $4.39 $4.39 $4.39
19. Apply CNG Fuel Credit No No No No No No No
20. CNG Price, $/dge $0.62 $0.62 $0.62 $0.62 $0.62 $0.62 $0.62
21. CNG Price, $/MMBtu $4.81 $4.81 $4.81 $4.81
22. Replacement Frequency, years 7 7 7 7 7 7 7
23. Salvage Value, Diesel, % of original
24. Salvage Value, CNG, % of original
25. Capital Costs
Time Fill Station, Sized for 100 $1,250,000 $1,250,000 $1,250,000 $1,250,000
Add-on for Quick Fill Capability, two fill $400,000 $400,000 $400,000 $400,000
Stand alone Quick Fill
Maintenance Facility Upgrades, $ $600,000 $600,000 $600,000 $600,000
Other - Extend Pipeline Service
26. Station Type TF & QF Combo N/A N/A N/A TF & QF Combo TF & QF Combo TF & QF Combo
27. CNG Facility O&M, $/year $54,000 $54,000 $54,000 $54,000
28. Diesel Fueling Station O&M, $/year $10,000 $10,000 $10,000 $10,000 $10,000 $10,000 $10,000
29. Allocation reduction if CNG used, % 50% 100% 100% 100% 50% 50% 50%
30. Diesel Fueling Station O&M, $/year Allocated $5,000 $10,000 $10,000 $10,000 $5,000 $5,000 $5,000
31. Other O&M, $/year
32. Alternative Energy Consumption Calc, CNG -
Hours of CNG Pumping, hrs/day 8 8 8 8
Days per week Pumping, days -
CNG Primary Compressor Size, hp 250 250 250 250
CNG Energy Use, bhp, @0.85 213 212.5 212.5 212.5
BHP with 93% energy efficiency 228 228.4946237 228.4946237 228.4946237
Watts/hp 745.699872 745.699872 745.699872 745.699872
Energy consumption, kWh/year 283,526 283,526 283,526 283,526
Electrical Cost, $/kwh 0.0766 0.0766 0.0766 0.0766 0.0766 0.0766 0.0766
Electrical Cost, $/year 21,700 $21,700 $21,700 $21,700
MF = Maintenance Factor
PP = CNG Vehicle Purchase Premium %
FEP = CNG Fuel Efficiency Penalty Factor

C N G F e a s i b i l i t y S t u d y , F i n a l v 1 . 0 4 7 8 / 1 5 / 2 0 1 1
E x h i b i t 2 3 . E x a m p l e O u t p u t o f t h e P r o F o r m a M o d e l , D i e s e l E s c a l a t o r 5 % , C N G E s c a l a t o r 3 %
35 Station Type
CNG TF & QF Combo
Item 2011 2012 2013 2014 2015 2016 2017 2018 2019 2020 2021 2022 2023 2024
Total Costs, $/year $2,609,000 $11,119,000 $7,037,000 $8,968,000 $5,091,000 $2,634,000 $3,788,000 $3,913,000 $10,047,000 $8,152,000 $10,791,000 $6,583,000 $3,572,000 $5,023,000
Capital Expenses $0 $8,196,000 $4,322,000 $6,342,000 $2,800,000 $242,000 $1,312,000 $1,352,000 $7,318,000 $5,313,000 $7,818,000 $3,442,000 $298,000 $1,616,000
Vehicle Replacements, $/year $0 $5,946,000 $4,322,000 $6,342,000 $2,800,000 $242,000 $1,312,000 $1,352,000 $7,318,000 $5,313,000 $7,818,000 $3,442,000 $298,000 $1,616,000
Fill Station $0 $1,650,000 $0 $0 $0 $0 $0 $0 $0 $0 $0 $0 $0 $0
Fill Station - Time Fill, $ $0 $1,250,000 $0 $0 $0 $0 $0 $0 $0 $0 $0 $0 $0 $0
Fill Stattion - Quick Fill Add-on, $ $0 $400,000 $0 $0 $0 $0 $0 $0 $0 $0 $0 $0 $0 $0
Maintenance Bldg Modifications $0 $600,000 $0 $0 $0 $0 $0 $0 $0 $0 $0 $0 $0 $0
Other - Extend Pipeline Service $0 $0 $0 $0 $0 $0 $0 $0 $0 $0 $0 $0 $0 $0
Operation Expenses $2,609,000 $2,923,000 $2,715,000 $2,626,000 $2,291,000 $2,392,000 $2,476,000 $2,561,000 $2,729,000 $2,839,000 $2,973,000 $3,141,000 $3,274,000 $3,407,000
Fuel, $/year $1,060,000 $1,009,000 $853,000 $667,000 $375,000 $362,000 $326,000 $314,000 $373,000 $373,000 $373,000 $373,000 $397,000 $397,000
Vehicle Maintenance, $/year $1,490,000 $1,853,000 $1,800,000 $1,895,000 $1,849,000 $1,961,000 $2,080,000 $2,175,000 $2,282,000 $2,389,000 $2,520,000 $2,686,000 $2,793,000 $2,924,000
CNG Fueling Facility O&M, $/year $54,000 $56,000 $57,000 $59,000 $61,000 $63,000 $64,000 $66,000 $68,000 $70,000 $73,000 $75,000 $77,000 $79,000
Diesel Facility O&M, $/year $5,000 $5,000 $5,000 $5,000 $6,000 $6,000 $6,000 $6,000 $6,000 $7,000 $7,000 $7,000 $7,000 $7,000
Other O&M $0 $0 $0 $0 $0 $0 $0 $0 $0 $0 $0 $0 $0 $0
Net Present Value at 5% discount factor, $ $63,209,000
Fuel Usuage
Diesel, gallons/year 354,400 281,500 207,500 125,700 29,900 22,400 11,200 - - - - - - -
CNG, MMBtu/year - 22,368 31,366 43,162 51,064 52,162 53,802 55,442 55,442 55,442 55,442 55,442 55,442 55,442
CNG, DGE/year - 172,726 242,208 333,297 394,317 402,795 415,459 428,124 428,124 428,124 428,124 428,124 428,124 428,124
Diesel Fuel Price, $/DGE @ 5% escalator 3.017 3.168 3.326 3.493 3.667 3.851 4.043 4.245 4.457 4.680 4.914 5.160 5.418 5.689
CNG Price (Delivered by VNG), $/MMBtu @3%"escalator $4.810 4.954 5.103 5.256 5.414 5.576 5.743 5.916 6.093 6.276 6.464 6.658 6.858 7.064
CNG Price (Delivered by VNG, $/DGE $0.620 $0.639 $0.658 $0.677 $0.698 $0.719 $0.740 $0.763 $0.785 $0.809 $0.833 $0.858 $0.884 $0.910
Note: Information presented in this table is for demonstration purposes of the structure of the pro forma model. Actual final results may vary for the specified scenario.
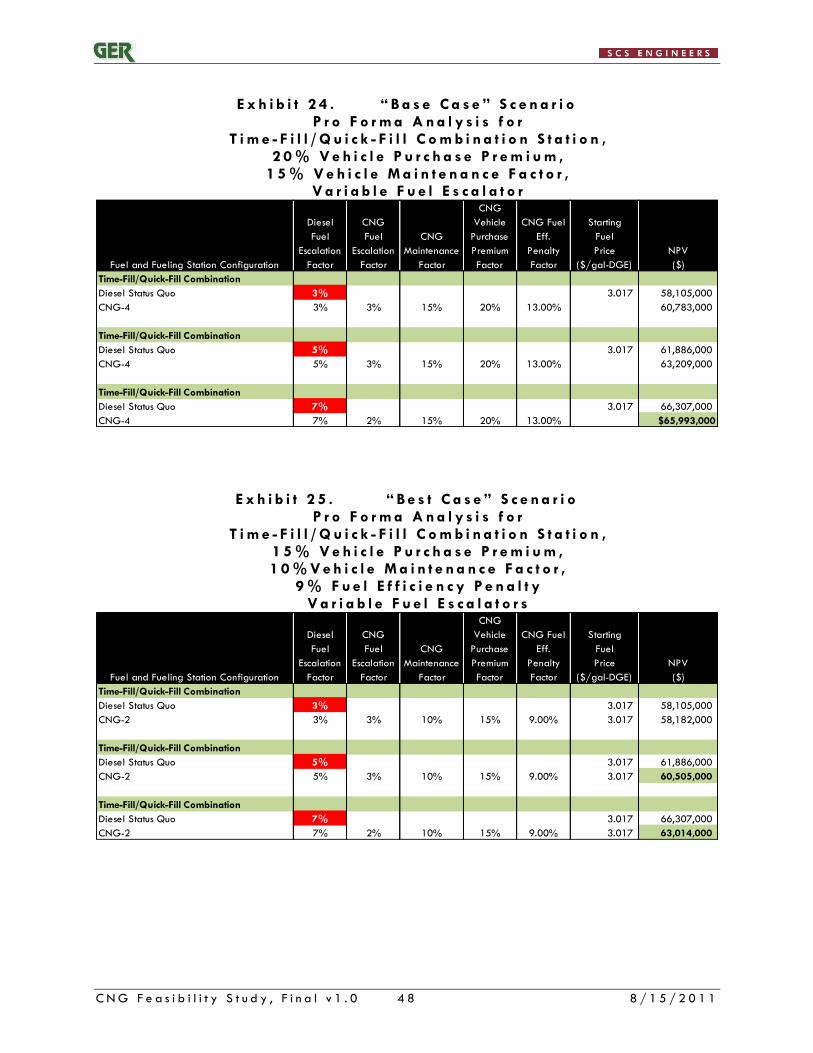
C N G F e a s i b i l i t y S t u d y , F i n a l v 1 . 0 4 8 8 / 1 5 / 2 0 1 1
E x h i b i t 2 4 . “ B a s e C a s e ” S c e n a r i o P r o F o r m a A n a l y s i s f o r
T i m e - F i l l / Q u i c k - F i l l C o m b i n a t i o n S t a t i o n , 2 0 % V e h i c l e P u r c h a s e P r e m i u m ,
1 5 % V e h i c l e M a i n t e n a n c e F a c t o r , V a r i a b l e F u e l E s c a l a t o r
Fuel and Fueling Station Configuration
Diesel
Fuel
Escalation
Factor
CNG
Fuel
Escalation
Factor
CNG
Maintenance
Factor
CNG
Vehicle
Purchase
Premium
Factor
CNG Fuel
Eff.
Penalty
Factor
Starting
Fuel
Price
($/gal-DGE)
NPV
($)
Time-Fill/Quick-Fill Combination
Diesel Status Quo 3% 3.017 58,105,000
CNG-4 3% 3% 15% 20% 13.00% 60,783,000
Time-Fill/Quick-Fill Combination
Diesel Status Quo 5% 3.017 61,886,000
CNG-4 5% 3% 15% 20% 13.00% 63,209,000
Time-Fill/Quick-Fill Combination
Diesel Status Quo 7% 3.017 66,307,000
CNG-4 7% 2% 15% 20% 13.00% $65,993,000
E x h i b i t 2 5 . “ B e s t C a s e ” S c e n a r i o P r o F o r m a A n a l y s i s f o r
T i m e - F i l l / Q u i c k - F i l l C o m b i n a t i o n S t a t i o n , 1 5 % V e h i c l e P u r c h a s e P r e m i u m , 1 0 % V e h i c l e M a i n t e n a n c e F a c t o r ,
9 % F u e l E f f i c i e n c y P e n a l t y V a r i a b l e F u e l E s c a l a t o r s
Fuel and Fueling Station Configuration
Diesel
Fuel
Escalation
Factor
CNG
Fuel
Escalation
Factor
CNG
Maintenance
Factor
CNG
Vehicle
Purchase
Premium
Factor
CNG Fuel
Eff.
Penalty
Factor
Starting
Fuel
Price
($/gal-DGE)
NPV
($)
Time-Fill/Quick-Fill Combination
Diesel Status Quo 3% 3.017 58,105,000
CNG-2 3% 3% 10% 15% 9.00% 3.017 58,182,000
Time-Fill/Quick-Fill Combination
Diesel Status Quo 5% 3.017 61,886,000
CNG-2 5% 3% 10% 15% 9.00% 3.017 60,505,000
Time-Fill/Quick-Fill Combination
Diesel Status Quo 7% 3.017 66,307,000
CNG-2 7% 2% 10% 15% 9.00% 3.017 63,014,000
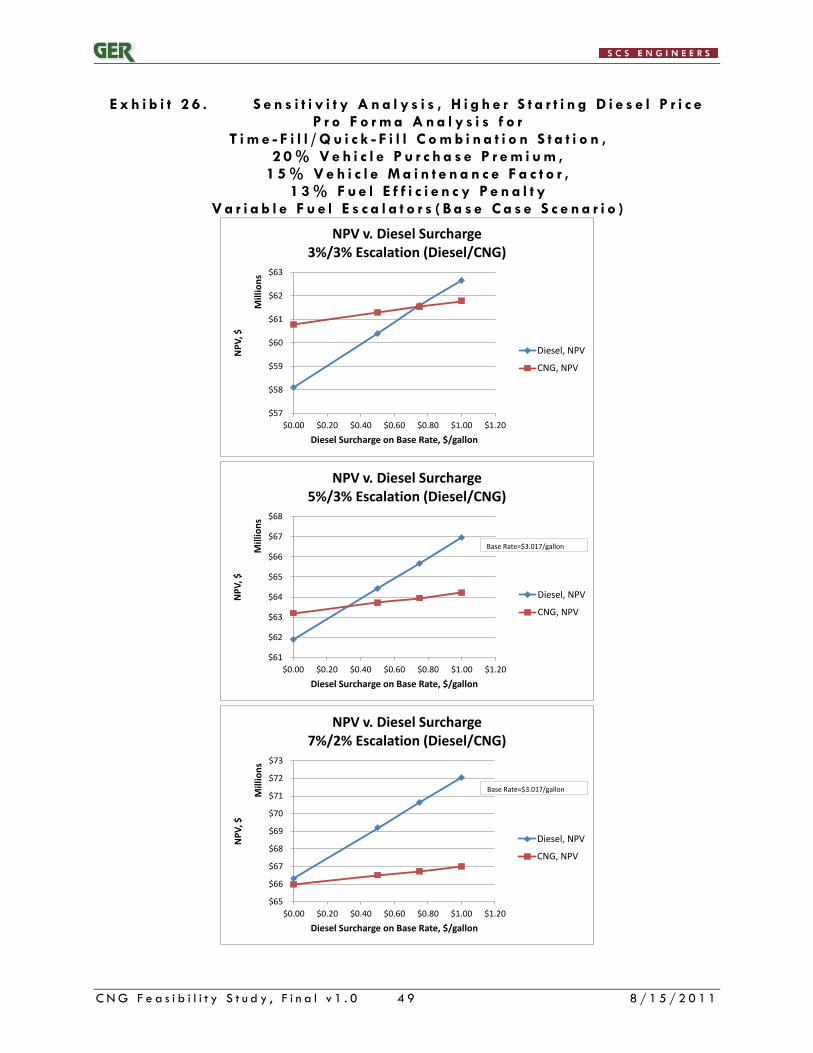
C N G F e a s i b i l i t y S t u d y , F i n a l v 1 . 0 4 9 8 / 1 5 / 2 0 1 1
E x h i b i t 2 6 . S e n s i t i v i t y A n a l y s i s , H i g h e r S t a r t i n g D i e s e l P r i c e P r o F o r m a A n a l y s i s f o r
T i m e - F i l l / Q u i c k - F i l l C o m b i n a t i o n S t a t i o n , 2 0 % V e h i c l e P u r c h a s e P r e m i u m ,
1 5 % V e h i c l e M a i n t e n a n c e F a c t o r , 1 3 % F u e l E f f i c i e n c y P e n a l t y
V a r i a b l e F u e l E s c a l a t o r s ( B a s e C a s e S c e n a r i o )
$57
$58
$59
$60
$61
$62
$63
$0.00 $0.20 $0.40 $0.60 $0.80 $1.00 $1.20
NP
V, $
Mill
ion
s
Diesel Surcharge on Base Rate, $/gallon
NPV v. Diesel Surcharge3%/3% Escalation (Diesel/CNG)
Diesel, NPV
CNG, NPV
$61
$62
$63
$64
$65
$66
$67
$68
$0.00 $0.20 $0.40 $0.60 $0.80 $1.00 $1.20
NP
V, $
Mill
ion
s
Diesel Surcharge on Base Rate, $/gallon
NPV v. Diesel Surcharge5%/3% Escalation (Diesel/CNG)
Diesel, NPV
CNG, NPV
Base Rate=$3.017/gallon
$65
$66
$67
$68
$69
$70
$71
$72
$73
$0.00 $0.20 $0.40 $0.60 $0.80 $1.00 $1.20
NP
V, $
Mill
ion
s
Diesel Surcharge on Base Rate, $/gallon
NPV v. Diesel Surcharge7%/2% Escalation (Diesel/CNG)
Diesel, NPV
CNG, NPV
Base Rate=$3.017/gallon
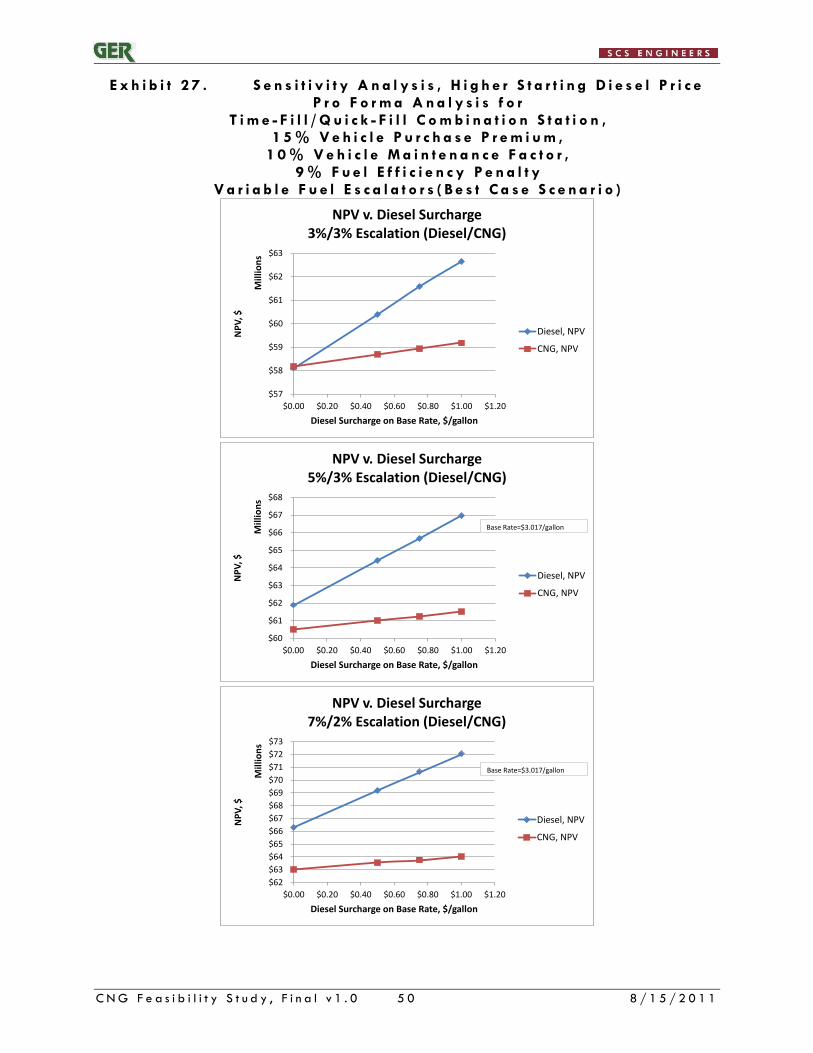
C N G F e a s i b i l i t y S t u d y , F i n a l v 1 . 0 5 0 8 / 1 5 / 2 0 1 1
E x h i b i t 2 7 . S e n s i t i v i t y A n a l y s i s , H i g h e r S t a r t i n g D i e s e l P r i c e P r o F o r m a A n a l y s i s f o r
T i m e - F i l l / Q u i c k - F i l l C o m b i n a t i o n S t a t i o n , 1 5 % V e h i c l e P u r c h a s e P r e m i u m ,
1 0 % V e h i c l e M a i n t e n a n c e F a c t o r , 9 % F u e l E f f i c i e n c y P e n a l t y
V a r i a b l e F u e l E s c a l a t o r s ( B e s t C a s e S c e n a r i o )
$57
$58
$59
$60
$61
$62
$63
$0.00 $0.20 $0.40 $0.60 $0.80 $1.00 $1.20
NP
V, $
Mill
ion
s
Diesel Surcharge on Base Rate, $/gallon
NPV v. Diesel Surcharge3%/3% Escalation (Diesel/CNG)
Diesel, NPV
CNG, NPV
$60
$61
$62
$63
$64
$65
$66
$67
$68
$0.00 $0.20 $0.40 $0.60 $0.80 $1.00 $1.20
NP
V, $
Mill
ion
s
Diesel Surcharge on Base Rate, $/gallon
NPV v. Diesel Surcharge5%/3% Escalation (Diesel/CNG)
Diesel, NPV
CNG, NPV
Base Rate=$3.017/gallon
$62
$63
$64
$65
$66
$67
$68
$69
$70
$71
$72
$73
$0.00 $0.20 $0.40 $0.60 $0.80 $1.00 $1.20
NP
V, $
Mill
ion
s
Diesel Surcharge on Base Rate, $/gallon
NPV v. Diesel Surcharge7%/2% Escalation (Diesel/CNG)
Diesel, NPV
CNG, NPV
Base Rate=$3.017/gallon
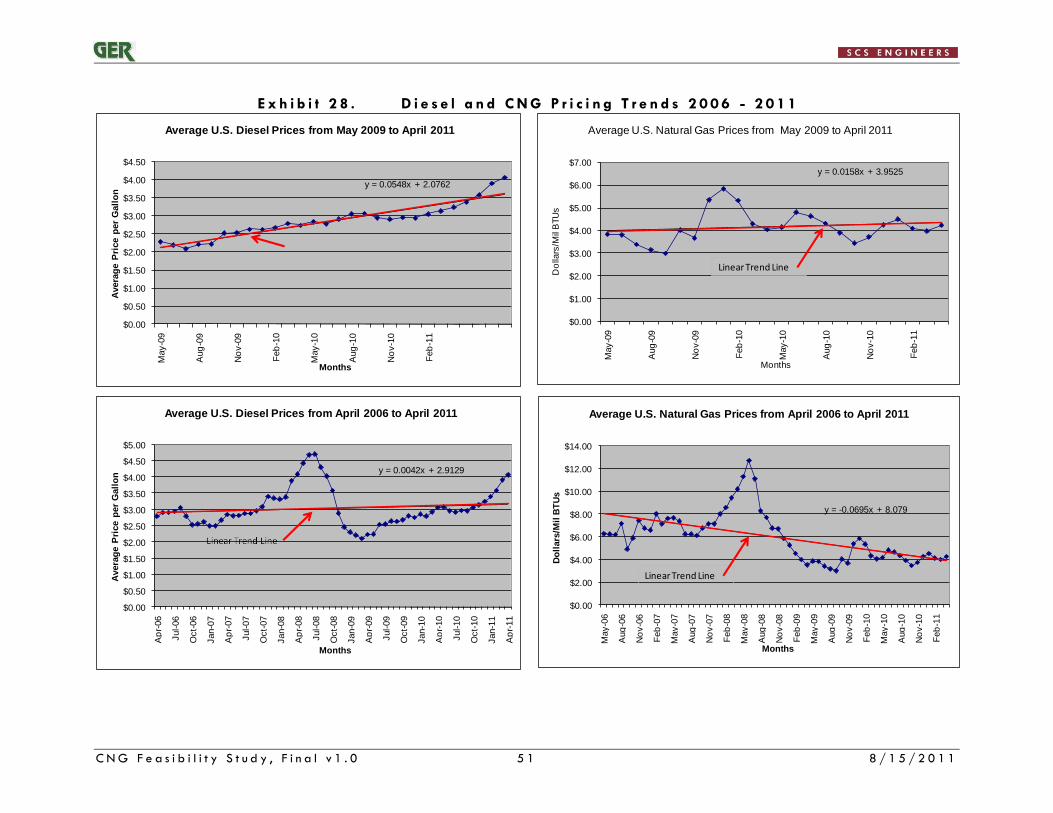
C N G F e a s i b i l i t y S t u d y , F i n a l v 1 . 0 5 1 8 / 1 5 / 2 0 1 1
E x h i b i t 2 8 . D i e s e l a n d C N G P r i c i n g T r e n d s 2 0 0 6 - 2 0 1 1
y = 0.0548x + 2.0762
$0.00
$0.50
$1.00
$1.50
$2.00
$2.50
$3.00
$3.50
$4.00
$4.50M
ay-0
9
Aug
-09
No
v-0
9
Feb
-10
May-1
0
Aug
-10
No
v-1
0
Feb
-11
Avera
ge P
rice p
er
Gall
on
Months
Average U.S. Diesel Prices from May 2009 to April 2011
y = 0.0042x + 2.9129
$0.00
$0.50
$1.00
$1.50
$2.00
$2.50
$3.00
$3.50
$4.00
$4.50
$5.00
Ap
r-06
Jul-06
Oct-
06
Jan-0
7
Ap
r-07
Jul-07
Oct-
07
Jan-0
8
Ap
r-08
Jul-08
Oct-
08
Jan-0
9
Ap
r-09
Jul-09
Oct-
09
Jan-1
0
Ap
r-10
Jul-10
Oct-
10
Jan-1
1
Ap
r-11
Avera
ge P
rice p
er
Gall
on
Months
Average U.S. Diesel Prices from April 2006 to April 2011
y = -0.0695x + 8.079
$0.00
$2.00
$4.00
$6.00
$8.00
$10.00
$12.00
$14.00
May-0
6
Aug
-06
No
v-0
6
Feb
-07
May-0
7
Aug
-07
No
v-0
7
Feb
-08
May-0
8
Aug
-08
No
v-0
8
Feb
-09
May-0
9
Aug
-09
No
v-0
9
Feb
-10
May-1
0
Aug
-10
No
v-1
0
Feb
-11
Do
llars
/Mil
BT
Us
Months
Average U.S. Natural Gas Prices from April 2006 to April 2011
Linear Trend Line
y = 0.0158x + 3.9525
$0.00
$1.00
$2.00
$3.00
$4.00
$5.00
$6.00
$7.00
May-0
9
Aug
-09
No
v-0
9
Feb
-10
May-1
0
Aug
-10
No
v-1
0
Feb
-11
Do
llars
/Mil
BTU
s
Months
Average U.S. Natural Gas Prices from May 2009 to April 2011
Linear Trend Line
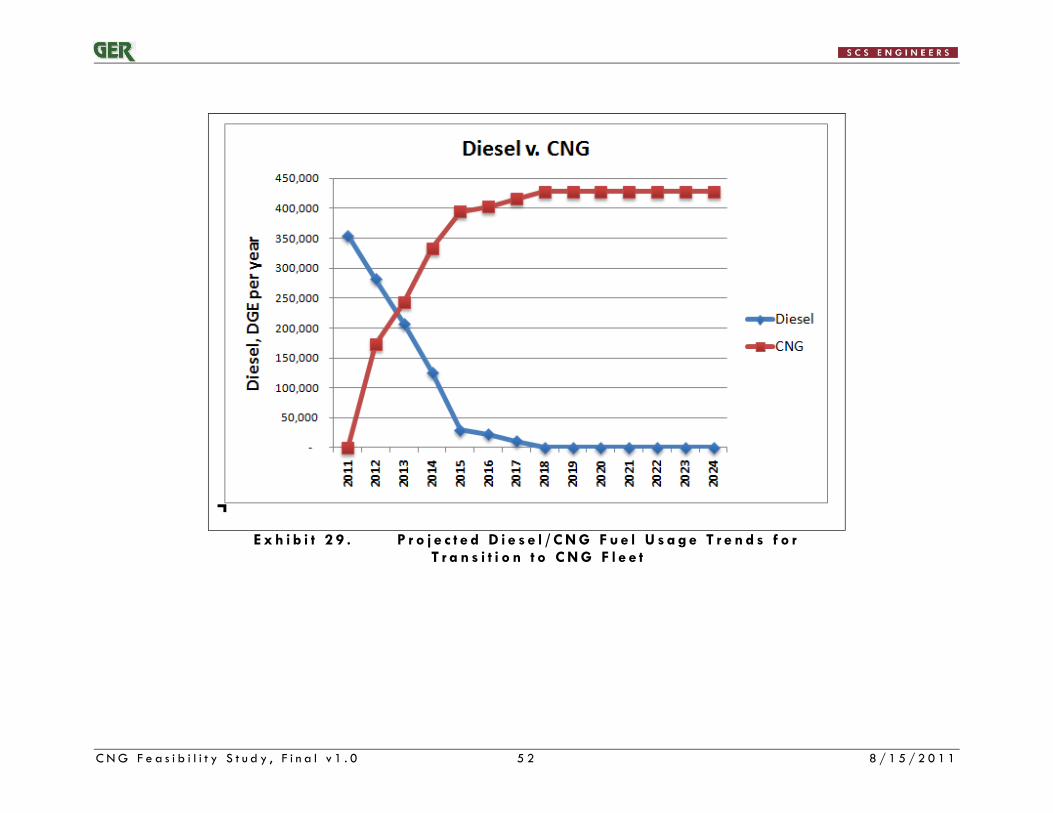
C N G F e a s i b i l i t y S t u d y , F i n a l v 1 . 0 5 2 8 / 1 5 / 2 0 1 1
E x h i b i t 2 9 . P r o j e c t e d D i e s e l / C N G F u e l U s a g e T r e n d s f o r T r a n s i t i o n t o C N G F l e e t
C N G F e a s i b i l i t y S t u d y , F i n a l v 1 . 0 5 3 8 / 1 5 / 2 0 1 1
5 .0 REFERENCES
All Hybrid Cars. ―Hybrid Cars Pros and Cons.‖ http://www.allhybridcars.com/hybrid-cars-pros-
and-cons.html. 2011
American Trucking Association. ―Is Natural Gas a Viable Alternative to Diesel for the Trucking
Industry?‖ http://www.truckline.com. June 2010.
Burdelski, J., Cannon, J.S., Gordon, D. ―Greening Garbage Trucks: New Technologies for
Cleaner Air.” http://www.informinc.org/reportpdfs/st/GreeningGarbageTrucks.pdf. 2003.
City of Chesapeake Public Works. Personal Communication. Meeting with George S. Hrichak,
SCS Engineers, on February 8, 2011.
City of Richmond Public Works. Personal Communication. Meeting and Site Visit to New CNG
Fueling Facility, SCS and GER, February 3, 2011. Follow-up phone call on June 15, 2011.
City of Virginia Beach, PowerPoint Briefing to City Council, 1/25/2011.
City of Virginia Beach, Office of the City Auditor, Audit of Citywide Fuel Utilization, Audit No
2009-007, June 15, 2009:
CNG Now. ―What is CNG?‖ http://www.cngnow.com/EN-US/WhatIsCNG/pages/default.aspx.
2011
DTE Energy. ―Plug-In Electric Vehicles: An Overview.‖
http://www.dteenergy.com/residentialCustomers/productsPrograms/electricVehicles/overview.ht
ml. 2011
Hurst, Timothy B., ―Waste Management Fueling Trash Trucks with Natural Gas.‖
http://ecopolitology.org/2009/03/11/waste-management-fueling-trash-trucks-with-natural-gas/
March 11, 2009.
Hybrid Cars. ―Hybrid Terms.‖ http://www.hybridcars.com/types-systems/hybrid-terms.html.
March 27, 2006.
Hybrid Center. ―Hybrids Under the Hood.‖ http://www.hybridcenter.org/hybrid-center-how-
hybrid-cars-work-under-the-hood.html. 2010
International CNG. ―How Natural Gas Fueling Works.‖
http://www.internationalcng.com/technology. 2010
Jackson, Julian. ―Bigger Hybrids are on a Roll.‖ http://www.earthtimes.org/scitech/bigger-
hybrids-roll/223/. January 18, 2011.
Livestrong. ―About Electric Cars.‖ http://www.livestrong.com/article/125370-electric-cars/.
2011
C N G F e a s i b i l i t y S t u d y , F i n a l v 1 . 0 5 4 8 / 1 5 / 2 0 1 1
National Renewable Energy Laboratory, ―Business Case for Compressed Natural Gas in
Chesapeake, Virginia Municipal Fleet‖, Prepare for the City of Chesapeake, Virginia, April
2011. (note: Financial Analysis Appendices not provided or reviewed).
Natural Gas Vehicle Institute (NGVi). ―Natural Gas Vehicles: The Decision Starts Here.‖
http://www.ngvi.com/publications.html. 2009
U. S. Department of Transportation – Federal Transit Administration. ―Summary of Advantages
and Disadvantages of Alternative Fuels.‖ http://www.fta.dot.gov/research_4586.html, 2011
U. S. Energy Information Agency – Energy Outlook:
http://www.eia.gov/emeu/steo/pub/contents.html, 2011
U. S. Energy Information Agency – STEO Current/Previous Forecast Comparisons: Energy
Prices, http://www.eia.gov/emeu/steo/pub/compare.pdf, 2011
C N G F e a s i b i l i t y S t u d y , F i n a l v 1 . 0 8 / 1 5 / 2 0 1 1
A p p e nd i x A . C i t y o f V i r g i n i a B e a c h D e p a r t me n t o f S o l i d Wa s t e R e f u s e C o l l e c t i o n V e h i c l e I n ve n t o r y
( Ja n ua ry 3 1 , 2 0 1 1 )
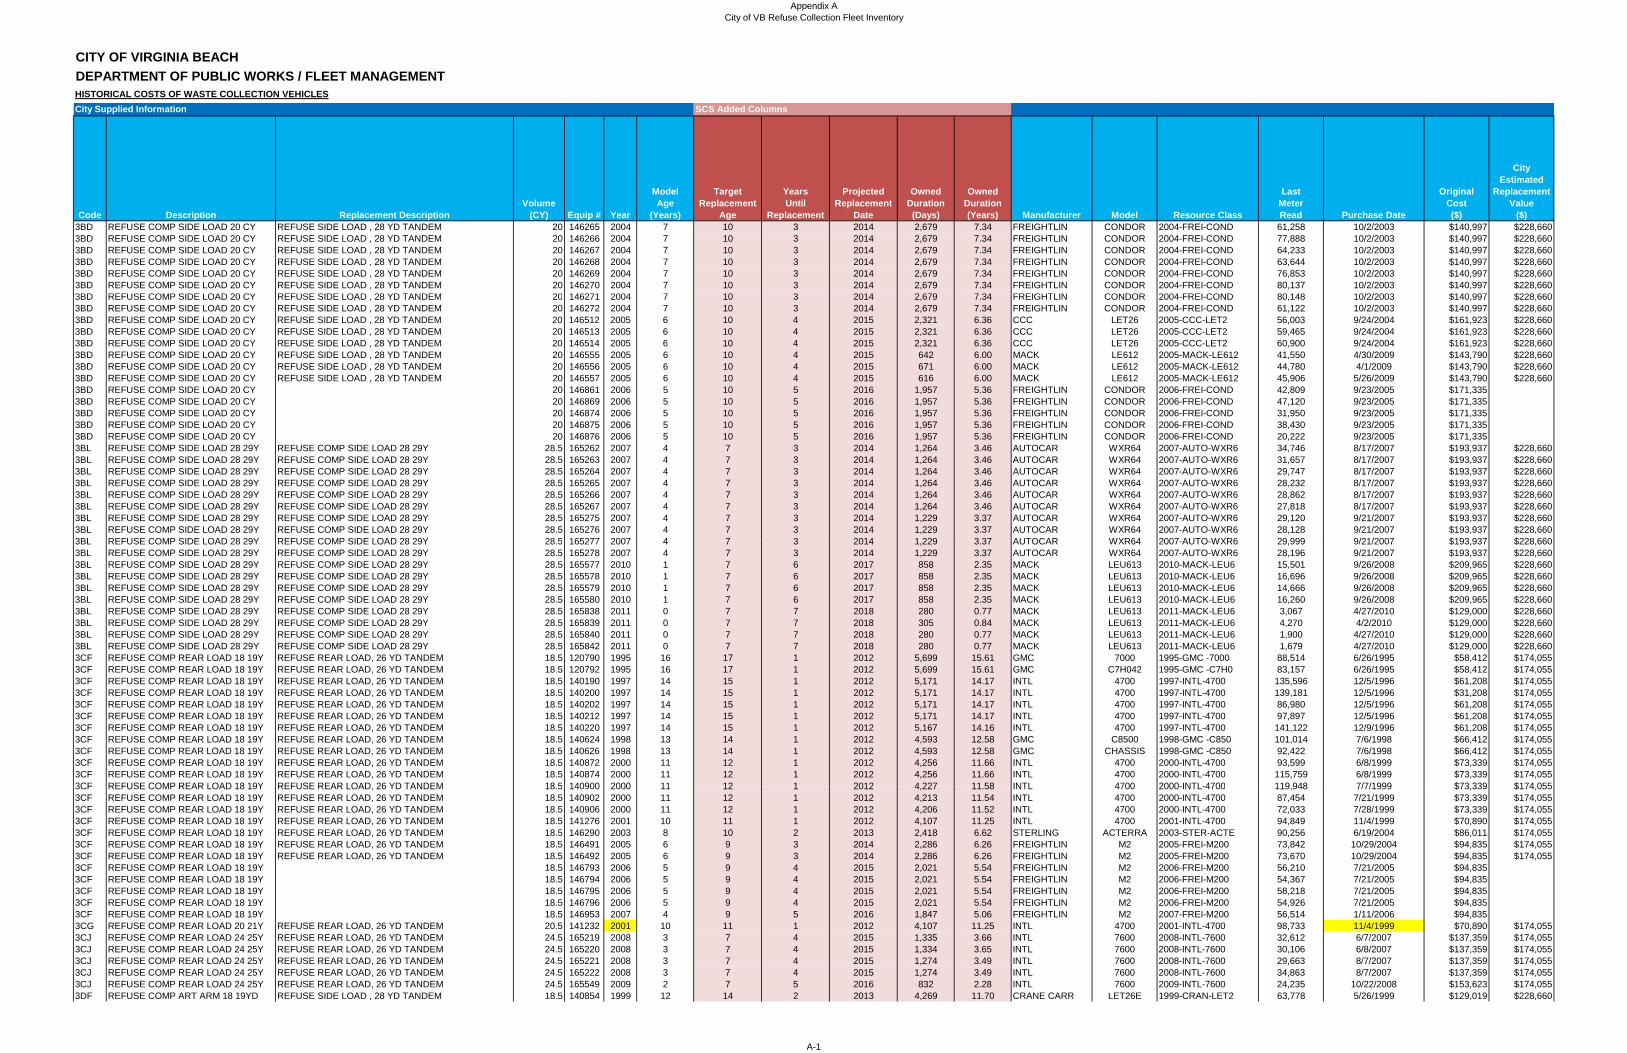
Appendix ACity of VB Refuse Collection Fleet Inventory
CITY OF VIRGINIA BEACHDEPARTMENT OF PUBLIC WORKS / FLEET MANAGEMENTHISTORICAL COSTS OF WASTE COLLECTION VEHICLESCity Supplied Information SCS Added Columns
Code Description Replacement DescriptionVolume
(CY) Equip # Year
ModelAge
(Years)
TargetReplacement
Age
YearsUntil
Replacement
ProjectedReplacement
Date
OwnedDuration(Days)
OwnedDuration(Years) Manufacturer Model Resource Class
Last Meter Read Purchase Date
Original Cost ($)
City Estimated
ReplacementValue
($)3BD REFUSE COMP SIDE LOAD 20 CY REFUSE SIDE LOAD , 28 YD TANDEM 20 146265 2004 7 10 3 2014 2,679 7.34 FREIGHTLIN CONDOR 2004-FREI-COND 61,258 10/2/2003 $140,997 $228,6603BD REFUSE COMP SIDE LOAD 20 CY REFUSE SIDE LOAD , 28 YD TANDEM 20 146266 2004 7 10 3 2014 2,679 7.34 FREIGHTLIN CONDOR 2004-FREI-COND 77,888 10/2/2003 $140,997 $228,6603BD REFUSE COMP SIDE LOAD 20 CY REFUSE SIDE LOAD , 28 YD TANDEM 20 146267 2004 7 10 3 2014 2,679 7.34 FREIGHTLIN CONDOR 2004-FREI-COND 64,233 10/2/2003 $140,997 $228,6603BD REFUSE COMP SIDE LOAD 20 CY REFUSE SIDE LOAD , 28 YD TANDEM 20 146268 2004 7 10 3 2014 2,679 7.34 FREIGHTLIN CONDOR 2004-FREI-COND 63,644 10/2/2003 $140,997 $228,6603BD REFUSE COMP SIDE LOAD 20 CY REFUSE SIDE LOAD , 28 YD TANDEM 20 146269 2004 7 10 3 2014 2,679 7.34 FREIGHTLIN CONDOR 2004-FREI-COND 76,853 10/2/2003 $140,997 $228,6603BD REFUSE COMP SIDE LOAD 20 CY REFUSE SIDE LOAD , 28 YD TANDEM 20 146270 2004 7 10 3 2014 2,679 7.34 FREIGHTLIN CONDOR 2004-FREI-COND 80,137 10/2/2003 $140,997 $228,6603BD REFUSE COMP SIDE LOAD 20 CY REFUSE SIDE LOAD 28 YD TANDEM 20 146271 2004 7 10 3 2014 2 679 7 34 FREIGHTLIN CONDOR 2004 FREI COND 80 148 10/2/2003 $140 997 $228 6603BD REFUSE COMP SIDE LOAD 20 CY REFUSE SIDE LOAD , 28 YD TANDEM 20 146271 2004 7 10 3 2014 2,679 7.34 FREIGHTLIN CONDOR 2004-FREI-COND 80,148 10/2/2003 $140,997 $228,6603BD REFUSE COMP SIDE LOAD 20 CY REFUSE SIDE LOAD , 28 YD TANDEM 20 146272 2004 7 10 3 2014 2,679 7.34 FREIGHTLIN CONDOR 2004-FREI-COND 61,122 10/2/2003 $140,997 $228,6603BD REFUSE COMP SIDE LOAD 20 CY REFUSE SIDE LOAD , 28 YD TANDEM 20 146512 2005 6 10 4 2015 2,321 6.36 CCC LET26 2005-CCC-LET2 56,003 9/24/2004 $161,923 $228,6603BD REFUSE COMP SIDE LOAD 20 CY REFUSE SIDE LOAD , 28 YD TANDEM 20 146513 2005 6 10 4 2015 2,321 6.36 CCC LET26 2005-CCC-LET2 59,465 9/24/2004 $161,923 $228,6603BD REFUSE COMP SIDE LOAD 20 CY REFUSE SIDE LOAD , 28 YD TANDEM 20 146514 2005 6 10 4 2015 2,321 6.36 CCC LET26 2005-CCC-LET2 60,900 9/24/2004 $161,923 $228,6603BD REFUSE COMP SIDE LOAD 20 CY REFUSE SIDE LOAD , 28 YD TANDEM 20 146555 2005 6 10 4 2015 642 6.00 MACK LE612 2005-MACK-LE612 41,550 4/30/2009 $143,790 $228,6603BD REFUSE COMP SIDE LOAD 20 CY REFUSE SIDE LOAD , 28 YD TANDEM 20 146556 2005 6 10 4 2015 671 6.00 MACK LE612 2005-MACK-LE612 44,780 4/1/2009 $143,790 $228,6603BD REFUSE COMP SIDE LOAD 20 CY REFUSE SIDE LOAD , 28 YD TANDEM 20 146557 2005 6 10 4 2015 616 6.00 MACK LE612 2005-MACK-LE612 45,906 5/26/2009 $143,790 $228,6603BD REFUSE COMP SIDE LOAD 20 CY 20 146861 2006 5 10 5 2016 1,957 5.36 FREIGHTLIN CONDOR 2006-FREI-COND 42,809 9/23/2005 $171,3353BD REFUSE COMP SIDE LOAD 20 CY 20 146869 2006 5 10 5 2016 1,957 5.36 FREIGHTLIN CONDOR 2006-FREI-COND 47,120 9/23/2005 $171,3353BD REFUSE COMP SIDE LOAD 20 CY 20 146874 2006 5 10 5 2016 1,957 5.36 FREIGHTLIN CONDOR 2006-FREI-COND 31,950 9/23/2005 $171,3353BD REFUSE COMP SIDE LOAD 20 CY 20 146875 2006 5 10 5 2016 1,957 5.36 FREIGHTLIN CONDOR 2006-FREI-COND 38,430 9/23/2005 $171,3353BD REFUSE COMP SIDE LOAD 20 CY 20 146876 2006 5 10 5 2016 1,957 5.36 FREIGHTLIN CONDOR 2006-FREI-COND 20,222 9/23/2005 $171,3353BL REFUSE COMP SIDE LOAD 28 29Y REFUSE COMP SIDE LOAD 28 29Y 28.5 165262 2007 4 7 3 2014 1,264 3.46 AUTOCAR WXR64 2007-AUTO-WXR6 34,746 8/17/2007 $193,937 $228,6603BL REFUSE COMP SIDE LOAD 28 29Y REFUSE COMP SIDE LOAD 28 29Y 28.5 165263 2007 4 7 3 2014 1,264 3.46 AUTOCAR WXR64 2007-AUTO-WXR6 31,657 8/17/2007 $193,937 $228,6603BL REFUSE COMP SIDE LOAD 28 29Y REFUSE COMP SIDE LOAD 28 29Y 28.5 165264 2007 4 7 3 2014 1,264 3.46 AUTOCAR WXR64 2007-AUTO-WXR6 29,747 8/17/2007 $193,937 $228,6603BL REFUSE COMP SIDE LOAD 28 29Y REFUSE COMP SIDE LOAD 28 29Y 28.5 165265 2007 4 7 3 2014 1,264 3.46 AUTOCAR WXR64 2007-AUTO-WXR6 28,232 8/17/2007 $193,937 $228,6603BL REFUSE COMP SIDE LOAD 28 29Y REFUSE COMP SIDE LOAD 28 29Y 28.5 165266 2007 4 7 3 2014 1,264 3.46 AUTOCAR WXR64 2007-AUTO-WXR6 28,862 8/17/2007 $193,937 $228,6603BL REFUSE COMP SIDE LOAD 28 29Y REFUSE COMP SIDE LOAD 28 29Y 28.5 165267 2007 4 7 3 2014 1,264 3.46 AUTOCAR WXR64 2007-AUTO-WXR6 27,818 8/17/2007 $193,937 $228,6603BL REFUSE COMP SIDE LOAD 28 29Y REFUSE COMP SIDE LOAD 28 29Y 28.5 165275 2007 4 7 3 2014 1,229 3.37 AUTOCAR WXR64 2007-AUTO-WXR6 29,120 9/21/2007 $193,937 $228,6603BL REFUSE COMP SIDE LOAD 28 29Y REFUSE COMP SIDE LOAD 28 29Y 28.5 165276 2007 4 7 3 2014 1,229 3.37 AUTOCAR WXR64 2007-AUTO-WXR6 28,128 9/21/2007 $193,937 $228,6603BL REFUSE COMP SIDE LOAD 28 29Y REFUSE COMP SIDE LOAD 28 29Y 28 5 165277 2007 4 7 3 2014 1 229 3 37 AUTOCAR WXR64 2007 AUTO WXR6 29 999 9/21/2007 $193 937 $228 6603BL REFUSE COMP SIDE LOAD 28 29Y REFUSE COMP SIDE LOAD 28 29Y 28.5 165277 2007 4 7 3 2014 1,229 3.37 AUTOCAR WXR64 2007-AUTO-WXR6 29,999 9/21/2007 $193,937 $228,6603BL REFUSE COMP SIDE LOAD 28 29Y REFUSE COMP SIDE LOAD 28 29Y 28.5 165278 2007 4 7 3 2014 1,229 3.37 AUTOCAR WXR64 2007-AUTO-WXR6 28,196 9/21/2007 $193,937 $228,6603BL REFUSE COMP SIDE LOAD 28 29Y REFUSE COMP SIDE LOAD 28 29Y 28.5 165577 2010 1 7 6 2017 858 2.35 MACK LEU613 2010-MACK-LEU6 15,501 9/26/2008 $209,965 $228,6603BL REFUSE COMP SIDE LOAD 28 29Y REFUSE COMP SIDE LOAD 28 29Y 28.5 165578 2010 1 7 6 2017 858 2.35 MACK LEU613 2010-MACK-LEU6 16,696 9/26/2008 $209,965 $228,6603BL REFUSE COMP SIDE LOAD 28 29Y REFUSE COMP SIDE LOAD 28 29Y 28.5 165579 2010 1 7 6 2017 858 2.35 MACK LEU613 2010-MACK-LEU6 14,666 9/26/2008 $209,965 $228,6603BL REFUSE COMP SIDE LOAD 28 29Y REFUSE COMP SIDE LOAD 28 29Y 28.5 165580 2010 1 7 6 2017 858 2.35 MACK LEU613 2010-MACK-LEU6 16,260 9/26/2008 $209,965 $228,6603BL REFUSE COMP SIDE LOAD 28 29Y REFUSE COMP SIDE LOAD 28 29Y 28.5 165838 2011 0 7 7 2018 280 0.77 MACK LEU613 2011-MACK-LEU6 3,067 4/27/2010 $129,000 $228,6603BL REFUSE COMP SIDE LOAD 28 29Y REFUSE COMP SIDE LOAD 28 29Y 28.5 165839 2011 0 7 7 2018 305 0.84 MACK LEU613 2011-MACK-LEU6 4,270 4/2/2010 $129,000 $228,6603BL REFUSE COMP SIDE LOAD 28 29Y REFUSE COMP SIDE LOAD 28 29Y 28.5 165840 2011 0 7 7 2018 280 0.77 MACK LEU613 2011-MACK-LEU6 1,900 4/27/2010 $129,000 $228,6603BL REFUSE COMP SIDE LOAD 28 29Y REFUSE COMP SIDE LOAD 28 29Y 28.5 165842 2011 0 7 7 2018 280 0.77 MACK LEU613 2011-MACK-LEU6 1,679 4/27/2010 $129,000 $228,6603CF REFUSE COMP REAR LOAD 18 19Y REFUSE REAR LOAD, 26 YD TANDEM 18.5 120790 1995 16 17 1 2012 5,699 15.61 GMC 7000 1995-GMC -7000 88,514 6/26/1995 $58,412 $174,0553CF REFUSE COMP REAR LOAD 18 19Y REFUSE REAR LOAD, 26 YD TANDEM 18.5 120792 1995 16 17 1 2012 5,699 15.61 GMC C7H042 1995-GMC -C7H0 83,157 6/26/1995 $58,412 $174,0553CF REFUSE COMP REAR LOAD 18 19Y REFUSE REAR LOAD, 26 YD TANDEM 18.5 140190 1997 14 15 1 2012 5,171 14.17 INTL 4700 1997-INTL-4700 135,596 12/5/1996 $61,208 $174,0553CF REFUSE COMP REAR LOAD 18 19Y REFUSE REAR LOAD, 26 YD TANDEM 18.5 140200 1997 14 15 1 2012 5,171 14.17 INTL 4700 1997-INTL-4700 139,181 12/5/1996 $31,208 $174,0553CF REFUSE COMP REAR LOAD 18 19Y REFUSE REAR LOAD, 26 YD TANDEM 18.5 140202 1997 14 15 1 2012 5,171 14.17 INTL 4700 1997-INTL-4700 86,980 12/5/1996 $61,208 $174,0553CF REFUSE COMP REAR LOAD 18 19Y REFUSE REAR LOAD, 26 YD TANDEM 18.5 140212 1997 14 15 1 2012 5,171 14.17 INTL 4700 1997-INTL-4700 97,897 12/5/1996 $61,208 $174,0553CF REFUSE COMP REAR LOAD 18 19Y REFUSE REAR LOAD, 26 YD TANDEM 18.5 140220 1997 14 15 1 2012 5,167 14.16 INTL 4700 1997-INTL-4700 141,122 12/9/1996 $61,208 $174,0553CF REFUSE COMP REAR LOAD 18 19Y REFUSE REAR LOAD, 26 YD TANDEM 18.5 140624 1998 13 14 1 2012 4,593 12.58 GMC C8500 1998-GMC -C850 101,014 7/6/1998 $66,412 $174,0553CF REFUSE COMP REAR LOAD 18 19Y REFUSE REAR LOAD, 26 YD TANDEM 18.5 140626 1998 13 14 1 2012 4,593 12.58 GMC CHASSIS 1998-GMC -C850 92,422 7/6/1998 $66,412 $174,0553CF REFUSE COMP REAR LOAD 18 19Y REFUSE REAR LOAD, 26 YD TANDEM 18.5 140872 2000 11 12 1 2012 4,256 11.66 INTL 4700 2000-INTL-4700 93,599 6/8/1999 $73,339 $174,0553CF REFUSE COMP REAR LOAD 18 19Y REFUSE REAR LOAD, 26 YD TANDEM 18.5 140874 2000 11 12 1 2012 4,256 11.66 INTL 4700 2000-INTL-4700 115,759 6/8/1999 $73,339 $174,0553CF REFUSE COMP REAR LOAD 18 19Y REFUSE REAR LOAD 26 YD TANDEM 18 5 140900 2000 11 12 1 2012 4 227 11 58 INTL 4700 2000 INTL 4700 119 948 7/7/1999 $73 339 $174 0553CF REFUSE COMP REAR LOAD 18 19Y REFUSE REAR LOAD, 26 YD TANDEM 18.5 140900 2000 11 12 1 2012 4,227 11.58 INTL 4700 2000-INTL-4700 119,948 7/7/1999 $73,339 $174,0553CF REFUSE COMP REAR LOAD 18 19Y REFUSE REAR LOAD, 26 YD TANDEM 18.5 140902 2000 11 12 1 2012 4,213 11.54 INTL 4700 2000-INTL-4700 87,454 7/21/1999 $73,339 $174,0553CF REFUSE COMP REAR LOAD 18 19Y REFUSE REAR LOAD, 26 YD TANDEM 18.5 140906 2000 11 12 1 2012 4,206 11.52 INTL 4700 2000-INTL-4700 72,033 7/28/1999 $73,339 $174,0553CF REFUSE COMP REAR LOAD 18 19Y REFUSE REAR LOAD, 26 YD TANDEM 18.5 141276 2001 10 11 1 2012 4,107 11.25 INTL 4700 2001-INTL-4700 94,849 11/4/1999 $70,890 $174,0553CF REFUSE COMP REAR LOAD 18 19Y REFUSE REAR LOAD, 26 YD TANDEM 18.5 146290 2003 8 10 2 2013 2,418 6.62 STERLING ACTERRA 2003-STER-ACTE 90,256 6/19/2004 $86,011 $174,0553CF REFUSE COMP REAR LOAD 18 19Y REFUSE REAR LOAD, 26 YD TANDEM 18.5 146491 2005 6 9 3 2014 2,286 6.26 FREIGHTLIN M2 2005-FREI-M200 73,842 10/29/2004 $94,835 $174,0553CF REFUSE COMP REAR LOAD 18 19Y REFUSE REAR LOAD, 26 YD TANDEM 18.5 146492 2005 6 9 3 2014 2,286 6.26 FREIGHTLIN M2 2005-FREI-M200 73,670 10/29/2004 $94,835 $174,0553CF REFUSE COMP REAR LOAD 18 19Y 18.5 146793 2006 5 9 4 2015 2,021 5.54 FREIGHTLIN M2 2006-FREI-M200 56,210 7/21/2005 $94,8353CF REFUSE COMP REAR LOAD 18 19Y 18.5 146794 2006 5 9 4 2015 2,021 5.54 FREIGHTLIN M2 2006-FREI-M200 54,367 7/21/2005 $94,8353CF REFUSE COMP REAR LOAD 18 19Y 18.5 146795 2006 5 9 4 2015 2,021 5.54 FREIGHTLIN M2 2006-FREI-M200 58,218 7/21/2005 $94,8353CF REFUSE COMP REAR LOAD 18 19Y 18.5 146796 2006 5 9 4 2015 2,021 5.54 FREIGHTLIN M2 2006-FREI-M200 54,926 7/21/2005 $94,8353CF REFUSE COMP REAR LOAD 18 19Y 18.5 146953 2007 4 9 5 2016 1,847 5.06 FREIGHTLIN M2 2007-FREI-M200 56,514 1/11/2006 $94,8353CG REFUSE COMP REAR LOAD 20 21Y REFUSE REAR LOAD, 26 YD TANDEM 20.5 141232 2001 10 11 1 2012 4,107 11.25 INTL 4700 2001-INTL-4700 98,733 11/4/1999 $70,890 $174,0553CJ REFUSE COMP REAR LOAD 24 25Y REFUSE REAR LOAD, 26 YD TANDEM 24.5 165219 2008 3 7 4 2015 1,335 3.66 INTL 7600 2008-INTL-7600 32,612 6/7/2007 $137,359 $174,0553CJ REFUSE COMP REAR LOAD 24 25Y REFUSE REAR LOAD, 26 YD TANDEM 24.5 165220 2008 3 7 4 2015 1,334 3.65 INTL 7600 2008-INTL-7600 30,106 6/8/2007 $137,359 $174,0553CJ REFUSE COMP REAR LOAD 24 25Y REFUSE REAR LOAD, 26 YD TANDEM 24.5 165221 2008 3 7 4 2015 1,274 3.49 INTL 7600 2008-INTL-7600 29,663 8/7/2007 $137,359 $174,0553CJ REFUSE COMP REAR LOAD 24 25Y REFUSE REAR LOAD, 26 YD TANDEM 24.5 165222 2008 3 7 4 2015 1,274 3.49 INTL 7600 2008-INTL-7600 34,863 8/7/2007 $137,359 $174,0553CJ REFUSE COMP REAR LOAD 24 25Y REFUSE REAR LOAD, 26 YD TANDEM 24.5 165549 2009 2 7 5 2016 832 2.28 INTL 7600 2009-INTL-7600 24,235 10/22/2008 $153,623 $174,0553DF REFUSE COMP ART ARM 18 19YD REFUSE SIDE LOAD , 28 YD TANDEM 18.5 140854 1999 12 14 2 2013 4,269 11.70 CRANE CARR LET26E 1999-CRAN-LET2 63,778 5/26/1999 $129,019 $228,660
A-1
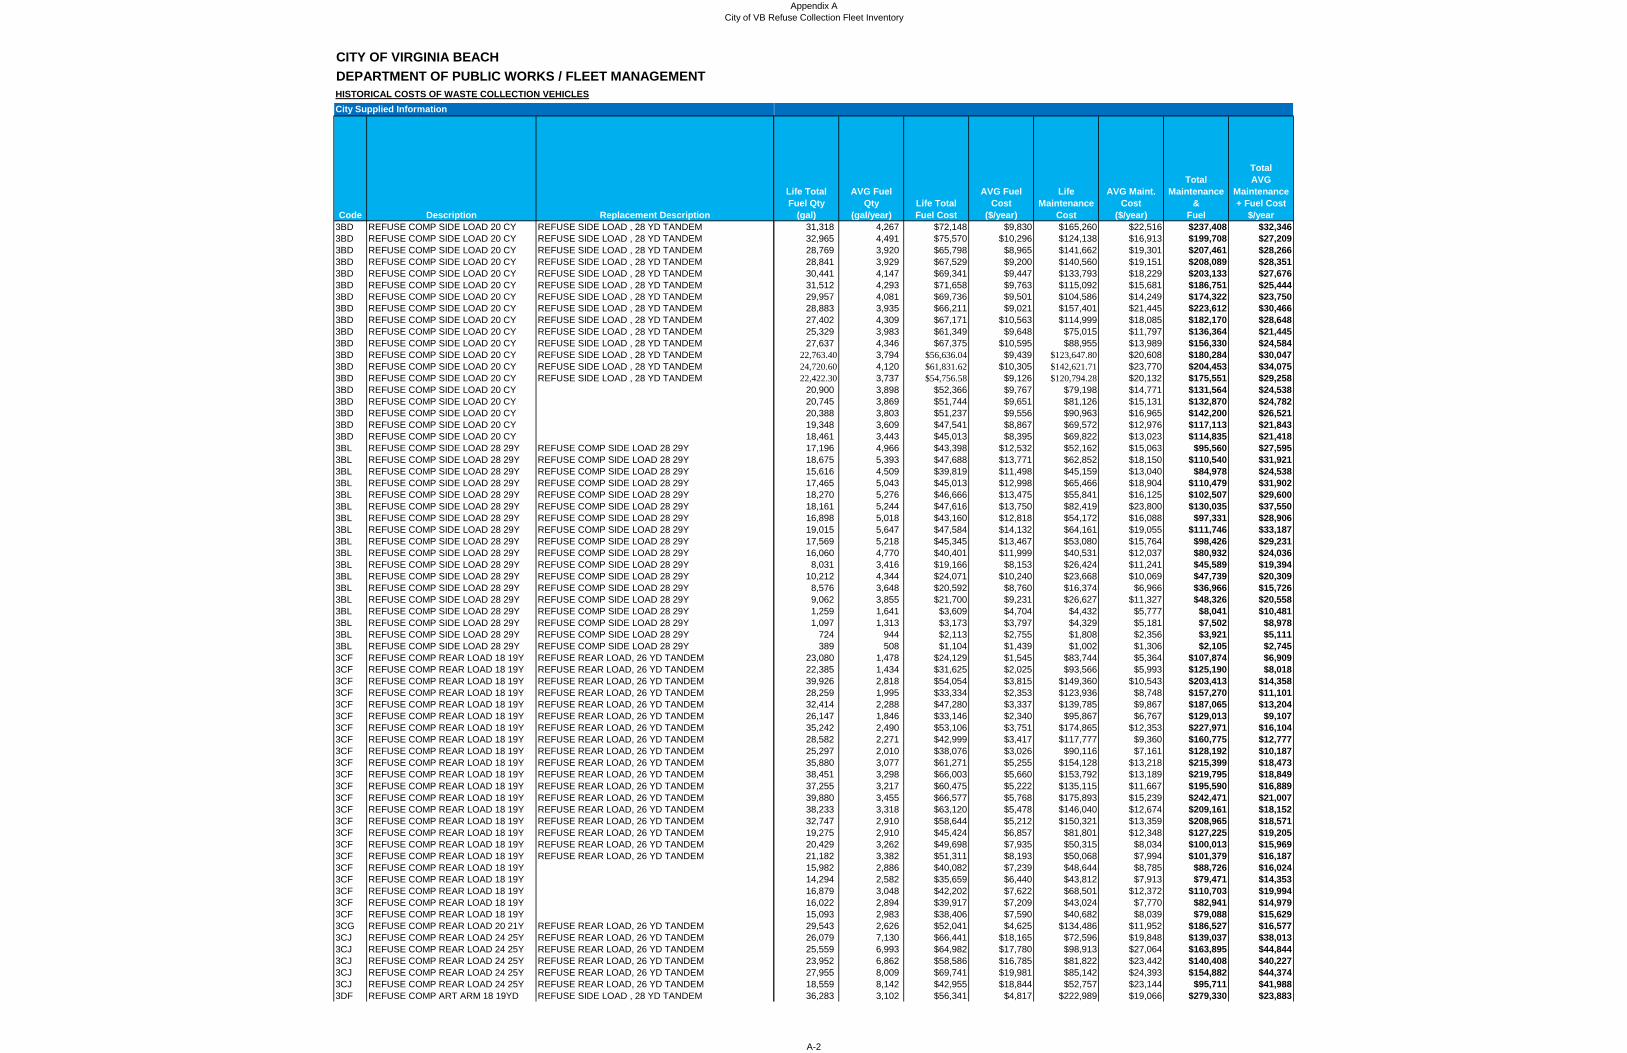
Appendix ACity of VB Refuse Collection Fleet Inventory
CITY OF VIRGINIA BEACHDEPARTMENT OF PUBLIC WORKS / FLEET MANAGEMENTHISTORICAL COSTS OF WASTE COLLECTION VEHICLESCity Supplied Information
Code Description Replacement Description3BD REFUSE COMP SIDE LOAD 20 CY REFUSE SIDE LOAD , 28 YD TANDEM3BD REFUSE COMP SIDE LOAD 20 CY REFUSE SIDE LOAD , 28 YD TANDEM3BD REFUSE COMP SIDE LOAD 20 CY REFUSE SIDE LOAD , 28 YD TANDEM3BD REFUSE COMP SIDE LOAD 20 CY REFUSE SIDE LOAD , 28 YD TANDEM3BD REFUSE COMP SIDE LOAD 20 CY REFUSE SIDE LOAD , 28 YD TANDEM3BD REFUSE COMP SIDE LOAD 20 CY REFUSE SIDE LOAD , 28 YD TANDEM3BD REFUSE COMP SIDE LOAD 20 CY REFUSE SIDE LOAD 28 YD TANDEM
Life TotalFuel Qty
(gal)
AVG FuelQty
(gal/year)Life TotalFuel Cost
AVG FuelCost
($/year)
LifeMaintenance
Cost
AVG Maint.Cost
($/year)
TotalMaintenance
& Fuel
Total AVG
Maintenance + Fuel Cost
$/year31,318 4,267 $72,148 $9,830 $165,260 $22,516 $237,408 $32,34632,965 4,491 $75,570 $10,296 $124,138 $16,913 $199,708 $27,20928,769 3,920 $65,798 $8,965 $141,662 $19,301 $207,461 $28,26628,841 3,929 $67,529 $9,200 $140,560 $19,151 $208,089 $28,35130,441 4,147 $69,341 $9,447 $133,793 $18,229 $203,133 $27,67631,512 4,293 $71,658 $9,763 $115,092 $15,681 $186,751 $25,44429 957 4 081 $69 736 $9 501 $104 586 $14 249 $174 322 $23 7503BD REFUSE COMP SIDE LOAD 20 CY REFUSE SIDE LOAD , 28 YD TANDEM
3BD REFUSE COMP SIDE LOAD 20 CY REFUSE SIDE LOAD , 28 YD TANDEM3BD REFUSE COMP SIDE LOAD 20 CY REFUSE SIDE LOAD , 28 YD TANDEM3BD REFUSE COMP SIDE LOAD 20 CY REFUSE SIDE LOAD , 28 YD TANDEM3BD REFUSE COMP SIDE LOAD 20 CY REFUSE SIDE LOAD , 28 YD TANDEM3BD REFUSE COMP SIDE LOAD 20 CY REFUSE SIDE LOAD , 28 YD TANDEM3BD REFUSE COMP SIDE LOAD 20 CY REFUSE SIDE LOAD , 28 YD TANDEM3BD REFUSE COMP SIDE LOAD 20 CY REFUSE SIDE LOAD , 28 YD TANDEM3BD REFUSE COMP SIDE LOAD 20 CY3BD REFUSE COMP SIDE LOAD 20 CY3BD REFUSE COMP SIDE LOAD 20 CY3BD REFUSE COMP SIDE LOAD 20 CY3BD REFUSE COMP SIDE LOAD 20 CY3BL REFUSE COMP SIDE LOAD 28 29Y REFUSE COMP SIDE LOAD 28 29Y3BL REFUSE COMP SIDE LOAD 28 29Y REFUSE COMP SIDE LOAD 28 29Y3BL REFUSE COMP SIDE LOAD 28 29Y REFUSE COMP SIDE LOAD 28 29Y3BL REFUSE COMP SIDE LOAD 28 29Y REFUSE COMP SIDE LOAD 28 29Y3BL REFUSE COMP SIDE LOAD 28 29Y REFUSE COMP SIDE LOAD 28 29Y3BL REFUSE COMP SIDE LOAD 28 29Y REFUSE COMP SIDE LOAD 28 29Y3BL REFUSE COMP SIDE LOAD 28 29Y REFUSE COMP SIDE LOAD 28 29Y3BL REFUSE COMP SIDE LOAD 28 29Y REFUSE COMP SIDE LOAD 28 29Y3BL REFUSE COMP SIDE LOAD 28 29Y REFUSE COMP SIDE LOAD 28 29Y
29,957 4,081 $69,736 $9,501 $104,586 $14,249 $174,322 $23,75028,883 3,935 $66,211 $9,021 $157,401 $21,445 $223,612 $30,46627,402 4,309 $67,171 $10,563 $114,999 $18,085 $182,170 $28,64825,329 3,983 $61,349 $9,648 $75,015 $11,797 $136,364 $21,44527,637 4,346 $67,375 $10,595 $88,955 $13,989 $156,330 $24,584
22,763.40 3,794 $56,636.04 $9,439 $123,647.80 $20,608 $180,284 $30,04724,720.60 4,120 $61,831.62 $10,305 $142,621.71 $23,770 $204,453 $34,07522,422.30 3,737 $54,756.58 $9,126 $120,794.28 $20,132 $175,551 $29,258
20,900 3,898 $52,366 $9,767 $79,198 $14,771 $131,564 $24,53820,745 3,869 $51,744 $9,651 $81,126 $15,131 $132,870 $24,78220,388 3,803 $51,237 $9,556 $90,963 $16,965 $142,200 $26,52119,348 3,609 $47,541 $8,867 $69,572 $12,976 $117,113 $21,84318,461 3,443 $45,013 $8,395 $69,822 $13,023 $114,835 $21,41817,196 4,966 $43,398 $12,532 $52,162 $15,063 $95,560 $27,59518,675 5,393 $47,688 $13,771 $62,852 $18,150 $110,540 $31,92115,616 4,509 $39,819 $11,498 $45,159 $13,040 $84,978 $24,53817,465 5,043 $45,013 $12,998 $65,466 $18,904 $110,479 $31,90218,270 5,276 $46,666 $13,475 $55,841 $16,125 $102,507 $29,60018,161 5,244 $47,616 $13,750 $82,419 $23,800 $130,035 $37,55016,898 5,018 $43,160 $12,818 $54,172 $16,088 $97,331 $28,90619,015 5,647 $47,584 $14,132 $64,161 $19,055 $111,746 $33,18717 569 5 218 $45 345 $13 467 $53 080 $15 764 $98 426 $29 2313BL REFUSE COMP SIDE LOAD 28 29Y REFUSE COMP SIDE LOAD 28 29Y
3BL REFUSE COMP SIDE LOAD 28 29Y REFUSE COMP SIDE LOAD 28 29Y3BL REFUSE COMP SIDE LOAD 28 29Y REFUSE COMP SIDE LOAD 28 29Y3BL REFUSE COMP SIDE LOAD 28 29Y REFUSE COMP SIDE LOAD 28 29Y3BL REFUSE COMP SIDE LOAD 28 29Y REFUSE COMP SIDE LOAD 28 29Y3BL REFUSE COMP SIDE LOAD 28 29Y REFUSE COMP SIDE LOAD 28 29Y3BL REFUSE COMP SIDE LOAD 28 29Y REFUSE COMP SIDE LOAD 28 29Y3BL REFUSE COMP SIDE LOAD 28 29Y REFUSE COMP SIDE LOAD 28 29Y3BL REFUSE COMP SIDE LOAD 28 29Y REFUSE COMP SIDE LOAD 28 29Y3BL REFUSE COMP SIDE LOAD 28 29Y REFUSE COMP SIDE LOAD 28 29Y3CF REFUSE COMP REAR LOAD 18 19Y REFUSE REAR LOAD, 26 YD TANDEM3CF REFUSE COMP REAR LOAD 18 19Y REFUSE REAR LOAD, 26 YD TANDEM3CF REFUSE COMP REAR LOAD 18 19Y REFUSE REAR LOAD, 26 YD TANDEM3CF REFUSE COMP REAR LOAD 18 19Y REFUSE REAR LOAD, 26 YD TANDEM3CF REFUSE COMP REAR LOAD 18 19Y REFUSE REAR LOAD, 26 YD TANDEM3CF REFUSE COMP REAR LOAD 18 19Y REFUSE REAR LOAD, 26 YD TANDEM3CF REFUSE COMP REAR LOAD 18 19Y REFUSE REAR LOAD, 26 YD TANDEM3CF REFUSE COMP REAR LOAD 18 19Y REFUSE REAR LOAD, 26 YD TANDEM3CF REFUSE COMP REAR LOAD 18 19Y REFUSE REAR LOAD, 26 YD TANDEM3CF REFUSE COMP REAR LOAD 18 19Y REFUSE REAR LOAD, 26 YD TANDEM3CF REFUSE COMP REAR LOAD 18 19Y REFUSE REAR LOAD, 26 YD TANDEM3CF REFUSE COMP REAR LOAD 18 19Y REFUSE REAR LOAD 26 YD TANDEM
17,569 5,218 $45,345 $13,467 $53,080 $15,764 $98,426 $29,23116,060 4,770 $40,401 $11,999 $40,531 $12,037 $80,932 $24,0368,031 3,416 $19,166 $8,153 $26,424 $11,241 $45,589 $19,394
10,212 4,344 $24,071 $10,240 $23,668 $10,069 $47,739 $20,3098,576 3,648 $20,592 $8,760 $16,374 $6,966 $36,966 $15,7269,062 3,855 $21,700 $9,231 $26,627 $11,327 $48,326 $20,5581,259 1,641 $3,609 $4,704 $4,432 $5,777 $8,041 $10,4811,097 1,313 $3,173 $3,797 $4,329 $5,181 $7,502 $8,978
724 944 $2,113 $2,755 $1,808 $2,356 $3,921 $5,111389 508 $1,104 $1,439 $1,002 $1,306 $2,105 $2,745
23,080 1,478 $24,129 $1,545 $83,744 $5,364 $107,874 $6,90922,385 1,434 $31,625 $2,025 $93,566 $5,993 $125,190 $8,01839,926 2,818 $54,054 $3,815 $149,360 $10,543 $203,413 $14,35828,259 1,995 $33,334 $2,353 $123,936 $8,748 $157,270 $11,10132,414 2,288 $47,280 $3,337 $139,785 $9,867 $187,065 $13,20426,147 1,846 $33,146 $2,340 $95,867 $6,767 $129,013 $9,10735,242 2,490 $53,106 $3,751 $174,865 $12,353 $227,971 $16,10428,582 2,271 $42,999 $3,417 $117,777 $9,360 $160,775 $12,77725,297 2,010 $38,076 $3,026 $90,116 $7,161 $128,192 $10,18735,880 3,077 $61,271 $5,255 $154,128 $13,218 $215,399 $18,47338,451 3,298 $66,003 $5,660 $153,792 $13,189 $219,795 $18,84937 255 3 217 $60 475 $5 222 $135 115 $11 667 $195 590 $16 8893CF REFUSE COMP REAR LOAD 18 19Y REFUSE REAR LOAD, 26 YD TANDEM
3CF REFUSE COMP REAR LOAD 18 19Y REFUSE REAR LOAD, 26 YD TANDEM3CF REFUSE COMP REAR LOAD 18 19Y REFUSE REAR LOAD, 26 YD TANDEM3CF REFUSE COMP REAR LOAD 18 19Y REFUSE REAR LOAD, 26 YD TANDEM3CF REFUSE COMP REAR LOAD 18 19Y REFUSE REAR LOAD, 26 YD TANDEM3CF REFUSE COMP REAR LOAD 18 19Y REFUSE REAR LOAD, 26 YD TANDEM3CF REFUSE COMP REAR LOAD 18 19Y REFUSE REAR LOAD, 26 YD TANDEM3CF REFUSE COMP REAR LOAD 18 19Y3CF REFUSE COMP REAR LOAD 18 19Y3CF REFUSE COMP REAR LOAD 18 19Y3CF REFUSE COMP REAR LOAD 18 19Y3CF REFUSE COMP REAR LOAD 18 19Y3CG REFUSE COMP REAR LOAD 20 21Y REFUSE REAR LOAD, 26 YD TANDEM3CJ REFUSE COMP REAR LOAD 24 25Y REFUSE REAR LOAD, 26 YD TANDEM3CJ REFUSE COMP REAR LOAD 24 25Y REFUSE REAR LOAD, 26 YD TANDEM3CJ REFUSE COMP REAR LOAD 24 25Y REFUSE REAR LOAD, 26 YD TANDEM3CJ REFUSE COMP REAR LOAD 24 25Y REFUSE REAR LOAD, 26 YD TANDEM3CJ REFUSE COMP REAR LOAD 24 25Y REFUSE REAR LOAD, 26 YD TANDEM3DF REFUSE COMP ART ARM 18 19YD REFUSE SIDE LOAD , 28 YD TANDEM
37,255 3,217 $60,475 $5,222 $135,115 $11,667 $195,590 $16,88939,880 3,455 $66,577 $5,768 $175,893 $15,239 $242,471 $21,00738,233 3,318 $63,120 $5,478 $146,040 $12,674 $209,161 $18,15232,747 2,910 $58,644 $5,212 $150,321 $13,359 $208,965 $18,57119,275 2,910 $45,424 $6,857 $81,801 $12,348 $127,225 $19,20520,429 3,262 $49,698 $7,935 $50,315 $8,034 $100,013 $15,96921,182 3,382 $51,311 $8,193 $50,068 $7,994 $101,379 $16,18715,982 2,886 $40,082 $7,239 $48,644 $8,785 $88,726 $16,02414,294 2,582 $35,659 $6,440 $43,812 $7,913 $79,471 $14,35316,879 3,048 $42,202 $7,622 $68,501 $12,372 $110,703 $19,99416,022 2,894 $39,917 $7,209 $43,024 $7,770 $82,941 $14,97915,093 2,983 $38,406 $7,590 $40,682 $8,039 $79,088 $15,62929,543 2,626 $52,041 $4,625 $134,486 $11,952 $186,527 $16,57726,079 7,130 $66,441 $18,165 $72,596 $19,848 $139,037 $38,01325,559 6,993 $64,982 $17,780 $98,913 $27,064 $163,895 $44,84423,952 6,862 $58,586 $16,785 $81,822 $23,442 $140,408 $40,22727,955 8,009 $69,741 $19,981 $85,142 $24,393 $154,882 $44,37418,559 8,142 $42,955 $18,844 $52,757 $23,144 $95,711 $41,98836,283 3,102 $56,341 $4,817 $222,989 $19,066 $279,330 $23,883
A-2
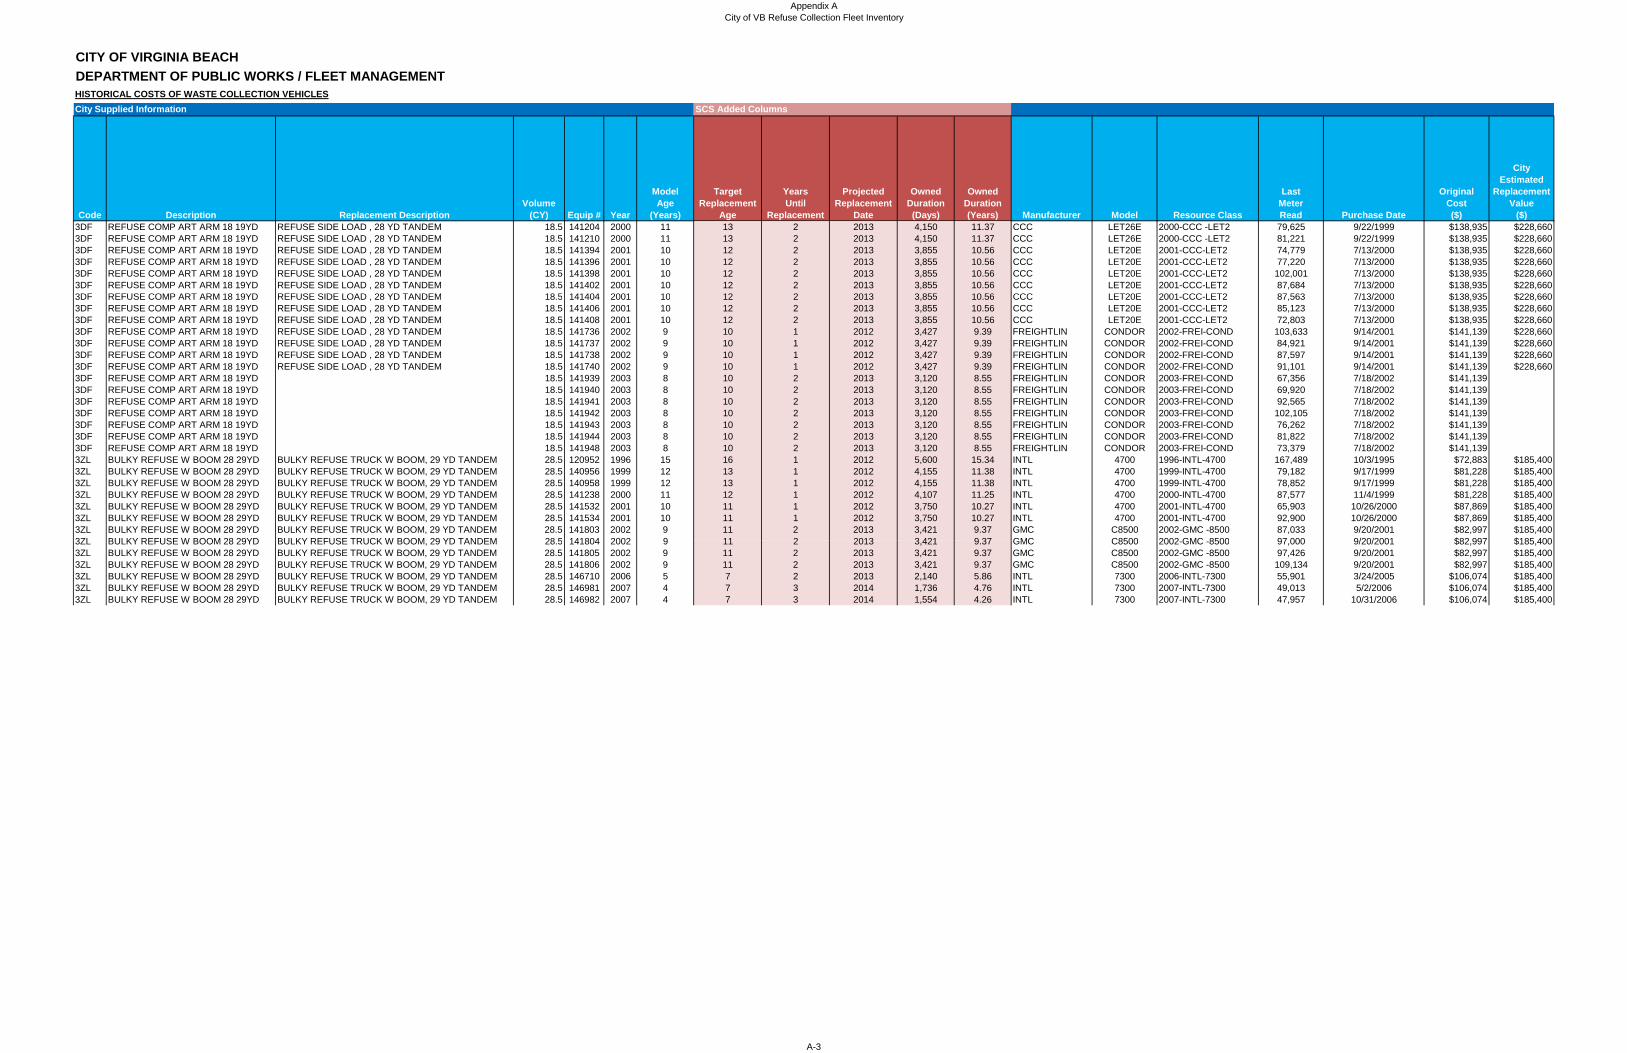
Appendix ACity of VB Refuse Collection Fleet Inventory
CITY OF VIRGINIA BEACHDEPARTMENT OF PUBLIC WORKS / FLEET MANAGEMENTHISTORICAL COSTS OF WASTE COLLECTION VEHICLESCity Supplied Information SCS Added Columns
Code Description Replacement DescriptionVolume
(CY) Equip # Year
ModelAge
(Years)
TargetReplacement
Age
YearsUntil
Replacement
ProjectedReplacement
Date
OwnedDuration(Days)
OwnedDuration(Years) Manufacturer Model Resource Class
Last Meter Read Purchase Date
Original Cost ($)
City Estimated
ReplacementValue
($)3DF REFUSE COMP ART ARM 18 19YD REFUSE SIDE LOAD , 28 YD TANDEM 18.5 141204 2000 11 13 2 2013 4,150 11.37 CCC LET26E 2000-CCC -LET2 79,625 9/22/1999 $138,935 $228,6603DF REFUSE COMP ART ARM 18 19YD REFUSE SIDE LOAD , 28 YD TANDEM 18.5 141210 2000 11 13 2 2013 4,150 11.37 CCC LET26E 2000-CCC -LET2 81,221 9/22/1999 $138,935 $228,6603DF REFUSE COMP ART ARM 18 19YD REFUSE SIDE LOAD , 28 YD TANDEM 18.5 141394 2001 10 12 2 2013 3,855 10.56 CCC LET20E 2001-CCC-LET2 74,779 7/13/2000 $138,935 $228,6603DF REFUSE COMP ART ARM 18 19YD REFUSE SIDE LOAD , 28 YD TANDEM 18.5 141396 2001 10 12 2 2013 3,855 10.56 CCC LET20E 2001-CCC-LET2 77,220 7/13/2000 $138,935 $228,6603DF REFUSE COMP ART ARM 18 19YD REFUSE SIDE LOAD , 28 YD TANDEM 18.5 141398 2001 10 12 2 2013 3,855 10.56 CCC LET20E 2001-CCC-LET2 102,001 7/13/2000 $138,935 $228,6603DF REFUSE COMP ART ARM 18 19YD REFUSE SIDE LOAD , 28 YD TANDEM 18.5 141402 2001 10 12 2 2013 3,855 10.56 CCC LET20E 2001-CCC-LET2 87,684 7/13/2000 $138,935 $228,6603DF REFUSE COMP ART ARM 18 19YD REFUSE SIDE LOAD 28 YD TANDEM 18 5 141404 2001 10 12 2 2013 3 855 10 56 CCC LET20E 2001 CCC LET2 87 563 7/13/2000 $138 935 $228 6603DF REFUSE COMP ART ARM 18 19YD REFUSE SIDE LOAD , 28 YD TANDEM 18.5 141404 2001 10 12 2 2013 3,855 10.56 CCC LET20E 2001-CCC-LET2 87,563 7/13/2000 $138,935 $228,6603DF REFUSE COMP ART ARM 18 19YD REFUSE SIDE LOAD , 28 YD TANDEM 18.5 141406 2001 10 12 2 2013 3,855 10.56 CCC LET20E 2001-CCC-LET2 85,123 7/13/2000 $138,935 $228,6603DF REFUSE COMP ART ARM 18 19YD REFUSE SIDE LOAD , 28 YD TANDEM 18.5 141408 2001 10 12 2 2013 3,855 10.56 CCC LET20E 2001-CCC-LET2 72,803 7/13/2000 $138,935 $228,6603DF REFUSE COMP ART ARM 18 19YD REFUSE SIDE LOAD , 28 YD TANDEM 18.5 141736 2002 9 10 1 2012 3,427 9.39 FREIGHTLIN CONDOR 2002-FREI-COND 103,633 9/14/2001 $141,139 $228,6603DF REFUSE COMP ART ARM 18 19YD REFUSE SIDE LOAD , 28 YD TANDEM 18.5 141737 2002 9 10 1 2012 3,427 9.39 FREIGHTLIN CONDOR 2002-FREI-COND 84,921 9/14/2001 $141,139 $228,6603DF REFUSE COMP ART ARM 18 19YD REFUSE SIDE LOAD , 28 YD TANDEM 18.5 141738 2002 9 10 1 2012 3,427 9.39 FREIGHTLIN CONDOR 2002-FREI-COND 87,597 9/14/2001 $141,139 $228,6603DF REFUSE COMP ART ARM 18 19YD REFUSE SIDE LOAD , 28 YD TANDEM 18.5 141740 2002 9 10 1 2012 3,427 9.39 FREIGHTLIN CONDOR 2002-FREI-COND 91,101 9/14/2001 $141,139 $228,6603DF REFUSE COMP ART ARM 18 19YD 18.5 141939 2003 8 10 2 2013 3,120 8.55 FREIGHTLIN CONDOR 2003-FREI-COND 67,356 7/18/2002 $141,1393DF REFUSE COMP ART ARM 18 19YD 18.5 141940 2003 8 10 2 2013 3,120 8.55 FREIGHTLIN CONDOR 2003-FREI-COND 69,920 7/18/2002 $141,1393DF REFUSE COMP ART ARM 18 19YD 18.5 141941 2003 8 10 2 2013 3,120 8.55 FREIGHTLIN CONDOR 2003-FREI-COND 92,565 7/18/2002 $141,1393DF REFUSE COMP ART ARM 18 19YD 18.5 141942 2003 8 10 2 2013 3,120 8.55 FREIGHTLIN CONDOR 2003-FREI-COND 102,105 7/18/2002 $141,1393DF REFUSE COMP ART ARM 18 19YD 18.5 141943 2003 8 10 2 2013 3,120 8.55 FREIGHTLIN CONDOR 2003-FREI-COND 76,262 7/18/2002 $141,1393DF REFUSE COMP ART ARM 18 19YD 18.5 141944 2003 8 10 2 2013 3,120 8.55 FREIGHTLIN CONDOR 2003-FREI-COND 81,822 7/18/2002 $141,1393DF REFUSE COMP ART ARM 18 19YD 18.5 141948 2003 8 10 2 2013 3,120 8.55 FREIGHTLIN CONDOR 2003-FREI-COND 73,379 7/18/2002 $141,1393ZL BULKY REFUSE W BOOM 28 29YD BULKY REFUSE TRUCK W BOOM, 29 YD TANDEM 28.5 120952 1996 15 16 1 2012 5,600 15.34 INTL 4700 1996-INTL-4700 167,489 10/3/1995 $72,883 $185,4003ZL BULKY REFUSE W BOOM 28 29YD BULKY REFUSE TRUCK W BOOM, 29 YD TANDEM 28.5 140956 1999 12 13 1 2012 4,155 11.38 INTL 4700 1999-INTL-4700 79,182 9/17/1999 $81,228 $185,4003ZL BULKY REFUSE W BOOM 28 29YD BULKY REFUSE TRUCK W BOOM, 29 YD TANDEM 28.5 140958 1999 12 13 1 2012 4,155 11.38 INTL 4700 1999-INTL-4700 78,852 9/17/1999 $81,228 $185,4003ZL BULKY REFUSE W BOOM 28 29YD BULKY REFUSE TRUCK W BOOM, 29 YD TANDEM 28.5 141238 2000 11 12 1 2012 4,107 11.25 INTL 4700 2000-INTL-4700 87,577 11/4/1999 $81,228 $185,4003ZL BULKY REFUSE W BOOM 28 29YD BULKY REFUSE TRUCK W BOOM, 29 YD TANDEM 28.5 141532 2001 10 11 1 2012 3,750 10.27 INTL 4700 2001-INTL-4700 65,903 10/26/2000 $87,869 $185,4003ZL BULKY REFUSE W BOOM 28 29YD BULKY REFUSE TRUCK W BOOM, 29 YD TANDEM 28.5 141534 2001 10 11 1 2012 3,750 10.27 INTL 4700 2001-INTL-4700 92,900 10/26/2000 $87,869 $185,4003ZL BULKY REFUSE W BOOM 28 29YD BULKY REFUSE TRUCK W BOOM, 29 YD TANDEM 28.5 141803 2002 9 11 2 2013 3,421 9.37 GMC C8500 2002-GMC -8500 87,033 9/20/2001 $82,997 $185,4003ZL BULKY REFUSE W BOOM 28 29YD BULKY REFUSE TRUCK W BOOM 29 YD TANDEM 28 5 141804 2002 9 11 2 2013 3 421 9 37 GMC C8500 2002 GMC 8500 97 000 9/20/2001 $82 997 $185 4003ZL BULKY REFUSE W BOOM 28 29YD BULKY REFUSE TRUCK W BOOM, 29 YD TANDEM 28.5 141804 2002 9 11 2 2013 3,421 9.37 GMC C8500 2002-GMC -8500 97,000 9/20/2001 $82,997 $185,4003ZL BULKY REFUSE W BOOM 28 29YD BULKY REFUSE TRUCK W BOOM, 29 YD TANDEM 28.5 141805 2002 9 11 2 2013 3,421 9.37 GMC C8500 2002-GMC -8500 97,426 9/20/2001 $82,997 $185,4003ZL BULKY REFUSE W BOOM 28 29YD BULKY REFUSE TRUCK W BOOM, 29 YD TANDEM 28.5 141806 2002 9 11 2 2013 3,421 9.37 GMC C8500 2002-GMC -8500 109,134 9/20/2001 $82,997 $185,4003ZL BULKY REFUSE W BOOM 28 29YD BULKY REFUSE TRUCK W BOOM, 29 YD TANDEM 28.5 146710 2006 5 7 2 2013 2,140 5.86 INTL 7300 2006-INTL-7300 55,901 3/24/2005 $106,074 $185,4003ZL BULKY REFUSE W BOOM 28 29YD BULKY REFUSE TRUCK W BOOM, 29 YD TANDEM 28.5 146981 2007 4 7 3 2014 1,736 4.76 INTL 7300 2007-INTL-7300 49,013 5/2/2006 $106,074 $185,4003ZL BULKY REFUSE W BOOM 28 29YD BULKY REFUSE TRUCK W BOOM, 29 YD TANDEM 28.5 146982 2007 4 7 3 2014 1,554 4.26 INTL 7300 2007-INTL-7300 47,957 10/31/2006 $106,074 $185,400
A-3
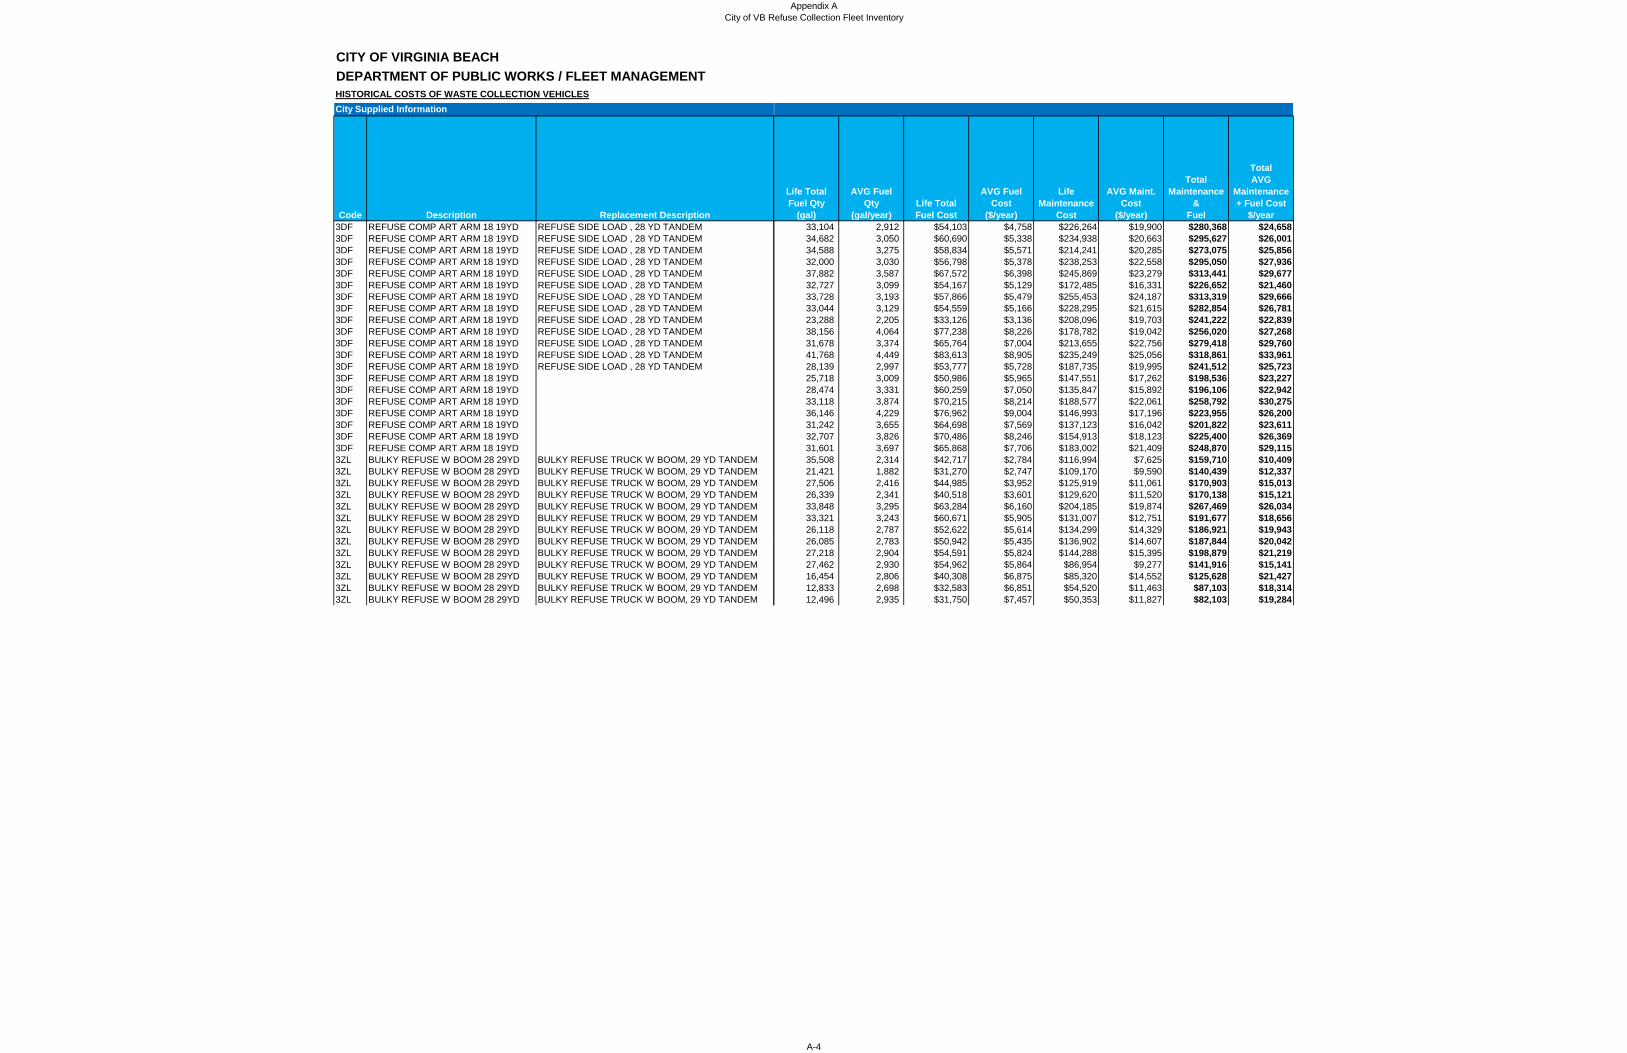
Appendix ACity of VB Refuse Collection Fleet Inventory
CITY OF VIRGINIA BEACHDEPARTMENT OF PUBLIC WORKS / FLEET MANAGEMENTHISTORICAL COSTS OF WASTE COLLECTION VEHICLESCity Supplied Information
Code Description Replacement Description3DF REFUSE COMP ART ARM 18 19YD REFUSE SIDE LOAD , 28 YD TANDEM3DF REFUSE COMP ART ARM 18 19YD REFUSE SIDE LOAD , 28 YD TANDEM3DF REFUSE COMP ART ARM 18 19YD REFUSE SIDE LOAD , 28 YD TANDEM3DF REFUSE COMP ART ARM 18 19YD REFUSE SIDE LOAD , 28 YD TANDEM3DF REFUSE COMP ART ARM 18 19YD REFUSE SIDE LOAD , 28 YD TANDEM3DF REFUSE COMP ART ARM 18 19YD REFUSE SIDE LOAD , 28 YD TANDEM3DF REFUSE COMP ART ARM 18 19YD REFUSE SIDE LOAD 28 YD TANDEM
Life TotalFuel Qty
(gal)
AVG FuelQty
(gal/year)Life TotalFuel Cost
AVG FuelCost
($/year)
LifeMaintenance
Cost
AVG Maint.Cost
($/year)
TotalMaintenance
& Fuel
Total AVG
Maintenance + Fuel Cost
$/year33,104 2,912 $54,103 $4,758 $226,264 $19,900 $280,368 $24,65834,682 3,050 $60,690 $5,338 $234,938 $20,663 $295,627 $26,00134,588 3,275 $58,834 $5,571 $214,241 $20,285 $273,075 $25,85632,000 3,030 $56,798 $5,378 $238,253 $22,558 $295,050 $27,93637,882 3,587 $67,572 $6,398 $245,869 $23,279 $313,441 $29,67732,727 3,099 $54,167 $5,129 $172,485 $16,331 $226,652 $21,46033 728 3 193 $57 866 $5 479 $255 453 $24 187 $313 319 $29 6663DF REFUSE COMP ART ARM 18 19YD REFUSE SIDE LOAD , 28 YD TANDEM
3DF REFUSE COMP ART ARM 18 19YD REFUSE SIDE LOAD , 28 YD TANDEM3DF REFUSE COMP ART ARM 18 19YD REFUSE SIDE LOAD , 28 YD TANDEM3DF REFUSE COMP ART ARM 18 19YD REFUSE SIDE LOAD , 28 YD TANDEM3DF REFUSE COMP ART ARM 18 19YD REFUSE SIDE LOAD , 28 YD TANDEM3DF REFUSE COMP ART ARM 18 19YD REFUSE SIDE LOAD , 28 YD TANDEM3DF REFUSE COMP ART ARM 18 19YD REFUSE SIDE LOAD , 28 YD TANDEM3DF REFUSE COMP ART ARM 18 19YD3DF REFUSE COMP ART ARM 18 19YD3DF REFUSE COMP ART ARM 18 19YD3DF REFUSE COMP ART ARM 18 19YD3DF REFUSE COMP ART ARM 18 19YD3DF REFUSE COMP ART ARM 18 19YD3DF REFUSE COMP ART ARM 18 19YD3ZL BULKY REFUSE W BOOM 28 29YD BULKY REFUSE TRUCK W BOOM, 29 YD TANDEM3ZL BULKY REFUSE W BOOM 28 29YD BULKY REFUSE TRUCK W BOOM, 29 YD TANDEM3ZL BULKY REFUSE W BOOM 28 29YD BULKY REFUSE TRUCK W BOOM, 29 YD TANDEM3ZL BULKY REFUSE W BOOM 28 29YD BULKY REFUSE TRUCK W BOOM, 29 YD TANDEM3ZL BULKY REFUSE W BOOM 28 29YD BULKY REFUSE TRUCK W BOOM, 29 YD TANDEM3ZL BULKY REFUSE W BOOM 28 29YD BULKY REFUSE TRUCK W BOOM, 29 YD TANDEM3ZL BULKY REFUSE W BOOM 28 29YD BULKY REFUSE TRUCK W BOOM, 29 YD TANDEM3ZL BULKY REFUSE W BOOM 28 29YD BULKY REFUSE TRUCK W BOOM 29 YD TANDEM
33,728 3,193 $57,866 $5,479 $255,453 $24,187 $313,319 $29,66633,044 3,129 $54,559 $5,166 $228,295 $21,615 $282,854 $26,78123,288 2,205 $33,126 $3,136 $208,096 $19,703 $241,222 $22,83938,156 4,064 $77,238 $8,226 $178,782 $19,042 $256,020 $27,26831,678 3,374 $65,764 $7,004 $213,655 $22,756 $279,418 $29,76041,768 4,449 $83,613 $8,905 $235,249 $25,056 $318,861 $33,96128,139 2,997 $53,777 $5,728 $187,735 $19,995 $241,512 $25,72325,718 3,009 $50,986 $5,965 $147,551 $17,262 $198,536 $23,22728,474 3,331 $60,259 $7,050 $135,847 $15,892 $196,106 $22,94233,118 3,874 $70,215 $8,214 $188,577 $22,061 $258,792 $30,27536,146 4,229 $76,962 $9,004 $146,993 $17,196 $223,955 $26,20031,242 3,655 $64,698 $7,569 $137,123 $16,042 $201,822 $23,61132,707 3,826 $70,486 $8,246 $154,913 $18,123 $225,400 $26,36931,601 3,697 $65,868 $7,706 $183,002 $21,409 $248,870 $29,11535,508 2,314 $42,717 $2,784 $116,994 $7,625 $159,710 $10,40921,421 1,882 $31,270 $2,747 $109,170 $9,590 $140,439 $12,33727,506 2,416 $44,985 $3,952 $125,919 $11,061 $170,903 $15,01326,339 2,341 $40,518 $3,601 $129,620 $11,520 $170,138 $15,12133,848 3,295 $63,284 $6,160 $204,185 $19,874 $267,469 $26,03433,321 3,243 $60,671 $5,905 $131,007 $12,751 $191,677 $18,65626,118 2,787 $52,622 $5,614 $134,299 $14,329 $186,921 $19,94326 085 2 783 $50 942 $5 435 $136 902 $14 607 $187 844 $20 0423ZL BULKY REFUSE W BOOM 28 29YD BULKY REFUSE TRUCK W BOOM, 29 YD TANDEM
3ZL BULKY REFUSE W BOOM 28 29YD BULKY REFUSE TRUCK W BOOM, 29 YD TANDEM3ZL BULKY REFUSE W BOOM 28 29YD BULKY REFUSE TRUCK W BOOM, 29 YD TANDEM3ZL BULKY REFUSE W BOOM 28 29YD BULKY REFUSE TRUCK W BOOM, 29 YD TANDEM3ZL BULKY REFUSE W BOOM 28 29YD BULKY REFUSE TRUCK W BOOM, 29 YD TANDEM3ZL BULKY REFUSE W BOOM 28 29YD BULKY REFUSE TRUCK W BOOM, 29 YD TANDEM
26,085 2,783 $50,942 $5,435 $136,902 $14,607 $187,844 $20,04227,218 2,904 $54,591 $5,824 $144,288 $15,395 $198,879 $21,21927,462 2,930 $54,962 $5,864 $86,954 $9,277 $141,916 $15,14116,454 2,806 $40,308 $6,875 $85,320 $14,552 $125,628 $21,42712,833 2,698 $32,583 $6,851 $54,520 $11,463 $87,103 $18,31412,496 2,935 $31,750 $7,457 $50,353 $11,827 $82,103 $19,284
A-4