City of Sanibel, Florida 1976, the first 2½ miles of Sanibel's paths ... Independent Auditors’...
179
City of Sanibel, Florida Comprehensive Annual Financial Report For the fiscal year ended September 30, 2014
Transcript of City of Sanibel, Florida 1976, the first 2½ miles of Sanibel's paths ... Independent Auditors’...

City of Sanibel, Florida
Comprehensive Annual Financial Report For the fiscal year ended September 30, 2014

City of Sanibel elevated to "Silver" status as a Bicycle Friendly CommunitySM by the League of American Bicyclists
In 2014, the League of American Bicyclists recognized the City of Sanibel with a "Silver" Bicycle Friendly Community (BFBSM) award. In 2010 Sanibel was awarded the "Bronze" designation. Only three other Florida communities hold this prestigious designation. This national recognition from the League of American Bicyclists is a source of community pride and appreciated by all.
"Visionary community leaders are recognizing the real‐time and long term impact that a culture of bicycling can create," said Andy Clarke, President of the League of American Bicyclists. "We applaud this new round of communities for investing in a more sustainable future for the country and a healthier future for their residents and beyond." In 1972, four Island women organized the Sanibel Path Committee to start a system of "hike and bike" trails to protect their young children. Since then, the community has systematically developed a citywide non‐motorized transportation network. This accomplishment has only been possible due to the City’s partners every step of the way – the Sanibel Bicycle Club. The Sanibel Bicycle Club was founded in 1994 and in 2005 established a non‐profit fund dedicated to supporting path enhancements. Shortly thereafter the Club constructed a Visitor Center on the Periwinkle Path In 1976, the first 2½ miles of Sanibel's paths were built along Periwinkle Way with seed money from the original Sanibel Bike Path Committee and a matching grant from the Florida Department of Transportation. Today the City has more than 25 miles of paved Shared Use Paths and 8 miles of natural surface paths. In 2009 the City adopted the Shared Use Path Master Plan which developed a program to annually expand and improve path safety. As a bikeable and walkable community, Sanibel actively promotes and encourages biking to community events and the weekly Farmers' Market. More information about the Bike Friendly Community program is available at www.bikeleague.org/BFA.

COMPREHENSIVE ANNUAL FINANCIAL REPORT
City of Sanibel, Florida
For the Fiscal Year Ended September 30, 2014
Prepared by the Finance Department
Sylvia A. Edwards, MBA, CPA, CGFO, CPFO Finance Director

CITY OF SANIBEL, FLORIDA COMPREHENSIVE ANNUAL FINANCIAL REPORT
FOR THE FISCAL YEAR ENDED SEPTEMBER 30, 2014 __________________________________________________________________________________________
TABLE OF CONTENTS
I. INTRODUCTORY SECTION Letter of Transmittal .......................................................................................................................................... 7 Certificate of Achievement for Excellence in Financial Reporting .................................................................. 20 Organizational Chart ....................................................................................................................................... 21 List of City Officials and Executive Staff ......................................................................................................... 22
II. FINANCIAL SECTION Independent Auditors’ Report ......................................................................................................................... 25 Management’s Discussion and Analysis ........................................................................................................ 28 BASIC FINANCIAL STATEMENTS
Government-wide Financial Statements Statement of Net Position ..................................................................................................................... 48 Statement of Activities ........................................................................................................................... 49
Governmental Fund Financial Statements Balance Sheet – Governmental Funds ................................................................................................. 50 Reconciliation of the Balance Sheet – Governmental Funds to the Government-wide Statement of Net Position .................................................................................... 51 Statement of Revenues, Expenditures, and Changes in Fund Balances – Governmental Funds ......................................................................................................................... 52 Reconciliation of the Statement of Revenues, Expenditures, and Changes in Fund Balances – Governmental Funds to the Government-wide Statement of Activities ................. 53 Statement of Revenues, Expenditures, and Changes in Fund Balance Budget and Actual – General Fund ................................................................................................... 54 Statement of Revenues, Expenditures, and Changes in Fund Balance Budget and Actual – Other Major Funds ........................................................................................... 55 Proprietary Fund Financial Statements Statement of Net Position – Proprietary Funds .................................................................................... 56 Statement of Revenues, Expenses, and Changes in Net Position – Proprietary Funds ...................... 58 Statement of Cash Flows – Proprietary Funds ..................................................................................... 59 Fiduciary Fund Financial Statements Statement of Net Position – Fiduciary Funds........................................................................................ 61 Statement of Changes in Fiduciary Net Position – Fiduciary Funds .................................................... 62 Notes to the Financial Statements............................................................................................................... 63 REQUIRED SUPPLEMENTARY INFORMATION General Employees’ Pension Plan ............................................................................................................ 114 Municipal Police Officers’ Pension Plan .................................................................................................... 117 Other Post-Employment Benefits Plan ...................................................................................................... 120 COMBINING FINANCIAL STATEMENTS AND SCHEDULES Nonmajor Governmental Funds Combining Balance Sheet – Nonmajor Governmental Funds ............................................................ 123 Combining Statement of Revenues, Expenditures, and Changes in Fund Balances – Nonmajor Governmental Funds ........................................................................................................ 125 Schedule of Revenues, Expenditures, and Changes in Fund Balance – Budget and Actual Water Quality Education .................................................................................................................. 127 Historical Committee ........................................................................................................................ 127 Road Impact Fees............................................................................................................................ 128 Community Park Impact Fees ......................................................................................................... 128
2

Father Madden Estate ..................................................................................................................... 129 Building Department ........................................................................................................................ 129 Elementary School Ball Park Maintenance ..................................................................................... 130 Shell Harbor Dredging ..................................................................................................................... 130 Sanibel Estates Canal Trimming ..................................................................................................... 131 Sanibel Isles/Water Shadows Dredging .......................................................................................... 131 2012 $2.97M General Obligation Bonds ......................................................................................... 132 2006 $8.35M General Obligation Bonds ......................................................................................... 132 Capital Asset Acquisition ................................................................................................................. 133 Transportation Capital Projects ....................................................................................................... 133 Periwinkle Bike Path & Road Project ............................................................................................... 134 Recreation Facility Sinking Fund ..................................................................................................... 134 Fiduciary Funds Combining Statement of Net Position – Fiduciary Funds ................................................................... 136 Combining Statement of Changes in Net Position – Fiduciary Funds ................................................ 137 Combining Statement of Changes in Assets and Liabilities – Agency Funds .................................... 138 III. STATISTICAL SECTION Financial Trends Net Position by Component ....................................................................................................................... 140 Changes in Net Position ............................................................................................................................ 141 Fund Balances of Governmental Funds .................................................................................................... 143 Changes in Fund Balances of Governmental Funds ................................................................................. 144 Tax Revenue by Source – Governmental Funds ...................................................................................... 145 Revenue Capacity Assessed and Estimated Actual Value of Taxable Property ..................................................................... 146 Direct and Overlapping Property Tax Rates .............................................................................................. 147 Principal Property Taxpayers .................................................................................................................... 148 Property Tax Levies and Collections ......................................................................................................... 149 Sanibel Sewer System Sewer Rates ......................................................................................................... 150 Debt Capacity Ratios of Outstanding Debt by Type.......................................................................................................... 151 Ratios of General Bonded Debt Outstanding ............................................................................................ 152 Direct and Overlapping Governmental Activities Debt .............................................................................. 153 Wastewater Revenue Bond Coverage ...................................................................................................... 154 Wastewater Revenue Note Coverage ....................................................................................................... 155 Demographic and Economic Information Demographic and Economic Statistics ...................................................................................................... 156 Principal Employers ................................................................................................................................... 157 Operating Information Full-time Equivalent City Government Employees by Function/Program ................................................. 158 Operating Indicators by Function/Program ................................................................................................ 159 Capital Assets Statistics by Function/Program .......................................................................................... 160 Schedule of Insurance Coverage .............................................................................................................. 161 IV. GOVERNMENT AUDITING STANDARDS Independent Auditors’ Report on Internal Control Over Financial Reporting and on Compliance and Other Matters Based on an Audit of Financial Statements Performed in Accordance with Government Auditing Standards ............................................................................................................... 165 V. MANAGEMENT LETTER AND RESPONSES Independent Auditors’ Management Letter ............................................................................................... 169 Management’s Response to Management Letter ..................................................................................... 173 Independent Accountants’ Examination Report ........................................................................................ 175
3

4

This section contains the following subsections:
Letter of Transmittal ......................................................................................................... 7
Government Finance Officers Association Certificate of Achievement For Excellence in Financial Reporting ................................. 20
City of Sanibel Organizational Chart .............................................................................. 21
List of City Officials and Executive Staff ........................................................................ 22
INTRODUCTORYSECT
ION
5

6

City of Sanibel
800 Dunlop Road Sanibel, Florida 33957-4096
www.mysanibel.com
AREA CODE – 239
CITY COUNCIL
ADMINISTRATIVE
BUILDING
EMERGENCY MANAGEMENT
FINANCE
LEGAL
NATURAL RESOURCES
RECREATION
PLANNING
POLICE
PUBLIC WORKS
472-4135
472-3700
472-4555
472-3111
472-9615
472-4359
472-3700
472-0345
472-4136
472-3111
472-6397
March 30, 2015 Honorable Mayor and Members of City Council City of Sanibel, Florida Sanibel, Florida The Comprehensive Annual Financial Report of the City of Sanibel, Florida, (the “City”) for the fiscal year ended September 30, 2014 is respectfully submitted. Chapter 218.39, Florida Statutes, requires that a complete set of financial statements be published within nine months of the fiscal year end, be presented in conformance with accounting principles generally accepted in the United States of America (GAAP) and audited in accordance with auditing standards generally accepted in the United States of America by licensed independent certified public accountants. This report consists of management’s representations concerning the finances of the City. Consequently, management assumes full responsibility for the completeness and reliability of all of the information presented in this report. To provide a reasonable basis for making these representations, management of the City has established a comprehensive internal control framework that is designed both to protect the government’s assets from loss, theft or misuse, and to compile sufficient, reliable information for the preparation of the City’s financial statements in conformity with GAAP. Because the cost of internal controls should not outweigh their benefits, the City’s comprehensive framework of internal controls has been designed to provide reasonable rather than absolute assurance that the financial statements will be free from material misstatement. As management, we assert that, to the best of our knowledge and belief, this financial report is complete and reliable in all material respects. The City of Sanibel’s financial statements have been audited by CliftonLarsonAllen, LLP a licensed certified public accounting firm. The independent audit was performed to provide reasonable assurance that the financial statements of the City for the fiscal year ended September 30, 2014 are free of material misstatement. The independent audit involved examining, on a test basis, evidence supporting the amounts and disclosures in the financial statements; assessing the accounting principles used and significant estimates made by management and evaluating the overall financial statement presentation. The independent auditor concluded, based upon the audit, that there was a reasonable basis for rendering an unmodified (“clean”) opinion that the City’s financial statements for the fiscal year ended September 30, 2014 are fairly presented in conformity with GAAP. The independent auditor’s report is presented as the first component of the financial section of this report.
Management’s discussion and analysis (MD&A) immediately follows the independent auditor’s report and provides a narrative introduction, overview and analysis of the basic financial statements. The MD&A complements this letter of transmittal and should be read in conjunction with it.
7

CITY PROFILE The City of Sanibel incorporated on November 5, 1974. The City is located on Sanibel Island, a barrier island in the Gulf of Mexico off the coast of southwest Florida in Lee County. The City is connected to the mainland by a three-mile causeway owned and operated by Lee County. The City operates under the council-manager form of government. Policy-making and legislative authority is vested in a governing council consisting of five (5) non-partisan members elected at-large in staggered four (4) year terms. One council member is selected annually from among the five council members to serve as mayor. The City Council is responsible for adopting ordinances and resolutions, adopting the annual budget, appointing the planning commission and advisory committees and hiring the City Manager and City Attorney. The City Manager is responsible for administering policies and ordinances of the City Council, overseeing the day-to-day operations of the City and appointing the heads of the various City departments, the chief of police and city clerk. The City Council is required to adopt a final budget no later than the close of the fiscal year. The annual budget serves as the foundation for the City’s financial planning and control. The budget is prepared by fund, function (e.g. public safety) and department (e.g. police). The City Manager may authorize appropriation transfers within departments of the general fund and within the fund as a whole for all other funds. The transfers are requested by the relevant department director. The transfers are reviewed and processed by Finance staff and approved by the City Manager as required by administrative policy. Any other revisions require approval by City Council. The City provides a comprehensive range of municipal services including general government, public safety (police protection, emergency management and building inspection), planning, natural resource management, sewer utility services including reclaimed water, transportation, (road, bridge and multi-use path construction and maintenance) and culture/recreation activities. Fire and library services are provided by independent taxing districts, electric service is provided by a cooperative and water service is provided by a non-profit. Private, not-for-profit organizations also provide additional community services including a below market rate housing program, a historical village and museum and a cultural arts center.
The Comprehensive Annual Financial Report includes all funds of the City of Sanibel and its component unit. The City as the primary government includes Community Housing and Resources, Inc. (CHR) as a component unit using the discrete method of presentation determined pursuant to Government Accounting Standards Board (GASB) Statement No. 14, as amended, criteria. CHR is under contract with the City to administer the City’s below market rate housing program. Although the board of CHR is not selected by the City Council, CHR is fiscally dependent upon the City in that there is a financial obligation by the City and the nature and significance of the relationship between the City and CHR is such that excluding CHR from the City’s financial statements would be misleading and incomplete.
ECONOMIC CONDITION AND OUTLOOK Sanibel is a world class visitor destination with a mild winter climate, 15.5 miles of white sandy beaches that are habitat for numerous endangered and threatened species, 25.06 miles of paved shared use paths and numerous eco-tourist opportunities. Sixty-seven percent of the island’s land area is located within the J.N. Ding Darling National Wildlife Refuge; other designated conservation land brings Sanibel’s total of land under conservation to 70 percent. The island is a world-renowned location for birding and shelling. Protection of the island’s natural environment is the paramount priority of the City of Sanibel and residents as evidenced in the City’s vision statement;
“Sanibel is and shall remain a barrier island sanctuary, one in which a diverse population lives in harmony with the island’s wildlife and natural habitats.”
8

Since incorporation, as the City approaches build-out, the population rate of growth has slowed from 201% between 1970 and 1980, 62% between 1980 and 1990, 11% between 1990 and 2000, and 7% between 2000 and 2010. On April 1, 2014 the estimated population was 6,490 (0.32% increase) according to the Bureau of Economic and Business Research at the University of Florida.
*Source: United States Census Bureau, 2010 Census As compared to Lee County and the State of Florida, Sanibel has a relatively older, higher educated population with higher median household incomes.
*Source: United States Census Bureau, 2010 Census According to the Lee County Visitor and Convention Bureau (VCB), tourism employs one out of every five people in Lee County. Based upon statistics collected by the VCB, Lee County receives approximately five million visitors a year that generate approximately $3 billion dollars in economic impact. In fiscal year 2014 Lee County’s tourism industry generated $33.348 million in tourist tax (bed tax), an increase of 16.5% over FY2013 $28.622 million.
1,117
3,363
5,4686,064
6,469
0
1,000
2,000
3,000
4,000
5,000
6,000
7,000
1970 Census 1980 Census 1990 Census 2000 Census 2010 Census
City of SanibelUS Census Data 1970-2010
Sanibel Lee County Florida
Population 6,469 618,754 18,801,310
Persons under 5 Years (%) 1.3% 5.3% 5.7%
Persons under 18 Years (%) 7.9% 19.5% 21.3%
Persons 65 & Older (%) 50.1% 23.5% 17.3%
Female Persons (%) 52.7% 50.9% 51.1%
High School Graduates (% of persons age 25+) 99.0% 86.7% 85.3%
Bachelor's Degree or higher (% of persons aged 25+) 58.5% 24.6% 25.9%
Median household income 2006-2010 $87,926 $50,014 $47,661
Per capita income past 12 months $79,742 $29,445 $26,551
Persons below poverty level (%) 4.8% 12.0% 13.8%
9

In the past decade Lee County has experienced the extremes of economic prosperity and economic decline. In 2005 it had one of the lowest unemployment rates in the entire nation at 2.9% and in 2009 one of the highest at 13.8%. In December 2014 the rate stood at 5.0%, the 5th year of decline.
*Source: U.S. Department of Labor NOTE: Unemployment rate is for the Cape Coral-Ft. Myers, FL Metropolitan Statistical Area as of December 2014 .
The majority of visitors to Lee County and Sanibel fly to the destination arriving via the Southwest Florida International Airport (RSW), located 26 miles from the City. The number of visitors arriving at RSW peaked in 2007 with 8.050 million passengers. Local air traffic increased by 4.3% between 2013 (7.638 million) and 2014 (7.970 million). The sole means of vehicular access to Sanibel Island is a causeway owned and operated by Lee County. Annual traffic crossing the causeway peaked in 2001 (3.476 million). Total traffic vehicles entering Sanibel over the causeway increased by 4.6% between 2013 (3.067 million) and 2014 (3.209 million). An interlocal agreement with Lee County provides that the City will receive 21% of surplus tolls once the causeway’s junior lien debts were paid. These obligations were satisfied in FY2013. The City received $1.367 million in FY2014. Historically, in addition to tourism, real estate has been a major economic component of the region and the City of Sanibel. Sales of single family homes peaked on Sanibel in 2004, with 269 homes sold. In 2014 the volume of single family homes sold increased from 197 homes sold in 2013 to 206 homes sold in 2014.
*Source: Sanibel Island VIP Realty Group
2.9 3.1
5.2
9.3
13.8
12.5
10.2
8.0
5.85.0
0
5
10
15
Lee County Unemployment Rate
266
156143 148 144
124
179 183197
206
0
50
100
150
200
250
300
2005 2006 2007 2008 2009 2010 2011 2012 2013 2014
City of Sanibel Total Homes Sold2005-2014
10
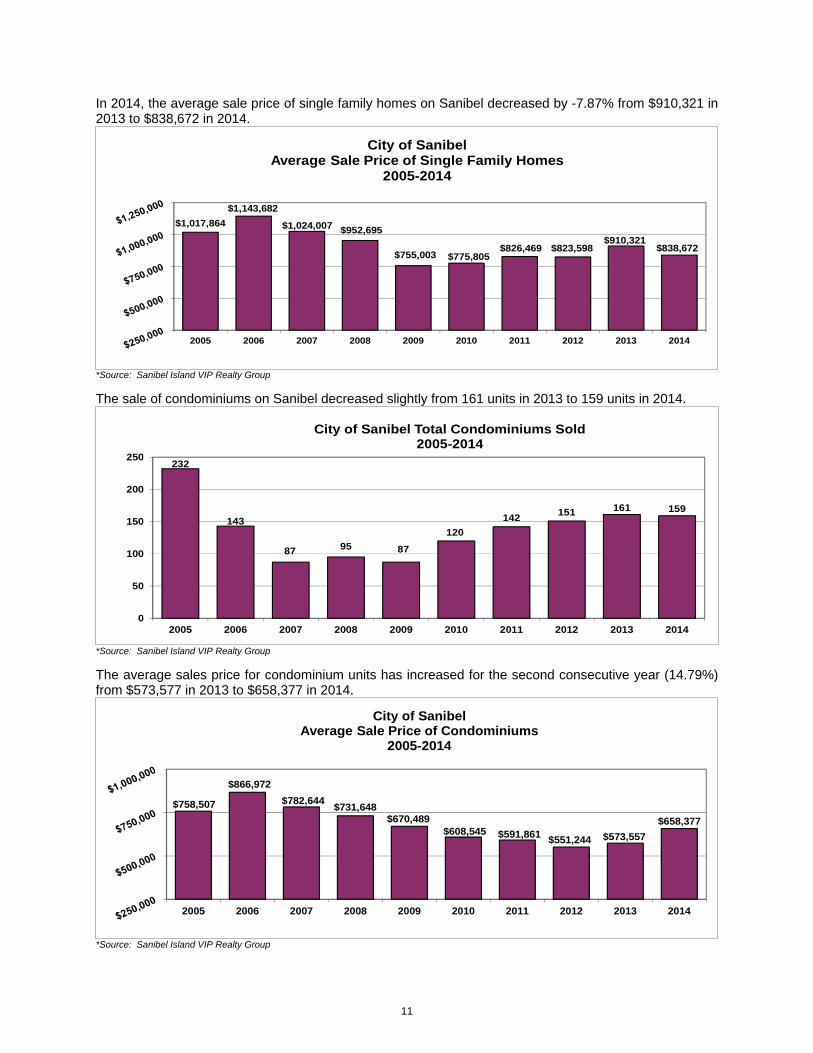
In 2014, the average sale price of single family homes on Sanibel decreased by -7.87% from $910,321 in 2013 to $838,672 in 2014.
*Source: Sanibel Island VIP Realty Group The sale of condominiums on Sanibel decreased slightly from 161 units in 2013 to 159 units in 2014.
*Source: Sanibel Island VIP Realty Group The average sales price for condominium units has increased for the second consecutive year (14.79%) from $573,577 in 2013 to $658,377 in 2014.
*Source: Sanibel Island VIP Realty Group
$1,017,864$1,143,682
$1,024,007 $952,695
$755,003 $775,805$826,469 $823,598
$910,321$838,672
2005 2006 2007 2008 2009 2010 2011 2012 2013 2014
City of Sanibel Average Sale Price of Single Family Homes
2005-2014
232
143
87 95 87
120142 151 161 159
0
50
100
150
200
250
2005 2006 2007 2008 2009 2010 2011 2012 2013 2014
City of Sanibel Total Condominiums Sold2005-2014
$758,507
$866,972$782,644 $731,648
$670,489$608,545 $591,861 $551,244 $573,557
$658,377
2005 2006 2007 2008 2009 2010 2011 2012 2013 2014
City of SanibelAverage Sale Price of Condominiums
2005-2014
11

Sanibel experienced an increase in construction of new single family homes from 17 units in 2013 to 23 units in 2014.
The average price of new homes constructed on Sanibel has averaged below $700,000 in four of the last seven years.
*Source: City of Sanibel, Building Department
Since 2008 the City had seen an overall trend towards relatively smaller homes constructed. With the exception of 2013; the average single family residence total square footage is trending below 6,000 square feet.
*Source: City of Sanibel, Building Department
27
17
13 1310
1317
23
17
23
0
10
20
30
2005 2006 2007 2008 2009 2010 2011 2012 2013 2014
Total Single Family Permits Issued By Fiscal Year
$990,353
$813,671
$682,043 $693,202 $631,446
$790,235
$655,151
$0
$250,000
$500,000
$750,000
$1,000,000
2008 2009 2010 2011 2012 2013 2014
DO
LLA
R V
ALU
E
FISCAL YEAR
Average Cost Of Single Family ResidencesBy Fiscal Year
7,0795,920
5,331 5,6775,125
7,108
5,742
0
2,500
5,000
7,500
2008 2009 2010 2011 2012 2013 2014
SQU
AR
E FO
OTA
GE
FISCAL YEAR
Single Family Residence Average Total Square Footage By Fiscal Year
*Source: City of Sanibel, Building Department
12

In 2004, the City sustained major damage due to Hurricane Charley. The number of on-Island businesses the year of the hurricane was 3,234 and in 2014, the number of on-island businesses decreased to 2,898.
*Source: City of Sanibel, Finance Department
Sanibel’s property values peaked in 2007 before beginning to decline in 2008. Property values are 17.2% lower in 2014 compared to the 2007 peak year. In 2014 the City experienced its second year of increased taxable property values (4.8%) following five (5) consecutive years of decline.
*Source: Lee County Property Appraiser
3,206 3,129 3,153 3,224 3,162 3,0993,229
3,039 2,928 2,8982,811
0
1,000
2,000
3,000
4,000
2005 2006 2007 2008 2009 2010 2011 2012 2013 2014 2015
Business Tax Receipts ‐ On Island BusinessesBy Fiscal Year
As of 3/26/15
$4.09
$4.99 $5.20
$4.90
$4.51 $4.21 $4.16 $4.08 $4.10
$4.30
$-
$1.00
$2.00
$3.00
$4.00
$5.00
$6.00
2005 2006 2007 2008 2009 2010 2011 2012 2013 2014
Billi
ons
Tax Year
Taxable Property Values(In Billions)
13
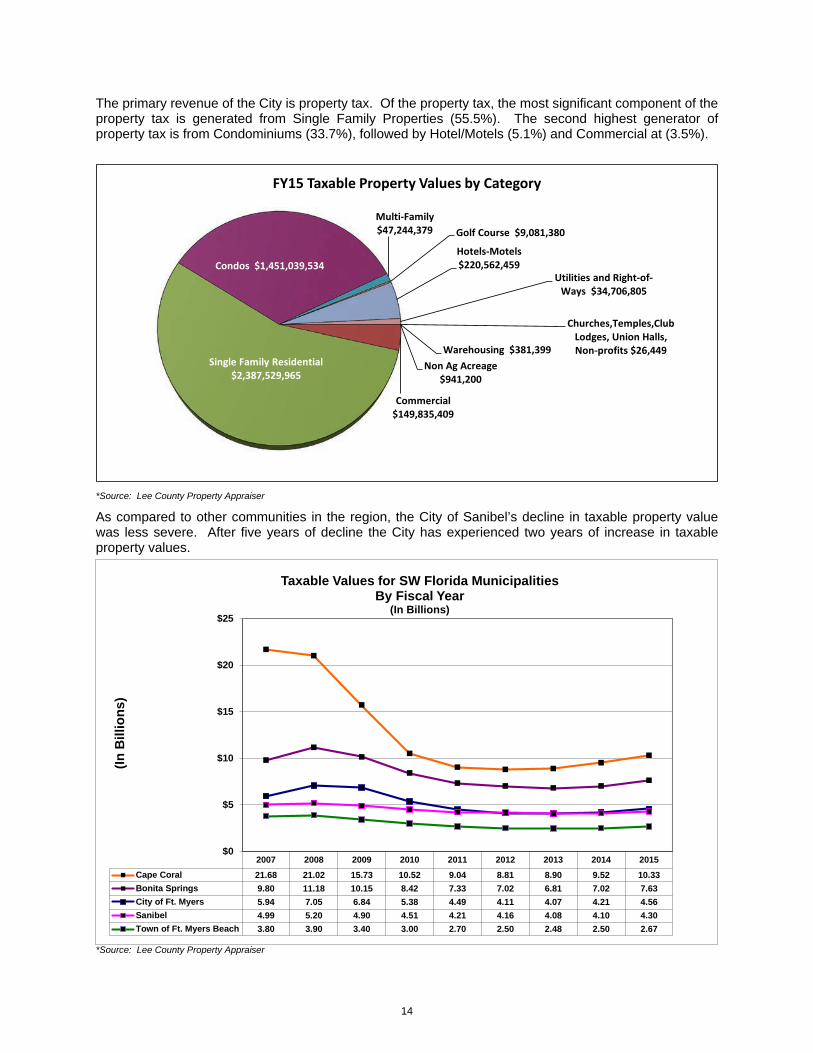
The primary revenue of the City is property tax. Of the property tax, the most significant component of the property tax is generated from Single Family Properties (55.5%). The second highest generator of property tax is from Condominiums (33.7%), followed by Hotel/Motels (5.1%) and Commercial at (3.5%).
*Source: Lee County Property Appraiser
As compared to other communities in the region, the City of Sanibel’s decline in taxable property value was less severe. After five years of decline the City has experienced two years of increase in taxable property values.
*Source: Lee County Property Appraiser
Non Ag Acreage $941,200
Commercial $149,835,409
Single Family Residential $2,387,529,965
Condos $1,451,039,534
Multi-Family $47,244,379 Golf Course $9,081,380
Hotels-Motels $220,562,459
Utilities and Right-of-Ways $34,706,805
Warehousing $381,399
Churches,Temples,Club Lodges, Union Halls, Non-profits $26,449
FY15 Taxable Property Values by Category
2007 2008 2009 2010 2011 2012 2013 2014 2015Cape Coral 21.68 21.02 15.73 10.52 9.04 8.81 8.90 9.52 10.33Bonita Springs 9.80 11.18 10.15 8.42 7.33 7.02 6.81 7.02 7.63City of Ft. Myers 5.94 7.05 6.84 5.38 4.49 4.11 4.07 4.21 4.56Sanibel 4.99 5.20 4.90 4.51 4.21 4.16 4.08 4.10 4.30Town of Ft. Myers Beach 3.80 3.90 3.40 3.00 2.70 2.50 2.48 2.50 2.67
$0
$5
$10
$15
$20
$25
(In B
illio
ns)
Taxable Values for SW Florida MunicipalitiesBy Fiscal Year
(In Billions)
14

LONG-TERM FINANCIAL PLANNING
During the current economic down-turn, the City of Sanibel has followed the strategy of reducing fixed costs (personnel and pension), reducing debt, lowering taxes, and protecting reserves. The City’s initiatives to improve the pension plans’ stability have produced positive results. The General Employees’ Pension Plan’s funded ratio has increased from a low of 48.24% to 82.51%; the Municipal Police Officers’ Pension Plan’s funded ratio has increased from a low of 57.14% to 77.85%. At year end the City’s general fund’s unassigned fund balance of $2.802 million was equal to 24.2 percent of general fund operating expenditures. On September 30, 2014, unassigned fund balance available to Council in the general fund (24.2 percent of general fund operating expenditures) falls within the fund balance policy guidelines set by the Council for budgetary and planning purposes (i.e., 17 percent of general fund operating expenditures). If the general fund’s unassigned fund balance falls below the acceptable level, the City shall take action necessary to restore the unassigned fund balance to acceptable levels within two years. The City increased the number of full-time employees from 117 in 2013 to 124 in 2014. The City’s 2014 full-time workforce is 12.7% lower than the 2006 full-time workforce of 142.
*Source: City of Sanibel, Finance Department
Effective in 2011, City Council significantly modified the General Employees’ Defined Benefit Pension Plan to improve the plan’s funded ratio and to contain future long-term pension costs. Current employees were provided the option to make an irrevocable election to opt out of the defined benefit plan and to participate in a defined contribution plan. The defined benefit plan was closed to new hires in February 2012. The City’s priority is to maintain Sanibel as a world-class, safe, clean, environmentally and fiscally sound municipality. During the economic downturn Sanibel maintained its strong financial position through prudent long-term financial planning and fiscal actions to reduce or contain fixed costs. The City is currently operating under the assumption that the recent economic recession has had a significant impact on Sanibel. This year, even though we experienced upticks in taxable property values, there remains concern how the new flood insurance rates will impact Sanibel property values. Council recognizes that as a barrier island in the sub-tropics, the City remains vulnerable to natural events such as tropical storms and hurricanes. In response to the City’s natural vulnerabilities from nature and man, Council committed $4.5 million for a disaster reserve and $1.0 million for an environmental initiative reserve. The City continues to evaluate and implement user fees as part of its efforts for long-term sustainability. In September 2014 the City Council approved a 5 percent increase in Recreation facility membership fees
142 140 135125 120
114 114 117124
0
25
50
75
100
125
150
2006 2007 2008 2009 2010 2011 2012 2013 2014
City of Sanibel Full-time Employees As of September 30
15

for residents and 10 percent increase for non-residents; activity and rental fees were increased 5 percent for members and 10 percent for non-members. Sewer fees and reclaimed water rates were increased 3.0 percent beginning October 1, 2014. Beach parking hourly parking fee was increased from $2 to $3. In the 2015 budget all other City fees were held flat. The building department and planning department FY2012 and FY2013 fee reductions were continued into FY2015. The City of Sanibel general operating millage has reduced from 2.500 mils in fiscal year 2007, to 1.9995 mils in fiscal year 2015, with no reduction in basic services.
*Source: City of Sanibel, Finance Department
The City Council takes the responsibility of being stewards of the public’s funds very seriously. Responsible management of public funds has enabled the City to build general fund reserves at an amount above the minimum established policy levels, leaving our City in a solid financial position. RELEVANT FINANCIAL POLICIES Budgetary control is established by Section 3.12 of the City Charter, which requires the adoption of an annual budget and Section 3.13, which provides for supplemental amendments to increase, decrease or transfer funds within the annual budget framework. Budgetary control throughout the fiscal year is maintained through monitoring encumbrances of estimated purchase amounts. Encumbrances for goods or services not received by fiscal year-end lapse and must be re-budgeted in the following year. Downward trends in the state and/or local economy would adversely impact the City’s ability to realize its historical levels of revenues. Therefore quarterly monitoring and conservative budgeting should mitigate any unforeseen circumstances. Complementing this practice is one in which certain expenses or expenditures are frozen and not released for use until it is clear that revenues will be at projected levels. The City has an investment policy in place which places a priority on the safety of principal and liquidity. The policy incorporates the principles of limiting investment risk, maintaining adequate liquidity and flexibility to meet both scheduled and unscheduled obligations and lastly, maximizing returns.
2.5000 2.1966 2.1561 2.1561 2.1561 2.1038 2.1000 2.0861 1.9995
0.2363
0.2346 0.2636 0.2856 0.2484 0.2360 0.2407 0.2295 0.2125
-
0.5000
1.0000
1.5000
2.0000
2.5000
3.0000
3.5000
2007 2008 2009 2010 2011 2012 2013 2014 2015
City of Sanibel Millage Rate HistoryBy Fiscal Year
General Operating Voted Debt Service ‐ Sewer Voted Debt Service ‐ Land Voted Debt Service ‐ Recreation Facility
2.5779 2.5760 2.6150 2.5908 2.5260 2.5570 2.5307 2.4145
2.8983
16

The City does not issue debt, long or short term, to finance operational costs. The City does not have a maximum debt limit. Debt terms are matched with the life of the asset being financed. All debt service requirements are fully funded each year. The City maintains unassigned fund balance in accordance with established fund balance policy of 17 percent of general fund operating expenditures. The budget continues to reserve significant taxing capacity for future needs and avoids using one-time revenue sources to fund ongoing City services. MAJOR INITIATIVES The City will continue to provide quality services to the Sanibel community. The major initiatives planned are: I. REDEVELOPMENT WORK PLAN FOR THE COMMERCIAL DISTRICT
Continue the City-wide redevelopment work plan by focusing on the future success and stability of the City’s Commercial District as it relates to the existing mix of retail and service uses that accommodate fulltime and seasonal residents and visitors of Sanibel. As an outcome of this work plan and effort Staff will:
Develop an area referred to as the “Civic Core,” which would incorporate architectural and environmental design standards that reinforces the natural rural and residential character of the community, eases traffic and parking congestions, and provides for a centralized area for community events and gatherings; and,
Update specific redevelopment zoning and land use requirements that consider the evolution of our community and are consistent with the community’s vision statement and Sanibel Plan. The specific land use issues will include permitted uses, parking, interconnectivity, non-conforming structures and setbacks. Develop codes to address the pre-incorporation non-conforming Commercial developments, creating an atmosphere to encourage reinvestment and eliminate those properties with a tired or shabby appearance.
II. SUSTAIN AND STRENGTHEN THE CITY’S FINANCIAL STABILITY
Develop a long-term debt early retirement plan, identify adequate reserves to sustain the City and identify a policy to adequately track and better evaluate potential revenue that might come from Causeway toll revenues.
Continue to evaluate options to retire the City’s debt in order to reduce annual fixed costs and produce substantial finance cost savings for taxpayers;
Evaluate current reserves to determine and identity a policy to adequately to determine appropriate levels based on risk factors, access to liquidity, insurance deductibles and current condition based on historical values; and,
Develop a process for evaluating, communicating and collecting toll revenues from Lee County that allows for open dialog and transparency between staffs.
Develop a five year projection to include all revenues, expenses, reserves and outstanding debt.
III. IMPROVE WATER QUALITY AND QUANTITY Work with local, state, and federal stakeholders in the prevention, correction, and preservation of water quality and water quality issues surrounding the City of Sanibel.
17

Local The Florida Department of Environmental Protection (FDEP) will be developing a Total Maximum Daily Load (TMDL) for the Sanibel River during the next one to two years. This will require the City to reduce nutrient loading to the River to meet the TMDL target. A Basin Management Action Plan (BMAP) will be developed by the FDEP in collaboration with the City to help guide nutrient reductions to achieve TMDL compliance.
In an effort to protect Sanibel’s water quality and to proactively address nutrient loading to the Sanibel River, the City has begun work on a Comprehensive Nutrient Management Plan for Sanibel. The Plan will include three phases and will provide a basis for development of the Island BMAP. The final phase of the Plan will be completed in 2015 and will include a list of short- and long-term projects that will help reduce nutrients loads on the Island.
Finish the Comprehensive Nutrient Management Plan, complete with a list of management recommendations and priority projects
Establish the appropriate budgetary level of expense and capital to complete the Comprehensive Nutrient Management Plan and begin work on critical short-term projects during the next fiscal year.
Develop and seek approval for a Sanibel Island Water Quality Improvement Program which includes both short-term and long-term improvement goals (reference the list of Short- and Long-term On-Island Nutrient Reduction Goals document on the City’s website at www.mysanibel.com/departments/natural-resources).
Continue implementation of regional fertilizer education program with Lee County and other partners.
State Support all legislative actions which reduce freshwater releases from Lake Okeechobee that impact the St. Lucie and Indian River Lagoon and Caloosahatchee River and estuary (reference the Short and Long-term State and Federal Goals documents located on the City’s website at www.mysanibel.com/departments/natural-resources).
Federal Work with Federal representatives to appropriate funding for the Water Resources Reform and Development Act (WRRDA) and associated water projects.
AWARDS AND ACKNOWLEDGEMENTS The Government Finance Officers Association of the United States and Canada (GFOA) awarded a Certificate of Achievement for Excellence in Financial Reporting to the City of Sanibel for its comprehensive annual financial report for the fiscal year ended September 30, 2013. This was the twenty-eighth (28th) consecutive year that the City has achieved this prestigious award. In order to be awarded a Certificate of Achievement, a government must publish an easily readable and efficiently organized comprehensive annual financial report. This report must satisfy both generally accepted accounting principles and applicable legal requirements. A Certificate of Achievement is valid for a period of one year only. We believe that our current comprehensive annual financial report continues to meet the Certificate of Achievement Program’s requirement and we are submitting it to the GFOA to determine its eligibility for another certificate. In addition, the government also received the GFOA’s Distinguished Budget Presentation Award for its annual budget document for the fiscal year beginning October 1, 2013. In order to qualify for the Distinguished Budget Presentation Award, the government’s budget document had to be judged proficient as a policy document, a financial plan, an operations guide, and a communications device.
18
A comprehensive financial report of this nature could not have been prepared without the dedicated efforts of the finance department staff. We would like to express our sincere appreciation to this staff for their noteworthy accomplishments in the completion of this endeavor. Finally, our sincere appreciation is extended to our external auditors, CliftonLarsonAllen LLP for their assistance and to the Mayor and City Council for the vital role they have played in enabling the City to remain fiscally responsible to the taxpayers of Sanibel. Respectfully submitted, Judith A. Zimomra Sylvia A. Edwards City Manager Finance Director
19

The Government Finance Officers Association of the United States and Canada (GFOA) awarded a Certificate of Achievement for Excellence in Financial Reporting to the City of Sanibel for its comprehensive annual financial report for the fiscal year ended September 30, 2013. This was the 29th consecutive year that the City has achieved this prestigious award. In order to be awarded a Certificate of Achievement, a government must publish an easily readable and efficiently organized comprehensive annual financial report. This report must satisfy both generally accepted accounting principles and applicable legal requirements. A Certificate of Achievement is valid for a period of one year only. We believe that our current comprehensive annual financial report continues to meet the Certificate of Achievement Program’s requirements and we are submitting it to the GFOA to determine its eligibility for another certificate.
20

CITY OF SANIBEL, FLORIDA ORGANIZATIONAL CHART
SEPTEMBER 30, 2014 __________________________________________________________________________________________________________________________
City Council Support
Administrative Staff
Support
Elections
Records Managemen
t
Committee Support
Business Tax Receipts
Payroll
Budget
Financial Statements
Accounts Payable
Treasury Managemen
Debt Issuance
Accounts Receivable
Code Enforcement
Plan Review
Planning Commission
Support
Long Range Planning
Development Regulations
Administration
Transportation Planning
Emergency Management
Plan
Parking Enforcement
Detective
Traffic Control
Dispatch 911 PSOP
Beach & Marine Patrol
Road Patrol
Building Permits
Building Plan
Review
Building Inspections
Contractor Licensing
Vegetation Licensing
Community Rating (FEMA)
Environmental Restoration and
Habitat Management
Beach & Estuary
Management
Noxious Plant Control
Water Quality
Streets
Garage
Engineering
Recycling
Parks Maintenance
Public Facilities
Shared Use Path
Maintenance
Sewer Treatment
Sewer Collection
Human Resources
Risk Management
Benefits Administration
City Council
Citizens
City Manager City Attorney
City Clerk Finance Planning Police Building Natural Resources
Public Works Administrative Services
Recreation
Recreation Complex
Youth & Adult
Activities
Seniors Programs
Information Technology
Network Administration
User Support
Technology Enhancement
Communications
Cash Receipts
Utility Billing Customer
Service
Protected Species
Management
Regulatory Review and
Environmental Code
Enforcement
Customer Service
Departmental Support
Ball Field Management
Community Programs
21

CITY OF SANIBEL, FLORIDA COUNCIL-MANAGER FORM GOVERNMENT
FOR THE FISCAL YEAR ENDED SEPTEMBER 30, 2014 __________________________________________________________________________________________
ELECTED OFFICIALS
Kevin Ruane ....................................................................................................................................................... Mayor
Doug Congress ........................................................................................................................................... Vice Mayor
Mick Denham ...................................................................................................................................... Councilmember
Marty Harrity ....................................................................................................................................... Councilmember
Jim Jennings ....................................................................................................................................... Councilmember
APPOINTED OFFICIALS
Judith A. Zimomra, MPA, JD. ................................................................................................................. City Manager
Kenneth B. Cuyler, Esq. .......................................................................................................................... City Attorney
EXECUTIVE STAFF
James R. Isom .......................................................................................................... Administrative Services Director
R. Harold Law, Jr, CBO ............................................................................................................. Chief Building Official
William Tomlinson ................................................................................................................................. Chief of Police
Pamela Smith, MMC ..................................................................................................................................... City Clerk
Sylvia A. Edwards, MBA, CPA, CGFO, CPFO .................................................................................. Finance Director
Albert Smith, Jr. ........................................................................................................ Information Technology Director
James T. Evans III, MS..................................................................................................... Natural Resources Director
James C. Jordan ............................................................................................................................... Planning Director
Keith L. Williams II, PE ....................................................................................... Public Works Director/City Engineer
Andrea L. Miller, CPRP................................................................................................................. Recreation Director
Contact: City of Sanibel
800 Dunlop Road Sanibel, Florida 33957
(239) 472-3700
www.mysanibel.com
22

This section contains the following subsections:
Independent Auditors’ Report ........................................................................................ 25
Management’s Discussion and Analysis........................................................................ 28
Basic Financial Statements ........................................................................................... 47
Notes to the Financial Statements ................................................................................. 63
Required Supplementary Information .......................................................................... 113
Combining Financial Statements and Schedules ........................................................ 121
FINANCIA
LSECTION
23

24

CliftonLarsonAllen LLP CLAconnect.com
An independent member of Nexia International
INDEPENDENT AUDITORS' REPORT Honorable Mayor and City Council City of Sanibel, Florida Sanibel, Florida Report on the Financial Statements We have audited the accompanying financial statements of the governmental activities, the business-type activities, the discretely presented component unit, each major fund, and the aggregate remaining fund information of the City of Sanibel, Florida (the “City”), as of and for the year ended September 30, 2014, and the related notes to the financial statements, which collectively comprise the City’s basic financial statements as listed in the table of contents. Management’s Responsibility for the Financial Statements
Management is responsible for the preparation and fair presentation of these financial statements in accordance with accounting principles generally accepted in the United States of America; this includes the design, implementation, and maintenance of internal control relevant to the preparation and fair presentation of financial statements that are free from material misstatement, whether due to fraud or error. Auditors’ Responsibility
Our responsibility is to express opinions on these financial statements based on our audit. We did not audit the financial statements of the Community Housing and Resources, Inc., which represents 100% of the assets, net position, and revenues of the discretely presented component unit. Those statements were audited by other auditors whose report has been furnished to us, and our opinion, insofar as it relates to the amounts included for the Community Housing and Resources, Inc., a discretely presented component unit, is based solely on the report of the other auditors. We conducted our audit in accordance with auditing standards generally accepted in the United States of America and the standards applicable to financial audits contained in Government Auditing Standards, issued by the Comptroller General of the United States. The financial statements of Community Housing and Resources, Inc. were not audited in accordance with Government Auditing Standards, issued by the Comptroller General of the United States. Those standards require that we plan and perform the audit to obtain reasonable assurance about whether the financial statements are free from material misstatement.
25

Honorable Mayor and City Council City of Sanibel, Florida
An audit involves performing procedures to obtain audit evidence about the amounts and disclosures in the financial statements. The procedures selected depend on the auditors’ judgment, including the assessment of the risks of material misstatement of the financial statements, whether due to fraud or error. In making those risk assessments, the auditor considers internal control relevant to the City’s preparation and fair presentation of the financial statements in order to design audit procedures that are appropriate in the circumstances, but not for the purpose of expressing an opinion on the effectiveness of the City’s internal control. Accordingly, we express no such opinion. An audit also includes evaluating the appropriateness of accounting policies used and the reasonableness of significant accounting estimates made by management, as well as evaluating the overall presentation of the financial statements. We believe that the audit evidence we have obtained is sufficient and appropriate to provide a basis for our audit opinions. Opinions
In our opinion, based on our audit and the report of the other auditors, the financial statements referred to above present fairly, in all material respects, the respective financial position of the governmental activities, the business-type activities, the discretely presented component unit, each major fund, and the aggregate remaining fund information of the City as of September 30, 2014, and the respective changes in financial position, and where applicable, cash flows thereof and the respective budgetary comparison for the general fund and the transportation and recreation special revenue funds, for the year then ended in accordance with accounting principles generally accepted in the United States of America. Emphasis of a Matter
During fiscal year ended September 30, 2014, the City adopted GASB Statement No. 65, Items Previously Reported as Assets and Liabilities and GASB Statement No. 68, Accounting and Financial Reporting for Pensions. In addition, the City’s pension plans adopted the provisions of GASB Statement No. 67, Financial Reporting for Pension Plans. As a result of the implementation of GASBS Nos. 65, 67 and 68, the City reported a restatement for the change in accounting principle (see Note 20.) The auditors’ opinion was not modified with respect to the restatement. Other Matters
Required Supplementary Information Accounting principles generally accepted in the United States of America require that the management’s discussion and analysis, schedules of changes in the net pension liability and related ratios, contributions and investment returns for the general employees’ and the municipal police officers pension plans, and the schedules of funding progress and contributions for the other post employment benefit plan on pages 28-45 and 114-120 be presented to supplement the basic financial statements. Such information, although not a part of the basic financial statements, is required by the Governmental Accounting Standards Board who considers it to be an essential part of financial reporting for placing the basic financial statements in an appropriate operational, economic, or historical context. We have applied certain limited procedures to the required supplementary information in accordance with auditing standards generally accepted in the United States of America, which consisted of inquiries of management about the methods of preparing the information and comparing the information for consistency with management’s responses to our inquiries, the basic financial statements, and other knowledge we obtained during our audit of the basic financial statements. We do not express an opinion or provide any assurance on the information because the limited procedures do not provide us with sufficient evidence to express an opinion or provide any assurance.
26

Honorable Mayor and City Council City of Sanibel, Florida
Other Information Our audit was conducted for the purpose of forming opinions on the financial statements that collectively comprise the City’s basic financial statements. The combining financial statements and schedules, the introductory section and statistical section, as listed in the table of contents, are presented for purposes of additional analysis and are not a required part of the basic financial statements. The combining financial statements and schedules are the responsibility of management and were derived from and relate directly to the underlying accounting and other records used to prepare the basic financial statements. Such information has been subjected to the auditing procedures applied in the audit of the basic financial statements and certain additional procedures, including comparing and reconciling such information directly to the underlying accounting and other records used to prepare the basic financial statements or to the basic financial statements themselves, and other additional procedures in accordance with auditing standards generally accepted in the United States of America. In our opinion, the combining and individual fund financial statements are fairly stated, in all material respects, in relation to the basic financial statements as a whole. The introductory and statistical sections have not been subjected to the auditing procedures applied in the audit of the basic financial statements, and accordingly, we do not express an opinion or provide any assurance on them. Other Reporting Required by Government Auditing Standards In accordance with Government Auditing Standards, we have also issued our report dated March 27, 2015, on our consideration of the City's internal control over financial reporting and on our tests of its compliance with certain provisions of laws, regulations, contracts, and grant agreements and other matters. The purpose of that report is to describe the scope of our testing of internal control over financial reporting and compliance and the result of that testing, and not to provide an opinion on internal control over financial reporting or on compliance. That report is an integral part of an audit performed in accordance with Government Auditing Standards in considering the City’s internal control over financial reporting and compliance.
CliftonLarsonAllen LLP
Fort Myers, Florida March 27, 2015
27

MANAGEMENT'S DISCUSSION AND ANALYSIS (Unaudited)
As management of the City of Sanibel, we offer readers of the City of Sanibel’s financial statements this narrative overview and analysis of the financial activities of the City of Sanibel for the fiscal year ended September 30, 2014. We encourage readers to consider the information presented here in conjunction with additional information that we have furnished in our letter of transmittal, which begins on page 7.
FINANCIAL HIGHLIGHTS At the close of fiscal year 2014, the City of Sanibel’s assets and deferred outflows of resources
exceeded its liabilities and deferred inflows of resources by $79.19 million (net position). Governmental and business-type assets and deferred outflows of resources exceeded liabilities and deferred inflows of resources by $44.98 million and $34.20 million, respectively.
The City’s total net position decreased by $16.89 million, or -17.6%, in comparison to the prior year, which includes an adjustment to beginning net position of $19.23 million. This adjustment affected both governmental and business-type activities. The adjustments were a result of the City adopting the provisions of the Governmental Accounting Standards Board (GASB) Statement Nos. 65, 67 and 68. For more information on these adjustments, please refer to Note #20 on page 112. The City’s unrestricted net position, which may be used to meet the City’s ongoing obligations to its citizens and creditors, decreased by $16.67 million, including the effects of the adjustments noted above. Negating the effect of these adjustments, the City reported an increase in total net position of $2.34 million compared to a decrease of $801,805 in fiscal year 2013.
The City’s governmental activities reported a total net position of $44.98 million, which is a decrease of $16.47 million, or -26.8%, in comparison to the prior year primarily attributable to the adjustment noted above. Approximately 9.1% of the total ($4.09 million) is unrestricted and available for spending at the City’s discretion.
The City’s business-type activities reported a total net position of $34.21 million, which is a decrease of $417,211, or -1.2%, in comparison to the prior year primarily attributable to the adjustment noted above. Approximately 13.3% of the total, or $4.56 million, is unrestricted and available for spending at the City’s discretion.
The City’s long-term liabilities relating to debt issuances decreased by $3.52 million during the current fiscal year. This represents the required annual debt service payments on existing debt and a current refunding and refinancing of certain business-type activity debt completed in fiscal year 2014. See Note #11 on page 93 for more information on the refunding. Total long-term liabilities increased due to the City recording a net pension liability of $9.64 million during fiscal year 2014 based on the requirements of GASB Statement No 68. See Note #14 on page 94 for more information on the net pension liability.
At the close of the current fiscal year, the City’s governmental funds reported a combined ending fund balance of $17.22 million, a decrease of $105,790, or -0.6%, in comparison with the prior year.
At the end of the current fiscal year, fund balance for the general fund was $11.54 million. Of this balance the following amounts have been committed: 1) $4.50 million to disaster reserves, 2) $1.00 million to support environmental initiatives; and 3) $315,000 to fund emergency insurance deductibles. Also in this balance is $1.60 million assigned to support the subsequent year’s budget per the City’s fund balance policy. In addition, $1.21 million is nonspendable in cash and consists of a long-term loan to the sewer fund ($1.10 million) and prepaid expenses and inventories of $108,760. Approximately $2.80 million (24.3%) is available for spending at the City’s discretion (unassigned fund balance).
28

OVERVIEW OF THE FINANCIAL STATEMENTS The discussion and analysis provided here are intended to serve as an introduction to the City’s basic financial statements. The City’s basic financial statements consist of three components: 1) government-wide financial statements, 2) fund financial statements, and 3) the notes to financial statements. This report also includes supplementary information intended to furnish additional detail to support the basic financial statements themselves. Government-wide Financial Statements The government-wide financial statements are designed to provide readers with a broad overview of the City’s finances, in a manner similar to a private-sector business. The focus is on “activities”, rather than “fund types”. All information is presented utilizing the economic resource measurement focus and the accrual basis of accounting. This method matches revenues and expenses to the period in which the revenue is earned and the expense attributed. The statement of net position presents information on all of the City’s assets, liabilities, and deferred inflows/outflows of resources, with the difference reported as net position. Over time, increases or decreases in net position may serve as a useful indicator of whether the financial position of the City is improving or deteriorating. The unrestricted portion of net position is designed to be similar to bottom line results for private sector companies. This statement combines and consolidates governmental fund current resources (short-term spendable resources) with capital assets and long-term obligations (see page 48). The statement of activities presents information showing how the City’s net position changed during the most recent fiscal year. All changes in net position are reported as soon as the underlying event giving rise to the change occurs, regardless of the timing of related cash flows. Thus, revenues and expenses are reported for some items that will only result in cash flows in future fiscal periods (e.g., uncollected taxes and earned but unused vacation leave). Both of the government-wide financial statements distinguish functions of the City that are principally supported by taxes and intergovernmental revenues (governmental activities) from other functions that are intended to recover all or a significant portion of their costs through user fees and charges (business-type activities). The governmental activities of the City include general government, public safety, physical environment, transportation, economic environment, human services, and culture and recreation. The business-type activities of the City include the Sanibel Sewer System and beach parking operations. The government-wide financial statements include not only the City itself (known as the primary government), but also a legally separate non-profit operation for which the City is financially accountable. Financial information for Community Housing Resources, Inc. (CHR) is reported separately from the financial information presented for the primary government itself. CHR has issued separately audited financial statements for the year ended September 30, 2014. The government-wide financial statements can be found on pages 48 and 49 of this report. Fund Financial Statements A fund is a grouping of related accounts that is used to maintain control over the resources that have been segregated for specific activities or objectives. The City, like other state and local governments, uses fund accounting to ensure and demonstrate compliance with finance-related legal requirements. All of the funds of the City can be divided into three categories: governmental funds, proprietary funds, and fiduciary funds.
29

Governmental funds. Governmental funds are used to account for essentially the same functions reported as governmental activities in the government-wide financial statements. However, unlike the government-wide financial statements, governmental fund financial statements focus on near-term inflows and outflows of spendable resources, as well as on balances of spendable resources available at the end of the fiscal year. Such information may be useful in evaluating the City’s near-term financing requirements. Because the focus of governmental funds is narrower than that of the government-wide financial statements, it is useful to compare the information presented for governmental funds with similar information presented for governmental activities in the government-wide financial statements. By doing so, readers may better understand the long-term impact of the City’s near-term financing decisions. Both the governmental fund balance sheet and the governmental fund statement of revenues, expenditures and changes in fund balances provide a reconciliation to facilitate this comparison between governmental funds and governmental activities. The City maintains nineteen individual governmental funds. Information is presented separately in the governmental fund balance sheet and in the governmental fund statement of revenues, expenditures and changes in fund balances for the general fund, the transportation fund, and the recreation fund, which are considered to be major funds. Data for the other sixteen governmental funds are combined into a single, aggregated presentation. Individual fund data for each of these nonmajor governmental funds is provided in the form of combining statements and schedules immediately following the required supplementary information and can be found on pages 122-126 of this report. The City adopts an annual appropriated budget for its general fund, as well as the other governmental funds. Budgetary comparison statements are required only for the general fund and major special revenue funds. Budgetary comparison statements have been provided for the general fund, the transportation fund and the recreation fund to demonstrate compliance with the budget on pages 54-55. Budgetary comparison schedules have also been provided on the other nonmajor governmental funds on pages 127-134. The basic governmental fund financial statements can be found on pages 50-53 of this report. Proprietary funds. The City maintains one of the two proprietary fund types. Enterprise funds are used to report the same functions presented as business-type activities in the government-wide financial statements. The City uses an enterprise fund to account for its sewer system utility fund and beach parking fund. Internal service funds are an accounting device used to accumulate and allocate costs internally among a government’s various functions. The City does not utilize internal service funds. Fees and charges are the primary revenue sources for the proprietary funds. The City’s sewer system enterprise fund also receives tax revenue from a voter-approved tax levy to pay debt service related to the sewer capital expansion projects. Proprietary funds provide the same type of information as the government-wide financial statements, only in more detail. The proprietary fund financial statements provide separate information for the sewer system utility fund and beach parking fund, both of which are considered to be major funds of the City. The basic proprietary fund financial statements can be found on pages 56-60 of this report.
30

Fiduciary funds. Fiduciary funds are used to account for resources held for the benefit of parties outside of the government. Fiduciary funds are not reported in the government-wide financial statements because the resources of those funds are not available to support the City’s own programs. The accounting used for fiduciary funds is much like that used for proprietary funds. The City maintains two different types of fiduciary funds. The Pension trust fund is used to report resources held in trust for retirees and beneficiaries covered by the General Employees and Municipal Police Officers’ Pension Plans. The Agency fund reports resources held by the City in a custodial capacity for individuals, private organizations and other governments. The fiduciary fund financial statements can be found on pages 61-62 of this report. Notes to the financial statements. The notes provide additional information that is necessary to acquire a full understanding of the data provided in the government-wide and fund financial statements. The notes to the financial statements can be found on pages 63-112 of this report. Other information. In addition to the basic financial statements and accompanying notes, this report also presents required supplementary information concerning certain information for the City's pension plans and other post-employment benefits (OPEB) plan. Required supplementary information can be found on pages 113-120 of this report.
GOVERNMENT-WIDE FINANCIAL STATEMENT ANALYSIS
Statement of Net Position As noted earlier, net position may serve over time as a useful indicator of a government’s financial position. In the case of the City, assets and deferred outflows of resources exceeded liabilities and deferred inflows of resources by $79.19 million.
By far, the largest portion of the City’s net position (76.1%) reflect its investment in capital assets (such as land, buildings, parks, roads, bridges, machinery and equipment) less any related outstanding debt used to acquire those assets. The City uses these assets to provide services to citizens; consequently these assets are not available for future spending. Although the capital assets are shown net of debt, it should be noted that the resources needed to repay this debt must be provided from other sources, since the capital assets themselves cannot be used to liquidate and pay for these liabilities.
Statement of Net Position (Summary)as of September 30, 2014 and 2013
2014 2013 2014 2013 2014 2013Current and other assets $18,643,044 $25,532,399 $13,835,538 $13,842,158 $32,478,582 $39,374,557 Capital assets, net 47,174,068 47,929,139 45,865,158 48,131,343 93,039,226 96,060,482
Total assets 65,817,112 73,461,538 59,700,696 61,973,501 125,517,808 135,435,039 Deferred outflows of resources - - 141,251 - 141,251 -
Total deferred outflows of res - - 141,251 - 141,251 - Current and other liabilities 1,479,875 1,472,951 474,858 656,374 1,954,733 2,129,325 Long-term liabilities 18,369,163 10,532,011 24,966,198 26,693,664 43,335,361 37,225,675
Total liabilities 19,849,038 12,004,962 25,441,056 27,350,038 45,290,094 39,355,000 Deferred inflows of resources 985,151 - 194,639 - 1,179,790 -
Total deferred inflows of res 985,151 - 194,639 - 1,179,790 - Net position:Net investment in capital assets 37,809,068 38,084,139 22,473,067 21,561,359 60,282,135 59,645,498 Restricted 3,088,775 2,412,824 7,178,063 8,708,211 10,266,838 11,121,035 Unrestricted 4,085,080 20,959,613 4,555,122 4,353,893 8,640,202 25,313,506
Total net position $44,982,923 $61,456,576 $34,206,252 $34,623,463 $79,189,175 $96,080,039
Governmental Activities Business-type Activities Total Primary Government
31

An additional portion of the City’s net position in the amount of $10.26 million (13.0%) represents resources that are subject to external restrictions on how they may be used. The remaining balance of $8.64 million (10.9%) is unrestricted and may be used to meet the City’s ongoing obligations to its citizens and creditors. The following graph compares the net position components for fiscal years 2014 and 2013:
At the end of the current fiscal year, the City is able to report positive balances in all reported categories of net position, both for the government as a whole, as well as for its separate governmental and business-type activities. The same situation held true for the prior fiscal year. However, as previously discussed, the City’s overall net position decreased $16.89 million from the prior fiscal year, primarily due to an adjustment made to beginning net position. Additional information on the change in net position is discussed in the following sections.
$0 $15,000,000 $30,000,000 $45,000,000 $60,000,000
Net investment in capital assets
Restricted
Unrestricted
City of Sanibel Net PositionSeptember 30, 2014 and 2013
2014
2013
32

Changes in Net Position
Governmental activities
Total program revenues increased $1.39 million (37.2%) to $5.12 million in fiscal year 2014 from $3.73 million in fiscal year 2013. Operating grants and contributions accounted for the most significant portion of the increase due to the receipt of $1.37 million in surplus toll revenue from Lee County, after several years of the City not receiving funds. During fiscal year 2013, the County paid off its junior debt for the Sanibel Causeway. As a result, the interlocal agreement between the City and the County required the reinstatement of the payment of 21% of the surplus tolls collected by Lee County to be remitted to the City. These funds are restricted to transportation related projects and expenses. The most significant revenue in program services comes from charges for services, which remained relatively stable compared to the previous year, decreasing approximately $64,000, or -2.0%. Capital grants and contributions increased approximately $80,000 in fiscal year 2014, mostly driven by an increase in impact fees received under an interlocal agreement with Lee County. Other capital grant activity varies from year to year as projects are approved and completed typically on an annual basis.
Changes in Net Position (Summary)For the Year Ended September 30, 2014 and 2013
Governmental Activities Business-type Activities Total Primary Government2014 2013 2014 2013 2014 2013
Revenues:Program revenues
Charges for services $ 3,183,264 $ 3,242,292 $ 8,117,212 $ 7,755,682 $ 11,300,476 $ 10,997,974 Operating grants and contributions 1,735,335 364,063 1,083,325 1,036,029 2,818,660 1,400,092 Capital grants and contributions 199,669 125,231 174,830 483,358 374,499 608,589
General revenuesProperty taxes 9,103,845 9,136,701 907,735 949,124 10,011,580 10,085,825 Other taxes 2,387,084 2,402,389 - - 2,387,084 2,402,389 Intergovernmental revenues 657,804 614,949 - - 657,804 614,949 Other 578,666 251,336 360,330 326,818 938,996 578,154
Total revenues 17,845,667 16,136,961 10,643,432 10,551,011 28,489,099 26,687,972
Expenses (including indirect expense):General government 1,989,435 2,645,474 - - 1,989,435 2,645,474 Public safety 4,818,715 4,968,234 - - 4,818,715 4,968,234 Physical environment 625,663 657,770 - - 625,663 657,770 Sewer - - 6,651,541 7,197,611 6,651,541 7,197,611 Transportation 4,114,671 4,207,936 - - 4,114,671 4,207,936 Beach parking - - 2,687,152 2,593,668 2,687,152 2,593,668 Economic development 319,055 310,986 - - 319,055 310,986 Human services 1,000 1,000 - - 1,000 1,000 Culture/recreation 4,580,446 4,526,040 - - 4,580,446 4,526,040 Interest on long-term debt 357,954 381,058 - - 357,954 381,058
Total expenses 16,806,939 17,698,498 9,338,693 9,791,279 26,145,632 27,489,777 Increase (decrease) in net position
before transfers 1,038,728 (1,561,537) 1,304,739 759,732 2,343,467 (801,805)Transfers (126,975) - 126,975 - - -
Increase (decrease) in net position 911,753 (1,561,537) 1,431,714 759,732 2,343,467 (801,805)
Net position - beginning of year aspreviously reported 61,456,576 63,018,113 34,623,463 33,863,731 96,080,039 96,881,844
Adjustment (See Note #20) (17,385,406) - (1,848,925) - (19,234,331) -
Net position - beginning of year as
restated 44,071,170 63,018,113 32,774,538 33,863,731 76,845,708 96,881,844
Net position - end of year $ 44,982,923 $ 61,456,576 $ 34,206,252 $ 34,623,463 $ 79,189,175 $ 96,080,039
33

The following table presents the total cost of services for each of the City's five largest programs as well as each program's net cost; that is, total cost less program revenues (i.e. excluding taxes), generated by the activities. The net cost represents the portion of each program that is supported by various general revenues, including taxes.
The total cost of all governmental activities provided this fiscal year was approximately $16.81 million, a decrease of approximately $892,000 (-5.0%) from the prior year. As detailed in the statement of activities on page 49, the net cost ultimately paid through taxes and other general revenues was approximately $11.69 million, a $2.28 million decrease from fiscal year 2013. The main component of the decrease in program costs from the previous year is due to a lump sum pension payment of approximately $1.20 million made in fiscal year 2013 to pay down an actuarial assumption change in the Municipal Police Officers’ Pension Plan. This was a one-time payment and was not repeated in fiscal year 2014. Additionally, the City received $1.37 million due to the reinstatement of surplus toll revenue. In comparing program expenses to program revenue, it can be easily seen that the majority of the funding for governmental activities is not from program revenues:
Program Revenues and ExpensesGovernmental Activities
Total Cost Of Services Net Cost (Earnings) Of Services2014 2013 2014 2013
General government 1,989,435$ 2,645,474$ 341,475$ 1,029,974$ Public safety 4,818,715 4,968,234 4,022,241 4,079,899 Physical environment 625,663 657,770 331,600 317,683 Transportation 4,114,671 4,207,936 2,582,098 4,070,382 Culture/Recreation 4,580,446 4,526,040 3,733,248 3,775,930 All others 678,009 693,044 678,009 693,044
Totals 16,806,939$ 17,698,498$ 11,688,671$ 13,966,912$
$-
$1,000,000
$2,000,000
$3,000,000
$4,000,000
$5,000,000
Generalgovernment
Public safety Physicalenvironment
Transportation Culture &recreation
All others
Program Revenue and ExpensesGovernmental Activities
Program Revenue Program Expense
34

Total general revenues increased $322,000 (2.6%) to $12.73 million from $12.41 million in 2013. Higher than anticipated investment returns accounted for the majority of the increase. Additionally, higher collections of impact fees resulting from increased construction activity in the City impacted the general revenue total. The following graphs compare the composition of revenues for the City’s governmental activities for fiscal years 2014 and 2013:
Business-type activities
Revenues Revenues of the City's business-type activities totaled $10.64 million in fiscal year 2014, a 0.9% increase from 2013. Total expenses for 2014 were $9.34 million, a 4.6% decrease from 2013. These results generated an increase in net position of $1.43 million (before the adjustment to beginning net position as previously discussed). Total net position decreased approximately $417,000 (-1.2%), which includes a $1.85 million adjustment to the enterprise fund’s beginning net position. See Note #20 on page 112 for more information on this adjustment. Total program revenues generated from the City’s business-type activities increased $100,000 (1.1%) in 2014 from 2013. Charges for services generated an increase of approximately $360,000 (4.7%) over 2013, reflecting the 1.5% increase in sewer rates the City Council established at the beginning of 2014 and increased visitors to the City’s beaches. The City’s operating grants and contributions are received pursuant to an interlocal agreement with the Lee County Tourist Development Council (TDC) and are accounted for in the Beach Parking fund. These funds increased $47,000 (4.6%) in 2014 from 2013. These grants mainly fund beach maintenance and prevention of erosion activities and routinely vary from year to year. Capital grants and contributions decreased $308,000 (-63.8%) in 2014. In the Sewer fund, capital contributions from sewer connection fees decreased $20,770, or -13.7%, from the previous year. These contributions typically vary from year to year based on activity and fluctuations are expected. In the Beach Parking fund, capital contributions from the Lee County TDC decreased $287,000 from 2013 primarily due to renovation projects that were completed in 2013. A large capital grant awarded in fiscal year 2014 to renovate beach restrooms was not completed and moved forward to fiscal year 2015. General revenues are received from two sources in the City’s business-type activities. The majority of revenue comes from tax revenue received from voter-approved tax levies to pay debt service related to the Sewer fund capital expansion projects. Tax revenue received in 2014 totaled approximately $907,000, a $41,000 decrease from 2013, based on debt service needs for the year. The second source of general revenues is received from the Sewer fund’s investment and banking activity. Greater than expected returns resulted in a $33,000 increase in interest and investment gains in fiscal year 2014.
Property Taxes51.0%
Other Taxes13.4% Charges for
services17.8%
Inter-governmental
3.7%
Operating grants &
contributions9.7%
Capital grants & contributions
1.1%
Miscellaneous3.2%
2014 Revenue by SourceGovernmental Activities
Property Taxes56.6%
Other Taxes14.9%
Charges for services20.1%
Inter-governmental
3.8%
Operating grants &
contributions2.3%
Capital grants & contributions
0.8%
Miscellaneous1.6%
2013 Revenue by SourceGovernmental Activities
35

The following graphs compare the composition of revenues for the City’s business-type activities for fiscal years 2014 and 2013:
Expenses Total expenses decreased $452,000 (-4.6%) in 2014 compared to 2013, following a decrease of 4.1% in 2013 from 2012. Efficiencies and improvements in processes in the sewer fund account for the majority of the continued decrease in expenses. Interest expense was the largest component of the decrease in expenses and accounted for a $218,000 decrease from 2013. The primary driver for this was the refinancing of certain outstanding sewer debt. See Note #11 on page 93 for more information. Reductions in necessary repairs and maintenance expenses contributed to the rest of the decrease ($150,000 decrease from 2013). The beach parking fund’s expenses increased $93,000 in the current year. The City’s water quality efforts and increased demand for beach services as the economy continues to improve accounted for the increase.
Charges for services76.3%
Capital grants & contributions
1.6%
Operating Grants10.2%
Investment earnings
3.4%
Property taxes (GO Debt)
8.5%
2014 Revenue by SourceBusiness-type Activities
Charges for services73.5%
Capital grants & contributions
4.6%
Operating Grants9.8%
Investment earnings
3.1%
Property taxes (GO Debt)
9.0%
2013 Revenue by SourceBusiness-type Activities
36

The following charts compare program expenses with program revenues for the City’s business-type activities for fiscal years 2014 and 2013:
FINANCIAL ANALYSIS OF GOVERNMENTAL FUNDS As noted earlier, the City uses fund accounting to ensure and demonstrate compliance with finance-related legal requirements. Governmental funds. The focus of the City’s governmental funds is to provide information on near-term inflows, outflows, and balances of spendable resources. Such information is useful in assessing the City’s financing requirements. In particular, unassigned fund balance may serve as a useful measure of a government’s net resources available for discretionary use as they represent the portion of fund balance which has not yet been limited to use for a particular purpose by either an external party, the City itself, or a group or individual that has been delegated authority to assign resources for use for particular purposes by the City Council.
$6,425,263 $6,241,988$6,651,541
$7,197,611
$0
$1,000,000
$2,000,000
$3,000,000
$4,000,000
$5,000,000
$6,000,000
$7,000,000
$8,000,000
FY 2014 FY 2013
Revenues and Expenses - Business-type ActivitiesSanibel Sewer System
Program Revenue Program Expense
$2,950,104 $3,033,081
$2,687,152 $2,593,668
$0
$500,000
$1,000,000
$1,500,000
$2,000,000
$2,500,000
$3,000,000
$3,500,000
FY 2014 FY 2013
Revenues and Expenses - Business-type ActivitiesBeach Parking
Program Revenue Program Expense
37

At September 30, 2014, the City’s governmental funds reported combined fund balances of $17.22 million, a decrease of $105,000 in comparison with the prior year. Approximately 16.3% of this amount ($2.80 million) constitutes unassigned fund balance, which is available for spending at the City’s discretion. The remainder of the fund balance is either nonspendable, restricted, committed, or assigned to indicate that it is 1) not in spendable form ($1.21 million), 2) restricted for particular purposes ($3.15 million), 3) committed for particular purposes ($5.82 million), or 4) assigned for particular purposes ($4.24 million).
General Fund The General Fund is the chief operating fund of the City. It is used to account for all financial resources except those required to be accounted for in another fund. At the end of the current fiscal year the unassigned fund balance of the general fund was $2.80 million, while total fund balance was $11.54 million. As a measure of the general fund’s liquidity, it may be useful to compare both unassigned fund balance and total fund balance to total general fund expenditures and other financing uses. Unassigned fund balance represents approximately 20.4% of the total general fund expenditures and other financing uses, while total fund balance represents 84.1% of that same amount. The fund balance of the general fund decreased $829,000 during fiscal year 2014, which was an improvement over 2013 when the fund balance decreased $1.57 million. Revenue in the general fund held steady in fiscal year 2014, showing a 1% improvement over 2013, while expenditures were reduced 3.0%. Additionally, other financing sources/uses decreased 10.6% in 2014. These results ended up reducing the decrease in fund balance in the general fund by 47.0% from fiscal year 2013. Key factors in the current year results are the net effect of the following items:
Revenues for the general fund increased by $127,000 from $12.78 million in fiscal year 2013 to $12.91 million in fiscal year 2014: The major components of the increase were 1) $70,000 increase in charges for services; and 2) better than anticipated results in investment earnings and interest, resulting in a $104,000 increase from 2013. Other revenue categories had minor decreases, which comprised the rest of the year over year change.
Total expenditures decreased by $350,000 to $11.57 million in fiscal year 2014 from $11.92 million in fiscal year 2013. General government expenditures decreased $890,000 in fiscal year 2014, based on the afore mentioned lump sum payment into the Municipal Police Officers’ Pension Plan in 2013 that was not repeated in fiscal year 2014. Alternatively, public safety expenditures increased $518,000, primarily in the area of personnel expenditures due to increased traffic and seasonal visitors to the City as the economy continues to improve and tourism increases.
Unassigned
Assigned
Committed
Restricted
Nonspendable
Governmental FundsComponents of Fund BalanceSeptember 30, 2014 and 2013
2013
2014
38

Unassigned24%
Assigned15%
Committed50% Nonspendable
11%
Components of Fund BalanceGeneral Fund
Assigned64%
Restricted36%
Components of Fund BalanceTransportation Fund
Other financing sources and uses resulted in a net reduction in uses of approximately $259,000 (10.6%) due to reduction in transfers necessary from the general fund to support other governmental funds. Specifically, the transfer from the general fund to the transportation fund that is typically made each year was not necessary in 2014 due to the receipt of toll funds from Lee County.
The chart to the right represents the components of fund balance in the general fund at September 30, 2014:
For information on the general fund’s budgetary performance for fiscal year 2014, see the discussion beginning on page 42. Transportation Fund The transportation fund, a major special revenue fund, was established to account for all activities necessary to provide repaving, maintenance and repairs to the City’s streets, shared-use paths and drainage infrastructure. Revenues are received from the local option gas taxes, municipal fuel allocation portion of the State of Florida’s municipal shared revenues, fuel tax rebates and surplus toll revenues from the Sanibel Causeway. Per an interlocal agreement with Lee County, the City’s receipt of surplus toll revenue from the Sanibel Causeway was reinstated in fiscal year 2014. The County paid off its junior debt on the Causeway and will now remit 21% of the surplus tolls to the City on a biannual basis. These funds are restricted for use for transportation related operational and capital expenditures. The ending fund balance of the transportation fund increased $326,000 during 2014 to $1.12 million. Key factors in this change are the net effect of the following items:
Revenues from the local option gas taxes increased 3.7% to $1.53 million in 2014 from $1.48 million in 2013.
Approximately $410,000 in surplus toll revenue was received directly into the transportation fund in fiscal year 2014. An additional $400,000 was received into the transportation capital projects fund and then subsequently transferred in to the transportation fund to support transportation related operating expenditures.
Total expenditures remained consistent with the previous year, reflecting a $24,500 (-1.2%) decrease to finish at $2.09 million. Slight increases in personnel costs were offset by savings in repairs and maintenance and road materials.
39

Assigned60%
Restricted39%
Nonspendable1%
Components of Fund BalanceRecreation Fund
Recreation Fund The Recreation Fund, a major special revenue fund, is used to account for the recreation center programs and the Center-4-Life senior programs. All activities necessary to provide recreation programs are accounted for in this fund. External revenues are received from membership fees and program fees. The ending fund balance of the Recreation fund decreased $54,000 during 2014 to $442,319. Key factors in this decrease are the net effect of the following items:
Revenues in 2014 increased 8.8% compared to 2013, totaling $735,299 in 2014. The major driver of this increase was in charges for services and memberships at the Recreation Center. Due to increase membership and usage, charges for services increased approximately 12.0% in fiscal year 2014.
Total expenditures remained consistent with the previous year, with a 0.6% increase over last year ($2.14 million vs. $2.13 million). The main reason for the increase related to the additional needs for operating supplies and other related item based on the increased usage noted above.
In addition to the revenues previously noted, the Recreation fund receives transfers from the general fund to support its ongoing operations. During 2014, transfers from the general fund were approximately $1.36 million. This reflects an 11.5% increase over the previous year’s transfers.
40

Other Governmental Funds All other governmental funds are accounted for in the column entitled other governmental funds. Other governmental funds include nonmajor special revenue, debt service and capital project funds. Fund balances for this group increased $451,454 in 2014 from 2013 and total $4.11 million. Key factors in this increase are the net effect of the following items:
Voter approved debt service ad valorem tax receipts remained steady with the 2013 results based on anticipated debt service needs. Total tax collected was $850,501 in 2014 compared to $853,159 in 2013.
Intergovernmental revenues increased $1.09 million in fiscal year 2014. The overwhelming majority of this increase relates to the aforementioned receipt of surplus toll revenue from Lee County in the transportation capital projects fund. The City allocated approximately $955,000 in surplus toll revenue during 2014 to the Transportation Capital Projects fund. As previously mentioned, $400,000 of these funds were transferred to the transportation fund. The rest remained in the transportation capital projects funds for future projects.
Better than expected investment returns and interest increased other revenue 113.9% in fiscal year 2014 to finish at $439,276, compared to $157,334 in fiscal year 2013.
Total expenditures decreased slightly in 2014 compared to 2013 (-0.2%). Increases in capital outlay and transportation expenses were offset by interest expense on debt savings and general government expenditure reductions.
Transfers in from other funds decreased 52.2% in fiscal year 2014. The main reason for this decrease was the reduction of the transfer from the general fund to the transportation capital projects fund for capital purposes, since the surplus toll revenue noted above supplanted the resources of the fund.
For more information, see the combining financial statements for the City’s non-major governmental funds beginning on page 121.
Assigned38%
Restricted62%
Components of Fund BalanceOther Governmental Funds
41

Proprietary funds. The City’s proprietary funds are comprised of enterprise funds. An enterprise fund is used to account for activities for which a fee is charged to external users for goods and services. These funds provide the same type of information found in the government-wide financial statements business-type activities. See the discussion of business-type activities beginning on page 35. For additional detail, see the propriety fund statements on pages 56-60.
GENERAL FUND BUDGETARY HIGHLIGHTS
During fiscal year 2014, there was a $70,000 (-0.5%) decrease in budgeted total revenue between the original and final amended budget and a $257,000 (2.2%) increase in budgeted total operating expenditures between the original and final amended budget. Following are the key factors for the variance in revenues between the original and final budget:
Ad valorem property tax receipts were decreased $327,000 to recognize the early payment discount utilized by taxpayers;
Intergovernmental revenue was increased to recognize several grants that were received during fiscal year 2014;
Charges for services budget was increased $105,000 due to increase cost recovery amounts by the general fund from other funds. The general fund recovers costs spent on behalf of other funds via a report prepared by a specialist each year.
Following are the key factors for the variance in expenditures between the original and final budget:
General government personnel costs were increased approximately $63,000 due to a reorganization in the Legislative Department approved by the City Council in fiscal year 2014;
The budget for public safety personnel costs was increased to account for the $65,000 pension contribution from the State of Florida. Additional costs related to increased demand for police services on the island due to increased tourism (traffic enforcement, control, etc.) also contributed approximately $66,000 to the budget increase.
Transportation personnel costs increased approximately $80,000 based on increased need.
$10,500,000
$11,000,000
$11,500,000
$12,000,000
$12,500,000
$13,000,000
$13,500,000
Total Revenues Total Expenditures
FY 2014 Budget to Actual ResultsGeneral Fund
Original Budget Final Budget Actual
42

During fiscal year 2014, there was a $30,000 (-0.2%) decrease in final budgeted total revenue and actual total revenue. The variances that comprised this small decrease were widespread and no specific line items were greatly decreased. Budget-to-actual expenditures show a $530,000 (4.4%) positive variance (actual less than budget). This decrease was uniform through most departments and reflects the continuation of cost containment efforts throughout the City. A more detailed analysis of the general fund budget comparison can be found in the budgetary comparison statement found on page 54 of this report.
CAPITAL ASSET AND DEBT ADMINISTRATION Capital assets. The City's capital assets as of September 30, 2014 reflect an investment of $93.04 million, net of accumulated depreciation. The following schedule provides a comparative summary of net capital assets by category for both governmental and business-type activities. Additional information on the City’s capital assets can be found in Note 9 on pages 88-89 of this report.
Notable capital asset events during the current fiscal year included the following:
Description Cost Purchases/Acquisitions Pond Apple Park/Shipley Connector Boardwalk ............................... $196,990 Playground Equipment – Recreation Center ......................................... 36,000 Periwinkle Way improvements ............................................................. 680,800 Trucks/vehicles (4) ................................................................................. 98,800 Various technology equipment .............................................................. 48,410 Recreation center equipment ................................................................. 11,270 Lighthouse rehabilitation ...................................................................... 342,800 Various beach equipment ...................................................................... 26,350 Sewer plant head works bypass line ................................................... 235,450 Construction Work in Progress Lighthouse beach restrooms ................................................................. 24,269 Generator/platform for lift station ........................................................... 82,431 Disposals Trucks/vehicles (7) ................................................................................. 80,130 Recreation center equipment ................................................................... 2,700
Capital Assets(net of depreciation)as of September 30,
Governmental Activities Business-type Activities Total Primary Government2014 2013 2014 2013 2014 2013
Land $24,964,425 $24,964,425 $ 1,860,674 $ 1,860,674 $ 26,825,099 $ 26,825,099 Buildings 12,861,996 13,480,868 1,365,082 1,132,913 14,227,078 14,613,781 Improvements other than buildings 1,054,768 948,704 758,239 803,468 1,813,007 1,752,172 Vehicles and equipment 1,045,015 1,206,895 937,947 1,091,919 1,982,962 2,298,814 Infrastructure 7,247,864 7,069,570 40,793,928 42,864,649 48,041,792 49,934,219 Construction work in progress - 258,677 149,288 377,720 149,288 636,397
Total capital assets $47,174,068 $47,929,139 $45,865,158 $48,131,343 $ 93,039,226 $ 96,060,482
43

Long-term debt. As of September 30, 2014, the City had $32.90 million in general obligation bonds, revenue bonds, and notes payable outstanding. The following schedule provides a comparative summary of the City's outstanding debt:
The City’s total debt related to bonds and notes payable decreased by $3.52 million during the current fiscal year due to annual scheduled principal payments. No additional debt was issued during fiscal year 2014; however, certain business-type debt was currently refunded and refinanced. Additional information about the City's long-term debt and the current refunding can be found in Note 11 beginning on page 90 of this report.
ECONOMIC FACTORS AND NEXT YEAR’S BUDGET AND RATES Property Values Property values continued to increase in fiscal year 2015, following a modest increase in fiscal year 2014. Property values increased 4.8% in 2015 to $4,300,931,329. As with much of Southwest Florida, Sanibel experienced its highest property values in 2007. Property values steadily decreased in the following years; however in the last two years, the trend appears to be reversing. Property values remain uncertain in the upcoming year; however, the City is cautiously optimistic that taxable values will continue to trend upwards. As the City relies on ad valorem tax revenue for the majority of its revenue, there is significant focus on next year’s values. Tourism Based on information from the Lee County Toll system’s (LeeWay) traffic reports, the Sanibel causeway’s fiscal year 2014 cumulative vehicle totals has decreased by 8.5% from the fiscal year 2001 peak. The annual cumulative count is down by approximately 295,000 vehicles, from 3.48 million in fiscal year 2001 to 3.18 million vehicles in fiscal year 2014. Traffic volume increased in fiscal year 2014 by 115,000 vehicles, a 3.7% increase from fiscal year 2013. This is another positive indicator that the tourism economy is improving.
Long-term Debtas of September 30,
2014 2013 2014 2013 2014 2013Bonds
G.O. bonds $ 9,365,000 $ 9,845,000 -$ -$ $ 9,365,000 $ 9,845,000 Revenue bonds - - 8,888,260 2,687,823 8,888,260 2,687,823
Notes Payable - - 14,645,081 23,882,161 14,645,081 23,882,161 Total 9,365,000$ 9,845,000$ 23,533,341$ 26,569,984$ 32,898,341$ 36,414,984$
Governmental Activities Business-type Activities Total Primary Government
2,000,000 2,200,000 2,400,000 2,600,000 2,800,000 3,000,000 3,200,000 3,400,000 3,600,000 3,800,000
Causeway Traffic
44

Other Economic Factors and Legislation According to the U.S. Department of Labor Bureau of Labor Statistics, the unemployment rate for the Cape Coral-Fort Myers Metropolitan Area (that includes the City) for December 2014 was 5.0%, a slight decline from the December 2013 rate of 5.8%. This is another indicator that the economic conditions in the area are improving. The Florida legislature is again considering various proposals relating to the elimination of local government revenues and limits to business taxes. Potential legislation could have a significant impact on a local government’s ability to maintain and or improve services to residents. The City is carefully monitoring these initiatives and their future impact on the City’s ability to function at its present level. Next Year’s Budget and Rates The following economic factors currently affect the City of Sanibel and were considered in developing the 2015 fiscal year budget:
The City’s property value for fiscal year 2015 increased 4.8% to $4,300,931,329. Taxable values peaked in the City during 2007 and after five consecutive years of decreasing values the trend is starting to reverse with two consecutive years of modest increases;
The City Council adopted a tax rate equal to the rolled back rate for fiscal year 2015. The rolled back rate is the rate that would bring in the same dollar revenue as the previous year’s millage rate, adjusted for new construction;
Beach parking fees were increased from $2 to $3 per hour; Sewer fees and reclaimed water rates were increased 3% for fiscal year 2015; Recreation Center membership fees were increased 5% for residents and 10% for non-residents;
activity fee and rental fees were increased 5% for members and 10% for non-members; With the recommencement of the receipt of surplus toll revenue from the Sanibel Causeway
through Lee County, fiscal year 2015 is the first year since 2004 that transportation operating costs have not had to be subsidized by the general fund;
Completed labor negotiations with both unions resulting in a 3% wage increase for all employees. Requests for Information This financial report is designed to provide our citizens, taxpayers, customers, and investors and creditors with a general overview of the City of Sanibel's finances and to demonstrate the City’s accountability. Questions concerning any of the information provided in this report or requests for additional financial information may be addressed to the Finance Director, City of Sanibel, 800 Dunlop Road, Sanibel, Florida 33957. Information is also available on the City’s website at www.mysanibel.com.
45

46

This section contains the following subsections:
Statement of Net Position .............................................................................................. 48
Statement of Activities ................................................................................................... 49
Balance Sheet – Governmental Funds .......................................................................... 50
Reconciliation of the Balance Sheet of Governmental Funds to the Statement of Net Position .................................................................................. 51
Statement of Revenues, Expenditures and Changes in Fund Balances - Governmental Funds ................................................................................................... 52
Reconciliation of the Statement of Revenues, Expenditures, and Changes in Fund Balances of Governmental Funds to the Statement of Activities .................... 53
Statement of Revenues, Expenditures, and Changes in Fund Balance Budget and Actual – General Fund ............................................................................. 54
Statement of Revenues, Expenditures, and Changes in Fund Balance Budget and Actual – Other Major Funds ...................................................................... 55
Statement of Net Position – Proprietary Funds .............................................................. 56
Statement of Revenues, Expenses, and Changes in Net Position – Proprietary Funds ........................................................................................................ 58
Statement of Cash Flows – Proprietary Funds .............................................................. 59
Statement of Net Position – Fiduciary Funds ................................................................. 61
Statement of Changes in Net Position – Fiduciary Funds ............................................. 62
BASICFIN
ANCIA
LSTATEM
ENTS
47

CITY OF SANIBEL, FLORIDA STATEMENT OF NET POSITION
September 30, 2014
__________________________________________________________________________________________
The notes to financial statements are an integral part of this statement.
Component UnitCommunity
Governmental Business-type Housing &Activities Activities Total Resources, Inc.
ASSETSCash and cash equivalents 9,605,201$ 7,154,954$ 16,760,155$ 163,785$ Investments 6,356,595 3,776 6,360,371 - Receivables (net of allowance for uncollectibles)
Accounts 89,382 294,875 384,257 - Interest 123,713 - 123,713 -
Due from other governments 684,831 576,350 1,261,181 - Internal balances 1,375,000 (1,375,000) - - Inventories 9,691 2,520 12,211 - Prepaids 104,069 - 104,069 31,510 Restricted assets:
Cash and cash equivalents 294,472 1,057,550 1,352,022 49,461 Interest & taxes receivable 90 - 90 - Assessments receivable - 6,120,513 6,120,513 -
Capital assets (net of accumulated depreciation, where applicable):Land 24,964,425 1,860,674 26,825,099 768,913 Buildings 12,861,996 1,365,082 14,227,078 4,060,106 Improvements other than buildings 1,054,768 758,239 1,813,007 - Vehicles and equipment 1,045,015 937,947 1,982,962 16,490 Infrastructure 7,247,864 40,793,928 48,041,792 - Construction in progress - 149,288 149,288 -
Total Assets 65,817,112 59,700,696 125,517,808 5,090,265
DEFERRED OUTFLOWS OF RESOURCESDeferred charge on refunding - 141,251 141,251 -
Total deferred outflows of resources -$ 141,251$ 141,251$ -$
LIABILITIESAccounts payable and other accrued liabilities 1,157,517 320,998 1,478,515 60,948 Accrued interest payable 57,543 153,860 211,403 - Unearned revenue 264,815 - 264,815 377 Long-term liabilities:
Due within one year 2,143,607 3,000,618 5,144,225 29,775 Due in more than one year 16,225,556 21,965,580 38,191,136 1,607,351
Total Liabilities 19,849,038 25,441,056 45,290,094 1,698,451
DEFERRED INFLOWS OF RESOURCESDeferred inflows of pension earnings 985,151 194,639 1,179,790 -
Total deferred outflows of resources 985,151$ 194,639$ 1,179,790$ -$
NET POSITIONNet investment in capital assets 37,809,068 22,473,067 60,282,135 3,384,073 Restricted for:
Public safety 863,291 - 863,291 - Transportation 932,994 - 932,994 - Capital projects 515,194 76,838 592,032 - Debt service 294,562 7,101,225 7,395,787 - Donations received 343,883 - 343,883 - Special Assessments 138,851 - 138,851 -
Unrestricted 4,085,080 4,555,122 8,640,202 7,741 Total Net Position 44,982,923$ 34,206,252$ 79,189,175$ 3,391,814$
Primary Government
48

CITY OF SANIBEL, FLORIDA STATEMENT OF ACTIVITIES
For the Fiscal Year Ended September 30, 2014 __________________________________________________________________________________________________________________________
The notes to financial statements are an integral part of this statement.
Component UnitIndirect Operating Capital Community
Expense Charges for Grants and Grants and Governmental Business-type Housing &Expenses Allocation Services Contributions Contributions Activities Activities Total Resources, Inc.
Primary government:Governmental activities:
General government 4,611,205$ (2,621,770)$ 1,575,060$ -$ 72,900$ (341,475)$ (341,475)$ Public safety 4,466,804 351,911 753,675 40,000 2,799 (4,022,241) (4,022,241) Physical environment 618,177 7,486 213,825 80,238 - (331,600) (331,600) Transportation 3,533,495 581,176 - 1,416,696 115,877 (2,582,098) (2,582,098) Economic environment 284,346 34,709 - - - (319,055) (319,055) Human services 1,000 - - - - (1,000) (1,000) Culture/recreation 3,819,004 761,442 640,704 198,401 8,093 (3,733,248) (3,733,248) Interest on long-term debt 357,954 - - - - (357,954) (357,954)
Total governmental activities 17,691,985 (885,046) 3,183,264 1,735,335 199,669 (11,688,671) (11,688,671)
Business-type activities:Sewer system 6,203,951 447,590 6,294,512 - 130,751 - (226,278)$ (226,278) Beach parking 2,249,696 437,456 1,822,700 1,083,325 44,079 - 262,952 262,952
Total business-type activities 8,453,647 885,046 8,117,212 1,083,325 174,830 - 36,674 36,674 Total primary government 26,145,632 - 11,300,476 2,818,660 374,499 (11,688,671) 36,674 (11,651,997)
Component unit:Community Housing & Resources, Inc. 1,141,782$ -$ 602,279$ 389,530$ -$ (149,973)
General revenues:Property taxes, levied for general purpose 8,253,344 - 8,253,344 - Property taxes, levied for debt service 850,501 907,735 1,758,236 - Gas taxes 1,534,406 - 1,534,406 - Local business taxes 284,521 - 284,521 - Communications taxes 568,157 - 568,157 - Intergovernmental revenues, not restricted to specific programs 657,804 - 657,804 - Investment earnings 135,333 360,330 495,663 261 Miscellaneous 443,333 - 443,333 11,061
Transfers (126,975) 126,975 - - Total general revenues and transfers 12,600,424 1,395,040 13,995,464 11,322 Change in net position 911,753 1,431,714 2,343,467 (138,651)
Net position - beginning of year as previously reported 61,456,576 34,623,463 96,080,039 3,530,465 Adjustment (See Note #20) (17,385,406) (1,848,925) (19,234,331) -
Net position - beginning of year as restated 44,071,170 32,774,538 76,845,708 3,530,465 Net position - end of year 44,982,923$ 34,206,252$ 79,189,175$ 3,391,814$
Functions/Programs
Primary GovernmentProgram Revenues Net (Expense) Revenue and Changes in Net Position
49

CITY OF SANIBEL, FLORIDA BALANCE SHEET
GOVERNMENTAL FUNDS September 30, 2014
__________________________________________________________________________________________
The notes to financial statements are an integral part of this statement.
Other TotalGovernmental Governmental
General Transportation Recreation Funds FundsASSETS
Cash and cash equivalents 4,202,332$ 958,757$ 537,350$ 4,201,234$ 9,899,673$ Investments 6,356,595 - - - 6,356,595 Receivables (net of allowance for uncollectibles)
Accounts 81,438 1,859 3,599 2,576 89,472 Interest 123,713 - - - 123,713
Due from other funds 1,397,558 - - - 1,397,558 Due from other governments 93,666 539,752 6,077 45,336 684,831 Inventories 4,690 - 5,001 - 9,691 Prepaids 104,069 - - - 104,069
Total assets 12,364,061$ 1,500,368$ 552,027$ 4,249,146$ 18,665,602$
LIABILITIES AND FUND BALANCESLiabilities:
Accounts payable 295,371$ 321,297$ 44,000$ 80,916$ 741,584$ Retainages payable - 31,527 - 14,316 45,843 Due to other funds - - - 22,558 22,558 Deposits 6,053 - - - 6,053 Accrued liabilities 275,177 24,093 46,974 17,793 364,037 Unearned revenue 246,081 - 18,734 - 264,815
Total liabilities 822,682 376,917 109,708 135,583 1,444,890 Fund balances:
Nonspendable:Inventories 4,690 - 5,001 - 9,691 Prepaid expenditures 104,069 - - - 104,069 Long-term loans to other funds 1,100,000 - - - 1,100,000
Restricted for:Building permits, inspections, operations - - - 863,291 863,291 Transportation capital projects - 405,007 - 527,987 932,994 Other capital projects - - - 161,436 161,436 Debt service - - - 352,105 352,105 Impact fees for capital projects - - - 353,758 353,758 Donations received - - 173,317 170,566 343,883 Canal dredging and trimming - - - 138,851 138,851
Committed to:Disaster reserve 4,500,000 - - - 4,500,000 Environmental initiative reserve 1,000,000 - - - 1,000,000 Insurance deductible reserve 315,000 - - - 315,000
Assigned to:Transportation - 718,444 - - 718,444 Parks and recreation - - 264,001 18,954 282,955 Other capital projects - - - 1,526,615 1,526,615 Other post employment benefits 118,301 - - - 118,301 Subsequent year's budget 1,597,201 - - - 1,597,201
Unassigned: 2,802,118 - - - 2,802,118 Total fund balances 11,541,379 1,123,451 442,319 4,113,563 17,220,712 Total liabilities and fund balances 12,364,061$ 1,500,368$ 552,027$ 4,249,146$ 18,665,602$
50

CITY OF SANIBEL, FLORIDA RECONCILIATION OF THE BALANCE SHEET OF GOVERNMENTAL FUNDS
TO THE STATEMENT OF NET POSITION September 30, 2014
__________________________________________________________________________________________
The notes to financial statements are an integral part of this statement.
Amounts reported for governmental activities in the statement of net position are different because:
Total fund balances - governmental funds 17,220,712$
47,174,068
(57,543)
(985,151)
(171,864)
(8,340,319)
Bonds and notes payable $ (9,365,000) Compensated absences (491,980)
(9,856,980)
Net position of governmental activities 44,982,923$
Capital assets used in governmental activities are not financial resources and, therefore, are notreported in the funds.
Other postemployment benefits are not due and payable in the current period and, therefore, arenot reported in the funds.
Long-term liabilities, including bonds payable, are not due and payable in the current period andtherefore are not reported in the funds.
Debt interest payable that will not be liquidated with current financial resources, is not reportedin the funds.
Deferred inflows of resources related to pension earnings are not recognized in the governmentalfunds; however, they are recorded in the statement of net position under full accrual accounting.
Net pension liabilities are not due and payable in the current period and, therefore, are notreported in the funds.
51

CITY OF SANIBEL, FLORIDA STATEMENT OF REVENUES, EXPENDITURES AND CHANGES IN FUND BALANCES
GOVERNMENTAL FUNDS For the Fiscal Year Ended September 30, 2014
__________________________________________________________________________________________
The notes to financial statements are an integral part of this statement.
Other TotalGovernmental Governmental
General Transportation Recreation Funds FundsREVENUES
TaxesProperty 8,253,344$ -$ -$ 850,501$ 9,103,845$ Gas - 1,534,406 - - 1,534,406 Casualty insurance premium 65,862 - - - 65,862 Local business 284,521 - - - 284,521 Communications services 568,157 - - - 568,157
Permits, Fees, Special Assessments 943,361 - - 626,961 1,570,322 Intergovernmental revenues 773,042 460,405 30,797 1,222,056 2,486,300 Charges for services 1,783,650 - 640,649 9,808 2,434,107 Fines and forfeitures 41,047 - 55 22,779 63,881 Other revenue 198,852 17,416 63,798 439,276 719,342
Total revenues 12,911,836 2,012,227 735,299 3,171,381 18,830,743
EXPENDITURESCurrent
General government 4,957,000 - - 60,528 5,017,528 Public safety 4,222,774 - - 683,799 4,906,573 Physical environment 559,895 - - 38,500 598,395 Transportation 834,996 2,094,163 - 223,459 3,152,618 Economic environment 284,346 - - - 284,346 Human services - - - 1,000 1,000 Culture/recreation 699,152 - 2,135,988 380,803 3,215,943
Debt servicePrincipal retirement - - - 480,000 480,000 Interest and fiscal charges - - - 360,336 360,336
Capital outlay 8,156 - 4,930 779,733 792,819 Total expenditures 11,566,319 2,094,163 2,140,918 3,008,158 18,809,558
1,345,517 (81,936) (1,405,619) 163,223 21,185 OTHER FINANCING SOURCES (USES)
Transfers in 85,815 408,025 1,364,761 774,046 2,632,647 Transfers out (2,260,726) - (13,081) (485,815) (2,759,622)
Total other financing sources (uses) (2,174,911) 408,025 1,351,680 288,231 (126,975)
Net change in fund balances (829,394) 326,089 (53,939) 451,454 (105,790)
Fund balances, beginning of year 12,370,773 797,362 496,258 3,662,109 17,326,502
11,541,379$ 1,123,451$ 442,319$ 4,113,563$ 17,220,712$
Excess (deficiency) of revenues over (under) expenditures
Fund balances, end of year
52

CITY OF SANIBEL, FLORIDA RECONCILIATION OF THE STATEMENT OF REVENUES, EXPENDITURES AND CHANGES IN
FUND BALANCES OF GOVERNMENTAL FUNDS TO THE STATEMENT OF ACTIVITIES For the Fiscal Year Ended September 30, 2014
__________________________________________________________________________________________
The notes to financial statements are an integral part of this statement.
Amounts reported for governmental activities in the statement of activities are different because:
Net change in fund balances - total governmental funds (105,790)$
Capital Outlay $ 792,819 Depreciation (1,541,871)
(749,052)
(6,019)
Principal debt payments 480,000
Accrued other postemployment benefits (6,924) Accrued compensated absences 30,091
Accrued interest payable 2,382 25,549
(28,150)
1,295,215
Change in net position of governmental activities 911,753$
Net effect of various miscellaneous transactions involving capital assets (I.e. disposals,transfers, donations) which decrease net position.
Governmental funds report capital outlays as expenditures. However, in the statement ofactivities the cost of those assets is allocated over their estimated useful lives and reported asdepreciation expense. This is the amount by which capital outlay exceeded depreciation in thecurrent period.
Cash pension contributions reported in the funds were more than the calculated pensionexpense on the statement of activities and therefore increased net position.
Revenue recognized in the statement of activities from a previous period that provides a currentfinancial resource is reported in the funds in the current year. This change represents thechange caused by the "available" revenue recognition criteria.
The (increase) decrease in certain accrued liabilities reported in the Statement of Activities doesnot require the use of current financial resources and therefore is not reported as expenditures in the governmental funds.
Issuance of long-term debt provides current financial resources to governmental funds, while therepayment of the principal of long-term debt consumes the current financial resources ofgovernmental funds. Neither transaction, however, has any effect on net position.
53
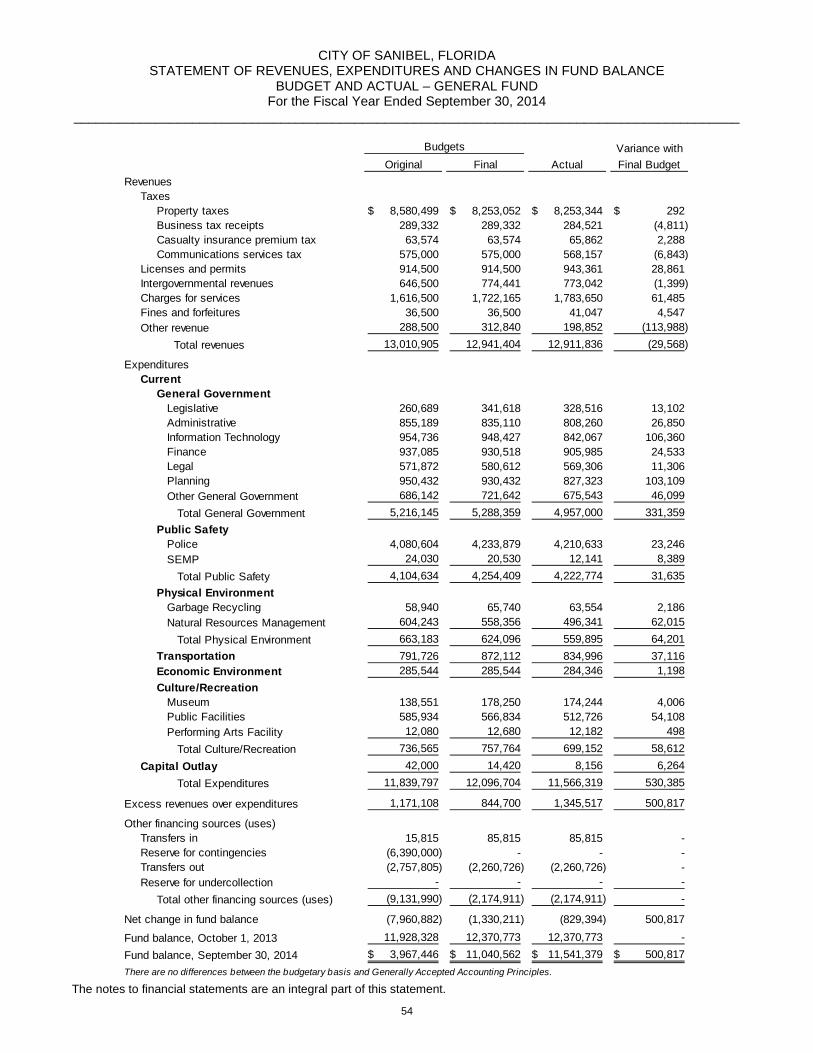
CITY OF SANIBEL, FLORIDA STATEMENT OF REVENUES, EXPENDITURES AND CHANGES IN FUND BALANCE
BUDGET AND ACTUAL – GENERAL FUND For the Fiscal Year Ended September 30, 2014
__________________________________________________________________________________________
The notes to financial statements are an integral part of this statement.
Variance withOriginal Final Actual Final Budget
RevenuesTaxes
Property taxes 8,580,499$ 8,253,052$ 8,253,344$ 292$ Business tax receipts 289,332 289,332 284,521 (4,811) Casualty insurance premium tax 63,574 63,574 65,862 2,288 Communications services tax 575,000 575,000 568,157 (6,843)
Licenses and permits 914,500 914,500 943,361 28,861 Intergovernmental revenues 646,500 774,441 773,042 (1,399) Charges for services 1,616,500 1,722,165 1,783,650 61,485 Fines and forfeitures 36,500 36,500 41,047 4,547 Other revenue 288,500 312,840 198,852 (113,988)
Total revenues 13,010,905 12,941,404 12,911,836 (29,568)
ExpendituresCurrent
General GovernmentLegislative 260,689 341,618 328,516 13,102 Administrative 855,189 835,110 808,260 26,850 Information Technology 954,736 948,427 842,067 106,360 Finance 937,085 930,518 905,985 24,533 Legal 571,872 580,612 569,306 11,306 Planning 950,432 930,432 827,323 103,109 Other General Government 686,142 721,642 675,543 46,099
Total General Government 5,216,145 5,288,359 4,957,000 331,359 Public Safety
Police 4,080,604 4,233,879 4,210,633 23,246 SEMP 24,030 20,530 12,141 8,389
Total Public Safety 4,104,634 4,254,409 4,222,774 31,635 Physical Environment
Garbage Recycling 58,940 65,740 63,554 2,186 Natural Resources Management 604,243 558,356 496,341 62,015
Total Physical Environment 663,183 624,096 559,895 64,201 Transportation 791,726 872,112 834,996 37,116 Economic Environment 285,544 285,544 284,346 1,198 Culture/Recreation
Museum 138,551 178,250 174,244 4,006 Public Facilities 585,934 566,834 512,726 54,108 Performing Arts Facility 12,080 12,680 12,182 498
Total Culture/Recreation 736,565 757,764 699,152 58,612 Capital Outlay 42,000 14,420 8,156 6,264
Total Expenditures 11,839,797 12,096,704 11,566,319 530,385
Excess revenues over expenditures 1,171,108 844,700 1,345,517 500,817
Other financing sources (uses)Transfers in 15,815 85,815 85,815 - Reserve for contingencies (6,390,000) - - - Transfers out (2,757,805) (2,260,726) (2,260,726) - Reserve for undercollection - - - -
Total other financing sources (uses) (9,131,990) (2,174,911) (2,174,911) -
Net change in fund balance (7,960,882) (1,330,211) (829,394) 500,817
Fund balance, October 1, 2013 11,928,328 12,370,773 12,370,773 - Fund balance, September 30, 2014 3,967,446$ 11,040,562$ 11,541,379$ 500,817$ There are no differences between the budgetary basis and Generally Accepted Accounting Principles.
Budgets
54

CITY OF SANIBEL, FLORIDA STATEMENT OF REVENUES, EXPENDITURES AND CHANGES IN FUND BALANCE
BUDGET AND ACTUAL – OTHER MAJOR FUNDS For the Fiscal Year Ended September 30, 2014
__________________________________________________________________________________________
The notes to financial statements are an integral part of this statement.
Variance with
Original Final Actual Final BudgetRevenues
TaxesGas taxes 1,425,000$ 1,482,591$ 1,534,406$ 51,815$
Intergovernmental revenues 43,250 456,360 460,405 4,045 Other revenue 9,000 9,000 17,416 8,416
Total revenues 1,477,250 1,947,951 2,012,227 64,276 Expenditures
CurrentTransportation 2,574,978 2,566,478 2,094,163 472,315
Excess revenues (under) expenditures (1,097,728) (618,527) (81,936) 536,591 Other financing sources (uses)
Transfers in 721,543 408,025 408,025 - Net change in fund balance (376,185) (210,502) 326,089 536,591
Fund balance, October 1, 2013 376,185 797,362 797,362 - Fund balance, September 30, 2014 -$ 586,860$ 1,123,451$ 536,591$
There are no differences between the budgetary basis and Generally Accepted Accounting Principles.
Budgets
Transportation Fund
Variance with
Original Final Actual Final BudgetRevenues
Intergovernmental revenues 25,000$ 25,000$ 30,797$ 5,797$ Charges for services 554,355 615,455 640,649 25,194 Fines and forfeitures - - 55 55 Other revenue 75,000 76,000 63,798 (12,202)
Total revenues 654,355 716,455 735,299 18,844 Expenditures
CurrentRecreation 2,188,028 2,261,499 2,135,988 125,511
Capital Outlay - 28,808 4,930 23,878 Total expenditures 2,188,028 2,290,307 2,140,918 149,389
Excess revenues (under) expenditures (1,533,673) (1,573,852) (1,405,619) 168,233 Other financing sources (uses)
Transfers in 1,338,673 1,364,761 1,364,761 - Transfers out - (13,081) (13,081) -
Total other financing sources (uses) 1,338,673 1,351,680 1,351,680 - Net change in fund balances (195,000) (222,172) (53,939) 168,233 Fund balance, October 1, 2013 347,450 496,258 496,258 - Fund balance, September 30, 2014 152,450$ 274,086$ 442,319$ 168,233$
There are no differences between the budgetary basis and Generally Accepted Accounting Principles.
Budgets
Recreation Fund
55

CITY OF SANIBEL, FLORIDA STATEMENT OF NET POSITION
PROPRIETARY FUNDS September 30, 2014
__________________________________________________________________________________________
The notes to financial statements are an integral part of this statement.
SanibelSewer Beach
System Parking TotalASSETS
Current assetsCash and cash equivalents 5,995,783$ 1,159,171$ 7,154,954$ Receivables (net of allowance for uncollectibles)
Accounts 294,286 589 294,875 Restricted assessments receivable 491,871 - 491,871 Due from other governments 724 575,626 576,350 Inventories 2,520 - 2,520
Total current assets 6,785,184 1,735,386 8,520,570
Noncurrent assetsInvestments 3,776 - 3,776 Restricted assets:
Cash and cash equivalents 1,057,550 - 1,057,550 Assessments receivable 5,628,642 - 5,628,642
Total noncurrent assets 6,689,968 - 6,689,968 Capital assets
Land 1,471,456 389,218 1,860,674 Buildings 1,420,934 1,108,842 2,529,776 Improvements other than buildings - 1,524,398 1,524,398 Vehicles and equipment 2,165,433 1,033,036 3,198,469 Infrastructure 69,162,445 - 69,162,445 Construction in progress 82,431 66,857 149,288
Less accumulated depreciation (31,111,813) (1,448,079) (32,559,892) Total capital assets, net 43,190,886 2,674,272 45,865,158 Total noncurrent assets 49,880,854 2,674,272 52,555,126 Total assets 56,666,038 4,409,658 61,075,696
DEFERRED OUTFLOWS OF RESOURCESDeferred charge on refunding 141,251 - 141,251
Total deferred outflows of resources 141,251$ -$ 141,251$
Business-type activities - Enterprise Funds
56

CITY OF SANIBEL, FLORIDA STATEMENT OF NET POSITION (CONTINUED)
PROPRIETARY FUNDS September 30, 2014
__________________________________________________________________________________________
The notes to financial statements are an integral part of this statement.
SanibelSewer Beach
System Parking TotalLIABILITIES
Current liabilitiesAccount payable and other current liabilities 167,659$ 66,171$ 233,830$ Accrued liabilities 46,134 41,034 87,168 Accrued interest payable 153,860 - 153,860 Due to other funds 275,000 - 275,000 Compensated absences 32,200 23,772 55,972 Debt:
Revenue bonds 1,216,123 - 1,216,123 Notes Payable 1,300,098 - 1,300,098
Total debt 2,516,221 - 2,516,221 Total current liabilities 3,191,074 130,977 3,322,051
Noncurrent liabilitiesDue to other funds 1,100,000 - 1,100,000 Net pension liability 629,248 674,260 1,303,508 Compensated absences 10,733 7,925 18,658 Other postemployment benefits 30,271 24,448 54,719 Debt:
Revenue bonds 7,672,137 - 7,672,137 Notes Payable 13,344,983 - 13,344,983
Total debt 21,017,120 - 21,017,120 Total noncurrent liabilities 22,787,372 706,633 23,494,005 Total liabilities 25,978,446 837,610 26,816,056
DEFERRED INFLOWS OF RESOURCESDeferred inflows of pension earnings 111,190 83,449 194,639
Total deferred inflows of resources 111,190 83,449 194,639
NET POSITIONNet investment in capital assets 19,798,795 2,674,272 22,473,067 Restricted for:
Debt service 7,101,225 - 7,101,225 Capital projects 76,838 - 76,838
Unrestricted 3,740,795 814,327 4,555,122 Total net position 30,717,653$ 3,488,599$ 34,206,252$
Business-type activities - Enterprise Funds
57

CITY OF SANIBEL, FLORIDA STATEMENT OF REVENUES, EXPENSES AND CHANGES IN NET POSITION
PROPRIETARY FUNDS For the Fiscal Year Ended September 30, 2014
__________________________________________________________________________________________
The notes to financial statements are an integral part of this statement.
SanibelSewer Beach
System Parking TotalOPERATING REVENUES
Charges for services 6,188,177$ 1,612,428$ 7,800,605$ Licenses and permits - 106,702 106,702 Fines and forfeitures 19,238 103,509 122,747 Other revenue 87,097 61 87,158
Total operating revenues 6,294,512 1,822,700 8,117,212
OPERATING EXPENSESPersonal services 1,262,949 1,137,719 2,400,668 Contractual services 377,466 447,313 824,779 Materials and supplies 228,969 133,407 362,376 Utilities 315,083 68,083 383,166 Depreciation 2,479,349 194,352 2,673,701 Insurance 19,121 26,731 45,852 Administrative charges 505,897 531,142 1,037,039 Repairs and maintenance 729,661 144,115 873,776
Total operating expenses 5,918,495 2,682,862 8,601,357
Operating income (loss) 376,017 (860,162) (484,145)
NON-OPERATING REVENUES (EXPENSES)Taxes 907,735 - 907,735 Investment earnings 99,104 15,213 114,317 Special assessment interest income 246,013 - 246,013 Intergovernmental - 1,083,325 1,083,325 Gain (loss) on disposition of equipment - (4,290) (4,290) Interest expense and fiscal charges (733,046) - (733,046)
Total non-operating revenues (expenses) 519,806 1,094,248 1,614,054
Income before capital contributions and transfers 895,823 234,086 1,129,909
CAPITAL CONTRIBUTIONSCapital contributions 130,751 - 130,751 Capital contributions intergovernmental - 44,079 44,079
Total capital contributions 130,751 44,079 174,830
TRANSFERSTransfers in from other funds - 135,000 135,000 Transfers out to other funds - (8,025) (8,025)
Total net transfers - 126,975 126,975
Change in net position 1,026,574 405,140 1,431,714
Net position - beginning of year as previously reported 30,673,966 3,949,497 34,623,463 Adjustment (See Note #20) (982,887) (866,038) (1,848,925)
Net position - beginning of year as restated 29,691,079 3,083,459 32,774,538 Net position - end of year 30,717,653$ 3,488,599$ 34,206,252$
Business-type activities - Enterprise Funds
58

CITY OF SANIBEL, FLORIDA STATEMENT OF CASH FLOWS
PROPRIETARY FUNDS For the Fiscal Year Ended September 30, 2014
__________________________________________________________________________________________
The notes to financial statements are an integral part of this statement.
SanibelSewer Beach
System Parking Total
CASH FLOWS FROM OPERATING ACTIVITIESCash received from customers 6,290,158$ 1,823,350$ 8,113,508$ Cash payments to suppliers for goods and services (2,079,438) (1,545,080) (3,624,518) Cash payments to employees for services (1,447,535) (1,243,408) (2,690,943)
Net cash provided (used) by operating activities 2,763,185 (965,138) 1,798,047
Advance annual payment (275,000) - (275,000) Transfers from other funds - 135,000 135,000 Transfers to other funds - (8,025) (8,025) Subsidy from intergovernmental grants - 1,090,501 1,090,501
(275,000) 1,217,476 942,476
Collection of taxes for bond debt service 908,048 - 908,048 Capital contributions from intergovernmental grants - 44,079 44,079 Capital contributions 130,751 - 130,751 Collection of special assessments 833,344 - 833,344 Acquisition/construction of capital assets (301,800) (119,242) (421,042) Proceeds from capital debt issuance 9,493,598 - 9,493,598 Principal paid on capital debt (12,692,418) - (12,692,418) Interest paid on capital debt (775,818) - (775,818) Proceeds from sales of capital assets - 9,236 9,236
(2,404,295) (65,927) (2,470,222)
CASH FLOWS FROM INVESTING ACTIVITIESInvestments purchased (673,498) - (673,498) Proceeds from maturity of investments 2,852,131 - 2,852,131 Interest and investment earnings 346,203 15,213 361,416
Net cash provided by investing activities 2,524,836 15,213 2,540,049
Net increase in cash and cash equivalents 2,608,726 201,624 2,810,350
Cash and equivalents, beginning of year 4,444,607 957,547 5,402,154 Cash and equivalents, end of year 7,053,333$ 1,159,171$ 8,212,504$
CASH FLOWS FROM NONCAPITAL FINANCING ACTIVITIES
CASH FLOWS FROM CAPITAL AND RELATED FINANCING ACTIVITIES
Business-type activities - Enterprise Funds
Net cash provided (used) by noncapital financing activities
Net cash used by capital and related financing activities
59

CITY OF SANIBEL, FLORIDA STATEMENT OF CASH FLOWS (CONTINUED)
PROPRIETARY FUNDS For the Fiscal Year Ended September 30, 2014
__________________________________________________________________________________________
The notes to financial statements are an integral part of this statement.
SanibelSewer Beach
System Parking Total
Operating gain (loss) 376,017$ (860,162)$ (484,145)$
Depreciation 2,479,349 194,352 2,673,701 Amortization 20,926 - 20,926 Non-cash pension expense (183,341) (108,329) (291,670) Net (increase) decrease in assets:
Accounts receivables (4,354) 650 (3,704) Inventories (2,520) - (2,520) Other assets 18,534 - 18,534
Net increase (decrease) in liabilities: Accounts payable 59,819 (194,289) (134,470) Accrued payroll and compensated absences (2,736) 1,355 (1,381) Other postemployment benefits 1,491 1,285 2,776
Net cash provided (used) by operating activities 2,763,185$ (965,138)$ 1,798,047$
Noncash investing, capital, and financing activities:Decrease in fair value of investments 9,801$ Write-off unamortized bond prepaid insurance at refunding 18,533
Reconciliation of operating loss to net cash provided (used) by operating activities
Adjustments to reconcile operating loss to net cash provided (used) by operating activities
Business-type activities - Enterprise Funds
60
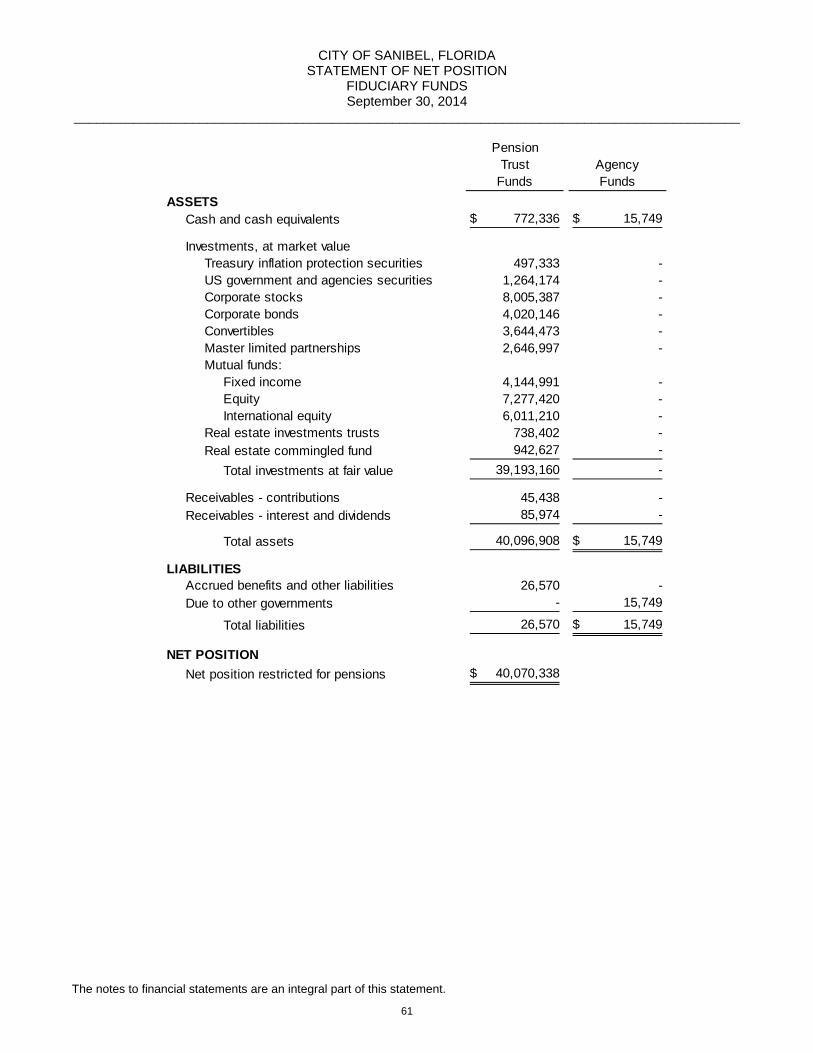
CITY OF SANIBEL, FLORIDA STATEMENT OF NET POSITION
FIDUCIARY FUNDS September 30, 2014
__________________________________________________________________________________________
The notes to financial statements are an integral part of this statement.
PensionTrust Agency
Funds FundsASSETS
Cash and cash equivalents 772,336$ 15,749$
Investments, at market valueTreasury inflation protection securities 497,333 - US government and agencies securities 1,264,174 - Corporate stocks 8,005,387 - Corporate bonds 4,020,146 - Convertibles 3,644,473 - Master limited partnerships 2,646,997 - Mutual funds:
Fixed income 4,144,991 - Equity 7,277,420 - International equity 6,011,210 -
Real estate investments trusts 738,402 - Real estate commingled fund 942,627 -
Total investments at fair value 39,193,160 -
Receivables - contributions 45,438 - Receivables - interest and dividends 85,974 -
Total assets 40,096,908 15,749$
LIABILITIESAccrued benefits and other liabilities 26,570 - Due to other governments - 15,749
Total liabilities 26,570 15,749$
NET POSITIONNet position restricted for pensions 40,070,338$
61

CITY OF SANIBEL, FLORIDA STATEMENT OF CHANGES IN NET POSITION
FIDUCIARY FUNDS For the Fiscal Year Ended September 30, 2014
__________________________________________________________________________________________
The notes to financial statements are an integral part of this statement.
PensionTrustFunds
ADDITIONSContributions
Employer 2,643,900$ State of Florida 65,862 Plan members 180,110
Total contributions 2,889,872
Investment incomeNet appreciation in fair value of investments 2,967,324 Interest and dividends 1,222,321
Total investment earnings 4,189,645
Less investment expense (200,405)
Net investment earnings 3,989,240
Total additions 6,879,112
DEDUCTIONSBenefits paid 1,971,736 Lump sum DROP distributions 49,635 Refunds of contributions 7,455 Administrative expenses 65,821
Total deductions 2,094,647
Change in net position 4,784,465
Net position - beginning of year As previously reported 34,902,103 Adjustment (See Note #20) 383,770
Net position - beginning of year as restated 35,285,873 Net position - end of year 40,070,338$
62
This section contains the following subsections: Note 1 Summary of Significant Accounting Policies .................................................. 64 Note 2 Stewardship, Compliance and Accountability ................................................ 73 Note 3 Deposits and Investments ............................................................................. 75 Note 4 Accounts Receivable ..................................................................................... 83 Note 5 Unearned Revenues ...................................................................................... 84 Note 6 Accounts Payable and Other Accrued Liabilities ........................................... 85 Note 7 Interfund Receivables, Payables, and Transfers ........................................... 85 Note 8 Intergovernmental and Contribution Revenues ............................................. 87 Note 9 Capital Assets ................................................................................................ 88 Note 10 Operating Leases .......................................................................................... 89 Note 11 Long-term Debt .............................................................................................. 90 Note 12 Risk Management .......................................................................................... 93 Note 13 Restricted Assets ........................................................................................... 94 Note 14 Defined Benefit Pension Plans ...................................................................... 94 Note 15 Defined Contribution Plan ............................................................................ 106 Note 16 Other Post-Employment Benefits ................................................................ 108 Note 17 Other Revenues .......................................................................................... 111 Note 18 Contingencies .............................................................................................. 111 Note 19 Commitments .............................................................................................. 111 Note 20 Change in Accounting Principle ................................................................... 112
NOTEST
OTHEFIN
ANCIA
LSTATEM
ENTS
63

CITY OF SANIBEL, FLORIDA NOTES TO THE FINANCIAL STATEMENTS
September 30, 2014 ____________________________________________________________________________________
Note 1. Summary of Significant Accounting Policies
A. Reporting Entity The City was incorporated November 5, 1974. The Charter of the City was adopted pursuant to the Laws of Florida, Chapter 74-606, as from time to time amended. The City operates under the Council-Manager form of government and provides municipal services such as police protection, public works, parks, recreation, natural resources, below market housing and all the necessary functions of general government. The City also has two enterprise operations consisting of wastewater utility services and beach parking services. The financial statements of the City have been prepared in conformity with generally accepted accounting principles (GAAP) accepted in the United States of America, as applied to governmental units. The Governmental Accounting Standards Board (GASB) is the accepted standard-setting body for establishing governmental accounting and financial reporting principles. The following is a summary of the City’s more significant accounting policies. The accompanying financial statements present the combined financial position, results of operations and cash flows of the applicable fund types governed by the City of Sanibel. As prescribed by the GASB, the financial reporting entity consists of the primary government, organizations for which the primary government are financially accountable and other organizations whose exclusion would cause the reporting entity’s financial statements to be misleading or incomplete. Each potential component unit is individually evaluated using specific criteria outlined by the GASB to determine whether the entity is: a) part of the primary government; b) a component unit which should be included in the reporting entity (blended or discretely presented); or c) an organization which should be excluded from the reporting entity entirely. The principal criteria for classifying a potential component unit include: a) the legal separateness of the organization; and b) the financial accountability to the primary government resulting from either the primary government’s ability to impose its will on the potential component unit or the potential component unit’s fiscal dependency on the primary government. In determining the agencies, boards or authorities to be included in the comprehensive annual financial report, the City has considered all potential component units. Under criteria established by the GASB, component units are to be either blended with the primary government or presented discretely. For a component unit to be blended it must meet one or both of the following two situations: 1) the board of the component unit is substantively the same as that of the primary government; or 2) the component unit serves the primary government exclusively, or almost exclusively. Discretely-Presented Component Unit – Based upon the application of these criteria, the following entity was determined to be a discretely-presented component unit: Community Housing and Resources, Inc. (CHR) is a legally separate organization with its own board that is not selected by the City Council. CHR provides services almost entirely to the citizens of the City of Sanibel. CHR is fiscally dependent upon the City in that there is a financial burden to the City and the nature and significance of the relationship between the City and CHR is such that excluding CHR from the City’s financial statements would be misleading and incomplete. Additionally, the support that the City provides to CHR is a significant financial component of its overall operations. CHR has issued separate financial statements for the year ended September 30, 2014, which may be obtained at the entity's administrative offices located at 2401 Library Way, Sanibel, Florida, 33957.
64

CITY OF SANIBEL, FLORIDA NOTES TO THE FINANCIAL STATEMENTS
September 30, 2014 ____________________________________________________________________________________
Note 1. Summary of Significant Accounting Policies (Continued)
B. Government-Wide and Fund Financial Statements The basic financial statements consist of the government-wide financial statements and fund financial statements. Both sets of statements distinguish between the governmental and business-type activities of the City. The government-wide financial statements (i.e., the Statement of Net Position and the Statement of Activities) report information on all of the non-fiduciary activities of the primary government and its component unit. As part of the consolidation process, inter-fund activities are eliminated to avoid distorted financial results. The amounts reported as internal balances represent the residual amounts due between governmental and business-type activities. Fiduciary funds of the government are also excluded from this presentation since these resources are not available for general government funding purposes. The Statement of Net Position reports all financial and capital resources of the City’s governmental and business-type activities. Governmental activities, which normally are supported by taxes and intergovernmental revenues, are reported separately from business-type activities, which rely to a significant extent on fees and charges for support. Likewise, the primary government is reported separately from certain legally separate component units for which the primary government is financially accountable. The Statement of Activities demonstrates the degree to which the direct expenses and indirect expenses of a given function or segment are offset by program revenues. Direct expenses are those that are clearly identifiable with a specific function or segment including depreciation. The City does not allocate the interest expense of governmental fund debt but the City does allocate certain indirect costs such as finance, personnel, legal, etc., from general government to other functions and/or segments. Program revenues include: 1) charges to customers or applicants who purchase, use, or directly benefit from goods, services, or privileges provided by a given function or segment; and 2) grants and contributions that are restricted to meeting the operational or capital requirements of a particular function or segment. Taxes and other items not properly included among program revenues are reported instead as general revenues. Separate financial statements are provided for governmental funds, proprietary funds, and fiduciary funds, even though the latter are excluded from the government-wide financial statements. Major individual governmental funds and major individual enterprise funds are reported as separate columns in the fund financial statements. Since the governmental fund financial statements are presented on a different measurement focus and basis of accounting than the government-wide statements, a reconciliation statement is provided which briefly explains the adjustments necessary to reconcile the results of governmental fund accounting to the government-wide presentations. The City’s fiduciary funds are presented in the fund financial statements.
65
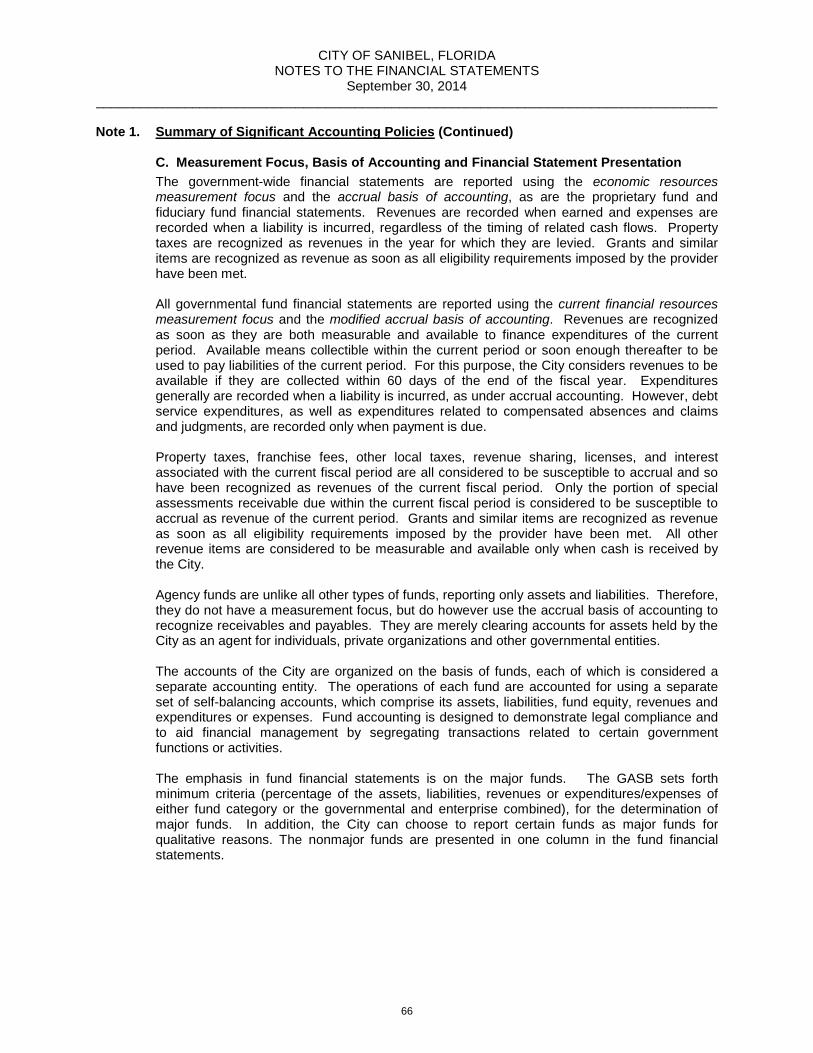
CITY OF SANIBEL, FLORIDA NOTES TO THE FINANCIAL STATEMENTS
September 30, 2014 ____________________________________________________________________________________
Note 1. Summary of Significant Accounting Policies (Continued)
C. Measurement Focus, Basis of Accounting and Financial Statement Presentation The government-wide financial statements are reported using the economic resources measurement focus and the accrual basis of accounting, as are the proprietary fund and fiduciary fund financial statements. Revenues are recorded when earned and expenses are recorded when a liability is incurred, regardless of the timing of related cash flows. Property taxes are recognized as revenues in the year for which they are levied. Grants and similar items are recognized as revenue as soon as all eligibility requirements imposed by the provider have been met. All governmental fund financial statements are reported using the current financial resources measurement focus and the modified accrual basis of accounting. Revenues are recognized as soon as they are both measurable and available to finance expenditures of the current period. Available means collectible within the current period or soon enough thereafter to be used to pay liabilities of the current period. For this purpose, the City considers revenues to be available if they are collected within 60 days of the end of the fiscal year. Expenditures generally are recorded when a liability is incurred, as under accrual accounting. However, debt service expenditures, as well as expenditures related to compensated absences and claims and judgments, are recorded only when payment is due. Property taxes, franchise fees, other local taxes, revenue sharing, licenses, and interest associated with the current fiscal period are all considered to be susceptible to accrual and so have been recognized as revenues of the current fiscal period. Only the portion of special assessments receivable due within the current fiscal period is considered to be susceptible to accrual as revenue of the current period. Grants and similar items are recognized as revenue as soon as all eligibility requirements imposed by the provider have been met. All other revenue items are considered to be measurable and available only when cash is received by the City. Agency funds are unlike all other types of funds, reporting only assets and liabilities. Therefore, they do not have a measurement focus, but do however use the accrual basis of accounting to recognize receivables and payables. They are merely clearing accounts for assets held by the City as an agent for individuals, private organizations and other governmental entities. The accounts of the City are organized on the basis of funds, each of which is considered a separate accounting entity. The operations of each fund are accounted for using a separate set of self-balancing accounts, which comprise its assets, liabilities, fund equity, revenues and expenditures or expenses. Fund accounting is designed to demonstrate legal compliance and to aid financial management by segregating transactions related to certain government functions or activities. The emphasis in fund financial statements is on the major funds. The GASB sets forth minimum criteria (percentage of the assets, liabilities, revenues or expenditures/expenses of either fund category or the governmental and enterprise combined), for the determination of major funds. In addition, the City can choose to report certain funds as major funds for qualitative reasons. The nonmajor funds are presented in one column in the fund financial statements.
66

CITY OF SANIBEL, FLORIDA NOTES TO THE FINANCIAL STATEMENTS
September 30, 2014 ____________________________________________________________________________________
Note 1. Summary of Significant Accounting Policies (Continued)
C. Measurement Focus, Basis of Accounting and Financial Statement Presentation
(Continued) The City reports the following major governmental funds: General Fund – the general fund is the City’s primary operating fund, and is used to
account for all financial resources except those required to be accounted for in another fund. All tax revenues and other receipts that are not allocated by law or contractual agreement to another fund are accounted for in this fund. The majority of current operating expenditures of the City, other than proprietary fund activities, are financed through revenues received by the general fund.
Transportation Fund – a special revenue fund used to account for the public works department’s street division. All activities necessary to provide repaving, maintenance and repairs to the City’s streets, shared-use paths and drainage system. Revenues are received from local option gas taxes, municipal fuel allocation portion of the State of Florida’s municipal shared revenues and fuel tax rebates. Additionally, an interlocal agreement with Lee County provides the City with 21% of the Causeway’s surplus tolls.
Recreation Fund – a special revenue fund used to account for the recreation center programs and the Center-4-Life center programs. All activities necessary to provide recreation programs are accounted for in this fund. Revenues are received from membership fees and program fees. An interlocal agreement with the Lee County School Board provides twenty (20%) percent reimbursement for the recreation center’s electric costs.
The City reports the following major proprietary funds: Sewer System Fund – an enterprise fund used to account for the provision of wastewater
collection and disposal services and wastewater reuse services to the residents and businesses of the City. All activities necessary to provide such services are accounted for in this fund, including administration, operations, construction, maintenance, financing and related debt service costs, billing and collection.
Beach Parking Fund – an enterprise fund used to account for the provision of parking and shared-use path access to the beaches, public safety services, beach facilities maintenance services and beach maintenance services. All activities necessary to provide such services are accounted for in this fund, including administration, operations, construction, maintenance, and collection of parking fees and parking violation fines. This fund receives operating grants from local agencies that augment beach maintenance.
Governmental and enterprise funds which do not meet the criteria for reporting as major funds are grouped together for financial reporting in one column. The City has no nonmajor enterprise funds, and reports certain nonmajor governmental funds of the following fund type: Special Revenue Funds – to account for and report the proceeds of certain specific
revenue sources that are restricted or committed to expenditure for specified purposes other than debt service or capital projects.
Debt Service Funds – to account for and report financial resources that are restricted to the accumulation of resources for, and the payment of, general long-term debt principal, interest, and related costs for governmental fund types.
Capital Project Funds – to account for and report financial resources that are received or appropriated for capital outlays, including the acquisition or construction of capital facilities and other capital assets, other than those accounted for in the proprietary funds.
67

CITY OF SANIBEL, FLORIDA NOTES TO THE FINANCIAL STATEMENTS
September 30, 2014 ____________________________________________________________________________________
Note 1. Summary of Significant Accounting Policies (Continued)
C. Measurement Focus, Basis of Accounting and Financial Statement Presentation
(Continued) In addition, the City reports the following fiduciary fund types:
Pension Trust Funds – to account for resources used to finance the City’s retirement programs. These funds are accounted for in the same manner as proprietary fund types. The City has two pension trust funds which accumulate resources to provide retirement benefits to City employees. The two pension trust funds are the Municipal Police Officers’ Pension Trust Fund and the General Employees’ Pension Trust Fund.
Agency Funds – to account for fees collected and held by the City as an agent for individuals, private organizations and other governmental agencies. The City collects and remits funds to the Sanibel Fire Rescue District, the Lee County School Board and various departments within Lee County.
As a general rule the effect of interfund activity has been eliminated from the government-wide financial statements. Exceptions to this rule include payments-in-lieu of taxes where the amount is reasonably equivalent in value to the interfund services provided and charges between the City’s sewer function and various other functions of the City. Elimination of these charges would distort the direct costs and program revenues reported for the various functions concerned. Amounts reported as program revenues include: 1) charges to customers or applicants who purchase, use, or directly benefit from goods, services, or privileges provided; and 2) grants and contributions that are restricted to meeting operational or capital requirements, including special assessments. Taxes and other items not properly included among program revenues are reported instead as general revenues. Proprietary funds distinguish operating revenues and expenses from non-operating items. Operating revenues and expenses generally result from providing services and producing and delivering goods in connection with a proprietary fund's principal ongoing operation. The principal operating revenues of the Sanibel Sewer System and of the Beach Parking enterprise funds are charges to customers for sales and services. Operating expenses for the Sanibel Sewer System and Beach Parking enterprise funds include the cost of sales and services, administrative expenses and depreciation on capital assets. All revenues and expenses not meeting this definition are reported as non-operating revenues and expenses.
D. Cash and Cash Equivalents and Investments The City maintains a cash and investment pool that is available for use by all funds. The City considers cash on hand, the cash and investment pool and non-pooled investments with original maturities of three months or less when purchased to be cash equivalents for purposes of the statement of cash flows. The City’s cash and investment pool allows individual funds, at any time, to deposit additional cash or make withdrawals without prior notice or penalty. Interest earned on pooled cash and investments is allocated to funds based on their average daily balances. Investments include non-pooled investments with original maturities of three months or more when purchased.
68

CITY OF SANIBEL, FLORIDA NOTES TO THE FINANCIAL STATEMENTS
September 30, 2014 ____________________________________________________________________________________
Note 1. Summary of Significant Accounting Policies (Continued)
D. Cash and Cash Equivalents and Investments (Continued) For all funds except the pension trust funds, investments consist of U.S. Government securities, U.S. Government Agency securities, bonds issued by corporations organized under the laws of the United States or District of Columbia with investment grade rating of “A” or better, investment grade obligations of state and local governments and public authorities with a maturity greater than three months and are carried at fair value. In addition, investments in the City’s pension funds include U.S. Government securities, corporate bonds, equity securities, comingled real estate fund and mutual funds. All investments are reported at fair value using quoted market prices or the best estimate available. The difference between cost and fair value of investments held is recorded as net unrealized gains or losses and is included in net investment earnings. E. Interfund Receivables and Payables During the course of operations, numerous transactions occur between individual funds for goods provided or services rendered. These receivables and payables are reported as "due from other funds" or "due to other funds". Any residual balances outstanding between the governmental activities and business-type activities are reported in the government-wide financial statements as "internal balances". F. Inventories Inventories consisting of materials and supplies held for consumption and inventories held for resale are stated at cost (first in, first-out method). The City utilizes the consumption method of accounting for inventories consisting of materials and supplies, which provides that expenditures/expenses are recognized when inventory is used. Perpetual inventory records are maintained and adjusted annually to physical inventory amounts as of September 30th of each year for inventories held for resale. Inventory held for resale is reported using the purchase method, whereby inventory items are recorded as expenditure when purchased. G. Prepaid Items Certain payments to vendors reflect costs applicable to future accounting periods and are recorded as prepaid items in both government-wide and fund financial statements. H. Restricted Assets Certain proceeds of the City’s bonds and notes (both governmental and proprietary funds), as well as certain resources set aside for their repayment, are classified as restricted assets on the Statement of Net Position because their use is limited by applicable bond covenants or other legal agreements. The debt service funds are used to segregate resources accumulated for debt service payments over the next twelve months. The reserve funds are used to report resources set aside to pay debt service if the sources of the pledged revenues do not generate sufficient funds to satisfy the debt service requirements. Additional, there are restricted assets in capital project funds and special revenue funds that are to be used only for specific purposes.
69

CITY OF SANIBEL, FLORIDA NOTES TO THE FINANCIAL STATEMENTS
September 30, 2014 ____________________________________________________________________________________
Note 1. Summary of Significant Accounting Policies (Continued)
I. Capital Assets Capital assets, which include property, plant, equipment, and infrastructure assets (e.g., roads, bridges, shared-use paths, and similar items) are reported in the applicable governmental or business-type activities columns in the government-wide financial statements. The City defines capital assets as assets with an initial individual cost of more than $1,000 and an estimated useful life in excess of one year. Such assets are recorded at historical cost or estimated historical cost if purchased or constructed. Donated capital assets are recorded at an estimated fair market value at the date of donation. The difference between the fair value and the amount paid for bargain purchase assets transferred between governmental entities at nominal amounts is treated as if it were a donated asset. In the governmental funds only the amount paid in cash is reported as a capital expenditure. The difference between fair value and the capital expenditure is reported as capital contribution revenue in the government-wide financial statement. Depreciation is provided using the straight-line method over the estimated useful lives of the related assets. The ranges of useful lives are as follows:
Assets Years Buildings 15-50 Improvements other than buildings 15 Infrastructure 30 Vehicles and Equipment 5-10
The cost of assets retired or sold, together with the related accumulated depreciation, is removed from the accounts and any gain or loss on disposition is credited or charged to earnings. Interest is capitalized on enterprise fund assets constructed with tax-exempt debt. The amount of interest to be capitalized is calculated by offsetting interest expense incurred from the date of the borrowing until completion of the project construction with interest earned on invested proceeds over the same period. J. Compensated Absences The City's regular full-time (40-hour-per-week) employees may accrue a maximum of 240 vacation hours. Regularly scheduled part-time employees who regularly work at least 16 hours per week accrue vacation leave in proportion to the amount of time worked. Sick leave accumulation is unlimited. Upon termination, employees can be paid for all accrued vacation time and 1/4 of all accrued sick time to a maximum of 390 hours. These benefits plus their related taxes are classified as compensated absences. The accumulated compensated absences are accrued when incurred in the government-wide financial statements and proprietary funds. The expenditure and liability for compensated absences are recognized in the governmental funds only when they have matured. That is, the only portion of the liability reported in the governmental funds is that amount of reimbursable unused vacation leave and sick leave payable to employees who have terminated their employment as of the end of the fiscal year.
70

CITY OF SANIBEL, FLORIDA NOTES TO THE FINANCIAL STATEMENTS
September 30, 2014 ____________________________________________________________________________________
Note 1. Summary of Significant Accounting Policies (Continued)
K. Long-Term Obligations In the government-wide financial statements and proprietary fund type financial statements, long-term debt and other long-term obligations are reported as liabilities in the applicable governmental activities, business-type activities, or proprietary fund type statement of net position. Bond premiums and discounts, as well as bond insurance costs, are deferred and amortized over the life of the bonds using the straight-line method. Bond issuance costs are expensed in the current period. In the fund financial statements, governmental fund types recognize bond premiums and discounts as well as bond issuance costs, during the current period. The face amount of debt issued is reported as other financing sources. Premiums received on debt issuances are reported as other financing sources while discounts on debt issuances are reported as other financing uses. Issuance costs, whether or not withheld from the actual debt proceeds received, are reported as debt service expenditures. L. Deferred Outflows/Inflows of Resources In addition to assets, the statement of net position will sometimes report a separate section for deferred outflows of resources. This separate financial statement element, deferred outflows of resources, represents a consumption of net position that applies to a future period(s) and so will not be recognized as an outflow of resources (expense/ expenditure) until then. The City only has one item that qualifies for reporting in this category. In the business-type activities column of the government-wide statement of net position a deferred charge on refunding is reported, resulting from the difference in the carrying value of refunded debt and its reacquisition price. This amount is deferred and amortized using the straight line method over the shorter of the life of the refunded or refunding debt. In addition to liabilities, the statement of net position and governmental funds balance sheet will sometimes report a separate section for deferred inflows of resources. This separate financial statement element, deferred inflows of resources, represents an acquisition of net position or fund balance that applies to a future period(s) and so will not be recognized as an inflow of resources (revenue) until that time. The City has only one type of item that qualifies for reporting in this category. A deferred inflow of pension earnings is reported for both governmental and business-type activities in the statement of net position. See Note 14 for more information on this line item. M. Utility Connection (Impact) Fees The City utilizes utility connection fees as a means for funding capital expansion required to meet sewer system demands resulting from growth. These fees are recorded as capital contribution revenue in the Sewer Fund when charged. N. Special Assessments The City levies special assessments against benefited property owners for construction of wastewater utility expansion in certain areas of the City. The special assessments are recorded as capital contributions, net of refunds, in the enterprise funds.
71

CITY OF SANIBEL, FLORIDA NOTES TO THE FINANCIAL STATEMENTS
September 30, 2014 ____________________________________________________________________________________
Note 1. Summary of Significant Accounting Policies (Continued)
O. Unearned Revenue Receipts that do not meet the criteria for revenue recognition, such as business tax receipts collected in advance, are reported as unearned revenues for both the government-wide and the fund financial statements. P. Intragovernmental Allocation of Administrative Expenses The general fund incurs certain administrative expenses for other funds, including accounting, legal, data processing, personnel administration, and other services. The governmental activities that received these services were charged $1,736,724 and the business-type activities that received these services were charged $885,046. Administrative expenses not directly charged to a fund are allocated as indirect expenses on the Statement of Activities. Q. Fund Balance In the fund financial statements, governmental funds report fund classifications that comprise a hierarchy based primarily on the extent to which the City is bound to honor constraints on the specific purposes for which amounts in those funds can be spent. Fund balance is reported in five components: nonspendable, restricted, committed, assigned and unassigned. Nonspendable – This component includes amounts that are (a) not in spendable form or (b) legally or contractually required to be maintained intact. “Not in spendable form” includes items that are not expected to be converted to cash (such as inventories and prepaid amounts) and items such as long-term amount of loans and notes receivable, as well as property acquired for resale. The corpus (or principal) of a permanent fund is an example of an amount that is legally or contractually required to be maintained intact. Restricted – This component consists of amounts that can be spent only for specific purposes stipulated by (a) external resource providers such as creditors (by debt covenants), grantors, contributors, or laws or regulations of other governments; or (b) imposed by law through constitutional provisions or enabling legislation. Committed – This component consists of amounts that can be used only for the specific purposes determined by a formal action (resolution) of the City Council, the City’s highest level of decision making authority. Commitments may be changed or lifted only by the City Council taking the same formal action (resolution) that imposed the constraint originally. Assigned – This component consists of amounts that are constrained by the City’s intent to be used for specific purposes, but are neither restricted nor committed. The authority for assigning fund balance is expressed by the City Council or City Manager as established in the City’s fund balance policy. Unassigned - Unassigned fund balance is the residual classification for the general fund. This classification represents spendable fund balance that has not been assigned to other funds and that has not been restricted, committed, or assigned to specific purposes within the general fund. Unassigned fund balance may also include negative balances for any governmental fund if expenditures exceed amounts restricted, committed, or assigned for those specific purposes.
72

CITY OF SANIBEL, FLORIDA NOTES TO THE FINANCIAL STATEMENTS
September 30, 2014 ____________________________________________________________________________________
Note 1. Summary of Significant Accounting Policies (Continued)
Q. Fund Balance (continued) The City uses restricted amounts to be spent first when both restricted and unrestricted fund balance is available. Additionally, the City would first use committed fund balance, followed by assigned fund balance and then unassigned fund balance when expenditures are incurred for purposes for which amounts in any of the unrestricted fund balance classifications could be used. R. Minimum Fund Balance Policy The City’s policy is to maintain an adequate general fund unassigned fund balance to provide liquidity to meet seasonal shortfalls in cash flow, and reduce susceptibility to emergency or unanticipated expenditures and/or revenue shortfalls. Fund balance information is used to identify the available resources to repay long-term debt, reduce property taxes, add new governmental programs, expand existing ones, or enhance the financial position of the City, in accordance with policies established by the City Council. The City Council adopted a financial standard to maintain a general fund minimum unassigned fund balance of 17% of general fund operating expenditures. S. Net Position The net positions of the government-wide and proprietary funds are categorized as net investment in capital assets, restricted or unrestricted. The first category represents property, plant, equipment and infrastructure, less outstanding debt related to the acquisition of those assets. The restricted category represents the balance of assets restricted by requirements of revenue bonds and other externally or legislatively imposed constraints in excess of the related liabilities payable from restricted assets. The unrestricted category represents all other resources that do not meet the definition of “restricted” or “net investment in capital assets”.
Note 2. Stewardship, Compliance and Accountability A. Budgets - Legal Compliance Budgets are adopted on a basis consistent with U.S. Generally Accepted Accounting Principles, except for the following funds for the respective reasons: FUND REASON Special Revenue Funds Fertilizer Outreach and Education No expenditures were planned for the year Historical Committee Fund No expenditures were planned for the year Annual appropriated budgets are adopted for the general fund, special revenue funds, debt service funds, capital project funds, and enterprise funds. All annual appropriations lapse at fiscal year-end and are not automatically re-appropriated the following fiscal year. On July 1st of each year, the Lee County Property Appraiser supplies the City with the assessed taxable valuation of the property located within the City on which the City's millage (property tax) rate for the next budget year will be based. Prior to July 31st a public hearing is held at which a proposed budget is presented to the City Council and, by resolution, the City Council establishes a proposed millage (property tax) rate for the subsequent fiscal year, which begins on October 1st.
73

CITY OF SANIBEL, FLORIDA NOTES TO THE FINANCIAL STATEMENTS
September 30, 2014 ____________________________________________________________________________________
Note 2. Stewardship, Compliance and Accountability (Continued)
A. Budgets - Legal Compliance (continued) Based on the State of Florida Truth in Millage (TRIM) calendar, the City holds two public hearings on the tentative millage rate and tentative budget during the month of September. On or before September 30th the budget is legally adopted by resolution. Five-year financial plans are also adopted for all capital project funds. Budget amounts are presented as originally adopted and as amended by the City Council. Budget amendments, which are adopted by resolution of the City Council, are used to revise the budgeted amounts through the year. The City Manager may amend the budget within existing appropriations of individual funds. The level of control whereby expenditures cannot exceed appropriations is at the fund level. During the fiscal year ended September 30, 2014, various supplemental appropriations were approved by the City Council in accordance with this policy. B. Budgeted Excess of Expenditures over Appropriations The City has no excess of expenditures over appropriations in individual governmental funds. C. Property Taxes All real and tangible personal property taxes are due and payable on November 1 of each year, or as soon thereafter as the tax roll is certified by the Lee County Property Appraiser, and become delinquent on April 1 of the following year. The Lee County Tax Collector does the billing and collection of all property taxes for the City. The tax collector mails to each property owner on the tax roll a notice of taxes levied by the various governmental entities in the County. Discounts are allowed for payment of property taxes made between November 1 and March 1. Tax certificates for the full amount of any unpaid taxes or assessments must be sold no later than June 1st of each year. The laws of Florida provide for procedures for collecting delinquent taxes, including applicable tax certificate sales, tax deed sales and tangible personal property seizure and sales. Enforceable lien date is approximately two years after taxes become delinquent and occurs only upon request of a holder of a delinquent tax certificate. Key dates in the property tax cycle (latest date, where appropriate) are as follows: July 1 Assessment roll certified, unless extension
granted by the Florida Department of Revenue.
93 days later (normally October 1) Millage resolution approved and taxes levied following certification of assessment roll.
November 1 Property taxes become due and payable (maximum discount, i.e., 4 percent). April 1 Taxes become delinquent (lien date). Prior to June 1 Tax certificates sold. The City is, in general, permitted by the State to levy property taxes up to $10 per $1,000 of assessed valuation for general governmental services. The tax rates for the year ended September 30, 2014 (tax year 2013) for the general governmental operations and voted debt service for the sewer expansion project, the 2012 Series General Obligation Refunding Bonds used to purchase environmentally sensitive land, and the 2006 Series General Obligation Bonds used to construct a recreational facility were 2.0861, 0.2295, 0.0860, and 0.1291, respectively, per $1,000 of assessed property valuation.
74
CITY OF SANIBEL, FLORIDA NOTES TO THE FINANCIAL STATEMENTS
September 30, 2014 ____________________________________________________________________________________
Note 3. Deposits and Investments
A. Deposits Custodial credit risk is the risk that in the event of a bank failure, the City’s deposits may not be returned to it. In accordance with its policy, all City depositories are banks designated by the Florida Chief Financial Officer as qualified public depositories. Chapter 280 of the Florida Statutes, “Florida Security for Public Deposits Act” provides procedures for public depositories to ensure public monies in banks and saving and loans are collateralized with the Florida Chief Financial Officer as agent for the public entities. Chapter 280 defines deposits as demand deposit accounts, time deposit accounts, and non-negotiable certificates of deposit. Financial institutions qualifying as public depositories shall deposit with the Florida Chief Financial Officer eligible collateral at the pledging level required pursuant to Chapter 280. The Florida Security for Public Deposits Act has a procedure for the payment of losses in the event of a default or insolvency. When public deposits are made in accordance with Chapter 280, no public depositor shall be liable for any loss thereof, and therefore, the City is not exposed to custodial credit risk for its deposits. At September 30, 2014, the carrying amount of cash on hand and on deposit with banks, including interest-bearing deposits, was $7,539,550. The carrying amount of cash with the City’s investment accounts pending overnight sweep from money market funds at September 30, 2014 was $19. B. Investments By Florida Statutes 218.415 and by Resolution No. 10-002 the City is authorized to invest in the Florida Local Government Surplus Funds Trust Fund, intergovernmental investment pools authorized pursuant to the Florida Interlocal Cooperation Act of 1969, as provided in Section 163.01 Florida Statutes, Securities and Exchange Commission registered money market funds, interest-bearing savings accounts, certificates of deposit, direct obligations of the U.S. Treasury, Federal agencies and instrumentalities, repurchase agreements, and collateralized mortgage obligations when the purpose of the purchase is to hold such investment to maturity, prime commercial paper of a United States corporation, finance company or banking institution, regulated bond mutual funds, corporate bonds or other corporate debt securities and investment grade obligations of state and local governments and public authorities. Additionally, the pension trust funds are authorized to invest in equity securities. The City seeks to optimize return on investments within the constraints of safety and liquidity. Securities are not sold prior to maturity with the following exceptions: a) a declining credit security could be sold early to minimize loss of principal; b) a security swap would improve the quality, yield or target duration in the portfolio; or c) liquidity needs of the portfolio require that the security be sold. The City’s investment policy defines suitable/authorized investment instruments and investment guidelines for each investment program: operating funds (pooled investments), reserve funds (non-pooled investments), surplus funds (pooled investments) and restricted funds (non-pooled investments). The City’s investment programs’ portfolios are under the direction and daily supervision of an investment adviser (Integrity Fixed Income Management, LLC). Investment compliance and performance is monitored by Burgess Chambers & Associates, Inc.
75

CITY OF SANIBEL, FLORIDA NOTES TO THE FINANCIAL STATEMENTS
September 30, 2014 ____________________________________________________________________________________
Note 3. Deposits and Investments (Continued)
B. Investments (Continued) The City maintains an investment pool that is available for use by all funds, except the Pension Trust Funds. In addition, investments are separately held by several of the City’s funds. The investments of the Pension Trust Funds are held separately from those of other City funds. Interest income earned as a result of pooling is allocated based upon the proportionate balance of each fund’s equity in pooled cash and pooled investments. Following is a summary of the City’s pooled investments at September 30, 2014 excluding investments in the City’s pension funds:
Following is a summary of the City’s non-pooled investments at September 30, 2014 excluding investments in the City’s pension funds:
The Florida State Board of Administration’s (SBA) Florida PRIME meets the criteria of a Rule 2a-7 like pool and the investments are valued using the account balance which is stated at amortized cost. Rule 2a-7 is the rule that permits money market funds to use amortized cost to maintain a constant net asset value (NAV) of $1.00 per share. The weighted average days to maturity (WAM) of the Florida PRIME at September 30, 2014, was 39 days. The Florida PRIME is rated by Standard & Poor’s as AAAm.
Percent of Less Than 3-12 1-3 OverInvestment Type Portfolio Fair Value 3 Months Months Years 3 Years
Cash 0.00% 19$ 19$ -$ -$ -$ SBA Florida PRIME 1.85% 190,577 190,577 - - - Federated Prime MMF 0.13% 13,670 13,670 - - - FDIC Insured MM 0.41% 42,528 42,528 - - - Taxable Municipal Obligations 87.40% 8,982,196 1,315,581 2,918,123 3,023,348 1,725,144 Corporate Bonds 10.21% 1,049,017 50,092 410,773 401,984 186,168
10,278,007$ 1,612,467$ 3,328,896$ 3,425,332$ 1,911,312$
Pooled InvestmentsInvestment Maturities
Percent of Less Than 3-12 1-3 OverInvestment Type Portfolio Fair Value 3 Months Months Years 3 Years
GNMA 0.03% 1,913$ -$ -$ -$ 1,913$ (1)FHLMC 0.06% 3,776 - - - 3,776 SBA Florida PRIME 3.97% 265,382 265,382 - - - Federated Prime MMF 0.78% 51,831 51,831 - - - Taxable Municipal Obligations 85.73% 5,725,145 1,491,216 2,634,585 1,599,344 - Corporate Bonds 9.43% 629,537 171,175 353,633 104,729 -
6,677,583$ 1,979,604$ 2,988,218$ 1,704,073$ 5,689$
Investment Maturities
(1) The FHLMC investment has a "no rating" (NR) by Standard’s & Poor and Moody’s. Original investment of $595,000 was made in 1993. Balance remaining to be redeemed as of September 30, 2014 is $3,776.
Non-Pooled Investments
76

CITY OF SANIBEL, FLORIDA NOTES TO THE FINANCIAL STATEMENTS
September 30, 2014 ____________________________________________________________________________________
Note 3. Deposits and Investments (Continued)
B. Investments (Continued) The SBA’s Florida PRIME is administered by the State Board of Administration under the regulatory oversight of the State of Florida, Chapter 19-7 of the Florida Administrative Code.
The Federated Prime Obligations Fund (Federated Prime MMF) is rated with Triple A ratings from three credit rating agencies: Standard & Poor’s, Moody’s and Fitch. The securities are valued at amortized cost to maintain a constant net asset value (NAV) of $1.00 per share. The weighted average days to maturity (WAM) at September 30, 2014, was 47 days.
All the municipal bonds and notes are investment grade with Standard and Poor’s credit ratings of A- to AAA or a Moody’s rating of A1 to Aa1. Except for two BBB+ ratings, the corporate bonds’ Standard and Poor’s credit ratings are A- to AA+.
Interest Rate Risk. As a means of limiting its exposure to fair value losses arising from changes in interest rates, the City's investment policy limits the City's investment portfolio to maturities of five years. Investments held to meet bond reserve requirements may be invested in debt instruments exceeding five years if the maturities of such investments are made to coincide as nearly as practicable with the expected use of funds. The pension plans may invest in longer-term debt instruments.
Credit Risk. The City’s policy requires limiting investments to the safest types of securities and diversifying the investment portfolio so that potential losses on individual securities will be minimized. As previously noted the City’s investment in the SBA Florida PRIME investment pool and the Federated Prime MMF is rated AAAm by Standard’s and Poor as of September 30, 2014; the municipal and corporate bonds’ Standard and Poor’s’ credit ratings range from A- to AAA except for two BBB+ ratings as of September 30, 2014.
Concentration of Credit Risk. Concentration of credit risk is the risk of loss attributable to the quantity of the government’s investment in a single issuer. The City’s investment policy allows for investing in a variety of securities based on the issuer. The allowable concentration in corporate bonds is up to ten (10%) percent in the operating and reserve investment portfolios and up to fifteen (15%) percent in the surplus and restricted investment portfolios. In addition, no more than two (2%) percent of the portfolio may be invested with any one corporate bond issuer. The City’s corporate bond investments meet the single issuer threshold for reportable concentration of credit risk.
% Invested Average Maximum Minimum Averagein Corporate Credit Average % in Corp. Credit Maximum
PORTFOLIO Bonds Rating Maturity Bonds Rating MaturityPooled Investments
Operating Portfolio 9.7% AA 0.4 Short term A High LiquiditySurplus Portfolio 11.0% AA 2.6 15.0% A 3.0
Non-Pooled InvestmentsReserves Portfolio 9.9% A+ 0.7 10.0% A 1.0
Prepared by City's investment adviser, Integrity Fixed Income Management, LLC
Portfolio Characteristics at 9/30/2014 Investment Policy
77

CITY OF SANIBEL, FLORIDA NOTES TO THE FINANCIAL STATEMENTS
September 30, 2014 ____________________________________________________________________________________
Note 3. Deposits and Investments (Continued)
B. Investments (Continued) Custodial Credit Risk. The City’s investment policy requires securities be held with a third party custodian and all securities purchased by, and all collateral obtained by the City should be properly designated as an asset of the City. The securities must be held in an account separate and apart from the assets of the financial institution. A third party custodian is defined as any bank depository chartered by the federal government, the State of Florida, or any other state or territory of the United States which has a branch or principal place of business in the State of Florida, or by a national association organized and existing under the laws of the United States which is authorized to accept and execute trusts and which is doing business in the State of Florida. As of September 30, 2014, the City’s investment portfolios were held with third-party custodians as required by the City’s investment policy.
The City does not have a formal policy relating to foreign currency risk. C. Pension Trust Funds’ Deposits and Investments The City has two defined benefit single-employer pension plans: the General Employees' (General) and the Municipal Police Officers' (Police), collectively, the Pension Funds.
Cash and Cash Equivalents At September 30, 2014, the carrying amount of the Pension Funds’ cash and cash equivalents was $772,336. Cash consists of $6,844 deposited in the City’s pool cash account which is maintained in a qualified public depository in accordance with Chapter 280 of the Florida Statutes. Cash equivalents consist of $444,552 placed with Federated Prime Value Obligations Fund, rated Triple A by all three ratings agencies; $140,422 placed with Goldman Sachs Financial Square Treasury Obligations Fund, an AAAm rated money market fund by Standard & Poor’s and an Aaa-mf rating by Moody’s, $173,165 placed with Fidelity Institutional Prime Class I Fund rated AAAm by Standard & Poor’s and Aaa-mf by Moody’s, and $7,353 placed with SEI Government Principal, which invests exclusively in U.S. Treasury obligations, obligations issued to guaranteed by agencies or instrumentalities of the U.S. Government and repurchase agreements fully-collateralized by such obligations.
Investment Portfolio Each Board of Trustees of the City’s Pension Funds adopted a comprehensive investment policy, pursuant to Florida Statutes Section 112.661, that established permitted investments, asset allocation limits, issuer limits, credit rating requirements, and maturity limits to protect the Pension Funds’ cash and investment assets. As of September 30, 2014, the City’s Pension Funds had the following investment types:
General Employees' Pension InvestmentsPercent of Less Than 1-5 Over
Investment Type Portfolio Fair Value Equities 1 Year Years 5 YearsCash Equivalents: Money Market Funds 2.42% 584,974$ -$ 584,974$ -$ -$ Investments: Domestic Equities 40.24% 9,722,238 9,722,238 - - - International Equities 15.13% 3,655,989 3,655,989 - - - Convertibles 8.65% 2,090,118 2,090,118 - - - Master Limited Partnerships 5.73% 1,385,665 1,385,665 - - - TIPS* 2.06% 497,333 - - 232,104 265,229 Government Obligations 3.32% 802,655 - 72,317 681,627 48,711 Mortgage/Asset Backed Sec 1.91% 461,519 - - - 461,519 Collateralized Mtge Oblig 2.28% 551,401 - - 100,198 451,203 Corporate Bonds 14.36% 3,468,745 - 866,376 2,570,006 32,363 Real Estate 3.90% 942,627 - - - 942,627
24,163,264$ 16,854,010$ 1,523,667$ 3,583,935$ 2,201,652$ *TIPS - Treasury Inflation Protection Securities
Maturities
78

CITY OF SANIBEL, FLORIDA NOTES TO THE FINANCIAL STATEMENTS
September 30, 2014 ____________________________________________________________________________________
Note 3. Deposits and Investments (Continued)
C. Pension Trust Funds’ Deposits and Investments (Continued)
Credit Risk The Pension Funds’ investment policy permits the following investments, which are limited as described below.
Equity Securities General: Domestic equity investments (common stocks, Master Limited Partnerships, convertible bonds, convertible preferred issues, and preferred stock) issued by a corporation organized under the laws of the United States or the District of Columbia provided the corporation is listed on one or more of the recognized national exchanges or OTC. Convertible bonds, convertible preferred issues, and preferred stock will be deemed as equity and shall not be held to the same rating standards as fixed-income. Foreign securities convertibles are limited to those that settle in U.S. dollars and trade on one or more of the national exchanges. Domestic equity managers may only invest in foreign securities designated as American Depository Receipts (ADR).
Police: Equity investments include publicly traded REITS, common stock, Master Limited Partnerships, convertible bonds, convertible preferred issues, and preferred stock in a corporation listed on one or more of the recognized national exchanges or on the National Market System of the NASDAQ stock market or the OTC. Convertible securities will be deemed as equity and shall not be held to the rating standards of fixed-income. Foreign convertibles are limited to those that settle in U.S. dollars and traded on one or more of the recognized national exchanges or on the National Market System of the NASDAQ stock market or the OTC.
Fixed Income Securities General: The credit quality of fixed income securities shall hold a rating of Baa2/Mid BBB or above by Moody’s and Standard & Poor’s respectively. In the event of a split rating, the lower rating shall prevail. In the event of a downgrade, the active fixed income manager may hold up to 5% at market value of their total portfolio in bonds rated below Baa2/Mid BBB. The active fixed income manager must notify the pension fund’s consultant in writing within ten (10) business days of any such downgrade. Permitted fixed income securities rated below A3/A- shall be limited to 20% of the total bond portfolio.
Municipal Police Officers' Pension InvestmentsPercent of Less Than 6-12 Over
Investment Type Portfolio Fair Value Equities 6 Months Months 1 YearCash Equivalents: Money Market Funds 1.14% 180,518$ -$ 180,518$ -$ -$ Investments: Large Cap Growth Equities 10.84% 1,711,499 1,711,499 - - - Large Cap Value Equities 10.09% 1,594,473 1,594,473 - - - Mid-cap Equities 7.96% 1,258,032 1,258,032 - - - Small-cap Equities 6.31% 996,565 996,565 - - - Convertibles 9.84% 1,554,355 1,554,355 - - - Master Limited Partnerships 7.99% 1,261,332 1,261,332 - - - International Equities 14.91% 2,355,221 2,355,221 - - - Fixed Income (bonds) 26.25% 4,144,991 - 4,144,991 - - REIT* 4.67% 738,402 738,402 - - -
15,795,388$ 11,469,879$ 4,325,509$ -$ -$ *REIT - Real Estate Investment Trust
Maturities
79
CITY OF SANIBEL, FLORIDA NOTES TO THE FINANCIAL STATEMENTS
September 30, 2014 ____________________________________________________________________________________
Note 3. Deposits and Investments (Continued)
C. Pension Trust Funds’ Deposits and Investments (Continued) The General Employees' Pension Trust corporate bond holdings of $3,468,745 were rated AAA to BAA by Barclay with an average quality rating of AA-.
Police: Bonds or other evidences of indebtedness issued or guaranteed by a corporation organized under the laws of the United States or the District of Columbia.
Custodial Credit Risk The Pension Funds’ investment policy pursuant to Section 112.661(10), Florida Statutes, states that securities should be held with a third party custodian and all securities purchased by, and all collateral obtained by the Pension Funds should be properly designated as an asset of the Pension Fund.
As of September 30, 2014, the General Employees' Pension Trust Fund equity investments were held with a third-party custodian as required by Florida Statutes. Its investments in the external investment pools and in mutual funds are not exposed to custodial credit risks because their existence is not evidenced by securities that exist in physical or book entry form.
As of September 30, 2014, the Municipal Police Officers' Pension Trust Fund equity investments were held with a third-party custodian as required by Florida Statutes. Its investments in mutual funds are not exposed to custodial credit risk because their existence is not evidenced by securities that exist in physical or book entry form. Its investments in equity and equity index funds, equity mutual funds and fixed income funds securities are uninsured, are not registered in the name of the government, and are held by the counterparty.
Concentration of Credit Risk The Pension Funds’ investment policy has established asset allocation and issuer limits on the following investments, which are designed to reduce concentration of credit risk of the Pension Funds’ investment portfolio.
Equity Securities General: A target of 38% at fair value of its fund's total asset value may be invested in domestic equity securities, a target of 10% at fair value of its fund’s total asset may be vested in convertibles, a target of 5% at fair value of its fund’s total asset may be vested in master limited partnerships and a target of 15% at fair value of its fund's total asset value may be invested in international equity securities. Investments in equities shall not exceed 70% of the Fund’s assets at market value. Not more than 5% of the Fund assets, based on market value, shall be vested in the securities of any one issuing company. The aggregate investment in any one issuing company shall not exceed 5% of the outstanding capital stock of the company.
Police: A maximum of 70% of the fund's total asset value may be invested in equity securities (including convertible bonds). A target of 10% of the fund’s total asset value may be vested in convertibles and a target of 5% of the fund’s total asset value may be vested in Master Limited Partnerships. Not more than 5% of the fund’s total asset cost value may be invested in a single corporate issuer nor shall the aggregate investment in any one corporate issuer exceed 5% of the outstanding capital stock of the company. Foreign equity securities are limited to 25% of total assets value.
Fixed Income Securities General: A target of 23% at fair value of the fund's total asset value may be invested in domestic fixed income securities. Non-government bond investments in any one issuing company shall be limited to 2.0% of the total bond portfolio. Foreign issued fixed-income securities may not exceed 10% of the market value of the total fund portfolio.
80

CITY OF SANIBEL, FLORIDA NOTES TO THE FINANCIAL STATEMENTS
September 30, 2014 ____________________________________________________________________________________
Note 3. Deposits and Investments (Continued)
C. Pension Trust Funds’ Deposits and Investments (Continued) Police: A target of 30% at fair value of the fund’s total asset value may be invested in fixed income securities. A maximum of 5% at cost of the fund's total asset value may be invested in the securities of any single fixed income issuer (excludes issues of the United States Government or any governmental agency).
Investment Policy: The following was the respective Board’s adopted asset allocation policy as of September 30, 2014:
General Police
Asset Class Target
Allocation Target
Allocation Domestic Equity 38% 35% International Equity 15% 15% Bonds 23% 30% TIPS 02% N/A Convertibles 10% 10% Private Real Estate/REIT 05% 05% MLPs 05% 05% Cash 02% 00% Total 100% 100%
Concentrations The General Employee and Police Officer’s Plans did not hold investments in any one organization that represent 5 percent or more of the individuals pension plan’s fiduciary net position.
Rate of Return The money-weighted rate of return expresses investment performance, net of investment expense, adjusted for the changing amounts actually invested.
General: For the year ended September 30, 2014 the annual money-weighted rate of return on Pension Plan investments, net of pension plan investment expense, was 11.00 percent.
Police: For the year ended September 30, 2014 the annual money-weighted rate of return on Pension Plan investments, net of pension plan investment expense, was 10.91 percent.
81

CITY OF SANIBEL, FLORIDA NOTES TO THE FINANCIAL STATEMENTS
September 30, 2014 ____________________________________________________________________________________
Note 3. Deposits and Investments (Continued)
D. Additional Information As of September 30, 2014 the City had the following deposits and investments:
The following schedule reconciles the deposit and investment information to the government-wide Statement of Net Position and Statement of Fiduciary Net Position:
Type Fair ValueUS Govt Agency Securities 5,689$ Pension Investments 39,193,160 City Investments-Reserves Account 6,354,682
Total Investments 45,553,531 PLUS: Cash Equivalents
Checking Accounts 7,538,465 SBA Florida PRIME 455,959 City Pool Investment-Operating Account 4,694,569 City Pool Investment-Surplus Account 5,336,644 City Money Market Funds 108,048 Pension Money Market Funds 765,492
Total Cash Equivalents 18,899,177
TOTAL Cash Equivalents and Investments 64,452,708
PLUS: Cash on Hand 1,085
TOTAL: Cash & Cash Equivalents and Investments 64,453,793$
CASH AND CASH EQUIVALENTS AND INVESTMENTS
TotalCash &
Equivalents InvestmentsCash &
Equivalents InvestmentsCash &
Investments
GOVERNMENTAL ACTIVITIESGeneral 4,202,332$ 6,356,595$ -$ -$ 10,558,927$ Transportation 958,757 - - - 958,757 Recreation 537,350 - - - 537,350
Other Govt'l Funds 3,906,762 - 294,472 - 4,201,234
Total Governmental 9,605,201 6,356,595 294,472 - 16,256,268
BUSINESS-TYPE ACTIVITIESSewer System 5,995,783 3,776 1,057,550 - 7,057,109
Beach Parking 1,159,171 - - - 1,159,171
Total Business-type 7,154,954 3,776 1,057,550 - 8,216,280
FIDUCIARY FUNDSPension Trust Fund - - 772,336 39,193,160 39,965,496 Agency Funds - - 15,749 - 15,749
Total Fiduciary - - 788,085 39,193,160 39,981,245
TOTAL 16,760,155$ 6,360,371$ 2,140,107$ 39,193,160$ 64,453,793$
Unrestricted Restricted
82

CITY OF SANIBEL, FLORIDA NOTES TO THE FINANCIAL STATEMENTS
September 30, 2014 ____________________________________________________________________________________
Note 3. Deposits and Investments (Continued)
E. Restricted Cash and Investments Restricted cash and investments represent resources to be restricted for debt service, debt reserves and construction commitment as follows:
Note 4. Accounts Receivable
Accounts receivable reported in the general fund represent miscellaneous receivables for insurance, public works services, restitution, code enforcement violations, false alarm fees and special event services provided by the City. Accounts receivable in the transportation fund is for services provided. Accounts receivable in the recreation fund is for after school programs. Accounts receivable in the other governmental funds is for services provided and other miscellaneous receivables. The general fund accounts receivables are net of an $8,184 allowance for uncollectible accounts. No allowance for uncollectible accounts was considered necessary in the other governmental funds. Receivables, net of allowance for uncollectibles, as of year-end for the City’s governmental activities, individual major governmental fund and nonmajor funds in the aggregate are as follows:
$1,397,558 of the due from other funds receivable in the general fund was eliminated in the conversion from the governmental funds balance sheet to the government-wide statement of net position ($1,375,000 due from the Sewer fund and $22,558 due from the Ballpark Maintenance fund). Additionally, in the government-wide statement of net position, $90 of receivables is reported as restricted assets for debt service Fiduciary funds are not included in the government-wide statements.
Cash & Equivalents Investments
Cash & Equivalents Investments
Debt service 294,472$ -$ 804,120$ -$ Debt reserves - - 176,592 - Construction - - 76,838 -
294,472$ -$ 1,057,550$ -$
Business-TypeRestricted Restricted
Governmental
OtherGeneral Transportation Recreation Governmental
Fund Fund Fund Funds Total
Accounts receivable 81,438$ 1,859$ 3,599$ 2,576$ 89,472$ Interest receivable 123,713 - - - 123,713 Due from other funds 1,397,558 - - - 1,397,558 Due from other governments 93,666 539,752 6,077 45,336 684,831
Total receivables 1,696,375$ 541,611$ 9,676$ 47,912$ 2,295,574$
83

CITY OF SANIBEL, FLORIDA NOTES TO THE FINANCIAL STATEMENTS
September 30, 2014 ____________________________________________________________________________________
Note 4. Accounts Receivable (Continued)
Accounts receivable reported in the enterprise funds represent fees for sewer services provided by the City (billed and unbilled). The accounts receivable are net of a $13,180 allowance for uncollectible accounts. Receivables, net of allowance for uncollectibles, as of year-end for the City’s business-type activities are as follows:
Special assessments were approved by the City Council to cover the cost of expanding the sewer system to service the entire City. The special assessment receivables are to be collected over a twenty-year period. Interest earnings are based on various rates depending on when each phase was assessed. The special assessment receivable is restricted for debt service. In accordance with full accrual accounting, the special assessments were recognized as revenue when assessed. The interest is recognized when earned.
Note 5. Unearned Revenues Governmental funds and business-type funds delay revenue recognition in connection with resources that have been received, but not yet earned. As of September 30, 2014, the business-type funds did not have any unearned revenues. The various components of unearned revenue reported in the governmental funds were as follows:
Sanibel BeachSewer System Parking Fund Total
UnrestrictedAccounts receivable 294,286$ 589$ 294,875$ Due from other governments 724 575,626 576,350
Total unrestricted 295,010 576,215 871,225
RestrictedAssessments receivable 6,120,513 - 6,120,513
Total net receivables 6,415,523$ 576,215$ 6,991,738$
Governmental Funds: Unavailable UnearnedUnearned revenues:
Prepaid weight permits - 2,606 Prepaid business tax receipts - 243,475 Recreation center gift cards - 209 Donations for FY2014 after school financial assistance program - 18,525 Total unearned revenue for governmental funds 264,815$
Unearned Revenue
84

CITY OF SANIBEL, FLORIDA NOTES TO THE FINANCIAL STATEMENTS
September 30, 2014 ____________________________________________________________________________________
Note 6. Accounts Payable and Other Accrued Liabilities
At September 30, 2014, the City reported accounts payable and accrued liabilities as follows:
The due to other funds of $1,375,000 in the enterprise fund line and the $22,558 included in the governmental funds were eliminated in the conversion from the statement of net position to the government-wide statement of net position. An accrued interest payable of $57,543 included in the governmental activities column of the government wide statement of net position will not be liquidated with current financial resources and is not included in the governmental funds balance sheet.
Note 7. Interfund Receivables, Payables and Transfers The following schedule as of September 30, 2014, represents interfund receivables and payables in the fund financial statements:
OtherGeneral Transportation Recreation Governmental
Fund Fund Fund Funds Total
GOVERNMENTAL FUNDSAccounts and retainages payable 295,371$ 352,824$ 44,000$ 95,232$ 787,427$ Deposits 6,053 - - - 6,053 Accrued liabilities 275,177 24,093 46,974 17,793 364,037 Due to other funds - - - 22,558 22,558
Total 576,601$ 376,917$ 90,974$ 135,583$ 1,180,075$
Sanibel Beach Sewer System Parking Fund Total
ENTERPRISE FUNDSAccounts and retainages payable 167,659$ 66,171$ 233,830$ Accrued liabilities 46,134 41,034 87,168 Accrued interest payable 153,860 - 153,860 Due to other funds 1,375,000 - 1,375,000
Total 1,742,653$ 107,205$ 1,849,858$
Receivable PayableFund Fund Purpose for Balance Amount
General Sanibel SewerSystem
1,375,000$
General Ball Park Maintenance22,558
TOTAL 1,397,558$ Entire balance expected to be collected in FY15.Short term loan to ball park maintenance fund.
City's advance to the sewer system primarilyrelated to effluent disposal/reuse as initiallyrequired by regulatory agencies. $1,100,000 isnot anticipated to be collected within the nextfiscal year. $275,000 repaid annually.
85

CITY OF SANIBEL, FLORIDA NOTES TO THE FINANCIAL STATEMENTS
September 30, 2014 ____________________________________________________________________________________
Note 7. Interfund Receivables, Payables and Transfers (Continued)
Transfers are indicative of funding for capital projects or debt service and subsidies of various City operations. The following schedules briefly describe the City’s transfer activity:
Interfund Transfers: Transfers InTotal
Other GovermentalTransfers Out General Transportation Recreation Governmental FundsGeneral Fund -$ -$ 1,364,761$ 760,965$ 2,125,726$ Recreation Fund - - - 13,081 13,081 Other Governmental Funds 85,815 400,000 - - 485,815
Beach Parking Fund - 8,025 - - 8,025 Total 85,815$ 408,025$ 1,364,761$ 774,046$ 2,632,647$
Interfund Transfers: Transfers InTotal
Enterprise TotalTransfers Out Beach Parking Funds TransfersGeneral Fund 135,000$ 135,000$
Total 135,000$ 135,000$ 2,767,647$
Source Transfer to Amount Purpose
General Fund Special Revenue Fund 50,445$ City expense for Shell Harbor dredging
General Fund Special Revenue Fund 3,000 City match for Sanibel Isles canal trimming
General Fund Special Revenue Fund 5,000 City match for Sanibel Isles/Water Shadows
dredging
General Fund Recreation Fund 1,364,761 Budgeted for recreation center program
General Fund Special Revenue Fund 165,159 Budgeted for ballpark maintenance
General Fund Capital Projects Fund 528,269 Budgeted for capital acquisition fund
General Fund Capital Projects Fund 9,092 Budgeted for transportation capital improvements
General Fund Beach Parking Fund 135,000 Budgeted to support water quality efforts
Recreation Fund Capital Projects Fund 13,081 Repairs for recreation complex
Capital Acquisition Fund General Fund 70,000 Public facility improvements and maintenance
Transportation Capital Fund Transportation Fund 400,000 Repair and maintenance for street program
Periwinkle Way Capital Fund General Fund 15,815 Return of unspent funds from project completion
Beach Parking Fund Transportation Fund 8,025 Traffic count study
TOTAL 2,767,647$
86
CITY OF SANIBEL, FLORIDA NOTES TO THE FINANCIAL STATEMENTS
September 30, 2014 ____________________________________________________________________________________
Note 8. Intergovernmental and Contribution Revenues
The following schedule as of September 30, 2014, represents intergovernmental and contribution revenues in the government-wide statement of activities:
The intergovernmental revenues of $1,222,056 reported in the Other Governmental Funds column of the Statement of Revenues, Expenditures and Changes in Fund Balance was increased by $134,658 for impact fees received from other governmental agencies, which are reported as other revenues in the governmental fund financial statements and reduced by $28,150 in revenue recognized in the Statement of Activities in the prior year and recognized in the current year in the fund financial statements due to availability timing.
OtherGeneral Transportation Recreation Governmental
Governmental activities Fund Fund Fund Funds TotalOperating Grants & Contributions
Public safety 40,000$ -$ -$ -$ 40,000$ Physical environment 75,238 - - 5,000 80,238 Transportation - 460,405 - 956,291 1,416,696 Culture/Recreation - - 30,797 167,604 198,401
Capital Grants & Contributions General Government - - - 72,900 72,900 Public safety - - - 2,799 2,799 Transportation - - - 115,877 115,877 Culture/Recreation - - - 8,093 8,093
General Revenues 657,804 - - - 657,804 Total 773,042$ 460,405$ 30,797$ 1,328,564$ 2,592,808$
Sanibel Sewer System
Beach Parking Fund Total
Business-type activitiesOperating Grants & Shared Revenues
Transportation -$ 1,083,325$ 1,083,325$ Capital Grants & Contributions
Physical Environment 130,751 - 130,751 Transportation - 44,079 44,079
Total 130,751$ 1,127,404$ 1,258,155$
87

CITY OF SANIBEL, FLORIDA NOTES TO THE FINANCIAL STATEMENTS
September 30, 2014 ____________________________________________________________________________________
Note 9. Capital Assets
Capital asset activity for the year ended September 30, 2014 was as follows:
Governmental activities Beginning Balances Increases Decreases
Ending Balances
Capital assets, not being depreciated:Land $24,964,425 $ - $ - $24,964,425 Construction in progress 258,677 - (258,677) -
Total capital assets, not being depreciated 25,223,102 - (258,677) 24,964,425
Capital assets, being depreciated:Buildings 19,129,160 - - 19,129,160 Improvements other than buildings 4,777,036 232,990 - 5,010,026 Infrastructure 13,732,899 680,795 - 14,413,694 Vehicles and equipment 4,710,289 137,711 (50,887) 4,797,113
Total capital assets, being depreciated 42,349,384 1,051,496 (50,887) 43,349,993
Less accumulated depreciation for:Buildings (5,648,292) (618,872) - (6,267,164)Improvements other than buildings (3,828,332) (126,926) - (3,955,258)Infrastructure (6,663,329) (502,501) - (7,165,830)Vehicles and equipment (3,503,394) (293,572) 44,868 (3,752,098)
Total accumulated depreciation (19,643,347) (1,541,871) 44,868 (21,140,350)
Total capital assets, being depreciated, net 22,706,037 (490,375) (6,019) 22,209,643
Governmental activities capital assets, net $47,929,139 $ (490,375) $ (264,696) $47,174,068
Business-type activities Beginning Balances Increases Decreases
Ending Balances
Capital assets, not being depreciated:Land $ 1,860,674 $ - $ - $ 1,860,674 Construction in progress 377,720 106,699 (335,131) 149,288
Total capital assets, not being depreciated 2,238,394 106,699 (335,131) 2,009,962
Capital assets, being depreciated:Buildings 2,186,963 342,813 - 2,529,776 Improvements other than buildings 1,510,605 13,793 - 1,524,398 Infrastructure 68,927,015 235,430 - 69,162,445 Vehicles and equipment 3,173,001 57,438 (31,970) 3,198,469
Total capital assets, being depreciated 75,797,584 649,474 (31,970) 76,415,088
Less accumulated depreciation for:Buildings (1,054,050) (110,644) - (1,164,694)Improvements other than buildings (707,137) (59,022) - (766,159)Infrastructure (26,062,366) (2,306,151) - (28,368,517)Vehicles and equipment (2,081,082) (197,884) 18,444 (2,260,522)
Total accumulated depreciation (29,904,635) (2,673,701) 18,444 (32,559,892)
Total capital assets, being depreciated, net 45,892,949 (2,024,227) (13,526) 43,855,196
Business-type activities capital assets, net $48,131,343 $ (1,917,528) $ (348,657) $45,865,158
88

CITY OF SANIBEL, FLORIDA NOTES TO THE FINANCIAL STATEMENTS
September 30, 2014 ____________________________________________________________________________________
Note 9. Capital Assets (Continued)
Depreciation expense was charged to functions/programs of the primary government as follows:
Note 10. Operating Leases In the governmental funds rental expenditures under operating leases for the year ended September 30, 2014 amounted to $27,593. The future minimum lease payments for the governmental funds under non-cancellable long-term operating leases as of September 30 are as follows:
Governmental activities:General government 68,780$ Public safety 107,044 Physical environment 58,084 Transportation 572,331 Culture/recreation 735,632
Total governmental activities 1,541,871$
Business-type activities:Sanibel Sewer System 2,479,349$ Beach Parking 194,352
Total business-type activities 2,673,701$
Fiscal Year Amount
2015 24,781$
2016 7,253
2017 2,559 2018 326
2019 -
TOTAL 34,919$
89

CITY OF SANIBEL, FLORIDA NOTES TO THE FINANCIAL STATEMENTS
September 30, 2014 ____________________________________________________________________________________
Note 11. Long-term Debt
Governmental activities long-term debt at September 30, 2014, is comprised of the following:
General Obligation Bonds$2,970,000 General Obligation Refunding Bonds, Series 2012, issued toretire General Obligation Bonds, Series 2002 that were issued topurchase environmentally sensitive land. The 2012 GO Bonds have fixedinterest rate of 2.07% due semiannually on August 1 and February 1,principal payments are due annually on August 1, collateralized with VotedDebt Service Ad Valorem Taxes, final payment is due August 2022. 2,420,000$
$8,350,000 General Obligation Bonds, Series 2006, issued to construct arecreation facility, have interest payable varying from 4.0% to 4.35% duesemiannually on August 1 and February 1, principal payments are dueannually on August 1, collateralized with Voted Debt Service Ad ValoremTaxes, final payment is due February 2036. 6,945,000
9,365,000
Net pension liability 8,340,319
Compensated absences 491,980
Other postemployment benefits obligation 171,864 Total Governmental Activities 18,369,163$
90

CITY OF SANIBEL, FLORIDA NOTES TO THE FINANCIAL STATEMENTS
September 30, 2014 ____________________________________________________________________________________
Note 11. Long-term Debt (Continued)
Business-type activities long-term debt at September 30, 2014, is comprised of the following:
Revenue Bonds Payable$9,493,598 Sanibel Sewer System Refunding Revenue Bonds, Series2014, issued to realize debt service savings from the 2003 Refundingbonds and the State of Florida revolving loan for the Phase 2 expansionnotes payable, collateralized by the net revenues of the sewer system, witha fixed interest rate of 1.43% payable semi-annually, and principalpayments payable annually from 2014 through 2021.
8,888,260$ Notes Payable
Disbursements, service fees and capitalized interest for a $5,424,184State of Florida revolving loan #835090, issued to finance Phase 2Bcollection system expansion, collateralized by voted debt service advalorem taxes, special assessments and net revenues of the sewersystem, accrued interest payable at 3.08%; due December, 2022. 2,499,908
Disbursements, service fees and capitalized interest for a $8,501,591State of Florida revolving loans #WWG83510, issued to finance Phase 2Ccollection system expansion, collateralized by voted debt service advalorem taxes, special assessments and net revenues of the sewersystem, accrued interest payable at 3.11%; due June, 2023. 4,198,196
Disbursements, service fees and capitalized interest for a $6,274,127State of Florida revolving loans # WW83511, issued to finance Phase 3Acollection system expansion, collateralized by voted debt service advalorem taxes, special assessments and net revenues of the sewersystem, accrued interest payable at 2.67%, due August, 2023. 3,124,927
Disbursements, service fees and capitalized interest for a $5,353,820State of Florida revolving loan # WW83512S, issued to finance Phase 3Bcollection system expansion, collateralized by voted debt service advalorem taxes, special assessments and net revenues of the sewersystem, accrued interest payable at 3.40% due June 2026. 4,822,050
14,645,081
Net pension liability 1,303,508
Compensated absences payable 74,630
Other postemployment benefits obligation 54,719
Total Business-Type Activities 24,966,198$
91

CITY OF SANIBEL, FLORIDA NOTES TO THE FINANCIAL STATEMENTS
September 30, 2014 ____________________________________________________________________________________
Note 11. Long-term Debt (Continued)
Changes in long-term debt and other long-term obligations for the year ended September 30, 2014, are as follows:
Annual debt service requirements for governmental and business-type activities by debt classification are detailed in the following tables.
Beginning Ending Due WithinGovernmental Activities Balance Additions Reductions Balance One YearGeneral Obligation bonds 9,845,000$ -$ (480,000)$ 9,365,000$ 490,000$ Net pension liability 10,620,685 227,253 (2,507,619) 8,340,319 - Compensated absences 522,071 314,558 (344,649) 491,980 368,983 Other postemployment benefits 164,940 6,924 - 171,864 -
Governmental activities totals 21,152,696$ 548,735$ (3,332,268)$ 18,369,163$ 858,983$
Business-type ActivitiesRevenue Bonds 2,850,000$ 9,493,598$ (3,455,338)$ 8,888,260$ 1,216,123$
Less:Issuance discounts * (9,815) - 9,815 - - Loss on refunding * (152,362) - 152,362 - -
Net revenue bonds payable 2,687,823 9,493,598 (3,293,161) 8,888,260 1,216,123 Notes payable 23,882,161 - (9,237,080) 14,645,081 1,300,098 Net pension liability 1,789,817 20,219 (506,528) 1,303,508 - Compensated absences 71,737 74,057 (71,164) 74,630 55,972 Other postemployment benefits 51,943 2,776 - 54,719 -
Business-type Activities Totals 28,483,481$ 9,590,650$ (13,107,933)$ 24,966,198$ 2,572,193$
* Issuance discounts and losses on refunding are now reported as Deferred Outlows of Resources and presented as a separate line item on the Statement of Net Position.
Year endingSeptember 30, Principal Interest
2015 490,000$ 345,106$
2016 505,000 330,386
2017 520,000 315,136 2018 540,000 299,358
2019 555,000 283,548 2020-2024 2,370,000 1,165,856
2025-2029 1,740,000 805,630 2030-2034 2,160,000 395,414
2035-2036 485,000 26,427
Total 9,365,000$ 3,966,861$
General Obligation BondsGovernmental Activities
Year endingSeptember 30, Principal Interest Principal Interest Principal Interest
2015 1,216,123 122,770 1,300,098 403,247 2,516,221 526,017
2016 1,233,576 105,317 1,340,280 402,652 2,573,856 507,969
2017 1,251,279 87,614 1,381,714 361,217 2,632,993 448,831
2018 1,269,236 69,657 1,424,438 318,495 2,693,674 388,152
2019 1,287,451 51,442 1,468,490 274,441 2,755,941 325,883
2020-2024 2,630,595 47,189 6,785,098 682,541 9,415,693 729,730
2025-2026 - - 944,963 40,500 944,963 40,500
Total 8,888,260$ 483,989$ 14,645,081$ 2,483,093$ 23,533,341$ 2,967,082$
TotalRevenue Bonds Notes Payable
Business-type Activities
92

CITY OF SANIBEL, FLORIDA NOTES TO THE FINANCIAL STATEMENTS
September 30, 2014 ____________________________________________________________________________________
Note 11. Long-term Debt (Continued)
Current Refunding In February 2014, the City issued $9,493,598 in Series 2014 revenue bonds with a fixed interest rate of 1.43%. The proceeds were used to currently refund the outstanding principal amount of the City’s Sewer Utility Revenue Refunding Bonds, Series 2003 (carrying an interest rate of 2.0% to 3.9%) and to refinance debt owed to the Florida Department of Environmental Protection pursuant to State Revolving Fund Loan agreement number 835080 (carrying an interest rate of 3.5%). The maturity date of the issued debt was accelerated from 2022 to 2021. The retirement of the refunded bonds resulted in an accounting loss of $162,177 due to unamortized bond-related accounts for the Sewer Utility Revenue Refunding Bonds, Series 2003. The loss is deferred for financial reporting, and recognized over the term of the Sewer System Refunding Revenue Bonds, Series 2014. Unamortized bond insurance cost of $18,533 on the Series 2003 refunded bonds was expensed in the current period. As a result of the issuance, the City reduced its annual enterprise fund debt service by $116,471 between fiscal year 2015 and fiscal year 2021 and by approximately $1.04 million for fiscal year 2022 (possible by applying $754,096 in restricted reserves made available by the refunding noted above). The City issued the bonds to obtain an economic gain (difference between the present values of the debt service payments on the old and new debt) of $958,244, an 8.85% savings. Issuance costs of approximately $55,000 were paid from accumulated debt service funds. Liquidation Bond Resolution - Resolutions for various debt obligations establish certain funds and accounts and determine the order in which certain revenue is to be deposited into the funds and accounts. The City has also covenanted to budget and appropriate sufficient non-ad valorem revenue sources to pay the various debt obligations when due. All required balances at year-end were maintained.
Net Pension Liability – In the governmental funds, the liability for the net pension liability is typically liquidated from the general fund. In the proprietary funds, the liability for the net pension liability is typically liquidated from the Sanibel Sewer System fund and Beach Parking fund.
Compensated Absences – In the governmental funds, the liability for compensated absences is typically liquidated from the general fund. In the proprietary funds, the liability for compensated absences is typically liquidated from the Sanibel Sewer System fund and Beach Parking fund.
Other Post-Employment Benefits – In the governmental funds, the OPEB liability is typically liquidated from the general fund. In the proprietary funds, the liability for the other post-employment benefits is typically liquidated from the Sanibel Sewer System fund and Beach Parking fund.
Note 12. Risk Management The City is exposed to various risks of loss related to torts; theft of, damage to, and destruction of assets; errors and omissions; injuries to employees; and natural disasters. The City participates in a public entity risk pool administered by Florida League of Cities, Inc. with insurance programs for general/professional liability, automobile, property and workers compensation. The City pays an annual premium to Florida League of Cities, Inc. for these insurance programs.
93

CITY OF SANIBEL, FLORIDA NOTES TO THE FINANCIAL STATEMENTS
September 30, 2014 ____________________________________________________________________________________
Note 12. Risk Management (Continued)
Participation in this risk pool is non-assessable. There were no significant reductions in insurance coverage as compared to the prior year. Settled claims have not exceeded insurance coverage in any of the past three fiscal years. The City retains the risk of loss up to a deductible amount (normally $50,000) with the risk of loss in excess of this amount transferred to the pool with limits of liability of $5,000,000 per occurrence for general and professional liability and $5,000,000 for automobile liability. The Florida League of Cities, Inc. published financial report for the year ended September 30, 2014, can be obtained from Florida League of Cities, Inc., Public Risk Service, 135 East Colonial Drive, Orlando, Florida 32853-0065.
Note 13. Restricted Assets The balances of the restricted asset accounts in the government-wide Statement of Net Position for governmental activities and business-type activities are as follows:
Note 14. Defined Benefit Pension Plans The City has two (2) defined benefit single-employer pension plans: • General Employees’ Pension Plan • Municipal Police Officers’ Pension Plan
The plans do not issue stand-alone financial reports and are not included in any other retirement system’s or entity’s financial report. The City accounts for both plans as pension trust funds; therefore, they are accounted for in substantially the same manner as proprietary funds, with a capital maintenance measurement focus and employment of the accrual basis of accounting. Plan member contributions, employer contributions and contributions from other entities are recognized in the period in which the contributions are due. Benefits and refunds are recognized when due and payable in accordance with the terms of the plans.
Governmental Business-TypeDebt service 294,562$ 6,924,633$ Debt reserves - 176,592 Construction - 76,838 Totals 294,562$ 7,178,063$
94

CITY OF SANIBEL, FLORIDA NOTES TO THE FINANCIAL STATEMENTS
September 30, 2014 ____________________________________________________________________________________
Note 14. Defined Benefit Pension Plans (Continued)
For financial statement purposes, plan assets are valued at market value for the General Employees’ and Municipal Police Officers’ plans, as reported within the annual trustee statements. Because the plans do not issue stand-alone GAAP financial reports, the following individual financial reports are presented for each of the plans:
Municipal TotalGeneral Police Trust
Employees' Officers' FundsASSETS
Cash and cash equivalents 589,157$ 183,179$ 772,336$
Investments, at market valueTreasury inflation protection securities 497,333 - 497,333 US government and agencies securities 1,264,174 - 1,264,174 Corporate stocks 8,005,387 - 8,005,387 Corporate bonds 4,020,146 - 4,020,146 Convertibles 2,090,118 1,554,355 3,644,473 Master Limited Partnerships 1,385,665 1,261,332 2,646,997 Mutual Funds
Fixed income - 4,144,991 4,144,991 Equity 1,716,851 5,560,569 7,277,420 International equity 3,655,989 2,355,221 6,011,210
Real estate investments trusts - 738,402 738,402 Real estate commingled fund 942,627 - 942,627
Total investments at fair value 23,578,290 15,614,870 39,193,160
Receivables - contributions - 45,438 45,438 Receivables - interest & dividends 66,791 19,183 85,974
Total assets 24,234,238 15,862,670 40,096,908
LIABILITIESAccrued benefits and other liabilities 20,428 6,142 26,570
Total liabilities 20,428 6,142 26,570
NET POSITIONNet position restricted for pensions 24,213,810$ 15,856,528$ 40,070,338$
Pension Trust Funds
STATEMENT OF FIDUCIARY NET POSITION
95

CITY OF SANIBEL, FLORIDA NOTES TO THE FINANCIAL STATEMENTS
September 30, 2014 ____________________________________________________________________________________
Note 14. Defined Benefit Pension Plans (Continued)
In addition to other disclosures, the GASB requires a schedule of changes in the net pension liability and related ratios; a schedule of contributions; and a schedule of investment returns that include historical trend information. These schedules are included as required supplementary information to the financial statements.
Municipal TotalGeneral Police Trust
Employees' Officers' FundsADDITIONS
ContributionsEmployer 1,681,948$ 961,952$ 2,643,900$ State of Florida - 65,862 65,862 Plan members 65,431 114,679 180,110
Total contributions 1,747,379 1,142,493 2,889,872
Investment incomeNet appreciation in fair value of investments 1,874,364 1,092,960 2,967,324 Interest, dividends and other 691,922 530,399 1,222,321
Total investment earnings 2,566,286 1,623,359 4,189,645
Less investment expense (141,895) (58,510) (200,405)
Net investment earnings 2,424,391 1,564,849 3,989,240
Total additions 4,171,770 2,707,342 6,879,112
DEDUCTIONSBenefits paid 1,276,944 694,792 1,971,736 Lump sum DROP disbursement - 49,635 49,635 Refunds of contributions - 7,455 7,455 Administrative expenses 27,489 38,332 65,821
Total deductions 1,304,433 790,214 2,094,647
Change in net position 2,867,337 1,917,128 4,784,465
Net position - beginning of year As previously reported 21,283,849 13,618,254 34,902,103 Adjustment (See Note #20) 62,624 321,146 383,770
Net position - beginning of year as restated 21,346,473 13,939,400 35,285,873
Net position - end of year 24,213,810$ 15,856,528$ 40,070,338$
Pension Trust Funds
STATEMENT OF CHANGES IN FIDUCIARY NET POSITION
96

CITY OF SANIBEL, FLORIDA NOTES TO THE FINANCIAL STATEMENTS
September 30, 2014 ____________________________________________________________________________________
Note 14. Defined Benefit Pension Plans (Continued)
A. General Employees’ Pension Plan The Plan and any amendments thereto were adopted by Ordinance of the City Council of the City of Sanibel. The City, which is responsible for the management of plan assets, has delegated the authority to manage plan assets to the General Employees’ Pension Board of Trustees. All costs of administering the plan are paid from plan assets. Plan Membership as of October 1, 2013:
Inactive Plan Members or Beneficiaries Currently Receiving Benefits 65 Inactive Plan Members Entitled to but Not Yet Receiving Benefits 69 Active Plan Members 25 159
Plan Description On February 7, 2012 the City Council approved Ordinance 12-002 closing the plan to all employees hired on or after February 7, 2012. Prior to February 7, 2012 all full-time employees who were non-sworn police officers, and who had attained age 18 but not attained age 65, were required to participate in the City’s General Employees’ Defined Benefit Pension Plan. On March 1, 2011, the City Council adopted Ordinance No. 11-001 which provided current participants (excluding police dispatchers) a one-time opportunity to make an irrevocable election to opt out of the defined benefit plan and participate in a defined contribution plan. The irrevocable election had to be made by April 30, 2011 with May 1, 2011 effective date. Subsequently, on November 1, 2011, the City Council adopted Ordinance No. 11-011 which provided the police dispatchers the same option. The irrevocable election had to be made by December 31, 2011 with January 1, 2012 effective date. All general employees except police dispatchers who become participants after March 1, 2011 and police dispatchers after November 1, 2011 shall have a one-time, irrevocable option to opt out of the plan and participate in a defined contribution plan. The plan is administered by a Board of Trustees comprised of: two members of the Plan (one with under 15 years of service, one with 15 years of service or more) elected by the Plan members, one Department Director appointed by the City Manager, five Council appointees, and one chosen by the other eight members of the Board and appointed by Council. The General Employees’ Pension Plan is broken down into two sub-plans, Plan A and Plan B. Both defined benefit plans provide retirement and pre-retirement death benefits to plan members and beneficiaries and provide 5-year cliff vesting for participants except police dispatchers with 5 or more years of vesting service on September 30, 2011 and police dispatchers with 5 or more years of vesting service on January 1, 2012. The plan provides 6-year cliff vesting for participants except police dispatchers with less than 5 years of vesting service on September 30, 2011 and police dispatchers with less than 5 years of vesting on January 1, 2012.
97

CITY OF SANIBEL, FLORIDA NOTES TO THE FINANCIAL STATEMENTS
September 30, 2014 ____________________________________________________________________________________
Note 14. Defined Benefit Pension Plans (Continued)
A. General Employees’ Pension Plan (continued) The annual retirement benefit shall be an amount equal to 3 percent of average compensation (as defined for Plan A and Plan B members) multiplied by the number of years of credited service prior to May 1, 2011 for all participants other than police dispatchers and prior to January 1, 2012 for police dispatchers, and 1.68 percent of average compensation (as defined for Plan A and Plan B members) multiplied by the number of years of credited service on and after May 1, 2011 for all participants other than police dispatchers and on and after January 1, 2012 for police dispatchers, with a combined maximum of 30 years of credited service. Average compensation is calculated differently for each Plan. Plan A, which is mandatory for all new hires beginning January 1, 2005 calculates average compensation as the highest five (5) years of compensation. Plan B, which was closed on January 1, 2005 to new participants, average compensation is based on career average. Normal retirement is the attainment of age 65 with 6 years of credited service. For members with 15 years or more of credited service as of September 30, 2011 (December 31, 2011 for police dispatchers), it is the attainment of age 60 with 5 years of credited service. Early retirement is the attainment of age 60 with 6 years of credited service. For members with 15 years or more of credited service as of September 30, 2011 (December 31, 2011 for police dispatchers), it is the attainment of age 55. Accrued benefit on early retirement date is reduced by 5 percent for each year that early retirement date precedes the normal retirement date. Notwithstanding the preceding sentence, the early retirement benefit for an employee with 15 or more years of city service on September 30, 2011 the accrued benefit will be reduced by 2.5 percent for each year that the early retirement date precedes age 60; and the benefit will not be reduced if the employee has attained age 60 at the time of retirement. Termination of Employment Vesting Schedule: Years of Service Vested Less than 6 0% 6 or more 100% Additionally, members with at least 5 years of credited service as of September 30, 2011 (December 31, 2011 for police dispatchers), are 100% vested in their accrued benefit. Vested accrued benefit payable at the normal retirement date (unreduced) or the early retirement date (reduced). Pre-retirement Death Benefits: If a vested participant dies while in the service of the city before he or she has taken early, normal or late retirement, one-half of the actuarially reduced accrued benefit payable for the life of the spouse or beneficiary beginning at the member’s otherwise early retirement date. Cost-of-living adjustments are provided to all normal and early retirees after October 17, 2006.
98

CITY OF SANIBEL, FLORIDA NOTES TO THE FINANCIAL STATEMENTS
September 30, 2014 ____________________________________________________________________________________
Note 14. Defined Benefit Pension Plans (Continued)
A. General Employees’ Pension Plan (Continued) For participants other than police dispatchers who retire or opt-out of the plan after October 17, 2006 and before May 1, 2011 who are 100% vested in the plan on April 30, 2011; and for police dispatchers who retire or opt-out of the plan after October 17, 2006 and before January 1, 2012 who are 100% vested on December 31, 2011 the cost-of-living adjustment is 2.75% per year beginning October 1 after receipt of 36 monthly retirement payments and continue for twenty-five (25) years thereafter or the length of the monthly retirement benefit period, whichever is less. For participants who elect to continue participating in the plan and all participants other than police dispatchers hired on or after May 1, 2011, and police dispatchers hired on or after January 1, 2012, the cost-of-living adjustment is 2.00% per year beginning October 1 after receipt of 60 monthly retirement payments and continue for twenty-five (25) years thereafter or the length of the monthly retirement benefit period, whichever is less. During fiscal year 2007, the Plan was amended to provide a Deferred Retirement Option Plan (DROP) for participants having attained age 60 and having been a plan participant for a minimum of five (5) years. Ordinances 11-001 and 11-011 amends the age to 65 and the participant must be 100% vested with an effective date of May 1, 2011 for all participants other than police dispatchers and January 1, 2012 for police dispatchers. DROP is a program that provides an alternative method for payment of retirement benefits wherein an employee may retire and have their benefits accumulate, at 6% interest, while continuing to work for the City. Participation in the DROP does not change conditions of employment. When the DROP period ends, maximum of 60 months, employment must be terminated. At the time of termination of employment, the employee will receive payment of the accumulated DROP benefits and begin receiving their monthly retirement benefit in the same amount determined at retirement, plus annual cost-of-living increases. The DROP balance as of September 30, 2014 is $86,810. Contributions Active members of Plan A are required to contribute 5% of base wages to the Plan. Active members of Plan B are not required to contribute to the Plan. The City contributes the remaining amount required in order to pay current costs and amortize unfunded past service cost, if any, as provided in Chapter 112, Florida Statutes. Net Pension Liability of the City The City’s net pension liability was measured as of September 30, 2014. The total pension liability used to calculate the net pension liability was determined as of that date. The components of the net pension liability of the City at September 30, 2014 were as follows:
Total pension liability $ 29,344,966 Plan fiduciary net position (24,213,810) City’s net pension liability $ 5,131,156 Plan fiduciary net position as a percentage of the total pension liability
82.51%
99

CITY OF SANIBEL, FLORIDA NOTES TO THE FINANCIAL STATEMENTS
September 30, 2014 ____________________________________________________________________________________
Note 14. Defined Benefit Pension Plans (Continued)
A. General Employees’ Pension Plan (Continued) Actuarial Assumptions: The total pension liability was determined by an actuarial valuation as of October 1, 2013 updated to September 30, 2014 using the following actuarial assumptions applied to all measurement periods.
Inflation 3.00% Salary Increases 4.80% - 7.80% Investment Rate of Return 6.75%
RP2000 Combined Healthy Mortality Table (sex distinct), projected to the valuation date with Schedule AA. The actuarial assumptions used in the October 1, 2013 valuation were based on the results of an actuarial experience study for the period 2002-2006. The long-term expected rate of return on pension plan investments was determined using a building-block method in which best-estimate ranges of expected future real rates of return (expected returns, net of pension plan investment expenses and inflation) are developed for each major asset class. These ranges are combined to produce the long term expected rate of return by weighting the expected future real rates of return by the target asset allocation percentage and by adding expected inflation. Best estimates of arithmetic real rates of return for each major asset class included in the pension plan’s target asset allocation as of September 30, 2014 are summarized in the following table:
Asset Class
Target Allocation
Long Term Expected Real Rate of Return
Domestic Equity 38.00% 7.80% International Equity 15.00% 2.20% Bonds 23.00% 3.70% TIPS 2.00% 2.00% Convertibles 10.00% 5.30% Private Real Estate 5.00% 4.90% MLPs 5.00% 12.70% Cash 2.00% 1.20% Discount Rate: The discount rate used to measure the total pension liability was 6.75 percent. The projection of cash flows used to determine the discount rate assumed that plan member contributions will be made at the current contribution rate and that city contributions will be made at rates equal to the difference between actuarially determined contribution rates and the member rate. Based on those assumptions, the pension plan’s fiduciary net position was projected to be available to make all projected future benefit payments of current plan members. Therefore, the long-term expected rate of return on pension plan investments was applied to all periods of projected benefit payments to determine the total pension liability.
100

CITY OF SANIBEL, FLORIDA NOTES TO THE FINANCIAL STATEMENTS
September 30, 2014 ____________________________________________________________________________________
Note 14. Defined Benefit Pension Plans (Continued)
A. General Employees’ Pension Plan (Continued)
Sensitivity of the net pension liability to changes in the discount rate: The following presents the net pension liability of the City, calculated using the discount rate of 6.75 percent, as well as what the City’s net pension liability would be if it were calculated using a discount rate that is 1-percentage-point lower (5.75 percent) or 1-percentage-point higher (7.75 percent) than the current rate:
Pension Expense and Deferred Inflows/Outflows of Resources Related to Pensions For the year ended September 30, 2014 the City will recognize a pension expense of $404,597. On September 30, 2014 the City reported deferred outflows of resources and deferred inflows of resources related to pensions from the following sources:
Total Pension Plan Fiduciary Net PensionLiability Net Position Liability
Balances at September 30, 2013 28,529,824$ 21,346,473$ 7,183,351$ Changes for the year: Service cost 196,178 - 196,178 Interest 1,895,908 - 1,895,908 Differences between expected and actual experience - - - Contributions - employer - 1,681,948 (1,681,948) Contributions - employee - 65,431 (65,431) Net investment income - 2,424,391 (2,424,391) Benefit payments, including refunds of employee contributions (1,276,944) (1,276,944) - Administrative expense - (27,489) 27,489 Net changes 815,142 2,867,337 (2,052,195) Balances at September 30, 2014 29,344,966$ 24,213,810$ 5,131,156$
Increase (Decrease)
CHANGES IN NET PENSION LIABILITY
1% Current 1%Decrease Discount Rate Increase
5.75% 6.75% 7.75%City's net pension liability 8,559,578$ 5,131,156$ 2,251,718$
Deferred Deferred Outflows of Inflows ofResources Resources
Actual investment earnings different than assumed -$ 774,843$ Differences between actual and expected experience - -
Total -$ 774,843$
101

CITY OF SANIBEL, FLORIDA NOTES TO THE FINANCIAL STATEMENTS
September 30, 2014 ____________________________________________________________________________________
Note 14. Defined Benefit Pension Plans (Continued)
A. General Employees’ Pension Plan (Continued) Amounts reported as deferred inflows of resources related to pensions will be recognized in pension expense as follows:
B. Municipal Police Officers’ Pension Plan This plan and all amendments were adopted by Ordinance of the City Council of the City of Sanibel. This plan is self-trusteed and is administered by the Municipal Police Officers’ Pension Board comprised of members elected pursuant to Section 185, Florida Statutes for local law plans. All costs of administering the plan are paid from plan assets.
Plan Membership as of October 1, 2013:
Inactive Plan Members or Beneficiaries Currently Receiving Benefits 22 Inactive Plan Members Entitled to but Not Yet Receiving Benefits 6 Active Plan Members 21 49
Plan Description All full-time sworn police officers who have attained age 18 are required to participate in the City’s Municipal Police Officers’ Pension Plan. The Plan provides retirement, termination, disability and death benefits to plan members and beneficiaries. The Plan is administered by a Board of Trustees comprised of: two City Council appointees, two members of the Plan elected by a majority of the other covered Police Officers, and a fifth (5th) member elected by the other four and appointed by City Council. There is a 5-year cliff vesting in the Plan. Members terminating with less than five years of credited service receive a refund of their contribution. Members terminating with 5 years or more accrued benefits are payable at early retirement date (reduced) or normal retirement date (unreduced). The Normal Retirement Benefit of the Plan is three percent of average final compensation multiplied by the number of years of service (maximum 30 years). Average compensation is calculated by taking the average of the total compensation paid during the 5 highest years of service. In 2011 the Florida Legislature amended Florida Statute 185, restricting overtime hours at a maximum of 300 per year and eliminating the payout of vacation and medical leave in the calculation of average compensation upon retirement.
Total year ended September 30:2015 (193,711)$ 2016 (193,711) 2017 (193,711) 2018 (193,710) 2019 -
Thereafter -
102

CITY OF SANIBEL, FLORIDA NOTES TO THE FINANCIAL STATEMENTS
September 30, 2014 ____________________________________________________________________________________
Note 14. Defined Benefit Pension Plans (Continued)
B. Municipal Police Officers’ Pension Plan (Continued) On November 1, 2011, the City Council approved Ordinance 11-010 amending the Municipal Police Officers’ Pension Plan’s average compensation calculation to coincide with the October 1, 2011 effective date of the new Fraternal Order of Police labor agreement. Effective with fiscal years on or after September 30, 2011, average compensation calculations includes overtime payments not to exceed 300 hours per fiscal year and excludes the payment for vacation and medical leave accrued at the time of retirement, except for the value of vacation and medical leave that was accrued and eligible for payout as of September 30, 2011, unless the actual value of the vacation and medical leave payout is less than the September 30, 2011 value, in which case the lesser value will be included. Normal retirement eligibility is the earlier of 1) age 60 with 5 years vesting credits, or 2) age 55 with 10 years vesting credits, or 3) 25 years vesting credits regardless of age. Early retirement eligibility is age 50 and attainment of 5 years vesting credits. Accrued benefits will be reduced 2.5 percent for each year prior to normal retirement date. Disability eligibility is ten years of contributing service for non-service related; coverage from date of hire for service-incurred. Benefit amount is three (3.0%) percent of average final compensation times credited service, but not less than forty-two (42%) percent of average final compensation for service related disabilities. Death benefits for a vested member the accrued pension is paid to the beneficiary at otherwise early retirement date (reduced basis) or normal retirement date (unreduced). Benefits are paid for ten years only. Beneficiary receives a refund of the member’s contribution for non-vested member. Supplemental benefit of $36.00 times credited service paid monthly to age 67. Minimum payment period is five years. Annual cost-of-living adjustments are provided at the rate of three (3.0%) percent annually. These increases occur October 1, and commence the October 1 following receipt of at least 12 monthly payments. The Plan provides a Deferred Retirement Option Plan (DROP) for participants having attained normal retirement requirements. DROP is a program that provides an alternative method for payment of retirement benefits wherein an employee may retire and have their benefits accumulate, at four (4%) percent interest credited quarterly, while continuing to work for the City. Participation in the DROP does not change conditions of employment. When the DROP period ends, maximum of 60 months, employment must be terminated. At the time of termination of employment, the employee will receive payment of the accumulated DROP benefits and begin receiving their monthly retirement benefit in the same amount determined at retirement, plus annual cost-of-living increases. The DROP balance at September 30, 2014 is $518,525. Contributions Active members are required to contribute eight (8%) percent of their compensation to this Plan until Normal Retirement Age and four (4%) percent thereafter. The State of Florida makes contributions from taxes on casualty insurance premiums.
103

CITY OF SANIBEL, FLORIDA NOTES TO THE FINANCIAL STATEMENTS
September 30, 2014 ____________________________________________________________________________________
Note 14. Defined Benefit Pension Plans (Continued)
B. Municipal Police Officers’ Pension Plan (Continued) The State of Florida’s contribution to the Municipal Police Officer’s Plan for the year ended September 30, 2014, was $65,862. The City recognized these on-behalf payments from the State as revenues and expenditures in the governmental fund financial statements. The City contributes the remaining amount required in order to pay current costs and amortize unfunded past service cost, if any, as provided in Chapter 112, Florida Statutes. Net Pension Liability of the City The City’s net pension liability was measured as of September 30, 2014. The total pension liability used to calculate the net pension liability was determined as of that date. The components of the net pension liability of the City at September 30, 2014 were as follows:
Total pension liability $ 20,369,200 Plan fiduciary net position (15,856,528) City’s net pension liability $ 4,512,672 Plan fiduciary net position as a percentage of the total pension liability
77.85%
Actuarial Assumptions: The total pension liability was determined by an actuarial valuation as of October 1, 2013 updated to September 30, 2014 using the following actuarial assumptions applied to all measurement periods.
Inflation 3.00% Salary Increases 7.00% Investment Rate of Return 7.50%
RP2000 Combined Healthy – Sex Distinct. Disabled lives are set forward five years. Based on a study of over 650 public safety funds, this table reflects a ten (10%) percent margin for future mortality improvements. The actuarial assumptions used in the October 1, 2013 valuation were based on the results of an actuarial experience study for the period 1989-2011. The long-term expected rate of return on pension plan investments was determined using a building-block method in which best-estimate ranges of expected future real rates of return (expected returns, net of pension plan investment expenses and inflation) are developed for each major asset class.
104

CITY OF SANIBEL, FLORIDA NOTES TO THE FINANCIAL STATEMENTS
September 30, 2014 ____________________________________________________________________________________
Note 14. Defined Benefit Pension Plans (Continued)
B. Municipal Police Officers’ Pension Plan (Continued) These ranges are combined to produce the long term expected rate of return by weighting the expected future real rates of return by the target asset allocation percentage and by adding expected inflation. Best estimates of arithmetic real rates of return for each major asset class included in the pension plan’s target asset allocation as of September 30, 2014 are summarized in the following table:
Asset Class
Target Allocation
Long Term Expected Real Rate of Return
Domestic Equity 35.00% 7.80% International Equity 15.00% 2.20% Bonds 30.00% 3.70% Convertibles 10.00% 5.30% REITS 5.00% 8.20% MLPs 5.00% 12.70% Discount Rate: The discount rate used to measure the total pension liability was 7.50 percent. The projection of cash flows used to determine the discount rate assumed that plan member contributions will be made at the current contribution rate and that city contributions will be made at rates equal to the difference between actuarially determined contribution rates and the member rate. Based on those assumptions, the pension plan’s fiduciary net position was projected to be available to make all projected future benefit payments of current plan members. Therefore, the long-term expected rate of return on pension plan investments was applied to all periods of projected benefit payments to determine the total pension liability.
Total Pension Plan Fiduciary Net PensionLiability Net Position Liability
Balances at September 30, 2013 19,166,551$ 13,939,400$ 5,227,151$ Changes for the year: Service cost 509,101 - 509,101 Interest 1,445,430 - 1,445,430 Differences between expected and actual experience - - - Contributions - employer - 961,952 (961,952) Contributions - state - 65,862 (65,862) Contributions - employee - 114,679 (114,679) Net investment income - 1,564,849 (1,564,849) Benefit payments, including refunds of employee contributions (751,882) (751,882) - Administrative expense - (38,332) 38,332 Net changes 1,202,649 1,917,128 (714,479) Balances at September 30, 2014 20,369,200$ 15,856,528$ 4,512,672$
Increase (Decrease)
CHANGES IN NET PENSION LIABILITY
105

CITY OF SANIBEL, FLORIDA NOTES TO THE FINANCIAL STATEMENTS
September 30, 2014 ____________________________________________________________________________________
Note 14. Defined Benefit Pension Plans (Continued)
B. Municipal Police Officers’ Pension Plan (Continued) Sensitivity of the net pension liability to changes in the discount rate: The following presents the net pension liability of the City, calculated using the discount rate of 7.50 percent, as well as what the City’s net pension liability would be if it were calculated using a discount rate that is 1-percentage-point lower (6.50 percent) or 1-percentage-point higher (8.50 percent) than the current rate:
Pension Expense and Deferred Inflows/Outflows of Resources Related to Pensions For the year ended September 30, 2014 the City will recognize a pension expense of $652,420. On September 30, 2014 the City reported deferred outflows of resources and deferred inflows of resources related to pensions from the following sources:
Amounts reported as deferred inflows of resources related to pensions will be recognized in pension expense as follows:
Payable to the Pension Plan On September 30, 2014, the City reported a payable of $44,423, for the outstanding amount of contributions of the pension plan required for the year ended September 30, 2014.
Note 15. Defined Contribution Plan On March 1, 2011, the City Council passed Resolution No. 11-020, which amended the City’s governmental money purchase plan and trust known as City of Sanibel 401(a) Plan to include the City’s general employees other than police dispatchers. On December 6, 2011, Council passed Resolution No. 11-110 which amended the Plan to include the police dispatchers and to comply with the Internal Revenue Service guidelines requiring the initial additional contribution decision by employees to be an irrevocable decision in order for the contribution to be considered a pre-tax contribution. The plan is administered by the ICMA Retirement Corporation an unrelated financial institution on behalf of the City.
1% Current 1%Decrease Discount Rate Increase
6.50% 7.50% 8.50%City's net pension liability 7,104,140$ 4,512,672$ 2,363,278$
Deferred Deferred Outflows of Inflows ofResources Resources
Actual investment earnings different than assumed -$ 404,947$ Differences between actual and expected experience - -
Total -$ 404,947$
Total year ended September 30:2015 (101,237)$ 2016 (101,237) 2017 (101,237) 2018 (101,236) 2019 -
Thereafter -
106
CITY OF SANIBEL, FLORIDA NOTES TO THE FINANCIAL STATEMENTS
September 30, 2014 ____________________________________________________________________________________
Note 15. Defined Contribution Plan (Continued)
Plan Description The plan is a pre-tax defined contribution governmental money purchase plan in which participants contribute a percentage of their base pay to the plan each pay period and receive a matching contribution from the City as outlined in the plan. Participants are not taxed on the contributions until the funds are withdrawn, usually at retirement. The Plan was established on September 13, 2002 at which time the only participants were the City Manager and City Attorney. The Plan was revised by City of Sanibel Resolution 11-020 on March 1, 2011 and Resolution 11-110 on December 6, 2011 to extend the Plan to all regular, full-time employees, who are not sworn police officers and who are not participants of the General Employees’ Retirement Plan, a defined benefit plan. When the plan was first established, new hires had 30 days from the date of initial employment to make an irrevocable decision whether or not to participate in this Plan. New regular, full-time employees, who are not sworn police officers, hired on or after February 7, 2012 are automatically enrolled in this Plan. The normal retirement age is 60. Mandatory and Irrevocable Additional Contributions All participants are required to contribute 5% of their base pay on a bi-weekly basis. Additional contributions of 1% to 10% may also be contributed to the Plan. The additional contribution amount initially selected is an irrevocable decision. Participants may not decrease the initial additional selected contribution. Increases are permitted after the initial selected contribution rate if the original contribution was less than the 15% maximum, however, the increased amount will be an after-tax contribution. City Matching The City will match the participant’s mandatory contribution of 5% of base pay at 100%. The first 1% to 5% of the voluntary contribution will be matched by the City at 50%. The additional 6% to 10% of the voluntary contribution permitted will not be matched by the City. The maximum City match is 7.5% of base pay. As of September 30, 2014, ninety-six (96) participants were in the plan and the City contributed $234,076 to the Plan in fiscal year 2014. Forfeitures A participant who separates from service prior to obtaining full vesting shall forfeit that percentage of his/her employer contribution account balance which has not vested as of the date such participant incurs a break in service of five (5) consecutive years or, if earlier, the date such participant receives, or is deemed to have received, distribution of the entire non-forfeitable interest in his/her employer contribution account. All amounts forfeited by terminated participants shall be allocated to a suspense account and used to reduce dollar for dollar employer contributions otherwise required under the Plan for the current plan year and succeeding plan years, if necessary. Forfeitures may first be used to pay the reasonable administrative expenses of the Plan, with any remainder being applied to reduce employer contributions. There are no forfeitures reflected in pension expense for the fiscal year 2014. Rollover Contributions by Participants Participants may rollover funds contained in another qualified retirement plan or IRA to the Plan.
107

CITY OF SANIBEL, FLORIDA NOTES TO THE FINANCIAL STATEMENTS
September 30, 2014 ____________________________________________________________________________________
Note 15. Defined Contribution Plan (Continued)
Accrued Leave Contributions by Participants At initial enrollment participants may irrevocably elect to contribute 100% of accrued leave payout to the plan. Once elected, an employee’s decision will remain in force and may not be revised or revoked. Vesting Provisions Former participants of the City of Sanibel General Employees’ Defined Benefit Plan who opted out of that plan to participant in this Plan on or before April 30, 2011 and on or before December 31, 2011 for police dispatchers are vested immediately for the City’s matching contributions. New hires are vested for the City’s matching contributions at 20% per year of service. Participants are eligible to withdraw the retirement funds when they are no longer employed by the City or reach age 60. Participants may choose distribution in a single payment, installment payments, life annuity or rollover to another qualified retirement account.
Note 16. Other Post-Employment Benefits (OPEB) Plan Description In accordance with Chapter 112.0801, Florida Statutes, the City allows retirees the option of continuing to participate in the City’s group health insurance coverage at a premium cost of no more than the premium cost applicable to active employees. Therefore, the City offers retirees the option of purchasing the City’s group health, dental and/or vision insurance coverage at the cost applicable to active employees. Retirees participating in the group insurance plans offered by the City are required to contribute 100% of the active premiums. In future years, contributions are assumed to increase at the same rate as premiums. The projected employee contributions for the dental benefit are assumed to cover the entire cost of the program. The plan does not issue a publicly available financial report.
Funding Policy Required contributions are based on projected pay-as-you-go financing. For the fiscal year ended September 30, 2014, the City provided contributions of $39,706 toward implicit benefits including administrative expenses payable during the year.
Current membership is comprised of the following: Active employees (including DROP) 98
Retirees and covered spouses currently receiving benefits: Pre-Medicare 8Post-Medicare 0
Total Retirees and covered spouses currently receiving benefits 8
108

CITY OF SANIBEL, FLORIDA NOTES TO THE FINANCIAL STATEMENTS
September 30, 2014 ____________________________________________________________________________________
Note 16. Other Post-Employment Benefits (Continued)
Annual OPEB Cost and Net OPEB Obligation The City’s annual OPEB cost for the current year was determined as part of the October 1, 2013 actuarial valuation using the entry age normal actuarial cost method. Select actuarial assumptions are listed in the table below:
Valuation date October 1, 2013 Actuarial cost method Entry Age Normal (Level Percent of Pay)
Amortization of UAAL Level Percentage of Payroll (Closed amortization over 30 years)
Remaining amortization period 30 years Asset valuation method Market value Actuarial assumptions: Interest rate 5.0%
Health care inflation
Pre-Medicare 7.5% (grading down to 4.5% in 2017)
Post-Medicare 7.5%, (grading down to of 4.5% in 2017
Salary Rate Increase 5.5% per year Inflation Rate 3.0% per year Payroll Growth 3.0% per year
Mortality Rate RP 2000 Combined Mortality Table, projected to measurement date using Scale AA.
The actuarial valuation involves estimates of the value of reported amounts and assumptions about the probability of events far into the future. Examples include assumptions about future employment, mortality and the healthcare cost trend. Amounts determined regarding the funded status of the plan and the annual required contributions of the City are subject to constant revision as actual experience is compared with past expectations and new estimates are made about the future. The schedule of funding progress, presented as required supplementary information following the notes to the financial statements, presents multi-year trend information that shows whether the actuarial value of plan assets is increasing or decreasing over time relative to the actuarial liabilities for benefits. Calculations are based upon the types of benefits provided under the terms of the substantive plan at the time of the valuation and on the pattern of sharing of costs between the City and plan members to that point. Calculations reflect a long-term prospective, so methods and assumptions used include techniques that are designed to reduce short-term volatility in actuarial accrued liabilities and the actuarial value of assets. The amounts shown below reflect a decision to no longer fund the program. All assets previously held in a separate trust fund have been transferred back to the City, resulting in a one-time adjustment to the Net OPEB Obligation as of September 30, 2012. For future years, the interest rate has also been lowered from 8% to 5% since the plan is no longer considered a funded plan.
109

CITY OF SANIBEL, FLORIDA NOTES TO THE FINANCIAL STATEMENTS
September 30, 2014 ____________________________________________________________________________________
Note 16. Other Post-Employment Benefits (Continued)
The three year funding trend follows:
Funded Status and Funding Progress The funded status of the Plan as of September 30, 2014 was as follows:
The schedule of funding progress is presented in the required supplementary information following the notes to the financial statements. The schedule presents multi-year trend information about whether the actuarial value of plan assets is increasing or decreasing over time relative to the actuarial accrued liability for benefits. The following table shows the components of the City’s OPEB cost for the year, the amount contributed to the plan, and changes in the City’s net OPEB obligation:
% of AnnualAnnual OPEB Cost Net OPEB
Fiscal Year Ending OPEB Cost Contributed ObligationSeptember 30, 2014 49,406$ 80.4% 226,583$ September 30, 2013 72,120 53.4% 216,883 September 30, 2012 58,209 48.8% 183,311
Funded status as of: 10/01/2011 10/01/2012 10/01/2013Actuarial Accrued Liability (AAL) 530,484$ 631,325$ 397,234$ Actuarial Value of Assets (AVA) (153,507) - - Unfunded Acturarial Accrued Liability (UAAL) 376,977 631,325 397,234 Funded Ratio (actuarial value of assets/AAL) 28.94% 0.00% 0.00%Covered Payroll 4,993,719 5,787,718 5,572,096 Ratio of UAAL to Covered Payroll 7.55% 10.91% 7.13%
Valuation Date 10/01/2011 10/01/2012 10/01/2013Applicable for Fiscal Year Ending 09/30/2012 09/30/2013 09/30/2014Annual Required Contribution 58,209$ 70,299$ 48,671$ Interest on Net OPEB Obligation - 9,166 10,844 Adjustment to Annual Required Contribution - (7,345) (10,109) Annual OPEB Cost (Expense) 58,209 72,120 49,406 Net Contributions Made (28,405) (38,548) (39,706) Increase (Decrease) in Net OPEB Obligation 29,804 33,572 9,700 Net OPEB Obligation - Beginning of Year - 183,311 216,883 Adjustment for Asset Transfer to City 153,507 - - Net OPEB Obligation - End of Year 183,311$ 216,883$ 226,583$
110

CITY OF SANIBEL, FLORIDA NOTES TO THE FINANCIAL STATEMENTS
September 30, 2014 ____________________________________________________________________________________
Note 17. Other Revenues
Other revenue in the government fund types at September 30, 2014 is as follows:
Note 18. Contingencies Amounts received or receivable from grantor agencies are subject to compliance audit by grantor agencies, principally federal and state governments. Any disallowed expenses, including amounts already collected, might constitute a liability of the applicable funds. The City does not believe any contingent liabilities are material. The City is a defendant in lawsuits. Although the outcome of these lawsuits is not presently determinable, in the opinion of the City’s counsel the resolution of the cases do not appear to present significant monetary exposure to the City in the event of unfavorable outcomes.
Note 19. Commitments The City’s commitments with contractors as of September 30, 2014, are as follows:
The Lighthouse Restroom project in the Beach Parking Fund is being funded with grant proceeds.
OtherGeneral Transportation Recreation Governmental
Fund Fund Fund Funds TotalInvestment earnings (loss) 32,683$ 17,416$ 9,778$ 75,456$ 135,333$ Rents 66,829 - - 481 67,310 Impact fees - - - 134,658 134,658 Special assessments - - 33,741 33,741 Sale of surplus equipment 16,183 - 600 - 16,783 Contributions and donations 1,100 - 50,572 186,795 238,467 Refund of prior year expenditures 27,695 - - - 27,695 Other 54,362 - 2,848 8,145 65,355 Total Other Revenues 198,852$ 17,416$ 63,798$ 439,276$ 719,342$
Total Contract Spent to Date Remaining GOVERNMENTAL ACTIVITIESTransportation Fund
2014 Street Resurfacing Project 490,248$ 117,574$ 372,674$ 2014 Sanibel River Clearing Project 80,000 47,667 32,333
Capital Project FundDinkins Bayou Dredging Project 304,592 143,156 161,436
Total governmental activities 874,840 308,397 566,443
BUSINESS-TYPE ACTIVITIESSewer Fund
Lift Station #5 - Generator and Platform 156,176 79,338 76,838 Beach Parking Fund
Lighthouse Restroom 683,609 66,857 616,752
Total business-type activities 839,785 146,195 693,590
Total construction commitments 1,714,625$ 454,592$ 1,260,033$
111

CITY OF SANIBEL, FLORIDA NOTES TO THE FINANCIAL STATEMENTS
September 30, 2014 ____________________________________________________________________________________
Note 20. Change in Accounting Principle
During fiscal year 2014, the City adopted GASB Statement No. 65, Items Previously Reported as Assets and Liabilities and GASB Statement No. 68, Accounting and Financial Reporting for Pensions. In addition, the City’s pension plans adopted the provisions of GASB Statement No. 67, Financial Reporting for Pension Plans. These pronouncements required the restatement of the September 30, 2013 net position in governmental activities, business-type activities, enterprise and fiduciary funds. This change is in accordance with generally accepted accounting principles. The tables below present the details of the restatements:
Actuarial information for the net pension liability and deferred inflows and outflows were not available for the prior period and, therefore, it was not considered practical to restate and reissue the prior year financial statements.
Governmental Business-typeActivities Activities Total
Net position, September 30, 2013 as previously reported 61,456,576$ 34,623,463$ 96,080,039$
Reclassification of bond issuance costs per GASB 65 (154,447) (59,108) (213,555)
Cumulative effect of application of GASB 68 (17,230,959) (1,789,817) (19,020,776)
Net position, September 30, 2013 as restated 44,071,170$ 32,774,538$ 76,845,708$
Governmental Activities
SanibelSewer Beach
System Parking Total
Net position, September 30, 2013 as previously reported 30,673,966$ 3,949,497$ 34,623,463$
Reclassification of bond issuance costs per GASB 65 (59,108) - (59,108)
Cumulative effect of application of GASB 68 (923,779) (866,038) (1,789,817)
Net position, September 30, 2013 as restated 29,691,079$ 3,083,459$ 32,774,538$
Enterprise Funds
MunicipalGeneral Police
Employees Officers' Total
Net position, September 30, 2013 as previously reported 21,283,849$ 13,618,254$ 34,902,103$
Cumulative effect of application of GASB 67 62,624 321,146 383,770
Net position, September 30, 2013 as restated 21,346,473$ 13,939,400$ 35,285,873$
Pension Trust Funds
112

This section contains the following subsections: General Employees’ Pension Plan Schedule of Changes in the Net Pension Liability and Related Ratios ...................... 114 Schedule of Contributions .......................................................................................... 115 Schedule of Investment Returns ................................................................................ 116 Municipal Police Officers’ Pension Plan Schedule of Changes in the Net Pension Liability and Related Ratios ...................... 117 Schedule of Contributions .......................................................................................... 118 Schedule of Investment Returns ................................................................................ 119 Other Post Employment Benefit Plan Schedule of Funding Progress .................................................................................. 120 Schedules of Contributions from the Employer .......................................................... 120
REQUIREDSU
PPLEM
ENTARYINFORMATION
113

CITY OF SANIBEL, FLORIDA REQUIRED SUPPLEMENTARY INFORMATION
September 30, 2014 ____________________________________________________________________________________
2014 2013Total pension liabilityService cost 196,178$ 183,773$ Interest 1,895,908 1,851,553 Changes of benefit termsDifferences between expected and actual experienceChanges of assumptionsBenefit payments, including refunds of member contributions (1,276,944) (1,504,296) Net change in total pension liability 815,142 531,030 Total pension liability - beginning 28,529,824 27,998,794 Total pension liability - ending (a) 29,344,966$ 28,529,824$
Plan fiduciary net positionContributions - employer 1,681,948$ 1,691,261$ Contributions - employee 65,431 64,908 Net investment income 2,424,391 2,436,581 Benefit payments, including refunds of member contributions (1,276,944) (1,504,296) Administrative expense (27,489) (31,229) Other - - Net change in plan fiduciary net position 2,867,337 2,657,225
Plan fiduciary net position - beginning 21,346,473 18,689,248 Plan fiduciary net position - ending (b) 24,213,810$ 21,346,473$
City's net pension liability - ending (a) - (b) 5,131,156$ 7,183,351$
Plan fiduciary net position as a percentage of the total pension liability 82.51% 74.82%
Covered-employee payroll 1,308,625$ 1,298,166$
City's net position liability as a percentage of covered-employee payroll 392.10% 553.35%
Notes to Schedule:
GASB 67 and GASB 68 compliance was adopted in fiscal year 2014
GENERAL EMPLOYEES' PENSION PLANSCHEDULE OF CHANGES IN THE NET PENSION LIABILITY AND RELATED RATIOS
Last Two Fiscal Years
114

CITY OF SANIBEL, FLORIDA REQUIRED SUPPLEMENTARY INFORMATION
September 30, 2014 ____________________________________________________________________________________________________________________
2014 2013 2012 2011 2010 2009 2008 2007 2006 2005
Actuarially determined contribution 1,659,991$ 1,668,403$ 1,397,764$ 1,448,913$ 1,173,397$ 858,029$ 824,863$ 635,605$ 629,330$ 802,887$
Contributions in relation to the actuarially determined contributions 1,681,948 1,691,261 5,587,616 1,448,913 1,173,397 975,816 824,863 635,605 629,330 802,887
Contribution deficiency (Excess) (21,957)$ (22,858)$ (4,189,852)$ -$ -$ (117,787)$ -$ -$ -$ -$
Covered-employee payroll 1,308,625$ 1,298,166$ 1,325,935$ 1,306,071$ 4,706,046$ 4,927,259$ 5,448,952$ 5,190,903$ 4,732,869$ 4,060,239$
Contributions as a percentage of covered employee payroll 128.53% 130.28% 421.41% 110.94% 24.93% 19.80% 15.14% 12.24% 13.30% 19.77%
Notes to Schedule
Valuation Date: 10/1/2012
Actuarially determined contribution rates are calculated as of October 1, two years prior to the end of the fiscal year in which contributions are reported.
Methods and assumptions used to determine contribution rates:
Funding methodAmortization methodRemaining amortization periodAsset smoothing methodology
InflationSalary increasesInterest ratePayroll increaseCost-of-living adjustmentRetirement ageEarly retirementTermination ratesDisability ratesMortality
Other Information% Becoming
% Terminating Disabled AverageDuring the During the Salary
Age Year Year Increase20 18.6% 0.14% 7.8%30 11.0% 0.18% 6.3%40 9.2% 0.30% 5.4%50 8.2% 1.00% 4.8%
See Table below.RP2000 Combined Healthy Mortality Table (sex distinct), projected to the valuation date with Schedule AA. Static mortality rates were utilized for prior valuations.
Termination, Disability and Salary Rate Tables
6.75% per year, compounded annually, net of investment related expenses. A 7.5% assumption was utilized for valuations prior to October 1, 2012.None2% for 25 years, beginning 5 years after retirement, payable to normal and early retirees.One year following satisfaction of the Plan's requirement for normal retirement.Commencing upon eligibility for early retirement, members are assumed to retire with an immediate benefit at the rate of 5% per year.See Table below.
See Table below.
GENERAL EMPLOYEES' PENSION PLANSCHEDULE OF CONTRIBUTIONS
Last Ten Fiscal Years
Entry age normal actuarial cost methodLevel percentage of pay, closed10 years (as of 10/01/2012)The actuarial value of assets is brought forward using the historical four-year geometric average of market value returns (net-of-fees). Over time, this may result in a deminis bias that is above or below the market value of assets.3.0% per year
115

CITY OF SANIBEL, FLORIDA REQUIRED SUPPLEMENTARY INFORMATION
September 30, 2014 ____________________________________________________________________________________
2014 2013
Annual money-weighted rate of return,net of investment expenses 11.00% 12.96%
GENERAL EMPLOYEES' PENSION PLANSCHEDULE OF INVESTMENT RETURNS
Last Two Fiscal Years
116

CITY OF SANIBEL, FLORIDA REQUIRED SUPPLEMENTARY INFORMATION
September 30, 2014 ____________________________________________________________________________________
2014 2013Total pension liabilityService cost 509,101$ 473,582$ Interest 1,445,430 1,373,741 Changes of benefit terms - - Differences between expected and actual experience - - Changes of assumptions - - Benefit payments, including refunds of member contributions (751,882) (1,102,107) Net change in total pension liability 1,202,649 745,216 Total pension liability - beginning 19,166,551 18,421,335 Total pension liability - ending (a) 20,369,200$ 19,166,551$
Plan fiduciary net positionContributions - employer 961,952$ 2,072,711$ Contributions - state 65,862 62,542 Contributions - employee 114,679 105,628 Net investment income 1,564,849 1,435,540 Benefit payments, including refunds of member contributions (751,882) (1,102,107) Administrative expense (38,332) (32,304) Other - - Net change in plan fiduciary net position 1,917,128 2,542,010
Plan fiduciary net position - beginning 13,939,400 11,397,390 Plan fiduciary net position - ending (b) 15,856,528$ 13,939,400$
City's net pension liability - ending (a) - (b) 4,512,672$ 5,227,151$
Plan fiduciary net position as a percentage of the total pension liability 77.85% 72.73%
Covered-employee payroll 1,433,491$ 1,320,347$
City's net position liability as a percentage of covered-employee payroll 314.80% 395.89%
Notes to Schedule:
GASB 67 and GASB 68 compliance was adopted in fiscal year 2014
Last Two Fiscal Years
MUNICIPAL POLICE OFFICERS' PENSION PLANSCHEDULE OF CHANGES IN THE NET PENSION LIABILITY AND RELATED RATIOS
117
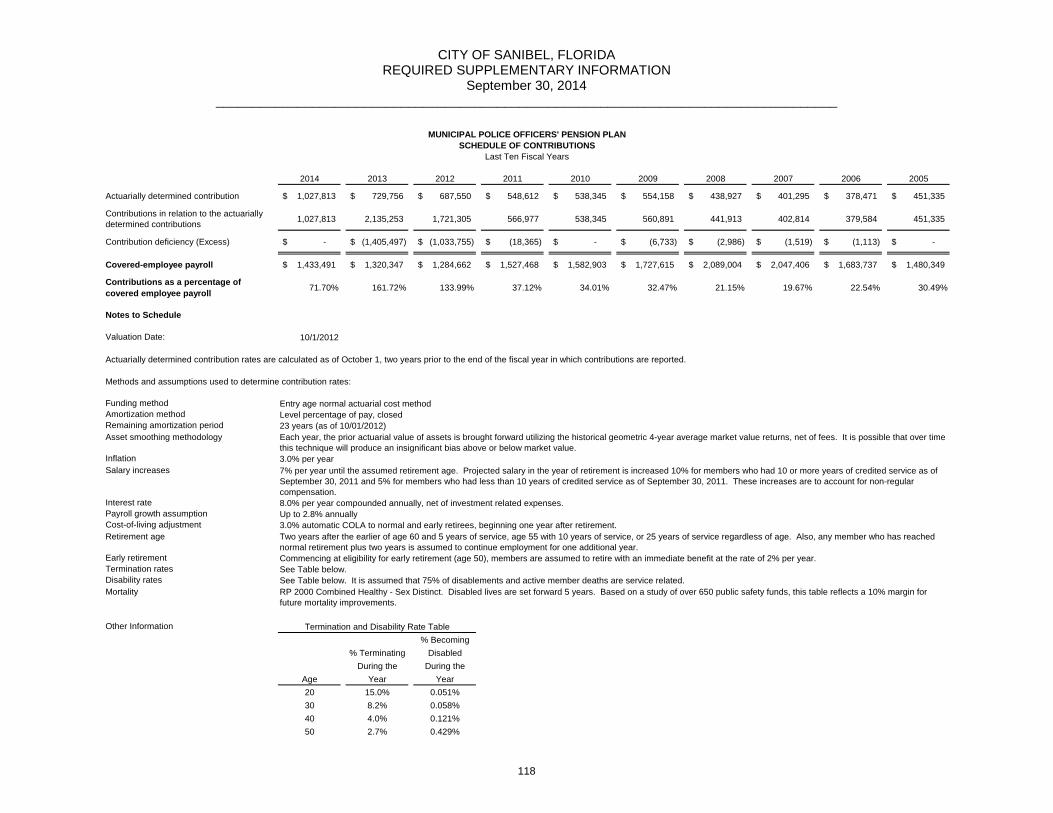
CITY OF SANIBEL, FLORIDA REQUIRED SUPPLEMENTARY INFORMATION
September 30, 2014 ____________________________________________________________________________________
2014 2013 2012 2011 2010 2009 2008 2007 2006 2005
Actuarially determined contribution 1,027,813$ 729,756$ 687,550$ 548,612$ 538,345$ 554,158$ 438,927$ 401,295$ 378,471$ 451,335$
Contributions in relation to the actuarially determined contributions 1,027,813 2,135,253 1,721,305 566,977 538,345 560,891 441,913 402,814 379,584 451,335
Contribution deficiency (Excess) -$ (1,405,497)$ (1,033,755)$ (18,365)$ -$ (6,733)$ (2,986)$ (1,519)$ (1,113)$ -$
Covered-employee payroll 1,433,491$ 1,320,347$ 1,284,662$ 1,527,468$ 1,582,903$ 1,727,615$ 2,089,004$ 2,047,406$ 1,683,737$ 1,480,349$
Contributions as a percentage of covered employee payroll 71.70% 161.72% 133.99% 37.12% 34.01% 32.47% 21.15% 19.67% 22.54% 30.49%
Notes to Schedule
Valuation Date: 10/1/2012
Actuarially determined contribution rates are calculated as of October 1, two years prior to the end of the fiscal year in which contributions are reported.
Methods and assumptions used to determine contribution rates:
Funding methodAmortization methodRemaining amortization periodAsset smoothing methodology
InflationSalary increases
Interest ratePayroll growth assumptionCost-of-living adjustmentRetirement age
Early retirementTermination ratesDisability ratesMortality
Other Information% Becoming
% Terminating DisabledDuring the During the
Age Year Year20 15.0% 0.051%30 8.2% 0.058%40 4.0% 0.121%50 2.7% 0.429%
Termination and Disability Rate Table
Each year, the prior actuarial value of assets is brought forward utilizing the historical geometric 4-year average market value returns, net of fees. It is possible that over time this technique will produce an insignificant bias above or below market value.3.0% per year7% per year until the assumed retirement age. Projected salary in the year of retirement is increased 10% for members who had 10 or more years of credited service as of September 30, 2011 and 5% for members who had less than 10 years of credited service as of September 30, 2011. These increases are to account for non-regular compensation.8.0% per year compounded annually, net of investment related expenses.Up to 2.8% annually3.0% automatic COLA to normal and early retirees, beginning one year after retirement.Two years after the earlier of age 60 and 5 years of service, age 55 with 10 years of service, or 25 years of service regardless of age. Also, any member who has reached normal retirement plus two years is assumed to continue employment for one additional year.Commencing at eligibility for early retirement (age 50), members are assumed to retire with an immediate benefit at the rate of 2% per year.See Table below.See Table below. It is assumed that 75% of disablements and active member deaths are service related.RP 2000 Combined Healthy - Sex Distinct. Disabled lives are set forward 5 years. Based on a study of over 650 public safety funds, this table reflects a 10% margin for future mortality improvements.
23 years (as of 10/01/2012)
MUNICIPAL POLICE OFFICERS' PENSION PLANSCHEDULE OF CONTRIBUTIONS
Last Ten Fiscal Years
Entry age normal actuarial cost methodLevel percentage of pay, closed
118

CITY OF SANIBEL, FLORIDA REQUIRED SUPPLEMENTARY INFORMATION
September 30, 2014 ____________________________________________________________________________________
2014 2013
Annual money-weighted rate of return,net of investment expenses 10.91% 12.01%
Last Two Fiscal Years
MUNICIPAL POLICE OFFICERS' PENSION PLANSCHEDULE OF INVESTMENT RETURNS
119

CITY OF SANIBEL, FLORIDA REQUIRED SUPPLEMENTARY INFORMATION
September 30, 2014 ____________________________________________________________________________________
OTHER POST EMPLOYMENT BENEFITS PLANSCHEDULE OF FUNDING PROGRESS
ActuarialAccrued UAAL as
Actuarial Liability Unfunded a % ofActuarial Value of (AAL) - AAL Funded Covered coveredValuation Assets Entry Age (UAAL) Ratio Payroll PayrollDate (*) (a) (b) (b-a) (a/b) ( c ) ((b-a)/c)
10/01/2013 -$ 397,234$ 397,234$ 0.00% 5,572,096$ 7.13%10/01/2012 - 631,325 631,325 0.00% 5,787,718 10.91%10/01/2011 153,507 530,484 376,977 28.94% 4,993,719 7.55%10/01/2010 129,012 377,652 248,640 34.16% 6,672,366 3.73%10/01/2009 109,079 326,631 217,552 33.40% 6,778,234 3.21%10/01/2008 80,460 426,115 345,655 18.88% 6,443,331 5.36%10/01/2007 26,579 479,981 453,402 5.54% 6,479,008 7.00%
OTHER POST EMPLOYMENT BENEFITS PLANSCHEDULE OF CONTRIBUTIONS FROM THE EMPLOYER
Year AnnualEnded Required City Percentage
September 30 Contribution Contribution Contributed2014 49,406$ 39,706$ 80.37%2013 72,120 38,548 53.45%2012 58,209 28,405 48.80%2011 52,480 52,480 100.00%2010 46,897 46,897 100.00%2009 70,235 70,235 100.00%2008 86,071 86,071 100.00%2007 54,339 54,339 100.00%
120

This section contains the following subsections: Description of Nonmajor Governmental Funds ............................................................ 122 Combining Balance Sheet – Nonmajor Governmental Funds ..................................... 123 Combing Statement of Revenues, Expenditures, and Changes in Fund Balances – Nonmajor Governmental Funds ..................................................... 125 Schedule of Revenues, Expenditures, and Changes in Fund Balances – Budget and Actual
Water Quality Education ......................................................................................... 127 Historical Committee .............................................................................................. 127 Road Impact Fees .................................................................................................. 128 Community Park Impact Fees ................................................................................ 128 Father Madden Estate ............................................................................................ 129 Building Department ............................................................................................... 129 Elementary School Ball Park Maintenance ............................................................ 130 Shell Harbor Dredging ............................................................................................ 130 Sanibel Estates Canal Trimming ............................................................................ 131 Sanibel Isles/Water Shadows Dredging ................................................................. 131 2012 $2.97M General Obligation Bonds ................................................................ 132 2006 $8.35M General Obligation Bonds ................................................................ 132 Capital Asset Acquisition ........................................................................................ 133 Transportation Capital Projects .............................................................................. 133 Periwinkle Bike Path & Road Project...................................................................... 134 Recreation Facility Sinking Fund ............................................................................ 134
COMBININGFIN
ANCIA
LSTATEM
ENTSA
NDSCH
EDULES
121

CITY OF SANIBEL, FLORIDA NONMAJOR GOVERNMENTAL FUNDS
September 30, 2014 ____________________________________________________________________________________
SPECIAL REVENUE FUNDS
Special revenue funds are used to account for specific revenues that are legally restricted to expenditure for particular purposes.
Fertilizer Outreach and Education Fund – to account for funds related to the support of the education and public awareness of water quality issues related to fertilizer use.
Historical Committee - to account for receipts and disbursements of donations specifically designated to the use and under the direction of the Historical Committee with City Council approval.
Road Impact Fees - to account for revenue collected by the City at the time of building permit issuance based on a county-wide ordinance assessing road impact fees which funds are used to improve roads on Sanibel.
Community Park Impact Fees - to account for revenue collected by the City at the time of building permit issuance based on a county-wide ordinance assessing community park impact fees which funds are used to improve community parks on Sanibel.
Father Madden Estate - to account for funds bequeathed to the City for the humane care of stray dogs and feral cats.
Building Department – to account for the receipts and disbursements of building-type permit revenues and the associated inspection and operations expenditures related thereto.
Elementary School Ball Park Maintenance - to account for the operation and maintenance of the ball fields, formerly Lee County School Board facilities, pursuant to interlocal operation and reimbursement agreements with Lee County and with the Lee County School Board.
Shell Harbor Dredging – to account for financial resources including special assessments from benefiting property owners used to retain navigability for both property owners and public access.
Sanibel Estates Canal Trimming – to account for financial resources including special assessments from benefiting property owners used to retain navigability and roadway drainage in canals.
Sanibel Isles/Water Shadows Dredging – to account for financial resources including special assessments from benefiting property owners used to retain navigability for both property owners and public access.
DEBT SERVICE FUNDS
Debt Service Funds are used to account for the accumulation of resources for and the payment of principal and interest on general long-term debt.
2012 $2.97M General Obligation Bond – to account for the debt service payments and administrative costs for the 2002 GO Bonds and the 2012 GO Refunding Bonds issued to retire the 2002 GO Bonds. Revenues are received from voter approved ad valorem property taxes.
2006 $8.35M General Obligation Bond – (Construction of New Recreation Center) – to account for the payment of principal and interest of the $8.35 million General Obligation Bonds, Series 2006 which bear interest from 4.0% to 4.35% to be fully repaid in February 2036.
CAPITAL PROJECTS FUNDS
Capital Project Funds account for all resources used for the acquisition and/or construction of major capital facilities.
Capital Asset Acquisition - to account for financial resources to be used for on-going and/or routine capital acquisitions such as vehicle replacement and environmentally sensitive land.
Transportation Capital Projects - to account for financial resources to be used for the maintenance and upgrading of roads and streets, including drainage, resurfacing, reshelling, shared-use paths and the professional engineering cost associated therewith.
Periwinkle Bike Path & Road Maintenance - to account for financial resources to be used for maintenance and improvements to the road and shared-use path on Periwinkle Way.
Recreation Facility Sinking Fund – sinking fund to accumulate funds necessary for the rehabilitation and replacement of components and equipment at the Recreation Complex.
122

CITY OF SANIBEL, FLORIDA COMBINING BALANCE SHEET
NONMAJOR GOVERNMENTAL FUNDS September 30, 2014
Special Revenue FundsSanibel
Elementary Sanibel Isles/Water Community Father School Shell Estates WaterQuality Historical Road Park Madden Building Ball Park Harbor Canal Shadows
Education Committee Impact Fees Impact Fees Estate Department Maintenance Dredging Trimming Dredging TotalASSETS
Cash and cash equivalents -$ 145,330$ 264,895$ 88,863$ 25,236$ 886,785$ -$ 40,249$ 24,671$ 79,704$ 1,555,733$ Accounts receivable - - - - - 58 - - - - 58 Due from other governments - - - - - - 42,210 221 59 47 42,537
Total assets -$ 145,330$ 264,895$ 88,863$ 25,236$ 886,843$ 42,210$ 40,470$ 24,730$ 79,751$ 1,598,328$
LIABILITIES - Accounts payable -$ -$ -$ -$ -$ 5,759$ 698$ -$ 6,100$ -$ 12,557$ Retainages payable - - - - - - - - - - - Due to other funds - - - - - - 22,558 - - - 22,558 Accrued liabilities - - - - - 17,793 - - - - 17,793
Total liabilities - - - - - 23,552 23,256 - 6,100 - 52,908
FUND BALANCESRestricted:
Public safety - - - - - 863,291 - - - - 863,291 Transportation - - - - - - - - - - - Capital projects - - - - - - - - - - - Debt service - - - - - - - - - - - Impact fees - - 264,895 88,863 - - - - - - 353,758 Donations received - 145,330 - - 25,236 - - - - - 170,566 Special assessments - - - - - - - 40,470 18,630 79,751 138,851
Assigned:Parks and recreation - - - - - - 18,954 - - - 18,954 Other capital projects - - - - - - - - - - -
Total fund balances - 145,330 264,895 88,863 25,236 863,291 18,954 40,470 18,630 79,751 1,545,420
Total liabilities and fund balances
-$ 145,330$ 264,895$ 88,863$ 25,236$ 886,843$ 42,210$ 40,470$ 24,730$ 79,751$ 1,598,328$
123

CITY OF SANIBEL, FLORIDACOMBINING BALANCE SHEET (Continued)
NONMAJOR GOVERNMENTAL FUNDSSeptember 30, 2014
Debt Service Capital Projects TOTAL
2012 $2.97M 2006 $8.35M Periwinkle RecreationGeneral General Capital Transportation Bike Path & Facility Nonmajor
Obligation Obligation Asset Capital Road Sinking GovernmentalBonds Bond Total Acquisition Projects Project Fund Total Funds
ASSETSCash and cash equivalents 275,835$ 76,180$ 352,015$ 960,669$ 835,426$ 50,316$ 447,075$ 2,293,486$ 4,201,234$ Accounts receivable 36 54 90 - 2,428 - - 2,428 2,576 Due from other governments - - - 2,799 - - - 2,799 45,336
Total assets 275,871$ 76,234$ 352,105$ 963,468$ 837,854$ 50,316$ 447,075$ 2,298,713$ 4,249,146$
LIABILITIESAccounts payable -$ -$ -$ 15,099$ 48,465$ -$ 4,795$ 68,359$ 80,916$ Retainages payable - - - - 14,316 - - 14,316 14,316 Due to other funds - - - - - - - - 22,558 Accrued liabilities - - - - - - - - 17,793
Total liabilities - - - 15,099 62,781 - 4,795 82,675 135,583
FUND BALANCESRestricted:
Public safety - - - - - - - - 863,291 Transportation - - - - 527,987 - - 527,987 527,987 Capital projects - - - - 161,436 - - 161,436 161,436 Debt service 275,871 76,234 352,105 - - - - - 352,105 Impact fees - - - - - - - - 353,758 Donations received - - - - - - - - 170,566 Special assessments - - - - - - - - 138,851
Assigned:Parks and recreation - - - - - - - - 18,954 Other capital projects - - - 948,369 85,650 50,316 442,280 1,526,615 1,526,615
Total fund balances 275,871 76,234 352,105 948,369 775,073 50,316 442,280 2,216,038 4,113,563
Total liabilities and fund balances
275,871$ 76,234$ 352,105$ 963,468$ 837,854$ 50,316$ 447,075$ 2,298,713$ 4,249,146$
124

CITY OF SANIBEL, FLORIDA COMBINING STATEMENT OF REVENUES, EXPENDITURES AND CHANGES IN FUND BALANCES
NONMAJOR GOVERNMENTAL FUNDS For the Year Ended September 30, 2014
Special RevenueSanibel
Elementary Sanibel Isles/Water Community Father School Shell Estates WaterQuality Historical Road Park Madden Building Ball Park Harbor Canal Shadows
Education Committee Impact Fees Impact Fees Estate Department Maintenance Dredging Trimming Dredging TotalREVENUES
TaxesProperty -$ -$ -$ -$ -$ -$ -$ -$ -$ -$ -$
Licenses and permits - - - - - 626,961 - - - - 626,961 Intergovernmental revenue 10,000 - - - - - 141,381 - - - 151,381 Charges for services - - - - - 9,808 - - - - 9,808 Fines and forfeitures - - - - - 22,779 - - - - 22,779 Other revenue - 2,423 123,942 15,394 426 13,903 - 20,732 7,178 11,024 195,022
Total revenues 10,000 2,423 123,942 15,394 426 673,451 141,381 20,732 7,178 11,024 1,005,951
EXPENDITURESCurrent
General government - - - - - - - - - - - Public safety - - - - - 683,799 - - - - 683,799 Physical environment 38,500 - - - - - - - - - 38,500 Transportation - - - - - - - 43,749 7,288 239 51,276 Human services - - - - 1,000 - - - - - 1,000 Culture/recreation - - - - - - 255,204 - - - 255,204
Debt ServicePrincipal retirement - - - - - - - - - - - Interest & fiscal charges - - - - - - - - - - -
Capital outlay - - - - - 1,049 36,000 - - - 37,049 Total expenditures 38,500 - - - 1,000 684,848 291,204 43,749 7,288 239 1,066,828
Excess (deficiency) of revenue over
(28,500) 2,423 123,942 15,394 (574) (11,397) (149,823) (23,017) (110) 10,785 (60,877)
OTHER FINANCING SOURCES (USES)Transfers in - - - - - - 165,159 50,445 3,000 5,000 223,604 Transfers out - - - - - - - - - - -
Total other financing sources (uses) - - - - - - 165,159 50,445 3,000 5,000 223,604
Net change in fund balances (28,500) 2,423 123,942 15,394 (574) (11,397) 15,336 27,428 2,890 15,785 162,727
Fund balances:Beginning of year 28,500 142,907 140,953 73,469 25,810 874,688 3,618 13,042 15,740 63,966 1,382,693
End of year -$ 145,330$ 264,895$ 88,863$ 25,236$ 863,291$ 18,954$ 40,470$ 18,630$ 79,751$ 1,545,420$
125

CITY OF SANIBEL, FLORIDACOMBINING STATEMENT OF REVENUES, EXPENDITURES AND CHANGES IN FUND BALANCES (Continued)
NONMAJOR GOVERNMENTAL FUNDSFor the Year Ended September 30, 2014
Capital Projects TOTAL
2012 $2.97M 2006 $8.35M Periwinkle RecreationGeneral General Capital Transportation Bike Path & Facility Nonmajor
Obligation Obligation Asset Capital Road Sinking GovernmentalBonds Bond Total Acquisition Projects Project Fund Total Funds
REVENUESTaxes
Property 339,984$ 510,517$ 850,501$ -$ -$ -$ -$ -$ 850,501$ Licenses and permits - - - - - - - - 626,961 Intergovernmental revenue - - - 2,799 1,067,876 - - 1,070,675 1,222,056 Charges for services - - - - - - - - 9,808 Fines and forfeitures - - - - - - - - 22,779 Other revenue 11,632 5,222 16,854 15,277 200,799 3,784 7,540 227,400 439,276
Total revenues 351,616 515,739 867,355 18,076 1,268,675 3,784 7,540 1,298,075 3,171,381
EXPENDITURESCurrent
General government - - - 60,528 - - - 60,528 60,528 Public safety - - - - - - - - 683,799 Physical environment - - - - - - - - 38,500 Transportation - - - - 168,128 4,055 - 172,183 223,459 Human services - - - - - - - - 1,000 Culture/recreation - - - 112,038 - - 13,561 125,599 380,803
Debt ServicePrincipal retirement 280,000 200,000 480,000 - - - - - 480,000 Interest & fiscal charges 55,890 304,446 360,336 - - - - - 360,336
Capital outlay - - - 115,056 196,990 422,118 8,520 742,684 779,733 Total expenditures 335,890 504,446 840,336 287,622 365,118 426,173 22,081 1,100,994 3,008,158
Excess (deficiency) of revenue over
15,726 11,293 27,019 (269,546) 903,557 (422,389) (14,541) 197,081 163,223
OTHER FINANCING SOURCES (USES)Transfers in - - - 528,269 9,092 - 13,081 550,442 774,046 Transfers out - - - (70,000) (400,000) (15,815) - (485,815) (485,815)
Total other financing sources (uses) - - - 458,269 (390,908) (15,815) 13,081 64,627 288,231
Net change in fund balances 15,726 11,293 27,019 188,723 512,649 (438,204) (1,460) 261,708 451,454
Fund balances:Beginning of year 260,145 64,941 325,086 759,646 262,424 488,520 443,740 1,954,330 3,662,109
End of year 275,871$ 76,234$ 352,105$ 948,369$ 775,073$ 50,316$ 442,280$ 2,216,038$ 4,113,563$
Debt Service
126

CITY OF SANIBEL, FLORIDA SCHEDULE OF REVENUES, EXPENDITURES AND CHANGES IN FUND BALANCE
BUDGET AND ACTUAL – NON-MAJOR FUNDS For the Fiscal Year Ended September 30, 2014
__________________________________________________________________________________________
Variance withOriginal Final Actual Final Budget
REVENUESIntergovernmental -$ 10,000$ 10,000$ -$ Other revenue - - - -
Total revenues - 10,000 10,000 -
EXPENDITURESTotal expenditures - 38,500 38,500 -
Excess (deficiency) of revenue over (under) expenditures - (28,500) (28,500) -
Net change in fund balances - (28,500) (28,500) -
Fund balances, beginning of year - 28,500 28,500 -
Fund balances, end of year -$ -$ -$ -$
Budgets
Water Quality Education Fund
Variance withOriginal Final Actual Final Budget
REVENUESOther revenue 2,200$ 2,200$ 2,423$ 223$
EXPENDITURESTotal expenditures - - - -
Excess (deficiency) of revenue over (under) expenditures 2,200 2,200 2,423 223
Net change in fund balances 2,200 2,200 2,423 223
Fund balances, beginning of year 142,808 142,907 142,907 -
Fund balances, end of year 145,008$ 145,107$ 145,330$ 223$
Budgets
Historical Committee Fund
127

CITY OF SANIBEL, FLORIDA SCHEDULE OF REVENUES, EXPENDITURES AND CHANGES IN FUND BALANCE
BUDGET AND ACTUAL – NON-MAJOR FUNDS For the Fiscal Year Ended September 30, 2014
__________________________________________________________________________________________
Variance withOriginal Final Actual Final Budget
REVENUESOther revenue 76,500$ 122,118$ 123,942$ 1,824$
EXPENDITURESTotal expenditures - - - -
Excess (deficiency) of revenue over (under) expenditures 76,500 122,118 123,942 1,824
Net change in fund balances 76,500 122,118 123,942 1,824
Fund balances, beginning of year 128,942 140,953 140,953 -
Fund balances, end of year 205,442$ 263,071$ 264,895$ 1,824$
Budgets
Road Impact Fees Fund
Variance withOriginal Final Actual Final Budget
REVENUESOther revenue 7,925$ 14,465$ 15,394$ 929$
EXPENDITURESTotal expenditures - - - -
Excess (deficiency) of revenue over (under) expenditures 7,925 14,465 15,394 929
OTHER FINANCING SOURCES (USES)Transfers out - - - -
Net change in fund balances 7,925 14,465 15,394 929
Fund balances, beginning of year 16,460 73,469 73,469 -
Fund balances, end of year 24,385$ 87,934$ 88,863$ 929$
Budgets
Community Park Impact Fees Fund
128

CITY OF SANIBEL, FLORIDA SCHEDULE OF REVENUES, EXPENDITURES AND CHANGES IN FUND BALANCE
BUDGET AND ACTUAL – NON-MAJOR FUNDS For the Fiscal Year Ended September 30, 2014
__________________________________________________________________________________________
Variance withOriginal Final Actual Final Budget
REVENUESOther revenue 308$ 308$ 426$ 118$
EXPENDITURESCurrent
Human Services 1,000 1,000 1,000 -
Excess (deficiency) of revenue over (under) expenditures (692) (692) (574) 118
Net change in fund balances (692) (692) (574) 118
Fund balances, beginning of year 25,685 25,810 25,810 -
Fund balances, end of year 24,993$ 25,118$ 25,236$ 118$
Budgets
Father Madden Estate Fund
Variance withOriginal Final Actual Final Budget
REVENUESLicenses & Permits 544,269$ 601,334$ 626,961$ 25,627$ Charges for services 10,000 10,000 9,808 (192) Fines and forfeitures 30,000 30,000 22,779 (7,221) Other revenue 9,354 9,354 13,903 4,549
Total revenues 593,623 650,688 673,451 22,763
EXPENDITURESCurrent
Public safety 687,172 696,407 683,799 12,608 Capital Outlay 10,000 12,500 1,049 11,451
Total expenditures 697,172 708,907 684,848 24,059
Excess (deficiency) of revenue over (under) expenditures (103,549) (58,219) (11,397) 46,822
Net change in fund balances (103,549) (58,219) (11,397) 46,822
Fund balances, beginning of year 779,530 874,688 874,688 -
Fund balances, end of year 675,981$ 816,469$ 863,291$ 46,822$
Budgets
Building Department Fund
129

CITY OF SANIBEL, FLORIDA SCHEDULE OF REVENUES, EXPENDITURES AND CHANGES IN FUND BALANCE
BUDGET AND ACTUAL – NON-MAJOR FUNDS For the Fiscal Year Ended September 30, 2014
__________________________________________________________________________________________
Variance withOriginal Final Actual Final Budget
REVENUESIntergovernmental 129,374$ 139,990$ 141,381$ 1,391$ Other revenue 175 175 - (175)
Total revenues 129,549 140,165 141,381 1,216
EXPENDITURESCurrent
Culture/recreation 244,450 269,350 255,204 14,146 Capital Outlay 86,000 36,000 36,000 -
Total expenditures 330,450 305,350 291,204 14,146
Excess (deficiency) of revenue over (under) expenditures (200,901) (165,185) (149,823) 15,362
OTHER FINANCING SOURCES (USES)Transfer in 155,875 165,159 165,159 -
Net change in fund balances (45,026) (26) 15,336 15,362
Fund balances, beginning of year 45,026 3,618 3,618 -
Fund balances, end of year -$ 3,592$ 18,954$ 15,362$
Budgets
Elementary School Ball Park Maintenance Fund
Variance withOriginal Final Actual Final Budget
REVENUESOther revenue 17,589$ 20,589$ 20,732$ 143$
EXPENDITURESCurrent
Transportation - 45,821 43,749 2,072
Excess (deficiency) of revenue over (under) expenditures 17,589 (25,232) (23,017) 2,215
OTHER FINANCING SOURCES (USES)Transfer in 5,445 50,445 50,445 -
Net change in fund balances 23,034 25,213 27,428 2,215
Fund balances, beginning of year 12,921 13,042 13,042 -
Fund balances, end of year 35,955$ 38,255$ 40,470$ 2,215$
Budgets
Shell Harbor Dredging Fund
130

CITY OF SANIBEL, FLORIDA SCHEDULE OF REVENUES, EXPENDITURES AND CHANGES IN FUND BALANCE
BUDGET AND ACTUAL – NON-MAJOR FUNDS For the Fiscal Year Ended September 30, 2014
__________________________________________________________________________________________
Variance withOriginal Final Actual Final Budget
REVENUESOther revenue 7,115$ 7,115$ 7,178$ 63$
EXPENDITURESCurrent
Transportation 10,315 10,315 7,288 3,027
Excess (deficiency) of revenue over (under) expenditures (3,200) (3,200) (110) 3,090
OTHER FINANCING SOURCES (USES)Transfers in 3,000 3,000 3,000 -
Net change in fund balances (200) (200) 2,890 3,090
Fund balances, beginning of year 15,569 15,740 15,740 -
Fund balances, end of year 15,369$ 15,540$ 18,630$ 3,090$
Budgets
Sanibel Estates Canal Trimming Fund
Variance withOriginal Final Actual Final Budget
REVENUESOther revenue 10,441$ 10,441$ 11,024$ 583$
EXPENDITURESCurrent
Transportation 245 245 239 6
Excess (deficiency) of revenue over (under) expenditures 10,196 10,196 10,785 589
OTHER FINANCING SOURCES (USES)Transfers in 5,000 5,000 5,000 -
Net change in fund balances 15,196 15,196 15,785 589
Fund balances, beginning of year 63,818 63,966 63,966 -
Fund balances, end of year 79,014$ 79,162$ 79,751$ 589$
Budgets
Sanibel Isles/Water Shadows Dredging Fund
131

CITY OF SANIBEL, FLORIDA SCHEDULE OF REVENUES, EXPENDITURES AND CHANGES IN FUND BALANCE
BUDGET AND ACTUAL – NON-MAJOR FUNDS For the Fiscal Year Ended September 30, 2014
__________________________________________________________________________________________
Variance withOriginal Final Actual Final Budget
REVENUESTaxes 339,425$ 339,425$ 339,984$ 559$ Other revenue 12,000 12,000 11,632 (368)
Total revenues 351,425 351,425 351,616 191
EXPENDITURESDebt Service
Principal retirement 280,000 280,000 280,000 - Interest and fiscal charges 55,890 55,890 55,890 -
Total expenditures 335,890 335,890 335,890 -
Excess (deficiency) of revenue over (under) expenditures 15,535 15,535 15,726 191
Net change in fund balances 15,535 15,535 15,726 191
Fund balances, beginning of year 278,842 260,145 260,145 -
Fund balances, end of year 294,377$ 275,680$ 275,871$ 191$
Budgets
2012 $2.97M General Obligation Bonds Fund
Variance withOriginal Final Actual Final Budget
REVENUESTaxes 509,722$ 509,722$ 510,517$ 795$ Other revenue 7,500 7,500 5,222 (2,278)
Total revenues 517,222 517,222 515,739 (1,483)
EXPENDITURESDebt Service
Principal retirement 200,000 200,000 200,000 - Interest and fiscal charges 304,412 304,462 304,446 16
Total expenditures 504,412 504,462 504,446 16
Excess (deficiency) of revenue over (under) expenditures 12,810 12,760 11,293 (1,467)
Net change in fund balances 12,810 12,760 11,293 (1,467)
Fund balances, beginning of year 62,329 64,941 64,941 -
Fund balances, end of year 75,139$ 77,701$ 76,234$ (1,467)$
Budgets
2006 $8.35M General Obligation Bonds Fund
132

CITY OF SANIBEL, FLORIDA SCHEDULE OF REVENUES, EXPENDITURES AND CHANGES IN FUND BALANCE
BUDGET AND ACTUAL – NON-MAJOR FUNDS For the Fiscal Year Ended September 30, 2014
__________________________________________________________________________________________
Variance withOriginal Final Actual Final Budget
REVENUESIntergovernmental -$ 2,799$ 2,799$ -$ Other revenue 7,000 7,000 15,277 8,277
Total revenues 7,000 9,799 18,076 8,277
EXPENDITURESCurrent
General government - 40,224 60,528 (20,304) Culture/recreation - - 112,038 (112,038)
Capital Outlay 1,151,302 788,086 115,056 673,030 Total expenditures 1,151,302 828,310 287,622 540,688
Excess (deficiency) of revenue over (under) expenditures (1,144,302) (818,511) (269,546) 548,965 OTHER FINANCING SOURCES (USES)
Transfers in 528,269 528,269 528,269 - Transfers out - (70,000) (70,000) -
Total other financing sources (uses) 528,269 458,269 458,269 - Net change in fund balances (616,033) (360,242) 188,723 548,965
Fund balances, beginning of year 616,033 759,646 759,646 - Fund balances, end of year -$ 399,404$ 948,369$ 548,965$
Budgets
Capital Asset Acquisition Fund
Variance withOriginal Final Actual Final Budget
REVENUESIntergovernmental -$ 1,065,780$ 1,067,876$ 2,096$ Other revenue 2,000 183,976 200,799 16,823
Total revenues 2,000 1,249,756 1,268,675 18,919 EXPENDITURES
CurrentTransportation - - 168,128 (168,128)
Capital Outlay 230,000 385,497 196,990 188,507 Total expenditures 230,000 385,497 365,118 20,379
Excess (deficiency) of revenue over (under) expenditures (228,000) 864,259 903,557 39,298 OTHER FINANCING SOURCES (USES)
Transfer in - 9,092 9,092 - Transfers out - (400,000) (400,000) -
Total other financing sources (uses) - (390,908) (390,908) - Net change in fund balances (228,000) 473,351 512,649 39,298 Fund balances, beginning of year 228,000 262,424 262,424 - Fund balances, end of year -$ 735,775$ 775,073$ 39,298$
Budgets
Transportation Capital Projects Fund
133

CITY OF SANIBEL, FLORIDA SCHEDULE OF REVENUES, EXPENDITURES AND CHANGES IN FUND BALANCE
BUDGET AND ACTUAL – NON-MAJOR FUNDS For the Fiscal Year Ended September 30, 2014
__________________________________________________________________________________________
Variance withOriginal Final Actual Final Budget
REVENUESOther revenue -$ -$ 3,784$ 3,784$
EXPENDITURESCurrent
Transportation - 4,055 4,055 - Capital Outlay 500,000 422,119 422,118 1
Total expenditures 500,000 426,174 426,173 1
Excess (deficiency) of revenue over (under) expenditures (500,000) (426,174) (422,389) 3,785
OTHER FINANCING SOURCES (USES)Transfers out (15,815) (15,815) (15,815) -
Net change in fund balances (515,815) (441,989) (438,204) 3,785 Fund balances, beginning of year 515,815 488,520 488,520 - Fund balances, end of year -$ 46,531$ 50,316$ 3,785$
Budgets
Periwinkle Bike Path & Road Project Fund
Variance withOriginal Final Actual Final Budget
REVENUESOther revenue 2,211$ 2,211$ 7,540$ 5,329$
EXPENDITURESCurrent
Culture/recreation - - 13,561 (13,561) Capital Outlay 80,200 47,281 8,520 38,761
Total expenditures 80,200 47,281 22,081 25,200
Excess (deficiency) of revenue over (under) expenditures (77,989) (45,070) (14,541) 30,529
OTHER FINANCING SOURCES (USES)Transfer in - 13,081 13,081 -
Net change in fund balances (77,989) (31,989) (1,460) 30,529 Fund balances, beginning of year 442,200 443,740 443,740 - Fund balances, end of year 364,211$ 411,751$ 442,280$ 30,529$
Budgets
Recreation Facility Sinking Fund
134

Trust funds are used to account for the assets of the public employee retirement systems Combining Statement of Net Position – Fiduciary Funds .................................. 136 Combining Statement of Changes in Net Position – Fiduciary Funds ............... 137
Agency funds are used to account for assets held by the City in the capacity of an agent for other governments, private organizations or individuals. Combining Statement of Changes in Assets and Liabilities – Agency Funds ................................................................................................. 138
FIDUCIA
RYFU
NDS
135

CITY OF SANIBEL, FLORIDA COMBINING STATEMENT OF NET POSITION
FIDUCIARY FUNDS September 30, 2014
__________________________________________________________________________________________
Municipal TotalGeneral Police Trust
Employees' Officers' FundsASSETS
Cash and cash equivalents 589,157$ 183,179$ 772,336$
Investments, at market valueTreasury inflation protection securities 497,333 - 497,333 US government and agencies securities 1,264,174 - 1,264,174 Corporate stocks 8,005,387 - 8,005,387 Corporate bonds 4,020,146 - 4,020,146 Convertibles 2,090,118 1,554,355 3,644,473 Master Limited Partnerships 1,385,665 1,261,332 2,646,997 Mutual Funds
Fixed income - 4,144,991 4,144,991 Equity 1,716,851 5,560,569 7,277,420 International equity 3,655,989 2,355,221 6,011,210
Real estate investments trusts - 738,402 738,402 Real estate commingled fund 942,627 - 942,627
Total investments at fair value 23,578,290 15,614,870 39,193,160
Receivables - contributions - 45,438 45,438 Receivables - interest & dividends 66,791 19,183 85,974
Total assets 24,234,238 15,862,670 40,096,908
LIABILITIESAccrued benefits and other liabilities 20,428 6,142 26,570
Total liabilities 20,428 6,142 26,570
NET POSITIONNet position restricted for pensions 24,213,810$ 15,856,528$ 40,070,338$
Pension Trust Funds
136

CITY OF SANIBEL, FLORIDA COMBINING STATEMENT OF CHANGES IN NET POSITION
FIDUCIARY FUNDS For the Fiscal Year Ended September 30, 2014
__________________________________________________________________________________________
Municipal TotalGeneral Police Trust
Employees' Officers' FundsADDITIONS
ContributionsEmployer 1,681,948$ 961,952$ 2,643,900$ State of Florida - 65,862 65,862 Plan members 65,431 114,679 180,110
Total contributions 1,747,379 1,142,493 2,889,872
Investment incomeNet appreciation in fair value of investments 1,874,364 1,092,960 2,967,324 Interest, dividends and other 691,922 530,399 1,222,321
Total investment earnings 2,566,286 1,623,359 4,189,645
Less investment expense (141,895) (58,510) (200,405)
Net investment earnings 2,424,391 1,564,849 3,989,240
Total additions 4,171,770 2,707,342 6,879,112
DEDUCTIONSBenefits paid 1,276,944 694,792 1,971,736 Lump sum DROP disbursement - 49,635 49,635 Refunds of contributions - 7,455 7,455 Administrative expenses 27,489 38,332 65,821
Total deductions 1,304,433 790,214 2,094,647
Change in net position 2,867,337 1,917,128 4,784,465
Net position - beginning of year As previously reported 21,283,849 13,618,254 34,902,103 Adjustment (See Note #20) 62,624 321,146 383,770
Net position - beginning of year as restated 21,346,473 13,939,400 35,285,873
Net position - end of year 24,213,810$ 15,856,528$ 40,070,338$
Pension Trust Funds
137
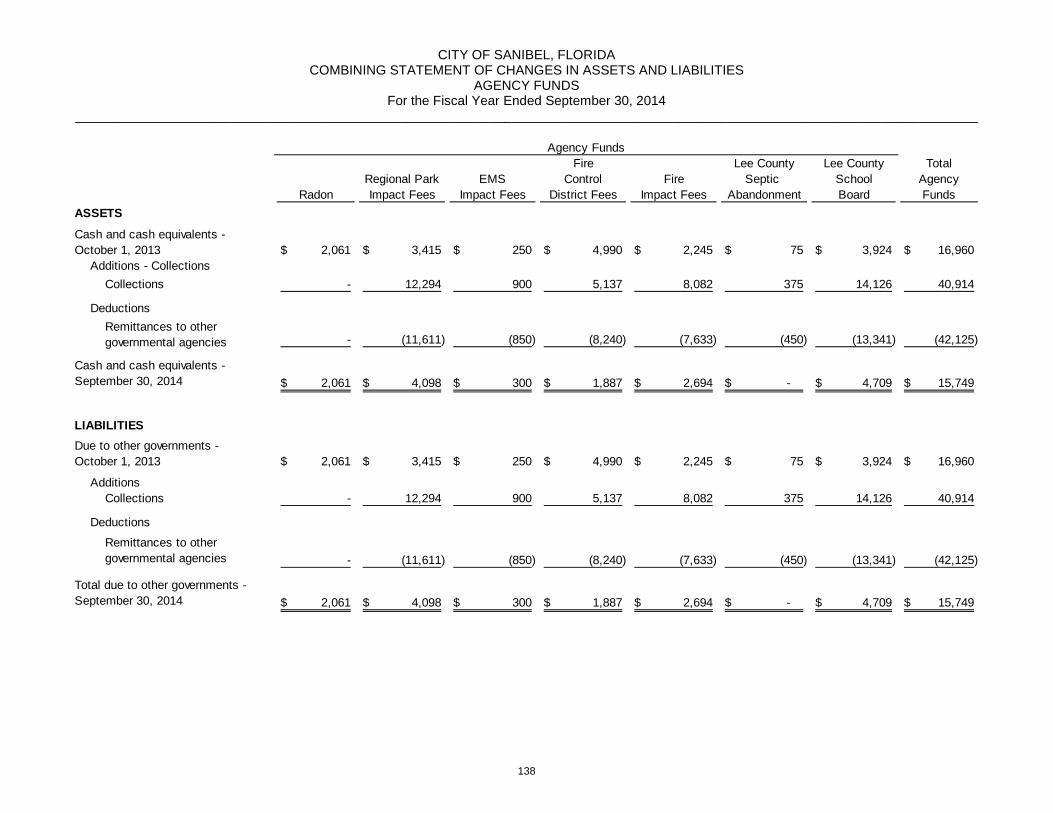
CITY OF SANIBEL, FLORIDA COMBINING STATEMENT OF CHANGES IN ASSETS AND LIABILITIES
AGENCY FUNDS For the Fiscal Year Ended September 30, 2014
__________________________________________________________________________________________________________________________
Fire Lee County Lee County TotalRegional Park EMS Control Fire Septic School Agency
Radon Impact Fees Impact Fees District Fees Impact Fees Abandonment Board Funds
2,061$ 3,415$ 250$ 4,990$ 2,245$ 75$ 3,924$ 16,960$ Additions - Collections
Collections - 12,294 900 5,137 8,082 375 14,126 40,914
DeductionsRemittances to other governmental agencies - (11,611) (850) (8,240) (7,633) (450) (13,341) (42,125)
2,061$ 4,098$ 300$ 1,887$ 2,694$ -$ 4,709$ 15,749$
2,061$ 3,415$ 250$ 4,990$ 2,245$ 75$ 3,924$ 16,960$
AdditionsCollections - 12,294 900 5,137 8,082 375 14,126 40,914
Deductions
Remittances to other governmental agencies - (11,611) (850) (8,240) (7,633) (450) (13,341) (42,125)
2,061$ 4,098$ 300$ 1,887$ 2,694$ -$ 4,709$ 15,749$ Total due to other governments - September 30, 2014
Due to other governments -October 1, 2013
Agency Funds
Cash and cash equivalents -October 1, 2013
Cash and cash equivalents - September 30, 2014
ASSETS
LIABILITIES
138

This part of the City of Sanibel’s Comprehensive Annual Financial Report presents historical and comparative information to provide a context for understanding the information in the financial statements, note disclosures and required supplementary information as well as the City’s overall financial health. Financial Trends These schedules contain trend information to help the reader understand how the City’s financial performance and well-being have changed over time. Net Position by Component ......................................................................................................... 140 Changes in Net Position ............................................................................................................... 141 Fund Balances of Governmental Funds ...................................................................................... 143 Changes in Fund Balance of Governmental Funds ..................................................................... 144 Tax Revenue by Source – Governmental Funds ......................................................................... 145 Revenue Capacity These schedules contain information to help the reader assess the factors affecting the City’s ability to generate its property and sales taxes. Assessed and Estimated Actual Value of Taxable Property ........................................................ 146 Direct and Overlapping Property Tax Rates ................................................................................ 147 Principal Property Taxpayers ....................................................................................................... 148 Property Tax Levies and Collections ........................................................................................... 149 Sanibel Sewer System Sewer Rates ........................................................................................... 150 Debt Capacity These schedules present information to help the reader assess the affordability of the City’s current levels of outstanding debt and the City’s ability to issue additional debt in the future (NOTE: Legal Debt Margin Information omitted as per Florida State Statutes, §200.181 and the City of Sanibel Code of Ordinances, there are no legal debt limits). Ratios of Outstanding Debt by Type ............................................................................................ 151 Ratios of General Bonded Debt Outstanding ............................................................................... 152 Direct and Overlapping Governmental Activities Debt ................................................................. 153 Wastewater Revenue Bond Coverage ......................................................................................... 154 Wastewater Revenue Note Coverage ......................................................................................... 155 Demographic and Economic Information These schedules offer demographic and economic indicators to help the reader understand the environment within which the City’s financial activities take place and to help make comparisons over time and with other governments. Demographic and Economic Statistics ........................................................................................ 156 Principal Employers ..................................................................................................................... 157 Operating Information These schedules contain information about the City’s operations and resources to help the reader understand how the City’s financial information relates to the services the City provides and the activities it performs. Full-time Equivalent City Government Employees by Function/Program .................................... 158 Operating Indicators by Function/Program .................................................................................. 159 Capital Asset Statistics by Function/Program .............................................................................. 160 Schedule of Insurance Coverage ................................................................................................. 161 Sources: Unless otherwise noted, the information in these schedules is derived from the City’s Comprehensive Annual Financial Reports for the relevant year. The City implemented GASB Statement 54 in fiscal year 2010, therefore, fiscal year 2009 data was restated for GASB 54 comparable presentation on the Fund Balances of Governmental Funds schedule.
STATIST
ICALSECT
ION
139

CITY OF SANIBEL, FLORIDA NET POSITION BY COMPONENT
LAST TEN FISCAL YEARS (accrual basis of accounting)
__________________________________________________________________________________________________________________________
Fiscal Year2014 2013 2012 2011 2010 2009 2008 2007 2006 2005
Governmental activities
Net investment in capital assets 37,809,068$ 38,084,139$ 38,489,185$ 38,851,134$ 38,368,735$ 35,796,393$ 36,345,476$ 34,442,658$ 22,258,204$ 28,657,933$
Restricted 3,088,775 2,412,824 2,321,002 2,276,723 1,924,988 4,045,391 4,544,823 6,406,164 11,904,294 5,887,726
Unrestricted 4,085,080 20,959,613 22,207,926 21,852,858 21,568,122 19,867,426 16,086,510 14,871,818 11,072,686 7,490,429
Total governmental activities net position 44,982,923 61,456,576 63,018,113 62,980,715 61,861,845 59,709,210 56,976,809 55,720,640 45,235,184 42,036,088
Business-type activities
Net investment in capital assets 22,473,067 21,561,359 21,228,648 21,085,016 17,991,148 17,037,477 10,783,538 8,052,663 7,616,345 8,262,922
Restricted 7,178,063 8,708,211 9,510,488 10,441,174 11,678,522 12,672,286 16,000,958 20,479,404 21,177,136 23,593,619
Unrestricted 4,555,122 4,353,893 3,124,595 1,693,021 2,792,034 1,810,124 2,796,975 360,675 (1,224,515) (3,497,749)
Total business-type activities net position 34,206,252 34,623,463 33,863,731 33,219,211 32,461,704 31,519,887 29,581,471 28,892,742 27,568,966 28,358,792
Primary government
Net investment in capital assets 60,282,135 59,645,498 59,717,833 59,936,150 56,359,883 52,833,870 42,495,321 42,495,321 29,874,549 36,920,855
Restricted 10,266,838 11,121,035 11,831,490 12,717,897 13,603,510 16,717,677 26,885,568 26,885,568 33,081,430 29,481,345
Unrestricted 8,640,202 25,313,506 25,332,521 23,545,879 24,360,156 21,677,550 15,232,493 15,232,493 9,848,171 3,992,680
Total primary government net position 79,189,175$ 96,080,039$ 96,881,844$ 96,199,926$ 94,323,549$ 91,229,097$ 86,558,280$ 84,613,382$ 72,804,150$ 70,394,880$
140
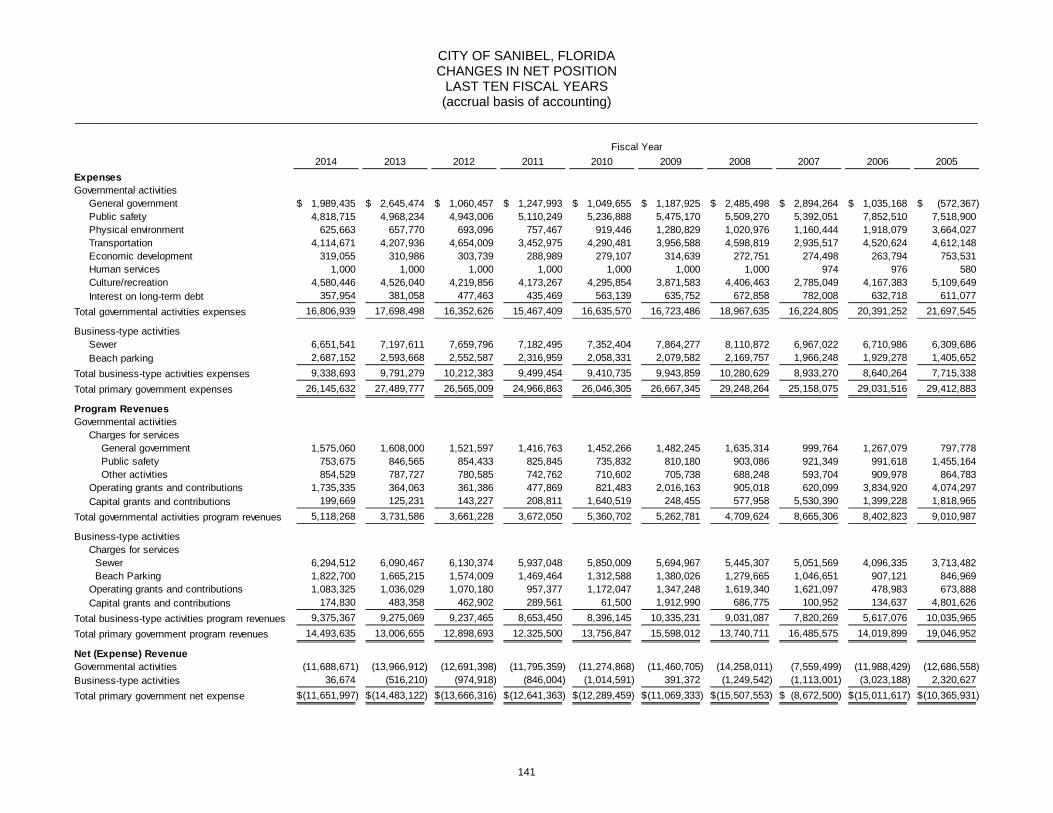
CITY OF SANIBEL, FLORIDA CHANGES IN NET POSITION
LAST TEN FISCAL YEARS (accrual basis of accounting)
__________________________________________________________________________________________________________________________
2014 2013 2012 2011 2010 2009 2008 2007 2006 2005ExpensesGovernmental activities
General government 1,989,435$ 2,645,474$ 1,060,457$ 1,247,993$ 1,049,655$ 1,187,925$ 2,485,498$ 2,894,264$ 1,035,168$ (572,367)$ Public safety 4,818,715 4,968,234 4,943,006 5,110,249 5,236,888 5,475,170 5,509,270 5,392,051 7,852,510 7,518,900 Physical environment 625,663 657,770 693,096 757,467 919,446 1,280,829 1,020,976 1,160,444 1,918,079 3,664,027 Transportation 4,114,671 4,207,936 4,654,009 3,452,975 4,290,481 3,956,588 4,598,819 2,935,517 4,520,624 4,612,148 Economic development 319,055 310,986 303,739 288,989 279,107 314,639 272,751 274,498 263,794 753,531 Human services 1,000 1,000 1,000 1,000 1,000 1,000 1,000 974 976 580 Culture/recreation 4,580,446 4,526,040 4,219,856 4,173,267 4,295,854 3,871,583 4,406,463 2,785,049 4,167,383 5,109,649 Interest on long-term debt 357,954 381,058 477,463 435,469 563,139 635,752 672,858 782,008 632,718 611,077
Total governmental activities expenses 16,806,939 17,698,498 16,352,626 15,467,409 16,635,570 16,723,486 18,967,635 16,224,805 20,391,252 21,697,545
Business-type activitiesSewer 6,651,541 7,197,611 7,659,796 7,182,495 7,352,404 7,864,277 8,110,872 6,967,022 6,710,986 6,309,686 Beach parking 2,687,152 2,593,668 2,552,587 2,316,959 2,058,331 2,079,582 2,169,757 1,966,248 1,929,278 1,405,652
Total business-type activities expenses 9,338,693 9,791,279 10,212,383 9,499,454 9,410,735 9,943,859 10,280,629 8,933,270 8,640,264 7,715,338 Total primary government expenses 26,145,632 27,489,777 26,565,009 24,966,863 26,046,305 26,667,345 29,248,264 25,158,075 29,031,516 29,412,883
Program RevenuesGovernmental activities
Charges for services General government 1,575,060 1,608,000 1,521,597 1,416,763 1,452,266 1,482,245 1,635,314 999,764 1,267,079 797,778 Public safety 753,675 846,565 854,433 825,845 735,832 810,180 903,086 921,349 991,618 1,455,164 Other activities 854,529 787,727 780,585 742,762 710,602 705,738 688,248 593,704 909,978 864,783 Operating grants and contributions 1,735,335 364,063 361,386 477,869 821,483 2,016,163 905,018 620,099 3,834,920 4,074,297 Capital grants and contributions 199,669 125,231 143,227 208,811 1,640,519 248,455 577,958 5,530,390 1,399,228 1,818,965
Total governmental activities program revenues 5,118,268 3,731,586 3,661,228 3,672,050 5,360,702 5,262,781 4,709,624 8,665,306 8,402,823 9,010,987
Business-type activitiesCharges for services Sewer 6,294,512 6,090,467 6,130,374 5,937,048 5,850,009 5,694,967 5,445,307 5,051,569 4,096,335 3,713,482 Beach Parking 1,822,700 1,665,215 1,574,009 1,469,464 1,312,588 1,380,026 1,279,665 1,046,651 907,121 846,969 Operating grants and contributions 1,083,325 1,036,029 1,070,180 957,377 1,172,047 1,347,248 1,619,340 1,621,097 478,983 673,888 Capital grants and contributions 174,830 483,358 462,902 289,561 61,500 1,912,990 686,775 100,952 134,637 4,801,626
Total business-type activities program revenues 9,375,367 9,275,069 9,237,465 8,653,450 8,396,145 10,335,231 9,031,087 7,820,269 5,617,076 10,035,965 Total primary government program revenues 14,493,635 13,006,655 12,898,693 12,325,500 13,756,847 15,598,012 13,740,711 16,485,575 14,019,899 19,046,952
Net (Expense) RevenueGovernmental activities (11,688,671) (13,966,912) (12,691,398) (11,795,359) (11,274,868) (11,460,705) (14,258,011) (7,559,499) (11,988,429) (12,686,558) Business-type activities 36,674 (516,210) (974,918) (846,004) (1,014,591) 391,372 (1,249,542) (1,113,001) (3,023,188) 2,320,627 Total primary government net expense (11,651,997)$ (14,483,122)$ (13,666,316)$ (12,641,363)$ (12,289,459)$ (11,069,333)$ (15,507,553)$ (8,672,500)$ (15,011,617)$ (10,365,931)$
Fiscal Year
141

CITY OF SANIBEL, FLORIDA CHANGES IN NET POSITION (Continued)
LAST TEN FISCAL YEARS (accrual basis of accounting)
__________________________________________________________________________________________________________________________
2014 2013 2012 2011 2010 2009 2008 2007 2006 2005General Revenues and Other Changes in
Net PositionGovernmental activities
Taxes Property taxes, levied for general purpose 8,253,344$ 8,283,542$ 8,460,871$ 8,742,177$ 9,372,184$ 10,175,612$ 11,004,197$ 11,973,525$ 9,716,569$ 10,198,461$ Property taxes, levied for debt service 850,501 853,159 748,558 755,021 753,285 737,735 735,097 775,976 239,383 248,668 Gas taxes 1,534,406 1,478,765 1,408,442 1,418,333 1,433,690 1,480,460 1,524,191 1,632,569 1,639,149 1,574,183 Local business taxes 284,521 284,903 289,220 290,214 291,395 293,393 290,066 656,936 583,452 478,475 Communications taxes 568,157 576,179 550,011 540,080 558,375 529,114 599,970 556,781 523,691 511,747 Casualty insurance premium tax - 62,542 63,574 57,487 58,716 57,459 53,654 50,726 98,026 - Intergovernmental revenues 657,804 614,949 581,420 554,641 526,046 676,646 825,679 945,322 1,031,166 873,700 Investment earnings 135,333 31,057 303,612 251,382 196,471 (15,420) 319,991 1,329,759 1,022,009 515,342 Gain (Loss) on Disposal of Assets - - - - - - (11,581) - - - Miscellaneous 443,333 220,279 323,088 304,894 237,341 258,107 347,918 192,710 334,080 843,638 Transfers (126,975) - - - - - (175,002) (69,349) - -
Total governmental activities 12,600,424 12,405,375 12,728,796 12,914,229 13,427,503 14,193,106 15,514,180 18,044,955 15,187,525 15,244,214
Business-type activitiesTaxes Property taxes, levied for debt service 907,735 949,124 949,140 1,007,540 1,241,407 1,244,143 1,175,625 1,131,789 1,019,678 925,113 Investment earnings 360,330 326,818 670,298 582,775 715,001 302,901 576,004 730,259 1,213,684 471,952 Gain (Loss) on Disposal of Assets - - - - - - 11,640 - - - Miscellaneous - - - 13,196 - - - 505,380 - - Transfers 126,975 - - - - - 175,002 69,349 - -
Total business-type activities 1,395,040 1,275,942 1,619,438 1,603,511 1,956,408 1,547,044 1,938,271 2,436,777 2,233,362 1,397,065 Total primary government 13,995,464 13,681,317 14,348,234 14,517,740 15,383,911 15,740,150 17,452,451 20,481,732 17,420,887 16,641,279
Change in Net PositionGovernmental activities 911,753 (1,561,537) 37,398 1,118,870 2,152,635 2,732,401 1,256,169 10,485,456 3,199,096 2,557,656 Business-type activities 1,431,714 759,732 644,520 757,507 941,817 1,938,416 688,729 1,323,776 (789,826) 3,717,692
Total change in net position 2,343,467$ (801,805)$ 681,918$ 1,876,377$ 3,094,452$ 4,670,817$ 1,944,898$ 11,809,232$ 2,409,270$ 6,275,348$
Fiscal Year
142

CITY OF SANIBEL, FLORIDA FUND BALANCES OF GOVERNMENTAL FUNDS
LAST TEN FISCAL YEARS (modified accrual basis of accounting)
__________________________________________________________________________________________________________________________
Pre-GASB 54Fiscal Year
2009 2008 2007 2006 2005
General FundReserved 2,106,410$ 2,453,016$ 3,241,640$ 3,504,415$ 3,521,581$ Unreserved 16,137,395 12,660,045 12,343,462 10,216,021 9,752,261
Total general Fund 18,243,805 15,113,061 15,585,102 13,720,436 13,273,842
All Other Governmental FundsReserved 534,083 538,412 540,083 735,526 1,847,721 Unreserved, reported in: Special revenue funds 2,615,240 2,256,268 2,047,882 1,048,837 2,513,084 Capital project funds 3,511,308 4,006,411 11,732,162 11,168,768 4,040,005
Total all other governmental funds 6,660,631$ 6,801,091$ 14,320,127$ 12,953,131$ 8,400,810$
Post-GASB 54Fiscal Year
2014 2013 2012 2011 2010 2009General Fund
Non SpendableNon Spendable 1,208,759$ 1,476,730$ 2,305,341$ 2,477,715$ 1,780,050$ 2,106,410$
SpendableCommitted 5,815,000 6,115,000 6,115,000 6,115,000 6,115,000 6,015,000 Assigned 1,715,502 2,307,319 1,467,261 4,692,583 275,000 275,000 Unassigned 2,802,118 2,471,724 4,048,953 4,125,963 8,222,172 9,847,395
Total General Fund 11,541,379 12,370,773 13,936,555 17,411,261 16,392,222 18,243,805
All Other Governmental FundsNon Spendable
Non Spendable 5,001 6,406 5,776 3,605 4,224 - Spendable
Restricted 3,146,318 2,527,749 2,384,739 2,355,723 1,924,988 4,045,391 Assigned 2,528,014 2,421,574 3,211,503 4,500,043 5,323,162 2,615,240
Total All Other Governmental Funds 5,679,333$ 4,955,729$ 5,602,018$ 6,859,371$ 7,252,374$ 6,660,631$
Note: Five years of data available for GASB 34 complianceFive years of data available for GASB 54 compliance which was adopted in 20102009 data was restated for GASB 54 comparable presentation
143

CITY OF SANIBEL, FLORIDA CHANGES IN FUND BALANCES OF GOVERNMENTAL FUNDS
LAST TEN FISCAL YEARS (modified accrual basis of accounting)
__________________________________________________________________________________________________________________________
2014 2013 2012 2011 2010 2009 2008 2007 2006 2005Revenues
Taxes 11,556,791$ 11,539,090$ 11,520,676$ 11,803,312$ 12,467,645$ 13,273,773$ 14,207,175$ 15,646,513$ 12,800,270$ 13,011,534$ Permits, Fees, Special Assessments 1,570,322 1,674,784 1,707,053 1,708,807 1,646,764 1,663,887 1,766,263 1,223,080 1,586,168 2,001,221 Intergovernmental 2,486,300 983,573 948,867 1,143,026 1,520,872 2,831,634 1,947,650 6,949,347 6,165,314 10,827,692 Charges for services 2,434,107 2,298,709 2,236,711 2,167,400 2,184,329 2,213,391 2,378,285 2,024,869 2,148,659 1,523,794 Fines and forfeits 63,881 66,576 70,208 80,127 83,542 102,626 80,831 265,828 176,406 149,853 Miscellaneous 719,342 403,709 787,693 730,766 596,761 415,098 827,817 1,668,933 1,456,089 1,861,138 Total revenues 18,830,743 16,966,441 17,271,208 17,633,438 18,499,913 20,500,409 21,208,021 27,778,570 24,332,906 29,375,232
ExpendituresCurrent General government 5,017,528 6,005,996 8,411,612 4,180,658 4,028,742 4,057,299 5,147,088 4,702,270 4,769,110 4,039,229 Public safety 4,906,573 4,500,436 4,514,438 4,050,699 4,096,086 4,353,428 4,672,683 4,515,664 4,084,478 3,802,872 Physical environment 598,395 592,915 619,264 691,637 854,615 1,214,970 960,151 1,038,602 1,806,296 3,581,602 Transportation 3,152,618 3,073,641 3,550,891 2,491,009 3,354,809 2,995,026 3,674,417 1,911,468 3,616,655 3,751,208 Economic environment 284,346 279,380 269,328 261,087 254,451 296,234 246,383 246,319 241,477 739,460 Human services 1,000 1,000 1,000 1,000 1,000 1,000 1,000 974 976 580 Culture/recreation 3,215,943 3,119,489 2,816,149 2,725,028 2,905,317 2,654,431 3,264,112 2,205,471 3,927,874 4,403,550 Debt service Principal 480,000 465,000 3,255,000 275,000 3,206,752 720,742 767,695 2,442,791 4,928,740 4,483,667 Interest and fiscal charges 360,336 373,630 514,607 469,438 625,259 635,498 664,630 774,882 474,685 608,750 Capital outlay 792,819 767,025 1,020,979 1,861,846 432,722 581,497 2,824,732 13,529,139 3,833,700 1,108,388 Total expenditures 18,809,558 19,178,512 24,973,268 17,007,402 19,759,753 17,510,125 22,222,891 31,367,580 27,683,991 26,519,306
Excess (deficiency) of revenues over (under) expenditures 21,185 (2,212,071) (7,702,060) 626,036 (1,259,840) 2,990,284 (1,014,870) (3,589,010) (3,351,085) 2,855,926
Other financing sources (uses)Transfers in 2,632,647 3,940,773 4,350,291 3,327,756 8,162,213 4,399,068 7,315,101 6,536,706 7,478,160 4,571,126 Transfers out (2,759,622) (3,940,773) (4,350,291) (3,327,756) (8,162,213) (4,399,068) (7,490,103) (6,606,056) (7,478,160) (4,571,126) Capital lease proceeds - - - - - - 88,817 - - - Debt proceeds/bond refunding - - 2,970,000 - - - - - 8,350,000 - Total other financing sources (uses) (126,975) - 2,970,000 - - - (86,185) (69,350) 8,350,000 -
Net change in fund balances (105,790)$ (2,212,071)$ (4,732,060)$ 626,036$ (1,259,840)$ 2,990,284$ (1,101,055)$ (3,658,360)$ 4,998,915$ 2,855,926$
Debt service as a percentage ofnoncapital expenditures 4.66% 4.55% 15.74% 4.92% 19.83% 8.01% 7.38% 18.04% 22.66% 20.04%
Fiscal Year
144

CITY OF SANIBEL, FLORIDA TAX REVENUE BY SOURCE – GOVERNMENTAL FUNDS
LAST TEN FISCAL YEARS (modified accrual basis of accounting)
__________________________________________________________________________________________________________________________
Local CasualtyFiscal Business Tax Local Option Communications InsuranceYear Operating Voted Debt Franchise* Receipts* Gas Tax Services Tax Premium Tax Total
2005 10,198,461$ 248,668$ 478,475$ -$ 1,574,183$ 511,747$ -$ 13,011,534$
2006 8,716,569 239,383 583,452 - 1,639,149 523,691 98,026 11,800,270
2007 11,973,525 775,976 656,936 - 1,632,569 556,781 50,726 15,646,513
2008 11,004,197 735,097 - 290,066 1,524,191 599,970 53,654 14,207,175
2009 10,175,612 737,735 - 293,393 1,480,460 529,114 57,459 13,273,773
2010 9,372,184 753,285 - 291,395 1,433,690 558,375 58,716 12,467,645
2011 8,742,177 755,021 - 290,214 1,418,333 540,080 57,487 11,803,312
2012 8,460,871 748,558 - 289,220 1,408,442 550,011 63,574 11,520,676
2013 8,283,542 853,159 - 284,903 1,478,765 576,179 62,542 11,539,090
2014 8,253,344 850,501 - 284,521 1,534,406 568,157 65,862 11,556,791
Change2005-2014 (19.07%) 242.02% N/A N/A (2.53%) 11.02% N/A (11.18%)
*Changes implemented by Florida Department of Financial Services reclassed Franchise Taxes as Franchise Fees and Occupational Licenses Fees as Local Business Taxes.
Property Taxes
145
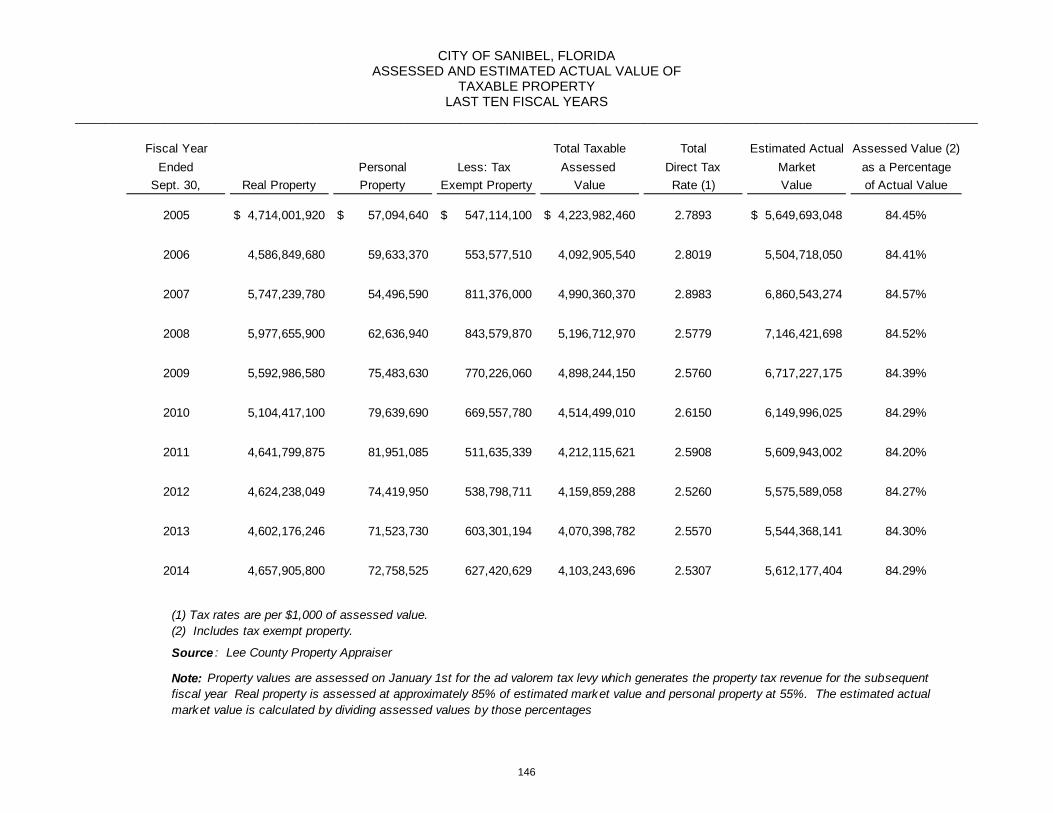
CITY OF SANIBEL, FLORIDA ASSESSED AND ESTIMATED ACTUAL VALUE OF
TAXABLE PROPERTY LAST TEN FISCAL YEARS
__________________________________________________________________________________________________________________________
Fiscal Year Total Taxable Total Estimated Actual Assessed Value (2)Ended Personal Less: Tax Assessed Direct Tax Market as a Percentage
Sept. 30, Real Property Property Exempt Property Value Rate (1) Value of Actual Value
2005 4,714,001,920$ 57,094,640$ 547,114,100$ 4,223,982,460$ 2.7893 5,649,693,048$ 84.45%
2006 4,586,849,680 59,633,370 553,577,510 4,092,905,540 2.8019 5,504,718,050 84.41%
2007 5,747,239,780 54,496,590 811,376,000 4,990,360,370 2.8983 6,860,543,274 84.57%
2008 5,977,655,900 62,636,940 843,579,870 5,196,712,970 2.5779 7,146,421,698 84.52%
2009 5,592,986,580 75,483,630 770,226,060 4,898,244,150 2.5760 6,717,227,175 84.39%
2010 5,104,417,100 79,639,690 669,557,780 4,514,499,010 2.6150 6,149,996,025 84.29%
2011 4,641,799,875 81,951,085 511,635,339 4,212,115,621 2.5908 5,609,943,002 84.20%
2012 4,624,238,049 74,419,950 538,798,711 4,159,859,288 2.5260 5,575,589,058 84.27%
2013 4,602,176,246 71,523,730 603,301,194 4,070,398,782 2.5570 5,544,368,141 84.30%
2014 4,657,905,800 72,758,525 627,420,629 4,103,243,696 2.5307 5,612,177,404 84.29%
(1) Tax rates are per $1,000 of assessed value.(2) Includes tax exempt property.
Source : Lee County Property Appraiser
Note: Property values are assessed on January 1st for the ad valorem tax levy which generates the property tax revenue for the subsequent fiscal year Real property is assessed at approximately 85% of estimated market value and personal property at 55%. The estimated actual market value is calculated by dividing assessed values by those percentages
146

CITY OF SANIBEL, FLORIDA DIRECT AND OVERLAPPING PROPERTY TAX RATES
LAST TEN FISCAL YEARS (Per $1,000 of assessed value)
__________________________________________________________________________________________________________________________
2014 2013 2012 2011 2010 2009 2008 2007 2006 2005
DIRECT RATESCITY OF SANIBEL
General Operating 2.0861 2.1000 2.1038 2.1561 2.1561 2.1561 2.1966 2.5000 2.4801 2.5000 Voted Debt - Land 0.0860 0.0855 0.0599 0.0595 0.0561 0.0483 0.0456 0.0475 0.0611 0.0625 Voted Debt - Recreation Facility 0.1291 0.1308 0.1263 0.1268 0.1172 0.1080 0.1011 0.1145 - - Voted Debt - Sewer 0.2295 0.2407 0.2360 0.2484 0.2856 0.2636 0.2346 0.2363 0.2607 0.2268 Total direct rates 2.5307 2.5570 2.5260 2.5908 2.6150 2.5760 2.5779 2.8983 2.8019 2.7893
OVERLAPPING RATESLEE COUNTY:
General Revenue 3.6506 3.6506 3.6506 3.6506 3.6506 3.6506 3.6506 3.5216 3.9332 4.2612 Capital Improvements 0.5000 0.5000 0.5000 0.5000 0.5000 0.5000 0.5000 0.9536 1.0124 1.0124
DEPENDENT DISTRICTS:Library - - - - - - - - 0.6055 0.6055
INDEPENDENTS DISTRICTS:Sanibel Public Library 0.3725 0.3750 0.3750 0.3750 0.3750 0.3750 0.3900 0.4200 - - Hyacinth Control 0.0291 0.0298 0.0310 0.0310 0.0277 0.0214 0.0214 0.0223 0.0295 0.0295 Mosquito Control 0.2520 0.2300 0.2388 0.2388 0.2132 0.1636 0.1636 0.1695 0.2247 0.2718 Fire Control District 1.0239 0.9660 0.9446 0.9446 0.8794 0.8114 0.7736 0.8258 0.9370 0.8300
WATER MANAGEMENT DISTRICTSSouth Florida Water Management 0.4110 0.4289 0.4363 0.6240 0.6240 0.6240 0.6240 0.6970 0.6970 0.6970 West Coast Inland Waterway 0.0394 0.0394 0.0394 0.0394 0.0394 0.0394 0.0394 0.0400 0.0400 0.0400
SCHOOL BOARD:General Operating 7.5980 7.5840 7.8540 8.0150 7.5080 6.8680 6.9600 7.0120 7.8820 8.0650
Total Direct and Overlapping Rates 16.4072 16.3607 16.5957 17.0092 16.4323 15.6294 15.7005 16.5601 18.1632 18.6017
Source : Lee County Tax Collector
147

CITY OF SANIBEL, FLORIDA PRINCIPAL PROPERTY TAXPAYERS
CURRENT AND NINE YEARS AGO
__________________________________________________________________________________________________________________________
Taxable Percentage of Taxable Percentage ofAsssessed Total City Taxable Asssessed Total City Taxable
Taxpayer Value Rank Assessed Value Value Rank Assessed Value
Casa Ybel Beach Resort 38,819,229$ 1 0.93% 27,841,580$ 1 0.60%
Sanibel Cottages 23,020,424 2 0.55% 13,789,580 5 0.30%
Tortuga Beach Club 19,177,236 3 0.46% 14,461,290 4 0.31%
BRE/Sanibel Inn Owner, LLC 16,727,320 4 0.40% - N/A N/A
RLR Investments, LLC 16,179,332 5 0.39% - N/A N/A
Shell Island Beach Club 14,069,025 6 0.34% 11,299,870 9 0.24%
1231 Middle Gulf Drive, LLC 13,779,146 7 0.33% - N/A N/A
Dahlmann Periwinkle Partners 11,351,849 8 0.27% - N/A N/A
Rochester Resorts 10,470,623 9 0.25% - N/A N/A
Perwinkle Park Limited 9,672,598 10 N/A - N/A N/A
West Wind Association of Sanibel - N/A 0.00% 18,291,930 2 0.39%
Miller, Tanya B. - N/A N/A 11,669,000 7 0.25%
Periwinkle Place Partners - N/A N/A 12,516,300 6 0.27%
Carroll, James P & Patricia - N/A N/A 15,919,730 3 0.34%
Meristar Sanibel Inn Co. LLC - N/A N/A 11,504,500 8 0.25%
Sobel, Mark & Mary Grace - N/A N/A 9,855,450 10 0.21%
173,266,782$ 4.17% 147,149,230$ 3.48%
Source: Lee County Property Appraiser
Fiscal Year 2013-14 Fiscal Year 2004-05
148

CITY OF SANIBEL, FLORIDA PROPERY TAX LEVIES AND COLLECTIONS
OPERATING LEVY LAST TEN FISCAL YEARS
__________________________________________________________________________________________________________________________
Collections ofPercentage Previous Percentage
Amount of Levy Years Amount of Levy
2005 10,559,956$ 10,181,864$ 96.42% 16,597$ 10,198,461$ 96.58%
2006 10,150,815 9,716,287 95.72% 281 9,716,569 95.72%
2007 12,475,901 11,627,012 93.20% 346,513 11,973,525 95.97%
2008 11,415,100 10,537,141 92.31% 467,056 11,004,197 96.40%
2009 10,579,884 9,882,269 93.41% 293,343 10,175,612 96.18%
2010 9,751,355 9,084,499 93.16% 287,685 9,372,184 96.11%
2011 9,081,742 8,485,790 93.44% 256,387 8,742,177 96.26%
2012 8,754,881 8,437,584 96.38% 23,012 8,460,596 96.64%
2013 8,733,402 8,280,019 94.81% 3,524 8,283,543 94.85%
2014 8,580,499 8,244,371 96.08% 8,973 8,253,344 96.19%
(*) Includes discount taken for early payment.
Fiscal year Ended Sept. 30
Taxes Levied for the Fiscal Year
Collections within the Fiscal Year of the Levy* Total Collections to Date
149

CITY OF SANIBEL, FLORIDA SANIBEL SEWER SYSTEM
SEWER RATES LAST TEN FISCAL YEARS
__________________________________________________________________________________________________________________________
Monthly RatesResidential Commercial
ConsumptionFiscal Meter Size PerYear Flat Fee 5/8" 1" 1-1/2" 2" 3" 4" 1,000 gallons
2005 38.46 22.33 55.79 111.55 159.89 356.82 559.48 5.62
2006 39.61 23.00 57.47 114.89 164.68 367.53 576.26 5.96
2007 47.53 27.60 68.96 137.87 197.62 441.03 691.52 7.15
2008 48.96 28.43 71.03 142.01 203.55 454.26 712.27 7.36
2009 50.43 29.29 73.16 146.27 209.65 467.88 733.63 7.58
2010 51.94 30.17 75.35 150.66 215.94 481.92 755.64 7.81
2011 51.94 30.17 75.35 150.66 215.94 481.92 755.64 7.81
2012 53.50 31.08 77.61 155.18 222.42 496.38 778.31 8.04
2013 54.04 31.39 78.39 156.73 224.64 501.34 786.09 8.12
2014 54.86 31.70 79.17 158.30 226.87 506.35 793.95 8.20
150

CITY OF SANIBEL, FLORIDA RATIOS OF OUTSTANDING DEBT BY TYPE
LAST TEN FISCAL YEARS
__________________________________________________________________________________________________________________________
2005 3,610,000$ 1,944,149$ 8,791,081$ 152,672$ 4,833,446$ 43,675,528$ 63,006,876$ N/A 10,046$
2006 11,875,000 1,854,401 4,087,980 101,781 4,604,876 46,395,287 68,919,325 14.21% 10,940
2007 11,640,000 1,759,388 2,026,093 50,891 4,287,269 45,797,920 65,561,561 N/A 10,412
2008 11,390,000 1,659,639 1,659,038 88,817 4,038,193 43,522,246 62,357,933 N/A 9,783
2009 11,135,000 1,555,151 1,306,432 80,169 3,784,120 35,492,474 53,353,346 11.50% 8,430
2010 10,870,000 - - - 3,520,045 32,855,365 47,245,410 9.16% 7,303
2011 10,595,000 - - - 3,250,970 27,752,296 41,598,266 N/A 6,429
2012 10,310,000 - - - 2,971,895 25,848,164 39,130,059 N/A 6,030
2013 9,845,000 - - - 2,687,823 23,882,161 36,414,984 N/A 5,605
2014 9,365,000 - - - 8,888,260 14,645,081 32,898,341 N/A 5,069
Notes: N/A indicates that statistical information is not available
Total Primary Government
Percentage of Personal Income Per Capita
Fiscal year Ended
Sept. 30
General Obligation
BondsCapital
Revenue BondsCapital
Revenue Notes Capital Leases
Governmental Activities Business-Type Activities
Wastewater Revenue Bonds
Wastewater Revenue Notes
151

CITY OF SANIBEL, FLORIDA RATIOS OF GENERAL BONDED DEBT OUTSTANDING
LAST TEN FISCAL YEARS
__________________________________________________________________________________________________________________________
2005 3,610,000$ 247,094$ 3,362,906$ 0.06% 536$
2006 11,875,000 256,429 11,618,571 0.21% 1,844
2007 11,640,000 271,549 11,368,451 0.17% 1,805
2008 11,390,000 268,025 11,121,975 0.16% 1,745
2009 11,135,000 262,885 10,872,115 0.16% 1,718
2010 10,870,000 294,179 10,575,821 0.17% 1,635
2011 10,595,000 249,383 10,345,617 0.18% 1,599
2012 10,310,000 249,106 10,060,894 0.18% 1,550
2013 9,845,000 265,161 9,579,839 0.17% 1,475
2014 9,365,000 294,562 9,070,438 0.16% 1,398
(1) This is the amount restricted for debt service principal payments.
Percentage of Estimated Actual Value of Taxable
Property Per CapitaFiscal year Ended
Sept. 30General
Obligation Bonds
Less: Amounts Available in Debt
Service (1)Net General Bonded Debt
General Bonded Debt Outstanding
152

CITY OF SANIBEL, FLORIDA DIRECT AND OVERLAPPING GOVERNMENTAL
ACTIVITIES DEBT September 30, 2014
__________________________________________________________________________________________________________________________
Governmental Unit
Debt repaid with property taxes
DIRECT:City of Sanibel 9,365,000$ 100% 9,365,000$
OVERLAPPINGLee County - N/A -
TOTAL: 9,365,000$ 9,365,000$
Debt Outstanding
Estimated Percentage Applicable
Estimated Share of
Overlapping Debt
153

CITY OF SANIBEL, FLORIDA WASTEWATER REVENUE BOND COVERAGE
SANIBEL SEWER SYSTEM LAST TEN FISCAL YEARS
__________________________________________________________________________________________________________________________
Net Revenue Net RevenueAvailable for Available forDebt Service Debt Service
(1) (2) Excluding Including Excluding IncludingGross Operating Connection Connection Connection Connection Connection
Fiscal Revenue Expenses Fees Fees Fees Principal Interest Total Fees Fees
2005 2,761,877$ 2,297,228$ 464,649$ 78,014$ 542,663$ 260,000$ 162,408$ 422,408$ 1.10 1.28
2006 3,126,129 2,563,785 562,344 65,437 627,781 265,000 157,409 422,409 1.33 1.49
2007 3,774,479 2,445,784 1,328,695 45,731 1,374,426 270,000 151,909 421,909 3.15 3.26
2008 3,855,217 3,363,667 491,550 28,770 520,320 270,000 146,509 416,509 1.18 1.25
2009 4,061,376 3,380,295 681,081 58,335 739,416 285,000 134,651 419,651 1.62 1.76
2010 3,767,290 3,114,777 652,513 35,102 687,615 290,000 127,241 417,241 1.56 1.65
2011 3,562,210 3,035,214 526,996 60,321 587,317 300,000 119,266 419,266 1.26 1.40
2012 4,374,694 3,780,265 594,429 113,409 707,838 305,000 110,266 415,266 1.43 1.70
2013 4,019,254 3,393,652 625,602 111,282 736,884 315,000 101,116 416,116 1.50 1.77
2014 5,465,389 2,991,556 2,473,833 47,126 2,520,959 1,216,123 122,770 1,338,893 1.85 1.88
(1) Total revenues (including interest) exclusive of connection fees and user fees pledged and used for repayment of subordinated State Revolving Loan debt.(2) Total operating expenses of the Donax plant exclusive of depreciation and indirect costs.
2014 Sewer Refunding Revenue Bonds
(3) The coverage requirement is (A) net revenues adequate at all times to pay in each fiscal year at least 120% (110% prior to fiscal year 2014) of the current annual debt service requirement becoming due in such fiscal year on each series of outstanding bonds or (B) net revenues, together with connection fees, adequate at all times to pay in each fiscal year at least one hundred twenty-five percent (125%) of the current annual debt service requirement becoming due in such fiscal year on each series of the outstanding bonds, provided, however, that with respect to (B), net revenues, excluding connection fees must be adequate at all times to pay in each fiscal year at least one hundred percent (100%) of the current annual debt service requirement becoming due in such fiscal year on the outstanding bonds.
Coverage Calculation (3)
Debt Service Requirements
154

CITY OF SANIBEL, FLORIDA WASTEWATER REVENUE NOTE COVERAGE
SANIBEL SEWER SYSTEM LAST TEN FISCAL YEARS
__________________________________________________________________________________________________________________________
(2) Special Net Revenue
Assessments, Available forTransmission Debt Service
Main and Including(1) Connection Assessments Coverage
Fiscal Year Net Revenue Fees and Fees Principal Interest Total Calculation
2005 2,341,656$ 1,365,838$ 3,707,494$ 2,081,276$ 1,359,777$ 3,441,053$ 1.08
2006 3,194,855 1,251,893 4,446,748 2,053,489 1,384,175 3,437,664 1.29
2007 3,137,159 1,523,528 4,660,687 2,525,200 1,416,310 3,941,510 1.18
2008 3,509,318 940,711 4,450,029 2,275,673 1,579,017 3,854,690 1.15
2009 3,179,638 972,918 4,152,556 2,124,134 1,191,171 3,315,305 1.25
2010 4,038,140 971,582 5,009,722 2,143,013 1,040,306 3,183,319 1.57
2011 3,959,164 999,710 4,958,874 1,904,133 878,896 2,783,029 1.78
2012 3,362,132 994,733 4,356,865 1,966,002 817,029 2,783,031 1.57
2013 3,332,060 876,811 4,208,871 2,029,899 753,132 2,783,031 1.51
2014 2,081,975 916,970 2,998,945 1,300,098 403,247 1,703,345 1.76
State Revolving Loan Notes
Debt Service Requirements
(1) Includes 15% (35% prior to fiscal year 2014) of gross user rate revenues, interest earnings on special assessments financed and ad valorem tax revenue from voted debt service property tax levy pledged specifically to the repayment of the wastewater expansion State Revolving Loan notes. (2) For financial reporting, Special Assessments, Transmission Main and Connection Fees are recognized in the year in which the levy is adopted and the lien placed upon the benefitting properties. The levy can be paid in full or financed over 20 years at 3.5% interest, collected utilizing the Uniform Method of Collection pursuant to Chapter 197, Florida Statues. For debt service requirements, payments are recognized when collected.
155

CITY OF SANIBEL, FLORIDA DEMOGRAPHIC AND ECONOMIC STATISTICS
LAST TEN FISCAL YEARS
__________________________________________________________________________________________________________________________
Lee CountyCity Personal Per Capita Unemployment
Year City Population Income Personal Income Rate
2005 6,272 N/A N/A 2.9%
2006 6,300 $ 485,024,400 $ 76,988 3.1%
2007 6,297 N/A N/A 5.2%
2008 6,374 N/A N/A 9.3%
2009 6,329 $ 463,909,371 $ 73,299 13.8%
2010 6,469 $ 515,850,998 $ 79,742 12.5%
2011 6,470 N/A N/A 10.2%
2012 6,489 N/A N/A 8.0%
2013 6,497 N/A N/A 5.8%
2014 6,490 N/A N/A 5.0%
N/A indicates that statistical information is not availab le
Source: Population data estimates provided by Bureau of Economic and Business Research, University ofFlorida . Per Capita income data for 2006 and 2009 is from the Lee County Office of Economic Developmentand for 2010 from the US Census Bureau. Unemployment rate is for the Cape Coral-Fort Myers, FL StatisticalArea as of December 2014 from the U.S. Department of Labor.
156
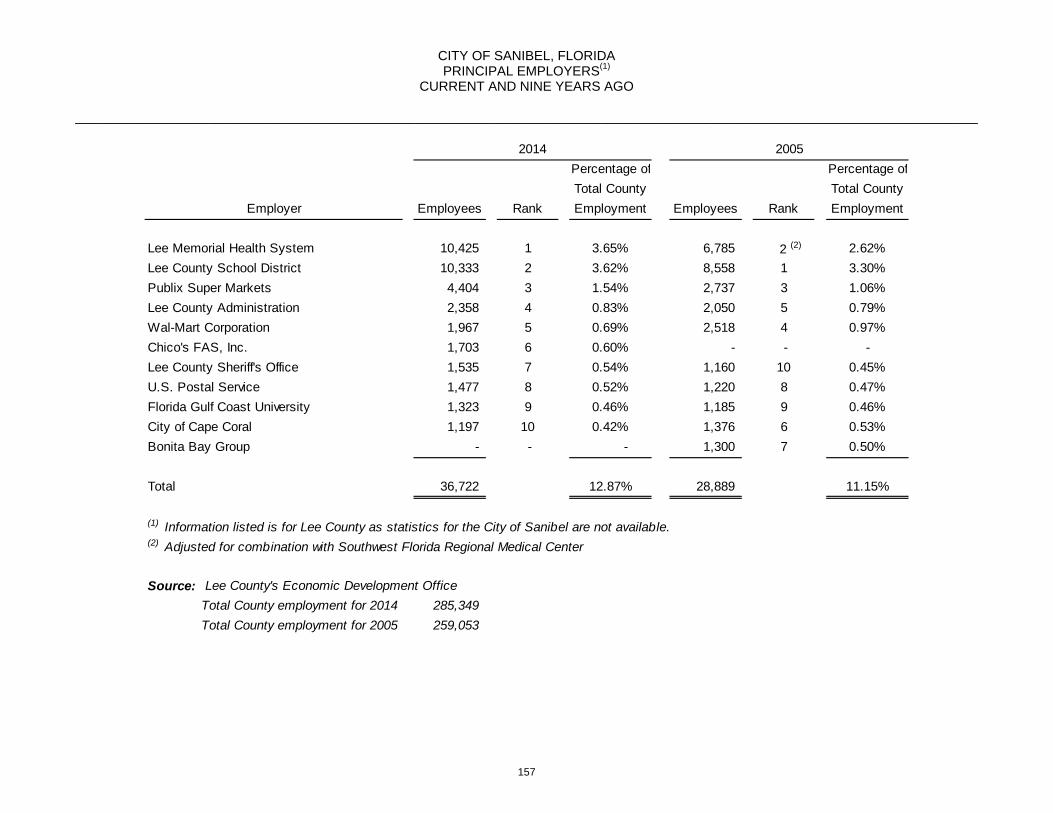
CITY OF SANIBEL, FLORIDA PRINCIPAL EMPLOYERS(1)
CURRENT AND NINE YEARS AGO
__________________________________________________________________________________________________________________________
Percentage of Percentage ofTotal County Total County
Employer Employees Rank Employment Employees Rank Employment
Lee Memorial Health System 10,425 1 3.65% 6,785 2 (2) 2.62%Lee County School District 10,333 2 3.62% 8,558 1 3.30%Publix Super Markets 4,404 3 1.54% 2,737 3 1.06%Lee County Administration 2,358 4 0.83% 2,050 5 0.79%Wal-Mart Corporation 1,967 5 0.69% 2,518 4 0.97%Chico's FAS, Inc. 1,703 6 0.60% - - -Lee County Sheriff's Office 1,535 7 0.54% 1,160 10 0.45%U.S. Postal Service 1,477 8 0.52% 1,220 8 0.47%Florida Gulf Coast University 1,323 9 0.46% 1,185 9 0.46%City of Cape Coral 1,197 10 0.42% 1,376 6 0.53%Bonita Bay Group - - - 1,300 7 0.50%
Total 36,722 12.87% 28,889 11.15%
(1) Information listed is for Lee County as statistics for the City of Sanibel are not available.(2) Adjusted for combination with Southwest Florida Regional Medical Center
Source: Lee County's Economic Development Office Total County employment for 2014 285,349 Total County employment for 2005 259,053
2014 2005
157

CITY OF SANIBEL, FLORIDA FULL-TIME EQUIVALENT CITY GOVERNMENT
EMPLOYEES BY FUNCTION/PROGRAM LAST TEN FISCAL YEARS
__________________________________________________________________________________________________________________________
Function/Program 2014 2013 2012 2011 2010 2009 2008 2007 2006 2005
General GovernmentLegislative 5.00 2.76 2.76 2.00 2.00 2.00 2.00 2.00 2.00 2.00 Administrative 3.75 4.75 4.75 4.75 5.00 5.00 5.00 5.00 5.00 4.00 IT 4.40 4.40 4.00 4.00 4.00 4.00 4.00 3.00 3.00 2.00 Finance 7.50 7.50 8.00 7.00 7.50 7.50 7.50 7.50 7.50 6.50 Legal 2.00 2.00 2.00 2.00 2.00 2.00 2.00 2.00 2.00 2.00 Planning 9.45 8.80 8.85 7.95 6.00 7.00 10.00 10.80 10.80 9.00
Public SafetyPolice 35.12 35.12 33.22 35.72 37.50 38.25 41.25 40.25 38.25 38.25 Building 4.80 4.50 4.35 4.25 4.00 4.00 5.00 7.50 8.00 7.00 Vehicle Weight Permits - - - - - - - 1.00 1.58 1.58
Physical Environment 3.00 2.96 2.96 3.00 3.00 3.00 3.00 3.00 3.00 2.00 Transportation 13.52 13.58 13.28 14.24 15.51 17.00 19.00 19.00 19.00 18.00 Culture/Recreation
Recreation Facility 26.05 24.24 24.24 24.06 22.81 21.81 18.92 14.42 14.42 14.42 Public Facilities 3.00 3.00 3.00 3.00 3.00 3.00 3.00 3.00 3.00 2.00 Senior Programs 2.00 1.57 1.57 1.57 1.57 1.62 1.62 1.62 1.62 1.62 Museum/Historical Village - - - - - - - 1.00 0.20 0.20 Ball Park Maintenance - - - - - 2.00 2.00 2.00 2.00 2.00
Wastewater 17.22 18.22 18.29 18.33 16.57 17.00 17.00 17.25 18.00 20.00 Beach Parking 16.88 15.63 14.58 13.18 13.92 13.50 14.50 14.50 14.50 13.50
TOTAL 153.69 149.03 145.85 145.05 144.38 148.68 155.79 154.84 153.87 146.07
Source : City of Sanibel Annual Budget
Full-time Equivalent Employees as of September 30,
158

CITY OF SANIBEL, FLORIDA OPERATING INDICATORS BY FUNCTION/PROGRAM
LAST TEN FISCAL YEARS
__________________________________________________________________________________________________________________________
Function/Program 2014 2013 2012 2011 2010 2009 2008 2007 2006 2005Police
Calls for Service 21,606 24,790 23,161 23,542 27,564 27,041 32,424 26,076 24,975 22,323 Parking Citations 3,401 2,969 2,439 2,583 2,649 3,561 3,859 3,412 2,716 2,341 Traffic Citations 1,031 1,300 1,113 1,081 1,055 782 1,283 1,478 1,066 1,447 Total Arrests 137 171 116 249 260 357 174 153 157 174
General GovernmentBuilding permits issued 2,677 2,725 2,828 2,430 2,418 2,200 2,165 2,624 2,870 4,888 Building inspections conducted 6,546 7,277 6,726 6,266 6,554 5,849 6,036 8,592 9,498 13,514 Dwelling units permitted 23 17 23 17 15 10 13 15 17 27
TransportationStreets resurfaced/reconstructed (miles) 3.01 4.80 5.80 5.93 6.71 6.45 3.03 1.01 1.92 1.38 Shared-use Paths Constructed (linear feet) 1,540 196 6,758 4,730 - - 1,200 - - - Road and Shared-use Path Miles Swept 139 235 59 491 465 447 274 281 166 170
WastewaterAverage daily sewage treatment (thousands of gallons) 1,278 1,408 1,038 1,122 1,515 1,396 1,506 1,355 1,356 1,478 Placement of new collection pipe (linear feet) - - - 1,120 - - - 3,960 43,000 40,570 Sewer equivalent residential units (ERU)(1) 9,375 9,360 9,344 9,323 9,302 8,864 8,835 8,517 8,466 8,371
RecreationAfter-school program participants 118 121 138 147 147 158 215 154 130 155 Senior Program membership 738 707 712 746 748 702 662 745 683 563 Senior Aerobics participants 10,013 9,845 9,023 8,196 8,464 6,584 5,470 5,271 5,194 4,276 RecCenter annual memberships(2) 1,091 1,085 1,093 1,005 990 989 1,183 - - - RecCenter six-month memberships(2) 787 788 744 729 731 780 1,112 - - -
Sanibel Harbor Canal Trimming Assessment DistrictMangroves trimmed (linear feet) 10,000 10,000 10,000 10,000 10,000 10,000 10,000 10,000 10,000 10,000
(1) New method of calculating ERU's in FY10 based upon estimated 240 gallons of wastewater generation per ERU(2) New Recreation Center opened in December 2007
Source: Various City departments annual reports
FISCAL YEAR
159

CITY OF SANIBEL, FLORIDA CAPITAL ASSET STATISTICS BY FUNCTION/PROGRAM
LAST TEN FISCAL YEARS
__________________________________________________________________________________________________________________________
Function/Program 2014 2013 2012 2011 2010 2009 2008 2007 2006 2005Police
Stations 1 1 1 1 1 1 1 1 1 1Vehicle Patrol Units
Patrol cars 11 10 9 9 10 10 10 11 10 10Motorcycles 2 2 2 2 2 2 2 2 2 2Unmarked vehicles 7 7 7 6 7 7 7 7 7 7Patrol boats 2 2 2 2 2 2 2 2 2 2
Natural ResourcesEnvironmentally Sensitive Land (acres) 622 622 622 622 622 622 622 622 622 622
TransportationPaved Public Streets (miles) 53.67 53.67 53.67 53.56 53.56 53.56 53.34 53.34 52.96 52.96Unpaved Public Streets (miles) 8.16 8.16 8.16 8.27 8.27 8.27 8.41 8.41 8.79 8.79Shared Use Paths (miles) 25.06 25.06 25.03 23.75 22.85 22.85 22.85 22.62 22.62 22.62
WastewaterTreatment Capacity (thousands) 2,500 2,500 2,500 2,500 2,500 2,500 2,500 2,500 2,500 2,500
RecreationNumber of Parks (non-beach facilities) 2 2 2 2 2 2 2 2 2 2Recreation centers/gymnasiums 1 1 1 1 1 1 1 0 1 1Senior centers 1 1 1 1 1 1 1 1 1 1Swimming pools 3 3 3 3 3 3 3 0 1 1Baseball/softball diamonds 3 3 3 3 3 3 3 3 3 3
Beach ParkingNumber of Beach Parking Faciliites 7 7 7 7 7 7 7 7 7 8Parking Spaces 637 637 637 610 610 610 610 610 586 657Restrooms 8 8 8 6 6 6 6 6 6 6Fishing Piers 1 1 1 1 1 1 1 1 1 1Boat ramps 1 1 1 1 1 1 1 1 1 1
Source: Various City departments annual reports
FISCAL YEAR
160

CITY OF SANIBEL, FLORIDA SCHEDULE OF INSURANCE COVERAGE
September 30, 2014
__________________________________________________________________________________________________________________________
Type of Policy Limitsand Type of Coverage of Liability Company Expiration Date Annual Premium
Property (1) Florida Municipal Insurance Trust 10/01/2014 98,776$ Real 47,529,276$ Personal 9,429,934 Business Income 2,000,000 Inland Marine 1,152,307
General Liability 5,000,000 Florida Municipal Insurance Trust 10/01/2014 131,891 Extra Contractual Legal Expense 25,000 Fire Legal Liability 500,000 Errors and Omissions Liability 5,000,000 Law Enforcement Liability 5,000,000 Faithful Performance Blanket Bond 1,000,000 Employee Theft Bond 1,000,000 Crime 100,000 Equipment Breakdown Limit 50,000,000
Workers' Compensation 1,000,000 Florida Municipal Insurance Trust 10/01/2014 173,517
Automobile Liability and Automobile Physical Damage 5,000,000 Florida Municipal Insurance Trust 10/01/2014 27,875
Statutory Accidental Death & Disability 70,000.00 National Union Fire Insurance Co of Pitt, PA 10/01/2014 1,175 198,000.00
Pollution Liability 2,000,000 Commerce and Industry Insurance Company 08/24/2015 1,648 ($1,000,000 maximum per claim)
Flood 10,551,900 American Bankers Insurance Co Various 87,389
Windstorm 12,622,791 Citizens Property Insurance Corporation Various 92,100
and computer equipment and software.
(1) Includes real, personal, inland marine equipment, EDP, watercraft, valuable papers and records, business interruption, rental value, contractors' equipment,
161

162

GOVERNMENTAUDITINGST
ANDARDS
163

164

An independent member of Nexia International
INDEPENDENT AUDITORS’ REPORT ON INTERNAL CONTROL OVER FINANCIAL REPORTING AND ON COMPLIANCE AND OTHER MATTERS BASED ON AN AUDIT OF FINANCIAL STATEMENTS PERFORMED IN ACCORDANCE WITH GOVERNMENT AUDITING STANDARDS Honorable Mayor and Members of the City Council City of Sanibel, Florida Sanibel, Florida We have audited, in accordance with the auditing standards generally accepted in the United States of America and the standards applicable to financial audits contained in Government Auditing Standards issued by the Comptroller General of the United States, the financial statements of the governmental activities, the business-type activities, the discretely presented component unit, each major fund, and the aggregate remaining fund information of the City of Sanibel, Florida (the “City”), as of and for the year ended September 30, 2014, and the related notes to the financial statements, which collectively comprise the City’s basic financial statements, and have issued our report thereon dated March 27, 2015. Our report includes a reference to other auditors who audited the financial statements of Community Housing and Resources, Inc, as described in our report on the City’s financial statements. This report does not include the results of the other auditors’ testing of internal control over financial reporting or compliance and other matters that are reported on separately by those auditors. The financial statements of Community Housing and Resources, Inc. were not audited in accordance with Government Auditing Standards. Internal Control Over Financial Reporting In planning and performing our audit of the financial statements, we considered the City's internal control over financial reporting (internal control) to determine the audit procedures that are appropriate in the circumstances for the purpose of expressing our opinions on the financial statements, but not for the purpose of expressing an opinion on the effectiveness of the City’s internal control. Accordingly, we do not express an opinion on the effectiveness of the City’s internal control. A deficiency in internal control exists when the design or operation of a control does not allow management or employees, in the normal course of performing their assigned functions, to prevent, or detect and correct, misstatements on a timely basis. A material weakness is a deficiency, or a combination of deficiencies, in internal control, such that there is a reasonable possibility that a material misstatement of the entity’s financial statements will not be prevented, or detected and corrected on a timely basis. A significant deficiency is a deficiency, or a combination of deficiencies, in internal control that is less severe than a material weakness, yet important enough to merit attention by those charged with governance. Our consideration of internal control was for the limited purpose described in the first paragraph of this section and was not designed to identify all deficiencies in internal control that might be material weaknesses or significant deficiencies. Given these limitations, during our audit we did not identify any deficiencies in internal control that we consider to be material weaknesses. However, material weaknesses may exist that have not been identified.
CliftonLarsonAllen LLP CLAconnect.com
165

Honorable Mayor and Members of the City Council City of Sanibel, Florida
Compliance and Other Matters As part of obtaining reasonable assurance about whether the City's financial statements are free from material misstatement, we performed tests of its compliance with certain provisions of laws, regulations, contracts, and grant agreements, noncompliance with which could have a direct and material effect on the determination of financial statement amounts. However, providing an opinion on compliance with those provisions was not an objective of our audit, and accordingly, we do not express such an opinion. The results of our tests disclosed no instances of noncompliance or other matters that are required to be reported under Government Auditing Standards. Purpose of this Report The purpose of this report is solely to describe the scope of our testing of internal control and compliance and the result of that testing, and not to provide an opinion on the effectiveness of the entity’s internal control or on compliance. This report is an integral part of an audit performed in accordance with Government Auditing Standards in considering the entity’s internal control and compliance. Accordingly, this communication is not suitable for any other purpose.
CliftonLarsonAllen LLP
Fort Myers, Florida March 27, 2015
166

This section contains the following subsections:
Independent Auditors’ Management Letter .................................................................. 169 Management Letter Findings and Recommendations ................................................. 171
Management’s Response to Management Letter ........................................................ 173
Independent Accountants’ Examination Report ........................................................... 175
MANAGEM
ENTLET
TER
167

168
CliftonLarsonAllen LLP CLAconnect.com
An independent member of Nexia International
MANAGEMENT LETTER Honorable Mayor and City Council City of Sanibel, Florida Sanibel, Florida Report on the Financial Statements We have audited the financial statements of the City of Sanibel, Florida (the “City”) as of and for the fiscal year ended September 30, 2014, and have issued our report thereon dated March 27, 2015. Auditors’ Responsibility We conducted our audit in accordance with auditing standards generally accepted in the United States of America, the standards applicable to financial audits contained in Government Auditing Standards issued by the Comptroller General of the United States. Other Reports and Schedule We have issued our Independent Auditors’ Report on Internal Control over Financial Reporting and Compliance and Other Matters Based on an Audit of the Financial Statements Performed in Accordance with Government Auditing Standards; and Independent Accountants’ Report on an examination conducted in accordance with AICPA Professional Standards, Section 601, regarding compliance requirements in accordance with Chapter 10.550, Rules of the Auditor General. Disclosures in those reports, which are dated March 27, 2015, should be considered in conjunction with this management letter. Prior Audit Findings Section 10.554(1)(i)1., Rules of the Auditor General, requires that we determine whether or not corrective actions have been taken to address findings and recommendations made in the preceding annual financial audit report. The status of significant findings and recommendations made in the preceding annual financial audit report are listed in Appendix A. Official Title and Legal Authority Section 10.554(1)(i)4., Rules of the Auditor General, requires that the name or official title and legal authority for the primary government and each component unit of the reporting entity be disclosed in this management letter, unless disclosed in the notes to the financial statements. The City discloses this information in the notes to the financial statements.
169

Honorable Mayor and City Council City of Sanibel, Florida
Financial Condition Section 10.554(1)(i)5.a., Rules of the Auditor General, requires that we report the results of our determination as to whether or not the City has met one or more of the conditions described in Section 218.503(1), Florida Statutes, and identification of the specific condition(s) met. In connection with our audit, we determined that the City did not meet any of the conditions described in Section 218.503(1), Florida Statutes. Pursuant to Sections 10.554(1)(i)5.c. and 10.556(8), Rules of the Auditor General, we applied financial condition assessment procedures. It is management’s responsibility to monitor the City’s financial condition, and our financial condition assessment was based in part on representations made by management and the review of financial information provided by same. Annual Financial Report Section 10.554(1)(i)5.b., Rules of the Auditor General, requires that we report the results of our determination as to whether the annual financial report for the City for the fiscal year ended September 30, 2014, filed with the Florida Department of Financial Services pursuant to Section 218.32(1)(a), Florida Statutes, is in agreement with the annual financial audit report for the fiscal year ended September 30, 2014. In connection with our audit, we determined that these two reports were in agreement. Special District Component Units Section 10.554(1)(i)5.d., Rules of the Auditor General, requires that we determine whether or not a special district that is a component unit of a county, municipality, or special district, provided the financial information necessary for proper reporting of the component unit, within the audited financial statements of the county, municipality, or special district in accordance with Section 218.39(3)(b), Florida Statutes. The City does not have any special district component units. Other Matters Section 10.554(1)(i)2., Rules of the Auditor General, requires that we address in the management letter any recommendations to improve financial management. In connection with our audit, we did not have any such recommendations. Section 10.554(1)(i)3., Rules of the Auditor General, requires that we address noncompliance with provisions of contracts or grant agreements, or abuse, that have occurred, or are likely to have occurred, that have an effect on the financial statements that is less than material but which warrants the attention of those charged with governance. Our current year findings and recommendations are listed in Appendix B to this Management Letter. Our management letter is intended solely for the information and use of the Legislative Auditing Committee, members of the Florida Senate and the Florida House of Representatives, the Florida Auditor General, Federal and other granting agencies, the Council Members, and applicable management, and is not intended to be, and should not be, used by anyone other than these specified parties.
CliftonLarsonAllen LLP Fort Myers, Florida March 27, 2015
170

CITY OF SANIBEL, FLORIDA MANAGEMENT LETTER SEPTEMBER 30, 2014
APPENDIX A – PRIOR YEAR FINDINGS AND RECOMMENDATIONS
Prior Year Findings
Current Year Status
Cleared Partially Cleared Not Cleared Finding Reference #
Comment
2010-03 Information Technology Controls X
171

CITY OF SANIBEL, FLORIDA MANAGEMENT LETTER SEPTEMBER 30, 2014
APPENDIX B – CURRENT YEAR FINDINGS AND RECOMMENDATIONS
MLC 2014-001 Investment Policy Criteria The City’s written investment policy should conform to all requirements of Section 218.415, Florida Statutes. Condition The City’s investment policy includes most of the requirements of Section 218.415. However, the City’s policy does not address two requirements.
1) The system of internal controls over investment activities should be in writing and made a part of the City’s operational procedures.
2) The investment policy does not include the requirement for the City’s official responsible for making investment decisions or chief financial officer to annually complete eight hours of continuing education in subjects or courses of study related to investment practices and products.
Cause The City does have internal control procedures in place related to investment activity. However, these procedures have not been formalized in writing and made part of the City’s internal control policies. In addition, the City’s Chief Financial Officer has been completing the required eight hours of continuing education annually. However, the City’s policy does not include this requirement. Effect The City’s policy is not in compliance with Section 218.415, Florida Statutes. Recommendation The City’s investment policy was adopted on March 16, 2010. This policy should be reviewed and updated for changes in market conditions that have occurred in the past five years and to comply with all requirements of Section 218.415, Florida Statutes.
172
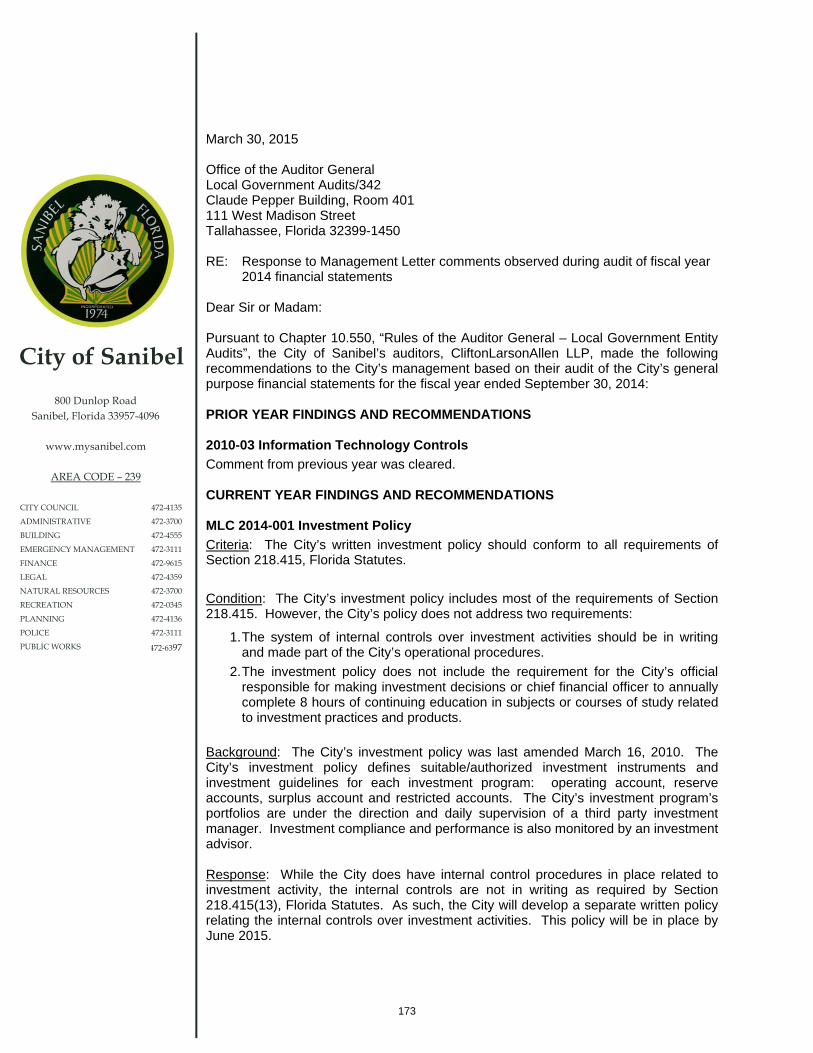
City of Sanibel
800 Dunlop Road Sanibel, Florida 33957-4096
www.mysanibel.com
AREA CODE – 239
CITY COUNCIL
ADMINISTRATIVE
BUILDING
EMERGENCY MANAGEMENT
FINANCE
LEGAL
NATURAL RESOURCES
RECREATION
PLANNING
POLICE
PUBLIC WORKS
472-4135
472-3700
472-4555
472-3111
472-9615
472-4359
472-3700
472-0345
472-4136
472-3111
472-6397
March 30, 2015 Office of the Auditor General Local Government Audits/342 Claude Pepper Building, Room 401 111 West Madison Street Tallahassee, Florida 32399-1450 RE: Response to Management Letter comments observed during audit of fiscal year 2014 financial statements Dear Sir or Madam: Pursuant to Chapter 10.550, “Rules of the Auditor General – Local Government Entity Audits”, the City of Sanibel’s auditors, CliftonLarsonAllen LLP, made the following recommendations to the City’s management based on their audit of the City’s general purpose financial statements for the fiscal year ended September 30, 2014: PRIOR YEAR FINDINGS AND RECOMMENDATIONS 2010-03 Information Technology Controls Comment from previous year was cleared. CURRENT YEAR FINDINGS AND RECOMMENDATIONS MLC 2014-001 Investment Policy Criteria: The City’s written investment policy should conform to all requirements of Section 218.415, Florida Statutes. Condition: The City’s investment policy includes most of the requirements of Section 218.415. However, the City’s policy does not address two requirements:
1. The system of internal controls over investment activities should be in writing and made part of the City’s operational procedures.
2. The investment policy does not include the requirement for the City’s official responsible for making investment decisions or chief financial officer to annually complete 8 hours of continuing education in subjects or courses of study related to investment practices and products.
Background: The City’s investment policy was last amended March 16, 2010. The City’s investment policy defines suitable/authorized investment instruments and investment guidelines for each investment program: operating account, reserve accounts, surplus account and restricted accounts. The City’s investment program’s portfolios are under the direction and daily supervision of a third party investment manager. Investment compliance and performance is also monitored by an investment advisor. Response: While the City does have internal control procedures in place related to investment activity, the internal controls are not in writing as required by Section 218.415(13), Florida Statutes. As such, the City will develop a separate written policy relating the internal controls over investment activities. This policy will be in place by June 2015.
173

Office of the Auditor General Page 2 March 30, 2015 Additionally, based on input from the City’s independent auditors and in conjunction with the City’s investment advisor and investment managers, an amended investment policy was developed and will be presented to the City Council at its April 7, 2015 regular meeting. The amended policy adds a continuing education requirement for the Finance Director and appropriate staff as required by Florida Statue 218.415(14). The City would like to note that the Finance Director has remained in compliance with the applicable statute by annually completing 8 hours of continuing education in subjects or courses of study related to investment practices and products. The amended policy will also include some clarifications in certain language to assist in proper implementation:
1. Clarification of investment ratings to include the minimum “A” rating of “A-” for Standard and Poor’s and “A3” for Moody’s. This clarifies the intent of the investment policy to include all “A” ratings with their modifiers. Add Moody as a rating agency in Section VII of the investment policy. Moody was included in Section V but inadvertently omitted in Section VII.
2. Add minimum rating requirements for state and local government and public authority issues. 3. Clarify that the “no more than two (2) percent of account will be invested with any one issuer”
refers to “non-government issuers”. The City of Sanibel appreciates the recommendations of CliftonLarsonAllen, LLP and is committed to implementing these improvements to the City’s financial and technological internal control matters. Sincerely, Judith A. Zimomra City Manager
174

CliftonLarsonAllen LLPCLAconnect.com
An independent member of Nexia International
INDEPENDENT ACCOUNTANTS' REPORT Honorable Mayor and City Council City of Sanibel, Florida Sanibel, Florida We have examined the City of Sanibel, Florida's (the “City”) compliance with Section 218.415, Florida Statutes, regarding the investment of public funds, during the year ended September 30, 2014. Management is responsible for the City's compliance with those requirements. Our responsibility is to express an opinion on the City's compliance based on our examination. Our examination was conducted in accordance with attestation standards established by the American Institute of Certified Public Accountants and, accordingly, included examining, on a test basis, evidence about the City’s compliance with those requirements and performing such other procedures as we considered necessary in the circumstances. We believe that our examination provides a reasonable basis for our opinion. Our examination does not provide a legal determination on the City’s compliance with specified requirements. Our examination disclosed the following deviations from Section 218.415, Florida Statutes. While the City does have internal control procedures in place related to investment activity, the internal controls are not in writing as required by 218.415(13). In addition, the City’s investment policy does not have a requirement for the City’s officials responsible for making investment decisions or chief financial officer to complete eight hours of continuing education in subjects or courses of study related to investment practices and products as required by 218.415(14). It was determined the City’s finance director did obtain the required eight hours of continuing education for the year ended September 30, 2014. Our examination disclosed the following deviations from the City’s investment policy. Authorized investments pursuant to the City’s investment policy include corporate bonds that have an investment grade rating of “A” or better by Standard & Poor’s. As of September 30, 2014 the City’s investment portfolio included corporate bonds with credit ratings lower than “A” by Standard & Poor’s or Moody’s. The City’s investment policy limits the investment with any one issuer to no more than 2% of the investment portfolio for the Reserves Account, Surplus Account and the Restricted Account. As of September 30, 2014, the City’s investments exceeded this 2% limitation in the Reserves and Surplus Accounts. Of those investments that exceeded the 2% limitation, none were corporate issuers. In our opinion, except for the deviations described in the third and fourth paragraphs, the City complied, in all material respects, with the aforementioned requirements for the year ended September 30, 2014.
175

Honorable Mayor and City Council City of Sanibel, Florida
This report is intended solely for the information and use of the City and the Florida Auditor General and is not intended to be, and should not be, used by anyone other than these specified parties.
CliftonLarsonAllen LLP
Fort Myers, Florida March 27, 2015
176

CITY OF SANIBEL
800 Dunlop Road Sanibel, Florida 33957
(239) 472-3700
www.mysanibel.com
About the Cover: Illustrated on the cover are plants in the City of Sanibel native plant gardens maintained at City Hall. Members of City Council's Vegetation Committee regularly offer tours of the garden, providing information on the benefits of native plants to reduce the use of fertilizers and water for irrigation on Sanibel. Left to right: Coreopsis lanceolata produces cheery flowers that attract birds and butterflies. It is easy to cultivate in any patch of sunny, moist soil and will come back year after year from self-sown seed. Commonly known as Tickseed, Coreopsis is Florida’s state wildflower. Rivina humilis, commonly known as Rouge Plant, is a member of the Pokeweed family. It is not tolerant of direct salt spray, but can do well in Sanibel’s saline soils and light shade. It has blooms and fruits nearly all year. Historically the juice of the showy, red berries has been used as a dye and ink. Helianthus debilis is drought and salt tolerant & well-suited for beach stabilization, but will provide a butterfly attractant in any sunny and dry location on Sanibel. Commonly known as Dune or Beach Sunflower, it is in the same genus as the large, upright, single-stalk sunflowers. Photography by Judith Zimomra. For addition information visit www.mysanibel.com.