City of Haines City, Florida Comprehensive Annual ... rpts/2016 haines city.pdf · April 25, 2017...
132
© Photo by Humberto Gutierrez City of Haines City, Florida Year End September 30, 2016 Comprehensive Annual Financial Report
Transcript of City of Haines City, Florida Comprehensive Annual ... rpts/2016 haines city.pdf · April 25, 2017...

© Photo by Humberto Gutierrez
City of Haines City, Florida
Year End September 30, 2016
Comprehensive AnnualFinancial Report

CITY OF HAINES CITY, FLORIDA
COMPREHENSIVE ANNUAL FINANCIAL REPORT
Fiscal Year Ended September 30, 2016
Prepared by: Department of Finance


CITY OF HAINES CITY, FLORIDA
Comprehensive Annual Financial ReportFiscal Year Ended September 30, 2016
TABLE OF CONTENTS
Page INTRODUCTORY SECTION
Letter of Transmittal i Organization Chart vi Principal City Officials vii Certificate of Achievement for Excellence in Financial Reporting viii
FINANCIAL SECTION
Independent Auditor’s Report 1 Management’s Discussion and Analysis 4
Basic Financial Statements
Government-wide Financial Statements Statement of Net Position 15 Statement of Activities 16
Fund Financial Statements
Balance Sheet–Governmental Funds 17 Reconciliation of the Balance Sheet of Governmental Funds to the Statement of Net Position 18 Statement of Revenues, Expenditures and Changes in Fund Balances– Governmental Funds 19 Reconciliation of the Statement of Revenues, Expenditures and Changes in Fund Balances of Governmental Funds to the Statement of Activities 20 Statement of Net Position–Proprietary Funds 21 Statement of Revenues, Expenses and Changes in Fund Net Position– Proprietary Funds 23 Statement of Cash Flows–Proprietary Funds 24 Statement of Fiduciary Net Position–Fiduciary Funds 26 Statement of Changes in Fiduciary Net Position–Pension Trust Funds 27 Notes to Financial Statements 28

Required Supplementary Information
Schedule of Revenues, Expenditures and Changes in Fund Balance– Budget and Actual–General Fund 58 Schedule of Revenues, Expenditures and Changes in Fund Balance– Budget and Actual–CRA Fund 59 Schedule of Changes in Net Pension Liability and Related Ratios- General Employees’ Pension 60 Schedule of Contributions-General Employees’ Pension 61 Schedules of Pension Investment Returns 62 Schedule of Changes in Net Pension Liability and Related Ratios- Police Officers’ Pension 63 Schedule of Contributions-Police Officers’ Pension 64 Schedule of Changes in Net Pension Liability and Related Ratios- Fire Fighters’ Pension 65 Schedule of Contributions-Fire Fighters’ Pension 66 Schedule of Funding Progress-Other Post-Employment Benefits 67
Other Supplementary Information
Statement of Changes in Assets and Liabilities– Right of Way Agency Fund 68
STATISTICAL SECTION
Net Position by Component 69 Changes in Net Position 70 Fund Balances, Governmental Funds 72 Changes in Fund Balances, Governmental Funds 73 Assessed Value and Estimated Actual Value of Taxable Property 74 Direct and Overlapping Property Tax Rates 75 Principal Taxpayers 76 Property Tax Levies and Collections 77 Ratios of Outstanding Debt by Type 78 Ratios of General Bonded Debt Outstanding 79 Direct and Overlapping Governmental Activities Debt 80 Legal Debt Margin Information 81 Pledged-Revenue Coverage 82 Demographic and Economic Statistics 83 Principal Employers 84 Full-time Equivalent City Government Employees by Function/Program 85 Operating Indicators by Function/Program 86 Capital Asset Statistics by Function/Program 87

COMPLIANCE SECTION
Independent Auditor’s Report on Internal Control Over Financial Reporting and on Compliance and Other Matters Based on an Audit of Financial Statements Performed in Accordance with Government Auditing Standards 88 Independent Auditor’s Report on Compliance for each Major Federal Program and State Project and on Internal Control over Compliance Required by the Uniform Guidance 90 Schedule of Expenditures of Federal Awards and State Financial Assistance Projects 92 Schedule of Findings and Questioned Costs 93 Independent Auditor's Management Letter 95 Independent Auditor’s Report – Investment Compliance 97


INTRODUCTORY SECTION
This section contains the following subsections:
Letter of Transmittal Organizational Chart List of City Officials Certificate of Achievement for Excellence in Financial Reporting


Our Mission
"Our team of professionals will provide our residents and business community with the highest quality services in a fiscally responsible manner through cooperation, strong ethical leadership with a lifelong commitment to enriching lives."
April 25, 2017
To the Honorable Mayor, City Commissioners and Citizens of the City of Haines City, Florida:
State law requires that all local governments publish each fiscal year a complete set of financial statements presented in conformity with accounting principles generally accepted in the United States of America (GAAP), and audited in accordance with auditing standards generally accepted in the United States of America by a firm of licensed certified public accountants. Pursuant to that requirement, we hereby issue the Comprehensive Annual Financial Report (CAFR) of the City of Haines City for the fiscal year ended September 30, 2016.
The report consists of management’s representation concerning the finances of the City of Haines City. Consequently, management assumes full responsibility for the completeness and reliability of all of the information presented in this report. To provide a reasonable basis for making these representations, management of the City of Haines City has established a comprehensive internal control framework that is designed both to protect the City’s assets from loss, theft, or misuse, and to compile sufficient reliable information for the preparation of the City of Haines City’s financial statements in conformity with GAAP. Furthermore, the cost of internal controls should not outweigh its benefits, the City of Haines City’s comprehensive framework of internal controls has been designed to provide reasonable -rather than absolute- assurance that the financial statements will be free from material misstatements. As management, we assert that, to the best of our knowledge and belief, the financial report is complete and reliable in all material respects.
The City of Haines City’s financial statements have been audited by Mauldin & Jenkins, L.L.C., a firm of licensed certified public accountants. The goal of the independent audit was to provide reasonable assurance that the basic financial statements of the City of Haines City for the fiscal year ended September 30, 2016, are free of material misstatements. The independent audit involved examining, on a test basis, evidence supporting the amount and disclosures in the financial statements; assessing the accounting principles used and significant estimates made by management; and evaluating the overall financial statement presentation. The independent auditor concluded, based upon the audit, that there was a reasonable basis for rendering an unqualified opinion that the City of Haines City’s financial statements for the fiscal year ended September 30, 2015, are fairly presented in conformity with GAAP. The independent auditors’ report is presented as the first component of the financial section of this report.
The independent audit of the financial statements of the City of Haines City was part of a broader, federal and state mandated “Single Audit” designed to meet the special needs of the federal and state grantor agencies. The standards governing Single Audit engagements require the independent auditor to report not only on the fair presentation of the financial statements, but also on the City’s internal controls and compliance with legal requirements, with special emphasis on the administration of federal and state awards.

ii
GAAP requires that management provide a narrative introduction, overview, and analysis to accompany the basic financial statements in the form of Management’s Discussion and Analysis (MD&A). This letter of transmittal is designed to complement the MD&A and should be read in conjunction with it. The City of Haines City’s MD&A can be found immediately following the independent auditors’ report.
Profile of the City
The City of Haines City, Florida, is a municipal corporation of the State of Florida and was incorporated in 1914. The City is located in Central Florida, some 40 miles west of Orlando and 60 miles east of Tampa. Because of this central location, Haines City is referred to as the “Heart of Florida”. The current permanent population is 23,252. The jurisdiction of the City encompasses 18.6 square miles of territory. The City is empowered to levy a property tax on real estate and personal properties located within its boundaries. It is empowered by state statute to extend its corporate limits by annexation, which occurs when deemed appropriate by the City Commission.
The City of Haines City operates under the Commission-Manager form of government. Policy direction and legislative authority are vested in a governing Commission consisting of five members. The City Commission is responsible for, among other things, enacting Ordinances, Resolutions and regulations governing the City, as well as appointing members of various boards, the City Manager, the City Clerk, and the City Attorney. The City Manager is responsible for implementing the policies adopted by the City Commission and for overseeing the day-to-day operations of the government. The City Manager is also charged with the hiring of department directors and with preparing a balanced recommended annual budget for the review and approval by the City Commission.
The City of Haines City provides a full range of services to its citizenry. These services include general government, police and fire protection, public works (including solid waste service), recreation and parks, library, economic and community development, and emergency management. In addition, the City operates the Water and Wastewater Utility and Stormwater Utility as enterprise activities and the Haines City Community Redevelopment Agency (CRA) as a Special Revenue Fund.
The financial reporting entity (the City of Haines City) includes all funds of the primary government (i.e., the City of Haines City as legally defined), as well as, all of its component units. Component units are legally separate entities for which the City of Haines City is financially accountable or the nature and significance of the relationship between the City and the entity was such that exclusion would cause the City’s financial statements to be misleading or incomplete.
The City has identified one component unit. The Community Redevelopment Agency (CRA) is reported as a blended component unit of the City and its governing body is composed of the members of the City Commission and two citizens or business owners appointed by the City Commission. Additional information can be found in (Note 1) of the notes to the basic financial statements.

iii
The annual budget serves as a foundation for the City of Haines City’s financial planning and control systems. All departments of the City are required to submit requests for appropriations to the City Manager and these requests are the starting point for developing a proposed budget. The City Manager then presents this proposed budget to the City Commission for review. The City Commission holds two (2) public hearings on the proposed budget prior to adopting the final budget and setting the tax rates for the budget year. Budgetary control over expenditures is legally maintained at the fund level. Therefore, management must have the City Commission’s approval to reallocate resources into or out of the fund. The budget to actual comparison for the General Fund is included as required supplementary information following the notes to the basic financial statements.
Factors Affecting Financial Condition
The information presented in the financial statements is best understood when it is considered from the broader perspective of the specific environment with which the City of Haines City operates.
Local Economy: The City is comprised of extensive residential housing stock with prices covering a broad range. Commercial projects continue to slowly develop in the area surrounding the local hospital in the northwest section of the City, as well as industrial projects in the City’s southern industrial park and along the Highway 27 corridor.
The economic condition of the area has been improving in the last couple of years. Property values had declined by forty percent (40%) through the year ended September 30, 2013, but has since recovered by increasing twenty percent (20%) through the year ended September 30, 2016. The unemployment rate continues to drop. It has declined from a high of 13.3% in 2010 to the current rate of 5.9% last year and this year. New housing starts increased over the previous year. The City issued 1,364 building permits for the fiscal year ended September 30, 2016, compared to 1,101 for fiscal year ended September 30, 2015. This is much higher than the 865 issued in the fiscal year ended September 30, 2012. The City will continue to work in unison to be good stewards of the financial resources collected from our residents to ensure that we manage the financial resources we have judiciously for future generations. The City is optimistic with the economic growth that is occurring in the community but understand there is still work to be done and we have a long way to go.
Relevant Financial Practices: The City incorporates fiscal practices within each budgetary cycle, on a fiscal year basis. These include budgetary practices, and financial practices. The fiscal practices encompass the City’s budgetary cycle from preparation to adoption. The process for amending the budget, the outline of legal level of budgetary control, as well as the use of revenues and appropriations are addressed. The practices speak to the use of funds from non-recurring revenue sources, the percentage makeup of Ad Valorem, or Property Taxes, of the total General Fund revenues, and process to apply for and subsequently accept grants staff may want to acquire.
In addition to these budgetary related issues, the fiscal practices also address long-range financial planning strategies, accounting and reporting practices, and establish the capitalization thresholds and capital expenditure limits. These practices allow for the administration of investments and procurements through other external policies, for which the City also maintains separate external policies.

iv
Major Initiatives: During Fiscal Year 2016, the City of Haines City achieved many significant accomplishments in furtherance of the goals and objectives established by the City Commission.
The accomplishments include the following:
The City continues to make improvements at the existing water and wastewater treatment facilities. Also, a new 20 inch water line and anionic ion exchange process is being designed to improve water quality, as well as system pressure within the water distribution system. The anionic ion exchange project is funded by a Florida Department of Environmental Protection State Revolving Fund (SRF) loan. A new mini pumper and pumper truck were purchased during the year as we continue to equip our fire fighters and the new Fire Station that was completed last year along with a new Fleet Management building. Achievement of the Government Finance Officers Association’s (GFOA) Distinguished Budget Presentation Award. Refunding of $25 million dollars of debt.
Fiscal Year 2016 encompassed a lot of change for the City, but the future will unfold even more rigorous accomplishments for the City, its employees, and its citizens.
Awards and Acknowledgements
The City of Haines City received the Government Finance Officers Association’s (GFOA) Certificate of Achievement for Excellence in Financial Reporting award for the seventh consecutive year for the City’s Comprehensive Annual Financial Report for the fiscal year ended September 30, 2015. The City also received its first ever Government Finance Officers Association’s (GFOA) Distinguished Budget Presentation Award. These Certificates of Achievement are the highest form of recognition for excellence in state and local government financial reporting and budgeting.
In order to be awarded a Certificate of Achievement, the City must publish an easily readable and efficiently organized Comprehensive Annual Financial Report. This report must satisfy both generally accepted accounting principles and applicable legal requirements. A Certificate of Achievement is valid for a period of one year only.
The City considers these awards not merely to be accolades hung on a wall, but yearly goals to hit and surpass the efforts of the previous year. The City understands that idle governments do not grow, yet it is the proactive vision of an organization that will continuously propel itself ahead.
The preparation of this report would not have been accomplished without the efficient and dedicated services of the entire staff of the Finance Department. Each member of the department has our sincere appreciation for the contributions made in the preparation of this report. The unconditional cooperation of the other departments and their respective staff is also greatly appreciated.
We also would like to express a special note of thanks to our external auditors, Mauldin & Jenkins, L.L.C., for their professional approach and high standards in the conduct of the independent audit of the City’s financial records and transactions.

v
Sincere appreciation is also expressed to the members of the City Commission for their leadership and support in matters pertaining to the financial affairs of the City.
Respectfully submitted,
Richard H. Sloan, MSCJ, CPM, FBINAA City Manager
Tavia Conner, CPA Finance Director

vi
CITY
OF
HAI
NES
CIT
Y O
RG
ANIZ
ATIO
NAL
CH
ART
CITIZENSOF
HAINES
CITY
CITY
COMMISSION
CITY
ATTO
RNEY
CITY
MAN
AGER
COMMUNITY
DEVE
LOPM
ENT
FINAN
CEFIRE
HUMAN
RESO
URC
ESLEISURE
SERV
ICES
POLICE
PUBLICWORK
SUTILITIES
CITY
CLER
K

vii
CITY OF HAINES CITY, FLORIDA
PRINCIPAL CITY OFFICIALS SEPTEMBER 30, 2016
CITY COMMISSION
Horace West, Mayor / Commissioner Don Mason, Vice Mayor / Commissioner
Kenneth Kipp, Commissioner Morris West, Commissioner
H.L. “Roy” Tyler, Commissioner
CITY MANAGER Richard H. Sloan
CITY CLERK Linda Bourgeois
CITY ATTORNEY Fred Reilly
CITY AUDITORS Mauldin & Jenkins, LLC

viii

FINANCIAL SECTION
This section contains the following subsections:
Independent Auditor's Report Management’s Discussion and Analysis Basic Financial Statements Required Supplementary Information


1401 MANATEE AVE WEST, SUITE 1200 • BRADENTON, FLORIDA 34205-7440 • 941-747-4483 • 855-891-0070 • FAX 941-747-6035 MEMBERS OF THE AMERICAN INSTITUTE OF CERTIFIED PUBLIC ACCOUNTANTS • www.mjcpa.com
INDEPENDENT AUDITOR’S REPORT
To the Honorable Mayor, Members of the City Council City of Haines City, Florida
Report on the Financial Statements
We have audited the accompanying financial statements of the governmental activities, the business-type activities, each major fund, and the aggregate remaining fund information of the City of Haines City, Florida (the “City”), as of and for the year ended September 30, 2016, and the related notes to the financial statements, which collectively comprise the City's basic financial statements as listed in the table of contents.
Management’s Responsibility for the Financial Statements
Management is responsible for the preparation and fair presentation of these financial statements in accordance with accounting principles generally accepted in the United States of America; this includes the design, implementation and maintenance of internal control relevant to the preparation and fair presentation of financial statements that are free from material misstatement, whether due to fraud or error.
Auditor’s Responsibility
Our responsibility is to express opinions on these financial statements based on our audit. We conducted our audit in accordance with auditing standards generally accepted in the United States of America and the standards applicable to financial audits contained in Government Auditing Standards, issued by the Comptroller General of the United States. Those standards require that we plan and perform the audit to obtain reasonable assurance about whether the financial statements are free from material misstatement.
An audit involves performing procedures to obtain audit evidence about the amounts and disclosures in the financial statements. The procedures selected depend on the auditor’s judgment, including the assessment of the risks of material misstatement of the financial statements, whether due to fraud or error. In making those risk assessments, the auditor considers internal control relevant to the entity’s preparation and fair presentation of the financial statements in order to design audit procedures that are appropriate in the circumstances, but not for the purpose of expressing an opinion on the effectiveness of the entity’s internal control. Accordingly, we express no such opinion. An audit also includes evaluating the appropriateness of accounting policies used and the reasonableness of significant accounting estimates made by management, as well as evaluating the overall presentation of the financial statements.
We believe that the audit evidence we have obtained is sufficient and appropriate to provide a basis for our audit opinions.

2
Opinions
In our opinion, the financial statements referred to above present fairly, in all material respects, the respective financial position of the governmental activities, the business-type activities, each major fund, and the aggregate remaining fund information of the City, as of September 30, 2016, and the respective changes in financial position and, where applicable, cash flows thereof for the year then ended in accordance with accounting principles generally accepted in the United States of America.
Other Matters
Required Supplementary Information
Accounting principles generally accepted in the United States of America require that the management’s discussion and analysis, budgetary comparison information, and pension and other post-employment benefit schedules on pages 4-14, 56-57 and 58-60, respectively, be presented to supplement the basic financial statements. Such information, although not a part of the basic financial statements, is required by the Governmental Accounting Standards Board, who considers it to be an essential part of financial reporting for placing the basic financial statements in an appropriate operational, economic or historical context. We have applied certain limited procedures to the required supplementary information in accordance with auditing standards generally accepted in the United States of America, which consisted of inquiries of management about the methods of preparing the information and comparing the information for consistency with management’s responses to our inquiries, the basic financial statements and other knowledge we obtained during our audit of the basic financial statements. We do not express an opinion or provide any assurance on the information because the limited procedures do not provide us with sufficient evidence to express an opinion or provide any assurance.
Other Information
Our audit was conducted for the purpose of forming opinions on the financial statements that collectively comprise the City's basic financial statements. The introductory section, individual fund statements and schedules, and statistical section are presented for purposes of additional analysis and are not a required part of the basic financial statements. The accompanying schedule of expenditures of federal awards and state financial assistance are presented for purposes of additional analysis as required Title 2 U.S. Code of Federal Regulations Part 200, Uniform Administrative Requirements, Cost Principles, and Audit Requirements for Federal Awards (Uniform Guidance) and by Section 215.97, Florida Statutes, and are also not a required part of the basic financial statements of the City.

3
The individual fund statements and schedules and the schedule of expenditures of federal awards and state financial assistance are the responsibility of management and were derived from and relate directly to the underlying accounting and other records used to prepare the basic financial statements. Such information has been subjected to the auditing procedures applied in the audit of the basic financial statements and certain additional procedures, including comparing and reconciling such information directly to the underlying accounting and other records used to prepare the basic financial statements or to the basic financial statements themselves, and other additional procedures in accordance with auditing standards generally accepted in the United States of America. In our opinion, the individual fund statements and schedules and the schedule of expenditures of federal awards and state financial assistance are fairly stated, in all material respects, in relation to the basic financial statements as a whole.
The introductory section and statistical section have not been subjected to the auditing procedures applied in the audit of the basic financial statements, and accordingly, we do not express an opinion or provide any assurance on them.
Other Reporting Required by Government Auditing Standards
In accordance with Government Auditing Standards, we have also issued our report dated April 25, 2017, on our consideration of the City’s internal control over financial reporting and on our tests of its compliance with certain provisions of laws, regulations, contracts and grant agreements, and other matters. The purpose of that report is to describe the scope of our testing of internal control over financial reporting and compliance and the results of that testing, and not to provide an opinion on internal control over financial reporting or on compliance. That report is an integral part of an audit performed in accordance with Government Auditing Standards in considering the City’s internal control over financial reporting and compliance.
Bradenton, Florida April 25, 2017


CITY OF HAINES CITY, FLORIDA MANAGEMENT’S DISCUSSION AND ANALYSIS
Year Ended September 30, 2016
4
The City of Haines City’s (the “City”) discussion and analysis is designed to provide the users with a narrative introduction, overview and analysis of the basic financial statements. Please read the information presented here in conjunction with the City’s financial statements and footnotes that follow this report.
FINANCIAL HIGHLIGHTS
The assets and deferred outflows of the City exceeded its liabilities and deferred inflows on September 30, 2016, by $83,897,563 (net position). This amount includes $61,631,302 invested in capital assets net of all related debt. Of this amount, unrestricted net position total $13,669,154.
The City’s total net position increased by $9,481,848 or 12.74%.
As of September 30, 2016, the City’s governmental funds reported combined ending fund balances of $13,454,192, an increase of $1,199,895 from the prior year. The improvement in the local economy along with extreme cost saving measures implemented by the City is the reason for the modest improvement in the ending fund balance amount.
The City’s total debt (including compensated absences and net pension liability) decreased by $857,762 (1.3%) during the current fiscal year.
OVERVIEW OF THE FINANCIAL STATEMENTS
The financial statement’s focus is on both the City as a whole (government-wide) and on the major individual funds. Both perspectives (government-wide and major fund) allow the user to address relevant questions, broaden a basis for comparison (year to year or government to government) and enhance the City’s accountability.
The City’s basic financial statements are comprised of three components: (1) government-wide financial statements; (2) fund financial statements; and (3) notes to the financial statements. The comprehensive annual financial report also contains other supplementary information in addition to the basic financial statements.
During the year ended September 30, 2016, the City adopted the provisions of GASB Statement No. 72 which improves the accounting and financial reporting related to fair value measurements impacting related disclosures. For the previous fiscal year ending September 30, 2015, the City implemented the provisions of Governmental Accounting Standards Board (GASB) Statement No. 68, Accounting and Financial Reporting for Pensions – an amendment of GASB Statement No. 27, as well as Statement No. 71, Pension Transition for Contributions Made Subsequent to the Measurement Date – an amendment of FASB Statement No. 68, which required the restatement of the September 30, 2014, net position of the governmental activities, business-type activities and enterprise funds.
In addition to assets, the statement of net position will sometimes report a separate section for deferred outflows of resources. This separate financial statement element, deferred outflow of resources, represents consumption of net position that applies to a future period(s) and so will not be recognized as an outflow of resources (expense/expenditure) until then. The City currently has $3,918,419 that qualifies for reporting in this category.
In addition to liabilities, the statement of net position will sometimes report a separate section for deferred inflows of resources. This separate financial statement element, deferred inflow of resources, represents consumption of net position that applies to a future period(s) and so will not be recognized as an inflow of resources (revenue) until then. The City currently has $1,176,020 that qualifies for reporting in this category.

CITY OF HAINES CITY, FLORIDA MANAGEMENT’S DISCUSSION AND ANALYSIS
Year Ended September 30, 2016
5
The government-wide financial statements are designed to provide readers with a broad overview of the City’s finances, in a manner similar to a private-sector business. The focus is on “activities” rather than (the previous model’s) “fund types.”
The Statement of Net Position presents information on all of the City’s assets and liabilities, with the difference between the two reported as net position. The focus of the Statement of Net Position (the “unrestricted net position”) is designed to be similar to bottom line results for the City and its governmental and business-type activities. Over time, the increases or decreases in net position may serve as a useful indicator of whether the financial position of the City is improving or deteriorating.
The Statement of Activities presents information showing how the City’s net position changed during the most recent fiscal year. All changes in net position are reported as soon as the underlying event giving rise to the change occurs, regardless of the timing of related cash flows. Thus, revenues and expenses are reported in this statement for some items that will only result in cash flows in future fiscal periods (e.g. uncollected revenues and earned but unused compensated absences).
Both of the government-wide financial statements distinguish functions of the City that are principally supported by taxes and intergovernmental revenues (governmental activities) from other functions that are intended to recover all or a significant portion of their costs through user fees and charges (business-type activities). The governmental activities of the City include general government, public safety, physical environment, transportation, economic environment, and culture and recreation. The business-type activities of the City consist of water/sewer utility and stormwater utility.
The government-wide financial statements include not only the City itself (the primary government) but also the legally separate community redevelopment agency (“CRA”). Financial information for this component unit is blended with the financial information presented for the primary government itself since its board members are primarily the same as the members of the City Commission.
The City has three defined benefit pension plans established for the exclusive benefit of its employees and beneficiaries.
Fund financial statements
A fund is a grouping of related accounts that is used to maintain control over the resources that have been segregated for specific activities or objectives. The City, like other state and local governments, uses fund accounting to ensure and demonstrate compliance with finance-related legal requirements. All of the funds of the City can be divided into three categories: (1) governmental funds, (2) proprietary funds, and (3) fiduciary funds. Traditional users of governmental financial statements will find the fund financial statements presentation more familiar.
Governmental funds. Governmental funds are used to account for essentially the same functions reported as governmental activities in the government-wide financial statements. However, unlike the government-wide financial statements, governmental fund financial statements focus on near-term inflows and outflows of spendable resources, as well as on balances of spendable resources available at the end of the fiscal year. Such information may be useful in evaluating the City’s near-term financing requirements.

CITY OF HAINES CITY, FLORIDA MANAGEMENT’S DISCUSSION AND ANALYSIS
Year Ended September 30, 2016
6
Because the focus of governmental funds is narrower than that of the government-wide financial statements, it is useful to compare the information presented for governmental funds with similar information presented for governmental activities in the government-wide financial statements. By doing so, readers may better understand the long-term impact of the City’s near-term financing decisions. Both the governmental fund Balance Sheet and the governmental fund Statement of Revenues, Expenditures and Changes in Fund Balances provide a reconciliation to facilitate this comparison between governmental funds and governmental activities.
The City maintains four individual governmental funds. Information is presented separately in the governmental fund Balance Sheet and in the governmental fund Statement of Revenues, Expenditures and Changes in Fund Balances for the General Fund, the Capital Projects Fund, the CRA Fund, and the Debt Service Fund, all of which are considered to be major funds. There was no activity in the Capital Projects Fund this year.
The City adopts an annual appropriated budget for its General Fund and the CRA Fund. Budgetary comparison schedules have been provided for the General Fund and CRA Fund to demonstrate compliance with the budget.
Proprietary funds. The City maintains two proprietary fund types. Enterprise funds are used to report the same functions presented as business-type activities in the government-wide financial statements. The City uses enterprise funds to account for its water/sewer and stormwater utility systems.
Fiduciary funds. Fiduciary funds are used to account for resources held for the benefit of parties outside the City. Fiduciary funds are not reflected in the government-wide financial statements because the resources of those funds are not available to support the City’s own programs. The accounting used for fiduciary funds is much like that used for proprietary funds. The City’s pension trust funds are included in the fiduciary fund type.
Notes to the financial statements
The notes provide additional information that is essential to a full understanding of the data provided in the government-wide and fund financial statements.
GOVERNMENT-WIDE FINANCIAL ANALYSIS
Statements of Net Position As noted earlier, net position may serve as a useful indicator of a government’s financial position over time. For the current year, the City’s assets exceeded liabilities by $83,897,563.

CITY OF HAINES CITY, FLORIDA MANAGEMENT’S DISCUSSION AND ANALYSIS
Year Ended September 30, 2016
7
The following table reflects the condensed Statements of Net Position for the current and prior years:
2016 2015 2016 2015 2016 2015
Current and other assets 14,937,444$ 13,658,730 17,124,177 14,035,289 32,061,621 27,694,019Capital assets 61,546,558 63,404,337 56,618,204 51,421,901 118,164,762 114,826,238
Total assets 76,484,002 77,063,067 73,742,381 65,457,190 150,226,383 142,520,257
Deferred outflows 3,441,796 1,287,174 476,623 140,878 3,918,419 1,428,052
Long-term liabilitiesoutstanding 46,773,892 49,178,248 16,092,085 14,226,237 62,865,977 63,404,485
Other liabilities 1,629,411 1,883,827 4,575,831 3,620,038 6,205,242 5,503,865Total liabilities 48,403,303 51,062,075 20,667,916 17,846,275 69,071,219 68,908,350
Deferred inflows 999,678 504,524 176,342 119,720 1,176,020 624,244
Net investment in capital assets 21,719,202 22,290,761 39,912,100 36,985,880 61,631,302 59,276,641Restricted 4,677,821 4,523,550 3,919,286 3,292,321 8,597,107 7,815,871Unrestricted 4,125,794 (30,669) 9,543,360 7,353,872 13,669,154 7,323,203
Total net position 30,522,817$ 26,783,642 53,374,746 47,632,073 83,897,563 74,415,715
Governmental Activities Business-type Activities Total
Seventy-three percent (73.5%) of the City’s net position reflects its investment in capital assets (e.g., land, buildings, improvements, infrastructure, and vehicles and equipment) less any related debt used to acquire those assets that is still outstanding. The City uses these capital assets to provide services to citizens; consequently, these assets are not available for future spending. Although the City’s investment in its capital assets is reported net of related debt, it should be noted that the resources needed to repay this debt must be provided from other sources, since the capital assets themselves cannot be used to liquidate these liabilities.
Ten percent (10.3%) of the City’s net position represents resources that are subject to external restrictions on how they may be used.
The increase in assets and net position of the City’s business-type activities is primarily due to the additions made to the City’s water distribution and sewer collection systems and decrease of the City’s long term liabilities including the refunding of debt, decrease in compensated absences due to the departure of tenured employees, and a decrease in the net pension liability.

CITY OF HAINES CITY, FLORIDA MANAGEMENT’S DISCUSSION AND ANALYSIS
Year Ended September 30, 2016
8
Statements of Activities
The following table reflects the condensed Statements of Activities for the current and prior years:
2016 2015 2016 2015 2016 2015Revenues Program revenues Charges for services 8,618,393$ 8,201,575 11,676,899 9,850,613 20,295,292 18,052,188 Operating grants and contributions 333,123 383,394 - - 333,123 383,394 Capital grants and contributions - 25,000 2,290,678 580,776 2,290,678 605,776
General revenues Property taxes 7,797,395 7,191,929 - - 7,797,395 7,191,929 Franchise taxes 1,810,206 1,971,016 - - 1,810,206 1,971,016 Utility taxes 1,771,016 1,637,064 - - 1,771,016 1,637,064 Communications service tax 518,919 514,898 - - 518,919 514,898 Local business tax 73,739 75,354 - - 73,739 75,354 Gas and fuel taxes 962,003 884,346 - - 962,003 884,346 State revenue sharing 2,184,678 2,019,140 - - 2,184,678 2,019,140 Unrestricted investment earnings 254,099 253,126 21,888 22,284 275,987 275,410 Gain on dispoal 7,258 155,580 - - 7,258 155,580 Total revenues 24,330,829 23,312,422 13,989,465 10,453,673 38,320,294 33,766,095
Expenses General government 3,468,800$ 3,595,254 - - 3,468,800 3,595,254 Public safety 8,703,603 8,762,723 - - 8,703,603 8,762,723 Physical environment 1,834,507 1,964,600 - - 1,834,507 1,964,600 Transportation 1,305,397 2,331,126 - - 1,305,397 2,331,126 Economic environment 292,272 227,942 - - 292,272 227,942 Culture and recreation 4,610,486 4,826,880 - - 4,610,486 4,826,880 Interest on long-term debt 1,976,589 1,989,212 - - 1,976,589 1,989,212 Water/sewer utility - - 6,349,429 6,724,698 6,349,429 6,724,698 Stormwater utility - - 297,363 237,584 297,363 237,584 Total expenses 22,191,654 23,697,737 6,646,792 6,962,282 28,838,446 30,660,019
Change in net position before transfers 2,139,175 (385,315) 7,342,673 3,491,391 9,481,848 3,106,076 Transfers 1,600,000 1,554,447 (1,600,000) (1,554,447) - -
Change in net position 3,739,175 1,169,132 5,742,673 1,936,944 9,481,848 3,106,076 Net position, beginning - as restated 26,783,642 25,614,510 47,632,073 45,695,129 74,415,715 71,309,639 Net position, ending 30,522,817$ 26,783,642 53,374,746 47,632,073 83,897,563 74,415,715
Governmental Activities Business-type Activities Total

CITY OF HAINES CITY, FLORIDA MANAGEMENT’S DISCUSSION AND ANALYSIS
Year Ended September 30, 2016
9

CITY OF HAINES CITY, FLORIDA MANAGEMENT’S DISCUSSION AND ANALYSIS
Year Ended September 30, 2016
10
Governmental Activities
Governmental activities net position increased by $3,739,175.
General revenues of governmental activities increased by $676,860 which indicates the local economy is stabilizing and property values have increased.
Program revenues of governmental activities increased by $341,547, showing a modest increase over last year’s gains from fire assessment program revenues. Charges for services increased by $416,818 as Operating grants and contributions decreased by $50,271 and Capital grants and contributions decreased by a combined $25,000. The City has been and will continue to be active in securing grant funding.
The expenses for governmental activities decreased by $1,506,083 compared to the prior year. This decrease is primarily due the less aggressive road paving program whereby eleven (11) roads were paved last year as well as salary savings as most departments were immensely understaffed.
Business-type Activities
Business-type activities net position increased by $5,742,673.
Program revenues of business type activities increased by $3,536,188, due to an increase in the amount the City received in capital grant funding.
Expenses of business-type activities decreased by $315,490 or 4.5%. The City continues to develop the most effective and efficient ways to provides services to its citizens.
FINANCIAL ANALYSIS OF THE CITY’S FUNDS
As noted earlier, the City uses fund accounting to ensure and demonstrate compliance with finance-related legal requirements.

CITY OF HAINES CITY, FLORIDA MANAGEMENT’S DISCUSSION AND ANALYSIS
Year Ended September 30, 2016
11
Governmental Funds
The focus of the City’s governmental funds is to provide information on near-term inflows, outflows and balances of spendable resources. Such information is useful in assessing the City’s financing requirements. In particular, unreserved fund balance may serve as a useful measure of a government’s net resources available for spending at the end of the fiscal year.
As of September 30, 2016, the City’s governmental funds reported combined ending fund balances of $13,454,192, an increase of $1,199,895 in comparison with the prior year. The increase is due to the improvement of the overall economic condition of the City. The City has implemented a non-ad valorem assessment for fire services to assist in offsetting a portion of the cost to provide fire protection. Each parcel of property is assessed $144.93. Additionally any relative improvements upon the property are assessed at $.85 per $1,000 of value. The data used to develop the assessment amount was obtained from the Polk County Property Appraiser. Also, the growth of the City superseded revenue projections.
The City has implemented the requirements of GASB 54 defining the manner in which Governmental Funds fund balance is classified. Fund balance is now divided into five categories, non-spendable, restricted, committed, assigned, and unassigned.
Non-spendable fund balance is the amounts that are not in spendable form (inventory or long-term receivables) or amounts that are required to be maintained intact (corpus of a permanent fund). Approximately $48,483 or 0.4% of total fund balance is classified as non-spendable.
Restricted fund balance is the amounts that can be spent only for specific purposes stipulated by external resource providers such as creditors, grantors, contributors, or laws or regulations of other governments, or imposed by law through constitutional provisions or enabling legislation. Approximately $4,677,821 or 34.8% of total fund balance is classified as restricted.
Committed fund balance is the amounts that can only be used for specific purposes pursuant to constraints imposed by formal action (resolution or ordinance) of the City Commission, the City’s highest level of decision-making authority. Committed amounts cannot be used for any other purposes unless the City Commission removes or changes the specified use by taking the same type of formal action (resolution or ordinance) it employed to commit those funds. Approximately $385,282 or 2.9% of total fund balance is classified as committed.
During the fiscal year of 2015, the City Commission committed funding of approximately $138,000, for the future construction of youth baseball/softball athletic fields. This revenue was experienced by the sale of East Park, to the city’s Utility Department (Enterprise Fund) for the construction of a composting facility vis-à-vis a public-private partnership. A corresponding resolution was adopted by the City Commission to restrict this revenue for recreational purposes specific to youth athletics. Capital construction has yet occurred, but staff has embarked upon a recreational master plan to address recreational programmatic needs for the next 15 to 20 years that will be presented in fiscal year 2017.
Assigned fund balance is the amount established by City Management intended to be used for specific purposes.
Unassigned fund balance is the residual classification representing fund balance that has not been restricted, committed or assigned. Approximately $8,342,606 or 62.0% of total fund balance is classified as unassigned.

CITY OF HAINES CITY, FLORIDA MANAGEMENT’S DISCUSSION AND ANALYSIS
Year Ended September 30, 2016
12
The General Fund is the chief operating fund of the City. At September 30, 2016, total fund balance of the General Fund is $12,467,040. Non-spendable fund balance equals $48,483 or 0.4%; restricted fund balance equals $3,577,253 or 28.7%; committed fund balance equals $385,282 or 3.1%: and unassigned fund balance equals $8,456,022 or 67.8%.
The fund balance of the City’s General Fund increased by $1,741,057 during the current fiscal year. As stated earlier, this increase is due to an overall improvement in the City’ economic condition, as well as new realized revenue streams and improved efficiencies in the delivery of services.
The fund balance of the City’s CRA fund increased by $720,869 during the current fiscal year.
It is essential that governments maintain an adequate level of fund balance to mitigate risks and provide a back-up for revenue shortfalls. Therefore the City has established the target minimum reserve balance in the City’s General Fund Unassigned Fund Balance equal to 17% of the General fund’s current fiscal year operating budget as recommended by the Governmental Finance Officers Association (GFOA). Currently the City is maintaining a 31.5% unassigned balance.
Proprietary Funds
The City’s proprietary funds provide the same type of information found in the government-wide financial statements, but in more detail.
Unrestricted net position of the Water and Sewer Fund and the Stormwater Utility Fund at September 30, 2016, amounted to $8,910,618 and $632,742, respectively. All stormwater fees are being collected through an assessment process on an annual basis. The stormwater fees will be collected in arrears going forward; therefore there is a natural lag in the collection cycle. Net position invested in capital assets, net of related debt, was $39,284,189 in the Water and Sewer Fund at year end. The change in net position for these funds was an increase of $2,927,665 and slight decrease of $1,445, respectively. The change in net position for the Water and Sewer Fund was due to a positive result from operating activities.
GENERAL FUND BUDGETARY HIGHLIGHTS
There is a $709,570 difference in appropriations between the original budget and the final amended budget for this fiscal year. The major reason for the difference is an increase in funding for the purchase of a new pumper truck for our growing fire department and to allow for leave payouts of employees retiring and departing the organization.
The difference between the final amended budget and actual expenditures was $821,325 and can be summarized as follows:
Various General Government departments under budget. Facilities Maintenance Division savings on building and repairs materials. Paving projects cost savings. Impact fees budgeted but not expended. Projects have been carried over to the 2016 budget year. Salary savings within other departments throughout the City due to vacant positions. Fuel costs decreased resulting from a decrease in gas prices.

CITY OF HAINES CITY, FLORIDA MANAGEMENT’S DISCUSSION AND ANALYSIS
Year Ended September 30, 2016
13
CAPITAL ASSET AND DEBT ADMINISTRATION
Capital Assets
The City’s investment in capital assets for its governmental and business-type activities, net of related debt, amounts to $61,631,302 (net of accumulated depreciation) as of September 30, 2016. This investment in capital assets includes land, buildings, improvements, infrastructure, vehicles and equipment. The total increase in the City’s investment in capital assets, net of related debt, for the current fiscal year (net of accumulated depreciation) was $2,354,661 (a decrease of $571,559 and an increase of $2,926,220 for governmental activities and business-type activities, respectively).
Major capital projects with substantial expenditures during the current fiscal year included the following:
Wastewater Treatment Plant Upgrades (Compost Facility and Anionic Ion Exchange System)
City of Haines City, Florida Capital Assets (Net of Accumulated Depreciation)
2016 2015 2016 2015 2016 2015
Land 8,986,434$ 9,004,809 728,150 483,853 9,714,584 9,488,662 Plant improvements - - 40,691,274 39,725,832 40,691,274 39,725,832 Buildings and improvements 42,089,580 44,356,787 191,495 180,648 42,281,075 44,537,435 Equipment 1,502,826 1,382,047 5,016,008 5,492,660 6,518,834 6,874,707 Transportation equipment 1,351,883 731,898 392,905 341,498 1,744,788 1,073,396 Infrastructure 6,398,553 6,719,590 440,158 453,223 6,838,711 7,172,813 Library books 142,422 205,987 - - 142,422 205,987 Construction in progress 1,074,860 1,003,219 9,158,214 4,744,187 10,233,074 5,747,406
Total 61,546,558$ 63,404,337 56,618,204 51,421,901 118,164,762 114,826,238
Governmental Activities Business-type Activities Total
Additional information on the City’s capital assets can be found in Note 4 to the Financial Statements on pages 40-41 of this report.
Long-term Debt
At the end of the current fiscal year, the City had total long term liabilities of $63,992,342, a decrease of $857,762 from the prior year.
City of Haines City, Florida Long-Term Debt
2016 2015 2016 2015 2016 2015
Total long term liabilities 46,773,892$ 49,178,248 17,218,450 15,671,856 63,992,342 64,850,104
Governmental Activities Business-type Activities Total
Additional information on the City’s long-term debt can be found in Note 7 to the Financial Statements on pages 43-47 of this report.

CITY OF HAINES CITY, FLORIDA MANAGEMENT’S DISCUSSION AND ANALYSIS
Year Ended September 30, 2016
14
NEXT YEAR’S BUDGETS AND RATES
The City’s millage rate has remained the same since fiscal year 2014 at 7.79 mills. For the fiscal year 2016, the City’s property tax valuation increased by $70,633,294 (8.75%). The increase is due to the upturn in property values as well as a modest amount of new growth. Balancing the annual budget continues to be a struggle as the City moves forward. The City has approved the levy of a Fire Service Assessment for property within the city limits of Haines City for the third year. Each parcel of land will be assessed a flat amount of $144.93 plus $.85 per every $1,000 of value for all relative improvements upon that parcel. The billing for the assessment will be included on the property owner’s tax bill which is issued by the Polk County Tax Collector.
ECONOMIC FACTORS
With all major market indicators showing that the economy is slowly recovering, the City is optimistic about what lies ahead in the coming fiscal years. Although the City’s housing market remains well below what it was in 2007, activity is slowly gaining momentum. The City issued 1,364 building permits in fiscal year 2016, as compared to 1,101 for last year. Therefore optimism remains high that this upward trend will continue. The area’s unemployment rate continues to drop. The current rate is 5.9%, well below the double digit rate of several years ago. The City will continue to work in unison to be good stewards of the financial resources collected from our residents to ensure that we manage the financial resources we have judiciously for future generations. The City is optimistic with the economic growth that is occurring in the community but understand there is still work to be done and we have a long way to go.
When you look at Haines City’s geographical location you see that it is the heart of Florida. It is within a short driving distance of some of the major tourist attractions of the world. The City has begun a campaign to take advantage of its location. With events like the Florida Iron Man competition, Ribs on the Ridge-Jack Daniels qualifying bar-b-que competition and Thunder on the Ridge Fourth of July Celebration, the City hopes to attract other events to stimulate the local economy. The City has invested $25 million in Lake Eva Park located in the City boundaries. The park is a multi-purpose recreational facility that rivals any in the area and has the capacity to accommodate a variety of different type and size events. The City wants to become a destination point. We found our heart beat in the heart of Florida; we invite everyone to come find theirs.
REQUESTS FOR INFORMATION
This financial report is designed to provide a general overview of the City’s finances for all those with an interest in the City’s finances. Questions concerning any of the information provided in this report or requests for additional financial information should be addressed to the Finance Director, City of Haines City, 620 E. Main Street, Haines City, Florida 33844.


Governmental Business-typeActivities Activities Total
ASSETSCash and cash equivalents 10,289,698$ 7,748,155$ 18,037,853$Accounts receivable, net 952,223 1,208,116 2,160,339Internal balances 18,924 (18,924) -Due from other governments 406,468 2,975,905 3,382,373Inventory 46,848 96,523 143,371Prepaid items 1,000 747 1,747Restricted cash and cash equivalents 3,221,648 5,113,655 8,335,303Long-term receivables 635 - 635Capital assets
Non-depreciable assets 10,061,294 9,886,363 19,947,657Depreciable assets, net of depreciation 51,485,264 46,731,841 98,217,105
TOTAL ASSETS 76,484,002 73,742,381 150,226,383
DEFERRED OUTFLOWS OF RESOURCESDeferred outflows - pensions 2,370,727 476,623 2,847,350Deferred loss on refunding 1,071,069 - 1,071,069
Total deferred outlows of resources 3,441,796 476,623 3,918,419
LIABILITIESAccounts payable 1,051,691 2,214,649 3,266,340Due to other governments 1,461 - 1,461Accrued interest 259,575 - 259,575Accrued payroll 235,489 27,453 262,942Deposits 40,381 - 40,381Unearned revenues 40,814 - 40,814Current liabilities payable from restricted assets
Accrued interest payable - 102,071 102,071Current portion of long-term debt - 1,126,365 1,126,365Deposits - 1,092,278 1,092,278Other liabilities - 13,015 13,015
Noncurrent liabilitiesPortion due within one year 1,812,407 137,464 1,949,871Portion due after one year 44,961,485 15,954,621 60,916,106
TOTAL LIABILITIES 48,403,303 20,667,916 69,071,219
DEFERRED INFLOWS OF RESOURCESDeferred inflows - pensions 999,678 176,342 1,176,020
NET POSITIONNet investment in capital assets 21,719,202 39,912,100 61,631,302Restricted for
Building permits 440,995 - 440,995Impact fee requirements 3,067,903 - 3,067,903Confiscated property 59,132 - 59,132Law enforcement training 9,223 - 9,223Capital projects - 2,870,955 2,870,955Community Development 924,322 - 924,322Debt service 176,246 1,048,331 1,224,577
Unrestricted 4,125,794 9,543,360 13,669,154 TOTAL NET POSITION 30,522,817$ 53,374,746$ 83,897,563$
Primary Government
STATEMENT OF NET POSITION
CITY OF HAINES CITY, FLORIDA
SEPTEMBER 30, 2016
The notes to the financial statements are an integral part of this statement.15

Ope
ratin
gC
apita
lC
harg
es fo
rG
rant
s and
Gra
nts a
ndG
over
nmen
tal
Bus
ines
s-ty
peE
xpen
ses
Serv
ices
Con
trib
utio
nsC
ontr
ibut
ions
Act
iviti
esA
ctiv
ities
Tot
alPR
IMA
RY
GO
VE
RN
ME
NT
Gov
ernm
enta
l act
iviti
esG
ener
al g
over
nmen
t3,
468,
800
$
1,70
1,92
6$
9,
352
$
-
$
(1
,757
,522
)$
-
$
(1,7
57,5
22)
$
Pu
blic
safe
ty8,
703,
603
3,33
1,89
1
6,
441
-
(5
,365
,271
)
-
(5,3
65,2
71)
Ph
ysic
al e
nviro
nmen
t1,
834,
507
2,53
0,45
5
-
-
69
5,94
8
-
69
5,94
8
Tr
ansp
orta
tion
1,30
5,39
7
40
6,95
8
-
-
(898
,439
)
-
(8
98,4
39)
Econ
omic
env
ironm
ent
292,
272
-
-
-
(2
92,2
72)
-
(292
,272
)
C
ultu
re a
nd re
crea
tion
4,61
0,48
6
64
7,16
3
317,
330
-
(3
,645
,993
)
-
(3,6
45,9
93)
In
tere
st o
n lo
ng-te
rm d
ebt
1,97
6,58
9
-
-
-
(1
,976
,589
)
-
(1,9
76,5
89)
T
otal
gov
ernm
enta
l act
iviti
es22
,191
,654
8,
618,
393
333,
123
-
(1
3,24
0,13
8)
-
(1
3,24
0,13
8)
Bus
ines
s-ty
pe a
ctiv
ities
Wat
er a
nd se
wer
6,34
9,42
9
11
,159
,520
-
2,
290,
678
-
7,
100,
769
7,
100,
769
St
orm
wat
er29
7,36
3
517,
379
-
-
-
220,
016
220,
016
Tot
al b
usin
ess-
type
act
iviti
es6,
646,
792
11,6
76,8
99
-
2,29
0,67
8
-
7,32
0,78
5
7,32
0,78
5
Tot
al p
rim
ary
gove
rnm
ent
28,8
38,4
46$
20,2
95,2
92$
333,
123
$
2,
290,
678
$
(13,
240,
138)
$
7,32
0,78
5$
(5,9
19,3
53)
$
GE
NE
RA
L R
EV
EN
UE
SPr
oper
ty ta
xes
7,79
7,39
5
-
7,79
7,39
5
Gas
and
fuel
taxe
s 96
2,00
3
-
96
2,00
3
U
tility
taxe
s1,
771,
016
-
1,
771,
016
C
omm
unic
atio
ns se
rvic
e ta
x51
8,91
9
-
51
8,91
9
Lo
cal b
usin
ess t
ax73
,739
-
73
,739
Fr
anch
ise
taxe
s1,
810,
206
-
1,
810,
206
St
ate
reve
nue
shar
ing
2,18
4,67
8
-
2,18
4,67
8
Gai
n on
dis
posa
l of c
apita
l ass
ets
7,25
8
-
7,25
8
U
nres
trict
ed in
vest
men
t ear
ning
s25
4,09
9
21
,888
275,
987
Tot
al g
ener
al r
even
ues
15,3
79,3
13
21
,888
15,4
01,2
01
Tran
sfer
s1,
600,
000
(1
,600
,000
)
-
Tot
al g
ener
al r
even
ues a
nd tr
ansf
ers
16,9
79,3
13
(1
,578
,112
)
15
,401
,201
Cha
nge
in n
et p
ositi
on
3,73
9,17
5
5,74
2,67
3
9,48
1,84
8
Net
pos
ition
, beg
inni
ng o
f yea
r26
,783
,642
47,6
32,0
73
74
,415
,715
N
et p
ositi
on, e
nd o
f yea
r30
,522
,817
$
53,3
74,7
46$
83
,897
,563
$
The notes to the financial statements are an integral part of this statement.16
CIT
Y O
F H
AIN
ES
CIT
Y, F
LO
RID
A
STA
TE
ME
NT
OF
AC
TIV
ITIE
SFO
R T
HE
FIS
CA
L Y
EA
R E
ND
ED
SE
PTE
MB
ER
30,
201
6
Prog
ram
Rev
enue
sN
et (E
xpen
se) R
even
ue a
nd C
hang
es in
Net
Pos
ition

Debt TotalGeneral CRA Service Governmental
Fund Fund Fund FundsAssets Cash and cash equivalents 9,360,804$ 928,894$ -$ 10,289,698$ Accounts receivable 838,807 - 113,416 952,223 Due from other funds 18,924 - - 18,924 Due from other governments 406,468 - - 406,468 Inventory 46,848 - - 46,848 Prepaid items 1,000 - - 1,000 Restricted cash and cash equivalents 3,158,818 - 62,830 3,221,648 Long-term receivables 635 - - 635
Total assets 13,832,304$ 928,894$ 176,246$ 14,937,444$
Liabilities Accounts payable 1,051,070$ 621$ -$ 1,051,691$ Due to other governments 1,461 - - 1,461 Accrued payroll 231,538 3,951 - 235,489 Other current liabilities 40,381 - - 40,381 Unearned revenue 40,814 - - 40,814
Total liabilities 1,365,264 4,572 - 1,369,836
Deferred Inflows of ResourcesUnavailable revenue - interest rebate - - 113,416 113,416
Total deferred inflows of resources - - 113,416 113,416
Fund BalancesNonspendable
Inventory 46,848 - - 46,848 Prepaid items 1,000 - - 1,000 Long-term receivables 635 - - 635
Restricted forBuilding permits 440,995 - - 440,995 Impact fee requirements 3,067,903 - - 3,067,903 Confiscated property 59,132 - - 59,132 Law enforcement training 9,223 - - 9,223 Community development - 924,322 - 924,322 Debt Service - - 176,246 176,246
Committed for capital projects 385,282 - - 385,282 Unassigned 8,456,022 - (113,416) 8,342,606
Total fund balances 12,467,040 924,322 62,830 13,454,192 Total liabilities, deferred inflows, and fund balances 13,832,304$ 928,894$ 176,246$ 14,937,444$
CITY OF HAINES CITY, FLORIDA
BALANCE SHEET
SEPTEMBER 30, 2016GOVERNMENTAL FUNDS
The notes to the financial statements are an integral part of this statement.17

CITY OF HAINES CITY, FLORIDA
RECONCILIATION OF BALANCE SHEET OF GOVERNMENTAL FUNDSTO THE STATEMENT OF NET POSITION
SEPTEMBER 30, 2016
Total fund balances for governmental funds 13,454,192$
1.Land 8,986,434$
42,089,580
Equipment, net of $5,114,728 accumulated depreciation 1,502,826 1,351,883
Infrastructure, net of $3,722,530 accumulated depreciation 6,398,553 Library books, net of $616,017 accumulated depreciation 142,422 Construction in progress 1,074,860
Total capital assets, net 61,546,558
2.
CenterState Bank loans (15,493,540) Florida Municipal Loan Council loan (24,109,000) Deferred loss on refunding 1,071,069 Capital leases obligations (224,816) Accrued interest on long-term debt (259,575) Compensated absences (1,229,728) Net pension liability (4,584,080) Other post-employment benefits (1,132,728)
Total long-term liabilities and accrued interest (45,962,398)
3.
Deferred outflows - pensions 2,370,727 Deferred inflows - pensions (999,678)
Total deferred outflows / inflows of resources 1,371,049
4.113,416
Total net position of governmental activities 30,522,817$
Total net position reported for governmental activities in the statement of net position is different because:
Capital assets used in governmental activities are not financial resources and
Transportation equipment, net of $3,871,209 accumulated depreciation
Deferred outflows and deferred inflows related to the City's pension plansare not expected to be liquidated with expendable available financialresources and are therefore, not reported in the funds.
Long-term liabilities and related accrued interest applicable to the City'sgovernmental activities are not due and payable in the current period andaccordingly are not reported as fund liabilities, except for portions payableearly in the following year for which sufficient resources have beenaccumulated in the funds to liquidate the liabilities. These liabilities consistof:
Buildings and improvements, net of $18,820,329 accumulated depreciation
Some assets are not available to pay for current period expenditures and therefore are not reported in the funds.
The notes to the financial statements are an integral part of this statement.18
Debt TotalGeneral CRA Service Governmental
Fund Fund Fund FundsRevenues
Property taxes 6,626,697$ 1,170,698$ -$ 7,797,395$ Gas and fuel taxes 962,003 - - 962,003 Utility taxes 1,771,016 - - 1,771,016 Communications service tax 518,919 - - 518,919 Local business tax 73,739 - - 73,739 Franchise fees 1,810,206 - - 1,810,206 Licenses and permits 1,253,265 - - 1,253,265 Intergovernmental 2,406,563 - - 2,406,563 Charges for services 3,538,090 - - 3,538,090 Fines and forfeitures 1,366,205 - - 1,366,205 Assessments 1,810,363 - - 1,810,363 Impact fees 498,955 - - 498,955 Contributions 126,421 - - 126,421 Interest 27,206 2,241 111,236 140,683 Other 135,903 429 - 136,332
Total revenues 22,925,551 1,173,368 111,236 24,210,155
ExpendituresCurrent
General government 3,364,526 - - 3,364,526 Public safety 8,581,570 - - 8,581,570 Physical environment 1,847,682 - - 1,847,682 Transportation 1,022,060 - - 1,022,060 Economic environment - 85,986 - 85,986 Culture and recreation 3,283,886 194,734 - 3,478,620 Debt service
Principal - - 1,842,347 1,842,347 Interest - - 1,879,806 1,879,806 Bond issuance costs - - 15,347 15,347
Capital outlay 1,645,296 29,700 - 1,674,996 Total expenditures 19,745,020 310,420 3,737,500 23,792,940
Excess (deficiency) of revenues over(under) expenditures 3,180,531 862,948 (3,626,264) 417,215
Other financing sources (uses)Insurance proceeds 7,258 - - 7,258 Issuance of capital leases 93,092 - - 93,092 Refunding notes issued 11,635 85,325 24,012,040 24,109,000 Payment to refunded debt escrow agent - - (25,026,670) (25,026,670) Transfers in 1,600,000 1,370,990 3,378,863 6,349,853 Transfers out (3,151,459) (1,598,394) - (4,749,853)
Total other financing sources (uses) (1,439,474) (142,079) 2,364,233 782,680
Net change in fund balances 1,741,057 720,869 (1,262,031) 1,199,895
Fund balances, beginning of year 10,725,983 203,453 1,324,861 12,254,297 Fund balances, end of year 12,467,040$ 924,322$ 62,830$ 13,454,192$
FOR THE FISCAL YEAR ENDED SEPTEMBER 30, 2016
CITY OF HAINES CITY, FLORIDA
STATEMENT OF REVENUES, EXPENDITURES AND CHANGES IN FUND BALANCESGOVERNMENTAL FUNDS
The notes to the financial statements are an integral part of this statement.19

Total net change in fund balances for governmental funds 1,199,895$
Capital outlay 1,674,996$Depreciation expense (3,456,797) (1,781,801)
Net book value of assets disposed (75,978)
113,416
New refunding notes payable and capital lease (24,202,092)Principal payments 25,447,347 1,245,255
Accrued interest on long-term debt 360,387 Pension expense 1,704,031 Compensated absences 88,716 Other post-employment benefits payable (86,212) 2,066,922
Prepaid debt insurance costs (8,381) Debt issuance premium 8,845 Loss on refunding debt 971,002 971,466
CHANGE IN NET POSITION OF GOVERNMENTAL ACTIVITIES 3,739,175$
CITY OF HAINES CITY, FLORIDA
RECONCILIATION OF THE STATEMENT OF REVENUES, EXPENDITURES AND CHANGESIN FUND BALANCES OF GOVERNMENTAL FUNDS TO THE STATEMENT OF ACTIVITIES
Governmental funds report capital outlays as expenditures. However, in the statement ofactivities, the cost of those assets is allocated over their estimated useful lives and reportedas depreciation expense in the current period.
Expense is recorded on the statement of activities for amortization of the following items:
FOR THE FISCAL YEAR ENDED SEPTEMBER 30, 2016
The change in net position reported for governmental activities in the statement ofactivities is different because:
Proceeds of certain long-term debt are reported as financing sources in governmental fundsand thus contribute to the increase in fund balance. In the statement of net position,however, issuing debt increases long-term liabilities and does not affect the statement ofactivities. Similarly, repayment of principal is an expenditure in the governmental fundsbut reduces the liability in the statement of net position. This is the amount by whichpayment of principal on this debt exceeds (is exceeded by) the proceeds from issuance ofnew debt.
Under the modified accrual basis of accounting used in the governmental funds,expenditures are not recognized for transactions that are not normally paid withexpendable available financial resources. In the statement of activities, however, which ispresented on the accrual basis, expenses and liabilities are reported regardless of whenfinancial resources are used. The net change associated with these expenses/expenditures isas follows:
The net effect of various miscellaneous transactions (i.e. sales and donations) is to decreasenet position.
Revenues in the statement of activities that do not provide current financial resources are not reported as revenues in the funds.
The notes to the financial statements are an integral part of this statement.20

CITY OF HAINES CITY, FLORIDA
STATEMENT OF NET POSITIONPROPRIETARY FUNDSSEPTEMBER 30, 2016
Water and StormwaterSewer Fund Fund Total
AssetsCurrent assets Cash and cash equivalents 6,976,093$ 772,062$ 7,748,155$ Accounts receivable, net of allowances 1,208,116 - 1,208,116 Due from other governments 2,967,208 8,697 2,975,905 Inventories 96,523 - 96,523 Prepaid items 747 - 747 Total current assets 11,248,687 780,759 12,029,446
Noncurrent assetsRestricted assets
Cash and cash equivalents 5,113,655 - 5,113,655 Capital assets
Land 672,198 55,952 728,150 Stormwater improvements - 811,768 811,768 Plant and plant improvements 61,781,000 - 61,781,000 Buildings and improvements 308,626 - 308,626 Equipment 9,088,118 19,331 9,107,449 Transportation equipment 1,314,120 - 1,314,120 Construction in progress 9,030,415 127,798 9,158,213
Less accumulated depreciation (26,204,184) (386,938) (26,591,122) Total capital assets (net of accumulated depreciation) 55,990,293 627,911 56,618,204
Total noncurrent assets 61,103,948 627,911 61,731,859
Total assets 72,352,635 1,408,670 73,761,305
Deferred Outflows of ResourcesDeferred outflows - pensions 447,656 28,967 476,623
The notes to the financial statements are an integral part of this statement.21

CITY OF HAINES CITY, FLORIDA
STATEMENT OF NET POSITIONPROPRIETARY FUNDSSEPTEMBER 30, 2016
Water and StormwaterSewer Fund Fund Total
LiabilitiesCurrent liabilities
Accounts payable 2,079,599$ 135,050$ 2,214,649$ Due to other funds 18,924 - 18,924 Accrued liabilities 22,831 4,622 27,453 Current portion of compensated absences 128,214 9,250 137,464
Current liabilities payable from restricted assetsCurrent portion of long-term debt 1,126,365 - 1,126,365 Accrued interest payable 102,071 - 102,071 Deposits 1,092,278 - 1,092,278 Other liabilities 13,015 - 13,015
Total current liabilities 4,583,297 148,922 4,732,219
Noncurrent liabilitiesLong-term liabilities 15,937,276 17,345 15,954,621
Total long-term liabilities 15,937,276 17,345 15,954,621
Total liabilities 20,520,573 166,267 20,686,840
Deferred Inflows of ResourcesDeferred inflows - pensions 165,625 10,717 176,342
Net PositionNet investment in capital assets 39,284,189 627,911 39,912,100 Restricted for
Capital projects 2,870,955 - 2,870,955 Debt service 1,048,331 - 1,048,331
Unrestricted 8,910,618 632,742 9,543,360
Total Net Position 52,114,093$ 1,260,653$ 53,374,746$
The notes to the financial statements are an integral part of this statement.22

Water and StormwaterSewer Fund Fund Total
Operating revenuesCharges for services 9,840,486$ 516,915$ 10,357,401$ Impact fees 1,185,449 - 1,185,449 Miscellaneous 133,585 464 134,049
Total operating revenues 11,159,520 517,379 11,676,899
Operating expensesPersonnel services 1,021,437 111,088 1,132,525 Other services and charges 3,049,782 172,685 3,222,467 Depreciation 2,034,510 13,590 2,048,100
Total operating expenses 6,105,729 297,363 6,403,092
Operating income 5,053,791 220,016 5,273,807
Nonoperating revenues (expenses) Interest revenue 20,310 1,578 21,888 Interest expense (245,557) - (245,557) Gain on disposal of capital assets 1,857 - 1,857 Total nonoperating revenues (expenses) (223,390) 1,578 (221,812)
Income before capital contributions and transfers 4,830,401 221,594 5,051,995
Capital contributions 2,290,678 - 2,290,678 Transfers out (1,600,000) - (1,600,000)
Change in net position 5,521,079 221,594 5,742,673
Net position, beginning of year 46,593,014 1,039,059 47,632,073
Net position, end of year 52,114,093$ 1,260,653$ 53,374,746$
CITY OF HAINES CITY, FLORIDA
STATEMENT OF REVENUES,EXPENSES AND CHANGES IN NET POSITION
PROPRIETARY FUNDSFOR THE FISCAL YEAR ENDED SEPTEMBER 30, 2016
The notes to the financial statements are an integral part of this statement.23

Water and StormwaterSewer Fund Fund Total
Cash Flows from Operating ActivitiesCash received from customers 11,199,293$ 515,752$ 11,715,045$ Cash payments to suppliers for goods and services (1,881,729) (44,742) (1,926,471) Cash payments to employees for services (2,005,822) (185,282) (2,191,104)
Net cash provided by operating activities 7,311,742 285,728 7,597,470
Cash Flows from Noncapital Financing ActivitiesTransfers out (1,600,000) - (1,600,000)
Net cash used in noncapital financing activities (1,600,000) - (1,600,000)
Cash Flows from Capital and Related Financing ActivitiesCapital contributions 2,290,678 - 2,290,678 Acquisition and construction of capital assets (7,232,258) (12,145) (7,244,403) Principal paid on loans payable (1,445,619) - (1,445,619) Interest paid on loans payable (257,338) - (257,338) Proceeds from issuance of notes payable 2,462,096 - 2,462,096
Proceeds from sales of capital assets 1,857 - 1,857 Net cash used in capital and related financing activities (4,180,584) (12,145) (4,192,729)
Cash Flows from Investing Activities Interest received 20,310 1,578 21,888 Net cash provided by investing activities 20,310 1,578 21,888
Net change in cash and cash equivalents 1,551,468 275,161 1,826,629
Cash and cash equivalents, beginning of year 10,538,280 496,901 11,035,181 Cash and cash equivalents, end of year 12,089,748$ 772,062$ 12,861,810$
Cash and cash equivalents classified asCurrent assets 6,976,093$ 772,062$ 7,748,155$ Restricted assets 5,113,655 - 5,113,655
12,089,748$ 772,062$ 12,861,810$
(Continued)
CITY OF HAINES CITY, FLORIDA
STATEMENT OF CASH FLOWSPROPRIETARY FUNDS
FOR THE FISCAL YEAR ENDED SEPTEMBER 30, 2016
The notes to the financial statements are an integral part of this statement.24

Water and StormwaterSewer Fund Fund Total
Reconciliation of operating income to net cashprovided by operating activities
Operating income 5,053,791$ 220,016$ 5,273,807$ Adjustments to reconcile operating income to net cash
provided by operating activitiesDepreciation expense 2,034,510 13,590 2,048,100 Change in assets and liabilities
(Increase) decrease inAccounts receivable (33,112) - (33,112) Due from other governments - (1,627) (1,627) Inventory 25,421 - 25,421 Prepaids (747) - (747) Deferred outflows - pensions (318,849) (16,896) (335,745)
Increase (decrease) inAccounts payable 1,141,966 127,943 1,269,909 Due to other funds 1,413 - 1,413 Accrued liabilities (55,966) - (55,966) Customer deposits 72,885 - 72,885 Deferred inflows - pensions 56,163 459 56,622 Net pension liability (682,434) (64,762) (747,196) Other postemployment benefits 16,165 539 16,704 Compensated absences 536 6,466 7,002
Total adjustments 2,257,951 65,712 2,323,663
Net cash provided by operating activities 7,311,742$ 285,728$ 7,597,470$
FOR THE FISCAL YEAR ENDED SEPTEMBER 30, 2016
CITY OF HAINES CITY, FLORIDA
STATEMENT OF CASH FLOWSPROPRIETARY FUNDS
The notes to the financial statements are an integral part of this statement.25

Right of WayPension Agency
Trust Funds FundAssets
Cash and cash equivalents $ 664,300 $ 11,771 Receivables
Contributions receivable 21,622 - Accrued interest and dividends 27,413 -
Investments, at fair valueU.S Government agencies 431,873 - Municipal obligations 54,008 - Corporate bonds 2,780,009 - Common equity securities 17,885,808 - Fixed income mutual funds 7,923,340 -
Total assets $ 29,788,373 $ 11,771
LiabilitiesDeposits held in custody for others $ - $ 11,771
Total liabilities - 11,771
Net positionRestricted for pension benefits $ 29,788,373 $ -
CITY OF HAINES CITY, FLORIDA
STATEMENT OF FIDUCIARY NET POSITIONFIDUCIARY FUNDS
SEPTEMBER 30, 2016
The notes to the financial statements are an integral part of this statement.26

PensionTrust Funds
AdditionsContributionsEmployer 838,351$ Employee 310,772 State of Florida 245,484
Total contributions 1,394,607
Investment earningsInterest 113,310 Dividends 678,991 Net appreciation in fair value of investments 1,190,965
Net investment earnings 1,983,266
Total additions 3,377,873
DeductionsPension benefits 2,315,517 Administrative expenses 322,404
Total deductions 2,637,921
Change in net position 739,952
Net position, restricted for pension benefits Beginning of year 29,048,421
End of year 29,788,373$
CITY OF HAINES CITY, FLORIDA
STATEMENT OF CHANGES IN FIDUCIARY NET POSITIONPENSION TRUST FUNDS
FOR THE FISCAL YEAR ENDED SEPTEMBER 30, 2016
The notes to the financial statements are an integral part of this statement.27


CITY OF HAINES CITY, FLORIDA NOTES TO FINANCIAL STATEMENTS
Fiscal Year Ended September 30, 2016
28
NOTE 1 SUMMARY OF SIGNIFICANT ACCOUNTING POLICIES
Reporting Entity
The City of Haines City, Florida (the “City”), was originally incorporated under the General Statutes of Florida as the Town of Haines City on February 23, 1914. The first state legislative act affecting the City was enacted on May 20, 1919, and, by Chapter 8272, it was reincorporated under a City Council form of government. The present charter was adopted as Chapter 12790 on July 1, 1927, changing the form of government to "Commission-Manager Plan,” as amended. The City operates under a commission-manager form of government and provides the following services as authorized by its charter: Public safety (Police and Fire), Streets and Highways, Culture-Recreation, Public Improvements, Sanitation, Planning and Zoning, and General and Administrative Services.
The financial statements of the City have been prepared in accordance with generally accepted accounting principles (“GAAP”) as applied to government units. The Governmental Accounting Standards Board (“GASB”) is the accepted standard setting body for establishing governmental accounting and financial reporting principles. The more significant of the government's accounting policies are described below.
In evaluating the City as a reporting entity, management has included all component units in accordance with GASB Statement No. 61, The Financial Reporting Entity: Omnibus an amendment of GASB Statements No. 14 and No. 34. The Financial Reporting Entity consists of the City (the primary government) and its blended component unit. Blended component units are legally separate organizations for which the City is financially accountable. The component unit discussed below is included in the City's reporting entity.
Blended Component Unit
The following component unit is blended with the primary government for financial statement purposes because the component unit's governing body is substantially the same as the City Commission and because the City has operational responsibility for the component unit.
Community Redevelopment Agency (CRA)
The CRA, which was created on April 4, 1991, by Resolution No. 558 pursuant to the Community Redevelopment Act, as found in Chapter 163 of the Florida Statutes, is an entity which is legally separate from the City and is governed by a seven-member board; five board members are the City Commission members and the other two members are appointed by the City Commission. Its sole purpose is to finance and develop the City's designated redevelopment areas. The CRA is reported as a major special revenue fund.
Government-wide and Fund Financial Statements
The basic financial statements consist of the government-wide financial statements and fund financial statements. The government-wide financial statements required under this statement (the Statement of Net Position and the Statement of Activities) report information on all of the non-fiduciary activities of the City and its blended component unit. For the most part, the effect of interfund activity has been removed from these statements so as not to distort financial results.

CITY OF HAINES CITY, FLORIDA NOTES TO FINANCIAL STATEMENTS
Fiscal Year Ended September 30, 2016
29
NOTE 1 SUMMARY OF SIGNIFICANT ACCOUNTING POLICIES (CONTINUED)
Fiduciary funds are also excluded from the government-wide financial statements since by definition these assets are being held for the benefit of third parties and cannot be used to address activities or obligations of the government. Governmental activities, which normally are supported by taxes and intergovernmental revenues, are reported separately from business-type activities, which rely to a significant extent on fees and charges for support.
The statement of activities demonstrates the degree to which the direct expenses of a given function or segment is offset by program revenues. Direct expenses are those that are clearly identifiable with a specific function or segment. Program revenues include: (1) charges to customers or applicants who purchase, use or directly benefit from goods, services or privileges provided by a given function or segment and, (2) grants and contributions that are restricted to meeting the operational or capital requirements of a particular function or segment. Taxes and other items not properly included among program revenues are reported instead as general revenues.
Separate financial statements (fund financial statements) are provided for governmental funds, proprietary funds and fiduciary funds. Major individual governmental funds and major individual enterprise funds are reported as separate columns in the fund financial statements. The City's fiduciary funds are presented in the fund financial statements but, as noted above, are not included in the government-wide statements. A reconciliation is provided that converts the results of governmental fund accounting to the government-wide presentations.
Measurement Focus, Basis of Accounting and Financial Statement Presentation
The government-wide financial statements, the proprietary fund financial statements and the fiduciary fund financial statements are reported using the economic resources measurement focus and the accrual basis of accounting. Revenues are recorded when earned and expenses are recorded when a liability is incurred, regardless of the timing of related cash flows. Property taxes are recognized as revenues in the year for which they are levied. Grants and similar items are recognized as revenue as soon as all eligibility requirements imposed by the provider have been met.
Governmental fund financial statements are reported using the current financial resources measurement focus and the modified accrual basis of accounting. Revenues are recognized as soon as they are both measurable and available. Revenues are considered to be available when they are collectible within the current period or soon enough thereafter to pay liabilities of the current period.
For this purpose, the City considers revenues to be available if they are collected within 90 days of the end of the current fiscal period, with the exception of property taxes, for which the period is 60 days.
Expenditures generally are recorded when a liability is incurred, as under accrual accounting. However, debt service expenditures, as well as expenditures related to claims and judgments, are recorded only when payment is due.
Revenues of the City which are susceptible to accrual under the modified accrual basis include property taxes, franchise fees, licenses and interest revenue associated with the current fiscal period. All other revenue items are considered to be measurable and available only when cash is received by the City.

CITY OF HAINES CITY, FLORIDA NOTES TO FINANCIAL STATEMENTS
Fiscal Year Ended September 30, 2016
30
NOTE 1 SUMMARY OF SIGNIFICANT ACCOUNTING POLICIES (CONTINUED)
The financial transactions of the City are recorded in individual funds. Each fund is accounted for with a separate set of self-balancing accounts that comprise its assets, liabilities, fund equity, revenues and expenditures, or expenses, as appropriate. Government resources are allocated to and accounted for in individual funds based upon the purposes for which they are to be spent and the means by which spending activities are controlled.
GASB Statement No. 34 sets forth minimum criteria (percentage of the assets, liabilities, revenues or expenditures/expenses of either fund category or the governmental and enterprise combined) for the determination of major funds.
The City reports the following major governmental funds:
The General Fund is the City’s primary operating fund. It accounts for all financial resources of the general government, except those required to be accounted for in another fund. The CRA Fund is the community redevelopment agency special revenue fund. Its purpose is to finance and redevelop the City’s designated redevelopment areas. Financing is provided primarily through tax increment funding from the City and Polk County. The Debt Service Fund is used to account for the payment of current principal and interest due on loans payable.
The City reports the following major proprietary funds:
The Water and Sewer Fund accounts for the operations of the City’s regional water and sewer system. The Stormwater Fund accounts for the operations of the City’s stormwater activities.
Additionally, the City reports the following fund types:
The Pension Trust Funds account for the activities of the General Employees’ Pension Fund, Police Officers’ Pension Fund and Fire Fighters’ Pension Fund, which accumulate resources for pension benefit payments to qualified employees. The Right of Way Agency Fund accounts for funds held in custody for the maintenance of Southern Dunes right-of-way land.
As a general rule, the effect of interfund activity has been eliminated from the government-wide financial statements.

CITY OF HAINES CITY, FLORIDA NOTES TO FINANCIAL STATEMENTS
Fiscal Year Ended September 30, 2016
31
NOTE 1 SUMMARY OF SIGNIFICANT ACCOUNTING POLICIES (CONTINUED)
Amounts reported as program revenues include: (1) charges to customers or applicants for goods, services or privileges provided, as well as fees, fines and forfeitures, (2) operating grants and contributions, and (3) capital grants and contributions. Internally dedicated resources are reported as general revenues rather than as program revenues. Likewise, general revenues include all taxes.
Proprietary funds distinguish operating revenues and expenses from nonoperating items. Operating revenues and expenses generally result from providing services and producing and delivering goods in connection with a proprietary fund’s principal ongoing operations. The principal operating revenues of the proprietary funds are charges to customers for sales and services. Operating expenses for proprietary funds include the cost of sales and services, administrative expenses and depreciation on capital assets. All revenues and expenses not meeting this definition are reported as nonoperating revenues and expenses.
When both restricted and unrestricted resources are available for use, it is the City’s policy to use restricted resources first, then unrestricted resources as they are needed.
Budget Process and Accounting
On or before September 1 of each year, the City Manager submits to the City Commission a proposed operating budget for the fiscal year commencing October 1. A public hearing is conducted at City Hall to obtain taxpayer comments. Prior to October 1, the budget is legally enacted through passage of an ordinance.
As set forth in the City Charter, the City Commission adopts an annual budget for the General Fund, Special Revenue Fund, and Proprietary Funds. The City does not adopt a budget for the Debt Service Fund, because effective budgetary control is achieved through bond indenture provisions. The annual budgets for the General Fund and Special Revenue Fund are prepared in accordance with GAAP for governmental fund types (modified accrual basis). The annual budgets for the Proprietary Funds are generally prepared in accordance with GAAP for enterprise fund types (accrual basis); except that capital expenses are included in the budget and depreciation expense is not included. All annual appropriations lapse at fiscal year-end.
Budgetary control is legally maintained at the fund level. City policy requires that expenditures do not exceed budgeted appropriations at the department level. Department Heads are permitted to transfer appropriations between line items within their department, with the approval of the Finance Director and City Manager. Appropriations may be transferred between departments with the approval of the Finance Director and City Manager. The City Commission approves budget amendments for expenditures/ expenses which are funded by new or increased revenue sources through passage of an ordinance. All outstanding commitments at fiscal year-end are re-appropriated at fiscal year-end as part of the following year’s budget.

CITY OF HAINES CITY, FLORIDA NOTES TO FINANCIAL STATEMENTS
Fiscal Year Ended September 30, 2016
32
NOTE 1 SUMMARY OF SIGNIFICANT ACCOUNTING POLICIES (CONTINUED)
Assets, Liabilities and Net Position or Equity
Deposits and investments
The City’s cash and cash equivalents include cash on hand, time and demand deposits and short-term investments. For purposes of the Statement of Cash Flows, the City considers all highly liquid investments (including restricted assets) with an original maturity of three months or less when purchased to be cash equivalents.
All investments, including Pension Funds, are stated at fair value. All fair market valuations are based on quoted market prices.
Receivables and payables
Receivables consist of trade receivables, due from other governments and interest receivable, recorded net of an allowance for doubtful accounts. The City's General Fund, Water and Sewer Fund and Stormwater Fund accounts receivable are presented net of an allowance for doubtful accounts of $30,491, $105,423 and $145, respectively, at September 30, 2016. All other receivables are considered fully collectible.
Outstanding balances between funds are reported as “due to/from other funds.” Any residual balances outstanding between the governmental activities and business-type activities are reported in the government-wide financial statements as “internal balances.”
Inventory
Inventory is valued at cost using the first-in/first-out (FIFO) method. Inventory in the governmental funds are recorded as expenditures when consumed rather than when purchased (consumption method).
Restricted assets
Certain proceeds of revenue bonds and loans, as well as certain resources set aside for their repayment, are classified as restricted assets on the balance sheet because their use is limited by applicable bond/loan covenants.
Capital assets
Capital assets, which include land, plant and plant improvements, buildings and improvements, equipment, transportation equipment, library books, and infrastructure (i.e., roads, sidewalks, and similar items), are reported in the applicable governmental or business-type activities columns in the government-wide financial statements. Capital assets are defined by the City as assets with an initial, individual cost of more than $1,000 and an estimated useful life in excess of one year. Such assets are recorded at historical cost or estimated historical cost if purchased or constructed. Donated capital assets are recorded at estimated fair value at the time of donation.
The costs of normal maintenance and repairs that do not add to the fair value of the assets or materially extend assets lives are not capitalized.

CITY OF HAINES CITY, FLORIDA NOTES TO FINANCIAL STATEMENTS
Fiscal Year Ended September 30, 2016
33
NOTE 1 SUMMARY OF SIGNIFICANT ACCOUNTING POLICIES (CONTINUED)
Major outlays for capital assets and improvements are capitalized as projects are constructed. Interest incurred during the construction phase of capital assets of business-type activities is included as part of the capitalized value of the assets constructed.
Depreciable capital assets are amortized using the straight-line method over the following estimated useful lives:
Assets Years Stormwater improvements 10 – 30 years Plant and plant improvements 5 – 50 years Buildings and improvements 5 – 50 years Equipment 3 – 50 years Transportation equipment 3 – 15 years Library books 3 – 7 years Infrastructure 20 – 40 years
Unavailable revenue/unearned revenue
Governmental funds report unavailable revenue in connection with receivables for revenues that are not considered to be available to liquidate liabilities of the current period. Governmental funds also defer revenue recognition in connection with resources that have been received but not yet earned – unavailable revenue.
Compensated absences
All regular employees with less than five years continuous service earn 80 hours of annual leave. The number of hours of annual leave increases relative to the number of years of continuous service, in increments of five years. The maximum of 160 hours of annual leave is obtained after twenty years of continuous service. For employees with 10 years or less of continuous service with the City, a maximum of 20 days of annual leave may be carried over to the next year. For employees with more than 10 years of continuous service, a maximum of 30 days may be carried over. Employees who terminate with more than one year’s service are paid for 100% of their unused annual leave. The City has accrued 100% of the annual leave liability, including related fringe benefits.
All regular employees earn eight hours of sick leave per month. A maximum of 112 days sick leave may be accumulated. Employees who voluntarily terminate or retire are paid for 100% of their accumulated sick leave balance up to a maximum of 112 days. The City has accrued the estimated amount of vested sick leave liability, including related fringe benefits.
Long-term obligations
Long-term debt and other long-term obligations are reported as liabilities in the applicable governmental activities, business-type activities, or proprietary fund type statement of net position. Bond premiums and discounts are deferred and amortized over the life of the bonds using the straight line method, which approximates the effective interest method. Bonds payable are reported net of the applicable bond premium or discount. Bond issuance costs are expensed when incurred.

CITY OF HAINES CITY, FLORIDA NOTES TO FINANCIAL STATEMENTS
Fiscal Year Ended September 30, 2016
34
NOTE 1 SUMMARY OF SIGNIFICANT ACCOUNTING POLICIES (CONTINUED)
In the fund financial statements, governmental fund types recognize bond premiums and discounts, as well as bond issuance costs, during the current period. The face amount of debt issued is reported as other financing sources. Premiums received on debt issuances are reported as other financing sources while discounts on debt issuances are reported as other financing uses. Issuance costs, whether or not withheld from the actual debt proceeds received, are reported as debt service expenditures.
Fund balance reporting
Effective October 1, 2010, the City adopted the provisions of Governmental Accounting Board Statement No. 54 (“GASB 54”), which addresses fund balance reporting. The intention of GASB 54 is to provide a more structured classification of fund balance and to improve the usefulness of fund balance reporting to the users of the City’s financial statements. The reporting standard establishes a hierarchy for fund balance classifications and the constraints imposed on the uses of those resources.
GASB 54 provides for two major types of fund balances, which are spendable and nonspendable. Nonspendable fund balances cannot be spent because they are not expected to be converted to cash or they are legally or contractually required to remain intact. Examples of this classification are prepaid items, inventories, and long-term receivables.
In addition to the nonspendable fund balance, GASB 54 provides a hierarchy of spendable fund balances, based on a hierarchy of spending constraints.
Restricted–Fund balances that are constrained by external parties, constitutional provisions, or enabling legislation.
Committed–Fund balances are reported as “committed” when they can be used for only specific purposes pursuant to constraints imposed by formal action of the City Council through the adoption of a resolution. Only the City Council may modify or rescind the commitment.
Assigned– Fund balances are reported as “assigned” when amounts are constrained by the City’s intent to be used for specific purposes, but are neither restricted nor committed. Through resolution, the City Manager has been authorized by the City Council to assign fund balances.
Unassigned–This classification represents the residual positive balance within the General Fund, which has not been restricted, committed or assigned. In funds other than the General Fund, unassigned fund balances are limited to negative residual balances.
Flow Assumptions – When both restricted and unrestricted amounts of fund balance are available for use for expenditures incurred, it is the City’s policy to use restricted amounts first and then unrestricted amounts as they are needed. For unrestricted amounts of fund balance, it is the City’s policy to use fund balance in the following order: (1) committed, (2) assigned, and (3) unassigned.
Net Position – Net position represents the difference between assets and liabilities in reporting which utilizes the economic resources measurement focus. Net investment in capital assets consists of capital assets, net of accumulated depreciation, reduced by the outstanding balances of any borrowing used (i.e., the amount that the City has spent) for the acquisition, construction or improvement of those assets. Net position is reported as restricted using the same definition as used for restricted fund balance as described in the section above. All other net position is reported as unrestricted.

CITY OF HAINES CITY, FLORIDA NOTES TO FINANCIAL STATEMENTS
Fiscal Year Ended September 30, 2016
35
NOTE 1 SUMMARY OF SIGNIFICANT ACCOUNTING POLICIES (CONTINUED)
The City applies restricted resources first when an expense is incurred for purposes for which both restricted and unrestricted net position are available.
Deferred Outflows/Inflows of Resources
The City implemented GASB Statements No. 63, Financial Reporting of Deferred Outflows of Resources, Deferred Inflows of Resources, and Net Position and No. 65, Items Previously Reported as Assets and Liabilities, as of October 1, 2012. These standards establish accounting and financial reporting for deferred outflows/inflows of resources and the concept of net position as the residual of all other elements presented in a statement of net position.
In addition to liabilities, the Statement of Net Position and the Governmental Funds Balance Sheet will sometimes report a separate section for deferred inflows of resources. This separate financial statement element, deferred inflows of resources, represents an acquisition of net position or fund balance that applies to future period(s) and so will not be recognized as an inflow of resources (revenue) until that time. The City has one item that qualifies for reporting in this category, which arises only under the modified accrual basis of accounting. Accordingly, the item, unavailable revenue, is reported only in the governmental funds balance sheet. The governmental funds report unavailable revenues from interest rebates and these amounts are deferred and will be recognized as an inflow of resources in the period in which the amounts become available.
The City has deferred inflows and deferred outflows related to the recording of changes in its net pension liability. Certain changes in the net pension liability are recognized as pension expense over time instead of all being recognized in the year of occurrence. Experience gains or losses result from periodic studies by the City’s actuary which adjust the net pension liability for actual experience for certain trend information that was previously assumed, for example the assumed dates of retirement of plan members. These experience gains or losses are recorded as deferred outflows of resources or deferred inflows of resources and are amortized into pension expense over the expected remaining service life of plan members. Changes in actuarial assumptions which adjust the net pension liability are also recorded as deferred outflows of resources or deferred inflows of resources and are amortized into pension expense over the expected remaining lives of plan members. The difference between projected investment return on pension investments and actual return on those investments is also deferred and amortized against pension expense over a five year period. The changes in proportion and differences between City contributions and proportionate share of contributions are also deferred and amortized against pension expense over a five year period. Additionally, any contributions made by the City to the pension plan before year end but subsequent to the measurement date of the City’s net pension liability are reported as deferred outflows of resources.
Pension
For purposes of measuring the net pension liability, deferred outflows of resources and deferred inflows of resources related to pensions, and pension expense, information about the fiduciary net position of the City’s three plans and additions to/deductions from these plan’s fiduciary net position have been determined on the same basis as they are reported by the plans. For this purpose, benefit payments (including refunds of employee contributions) are recognized when due and payable in accordance with the benefit terms. Investments are reported at fair value.

CITY OF HAINES CITY, FLORIDA NOTES TO FINANCIAL STATEMENTS
Fiscal Year Ended September 30, 2016
36
NOTE 1 SUMMARY OF SIGNIFICANT ACCOUNTING POLICIES (CONTINUED)
Use of estimates
The preparation of financial statements in conformity with GAAP requires management to make estimates and assumptions that affect the reported amounts of assets and liabilities and disclosure of contingent assets and liabilities at the date of the financial statements and the reported amounts of revenues and expenditures/expenses during the reporting period. Actual results could differ from management’s estimates.
NOTE 2 PROPERTY TAXES
Property tax collections are governed by Chapter 197, Florida Statutes. The Polk County Tax Collector bills and collects all property taxes levied within the county. Discounts of 4, 3, 2 and 1% are allowed for early payment in November, December, January and February, respectively.
The Tax Collector remits collected taxes at least monthly to the City. The City recognizes property tax revenues in the year for which they are levied.
A calendar of property tax events is as follows:
January 1 Property taxes are based on assessed value at this date as determined by the Polk County Property Appraiser
July 1 Assessment roll approved by the state September 30 Millage resolution approved by the City commission October 1 Beginning of fiscal year for which taxes have been levied November 1 Property taxes due and payable November 30 Last day for 4% maximum discount April 1 Unpaid property taxes become delinquent Not later than June 1 Tax certificates are sold by the Polk County Tax Collector. An
enforceable legal claim arises this date
NOTE 3 DEPOSITS AND INVESTMENTS
In accordance with Florida Statutes and the City’s (except for the pension trust funds) written investment policy (which was adopted by the City Commission by Resolution), the City may invest in the following types of investments: the Local Government Surplus Funds Trust Fund (Florida PRIME); SEC-registered money market funds with the highest credit quality rating; interest-bearing time deposits or savings accounts in qualified public depositories; direct obligations of the U.S. Treasury; Federal agencies and instrumentalities; securities of investment companies or investment trusts provided their portfolio is limited to obligations of the U.S. government or agencies or instrumentalities; repurchase agreements fully collateralized by U.S. government obligations and other investments authorized by law or ordinance for a municipality.
The City pools the majority of its cash in a single bank account that is available for use by all funds, except the Pension Trust Funds. The City has entered into an agreement with the bank concerning the sweeping of this account to pay all cleared charges against other accounts and pay the City a stipulated variable rate of interest on the account’s daily balance. At September 30, 2016, the bank balances of the City’s total deposits was $26,512,184. All such deposits are covered either by the Federal Deposit Insurance Corporation or by the State of Florida Collateral Pool, a multiple financial institution pool with the ability to assess its members' financial institution for collateral shortfalls if a member fails.

CITY OF HAINES CITY, FLORIDA NOTES TO FINANCIAL STATEMENTS
Fiscal Year Ended September 30, 2016
37
NOTE 3 DEPOSITS AND INVESTMENTS (CONTINUED)
Each of the City’s three defined benefit pension plans (police officers, firefighters and other general employees) has adopted an investment policy that specifies objectives and guidelines for the portfolio as a whole and for each individual manager. The policy also details limits by investment and issuer. Investments of the pension trust funds shall be limited to annuity and life insurance contracts, time or savings accounts, obligations of the United States, bonds issued by the State of Israel, stocks, commingled funds administered by national or state banks, mutual funds and bonds rated in one of the three highest classifications by a major rating service. Up to 10% of the assets may be invested in foreign securities and no more than 5% of the pension funds’ assets may be invested in equities of any one issuing company. The aggregate of its investments in common stock, capital stock and convertible securities at cost shall not exceed 50% of the assets of the police officers’ and firefighters’ pension funds and 65% of the general employees’ pension fund.
The City's Pension Trust Funds' investment balances at September 30, 2016, are as shown below and on the following page. For purposes of credit quality rating, investments explicitly guaranteed by the United States government are rated as “N/A.” Interest rate risk policy
Interest rate risk is the risk that the market value of securities in the portfolio will fall due to change in the general interest rate. The City and the Pension Trust Funds mitigate this risk by:
Structuring the investment portfolio so that securities mature to meet cash flow requirements for ongoing operations, thereby avoiding the need to sell securities on the open market prior to maturity, and Investing operating funds primarily in shorter-term securities.
Credit risk policy
The City has an investment policy that limits investments to the safest types of securities. It requires pre-qualifying of all financial institutions, broker/dealers, intermediaries and advisors with whom the City conducts business. Also, the City diversifies their investment portfolio to minimize any potential loss on an individual security.
The Pension Trust Funds have investment policies that limit investments to those with a minimum credit quality rating of BBB by Standard & Poor’s or an equivalent rating by another major rating service. Fixed income securities that are downgraded below the minimum rating are sold at the earliest beneficial opportunity.
General Employees' PensionInvestment Type Rating Fair Value < 1 1-5 6-10 >10
Fixed income mutual funds AAA- 6,331,615$ 6,331,615 - - - Common equity securities N/A 9,035,849 9,035,849 - - - Money market/cash N/A 221,444 221,444 - - - Total fair value 15,588,908$ 15,588,908 - - -
Years to Maturity

CITY OF HAINES CITY, FLORIDA NOTES TO FINANCIAL STATEMENTS
Fiscal Year Ended September 30, 2016
38
NOTE 3 DEPOSITS AND INVESTMENTS (CONTINUED)
Police Officers' PensionInvestment Type Rating Fair Value < 1 1-5 6-10 >10
U.S. Government securities N/A 431,873$ 730 217,744 63,950 149,449 Foreign stocks N/A 26,284 26,284 - - - Corporate bonds Aa..B1 2,780,009 894,656 971,234 566,875 347,244 Common equity securities N/A 5,067,549 5,067,549 - - - Municipal obligations Aa3 54,008 - 26,208 - 27,800 Money market/cash N/A 289,868 289,868 - - - Total fair value 8,649,591$ 6,279,087 1,215,186 630,825 524,493
Firefighters' PensionInvestment Type Rating Fair Value < 1 1-5 6-10 >10
Fixed income mutual funds Aaa 1,591,725$ 1,591,725 - - - Common equity securities N/A 3,756,126 3,756,126 - - - Money market/cash N/A 152,988 152,988 - - - Total fair value 5,500,839$ 5,500,839 - - -
Years to Maturity
Years to Maturity
Fair Value Measurements
The City categorizes its fair value measurements within the fair value hierarchy established by generally accepted accounting principles. Fair value is the exchange price that would be received for an asset (exit price) in the principal or most advantageous market for an asset in an orderly transaction between market participants on the measurement date. There are three levels of inputs that may be used to measure fair values:
Level 1 inputs utilize quoted prices (unadjusted) in active markets for identical assets that the City has the ability to access.
Level 2 inputs are inputs other than quoted prices included in Level 1 that are observable for the asset in active markets, as well as inputs that are observable for the asset (other than quoted prices), such as interest rates, foreign exchange rates, and yield curves that are observable at commonly quoted intervals.
Level 3 inputs are unobservable inputs for the asset which are typically based on the City’s own assumptions, as there is little, if any, related market activity.
Investments that are measured at fair value using the net asset value (NAV) per share, or its equivalent, as a practical expedient are not classified in the fair value hierarchy.

CITY OF HAINES CITY, FLORIDA NOTES TO FINANCIAL STATEMENTS
Fiscal Year Ended September 30, 2016
39
NOTE 3 DEPOSITS AND INVESTMENTS (CONTINUED)
The City had the following recurring fair value measurements, broken into the fair value hierarchy, as of September 30, 2016:
General Employees' PensionInvestment Type Fair Value Level 1 Level 2 Level 3
Fixed income mutual funds 6,331,615$ 587,033 5,744,582 - Common equity securities 9,035,849 9,035,849 - - Money market/cash 221,444 221,444 - - Total fair value 15,588,908$ 9,844,326 5,744,582 -
Police Officers' PensionInvestment Type Fair Value Level 1 Level 2 Level 3
U.S. Government securities 431,873$ 302,132 129,741 - Foreign stocks 26,284 26,284 - - Corporate bonds 2,780,009 849,640 1,930,369 - Common equity securities 5,067,549 5,067,549 - - Municipal obligations 54,008 - 54,008 - Money market/cash 289,868 289,868 - - Total fair value 8,649,591$ 6,535,473 2,114,118 -
Firefighters' PensionInvestment Type Fair Value Level 1 Level 2 Level 3
Fixed income mutual funds 1,591,725$ 1,591,725 - - Common equity securities 3,756,126 3,756,126 - - Money market/cash 152,988 152,988 - - Total fair value 5,500,839$ 5,500,839 - -
Fair Value Hierarchy
Fair Value Hierarchy
Fair Value Hierarchy

CITY OF HAINES CITY, FLORIDA NOTES TO FINANCIAL STATEMENTS
Fiscal Year Ended September 30, 2016
40
NOTE 4 CAPITAL ASSETS
Capital asset balances and activity for the year ended September 30, 2016, were as follows:
Beginning Ending Balance Additions Deletions Balance
Governmental activities:Capital assets not being depreciated
Land 9,004,809$ 21,165 (39,540) 8,986,434Construction in progress 1,003,219 71,641 - 1,074,860 Total capital assets not being depreciated 10,008,028 92,806 (39,540) 10,061,294
Capital assets being depreciatedBuildings and improvements 60,869,836 77,633 (37,560) 60,909,909Equipment 6,175,422 533,752 (91,620) 6,617,554Transportation equipment 4,263,002 970,805 (10,715) 5,223,092Infrastructure 10,121,083 - - 10,121,083Library books 758,439 - - 758,439 Total capital assets being depreciated 82,187,782 1,582,190 (139,895) 83,630,077
Less accumulated depreciation for:Buildings and improvements (16,513,049) (2,323,404) 16,124 (18,820,329)Equipment (4,793,375) (397,971) 76,618 (5,114,728)Transportation equipment (3,531,104) (350,820) 10,715 (3,871,209)Infrastructure (3,401,493) (321,037) - (3,722,530)Library books (552,452) (63,565) - (616,017) Total accumulated depreciation (28,791,473) (3,456,797) 103,457 (32,144,813)
Capital assets being depreciated, net 53,396,309 (1,874,607) (36,438) 51,485,264Governmental activities capital assets, net 63,404,337$ (1,781,801) (75,978) 61,546,558

CITY OF HAINES CITY, FLORIDA NOTES TO FINANCIAL STATEMENTS
Fiscal Year Ended September 30, 2016
41
NOTE 4 CAPITAL ASSETS (CONTINUED)
Beginning Ending Balance Increases Decreases Balance
Business-type activities:Capital assets not being depreciated
Land 483,853$ 244,297 - 728,150 Construction in progress 4,744,187 6,678,577 (2,264,550) 9,158,214 Total capital assets not being depreciated 5,228,040 6,922,874 (2,264,550) 9,886,364
Capital assets being depreciatedPlant and plant improvements 59,485,091 31,360 2,264,550 61,781,001Buildings and improvements 285,976 22,650 - 308,626 Equipment 8,959,556 147,889 - 9,107,445Infrastructure 811,768 - - 811,768 Transportation equipment 1,213,272 119,630 - 1,332,902 Total capital assets being depreciated 70,755,663 321,529 2,264,550 73,341,742
Less accumulated depreciation Plant and plant improvements (19,759,259) (1,330,468) - (21,089,727)Buildings and improvements (105,328) (11,803) - (117,131)Equipment (3,466,896) (624,541) - (4,091,437)Infrastructure (358,545) (13,065) - (371,610)Transportation equipment (871,774) (68,223) - (939,997) Total accumulated depreciation (24,561,802) (2,048,100) - (26,609,902)
Capital assets being depreciated, net 46,193,861 (1,726,571) 2,264,550 46,731,840Business-type activities capital assets, net 51,421,901$ 5,196,303 - 56,618,204
Depreciation expense was charged to function/programs of the primary government as follows:
Governmental activities:General government 559,010$ Public safety 561,248 Transportation 386,590 Economic environment 207,774 Culture and recreation 1,742,175
Total depreciation expense, governmental functions 3,456,797$
Depreciation expense was charged to functions/programsof the primary government as follows:Business-type activities:
Water and sewer 2,034,510$ Stormwater 13,590 Total depreciation expense, business-type functions 2,048,100$

CITY OF HAINES CITY, FLORIDA NOTES TO FINANCIAL STATEMENTS
Fiscal Year Ended September 30, 2016
42
NOTE 5 CONSTRUCTION COMMITMENTS
Commitments under uncompleted construction projects at September 30, 2016, consist of the following:
CommittedGeneral Fund
Johnson Avenue Road Project 25,834$ 25,834
Water and Sewer FundReuse System Exp Ground Storage Tanks 192,950WTP #1 Anionic Ion Exchange 5,892,161
6,085,111Stormwater Fund
Lake Eva Alum 31,976 Ledwith Ave & 5th St./Hill Dr 46,907
78,883
NOTE 6 INTERFUND BALANCES AND TRANSFERS
Interfund loans for short-term operating purposes resulted in the following balances at September 30, 2016:
Receivable PayableGeneral Fund 18,924$ - Water and Sewer Fund - 18,924
18,924$ 18,924
The outstanding balance between funds results from the annual accrual of utility billing. All amounts are expected to be repaid within one year.
Interfund transfers for operating purposes from the fund that collected them to the fund that is authorized to expend them were as follows for the year ended September 30, 2016:
Transfers In Transfers OutGeneral Fund 1,600,000$ 3,151,459CRA Fund 1,370,990 1,598,394Debt Service Fund 3,378,863 - Water and Sewer Fund - 1,600,000
6,349,853$ 6,349,853
Transfers between the funds are used to fund various activities of the City such as the General Fund’s contribution to the CRA for redevelopment projects, and debt service payments and administrative duties paid by the General Fund.

CITY OF HAINES CITY, FLORIDA NOTES TO FINANCIAL STATEMENTS
Fiscal Year Ended September 30, 2016
43
NOTE 7 LONG-TERM DEBT
Summarized below is the City’s debt issued to finance the acquisition and construction of major capital facilities that is outstanding as of September 30, 2016:
1. Governmental activities debt
$11,748,000 loan payable ($10,489,000 in principal remaining at September 30, 2016), CenterState Bank–Funds borrowed to finance the construction of a new City Hall/Library municipal complex and fire station in the downtown area. The financing was accomplished through the Build America Bond Program, under the Recovery Zone Economic Development Bond (RZEDB) provision, with a 25 year variable rate bank note with CenterState Bank in the principal amount of $11,748,000. The RZEDB program is a stimulus program administered through the Department of Treasury/IRS where 45% of interest payments associated with qualified financing is federally subsidized.
The CenterState Bank loan is secured by a pledge and lien upon the revenues derived by the City from the electricity portion of the City’s Utility Services Tax together with a lien on the rebate subsidy credit that it will receive from the Federal Government. Semi-annual payments will be made over a 25 year period, including interest at 4.92%. The total principal and interest remaining to be paid on the CenterState Bank loan was $16,288,327, less a subsidy of $2,609,697, as of September 30, 2016. Interest paid was $525,936 and total pledged revenue was $1,346,073 for the fiscal year ended September 30, 2016.
$4,636,000 loan payable ($4,179,000 in principal remaining at September 30, 2016), CenterState Bank–Funds borrowed during fiscal year 2015 to refund two previous notes with Municipal Loan Council. Annual payments will be made over a 15 year period, including interest at 2.70%.
$967,894 loan payable ($825,540 in principal remaining at September 30, 2016), CenterState Bank–Funds borrowed during fiscal year 2015 to finance various vehicles and equipment purchases. Annual payments will be made over a 10 year period, including interest at 2.65%.
$24,109,000 loan payable ($24,109,000 in principal remaining at September 30, 2016), CenterState Bank–Funds borrowed during fiscal year 2016 to refund $2,725,000 of the Police Station Loan from the Florida Municipal Loan Council and $21,780,000 of the CRA projects loan from the Florida Municipal Loan Council. Semi-annual payments will be made over a 17 year period, including interest at 2.95%. The excess of the reacquisition price over the net carrying amount of the old debt of $1,071,069 is reflected as a deferred outflow and is being amortized over 17 years.
The Florida Municipal Loan Council loans are subject to arbitrage. The arbitrage rebate requirement requires issuers of tax exempt debt to rebate to the U.S. Treasury investment income arising from proceeds of tax exempt debt to the extent that such income results from an investment yield in excess of the bond yield. There was no arbitrage liability at September 30, 2016.
The Florida Municipal Loan Council loans payable are secured by a covenant to budget and appropriate non-ad valorem revenues of the City sufficient to pay the principal and interest.

CITY OF HAINES CITY, FLORIDA NOTES TO FINANCIAL STATEMENTS
Fiscal Year Ended September 30, 2016
44
NOTE 7 LONG-TERM DEBT (CONTINUED)
Capital Leases:
The City has entered into lease agreements as lessee for financing the acquisition of various equipment including police vehicles, computers and telephone servers. These lease agreements qualify as capital leases for accounting purposes and, therefore, have been recorded at the present value of their future minimum lease payments as of the inception date.
The assets acquired through capital leases are as follows for the City’s governmental activities:
Vehicles and Equipment 808,597$Less Accumulated Depreciation (405,095)Total 403,502$
The future minimum lease obligations and the net present value of these minimum lease payments as of September 30, 2016 for governmental activities are as follows:
Fiscal Year 2017 155,361$ 2018 20,687 2019 20,687 2020 20,687 2021 20,687
Total minimum lease payments 238,109 Less: Amount representing interest (13,293) Present value of minimum lease payments 224,816$
2. Business-type activities debt
$3,990,747 State Revolving Fund Loan ($3,300,775 in principal remaining at September 30, 2016)–Funds borrowed to finance construction of a sewer plant expansion project. The maximum amount of the loan is $4,124,761, including capitalized interest of $75,565. Semi-annual loan payments began on April 15, 2014. The loan will be repaid in forty semi-annual payments including interest at 2.26%, 2.31% and 2.34%, which applies to various loan increments.
$369,362 State Revolving Fund Loan ($288,745 in principal remaining at September 30, 2016) Funds borrowed to finance construction of a water main expansion and new ground storage reservoirs projects. Semi-annual loan payments began on June 15, 2011. The loan will be repaid in forty semi-annual payments including interest at 2.71%. The loan is part of an agreement with the Florida Department of Environmental Protection which provides principal forgiveness on loans funded by the American Recovery and Reinvestment Act. Of the total $2,462,413 awarded under this agreement, the estimated amount of principal forgiveness is $2,093,051, the amount of money awarded pursuant to this agreement that is not to be repaid.
$319,529 State Revolving Fund Loan ($250,537 in principal remaining at September 30, 2016)–Funds borrowed to finance construction of a water main expansion and new ground storage reservoirs projects. Semi-annual loan payments began on June 15, 2011. The loan is paid in forty semi-annual payments, including interest at 2.61%.

CITY OF HAINES CITY, FLORIDA NOTES TO FINANCIAL STATEMENTS
Fiscal Year Ended September 30, 2016
45
NOTE 7 LONG-TERM DEBT (CONTINUED)
$4,912,507 State Revolving Fund Loan ($4,107,744 in principal remaining on September 30, 2016)– Funds borrowed to finance construction of the BCR Neutralizer and Sludge Treatment Facilities Project. The maximum amount of the loan is $5,222,820, including capitalized interest of $38,600. Semi-annual loan payments began on May 15, 2016, including interest of 2.18%.
$404,303 State Revolving Fund Loan ($404,303 in principal remaining on September 30, 2016)– Funds borrowed to finance construction of the WTP #1 and 2 treatment system upgrades. The maximum amount of the loan is $6,173,086 less principal forgiveness of $5,247,123 and is currently in the draw-down phase. 40 semi-annual loan payments will begin once the project has been completed, including interest of 1.16%.
$5,025,000 State Revolving Fund Loan ($5,025,000 in principal remaining on September 30, 2016)– Funds borrowed to finance construction of a new compost facility. The maximum amount of the loan is $5,101,891 and is currently in the draw-down phase. 40 semi-annual loan payments will begin once the project has been completed.
$3,670,000 Utility System Revenue Note, Series 2013A ($2,988,000 in principal remaining on September 30, 2016)– Funds borrowed to finance construction of various water and sewer system improvements. Semi-annual loan payments will begin in October 2014, including interest of 1.83%.
$2,290,000 Utility System Refunding Revenue Note, Series 2013B ($341,000 in principal remaining on September 30, 2016)– Funds borrowed to refinance the debt owed by the City to the Florida State Revolving Fund Loan Agreement. Semi-annual loan payments began in October 2013, including interest of 1.28%.
State Revolving Fund Loans Payable
The total principal and interest remaining to be paid on these loans was $14,897,123 (includes interest of $1,520,019) as of September 30, 2016. Principal and interest paid was $613,799 and total available pledged revenue was $5,923,162 for the fiscal year ended September 30, 2016. The loans are secured by pledged revenue, which consists of the gross revenues derived from the operation of the Water and Sewer Systems after payment of the Operations and Maintenance Expense and the satisfaction of all yearly payment obligations on account of the Senior Revenue Obligations.

CITY OF HAINES CITY, FLORIDA NOTES TO FINANCIAL STATEMENTS
Fiscal Year Ended September 30, 2016
46
NOTE 7 LONG-TERM DEBT (CONTINUED)
3. Changes in long-term debt
The following is a summary of changes in long-term debt of the City for the year ended September 30, 2016:
Beginning Ending Due WithinBalance Additions Reductions Balance One Year
Governmental activities:CenterState Bank Loan 10,809,000$ - (320,000) 10,489,000 336,000 CenterState Bank Loan, Series 2014 4,422,000 - (243,000) 4,179,000 250,000 CenterState Bank Loan, Series 2016 967,894 - (142,354) 825,540 146,164 CenterState Bank Loan, Series 2016 Refunding - 24,109,000 - 24,109,000 273,000 FMLC, police station 2,725,000 - (2,725,000) - - FMLC, CRA 21,780,000 - (21,780,000) - - Loans payable 40,703,894 24,109,000 (25,210,354) 39,602,540 1,005,164
Less unamortized costs:Unamortized premium 123,834 - (123,834) - - Total loans payable, net 40,827,728 24,109,000 (25,334,188) 39,602,540 1,005,164
Capital leases 368,717 93,092 (236,993) 224,816 152,413 Compensated absences 1,318,444 312,000 (400,716) 1,229,728 654,830 Net pension liability 5,699,712 3,843,162 (4,958,794) 4,584,080 - Other postemployment benefits 1,046,516 274,717 (188,505) 1,132,728 -
8,433,389 4,522,971 (5,785,008) 7,171,352 807,243 Total governmental activitieslong-term liabilities 49,261,117$ 28,631,971 (31,119,196) 46,773,892 1,812,407
For governmental activities, compensated absences, the net pension liability, and net OPEB obligations are generally liquidated by the General Fund.
Beginning Ending Due WithinBalance Additions Reductions Balance One Year
Business- type activities:Utility System Revenue Note, Series 2013 4,349,000$ - (1,020,000) 3,329,000 691,000 State Revolving Fund Loan, WW765080 3,476,027 - (175,252) 3,300,775 179,326 State Revolving Fund Loan, DW530410 304,807 - (16,062) 288,745 16,501 State Revolving Fund Loan, DW530411 264,597 - (14,060) 250,537 14,428 State Revolving Fund Loan, WW530400 4,327,989 - (220,245) 4,107,744 225,110 State Revolving Fund Loan, WW530440 1,457,730 3,567,270 - 5,025,000 - State Revolving Fund Loan, DW530450 255,871 148,432 - 404,303 -
14,436,021 3,715,702 (1,445,619) 16,706,104 1,126,365 Compensated absences 256,087 97,500 (90,498) 263,089 137,464 Net pension liability 776,986 880,776 (1,627,971) 29,791 - Other post-employment benefits 202,762 53,227 (36,523) 219,466 -
1,235,835 1,031,503 (1,754,992) 512,346 137,464 Total business-type activitieslong-term liabilities 15,671,856$ 4,747,205 (3,200,611) 17,218,450 1,263,829

CITY OF HAINES CITY, FLORIDA NOTES TO FINANCIAL STATEMENTS
Fiscal Year Ended September 30, 2016
47
NOTE 7 LONG-TERM DEBT (CONTINUED)
4. Principal and Interest Requirements to Maturity
The following represents the annual debt service requirements to maturity for debt outstanding as of September 30, 2016, including the General Government's $24,109,000 of FMLC debt principal, $15,493,540 of Center State Bank Loans, and State Revolving Fund Loans and Utility System Revenue Notes of $11,276,801. The schedule below does not include the State Revolving Fund Loans in the amount of $5,429,303 which have not yet been fully drawn down.
Fiscal YearEnding Principal Interest Subsidy Total Principal Interest Total
2017 1,005,164$ 1,176,547 (229,476) 1,952,235 1,126,365 232,094 1,358,459 2018 1,976,076 1,300,887 (221,876) 3,055,087 802,335 213,473 1,015,808 2019 1,990,453 1,236,295 (213,906) 3,012,842 818,535 196,686 1,015,221 2020 2,055,115 1,170,332 (205,548) 3,019,899 835,968 179,545 1,015,513 2021 2,084,915 1,102,479 (196,764) 2,990,630 853,641 162,037 1,015,678
2022-2026 11,401,817 4,420,740 (835,951) 14,986,606 3,723,085 549,329 4,272,414 2027-2031 12,605,000 2,381,281 (540,249) 14,446,032 2,835,667 209,796 3,045,463 2032-2036 6,484,000 465,548 (165,928) 6,783,620 281,205 3,161 284,366
39,602,540$ 13,254,109 (2,609,698) 50,246,951 11,276,801 1,746,121 13,022,922
Governmental Activities Business-type Activities
NOTE 8 RESTRICTED ASSETS
Certain cash and cash equivalents that are legally restricted in the statement of net position at September 30, 2016, are as follows:
Governmental Business-type Activities Activities
Capital projects -$ 20 Impact fees 3,090,463 2,857,940 Debt service 62,830 1,150,402 Other purposes:
Confiscated property 59,132 - Law enforcement training 9,223 - Deposits - 1,092,278 Bond and loan reserves - 13,015 Total 3,221,648$ 5,113,655
NOTE 9 RISK MANAGEMENT
The City is exposed to various risks of loss related to torts; theft of, damage to and destruction of assets; errors and omissions; injuries to employees; employee health and medical claims; and natural disasters for which the City carries commercial insurance. There have been no significant reductions in insurance coverage from the previous year. Settlement amounts have not exceeded insurance coverage for the current year nor the three prior years.

CITY OF HAINES CITY, FLORIDA NOTES TO FINANCIAL STATEMENTS
Fiscal Year Ended September 30, 2016
48
NOTE 9 RISK MANAGEMENT (CONTINUED)
The City’s former worker's compensation insurer, Governmental Risk Insurance Trust (GRIT), a governmental insurance pool, filed for Chapter 11 bankruptcy on March 30, 2000. As a result, the City is contingently liable for certain worker's compensation claims that otherwise would have been subject to GRIT coverage. There was one such claim outstanding at September 30, 2016.
As of September 30, 2016, the City’s risk retention for certain types of risk is as follows:
Retention/Deductible Coverage after Retention/Deductible Worker’s Compensation None 100% - liabilities under F.S 440 General liability $2,500 $2,000,000/$4,000,000 limit Property, multi-peril $5,000 $2,000,000 limit Public officials liability $2,500 $2,000,000 limit Storage tank pollution liability $10,000 $1,000,000 each incident
$2,000,000 aggregate
NOTE 10 – CONTINGENT LIABILITIES
The City receives revenues from various federal and state grants. These grants are for specific purposes and are subject to review and audit by the grantor agencies. Such audits could result in requests for reimbursement for expenditures disallowed under the terms of the grants. Based upon prior experience, City management believes such disallowances, if any, will be immaterial. The City is involved in legal actions and has certain workers’ compensation claims outstanding, as described above. In the opinion of management, associated contingent obligations will not have a material effect on the financial statements of the City.
NOTE 11 – POST-EMPLOYMENT BENEFITS OTHER THAN PENSION BENEFITS
In addition to providing pension benefits, the City offers its retirees the option of continuing to participate in health and dental insurance benefits and a $5,000 group term life insurance benefit at the same rate as active employees, in accordance with state statutes. Retirees can also insure eligible dependents for health and dental insurance only. Each retiree must pay 100% of the costs of any insurance they elect to continue. Funding is on a “pay as you go” basis. Most of the City’s employees would become eligible for those benefits should they reach normal retirement age while working for the City. Life, dental and health insurance are fully insured and provided through outside providers. Retiree premium costs are paid in full by the retirees.
In order to comply with the requirements of GASB 45, Accounting and Financial Reporting by Employers for Post-employment Benefits Other than Pensions, the City contracted with a certified actuarial firm to provide an actuarial valuation of post-employment benefits. The post-employment health insurance benefits will continue to be offered on a pay-as-you-go basis with no premium subsidy to the retirees. As required by the State of Florida Statute 112.08011, the claims experience of the retirees is co-mingled with that of active employees in determining the health plan cost. In accordance with GASB 45, the co-mingling of claims requirement equates to an implicit subsidy to retirees that creates an OPEB liability on the part of the City. Therefore, the City has incurred a liability for the implicit rate subsidy as the City implemented GASB 45. The City does not intend to fund the actuarial accrued liability. The post-employment benefit plan is a single-employer plan.

CITY OF HAINES CITY, FLORIDA NOTES TO FINANCIAL STATEMENTS
Fiscal Year Ended September 30, 2016
49
NOTE 11 – POST-EMPLOYMENT BENEFITS OTHER THAN PENSION BENEFITS (CONTINUED)
Membership
As of October 1, 2014, the most recent actuarial evaluation date, membership consisted of:
Active Employees 190 Retired Participants 24 Retiree Covered Spouses 3
Annual OPEB Costs and Net OPEB Obligation
The City’s annual other post-employment benefit (OPEB) cost is calculated based on the annual required contribution (ARC) of the employer, an amount actuarially determined in accordance with the parameters of GASB 45. The calculation produced an unfunded obligation of $2,554,437 and an ARC of $350,219, defined in level dollars. The following table shows the components of the City’s OPEB cost for the year, the amount contributed to the plan, and changes in the City’s net OPEB obligation:
Annual Required Contribution (ARC) 350,219$Interest on Net OPEB Obligation 49,971Adjustment to ARC (72,246)
Annual OPEB cost 327,944 Contributions made (225,028)
Increase in Net OPEB Obligation 102,916Net OPEB Obligation, beginning of year 1,249,278
Net OPEB Obligation, end of year 1,352,194$
The above OPEB obligation is presented as part of long-term debt, as summarized in Note 7. The City’s annual OPEB cost, the percentage of annual OPEB cost contributed to the plan, and the net OPEB obligation for the year are as follows:
Fiscal Annual % of Annual OPEB Net OPEBYear Ended OPEB Cost Cost Contributed Obligation
September 30, 2014 297,283$ 53% 1,142,527$September 30, 2015 317,504 66% 1,249,278September 30, 2016 327,944 69% 1,352,194

CITY OF HAINES CITY, FLORIDA NOTES TO FINANCIAL STATEMENTS
Fiscal Year Ended September 30, 2016
50
NOTE 11 – POST-EMPLOYMENT BENEFITS OTHER THAN PENSION BENEFITS (CONTINUED)
The funded status of the plan as of October 1, 2014, the most recent actuarial valuation date, is as follows:
Actuarial Accrued Liability (AAL) 2,554,437$Actuarial Value of Plan Assets -
Unfunded Actuarial Accrued Liability (UAAL) 2,554,437$
Funded Ratio 0%
Covered Payroll 8,214,148
Ratio of UAAL to Covered Payroll 31.10%
Valuation method and assumptions
The schedule of funding progress, presented as Required Supplementary Information following the notes to the financial statements, presents multiyear trend information about whether the actuarial value of the plan assets is increasing or decreasing over time relative to the actuarial accrued liability for benefits. A separate, publicly available post-employment benefit plan report is not prepared for the defined benefit plans.
Actuarial valuations of an ongoing plan involve estimates of the value of reported amounts and assumptions about the probability of occurrence of events far into the future. Examples include assumptions about future employment, mortality, and the healthcare cost trend. Amounts determined regarding the funded status of the plan and the annual required contributions of the employer are subject to continual revision as actual results are compared with past expectation and new estimates are made about the future.
Calculations for financial reporting purposes are based on the benefits provided under terms of the substantive plan (the plan as understood by the employer and the plan members) in effect at the time of each valuation and on the pattern of sharing the costs between the employer and the plan members to that point. The projection of benefits for financial reporting purposes does not explicitly incorporate the potential effects of legal or contractual funding limitations on the pattern of cost sharing between the employer and the plan members in the future. Actuarial calculations reflect a long-term perspective. Consistent with that perspective, actuarial methods and assumptions used include techniques that are designed to reduce the effects of short-term volatility in actuarial accrued liabilities and the actuarial value of assets.

CITY OF HAINES CITY, FLORIDA NOTES TO FINANCIAL STATEMENTS
Fiscal Year Ended September 30, 2016
51
NOTE 11 – POST-EMPLOYMENT BENEFITS OTHER THAN PENSION BENEFITS (CONTINUED)
The information presented in the required supplementary schedule was determined as a part of the actuarial valuation at the date indicated.
Valuation date October 1, 2014Actuarial cost method Projected Unit CreditAmortization method Level Dollar, openRemaining amortization period 30 YearsAsset valuation method Market ValueActuarial assumptions
Investment return 0.0% per yearDiscount rate 4.0% per year, compounded annuallyHealthcare cost trend rate 9.6% initially, 4.2% ultimately in 2080Inflation rate 2.50% per annum, compounded annually Projected salary increases N/A, not relevant to determination of benefits
NOTE 12 PENSION PLANS
Defined benefit plans
The City Commission has established a single-employer public employee retirement system to provide defined retirement benefits to its qualifying employees. Separate plans are maintained for its police officers, firefighters and other general employees. The City Commission has established separate governing boards for each of the plans, which have the authority to make recommendations to amend plan provisions, including contribution rates. Stand-alone plan financial reports are not issued, and the plans are not included in the reports of any other public employee retirement system or entity. Benefits and refunds of these plans are recognized when due and payable in accordance with the terms of the plan.
Membership
At October 1, 2016, the date of the latest actuarial valuations for the plans, participation in the plans consisted of:
General PoliceEmployees Officers Firefighters
Retirees and beneficiaries receiving benefits 63 18 16Terminated employees entitled to benefits
but not yet receiving them 70 13 6Active plan members 49 44 26Total membership 182 75 48

CITY OF HAINES CITY, FLORIDA NOTES TO FINANCIAL STATEMENTS
Fiscal Year Ended September 30, 2016
52
NOTE 12 PENSION PLANS (CONTINUED)
The following is a summary of the funding policies, contribution methods, and benefit provisions of the defined benefit plans:
General Employees Police Officers and Fire Fighters
Eligibility to Full time (30 hours per week) City employees not Full-time sworn police officers and firefightersparticipate classified as sworn police officers or firefighters
Determination of Actuarially determined Actuarially determinedcontributions
Funding of Included in normal cost Included in normal costadministration costs
Period required If employed on or before 8/1/99, 20% after three 100% after 10 years of credited serviceto vest years of credited service, plus 20% annually
thereafter to 100% after seven years; if employed after 8/1/99, 100% after seven years of credited service
Required 5% of compensation Police Officers: 9% of salarycontributions Firefighters: 9% of salary
Eligibility for BenefitsNormal retirement If employed before 8/1/99, age 60 and five years Earlier of age 55 and 10 years of credited
of credited service; if employed on or after 8/1/99 service or age 52 and 25 years of credited age 60 and seven years of credited service. service or age 60
Early retirement Age 55 and 10 years of credited service Age 50 and 10 years of credited service
Benefits
Normal retirement 3% of average final compensation times credited Police Officers: 3.35% of average final service. compensation times credited service earned
before 10/1/11 plus 3.30% of average finalcompensation times credited service earnedafter 10/1/11. Firefighters: 3.2% of average finalcompensation times credited service earnedbefore 10/1/11 plus 3.11% of average finalcompensation times credited service earnedearned on or after 10/1/11.
Early retirement Accrued benefit, reduced 2% for each year up to Accrued benefit, reduced 3% for each year five and 4% for each year between five and 10 prior to normal retirement.that early retirement precedes normal retirement.No reduction for participants age 55 and with 25years of service
The plans also have provisions for benefits in case of termination, disability or death.
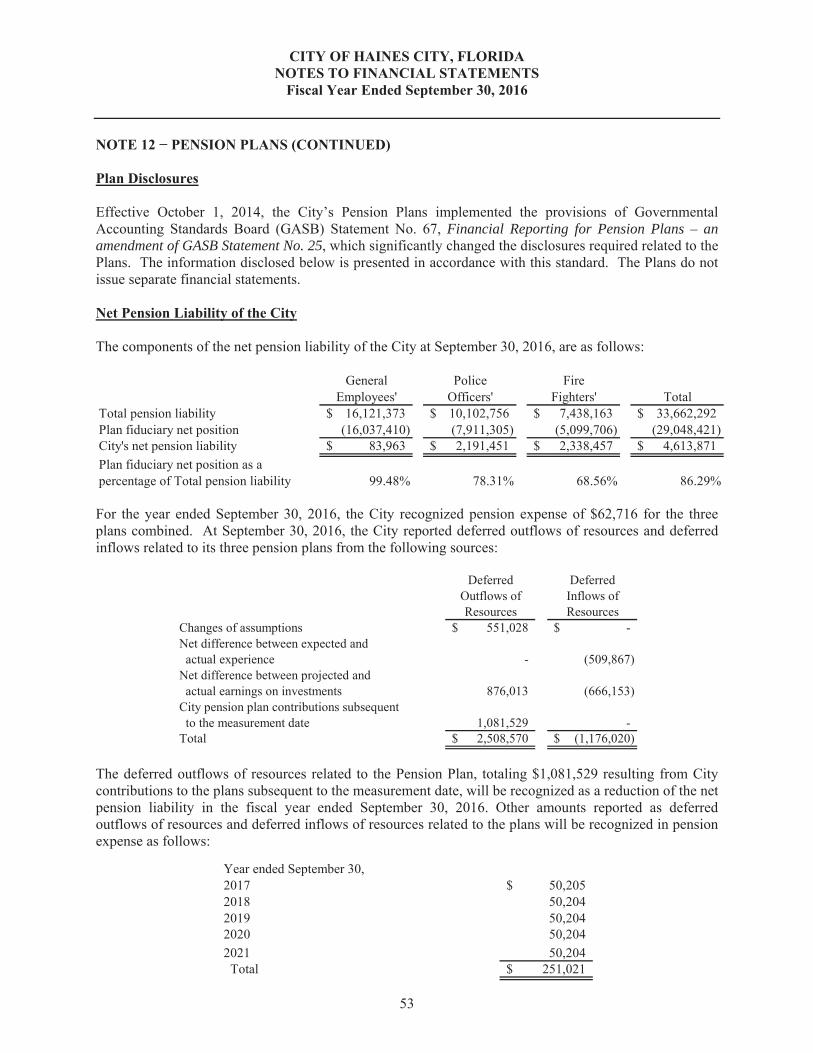
CITY OF HAINES CITY, FLORIDA NOTES TO FINANCIAL STATEMENTS
Fiscal Year Ended September 30, 2016
53
NOTE 12 PENSION PLANS (CONTINUED)
Plan Disclosures
Effective October 1, 2014, the City’s Pension Plans implemented the provisions of Governmental Accounting Standards Board (GASB) Statement No. 67, Financial Reporting for Pension Plans – an amendment of GASB Statement No. 25, which significantly changed the disclosures required related to the Plans. The information disclosed below is presented in accordance with this standard. The Plans do not issue separate financial statements.
Net Pension Liability of the City
The components of the net pension liability of the City at September 30, 2016, are as follows:
General Police FireEmployees' Officers' Fighters' Total
Total pension liability 16,121,373$ 10,102,756$ 7,438,163$ 33,662,292$Plan fiduciary net position (16,037,410) (7,911,305) (5,099,706) (29,048,421)City's net pension liability 83,963$ 2,191,451$ 2,338,457$ 4,613,871$Plan fiduciary net position as apercentage of Total pension liability 99.48% 78.31% 68.56% 86.29%
For the year ended September 30, 2016, the City recognized pension expense of $62,716 for the three plans combined. At September 30, 2016, the City reported deferred outflows of resources and deferred inflows related to its three pension plans from the following sources:
Deferred DeferredOutflows of Inflows ofResources Resources
Changes of assumptions 551,028$ -$ Net difference between expected and actual experience - (509,867) Net difference between projected and actual earnings on investments 876,013 (666,153) City pension plan contributions subsequent to the measurement date 1,081,529 - Total 2,508,570$ (1,176,020)$
The deferred outflows of resources related to the Pension Plan, totaling $1,081,529 resulting from City contributions to the plans subsequent to the measurement date, will be recognized as a reduction of the net pension liability in the fiscal year ended September 30, 2016. Other amounts reported as deferred outflows of resources and deferred inflows of resources related to the plans will be recognized in pension expense as follows:
Year ended September 30, 2017 50,205$ 2018 50,204 2019 50,204 2020 50,204 2021 50,204 Total 251,021$

CITY OF HAINES CITY, FLORIDA NOTES TO FINANCIAL STATEMENTS
Fiscal Year Ended September 30, 2016
54
NOTE 12 PENSION PLANS (CONTINUED)
The required schedule of changes in the City’s net pension liability and related ratios immediately following the notes to the financial statements presents multiyear trend information about whether the value of plan assets is increasing or decreasing over time relative to the total pension liability.
Actuarial assumptions. The total pension liability was determined by an actuarial valuation as of October 1, 2014 updated through September 30, 2015. The following actuarial assumptions applied to all periods included in the measurement:
General Police FireEmployees' Officers' Fighters'
Inflation 3.0% 3.0% 3.0%Salary increases 6.0% 4.0% - 10.0% 4.0% - 5.5%Investment rate of return 8.0% 7.5% 7.5%
Mortality rates were based upon the RP-2000 Combined Healthy Mortality Table.
The actuarial assumptions used in the October 1, 2015, valuation were based on the results of an actuarial experience study for the period 2008 – 2013.
The long-term expected rate of return on pension plan investments was determined using a building block method in which best-estimate ranges of expected future real rates of return (expected returns, net of pension plan investment expense and inflation) are developed for each major asset class. These ranges are combined to produce the long-term expected rate of return by weighting the expected future real rates of return by the target asset allocation percentage and by adding expected inflation. Best estimates of arithmetic real rates of return for each major asset class included in the pension plan’s target asset allocation as of September 30, 2016, are: Domestic Equities – 7.5%; International Equities – 8.5% and Broad Market Fixed Income – 2.5%.
The target asset allocation as of September 30, 2016, are: Domestic Equities – 40%; International Equities – 15%; Bonds – 30%; Convertibles – 10% and MLPs – 5% for the Police Officers’ plan.
The target asset allocation as of September 30, 2016, are: Domestic Equities – 50%; International Equities – 10%; Broad Market Fixed Income – 35%; and Global Bonds – 5% for the General Employees’ and the Fire Fighters’ plan.
Discount rate. The discount rate used to measure the total pension liability was 7.50% for the Fire Fighters’ and Police Officers’ plans and was 8.0% for the General Employees’ plan. The projection of cash flows used to determine the discount rate assumed that plan member contributions will be made at the current contribution rate and that City contributions will be made at rates equal to the difference between actuarially determined contribution rates and the member rate. Based on those assumptions, the pension plan’s fiduciary net position was projected to be available to make all projected future benefit payments of current plan members. Therefore, the long-term expected rate of return on pension plan investments was applied to all periods of projected benefit payments to determine the total pension liability.

CITY OF HAINES CITY, FLORIDA NOTES TO FINANCIAL STATEMENTS
Fiscal Year Ended September 30, 2016
55
NOTE 12 PENSION PLANS (CONTINUED)
Changes in the net pension liability of the City: The changes in the components of the net pension liability of the City for the fiscal year ended September 30, 2016, were as follows:
Total Pension Plan Fiduciary Net PensionLiability (a) Net Position (b) Liability (a-b)
Balances at 9/30/15 36,345,719$ 29,869,020$ 6,476,699$Changes for the year:
Service cost 788,398 - 788,398 Interest on total pension liability 2,495,221 - 2,495,221 Changes of benefit terms (3,433,675) (3,433,675) Change in excess state money 99,610 99,610 Differences between expected and actual experience (1,103,301) - (1,103,301) Change in assumptions 734,705 - 734,705 Benefit payments, including refunds of employee contributions (2,264,385) (2,303,448) 39,063 Contributions - employer - 1,820,474 (1,820,474) Net investment income - 9,001 (9,001) Administrative expenses - (346,626) 346,626
Net change (2,683,427) (820,599) (1,862,828)Balances at 9/30/16 33,662,292$ 29,048,421$ 4,613,871$
Sensitivity of the net pension liability to changes in the discount rate. The following table presents the net pension liability of the City, calculated using the discount rate of 7.50%, as well as what the City’s net pension liability would be if it were calculated using a discount rate that is 1-percentage-point lower (6.50%) or 1-percentage-point higher (8.50%) than the current rate:
Current1% Decrease Discount Rate 1% Increase
General Employees: 6.50% 7.50% 8.50%City's Net Pension Liability 1,751,655$ 83,963$ (1,334,550)$
Police Officers: 6.50% 7.50% 8.50%City's Net Pension Liability 3,530,566$ 2,191,451$ 1,187,776$
Fire Fighters: 6.50% 7.50% 8.50%City's Net Pension Liability 3,235,951$ 2,338,457$ 1,679,176$ Total 8,518,172$ 4,613,871$ 1,532,402$
Actuarial valuations involve estimates of the value of reported amounts and assumptions about the probability of events far into the future, and actuarially determined amounts are subject to continual revision as results are compared to past expectations and new estimates are made about the future. Actuarial calculations reflect a long-term perspective. Calculations are based on the substantive plan in effect as of September 30, 2016, and the current sharing pattern of costs between employer and employee.
Contributions
Members of the General Employees’ plan are required to contribute 5% of total compensation. The City is required to contribute the actuarially determined amounts. Administrative costs of the General Employees’ Pension Fund are financed through plan contributions and investment earnings.
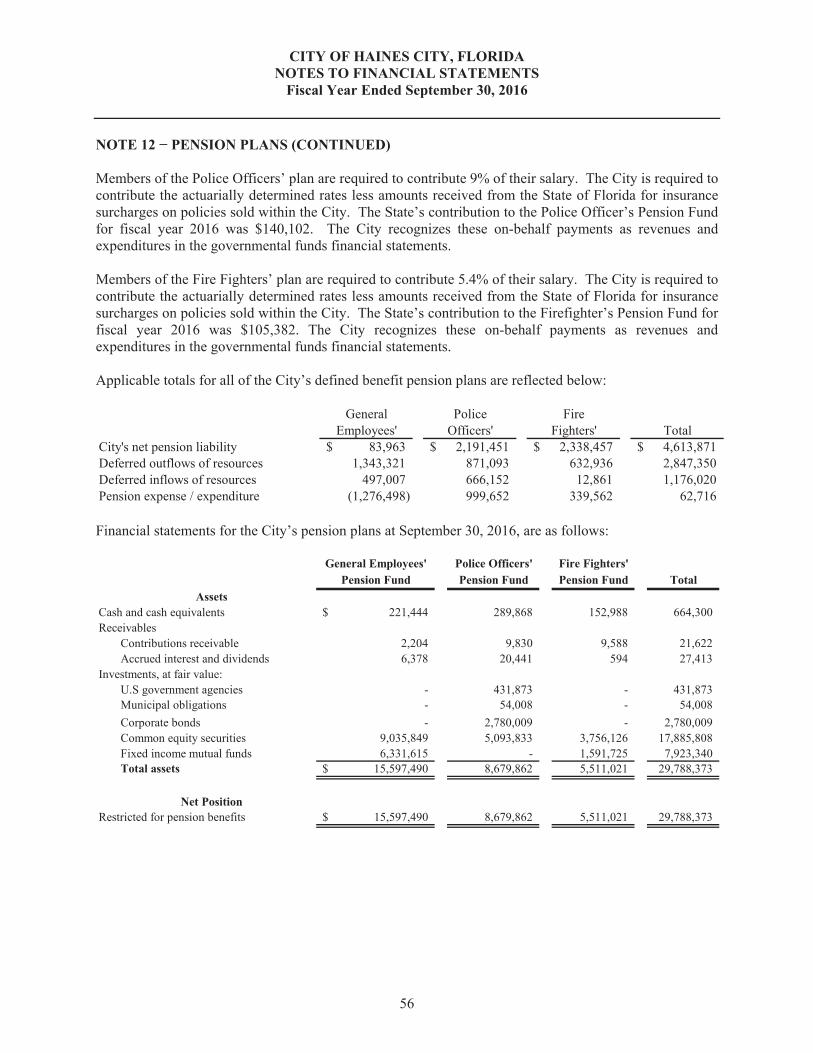
CITY OF HAINES CITY, FLORIDA NOTES TO FINANCIAL STATEMENTS
Fiscal Year Ended September 30, 2016
56
NOTE 12 PENSION PLANS (CONTINUED)
Members of the Police Officers’ plan are required to contribute 9% of their salary. The City is required to contribute the actuarially determined rates less amounts received from the State of Florida for insurance surcharges on policies sold within the City. The State’s contribution to the Police Officer’s Pension Fund for fiscal year 2016 was $140,102. The City recognizes these on-behalf payments as revenues and expenditures in the governmental funds financial statements.
Members of the Fire Fighters’ plan are required to contribute 5.4% of their salary. The City is required to contribute the actuarially determined rates less amounts received from the State of Florida for insurance surcharges on policies sold within the City. The State’s contribution to the Firefighter’s Pension Fund for fiscal year 2016 was $105,382. The City recognizes these on-behalf payments as revenues and expenditures in the governmental funds financial statements.
Applicable totals for all of the City’s defined benefit pension plans are reflected below:
General Police FireEmployees' Officers' Fighters' Total
City's net pension liability 83,963$ 2,191,451$ 2,338,457$ 4,613,871$Deferred outflows of resources 1,343,321 871,093 632,936 2,847,350Deferred inflows of resources 497,007 666,152 12,861 1,176,020Pension expense / expenditure (1,276,498) 999,652 339,562 62,716
Financial statements for the City’s pension plans at September 30, 2016, are as follows:
General Employees' Police Officers' Fire Fighters'Pension Fund Pension Fund Pension Fund Total
AssetsCash and cash equivalents 221,444$ 289,868 152,988 664,300 Receivables
Contributions receivable 2,204 9,830 9,588 21,622 Accrued interest and dividends 6,378 20,441 594 27,413
Investments, at fair value:U.S government agencies - 431,873 - 431,873 Municipal obligations - 54,008 - 54,008 Corporate bonds - 2,780,009 - 2,780,009 Common equity securities 9,035,849 5,093,833 3,756,126 17,885,808Fixed income mutual funds 6,331,615 - 1,591,725 7,923,340 Total assets 15,597,490$ 8,679,862 5,511,021 29,788,373
Net PositionRestricted for pension benefits 15,597,490$ 8,679,862 5,511,021 29,788,373

CITY OF HAINES CITY, FLORIDA NOTES TO FINANCIAL STATEMENTS
Fiscal Year Ended September 30, 2016
57
NOTE 12 PENSION PLANS (CONTINUED)
General Employees' Police Officers' Fire Fighters'Pension Fund Pension Fund Pension Fund Total
AdditionsContributions
Employer 118,886$ 392,211 327,254 838,351 Employees - 207,696 103,076 310,772 State of Florida - 140,102 105,382 245,484 Total contributions 118,886 740,009 535,712 1,394,607
Investment earningsInterest 14,199 97,932 1,179 113,310 Dividends 215,103 224,151 239,737 678,991 Net appreciation in fair value of investments 453,002 473,455 264,508 1,190,965 Net investment earnings 682,304 795,538 505,424 1,983,266 Total additions 801,190 1,535,547 1,041,136 3,377,873
DeductionsPension benefits 1,078,898 679,205 557,414 2,315,517 Administrative expenses 162,212 87,785 72,407 322,404 Total deductions 1,241,110 766,990 629,821 2,637,921
Change in net position (439,920) 768,557 411,315 739,952
Net position, beginning of year 16,037,410 7,911,305 5,099,706 29,048,421
Net position, end of year 15,597,490$ 8,679,862 5,511,021 29,788,373
NOTE 13 – COMMUNITY REDEVELOPMENT AGENCY
Pursuant to Florida Statute 163.387, listed below is a summary of the sources and amounts of deposits into, and the amount and purpose of withdrawals from the Community Redevelopment Agency (CRA) for the fiscal year ended September 30, 2016:
Revenues ExpendituresSource of Revenues
Ad valorem taxes $ 1,370,990 - Ad valorem taxes received from Polk County 1,170,698 - Interest 2,241Other 429 - Refunding notes issued 85,325 -
Purpose of ExpendituresProfessional services - 85,986Culture and recreation - 194,734Capital outlay - 29,700Debt service - 1,598,394
$ 2,629,683 1,908,814

REQUIRED SUPPLEMENTARY INFORMATION
In accordance with the Governmental Accounting Standards Board Statement Number 34, the following budgetary comparison for the General Fund and CRA Fund is required supplementary information.
In accordance with the Governmental Accounting Standards Board Statement Number 68, the following historical trend information of the City’s General Employees, Police Officers' and Firefighters' Pension Trust Funds is required supplementary information.
In accordance with the Governmental Accounting Standards Board Statement Number 45, the following historical trend information of the City’s Post-Employment Benefits Other than Pensions is required supplementary information.


VarianceActual With Final
Original Final Amounts BudgetRevenues
Property taxes 6,598,100$ 6,598,100 6,626,697 28,597 Gas and fuel taxes 860,000 860,000 962,003 102,003 Utility taxes 1,600,500 1,600,500 1,771,016 170,516 Communications service tax 530,000 530,000 518,919 (11,081) Local business tax 70,000 70,000 73,739 3,739 Franchise fees 1,890,000 1,890,000 1,810,206 (79,794) Licenses and permits 776,500 776,500 1,253,265 476,765 Intergovernmental 2,256,880 2,272,880 2,406,563 133,683 Charges for services 3,222,400 3,222,400 3,538,090 315,690 Fines and forfeitures 824,450 824,450 1,366,205 541,755 Assessments 1,800,000 1,800,000 1,810,363 10,363 Impact fees - - 498,955 498,955 Contributions 127,200 127,200 126,421 (779) Interest 15,000 15,000 27,206 12,206 Other 97,700 97,700 135,903 38,203
Total revenues 20,668,730 20,684,730 22,925,551 2,240,821
ExpendituresCurrent
General government 3,693,540 3,564,630 3,364,526 200,104 Public safety 9,006,345 8,749,490 8,581,570 167,920 Physical environment 1,877,375 1,877,375 1,847,682 29,693 Transportation 1,433,805 1,332,355 1,022,060 310,295 Culture and recreation 3,498,565 3,463,665 3,283,886 179,779
Capital outlay 347,145 1,578,830 1,645,296 (66,466) Total expenditures 19,856,775 20,566,345 19,745,020 821,325
Excess of revenues over expenditures 811,955 118,385 3,180,531 3,062,146
Other financing sources (uses)Insurance proceeds - 3,310 7,258 3,948 Refunding notes issued - - 11,635 11,635 Issuance of capital lease 140,825 140,825 93,092 (47,733) Transfers in 1,944,500 2,634,760 1,600,000 (1,034,760) Transfers out (2,897,280) (2,897,280) (3,151,459) (254,179)
Total other financing uses (811,955) (118,385) (1,439,474) (1,321,089)
Net change in fund balance - - 1,741,057 1,741,057
Fund balance, beginning of year 10,725,983 10,725,983 10,725,983 -
Fund balance, end of year 10,725,983$ 10,725,983 12,467,040 1,741,057
Budgeted Amounts
FOR THE FISCAL YEAR ENDED SEPTEMBER 30, 2016BUDGET AND ACTUAL–GENERAL FUND
CITY OF HAINES CITY, FLORIDA
SCHEDULE OF REVENUES, EXPENDITURES AND CHANGES IN FUND BALANCES–REQUIRED SUPPLEMENTARY INFORMATION
58

VarianceActual With Final
Original Final Amounts BudgetRevenues
Property taxes 1,208,460$ 1,208,460 1,170,698 (37,762) Interest revenue 500 500 2,241 1,741 Other - - 429 429
Total revenues 1,208,960 1,208,960 1,173,368 (35,592)
ExpendituresCurrent
Economic development 339,030 339,030 85,986 253,044 Culture and recreation 229,675 229,675 194,734 34,941
Capital outlay 28,000 28,000 29,700 (1,700) Total expenditures 596,705 596,705 310,420 286,285
Excess of revenues over expenditures 612,255 612,255 862,948 250,693
Other financing sources (uses)Refunding notes issued - - 85,325 85,325 Transfers in 1,370,990 1,370,990 1,370,990 - Transfers out (1,983,245) (1,983,245) (1,598,394) 384,851
Total other financing sources (uses) (612,255) (612,255) (142,079) 470,176
Net change in fund balance - - 720,869 720,869
Fund balance, beginning of year 203,453 203,453 203,453 -
Fund balance, end of year 203,453$ 203,453 924,322 720,869
Budgeted Amounts
CITY OF HAINES CITY, FLORIDAREQUIRED SUPPLEMENTARY INFORMATION
SCHEDULE OF REVENUES, EXPENDITURES AND CHANGES IN FUND BALANCES–BUDGET AND ACTUAL–CRA FUND
FOR THE FISCAL YEAR ENDED SEPTEMBER 30, 2016
59

CITY OF HAINES CITY, FLORIDA
REQUIRED SUPPLEMENTARY INFORMATION SCHEDULE OF CHANGES IN NET PENSION LIABILITY
AND RELATED RATIOS - GENERAL EMPLOYEES PENSION
2016 2015Total pension liability
Service cost 323,073$ 797,644$ Interest on total pension liability 1,233,630 1,451,733 Changes of benefit terms (3,433,675) - Differences between expected and actual experience (662,677) - Changes of assumptions 734,704 - Benefit payments, including refunds of employee contributions (1,209,317) (925,509)
Net change in total pension liability (3,014,262) 1,323,868
Total pension liability - beginning 19,135,635 17,811,767 Total pension liability - ending (a) 16,121,373$ 19,135,635$
Plan fiduciary net positionContributions - employer 443,084$ 893,398$ Contributions - state - - Contributions - employee 84,740 221,592 Net investment income 218,081 1,769,864 Benefit payments, including refunds of member contributions (1,220,354) (923,182) Administrative expenses (180,013) (141,662)
Net change in plan fiduciary net position (654,462) 1,820,010
Plan fiduciary net position - beginning 16,691,872 14,871,862 Plan fiduciary net position - ending (b) 16,037,410$ 16,691,872$
City's net pension liability - ending (a) - (b) 83,963$ 2,443,763$
Plan fiduciary net position as a percentage of the total pension liability 99.48% 87.23%
Covered-employee payroll 3,690,825$ 4,454,410$
City's net pension liability as a percentage of covered-employee payroll 2.27% 54.86%
Notes to the Schedule:The schedule will present 10 years of information once it is accumulated.
60

CITY OF HAINES CITY, FLORIDA
REQUIRED SUPPLEMENTARY INFORMATION SCHEDULE OF CONTRIBUTIONSGENERAL EMPLOYEES PENSION
2016 2015Actuarially determined contribution 472,548$ 890,882$ Contributions in relation to the actuarially determined contribution 443,084 893,398
Contribution deficiency (excess) 29,464$ (2,516)$
Covered employee payroll 3,690,825$ 4,454,410$ Contributions as a percentage of covered-employee payroll 12.80% 20.00%
Notes to the Schedule:
Valuation Date October 1, 2014
Methods and assumptions used to determine contribution rates:
Funding method: Entry age normal actuarial cost methodAmortization method: Level percentage of pay, closedRemaining amortization period: 14 years (as of 10/1/2014)Asset valuation method:
Inflation: 3.0% per yearSalary increases: 6% per year until the assumed retirement age.Final salary load: Individually determined based upon current accruals. Interest Rate:
Payroll increases:
Retirement age:
Early retirement:
The schedule will present 10 years of information once it is accumulated.
Actuarially determined contribution rates are calculated as of October 1, two years prior to the end of the fiscal year in which contributions are reported.
All assets are valued at market value with an adjustment made touniformly spread actuarial investment gains and losses (as measuredby actual market value investment return against expected marketvalue investment return) over a four year period.
8.0% per year, compounded annually, net of investment-related expenses
The earlier of age 60 with the completion of 7 years of service and age55 with the completion of 25 years of service. Members at or over thenormal retirement age on the valuation date are assumed to work oneadditional year.
3% per year for amortizing UAAL. None for required contribution projection.
Commencing with the earliest early retirement age (55 with 10 years ofservice), members are assumed to retire with an immediate subsidizedbenefit at the rate of 5% per year.
61

CITY OF HAINES CITY, FLORIDA
REQUIRED SUPPLEMENTARY INFORMATION SCHEDULES OF PENSION INVESTMENT RETURNS
2016 2015General Employees:Annual money-weighted rate of return, net of investment expenses 0.65% 11.18%
Police Officers:Annual money-weighted rate of return, net of investment expenses -3.69% 8.76%
Fire Fighters:Annual money-weighted rate of return, net of investment expenses -0.70% 12.42%
Notes to the Schedules:The schedules will present 10 years of information once it is accumulated.
62
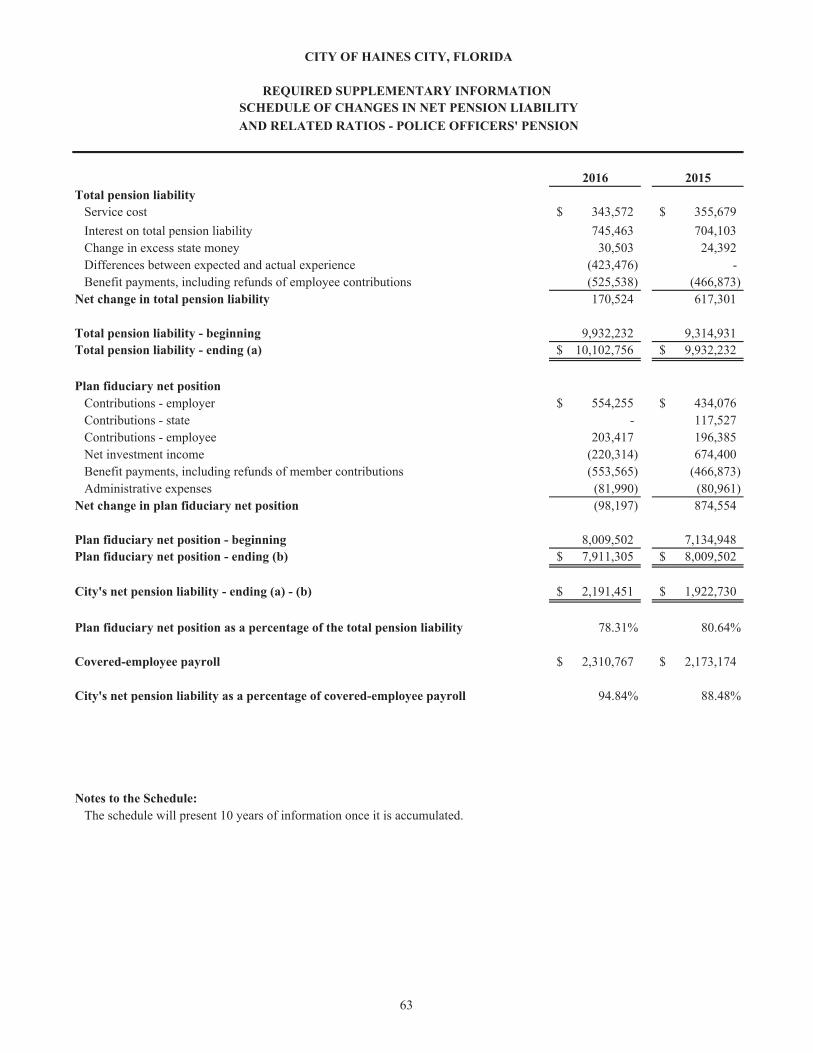
CITY OF HAINES CITY, FLORIDA
REQUIRED SUPPLEMENTARY INFORMATION SCHEDULE OF CHANGES IN NET PENSION LIABILITYAND RELATED RATIOS - POLICE OFFICERS' PENSION
2016 2015Total pension liability
Service cost 343,572$ 355,679$ Interest on total pension liability 745,463 704,103 Change in excess state money 30,503 24,392 Differences between expected and actual experience (423,476) - Benefit payments, including refunds of employee contributions (525,538) (466,873)
Net change in total pension liability 170,524 617,301
Total pension liability - beginning 9,932,232 9,314,931 Total pension liability - ending (a) 10,102,756$ 9,932,232$
Plan fiduciary net positionContributions - employer 554,255$ 434,076$ Contributions - state - 117,527 Contributions - employee 203,417 196,385 Net investment income (220,314) 674,400 Benefit payments, including refunds of member contributions (553,565) (466,873) Administrative expenses (81,990) (80,961)
Net change in plan fiduciary net position (98,197) 874,554
Plan fiduciary net position - beginning 8,009,502 7,134,948 Plan fiduciary net position - ending (b) 7,911,305$ 8,009,502$
City's net pension liability - ending (a) - (b) 2,191,451$ 1,922,730$
Plan fiduciary net position as a percentage of the total pension liability 78.31% 80.64%
Covered-employee payroll 2,310,767$ 2,173,174$
City's net pension liability as a percentage of covered-employee payroll 94.84% 88.48%
Notes to the Schedule:The schedule will present 10 years of information once it is accumulated.
63

CITY OF HAINES CITY, FLORIDA
REQUIRED SUPPLEMENTARY INFORMATION SCHEDULE OF CONTRIBUTIONS
POLICE OFFICERS' PENSION
2016 2015Actuarially determined contribution 520,137$ 517,215$ Contributions in relation to the actuarially determined contribution 554,255 551,603
Contribution deficiency (excess) (34,118)$ (34,388)$
Covered employee payroll 2,310,767$ 2,173,174$ Contributions as a percentage of covered-employee payroll 22.51% 23.80%
Notes to the Schedule:
Valuation Date October 1, 2014
Methods and assumptions used to determine contribution rates:
Funding method: Entry age normal actuarial cost methodAmortization method: Level percentage of pay, closedRemaining amortization period: 29 years (as of 10/1/2014)Asset valuation method:
Inflation: 3.0% per yearSalary increases:
Interest Rate:
Payroll increase: 3% per year.Retirement age:
Early retirement:
The schedule will present 10 years of information once it is accumulated.
7.0% per year until the assumed retirement age. Projected salary atretirement is increased 20% to account for non-regular compensation.
Actuarially determined contribution rates are calculated as of October 1, two years prior to the end of the fiscal year in which contributions are reported.
Each year, the prior actuarial value of assets is brought forwardutilizing the historical geometric 5-year average market value return(net of fees). It is possible that over time this technique will producean insignificant bias above or below market value.
7.5% per year, compounded annually, net of investment-relatedexpenses
Earlier of age 56 and 11 years of service, or age 53 and 26 years ofservice, or age 60. Also, any member who has reached normalretirement is assumed to continue employement for one additionalyear.Commencing with the earliest early retirement age (50), members areassumed to retire with an immediate subsidized benefit at the rate of5% per year.
64

CITY OF HAINES CITY, FLORIDA
REQUIRED SUPPLEMENTARY INFORMATION SCHEDULE OF CHANGES IN NET PENSION LIABILITY
AND RELATED RATIOS - FIRE FIGHTERS' PENSION
2016 2015Total pension liability
Service cost 121,753$ 130,593$ Interest on total pension liability 516,128 506,406 Change in excess state money 69,107 70,342 Differences between expected and actual experience (17,148) - Benefit payments, including refunds of employee contributions (529,529) (467,541)
Net change in total pension liability 160,311 239,800
Total pension liability - beginning 7,277,852 7,038,052 Total pension liability - ending (a) 7,438,163$ 7,277,852$
Plan fiduciary net positionContributions - employer 430,712$ 352,192$ Contributions - state - 110,374 Contributions - employee 104,266 105,867 Net investment income 11,234 592,615 Benefit payments, including refunds of member contributions (529,529) (467,541) Administrative expenses (84,623) (68,237)
Net change in plan fiduciary net position (67,940) 625,270
Plan fiduciary net position - beginning 5,167,646 4,542,376 Plan fiduciary net position - ending (b) 5,099,706$ 5,167,646$
City's net pension liability - ending (a) - (b) 2,338,457$ 2,110,206$
Plan fiduciary net position as a percentage of the total pension liability 68.56% 71.01%
Covered-employee payroll 1,233,777$ 1,146,263$
City's net pension liability as a percentage of covered-employee payroll 189.54% 184.09%
Notes to the Schedule:The schedule will present 10 years of information once it is accumulated.
65

CITY OF HAINES CITY, FLORIDA
REQUIRED SUPPLEMENTARY INFORMATION SCHEDULE OF CONTRIBUTIONS
FIRE FIGHTERS' PENSION
2016 2015Actuarially determined contribution 385,144$ 385,144$ Contributions in relation to the actuarially determined contribution 430,712 462,566
Contribution deficiency (excess) (45,568)$ (77,422)$
Covered employee payroll 1,233,777$ 1,146,263$ Contributions as a percentage of covered-employee payroll 31.22% 33.60%
Notes to the Schedule:
Valuation Date October 1, 2014
Methods and assumptions used to determine contribution rates:
Funding method: Entry age normal actuarial cost methodAmortization method: Level percentage of pay, closedRemaining amortization period: 29 years (as of 10/1/2014)Asset valuation method:
Inflation: 3.0% per yearSalary increases:
Interest Rate:
Payroll increase: 3% per year.Retirement age:
Early retirement:
The schedule will present 10 years of information once it is accumulated.
6.5% per year until the assumed retirement age. Projected salary atretirement is increased 20% to account for non-regular compensation. 7.5% per year, compounded annually, net of investment-relatedexpenses
Earlier of age 55 and 10 years of service, age 52 and 25 years ofservice, and age 60. Also, any member who has reached normalretirement is assumed to continue employement for one additionalyear.Commencing with the earliest early retirement age (50), members areassumed to retire with an immediate subsidized benefit at the rate of10% per year.
Each year, the prior actuarial value of assets is brought forwardutilizing the historical geometric 5-year average market value return(net of fees). It is possible that over time this technique will producean insignificant bias above or below market value.
Actuarially determined contribution rates are calculated as of October 1, two years prior to the end of the fiscal year in which contributions are reported.
66

CITY OF HAINES CITY, FLORIDAREQUIRED SUPPLEMENTARY INFORMATION
SCHEDULE OF FUNDING PROGRESS–OTHER POST-EMPLOYMENT BENEFITSFOR THE FISCAL YEAR ENDED SEPTEMBER 30, 2016
Schedule of Funding Progress
(1) (2) (3) UAALActuarial Actuarial Actuarial Unfunded Funded Annual as a %Valuation Value Accrued AAL (UAAL) Ratio Covered of Payroll
Date of Assets Liability (AAL) (2) - (1) (1)/(2) Payroll [(2) - (1)] / (3)
10/1/2015 -$ 2,554,437$ 2,554,437$ 0.00% 8,214,148$ 31.10%10/1/2014 - 2,475,673 2,475,673 0.00% 8,510,287 29.09%10/1/2013 - 2,246,712 2,246,712 0.00% 8,510,287 26.40%
As stated in GASB 45, Accounting and Financial Reporting by Employers for Post-employment Benefits Other thanPensions, OPEB plans with a total membership of 200 or more must have actuarial valuations at least biennially.
67

OTHER SUPPLEMENTARY INFORMATION


Balance Balance09/30/15 Additions Deductions 09/30/16
AssetsCash and cash equivalents 11,741$ 30$ -$ 11,771$
LiabilitiesDeposits held in custody for others 11,741$ 30$ -$ 11,771$
RIGHT OF WAY AGENCY FUND
CITY OF HAINES CITY, FLORIDAOTHER SUPPLEMENTARY INFORMATION
STATEMENT OF CHANGES IN ASSETS AND LIABILITIES
FOR THE FISCAL YEAR ENDED SEPTEMBER 30, 2016
68


Statistical Section
The statistical section of the Comprehensive Annual Financial Report presents detailed information as a context for understanding what the information in the financial statements, note disclosures, and required supplementary information indicates about the City's overall financial health. Below is a summary of the components and purpose for the tables provided herein.
Page
Financial Trends…………………………………………………………………………. 69
These schedules contain trend information to help the reader understand how the City’s financial performance and well-being have changed over time.
Revenue Capacity ……………………………………………………………………….. 74
These schedules contain trend information to help the reader assess the City’s most significant local revenue source, the property tax.
Debt Capacity ……………………………………………………………………………. 78
These schedules present information to help the reader assess the affordability of the City’s current levels of outstanding debt, the City’s ability to issue additional debt in the future and related historical trend data..
Demographic and Economic Information ……………………………………….………. 83
These schedules offer demographic and economic indicators to help the reader understand the environment within which the City’s financial activities take place.
Operating Information ………………………………………………………………….. 85
These schedules contain service and infrastructure data to help the reader understand how the information in the City’s financial report relates to the services the city provides and the activities it performs.


2007
2008
2009
2010
2011
2012
2013
2014
2015
2016
Gov
ernm
enta
l act
iviti
es
Net
inve
stm
ent i
n ca
pita
l ass
ets
23,4
76,9
03$
29,8
57,4
2029
,415
,076
28,5
76,3
9126
,940
,200
22,2
15,4
1023
,437
,379
21,7
01,7
75
22,2
90,7
61
21,7
19,2
02
Res
trict
ed3,
615,
300
4,78
0,83
14,
924,
785
5,09
5,13
06,
975,
641
9,56
2,33
06,
063,
673
5,65
3,28
0
4,
523,
550
4,67
7,82
1
Unr
estri
cted
8,39
2,92
25,
199,
355
7,39
3,46
67,
626,
335
4,99
5,80
43,
921,
279
2,07
5,98
03,
629,
398
(30,
669)
4,12
5,79
4
Tot
al g
over
nmen
tal a
ctiv
ities
ne
t pos
ition
35,4
85,1
25$
39,8
37,6
0641
,733
,327
41,2
97,8
5638
,911
,645
35,6
99,0
1931
,577
,032
30,9
84,4
53
26,7
83,6
42
30,5
22,8
17
Bus
ines
s-ty
pe a
ctiv
ities
N
et in
vest
men
t in
capi
tal a
sset
s18
,130
,167
$
27,1
45,0
02
29
,787
,837
34,3
90,1
10
37
,287
,641
37,2
74,8
91
34
,286
,996
34
,971
,248
36
,985
,880
39
,912
,100
R
estri
cted
5,23
2,98
44,
932,
384
4,24
9,43
22,
387,
606
2,55
8,21
02,
668,
531
2,66
8,53
13,
292,
321
3,07
5,98
6
3,
919,
286
U
nres
trict
ed2,
805,
237
3,39
4,03
43,
157,
162
4,69
7,00
32,
788,
028
3,04
4,50
47,
876,
386
8,08
2,24
0
7,
570,
207
9,54
3,36
0
Tot
al b
usin
ess-
type
act
iviti
es
ne
t pos
ition
26,1
68,3
88$
35,4
71,4
2037
,194
,431
41,4
74,7
1942
,633
,879
42,9
87,9
2644
,831
,913
46,3
45,8
09
47,6
32,0
73
53,3
74,7
46
Prim
ary
gove
rnm
ent
N
et in
vest
men
t in
capi
tal a
sset
s41
,607
,070
$57
,002
,422
59,2
02,9
1362
,966
,501
64,2
27,8
4159
,490
,301
57,7
24,3
7556
,673
,023
59,2
76,6
41
61,6
31,3
02
Res
trict
ed8,
848,
284
9,71
3,21
59,
174,
217
7,48
2,73
69,
533,
851
12,2
30,8
618,
732,
204
8,94
5,60
1
7,
599,
536
8,59
7,10
7
Unr
estri
cted
11,1
98,1
598,
593,
389
10,5
50,6
2812
,323
,338
7,78
3,83
26,
965,
783
9,95
2,36
611
,711
,638
7,
539,
538
13,6
69,1
54
Tot
al p
rimar
y go
vern
men
t
ne
t pos
ition
61,6
53,5
13$
75,3
09,0
2678
,927
,758
82,7
72,5
7581
,545
,524
78,6
86,9
4576
,408
,945
77,3
30,2
62
74,4
15,7
15
83,8
97,5
63
Sour
ces:
Info
rmat
ion
deriv
ed fr
om th
e co
mpr
ehen
sive
ann
ual f
inan
cial
repo
rt or
ann
ual f
inan
cial
repo
rts fo
r the
rele
vant
yea
r.Th
e C
ity im
plem
ente
d G
ASB
Sta
tem
ent 3
4 in
200
3; sc
hedu
les p
rese
ntin
g go
vern
men
t-wid
e in
form
atio
n in
clud
e in
form
atio
n be
ginn
ing
in th
at y
ear.
69
CIT
Y O
F H
AIN
ES
CIT
Y, F
LO
RID
AN
ET
PO
SIT
ION
BY
CO
MPO
NE
NT
Las
t Ten
Fis
cal Y
ears
(acc
rual
bas
is o
f acc
ount
ing)

Exp
ense
s20
0720
0820
0920
1020
1120
1220
1320
1420
1520
16
Gov
ernm
enta
l act
iviti
es
G
ener
al g
over
nmen
t3,
122,
071
$2,
541,
726
3,72
2,26
23,
624,
171
3,40
0,46
73,
110,
061
3,61
5,99
23,
799,
284
3,59
5,25
43,
468,
800
Publ
ic sa
fety
6,89
8,27
07,
163,
470
7,40
4,67
87,
646,
714
8,40
6,66
78,
949,
795
9,08
2,03
58,
746,
663
8,76
2,72
38,
703,
603
Phys
ical
env
ironm
ent
2,27
9,49
22,
389,
786
2,31
1,30
42,
256,
065
2,27
0,20
32,
407,
824
2,73
2,17
82,
078,
854
1,96
4,60
01,
834,
507
Tran
spor
tatio
n2,
103,
696
1,74
1,82
61,
792,
055
1,43
2,91
31,
366,
502
1,52
8,13
92,
098,
081
1,38
9,98
32,
331,
126
1,30
5,39
7
Ec
onom
ic e
nviro
nmen
t1,
385,
515
1,55
0,58
71,
393,
596
1,69
3,95
31,
513,
205
1,22
4,27
634
8,22
422
8,51
822
7,94
229
2,27
2
C
ultu
re a
nd re
crea
tion
2,70
5,53
82,
953,
468
4,07
8,88
44,
950,
934
4,86
1,54
05,
199,
493
5,03
0,10
24,
904,
738
4,82
6,88
04,
610,
486
Inte
rest
on
long
-term
deb
t60
0,81
31,
971,
844
1,77
4,79
096
1,10
91,
999,
634
2,21
3,16
22,
697,
317
2,01
7,53
21,
989,
212
1,97
6,58
9To
tal g
over
nmen
tal a
ctiv
ities
exp
ense
s 19
,095
,395
20,3
12,7
0722
,477
,569
22,5
65,8
5923
,818
,218
24,6
32,7
5025
,603
,929
23,1
65,5
7223
,697
,737
22,1
91,6
54
B
usin
ess-
type
act
iviti
es
W
ater
/sew
er u
tility
4,95
9,49
95,
364,
164
5,94
3,44
75,
902,
252
5,91
6,02
36,
954,
698
6,66
0,71
06,
655,
355
6,72
4,69
86,
349,
429
Stor
mw
ater
util
ity15
2,69
775
,017
61,4
1627
1,81
427
0,17
545
0,92
932
3,11
925
5,38
023
7,58
429
7,36
3To
tal b
usin
ess-
type
act
iviti
es e
xpen
ses
5,11
2,19
65,
439,
181
6,00
4,86
36,
174,
066
6,18
6,19
87,
405,
627
6,98
3,82
96,
910,
735
6,96
2,28
26,
646,
792
Tota
l prim
ary
gove
rnm
ent n
et p
ositi
on24
,207
,591
25,7
51,8
8828
,482
,432
28,7
39,9
2530
,004
,416
32,0
38,3
7732
,587
,758
30,0
76,3
0730
,660
,019
28,8
38,4
46
Prog
ram
rev
enue
s
Gov
ernm
enta
l act
iviti
es
C
harg
es fo
r ser
vice
s
Gen
eral
gov
ernm
ent
1,72
4,42
71,
218,
390
684,
283
817,
763
943,
347
1,02
6,20
61,
333,
376
2,62
5,43
73,
581,
673
1,70
1,92
6
Publ
ic sa
fety
792,
494
736,
734
472,
928
492,
529
1,81
2,47
32,
065,
746
1,78
1,35
41,
159,
008
1,05
5,09
63,
331,
891
Ph
ysic
al e
nviro
nmen
t2,
233,
962
2,35
9,19
32,
285,
293
2,21
1,52
12,
216,
110
2,28
8,62
32,
513,
053
2,43
3,75
22,
476,
577
2,53
0,45
5
Tran
spor
tatio
n1,
071,
798
736,
696
485,
559
336,
351
291,
073
152,
524
477,
617
225,
720
502,
397
406,
958
Ec
onom
ic e
nviro
nmen
t44
3,27
387
5,51
737
9,22
723
,968
27,8
00-
--
--
C
ultu
re a
nd re
crea
tion
288,
562
177,
593
382,
083
528,
904
512,
225
486,
031
585,
657
554,
736
585,
832
647,
163
Ope
ratin
g gr
ants
and
con
tribu
tions
887,
006
861,
011
1,09
8,41
41,
077,
708
1,21
5,42
262
7,69
141
1,25
340
1,00
338
3,39
433
3,12
3
C
apita
l gra
nts a
nd c
ontri
butio
ns55
0,85
426
8,13
383
3,67
02,
333
18,6
6770
9,14
938
,463
-
25,0
00-
Tota
l gov
ernm
enta
l act
iviti
es p
rogr
am re
venu
es7,
992,
376
7,23
3,26
76,
621,
457
5,49
1,07
77,
037,
117
7,35
5,97
07,
140,
773
7,39
9,65
68,
609,
969
8,95
1,51
6
B
usin
ess-
type
act
iviti
es
C
harg
es fo
r ser
vice
s7,
351,
255
8,12
8,62
77,
458,
032
7,62
3,87
38,
279,
379
8,75
5,10
89,
785,
780
9,78
7,68
89,
850,
613
11,6
76,8
99
O
pera
ting
gran
ts a
nd c
ontri
butio
ns39
,790
--
--
37
,578
4,98
7-
--
Cap
ital g
rant
s and
con
tribu
tions
143,
288
7,40
7,56
21,
230,
190
3,91
9,99
412
5,03
265
,088
335,
604
-
580,
776
2,29
0,67
8To
tal b
usin
ess-
type
act
iviti
es p
rogr
am re
venu
es7,
534,
333
15,5
36,1
898,
688,
222
11,5
43,8
678,
404,
411
8,85
7,77
410
,126
,371
9,78
7,68
810
,431
,389
13,9
67,5
77
Tota
l prim
ary
gove
rnm
ent p
rogr
am re
venu
es15
,526
,709
22,7
69,4
5615
,309
,679
17,0
34,9
4415
,441
,528
16,2
13,7
4417
,267
,144
17,1
87,3
4419
,041
,358
22,9
19,0
93
Net
(exp
ense
s)/r
even
ue
Gov
ernm
enta
l act
iviti
es(1
1,10
3,01
9)(1
3,07
9,44
0)(1
5,85
6,11
2)(1
7,07
4,78
2)(1
6,78
1,10
1)(1
7,27
6,78
0)
(18,
463,
156)
(1
5,76
5,91
6)(1
5,08
7,76
8)(1
3,24
0,13
8)
Bus
ines
s-ty
pe a
ctiv
ities
2,42
2,13
710
,097
,008
2,68
3,35
95,
369,
801
2,21
8,21
31,
452,
147
3,14
2,54
22,
876,
953
3,46
9,10
77,
320,
785
Tota
l prim
ary
gove
rnm
ent n
et e
xpen
ses
(8,6
80,8
82)
$(2
,982
,432
)(1
3,17
2,75
3)(1
1,70
4,98
1)(1
4,56
2,88
8)(1
5,82
4,63
3)
(15,
320,
614)
(1
2,88
8,96
3)(1
1,61
8,66
1)(5
,919
,353
)
Sour
ces:
Info
rmat
ion
deriv
ed fr
om th
e co
mpr
ehen
sive
ann
ual f
inan
cial
repo
rt or
ann
ual f
inan
cial
repo
rts fo
r the
rele
vant
yea
r.Th
e C
ity im
plem
ente
d G
ASB
Sta
tem
ent 3
4 in
200
3; sc
hedu
les p
rese
ntin
g go
vern
men
t-wid
e in
form
atio
n in
clud
e in
form
atio
n be
ginn
ing
in th
at y
ear.
70
CIT
Y O
F H
AIN
ES
CIT
Y, F
LO
RID
AC
HA
NG
ES
IN N
ET
PO
SIT
ION
(acc
rual
bas
is o
f acc
ount
ing)
Las
t Ten
Fis
cal Y
ears

2007
2008
2009
2010
2011
2012
2013
2014
2015
2016
Gen
eral
rev
enue
s and
oth
er c
hang
es i
n ne
t pos
ition
G
over
nmen
tal a
ctiv
ities
Prop
erty
taxe
s8,
722,
091
$10
,213
,697
10,2
86,1
018,
940,
798
6,87
8,62
46,
048,
218
6,45
7,67
9
6,65
8,89
6
7,
191,
929
7,79
7,39
5
Fr
anch
ise
taxe
s1,
572,
079
1,64
4,84
81,
936,
734
2,08
5,37
3
1,
968,
887
1,93
5,03
81,
890,
395
1,
979,
579
1,97
1,01
6
1,
810,
206
Util
ity ta
xes
1,21
8,58
81,
254,
101
1,30
3,50
91,
471,
442
1,43
7,39
41,
418,
290
1,47
2,36
3
1,55
7,79
2
1,
637,
064
1,77
1,01
6
C
omm
unic
atio
ns ta
xes
686,
392
725,
155
767,
190
677,
765
64
9,98
866
1,52
654
3,15
4
53
3,36
4
514,
898
51
8,91
9
Lo
cal b
usin
ess t
ax-
70
,575
71,3
8976
,213
84
,424
66,2
8572
,503
71
,948
75
,354
73
,739
Gas
and
fuel
taxe
s82
5,07
582
3,39
580
5,14
579
6,85
9
766,
757
746,
463
778,
859
824,
130
88
4,34
6
962,
003
Stat
e re
venu
e sh
arin
g1,
602,
438
1,56
7,68
81,
406,
501
1,37
5,31
0
1,
416,
689
1,65
9,85
01,
750,
552
1,
872,
644
2,01
9,14
0
2,
184,
678
Unr
estri
cted
inve
stm
ent e
arni
ngs
530,
837
267,
850
131,
663
75,9
06
101,
433
382,
319
273,
878
257,
673
25
3,12
6
254,
099
Gai
n/(lo
ss) o
n sa
le o
f cap
ital a
sset
s(1
00,8
41)
(87,
186)
--
-
--
-
15
5,58
0
7,25
8
Tr
ansf
ers i
n (o
ut)
266,
329
951,
798
1,04
3,60
11,
130,
339
1,10
0,00
01,
146,
165
1,38
5,83
5
1,38
5,83
5
1,
554,
447
1,60
0,00
0
Tota
l gov
ernm
enta
l act
iviti
es15
,322
,988
17,4
31,9
2117
,751
,833
16,6
30,0
05
14,4
04,1
9614
,064
,154
14,6
25,2
18
15,1
41,8
6116
,256
,900
16
,979
,313
B
usin
ess-
type
act
iviti
es
U
nres
trict
ed in
vest
men
t ear
ning
s35
5,85
617
0,23
683
,253
38,7
36
43,0
3733
,956
29,0
87
22,7
78
22,2
84
21,8
88
M
isce
llane
ous
--
--
-
14
,109
58,1
93
-
-
-
G
ain/
(loss
) on
sale
of c
apita
l ass
ets
(208
,659
)(1
2,41
4)-
-
--
-
-
-
-
Tran
sfer
s in
(out
)(2
66,3
29)
(951
,798
)(1
,043
,601
)(1
,130
,339
)(1
,100
,000
)(1
,146
,165
)(1
,385
,835
)
(1,3
85,8
35)
(1,5
54,4
47)
(1,6
00,0
00)
Tota
l bus
ines
s-ty
pe a
ctiv
ities
(119
,132
)(7
93,9
76)
(960
,348
)(1
,091
,603
)(1
,056
,963
)(1
,098
,100
)(1
,298
,555
)
(1,3
63,0
57)
(1,5
32,1
63)
(1,5
78,1
12)
Tota
l prim
ary
gove
rnm
ent
15,2
03,8
5616
,637
,945
16,7
91,4
8515
,538
,402
13
,347
,233
12,9
66,0
5413
,326
,663
13
,778
,804
14,7
24,7
37
15,4
01,2
01
Cha
nge
in n
et p
ositi
on
Gov
ernm
enta
l act
iviti
es4,
219,
969
4,35
2,48
11,
895,
721
(444
,777
)(2
,376
,905
)(3
,212
,626
)(3
,837
,938
)
(624
,055
)1,
169,
132
3,73
9,17
5
Bus
ines
s-ty
pe a
ctiv
ities
2,30
3,00
59,
303,
032
1,72
3,01
14,
278,
198
1,16
1,25
035
4,04
71,
843,
987
1,
513,
896
1,93
6,94
4
5,
742,
673
To
tal p
rimar
y go
vern
men
t6,
522,
974
$13
,655
,513
3,61
8,73
23,
833,
421
(1,2
15,6
55)
(2,8
58,5
79)
(1,9
93,9
51)
88
9,84
1
3,10
6,07
6
9,
481,
848
Sour
ces:
Info
rmat
ion
deriv
ed fr
om th
e co
mpr
ehen
sive
ann
ual f
inan
cial
repo
rt or
ann
ual f
inan
cial
repo
rts fo
r the
rele
vant
yea
r.
71
CIT
Y O
F H
AIN
ES
CIT
Y, F
LO
RID
AC
HA
NG
ES
IN N
ET
PO
SIT
ION
(acc
rual
bas
is o
f acc
ount
ing)
Las
t Ten
Fis
cal Y
ears

CIT
Y O
F H
AIN
ES
CIT
Y, F
LO
RID
AFU
ND
BA
LA
NC
ES,
GO
VE
RN
ME
NT
AL
FU
ND
S(m
odifi
ed a
ccru
al b
asis
of a
ccou
ntin
g)L
ast T
en F
isca
l Yea
rs
2007
2008
2009
2010
2011
2012
2013
2014
2015
2016
Gen
eral
Fun
d
N
onsp
enda
ble
-$
-
-
-
95
,210
11
0,52
4
74
,724
76
,171
52
9,20
1
48,4
83
Res
trict
ed-
-
-
-
3,88
4,15
9
3,61
0,81
5
3,33
5,25
9
3,
473,
360
3,49
1,46
2
3,
962,
535
A
ssig
ned
-
-
-
-
3,
022,
660
49
2,77
0
40
0,00
0
-
-
-
Una
ssig
ned
-
-
-
-
3,
543,
346
4,
609,
524
4,
001,
486
5,52
2,73
26,
705,
320
8,45
6,02
2
R
eser
ved
1,39
5,83
736
4,48
112
9,35
959
,038
-
-
-
-
-
-
Unr
eser
ved
10,7
19,8
91
10
,686
,550
10,4
37,5
6611
,103
,810
-
-
-
-
-
-
Tota
l gen
eral
fund
12,1
15,7
28$
11,0
51,0
31
10,5
66,9
25
11,1
62,8
48
10,5
45,3
75
8,82
3,63
3
7,81
1,46
9
9,
072,
263
10,7
25,9
83
12,4
67,0
40
All
othe
r go
vern
men
tal f
unds
Res
trict
ed, r
epor
ted
in
C
apita
l Pro
ject
s Fun
d-
$
-
-
-
10,0
57,8
98
4,35
9,42
6
1,44
0,29
0
1,
365,
494
-
-
CR
A F
und
-
-
-
-
1,
825,
119
30
9,82
0
-
-
203,
453
92
4,32
2
Deb
t Ser
vice
Fun
d-
--
-
1,
260,
774
1,
273,
655
1,
288,
124
1,31
0,65
21,
324,
861
62,8
30
R
eser
ved
29,8
52,1
82
1,
130,
504
1,23
0,23
1
1,
243,
303
-
-
-
-
-
-
Unr
eser
ved,
repo
rted
in
CR
A F
und
-
18
,122
,376
3,
186,
179
2,55
8,78
8
-
-
-
-
-
-
Tota
l all
othe
r
gove
rnm
enta
l fun
ds29
,852
,182
$19
,252
,880
4,
416,
410
3,80
2,09
1
13
,143
,791
5,
942,
901
2,
728,
414
2,67
6,14
61,
528,
314
987,
152
Sour
ces:
Info
rmat
ion
deriv
ed fr
om th
e co
mpr
ehen
sive
ann
ual f
inan
cial
repo
rt or
ann
ual f
inan
cial
repo
rts fo
r the
rele
vant
yea
r.
72

CIT
Y O
F H
AIN
ES
CIT
Y, F
LO
RID
AC
HA
NG
ES
IN F
UN
D B
AL
AN
CE
S, G
OV
ER
NM
EN
TA
L F
UN
DS
(mod
ified
acc
rual
bas
is o
f acc
ount
ing)
Las
t Ten
Fis
cal Y
ears
Rev
enue
s20
0720
0820
0920
1020
1120
1220
1320
1420
1520
16
Tax
es13
,024
,223
$ 14
,731
,771
15
,170
,068
14
,048
,450
11
,786
,074
10
,875
,820
11
,214
,953
11
,625
,709
12
,274
,607
12
,933
,278
L
icen
ses a
nd p
erm
its1,
381,
617
931,
930
32
6,25
6
327,
821
36
0,95
3
538,
662
87
9,19
0
83
9,58
7
97
2,78
5
1,
253,
265
In
terg
over
nmen
tal r
even
ues
4,31
4,08
0
3,
061,
894
3,41
5,04
2
2,
606,
694
2,53
9,68
7
2,
755,
865
2,38
3,76
6
2,10
0,59
1
2,25
4,62
2
2,40
6,56
3
Cha
rges
for s
ervi
ces
2,60
4,44
5
2,
790,
219
2,86
0,20
3
2,
952,
486
2,96
5,27
1
3,
091,
021
3,37
6,45
0
3,21
9,72
2
3,47
6,11
7
3,53
8,09
0
Fin
es a
nd fo
rfei
ture
s26
5,43
2
190,
237
26
1,00
4
361,
709
1,
735,
716
1,97
0,25
4
1,
668,
140
1,
089,
915
96
4,30
5
1,
366,
205
A
sses
smen
ts-
-
-
-
-
-
-
1,37
5,92
7
2,11
6,84
9
1,81
0,36
3
Impa
ct fe
es1,
296,
464
756,
229
33
3,23
3
348,
306
25
8,66
1
151,
992
58
9,09
1
35
7,46
0
47
8,99
1
49
8,95
5
M
isce
llane
ous r
even
ues
1,31
1,85
5
1,
401,
974
939,
395
35
8,65
5
718,
903
62
6,41
9
591,
164
546,
771
618,
566
403,
436
To
tal r
even
ues
24,1
98,1
16
23,8
64,2
5423
,305
,201
21
,004
,121
20,3
65,2
65
20,0
10,0
33
20,7
02,7
54
21,1
55,6
82
23,1
56,8
42
24,2
10,1
55
Exp
endi
ture
sC
urre
nt
Gen
eral
gov
ernm
ent
2,69
6,55
7
3,
284,
156
2,67
7,03
0
3,
154,
632
3,16
4,41
9
2,
916,
138
3,30
7,80
7
3,20
7,65
5
3,28
9,50
8
3,36
4,52
6
Pub
lic sa
fety
6,42
7,64
3
6,
615,
670
6,73
4,41
8
6,
983,
796
7,83
6,13
9
8,
452,
010
8,68
7,22
0
8,30
2,66
5
8,44
9,77
6
8,58
1,57
0
Phy
sica
l env
ironm
ent
2,27
8,21
2
2,
387,
630
2,30
6,11
7
2,
250,
786
2,26
8,83
8
2,
406,
891
2,73
6,83
8
2,07
9,60
2
1,95
9,22
6
1,84
7,68
2
Tra
nspo
rtatio
n1,
836,
469
1,43
2,34
3
1,
462,
387
1,08
7,48
9
1,
021,
361
1,19
6,01
4
1,
389,
560
1,
006,
979
1,
977,
480
1,
022,
060
E
cono
mic
env
ironm
ent
1,75
4,87
0
1,
431,
838
1,31
2,87
2
1,
353,
196
1,17
3,55
4
90
0,12
5
150,
934
22,7
62
19,9
63
85,9
86
Cul
ture
and
recr
eatio
n2,
448,
921
2,52
8,91
1
3,
092,
972
3,19
1,00
7
3,
168,
448
3,51
6,15
8
3,
104,
819
3,
014,
287
2,
995,
290
3,
478,
620
Cap
ital o
utla
y6,
940,
050
17,0
63,9
8219
,344
,204
1,
126,
872
2,42
9,36
9
7,
187,
108
3,35
5,53
1
1,09
4,50
5
3,34
3,48
4
1,67
4,99
6
D
ebt s
ervi
ce
Prin
cipa
l ret
irem
ent
536,
915
64
3,86
2
1,15
8,01
1
1,
320,
473
1,29
9,24
7
1,
324,
402
1,47
1,00
0
1,65
1,90
7
1,61
4,88
0
1,84
2,34
7
Inte
rest
and
fisc
al c
harg
es51
8,27
8
1,23
9,10
9
1,
771,
137
1,72
4,91
7
2,
131,
212
2,19
4,37
6
2,
132,
915
2,
065,
990
2,
038,
540
1,
895,
153
Tota
l exp
endi
ture
s25
,437
,915
36
,627
,501
39,8
59,1
48
22,1
93,1
6824
,492
,587
30
,093
,222
26
,336
,624
22
,446
,352
25
,688
,147
23
,792
,940
Exce
ss o
f rev
enue
s
ove
r (un
der)
exp
endi
ture
s(1
,239
,799
)
(1
2,76
3,24
7)
(16,
553,
947)
(1,1
89,0
47)
(4
,127
,322
)
(10,
083,
189)
(5
,633
,870
)(1
,290
,670
)(2
,531
,305
)41
7,21
5
Oth
er fi
nanc
ing
sour
ces (
uses
)
Bon
d/Lo
an p
roce
eds
26,8
83,2
24
106,
996
15
9,64
4
-
11,7
48,0
00
-
-
-
-
-
Insu
ranc
e pr
ocee
ds20
,852
38,9
28
30,1
26
40
,312
3,
549
9,24
2
52
,860
7,
224
9,76
7
7,
258
Pro
ceed
s fro
m sa
le o
f cap
ital a
sset
s-
-
-
-
-
5,
150
-
59
6,66
5
14
6,02
4
-
Issu
ance
of c
apita
l lea
se-
-
-
-
-
-
-
477,
996
1,20
5,40
2
93,0
92
Ref
undi
ng n
otes
issu
ed-
-
-
-
-
-
-
-
4,
636,
000
24
,109
,000
P
aym
ent t
o re
fund
ed d
ebt e
scro
w a
gent
-
-
-
-
-
-
-
-
(4,5
60,0
00)
(25,
026,
670)
T
rans
fers
in2,
912,
335
6,37
0,83
7
6,
345,
401
5,97
7,13
6
5,
571,
045
5,44
0,89
3
5,
777,
177
6,
326,
611
6,
738,
627
6,
349,
853
T
rans
fers
out
(2,6
46,0
06)
(5,4
19,0
40)
(5
,301
,800
)
(4
,846
,797
)
(4,4
71,0
45)
(4
,294
,728
)
(4,3
91,3
42)
(4,9
40,7
76)
(5,1
38,6
27)
(4,7
49,8
53)
Tota
l oth
er fi
nanc
ing
sour
ces (
uses
)27
,170
,405
1,
097,
721
1,23
3,37
1
1,
170,
651
12,8
51,5
49
1,16
0,55
7
1,
438,
695
2,
467,
720
3,
037,
193
78
2,68
0
Net
cha
nge
in fu
nd b
alan
ces
25,9
30,6
06$
(11,
665,
526)
(1
5,32
0,57
6)(1
8,39
6)
8,72
4,22
7
(8
,922
,632
)
(4,1
95,1
75)
1,17
7,05
0
505,
888
1,19
9,89
5
Deb
t ser
vice
as a
per
cent
age
o
f non
-cap
ital e
xpen
ditu
res
5.70
%9.
62%
14.2
8%14
.46%
15.5
5%15
.36%
15.4
6%17
.58%
16.5
0%16
.90%
Sour
ces:
Info
rmat
ion
deriv
ed fr
om th
e co
mpr
ehen
sive
ann
ual f
inan
cial
repo
rt or
ann
ual f
inan
cial
repo
rts fo
r the
rele
vant
yea
r.
73
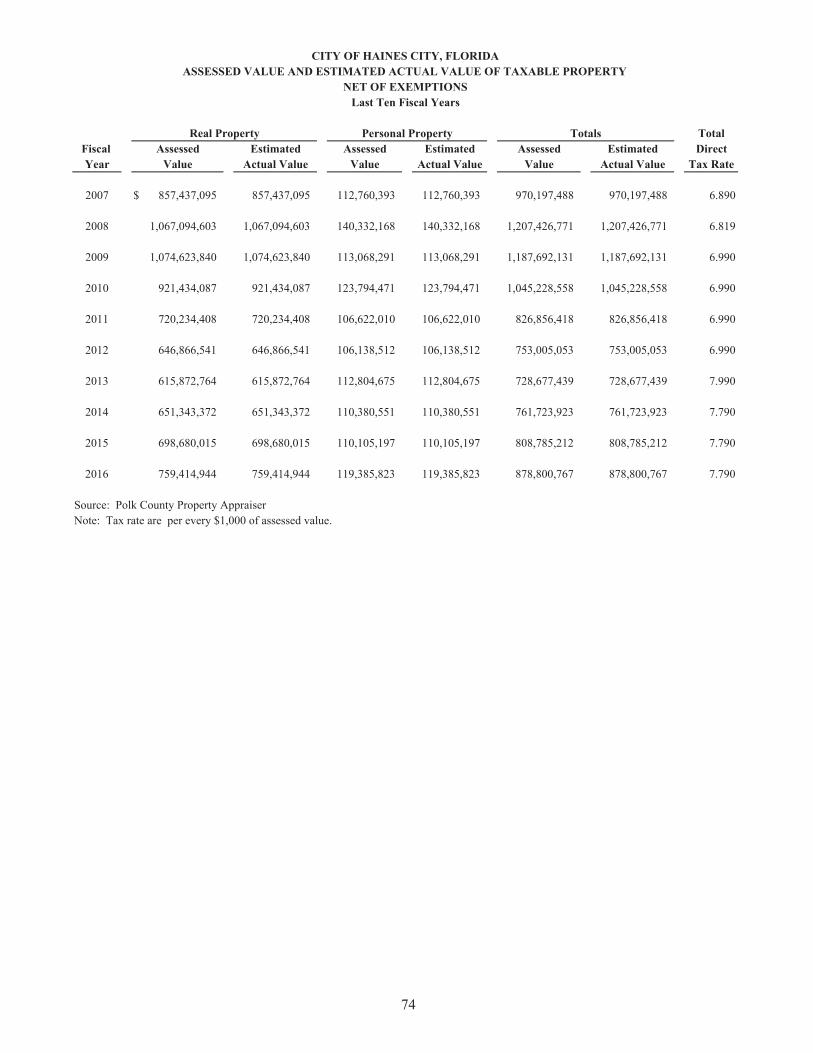
Real Property TotalFiscal Assessed Estimated Assessed Estimated Assessed Estimated DirectYear Value Actual Value Value Actual Value Value Actual Value Tax Rate
2007 $ 857,437,095 857,437,095 112,760,393 112,760,393 970,197,488 970,197,488 6.890
2008 1,067,094,603 1,067,094,603 140,332,168 140,332,168 1,207,426,771 1,207,426,771 6.819
2009 1,074,623,840 1,074,623,840 113,068,291 113,068,291 1,187,692,131 1,187,692,131 6.990
2010 921,434,087 921,434,087 123,794,471 123,794,471 1,045,228,558 1,045,228,558 6.990
2011 720,234,408 720,234,408 106,622,010 106,622,010 826,856,418 826,856,418 6.990
2012 646,866,541 646,866,541 106,138,512 106,138,512 753,005,053 753,005,053 6.990
2013 615,872,764 615,872,764 112,804,675 112,804,675 728,677,439 728,677,439 7.990
2014 651,343,372 651,343,372 110,380,551 110,380,551 761,723,923 761,723,923 7.790
2015 698,680,015 698,680,015 110,105,197 110,105,197 808,785,212 808,785,212 7.790
2016 759,414,944 759,414,944 119,385,823 119,385,823 878,800,767 878,800,767 7.790
Source: Polk County Property AppraiserNote: Tax rate are per every $1,000 of assessed value.
Personal Property Totals
CITY OF HAINES CITY, FLORIDAASSESSED VALUE AND ESTIMATED ACTUAL VALUE OF TAXABLE PROPERTY
NET OF EXEMPTIONSLast Ten Fiscal Years
74

SouthwestFlorida Polk Peace
GO Debt Total Water County RiverFiscal Operating Service Direct Polk Management School WaterYear Millage Millage Millage County District Board Basin Total
2007 6.890 0.000 6.890 8.333 0.422 7.770 0.195 23.610
2008 6.819 0.000 6.819 6.867 0.387 7.512 0.183 21.766
2009 6.990 0.000 6.990 6.867 0.387 7.586 0.183 22.013
2010 6.990 0.000 6.990 6.867 0.377 7.792 0.183 22.208
2011 6.990 0.000 6.990 6.867 0.377 7.792 0.183 22.208
2012 6.990 0.000 6.990 7.499 0.393 7.670 0.183 22.735
2013 7.990 0.000 7.990 6.867 0.393 7.492 0.000 22.742
2014 7.790 0.000 7.790 6.867 0.365 7.547 0.000 22.569
2015 7.790 0.000 7.790 6.782 0.349 7.208 0.000 22.129
2016 7.790 0.000 7.790 6.782 0.332 6.797 0.000 21.701
(a) Overlapping rates are those of local and county governments that apply to property ownerswithin the incorporated areas.
Source: Polk County Tax Collector
CITY OF HAINES CITY, FLORIDADIRECT AND OVERLAPPING PROPERTY TAX RATES
Last Ten Fiscal YearsMillage Rates ($1 per $1,000 Valuation)
City of Haines City Overlapping Rates (a)
75

Percent Percentof Total of Total
Taxable Taxable Taxable TaxableTaxpayer Value Value Rank Value Value Rank
Heart of Florida 39,182,433$ 4.5% 1 * * *Sofidel America Corp 33,837,532 3.9% 2 * * *Aldi Florida LLC 23,845,256 2.7% 3 * * *Duke Energy/Florida Power 21,703,886 2.5% 4 * * *Royal Palm Village LLC 10,148,498 1.2% 5 * * *WalMart 8,851,513 1.0% 6 * * *Verizon Florida 7,905,319 0.9% 7 * * *Oldcastle APG South 7,505,397 0.9% 8 * * *Lowes 7,110,178 0.8% 9 * * *Haines Mall LLC 6,894,476 0.8% 10 * * *
Total ten largest taxpayers 166,984,488 19.0% 0 0.0%
Other taxpayers 711,816,279 81.0%
Total per 2016 tax roll 878,800,767$ 100.0% 0 0.0%
*Data not availableSource : Polk County Property Appraiser
CITY OF HAINES CITYPRINCIPAL TAXPAYERS
Current Year and Nine Years Ago
Fiscal Year 2015/2016 Fiscal Year 2006/2007
76

Current Percent of Prior Years Percentage ofFiscal Total Tax Levy Tax Total Tax Total CollectionsYear Tax Levy (1) Collections Collected Collections Collections To Tax Levy
2007 6,684,661$ 6,470,906 96.80% 14,881 6,485,787 97.02%
2008 8,232,839 7,783,524 94.54% 139,007 7,922,531 96.23%
2009 8,301,968 8,052,643 97.00% 100,973 8,153,616 98.21%
2010 7,306,148 7,117,451 97.42% 70,945 7,188,396 98.39%
2011 5,779,726 5,598,844 96.87% 72,540 5,671,384 98.13%
2012 5,268,128 5,048,229 95.83% 63,901 5,112,130 97.04%
2013 5,822,133 5,600,105 96.19% 32,986 5,633,091 96.75%
2014 5,933,829 5,718,569 96.37% 36,919 5,755,488 96.99%
2015 6,300,431 6,082,038 96.53% 68,306 6,150,344 97.62%
2016 6,845,858 6,592,527 96.30% 34,170 6,626,697 96.80%
(1) Total assessed value times millage rate. Gross taxes before discountsSource: Polk County Tax Collector
CITY OF HAINES CITYPROPERTY TAX LEVIES AND COLLECTIONS
Last Ten Fiscal Years
77

Gov
ernm
enta
l Act
iviti
esU
tility
Sys
tem
Stat
e T
otal
Hai
nes C
ityPe
rcen
tage
Fi
scal
C
apita
l C
apita
l Pro
ject
sR
even
ue B
onds
/R
evol
ving
Cap
ital
Prim
ary
Pers
onal
of P
erso
nal
Per
Yea
rL
ease
sR
even
ue B
onds
Not
esL
oans
Lea
ses
Gov
ernm
ent
Inco
me
Inco
me
Cap
ita
2007
$75
7,35
6
36
,563
,186
1,
748,
767
6,
030,
184
63
,036
45
,162
,529
584,
515,
251
7.73
%2,
276
2008
660,
409
36,1
42,3
30
1,50
0,76
2
5,43
3,34
0
21,2
60
43,7
58,1
01
58
2,29
1,22
87.
51%
2,31
3
2009
587,
123
35,2
36,4
74
1,23
7,41
2
5,45
2,09
5
-
42
,513
,104
587,
512,
737
7.24
%2,
267
2010
316,
650
34,2
05,6
18
958,
687
5,82
6,17
8
-
41
,307
,133
668,
866,
020
6.18
%2,
012
2011
112,
402
44,8
77,7
52
-
7,
023,
004
-
52,0
13,1
58
66
8,09
4,09
67.
79%
2,51
7
2012
-
44
,103
,189
-
12,2
56,6
92
-
56,3
59,8
81
69
1,04
8,46
78.
16%
2,72
8
2013
-
42
,627
,605
5,
960,
000
9,
196,
289
-
57,7
83,8
94
71
9,54
1,09
58.
03%
2,70
2
2014
366,
089
41,0
84,2
85
5,35
3,00
0
8,78
9,51
0
-
55
,592
,884
735,
494,
305
7.56
%2,
600
2015
368,
717
40,7
44,8
59
4,34
9,00
0
10,0
87,0
21
-
55,5
49,5
97
72
4,35
1,96
87.
67%
2,50
4
2016
224,
816
39,6
02,5
40
3,32
9,00
0
13,3
77,1
04
-
56,5
33,4
60
78
4,12
7,19
67.
21%
2,43
1
Sour
ces:
Pop
ulat
ion
data
from
the
City
of H
aine
s City
Dep
artm
ent o
f Eco
nom
ic D
evel
opm
ent.
Pers
onal
inco
me
data
from
the
U.S
. Dep
artm
ent o
f Com
mer
ce.
Not
e: D
etai
ls re
gard
ing
the
City
's ou
tsta
ndin
g de
bt c
an b
e fo
und
in th
e no
tes t
o th
e fin
anci
al st
atem
ents
.D
ebt l
imita
tion:
The
re a
re n
o le
gal d
ebt l
imits
for F
lorid
a m
unic
ipal
ities
.
78
CIT
Y O
F H
AIN
ES
CIT
Y, F
LO
RID
AR
AT
IOS
OF
OU
TST
AN
DIN
G D
EB
T B
Y T
YPE
Las
t Ten
Fis
cal Y
ears
Bus
ines
s-ty
pe A
ctiv
ities
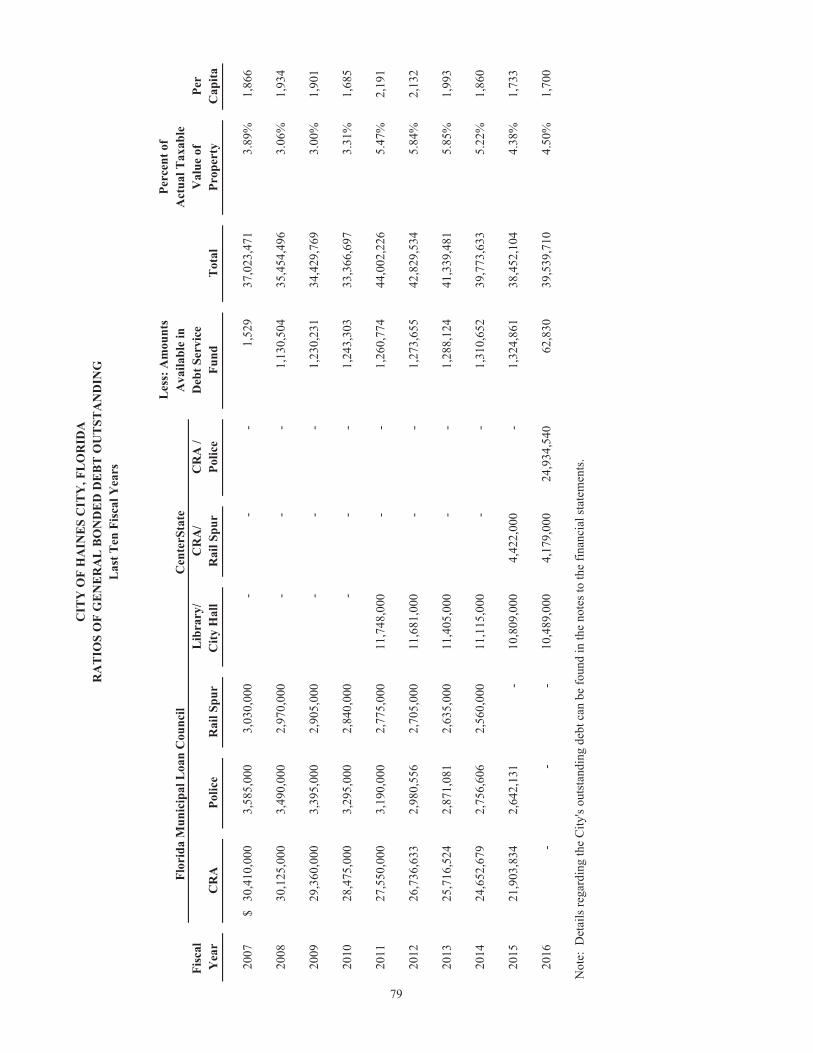
Les
s: A
mou
nts
Perc
ent o
fFl
orid
a M
unic
ipal
Loa
n C
ounc
ilC
ente
rSta
teA
vaila
ble
inA
ctua
l Tax
able
Fisc
al
Lib
rary
/C
RA
/C
RA
/D
ebt S
ervi
ceV
alue
of
Per
Yea
rC
RA
Polic
eR
ail S
pur
City
Hal
l R
ail S
pur
Polic
eFu
ndT
otal
Prop
erty
Cap
ita
2007
30,4
10,0
00$
3,
585,
000
3,
030,
000
-
-
-
1,52
9
37
,023
,471
3.
89%
1,86
6
2008
30,1
25,0
00
3,
490,
000
2,
970,
000
-
-
-
1,13
0,50
4
35
,454
,496
3.
06%
1,93
4
2009
29,3
60,0
00
3,
395,
000
2,
905,
000
-
-
-
1,23
0,23
1
34
,429
,769
3.
00%
1,90
1
2010
28,4
75,0
00
3,
295,
000
2,
840,
000
-
-
-
1,24
3,30
3
33
,366
,697
3.
31%
1,68
5
2011
27,5
50,0
00
3,
190,
000
2,
775,
000
11
,748
,000
-
-
1,
260,
774
44,0
02,2
26
5.47
%2,
191
2012
26,7
36,6
33
2,
980,
556
2,
705,
000
11
,681
,000
-
-
1,
273,
655
42,8
29,5
34
5.84
%2,
132
2013
25,7
16,5
24
2,
871,
081
2,
635,
000
11
,405
,000
-
-
1,
288,
124
41,3
39,4
81
5.85
%1,
993
2014
24,6
52,6
79
2,
756,
606
2,
560,
000
11
,115
,000
-
-
1,
310,
652
39,7
73,6
33
5.22
%1,
860
2015
21,9
03,8
34
2,
642,
131
-
10,8
09,0
00
4,
422,
000
-
1,
324,
861
38,4
52,1
04
4.38
%1,
733
2016
-
-
-
10
,489
,000
4,17
9,00
0
24,9
34,5
40
62,8
30
39
,539
,710
4.50
%1,
700
Not
e: D
etai
ls re
gard
ing
the
City
's ou
tsta
ndin
g de
bt c
an b
e fo
und
in th
e no
tes t
o th
e fin
anci
al st
atem
ents
.
CIT
Y O
F H
AIN
ES
CIT
Y, F
LO
RID
AR
AT
IOS
OF
GE
NE
RA
L B
ON
DE
D D
EB
T O
UT
STA
ND
ING
Las
t Ten
Fis
cal Y
ears
79

Total Percentage AmountBonded Debt Applicable to Applicable to
Jurisdiction Outstanding City of Haines City City of Haines City
District School Board of Polk County 254,794,532$ 3.26% (1) 8,297,468$
Total overlapping debt 8,297,468
Total direct debt 39,827,356 100.0% 39,827,356
Total direct and overlapping debt 48,124,824$
(1) The percentage of overlapping debt applicable is estimated using taxable assessed property values. Applicable percentages were estimated by dividing the City's taxable assessed values by the County's total taxable assessed values.
Source: Polk County School Board
CITY OF HAINES CITY, FLORIDA
DIRECT AND OVERLAPPING GOVERNMENTAL ACTIVITIES DEBTGeneral Obligation Bonds
September 30, 2016
80

CITY OF HAINES CITY, FLORIDALEGAL DEBT MARGIN INFORMATION
September 30, 2016
The constitution of the State of Florida, Florida Statute 200.181 and the City of Haines City, Florida, set no legal debt limit.
81

Less Net AvailableFiscal Gross Operating For Debt Year Revenues (1) Expenses (2) Service Principal Interest Coverage
2007 6,592,401$ 3,809,716 2,782,685 235,000 121,536 7.80
2008 7,195,273 4,118,344 3,076,929 250,000 105,950 8.64
2009 6,930,688 4,542,408 2,388,280 265,000 89,213 6.74
2010 7,287,830 4,585,174 2,702,656 280,000 71,500 7.69
2011 7,897,736 4,598,332 3,299,404 960,000 64,209 3.22
2012 8,359,524 5,373,126 2,986,398 - - -
2013 8,595,968 4,756,751 3,839,217 - - -
2014 8,701,975 4,598,428 4,103,547 607,000 90,815 5.88
2015 8,807,681 4,645,953 4,161,728 1,007,000 76,131 3.84
2016 9,994,381 4,071,219 5,923,162 1,020,000 61,215 5.48
2007 6,592,401 4,166,252 2,426,149 588,743 172,682 3.19
2008 7,195,273 4,474,294 2,720,979 596,845 156,754 3.61
2009 6,930,688 4,896,621 2,034,067 613,218 140,380 2.70
2010 7,287,830 4,936,674 2,351,156 630,053 123,545 3.12
2011 7,897,736 5,622,541 2,275,195 657,475 112,029 2.96
2012 8,359,524 5,373,126 2,986,398 918,559 203,785 2.66
2013 8,595,968 4,756,751 3,839,217 873,206 (3) 279,786 3.33
2014 8,701,975 5,296,243 3,405,732 406,778 207,021 5.55
2015 8,807,681 5,729,084 3,078,597 416,092 193,892 5.05
2016 9,994,381 5,152,434 4,841,947 425,619 188,180 7.89
(1) Gross revenues from water and sewer charges for services, plus interest income and service charges.(2) Total operating expenses exclusive of depreciation, sewer impact fees, amortization of intangibles
and non-reoccurring costs. State Revolving Fund Loans operating expenses include the annual debt service for revenue bonds.
(3) This amount does not include $2,292,898 of funds from the issuance of the 2013 Revenue Notes used to payoff SRF note. See Note 7.3 within financial statements. Change in long-term debt does includethis amount as a principal reduction.
Note: Details regarding the City's outstanding debt can be found in the notes to the financial statements.Source: City of Haines City Finance Department.
State Revolving Fund Loans
CITY OF HAINES CITY, FLORIDAPLEDGED REVENUE COVERAGE
Last Ten Fiscal Years
Debt Service Requirements
Water and Sewer Revenue Bonds
82

Polk CountyPer Capita Public Personal Personal School Unemployment
Year Population (1) Income (2) Income (2) Enrollment (3) Rate (4)
2007 19,843 29,457$ 584,515,251 7,394 5.2%
2008 18,916 30,783 582,291,228 7,468 8.7%
2009 18,753 31,329 587,512,737 7,673 12.8%
2010 20,535 32,572 668,866,020 7,701 13.3%
2011 20,661 32,336 668,094,096 7,653 10.7%
2012 20,661 33,447 691,048,467 7,846 8.6%
2013 21,385 33,647 719,541,095 8,449 7.2%
2014 21,385 34,393 735,494,305 8,533 6.6%
2015 22,184 32,652 724,351,968 6,881 5.9%
2016 23,252 33,723 784,127,196 6,227 5.9%
Sources: (1) City of Haines City Community Development Department .(2) U.S. Department of Commerce, Bureau of Economic Analysis, Regional Economic Information System The actual per capita personal income is for Lakeland/Winter Haven MSA. The per capita figures are multiplied by population to determine the total personal income.(3) Polk County School Board.(4) U.S. Department of Labor Bureau labor Statistics Data, Polk County, Florida.
CITY OF HAINES CITY, FLORIDADEMOGRAPHIC AND ECONOMIC STATISTICS
Last Ten Fiscal Years
83
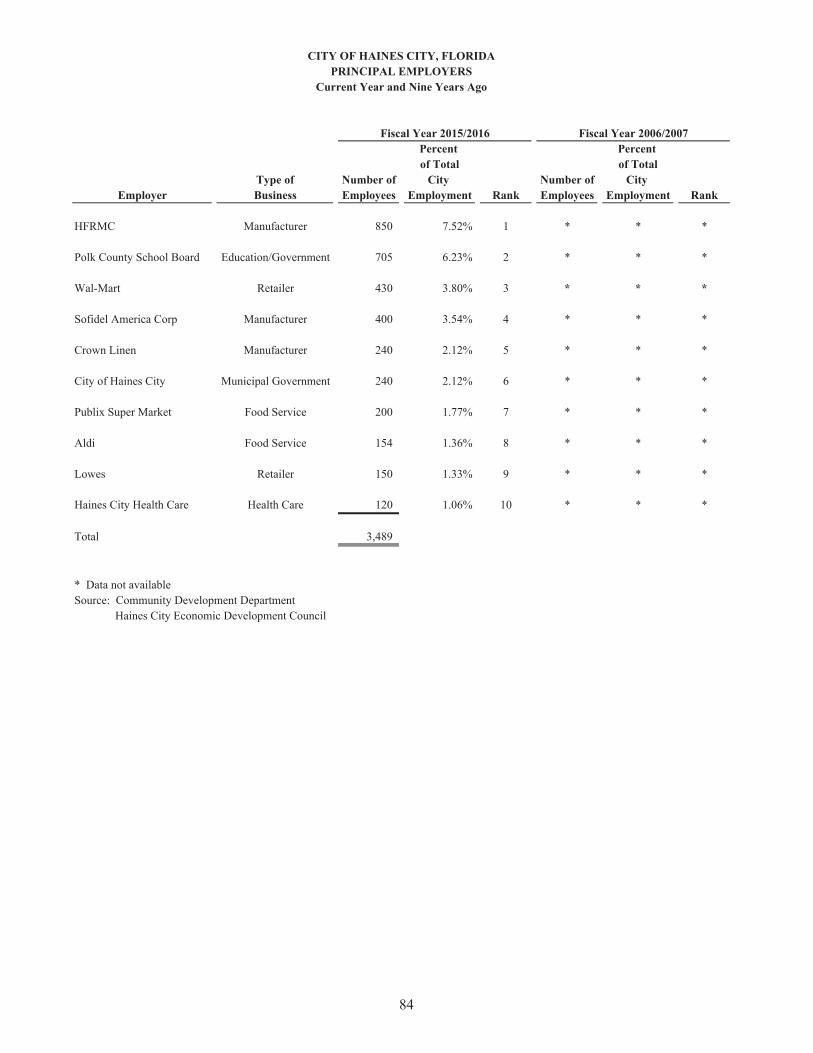
Percent Percent of Total of Total
Type of Number of City Number of City Employer Business Employees Employment Rank Employees Employment Rank
HFRMC Manufacturer 850 7.52% 1 * * *
Polk County School Board Education/Government 705 6.23% 2 * * *
Wal-Mart Retailer 430 3.80% 3 * * *
Sofidel America Corp Manufacturer 400 3.54% 4 * * *
Crown Linen Manufacturer 240 2.12% 5 * * *
City of Haines City Municipal Government 240 2.12% 6 * * *
Publix Super Market Food Service 200 1.77% 7 * * *
Aldi Food Service 154 1.36% 8 * * *
Lowes Retailer 150 1.33% 9 * * *
Haines City Health Care Health Care 120 1.06% 10 * * *
Total 3,489
* Data not availableSource: Community Development Department Haines City Economic Development Council
CITY OF HAINES CITY, FLORIDAPRINCIPAL EMPLOYERS
Current Year and Nine Years Ago
Fiscal Year 2015/2016 Fiscal Year 2006/2007
84

Fisc
al Y
ear
2007
2008
2009
2010
2011
2012
2013
2014
2015
2016
Gen
eral
gov
ernm
ent
C
ity M
anag
er5
54
44
43
33
3
City
Cle
rk2
22
22
21.
52
22
F
inan
ce7.
56.
56.
56.
55.
55.
53.
32.
83.
84.
7
Hum
an R
esou
rces
22
22
22
22
33
In
form
atio
n Te
chno
logy
22.
54
4
Com
mun
ity D
evel
opm
ent
2021
1917
1616
1312
810
F
acili
ties M
aint
enan
ce1
11
66
67
56
9.4
Publ
ic sa
fety
P
olic
e76
7474
7676
7676
6463
.662
.7
Fire
3131
3131
3131
3132
31.4
31.3
Publ
ic w
orks
18.5
1717
12.5
12.5
12.5
108.
89.
2515
.5
Util
ities
3942
.542
.546
4646
46.7
45.9
544
.95
39.1
Park
s and
rec
reat
ion
3135
4742
4240
3433
3235
Lib
rary
77
66
56
98
88
Tot
al24
024
425
225
124
824
723
922
121
922
8
Sour
ce:
City
of H
aine
s City
Ann
ual B
udge
t
CIT
Y O
F H
AIN
ES
CIT
Y, F
LO
RID
AFU
LL
-TIM
E E
QU
IVA
LE
NT
CIT
Y G
OV
ER
NM
EN
T E
MPL
OY
EE
S B
Y F
UN
CT
ION
/PR
OG
RA
ML
ast T
en F
isca
l Yea
rs
85

Fisc
al Y
ear
2007
2008
2009
2010
2011
2012
2013
2014
2015
2016
Bui
ldin
g in
spec
tion
B
uild
ing
perm
its is
sued
1,37
4
1,
052
767
78
8
810
86
5
935
1,
235
1,10
1
1,
364
N
umbe
r of b
uild
ing
insp
ectio
ns c
ompl
eted
6,87
4
3,
678
2,63
9
2,
297
2,38
3
3,
531
3,56
7
5,
129
4,55
4
5,
365
N
umbe
r of r
e-in
spec
tions
**
**
**
**
**
N
umbe
r of t
otal
bui
ldin
g co
nstru
ctio
n pl
ans r
evie
wed
*38
7
308
29
8
322
30
0
323
36
8
498
66
7
Law
enf
orce
men
t
Phy
sica
l arr
ests
1,22
1
1,
154
1,09
3
1,
504
1,52
7
1,
768
1,35
5
1,
435
1,05
8
77
9
D
UI a
rres
ts95
54
63
66
62
58
59
77
17
22
Tra
ffic
vio
latio
ns3,
548
2,62
0
2,
987
5,09
0
4,
974
4,94
3
3,
825
4,01
1
2,
428
2,95
9
Red
ligh
t cam
era
viol
atio
ns*
**
*25
,189
21,4
54
20
,427
22,3
57
11
,428
18,4
70
Tra
ffic
cra
shes
672
68
5
712
81
6
536
61
6
610
71
9
814
1,
315
C
alls
for s
ervi
ce14
,702
14,9
06
13
,541
19,6
32
16
,265
20,9
74
23
,571
22,7
41
21
,241
17,4
24
Fire
E
mer
genc
y re
spon
ses
2,24
2
2,
572
2,42
4
2,
096
2,12
7
2,
212
2,68
4
2,
711
2,83
8
3,
705
N
umbe
r of a
ctua
l fire
s sup
pres
sed
24
27
33
26
70
93
106
23
20
10
5
N
umbe
r of b
uild
ing
insp
ectio
ns25
9
699
72
0
669
37
0
370
49
2
448
60
307
Num
ber o
f sch
ool i
nspe
ctio
ns8
8
8
9
12
12
12
12
2
1
Num
ber o
f re-
insp
ectio
n*
*72
2
1,26
0
65
2
1,15
0
65
5
995
50
98
Num
ber o
f pla
ns re
view
ed*
*46
67
11
5
54
62
69
70
53
Publ
ic w
orks
S
treet
resu
rfac
ing
(mile
s)*
**
**
**
*3
1
Oth
er st
reet
repa
irs*
**
**
**
**
*
Pav
ed st
reet
s (m
iles)
**
**
**
**
84
84
U
npav
ed st
reet
s (m
iles)
**
**
**
**
6
6
* D
ata
not a
vaila
ble
Sour
ce: V
ario
us C
ity d
epar
tmen
ts
86
CIT
Y O
F H
AIN
ES
CIT
YO
PER
AT
ING
IND
ICA
TO
RS
BY
FU
NC
TIO
N/P
RO
GR
AM
Las
t Ten
Fis
cal Y
ears

Fisc
al Y
ear
2007
2008
2009
2010
2011
2012
2013
2014
2015
2016
Tra
nspo
rtat
ion
M
iles o
f stre
ets
**
**
**
**
**
Publ
ic sa
fety
N
umbe
r of f
ire st
atio
ns1
1
1
1
1
1
1
1
1
1
Num
ber o
f fire
fight
ers a
nd o
ffic
ers
30
30
30
30
30
30
30
32
30
30
N
umbe
r of p
olic
e st
atio
ns1
1
1
1
1
1
1
1
1
1
Num
ber o
f sw
orn
offic
ers
50
51
51
51
53
53
53
53
53
53
Mun
icip
al w
ater
syst
em
Num
ber o
f cus
tom
ers
8,12
1
8,09
7
7,73
3
7,89
1
8,16
7
9,31
4
9,53
2
9,71
4
9,87
1
9,49
3
A
vera
ge d
aily
con
sum
ptio
n3.
99M
GD
3.99
MG
D3.
99M
GD
3.99
MG
D3.
99M
GD
3.99
MG
D3.
99M
GD
3.99
MG
D4.
39M
GD
4.51
MG
D
Pla
nt c
apac
ity, a
ll pl
ants
5.72
MG
D5.
72M
GD
5.72
MG
D5.
72M
GD
5.72
MG
D9.
0MG
D9.
0MG
D9.
0MG
D9.
0MG
D9.
0MG
D
Dee
p w
ells
7
7
7
7
7
7
7
7
7
7
N
umbe
r of f
ire h
ydra
nts
700
700
700
700
700
700
700
700
710
718
Mun
icip
al se
wer
syst
em
Num
ber o
f cus
tom
ers
6,75
5
6,81
3
6,56
6
6,56
6
6,89
9
7,43
2
7,46
3
7,46
7
7,36
3
7,28
6
T
reat
men
t fac
ility
cap
acity
2.97
MG
D2.
97M
GD
2.97
MG
D2.
97M
GD
2.97
MG
D2.
97M
GD
2.97
MG
D2.
97M
GD
2.97
MG
D2.
97M
GD
A
nnua
l ave
rage
flow
1.65
MG
D1.
65M
GD
1.65
MG
D1.
65M
GD
1.65
MG
D1.
65M
GD
1.65
MG
D1.
65M
GD
1.65
MG
D1.
50M
GD
Mun
icip
al st
orm
wat
er sy
stem
N
umbe
r of c
usto
mer
s7,
535
7,
541
7,
205
7,
332
7,
426
7,
426
7,
426
7,
426
7,
910
7,
910
Bui
ldin
g pe
rmits
issu
ed71
4
54
4
76
7
78
8
81
0
86
5
93
5
1,
235
1,
101
1,
364
Rec
reat
ion
and
cultu
re
Num
ber o
f nei
ghbo
rhoo
d pa
rks
3
4
4
4
4
4
4
4
4
4
P
ark
area
, num
ber o
f acr
es39
39
39
39
39
39
39
39
39
39
Num
ber o
f boo
ks52
,607
58,0
00
61
,854
62,5
10
60
,521
61,5
25
61
,500
61,5
00
61
,500
62
,099
* D
ata
not a
vaila
ble
Sour
ce:
Var
ious
City
dep
artm
ents
87
CIT
Y O
F H
AIN
ES
CIT
Y, F
LO
RID
AC
API
TA
L A
SSE
T S
TA
TIS
TIC
S B
Y F
UN
CT
ION
/PR
OG
RA
ML
ast T
en F
isca
l Yea
rs


COMPLIANCE SECTION
This section contains the following subsections:
Independent Auditor’s report on Internal Control over Financial Reporting and on Compliance and Other Matters Based on an Audit of Financial Statements Performed in Accordance with Government Auditing StandardsIndependent Auditor’s Report on Compliance for each Major Federal Program and State Project and on Internal Control over Compliance Required by the Uniform Guidance Schedule of Expenditures of Federal Awards and State Financial Assistance ProjectsSchedule of Findings and Questioned Costs Independent Auditor's Management Letter Independent Auditor’s Report – Investment Compliance


1401 MANATEE AVE WEST, SUITE 1200 • BRADENTON, FLORIDA 34205-7440 • 941-747-4483 • 855-891-0070 • FAX 941-747-6035 MEMBERS OF THE AMERICAN INSTITUTE OF CERTIFIED PUBLIC ACCOUNTANTS • www.mjcpa.com
INDEPENDENT AUDITOR’S REPORT ON INTERNAL CONTROL OVER FINANCIAL REPORTING AND ON COMPLIANCE AND OTHER MATTERS BASED
ON AN AUDIT OF FINANCIAL STATEMENTS PERFORMED IN ACCORDANCE WITH GOVERNMENT AUDITING STANDARDS
To the Honorable Mayor, Members of the City Council City of Haines City, Florida
We have audited, in accordance with the auditing standards generally accepted in the United States of America and the standards applicable to financial audits contained in Government Auditing Standardsissued by the Comptroller General of the United States, the financial statements of the governmental activities, the business-type activities, each major fund, and the aggregate remaining fund information of the City of Haines City, Florida (the “City”), as of and for the year ended September 30, 2016, and the related notes to the financial statements, which collectively comprise the City’s basic financial statements and have issued our report thereon dated April 25, 2017.
Internal Control Over Financial Reporting
In planning and performing our audit of the financial statements, we considered the City’s internal control over financial reporting (internal control) to determine the audit procedures that are appropriate in the circumstances for the purpose of expressing our opinions on the financial statements, but not for the purpose of expressing an opinion on the effectiveness of the City’s internal control. Accordingly, we do not express an opinion on the effectiveness of the City’s internal control.
A deficiency in internal control exists when the design or operation of a control does not allow management or employees, in the normal course of performing their assigned functions, to prevent, or detect and correct, misstatements on a timely basis. A material weakness is a deficiency, or a combination of deficiencies, in internal control such that there is a reasonable possibility that a material misstatement of the entity’s financial statements will not be prevented, or detected and corrected on a timely basis. A significant deficiency is a deficiency, or a combination of deficiencies, in internal control that is less severe than a material weakness, yet important enough to merit attention by those charged with governance.
Our consideration of internal control was for the limited purpose described in the first paragraph of this section and was not designed to identify all deficiencies in internal control that might be material weaknesses or, significant deficiencies. Given these limitations, during our audit we did not identify any deficiencies in internal control that we consider to be material weaknesses. However, material weaknesses may exist that have not been identified.

89
Compliance and Other Matters
As part of obtaining reasonable assurance about whether the City’s financial statements are free of material misstatement, we performed tests of its compliance with certain provisions of laws, regulations, contracts, and grant agreements, noncompliance with which could have a direct and material effect on the determination of financial statement amounts. However, providing an opinion on compliance with those provisions was not an objective of our audit, and accordingly, we do not express such an opinion. Theresults of our tests disclosed no instances of noncompliance or other matters that are required to be reported under Government Auditing Standards.
Purpose of this Report
The purpose of this report is solely to describe the scope of our testing of internal control and compliance and the results of that testing, and not to provide an opinion on the effectiveness of the entity’s internal control or on compliance. This report is an integral part of an audit performed in accordance with Government Auditing Standards in considering the entity’s internal control and compliance. Accordingly, this communication is not suitable for any other purpose.
Bradenton, Florida April 25, 2017

1401 MANATEE AVENUE WEST, SUITE 1200 • BRADENTON, FLORIDA 34205 • 941-747-4483 • FAX 941-747-6035 • www.mjcpa.com MEMBERS OF THE AMERICAN INSTITUTE OF CERTIFIED PUBLIC ACCOUNTANTS
INDEPENDENT AUDITOR’S REPORT ON COMPLIANCE FOR EACH MAJOR FEDERAL PROGRAM AND STATE PROJECT AND ON INTERNAL CONTROL OVER
COMPLIANCE REQUIRED BY THE UNIFORM GUIDANCE
To the Honorable Mayor, Members of the City Council City of Haines City, Florida
Report on Compliance for Each Major Federal Program and State Project
We have audited the City of Haines City, Florida’s (the “City”) compliance with the types of compliance requirements described in the OMB Compliance Supplement and the requirements described in the Department of Financial Services’ State Projects Compliance Supplement, that could have a direct and material effect on each of the City’s major federal programs, state projects and its passenger facility charges for the year ended September 30, 2016. The City's major federal programs and state financial assistance projects are identified in the summary of auditor’s results section of the accompanying schedule of findings and questioned costs.
Management’s Responsibility
Management is responsible for compliance with federal and state statutes, regulations, and the terms and conditions of its federal and state awards applicable to its federal programs and state projects.
Auditor’s Responsibility
Our responsibility is to express an opinion on compliance for each of the City’s major federal programs and state projects based on our audit of the types of compliance requirements referred to above. We conducted our audit of compliance in accordance with auditing standards generally accepted in the United States of America; the standards applicable to financial audits contained in Government Auditing Standards, issued by the Comptroller General of the United States; Title 2 U.S. Code of Federal Regulations Part 200, Uniform Administrative Requirements, Cost Principles, and Audit Requirements for Federal Awards (Uniform Guidance); and Chapter 10.550, Rules of the Auditor General. Those standards, the Uniform Guidance and Chapter 10.550 require that we plan and perform the audit to obtain reasonable assurance about whether noncompliance with the types of compliance requirements referred to above that could have a direct and material effect on a major federal program and state project occurred. An audit includes examining, on a test basis, evidence about the City's compliance with those requirements and performing such other procedures as we considered necessary in the circumstances.
We believe that our audit provides a reasonable basis for our opinion on compliance for each major federal program and state project. However, our audit does not provide a legal determination of the City's compliance.
Opinion on Each Major Federal Program and State Project
In our opinion, the City complied, in all material respects, with the types of compliance requirements referred to above that could have a direct and material effect on each of its major federal programs and state projects for the year ended September 30, 2016.

91
Report on Internal Control Over Compliance
Management of the City is responsible for establishing and maintaining effective internal control over compliance with the types of compliance requirements referred to above. In planning and performing our audit of compliance, we considered the City’s internal control over compliance with the types of requirements that could have a direct and material effect on each major federal program and state project to determine the auditing procedures that are appropriate in the circumstances for the purpose of expressing our opinion on compliance for each major federal program and state project and to test and report on internal control over compliance in accordance with the Uniform Guidance and Chapter 10.550, Rules of the Auditor General, but not for the purpose of expressing an opinion on the effectiveness of internal control over compliance. Accordingly, we do not express an opinion on the effectiveness of the City’s internal control over compliance.
A deficiency in internal control over compliance exists when the design or operation of a control over compliance does not allow management or employees, in the normal course of performing their assigned functions, to prevent, or detect and correct, noncompliance with a type of compliance requirement of a federal program or state project on a timely basis. A material weakness in internal control over compliance is a deficiency, or combination of deficiencies, in internal control over compliance, such that there is a reasonable possibility that material noncompliance with a type of compliance requirement of a federal program or state project will not be prevented, or detected and corrected, on a timely basis. A significant deficiency in internal control over compliance is a deficiency, or a combination of deficiencies, in internal control over compliance with a type of compliance requirement of a federal program or state project that is less severe than a material weakness in internal control over compliance, yet important enough to merit attention by those charged with governance.
Our consideration of internal control over compliance was for the limited purpose described in the first paragraph of this section and was not designed to identify all deficiencies in internal control over compliance that might be material weaknesses or significant deficiencies. We did not identify any deficiencies in internal control over compliance that we consider to be material weaknesses. However, material weaknesses may exist that have not been identified.
The purpose of this report on internal control over compliance is solely to describe the scope of our testing of internal control over compliance and the results of that testing based on the requirements of the Uniform Guidance and Chapter 10.550, Rules of the Auditor General. Accordingly, this report is not suitable for any other purpose.
Bradenton, Florida April 25, 2017

Pass ThroughFederal Grantors/Pass Through CFDA Grantor's/Lender's
Grantor/Program Title Number Number Expenditures
Federal Financial AssistanceU.S. Enviromental Protection Agency
Passed through the Florida Department of Environmental Protection
Drinking Water State Revolving FundWater Treatment Construction 66.468 DW530450 2,439,045$
Total U.S. Environmental Protection Agency 2,439,045
U.S. Department of Justice Passed through the Florida Department of Law Enforcement Patrol Equipment Initiative 16.738 2016-JAGC-POLK-17-H3-105 10,301 Identification Maker 16.738 2016-JAGD-POLK-4-H4-067 4,525 Total U.S. Department of Justice 14,826
Total Expenditures of Federal Awards 2,453,871$
State Financial AssistanceState of Florida, Department of State Passed through Polk County, Florida Board of County Commissioners Library Cooperative Grant 45.018 N/A 191,014$
State of Florida, Department of Environmental Protection Clean Water State Revolving Fund Design and Construction 37.077 WW530440 3,567,270
Total Expenditures of State financial assistance 3,758,284$
NOTE 3. Non-Cash Awards - The City did not receive non-cash federal awards during the year ended September 30, 2016.
NOTE 4. Subrecipents - There were no awards passed through to subrecipientsduring the year ended September 30, 2016.
NOTE 2. De Minimis Indirect Cost Rate - The City chose not to use the ten percent de minimus cost rate for the year endedSeptember 30, 2016.
CITY OF HAINES CITY, FLORIDASCHEDULE OF EXPENDITURES OF FEDERAL AWARDS AND
FOR FISCAL YEAR ENDED SEPTEMBER 30, 2016STATE FINANCIAL ASSISTANCE PROJECTS
NOTE 1. Basis of Presentation - The above schedule of expenditures of federal awards includes the federal grant activity of theCity of Haines City, Florida (the "City"), and is presented on the modified accrual basis of accounting. The information in thisschedule is presented in accordance with the requirements of Title 2 U.S. Code of Federal Regulations (CFR) Part 200, UniformAdministrative Requirements, Cost Principles, and Audit Requirements for Federal Awards. Therefore, some amounts presentedin the schedule may differ from amounts presented in, or used in the preparation of, the basic financial statements.
92

93
CITY OF HAINES CITY, FLORIDA SCHEDULE OF FINDINGS AND QUESTIONED COSTS
FOR THE YEAR ENDED SEPTEMBER 30, 2016
SECTION I SUMMARY OF AUDIT RESULTS
Financial Statements Type of auditor’s report issued Unmodified
Internal control over financial reporting: Material weaknesses identified? ____ yes X no
Significant deficiencies identified not considered to be material weaknesses? ____ yes X none reported
Noncompliance material to financial statements noted? ____ yes X no
Federal Programs and State Financial Assistance Projects Internal Control over major federal or state programs: Material weaknesses identified? ____ yes X no
Significant deficiencies identified not considered to be material weaknesses? ____ yes X none reported
Type of auditor’s report issued on compliance for major Federal programs and state financial assistance projects: Unmodified
Any audit findings disclosed that are required to be reported in accordance with the Uniform Guidance? yes X no
Identification of major federal program:
CFDA Number Name of Federal Program or Cluster 66.468 U.S. Environmental Protection Agency– Capitalization
Grants for Drinking Water
Identification of major state financial assistance projects:
CFDA Number Name of State Project or Cluster 37.077 Wastewater Treatment Facility Construction
Dollar threshold used to distinguish between Type A and Type B programs: $750,000
Auditee qualified as low-risk auditee? yes X no

94
SECTION II FINANCIAL STATEMENT FINDINGS AND RESPONSES
None reported
SECTION III STATE FINANCIAL ASSISTANCE PROJECT
FINDINGS AND QUESTIONED COSTS
None reported.
SECTION IV SUMMARY SCHEDULE OF PRIOR AUDIT FINDINGS
None reported.


1401 MANATEE AVE WEST, SUITE 1200 • BRADENTON, FLORIDA 34205-7440 • 941-747-4483 • 855-891-0070 • FAX 941-747-6035 MEMBERS OF THE AMERICAN INSTITUTE OF CERTIFIED PUBLIC ACCOUNTANTS • www.mjcpa.com
INDEPENDENT AUDITOR'S MANAGEMENT LETTER
The Honorable Mayor, Members of the City Council City of Haines City, Florida
Report on the Financial Statements We have audited the financial statements of the City of Haines City, Florida (the "City"), as of and for the fiscal year ended September 30, 2016, and have issued our report thereon dated April 25, 2017.
Auditor’s Responsibility We conducted our audit in accordance with auditing standards generally accepted in the United States of America; the standards applicable to financial audits contained in Government Auditing Standards, issuedby the Comptroller General of the United States; the audit requirements of Title 2 U.S. Code of Federal Regulations Part 200, Uniform Administrative Requirements, Cost Principles, and Audit Requirements of Federal Awards (Uniform Guidance); and Chapter 10.550, Rules of the Auditor General.
Other Reports and Schedule We have issued our Independent Auditor’s Report on Internal Control over Financial Reporting and On Compliance and Other Matters Based on an Audit of Financial Statements Performed in Accordance with Government Auditing Standards, Independent Auditor’s Report on Compliance for Each Major Federal Program and State Project and on Internal Control over Compliance Required by the Uniform Guidance; Schedule of Findings and Questioned Costs, and Independent Accountant’s Report on an examination conducted in accordance with AICPA Professional Standards, Section 601, regarding compliance requirements in accordance with Chapter 10.550, Rules of the Auditor General. Disclosures in those reports, which are dated April 25, 2017, should be considered in conjunction with this management letter.
Prior Audit FindingsSection 10.554(1)(i)1., Rules of the Auditor General, requires that we determine whether or not corrective actions have been taken to address findings and recommendations made in the preceding annual financial audit report. There were no findings or recommendations requiring correction in the prior year.
Official Title and Legal Authority Section 10.554(1)(i)4., Rules of the Auditor General, requires that the name or official title and legal authority for the primary government and each component unit of the reporting entity be disclosed in this management letter, unless disclosed in the notes to the financial statements. The City of Haines City, Florida was incorporated in 1914. Additional information on the City’s creation and the City’s component unit is disclosed within the City’s footnotes.

96
Financial Condition Section 10.554(1)(i)5.a. and 10.556(7), Rules of the Auditor General, require that we apply appropriate procedures and report the results of our determination as to whether or not the City has met one or more of the conditions described in Section 218.503(1), Florida Statutes, and identification of the specific condition(s) met. In connection with our audit, we determined that the City did not meet any of the conditions described in Section 218.503(1), Florida Statutes.
Pursuant to Sections 10.554(1)(i)5.c. and 10.556(8), Rules of the Auditor General, we applied financial condition assessment procedures. It is management’s responsibility to monitor the City’s financial condition, and our financial condition assessment was based in part on representations made by management and the review of financial information provided by same.
Annual Financial Report Section 10.554(1)(i)5.b. and 10.556(7), Rules of the Auditor General, require that we apply appropriate procedures and report the results of our determination as to whether the annual financial report for the City for the fiscal year ended September 30, 2016, filed with the Florida Department of Financial Services pursuant to Section 218.32(1)(a), Florida Statutes, is in agreement with the annual financial audit report for the fiscal year ended September 30, 2016. In connection with our audit, we determined that these two reports were in agreement.
Special District Component Units Section 10.554(1)(i)5.d, Rules of the Auditor General, requires that we determine whether or not a special district that is a component unit of a county, municipality, or special district, provided the financial information necessary for proper reporting of the component unit, within the audited financial statements of the county, municipality, or special district in accordance with Section 218.39(3)(b), Florida Statutes. In connection with our audit, we determined that all special district component units provided the necessary information for proper reporting in accordance with Section 218.39(3)(b), Florida Statutes.
Other Matters Section 10.554(1)(i)2., Rules of the Auditor General, requires that we address in the management letter any recommendations to improve financial management. In connection with our audit, we did not have any such recommendations.
Section 10.554(1)(i)3., Rules of the Auditor General, requires that we address noncompliance with provisions of contracts or grant agreements, or abuse, that have occurred, or are likely to have occurred, that have an effect on the financial statements that is less than material but which warrants the attention of those charged with governance. In connection with our audit, we did not have any such findings.
Purpose of this Letter Our management letter is intended solely for the information and use of the Legislative Auditing Committee, members of the Florida Senate and the Florida House of Representatives, the Florida Auditor General, Federal and other granting agencies, the Mayor and Members of the City Council, and applicable management, and is not intended to be and should not be used by anyone other than these specified parties.
Bradenton, Florida April 25, 2017

1401 MANATEE AVE WEST, SUITE 1200 • BRADENTON, FLORIDA 34205-7440 • 941-747-4483 • 855-891-0070 • FAX 941-747-6035 MEMBERS OF THE AMERICAN INSTITUTE OF CERTIFIED PUBLIC ACCOUNTANTS • www.mjcpa.com
INDEPENDENT AUDITOR’S REPORT
The Honorable Mayor, Members of the City Council City of Haines City, Florida
We have examined the City of Haines City, Florida’s (the “City”) compliance with Section 218.415, Florida Statutes, regarding the investment of public funds during the year ended September 30, 2016. Management is responsible for the City’s compliance with those requirements. Our responsibility is to express an opinion on the City’s compliance based on our examination.
Our examination was conducted in accordance with attestation standards established by the American Institute of Certified Public Accountants and, accordingly, included examining, on a test basis, evidence about the City’s compliance with those requirements and performing such other procedures as we considered necessary in the circumstances. We believe that our examination provides a reasonable basis for our opinion. Our examination does not provide a legal determination on the City’s compliance with specified requirements.
In our opinion, the City complied, in all material respects, with the aforementioned requirements for the year ended September 30, 2016.
This report is intended solely for the information and use of the City and the Auditor General, State of Florida, and is not intended to be and should not be used by anyone other than these specified parties.
Bradenton, Florida April 25, 2017