Steven A. Brigance 2712 Market Trace Fort Smith, Arkansas (479) 783-7070 [email protected].

1
City of Fort Smith, Arkansas
Comprehensive Annual Financial Report
Year Ended December 31, 2018
Prepared By the
City of Fort Smith, Arkansas Finance Department
City Board of Directors
Sandy Sanders, Mayor
Keith Lau Andre’ Good Mike Lorenz
George Catsavis Tracy Pennartz
Kevin Settle Don Hutchings
City Administrator Carl Geffken

2
City of Fort Smith, Arkansas Year Ended December 31, 2018
Contents
Introductory Section
Letter of Transmittal ........................................................................................................................... 8
GFOA Certificate of Achievement for Excellence in Financial Reporting ...................................... 14
Organizational Structure ................................................................................................................... 15
List of Elected and Appointed Officials ........................................................................................... 16
Financial Section
Independent Auditor’s Report ........................................................................................ 19 Management’s Discussion and Analysis ..................................................................... 23 Basic Financial Statements
Governmental-Wide Financial Statements:
Statement of Net Position ....................................................................................................... 34
Statement of Activities ........................................................................................................... 36
Fund Financial Statements:
Governmental Funds:
Balance Sheet ...................................................................................................................... 38
Reconciliation of the Balance Sheet of Governmental Funds to the Statement of Net Position ................................................................................................ 39
Statement of Revenues, Expenditures and Changes in Fund Balances ............................... 40
Reconciliation of the Statement of Revenues, Expenditures and Changes in Fund Balances of Governmental Funds to the Statement of Activities ...................... 42
Proprietary Funds:
Statement of Fund Net Position .......................................................................................... 44
Statement of Revenues, Expenses and Changes in Fund Net Position ............................... 46
Statement of Cash Flows ..................................................................................................... 48
Fiduciary Funds:
Statement of Fiduciary Net Position ................................................................................... 50
Statement of Changes in Fiduciary Net Position ................................................................ 51
Notes to Financial Statements ..................................................................................................... 52

3
City of Fort Smith, Arkansas Year Ended December 31, 2018
Contents (Continued)
Required Supplementary Information
Agent Multiple-Employer Plans
Schedule of the City’s Net Pension Liability and Related Ratios – FRPF (the Old Fire Plan) .................................................................................................. 130
Schedule of the City’s Pension Contributions – FRPF (the Old Fire Plan) .......................... 131
Schedule of the City’s Net Pension Liability and Related Ratios – PRPF (the Old Police Plan) .............................................................................................. 132
Schedule of the City’s Pension Contributions – PRPF (the Old Police Plan) ...................... 133
Cost-Sharing Plans
Schedule of the City’s Proportionate Share of the Net Pension Liability – LOPFI (the New Plans) .................................................................................................... 134
Schedule of City’s Contributions – LOPFI (the New Plans) ................................................ 135
Schedule of the City’s Proportionate Share of the Net Pension Liability – APERS ............ 136
Schedule of City’s Contributions – APERS ......................................................................... 137
Fort Smith Public Library - APERS ..................................................................................... 138
Other Postemployment Benefit (OPEB) Plan
Schedule of Changes in the City’s Net OPEB Liability and Related Ratios – OPEB Plan .................................................................................................................. 139
Schedule of City Contributions – OPEB Plan ..................................................................... 140
Schedule of Investment Returns – OPEB Plan .................................................................... 141
Schedule of Revenues, Expenditures and Changes in Fund Balances – Budget and Actual – General Fund ....................................................................................... 142
Schedule of Revenues, Expenditures and Changes in Fund Balances – Budget and Actual – Street Maintenance Fund ..................................................................... 143
Notes to Required Supplementary Information ......................................................................... 144
Combining and Individual Fund Financial Statements and Schedules
Nonmajor Governmental Funds:
Combining Balance Sheet .................................................................................................... 147
Combining Statement of Revenues, Expenditures and Changes in Fund Balances ............. 148

4
City of Fort Smith, Arkansas Year Ended December 31, 2018
Contents (Continued)
Internal Service Funds:
Combining Statement of Net Position .................................................................................. 150
Combining Statement of Revenues, Expenses and Changes in Fund Net Position .............. 151
Combining Statement of Cash Flows ................................................................................... 152
Discretely Presented Component Units:
Governmental Activities:
Combining Statement of Net Position ............................................................................ .154
Combining Statement of Activities ................................................................................. 155
Balance Sheet – Advertising and Promotion ................................................................... 156
Statement of Revenues, Expenditures and Changes in Fund Balance – Advertising and Promotion .......................................................................................... 157
Business Type Activities:
Combining Statement of Net Position .................................................................................. 158
Combining Statement of Activities ...................................................................................... 159
Combining Statement of Cash Flows ................................................................................... 160
Statistical Section (Unaudited)
Net Position by Component – Table 1 ...................................................................................... 165
Changes in Net Position – Table 2 ............................................................................................ 166
Changes in Fund Balances of Governmental Funds – Table 3 ................................................. 168
Fund Balances of Governmental Funds – Table 4 .................................................................... 169
General Fund Revenues, Expenditures and Fund Balance – Table 5 ........................................ 170
General Governmental Taxes by Source – Table 6 ................................................................... 171
Local Sales and Use Tax Collections – Table 7 ........................................................................ 172
Property Tax Levies and Collections – Table 8 ........................................................................ 173
Assessed and Estimated Actual Value of Taxable Property – Table 9 ..................................... 174
Property Tax Rates and Tax Levies – All Direct and Overlapping Governments – Table 10 ................................................................................................................................. 175
Principal Taxpayers – Table 11 ................................................................................................. 176
Computation of Direct and Estimated Overlapping Debt – Table 12 ....................................... 177
Computation of Legal Debt Margin – Table 13 ........................................................................ 178

5
City of Fort Smith, Arkansas Year Ended December 31, 2018
Contents (Continued)
Ratios of Outstanding Debt by Type – Table 14 ....................................................................... 179
Revenue Bonds Debt Service Coverage – Table 15 .................................................................. 180
Demographic Statistics – Table 16 ............................................................................................ 181
Principal Employers – Table 17 ................................................................................................ 182
Full-time Equivalent City Government Employees by Function – Table 18 ............................ 183
Capital Asset Statistics by Function – Table 19 ........................................................................ 184
Operating Indicators by Function – Table 20 ............................................................................ 185
Solid Waste System Statistics – Table 21 ................................................................................. 186
Water and Sewer Statistics – Table 22 ...................................................................................... 188

6
(This Page Intentionally Left Blank)

7
INTRODUCTORY
SECTION

June 15, 2020
To the Honorable Mayor, Members of the Board of Directors, and Citizens of the City of Fort Smith, Arkansas:
Arkansas law allows cities to choose to publish a complete set of financial statements presented in conformity with accounting principles generally accepted in the United States of America ( GAAP) and audited in accordance with generally accepted auditing standards by a firm of licensed certified public accountants. The City has exercised this option. Accordingly, we hereby issue the comprehensive annual financial report (CAFR) of the City of Fort Smith for the fiscal year ended December 31, 2018.
This report consists of management's representations concerning the finances of the City. Consequently, management assumes full responsibility for the completeness and reliability of all information presented in this report. To provide a reasonable basis for making these representations, City management has established a comprehensive internal control framework that is designed both to protect the City's assets from lqss, theft, or misuse and to compile sufficient reliable information for the preparation of the City's financial statements in conformity with GAAP. Because the cost of controls should not outweigh their benefits, the City's comprehensive framework of internal controls has been designed to provide reasonable rather than absolute assurance that the financial statements will be free from material misstatement. As management, we assert that, to the best of our knowledge and belief, this financial report is complete and reliable in all material aspects.
The City's financial statements have been audited by BKD, LLP, a firm of licensed certified public accountants. The goal of the independent audit was to provide reasonable assurance that the City's financial statements for the fiscal year ended December 31, 2018 are free of material misstatement. The independent audit involved examining, on a test basis, evidence supporting the amounts and disclosures in the financial statements; assessing the accounting principles used and significant estimates made by management; and evaluating the overall financial statement presentation. BKD, LLP concluded, based upon the audit, that there was a reasonable basis for rendering unmodified ("clean") opinions on the financial statements of the governmental activities, business-type activities, aggregate discretely presented component units, each major fund and aggregate remaining fund information that collectively comprise the City's basic financial statements as of and for the fiscal year ended December 31, 2018. The independent auditor's report is presented as the first component of the financial section of this report.
623 Garrison Avenue P.O. Box l 908
Fort Smith, Arkansas 72902 (479) 785-2801
www.fortsmithar.gov
Printed on I 00% Recycled Paper
8

The independent audit of the City's financial statements was part of a broader, federally mandated "Single Audit" designed to meet the special needs of federal grantor agencies. The standards governing Single Audit engagements require the independent auditor to report not only on the fair presentation of the financial statements, but also on the internal controls and compliance with legal requirements, with special emphasis on internal controls and legal requirements involving the administration of federal awards. These reports have been issued separately.
GAAP require that management provide a narrative introduction, overview, and analysis to accompany the basic financial statements in the form of Management's Discussion and Analysis (MD&A). This letter of transmittal is designed to complement the MD&A and should be read in conjunction with it. The City's MD&A can be found immediately following the independent auditor's report in the financial section of this document.
Profile of the City
Fort Smith is located in western Arkansas on the border of Oklahoma and is the second largest city in the state. The City was incorporated in 1842 and is the county seat for Sebastian County. Fort Smith is 159 miles west of Little Rock and 145 miles southeast of Tulsa, Oklahoma. The City serves as the central focus for a six-county economic and trade region in the west central area of Arkansas and the east central area of Oklahoma. The City encompasses 68 square miles and has a population of approximately 88,000. The City is empowered by state statutes to levy real and personal property taxes within its limits and extend the corporate limit by annexation, which occurs periodically when deemed appropriate by the Board of Directors. State statutes also allow the City to levy local sales and use taxes.
Since 1967, the City has operated as a City Administrator form of government. The Mayor and the Board of Directors are elected to staggered, four-year terms. The Mayor and three directors are elected at large and the remaining four directors are elected in representative wards of the City. The Board of Directors is charged with setting policy and enacting laws for the City. The City Administrator is appointed by the Board of Directors and serves as the chief executive officer for the City.
The City provides a full range of services including public safety, construction and maintenance of streets and other infrastructure, parks and recreational activities, water and sewer services, solid waste collection and disposal, public transportation, and administrative services. The City also reports the financial activity for the Advertising and Promotion Commission, the Fort Smith Public Library, the Fort Smith Parking Authority, and the Fort Smith Airport Commission. These four entities are included in the financial statements as discretely presented component units. Additional information on these component units may be found in Note 1 in the notes to the financial statements.
The Board of Directors adopts an annual budget that serves as the City's financial planning document. Control over spending and allocation of resources are a main focus of the budget. The annual budget process begins in June of each year and is usually adopted each December.
9

Appropriation requests by fund, division and department are submitted to the City Administrator and the Director of Finance. Resources are allocated based upon priorities established by the Board of Directors. The legal level of budgetary control is the departmental level. For example, the Police Department is reported as a Public Safety ( division) expenditure in the General Fund budget to actual statement located in the required supplementary information in the financial section of this report. The City Administrator is authorized to transfer appropriated amounts within individual funds. However, additional appropriations during the year require approval by the Board of Directors.
Factors Affecting Financial Condition
The information presented in the financial statements may be better understood when considered from a broader perspective of the environment within which Fort Smith's municipal government operates.
Local Economy. Total sales tax revenue in 2018 increased 1.6% in 2018 over 2017. This was compared to a 0.4% increase in 2017 over 2016.
The City has seen significant industrial and residential development. Several major companies have longstanding and growing interests in the region, including OK Foods, Kraft-Planters, ABB Motors and Mechanical Inc., Umarex USA, Phoenix Metals, Mars Petcare, Rheem Manufacturing, ArcBest, PRADCO Outdoor Brands, Graphic Packaging, Owens Coming, Nestle, FFO Home and Georgia-Pacific Dixie Products.
Glatfelter, a Pennsylvania based company completed plans to tum the vacant Mitsubishi plant into a state-of-the-art production facility for air-laid paper products. Glatfelter opened their new $90 million manufacturing operation. The company began production and commercial shipments in first quarter 2018.
Silgan Plastic Food Containers broke ground on the approximately 100,000 plus square foot facility which will create 150 new jobs to the area. Silgan will invest approximately $38 million on this project.
The Arkansas Colleges of Health Education (ACHE) opened its first college at Chaffee Crossing in Fort Smith in Fall 2017. The Arkansas College of Osteopathic Medicine (ARCOM) anticipates graduating 150 Doctors of Osteopathic Medicine (DO) annually beginning in May 2021. ACHE's second building, the College of Health Sciences, a $25 million, 66,000 square foot facility was completed in January 2020 and will be the home for future programs: School of Physical Therapy (PT), School of Occupational Therapy (OT), and Physician Assistant Studies (PA). Currently, construction is underway on a $11 million development on 6.6 acres for residential and retail buildings.
10

The Arkansas Air National Guard 188th Fighter Wing learned in 2013 that it would receive a new mission and convert from the manned A-10 aircraft to a remotely piloted aircraft, targeting and intelligence unit. The 188th is the only organization in the world with RP A, intelligence and targeting at a combined facility. This change preserves the 1,000 full and part-time jobs associated with the 188th with a mission that is sustainable for the long term as part of the modem Air Force. Razorback Operation Center broke ground on the $14.2 million facility in February 2018 with an expected finish in 2020.
Downtown Fort Smith is experiencing a revitalization. The plan is to create sustainable downtown growth through increased residential and commercial spaces, walkability, and more entertainment and cultural amenities. The Arkansas Department of Transportation and the City approved a joint project for the complete rehabilitation of all of Towson Avenue and a public/private partnership was formed with the guidance of the area Metropolitan Planning Organization to work on a streetscape project in conjunction with the rehabilitation. A downtown truck and traffic study was also completed that examined the flow of personal and commercial vehicles in order to examine ways to improve walkability while maintain access for commercial vehicles. Several other streetscape projects and private investments in office, residential, and commercial redevelopment, is representative of the successful resurgence of the downtown area. Additionally, the Unexpected Arts Festival, Riverfront Jazz Festival, Steel Horse Rally and Peacemaker Music Festivals are all encouraging signs of growth and interest in the downtown area.
The Fort Smith Regional Chamber of Commerce continues its work to extoll the virtues of Fort Smith as the fourth lowest cost location in the United States for business. The top 10 employers have approximately 17,000 employees with OK Foods being the number one employer in Fort Smith with over 3,100 employees. The top 10 employers are a healthy mix of private sector companies, healthcare organizations, the University of Arkansas-Fort Smith, the Fort Smith Public School District, and the City of Fort Smith. The Chamber is a regional economic development organization which includes areas of western Arkansas and eastern Oklahoma up to 30 miles from the City. The regional approach enhances relationships with the two states' economic development agencies, and offers prospects more choices for potential locations.
Long-Term Financial Planning. In 1985, the City began collecting a one-percent (1 %) local sales and use tax to fund its neighborhood and major street improvements. This sales tax is authorized through 2025.
The City also levies an additional one-percent (1 %) local sales and use tax which is pledged to redeem bonds issued for large construction projects as well as provide operating resources for the fire and parks departments. The current 2012 Sales and Use Tax Bonds fund an aquatics park in conjunction with Sebastian County that opened in May 2015; a new fire station, existing station upgrades and improvements, and apparatus additions and replacements; wastewater improvements; and water improvements. The 2014 Sales and Use Tax Bonds fund additional water and wastewater improvements. This has proven to be a very effective way to fund projects and the City saves on interest charges because Arkansas sales tax bond issues have mandatory redemption requirements. Three-fourths of the existing 1 % local sales tax supports the redemption of the 2012 and 2014 bonds. The remaining one-fourth percent of the tax assessment is used to provide operating and capital costs for the fire department and the parks department.
11

The City's comprehensive plan includes development and planning in and around Fort Smith. Local developers of planned residential areas outside the City limits continue to request City services. This may provide for future annexation that would increase the City's tax base. The comprehensive plan was updated at the end of 2017. Annual updates to the implementation of the Comprehensive Plan are provided to the Implementation Committee each year.
In January 2015, the City entered into a 12-year consent decree with the Department of Justice regarding dry and wet weather sanitary system overflows requiring sewer rehabilitation and improvements. In May 2015, the Board of Directors approved multi-year sewer rate increases to provide funding for some of the required projects and upgrades to the sewer system. The cumulative rate increase was 167%. Beginning in September 2016, the City began the process to request a modification to the consent decree. The request was initially denied in November 2019. However, in May 2020, the City was granted an additional five-years, with conditions, to complete the consent decree per section nine of the consent decree.
Other Information
Awards. The Government Finance Officers Association (GFOA) awarded a Certificate of Achievement for Excellence in Financial Reporting to the City for its comprehensive annual financial report (CAFR) for the fiscal year ended December 31, 2017. The Certificate of Achievement is the highest form of recognition for excellence in local government financial reporting. This was the thirty-third consecutive year that the City has received this prestigious award. In order to be awarded a Certificate of Achievement, the City published an easily readable and efficiently organized CAFR. This report satisfied both GAAP and applicable legal requirements.
A Certificate of Achievement is valid for one year only.
Acknowledgements. The preparation of the CAFR was made possible by the dedicated service of the entire staff of the Finance Department. Special recognition is made to Lori Hopkins -Finance Manager and Tracy Keck - Accounting Manager for their efforts. Each member of the department has our sincere appreciation for the contributions made in the preparation of this report.
We also acknowledge the thorough and professional manner in which the annual audit was conducted and assistance with the CAFR production by BKD, LLP.
12

In closing, we acknowledge the contributions of the Mayor, Board of Directors, Tracey Shockley, Internal Auditor, and the Audit Advisory Committee members who have consistently supported the City's goal of excellence in all aspects of financial management. Their encouragement and support is greatly appreciated.
Respectfully submitted,
Carl Geffken City Administrator
13

14

15

16
City of Fort Smith, Arkansas List of Elected and Appointed Officials
December 31, 2018 Elected Officials Mayor Sandy Sanders Director-Ward 1 Keith Lau Director-Ward 2 Andre’ Good Director-Ward 3 Mike Lorenz Director-Ward 4 George Catsavis Director at Large Tracy Pennartz Director at Large/Vice Mayor Kevin Settle Director at Large Don Hutchings District Court Judge Ben Beland District Court Judge Claire Borengasser District Court Judge David Saxon Appointed Officials City Administrator Carl Geffken Deputy City Administrator Jeff Dingman Advertising and Promotion Claude Legris Airport Michael Griffin City Clerk Sherri Gard Development/Planning Wally Bailey District Court Rachel Sims Engineering Stan Snodgrass Finance Jennifer Walker Fire Phil Christensen, Fire Chief Boyd Waters, Assistant Fire Chief Human Resources Rick Lolley Information and Technology Russell Gibson Internal Audit Tracey Shockley Library Jennifer Goodson Parks and Recreation Doug Reinert Police Nathanial Clark Sanitation Kyle Foreman Streets and Traffic Control George Allen Transit Ken Savage Utilities Jerry Walters

17
FINANCIAL SECTION

18
(This Page Intentionally Left Blank)

19
Independent Auditor’s Report The Honorable Mayor and Board of Directors City of Fort Smith, Arkansas Fort Smith, Arkansas We have audited the accompanying financial statements of the governmental activities, the business-type activities, the aggregate discretely presented component units, each major fund and the aggregate remaining fund information of the City of Fort Smith, Arkansas as of and for the year ended December 31, 2018, and the related notes to the financial statements, which collectively comprise the City’s basic financial statements as listed in the table of contents.
Management’s Responsibility for the Financial Statements
Management is responsible for the preparation and fair presentation of these financial statements in accordance with accounting principles generally accepted in the United States of America; this includes the design, implementation and maintenance of internal control relevant to the preparation and fair presentation of financial statements that are free from material misstatement, whether due to fraud or error.
Auditor’s Responsibility
Our responsibility is to express opinions on these financial statements based on our audit. We did not audit the financial statements of the Fort Smith Public Library, which represent 85%, 66% and 79% of the assets, net position and revenues, respectively, of the aggregate discretely presented governmental activities component units. Those statements were audited by another auditor, whose report has been furnished to us, and our opinion, insofar as it relates to the amounts included for the Fort Smith Public Library, is based solely on the report of the other auditor. We conducted our audit in accordance with auditing standards generally accepted in the United States of America. Those standards require that we plan and perform the audit to obtain reasonable assurance about whether the financial statements are free from material misstatement.

20
The Honorable Mayor and Board of Directors City of Fort Smith, Arkansas Page 2 An audit involves performing procedures to obtain audit evidence about the amounts and disclosures in the financial statements. The procedures selected depend on the auditor's judgment, including the assessment of the risks of material misstatement of the financial statements, whether due to fraud or error. In making those risk assessments, the auditor considers internal control relevant to the entity's preparation and fair presentation of the financial statements in order to design audit procedures that are appropriate in the circumstances, but not for the purpose of expressing an opinion on the effectiveness of the entity's internal control. Accordingly, we express no such opinion. An audit also includes evaluating the appropriateness of accounting policies used and the reasonableness of significant accounting estimates made by management, as well as evaluating the overall presentation of the financial statements. We believe that the audit evidence we have obtained is sufficient and appropriate to provide a basis for our audit opinions.
Opinions
In our opinion, based on our audit and the report of the other auditor, the financial statements referred to above present fairly, in all material respects, the respective financial position of the governmental activities, the business-type activities, the aggregate discretely presented component units, each major fund and the aggregate remaining fund information of the City of Fort Smith, Arkansas as of December 31, 2018, and the respective changes in financial position, and, where applicable, cash flows thereof for the year then ended in accordance with accounting principles generally accepted in the United States of America.
Emphasis of Matter
Change in Accounting Principle
As discussed in Note 1 to the financial statements, in 2018 the City implemented the provisions of Governmental Accounting Standards Board Statement No. 75, Accounting and Financial Reporting for Postemployment Benefits Other Than Pensions. Our opinions are not modified with respect to this matter.

21
The Honorable Mayor and Board of Directors City of Fort Smith, Arkansas Page 3
Other Matters
Required Supplementary Information
Accounting principles generally accepted in the United States of America require that the management’s discussion and analysis, budgetary comparison, pension and other postemployment benefit information as listed in the table of contents be presented to supplement the basic financial statements. Such information, although not part of the basic financial statements, is required by the Governmental Accounting Standards Board, who considers it to be an essential part of financial reporting for placing the basic financial statements in an appropriate operational, economic or historical context. We have applied certain limited procedures to the required supplementary information in accordance with auditing standards generally accepted in the United States of America, which consisted of inquiries of management about the methods of preparing the information and comparing the information for consistency with management’s responses to our inquiries, the basic financial statements and other knowledge we obtained during our audit of the basic financial statements. We do not express an opinion or provide any assurance on the information because the limited procedures do not provide us with sufficient evidence to express an opinion or provide any assurance.
Other Information
Our audit was conducted for the purpose of forming opinions on the financial statements that collectively comprise the City’s basic financial statements. The combining and individual fund statements, introductory section and statistical section listed in the table of contents are presented for purposes of additional analysis and are not a required part of the basic financial statements. The combining and individual fund statements listed as other information in the table of contents are the responsibility of management and was derived from and relates directly to the underlying accounting and other records used to prepare the basic financial statements. Such information has been subjected to the auditing procedures applied in the audit of the basic financial statements and certain additional procedures, including comparing and reconciling such information directly to the underlying accounting and other records used to prepare the basic financial statements or to the basic financial statements themselves, and other additional procedures in accordance with auditing standards generally accepted in the United States of America. In our opinion, the combining and individual fund statements are fairly stated in all material respects in relation to the basic financial statements as a whole. The introductory section and statistical section listed in the table of contents have not been subjected to the auditing procedures applied in the audit of the basic financial statements, and accordingly, we do not express an opinion or provide any assurance on it.
Fort Smith, Arkansas June 15, 2020

22
(This Page Intentionally Left Blank)

23
City of Fort Smith, Arkansas Management’s Discussion and Analysis
December 31, 2018
The following discussion and analysis of the City of Fort Smith’s financial performance provides a narrative overview and analysis of its financial activities for the year ended December 31, 2018. We encourage readers to consider the information presented here in conjunction with additional information we have furnished in our letter of transmittal, which can be found on pages 8-13 of this report.
Financial Highlights
Primary Government total assets and deferred outflow of resources exceeded total liabilities and deferred inflows of resources at the close of 2018 by $804.0 million (net position). Of this amount, $729.2 million was invested in capital assets, net of related debt; $67.5 million was restricted for debt service, police and fire retirement contributions, construction projects, and other purposes. The component of net position unrestricted and available for meeting the City’s emergency and unexpected obligations was $7.3 million. The City’s governmental activities have a deficit in unrestricted net position of $35.9 million. The City’s business-type activities have unrestricted net position of $43.2 million. The negative unrestricted net position of the governmental activities is due primarily to the $70.5 million balance in net pension liabilities at year-end.
The City’s total net position increased by $32.7 million in 2018. Net position of the governmental activities increased by $18.0 million in 2018 compared to a net increase of $18.7 million in 2017. The City’s net position of the business-type activities increased by $14.7 million in 2018 compared to a net increase of $3.8 million in 2017.
As of the close of 2018, the City’s governmental funds reported combined ending fund balances of $84.6 million, an increase of $8.3 million from the prior year. The restricted portion of the fund balances is $58.7 million. The remaining fund balances is classified as nonspendable of $1.0 million; assigned of $5.8 million; and unassigned of $19.2 million.
At the end of 2018, the unassigned fund balance for the General Fund was $19.5 million or 41.6% of total General Fund expenditures and transfers out. There was an increase of $3.4 million in total general fund balance between years.
The City’s total bonded indebtedness increased by $45.5 million during the current year. The City issued $130.7 million in Water and Sewer Refunding and Construction Revenue Bonds, Series 2018 which refunded $66.3 million of the remaining Water and Sewer Refunding and Construction Revenue Bonds, Series 2008. $5.3 million in Sales and Use Tax bonds were called during the year.
The City’s governmental component units reported net position of $1.1 million at December 31, 2018 which was a $31 thousand decrease from 2017.
The City’s business-type component units reported net position of $42.3 million at December 31, 2018 which was a $1.6 million increase from 2017.

24
Overview of the Financial Statements
This discussion and analysis is intended to serve as an introduction to the City’s basic financial statements which are comprised of three components: 1) government-wide financial statements, 2) fund financial statements, and 3) notes to the basic financial statements. This report also contains required and other supplementary information in addition to the basic financial statements.
Government-Wide Financial Statements. The government-wide financial statements are designed to provide readers with a broad overview of the City’s finances, in a manner similar to private-sector business.
The statement of net position presents information on all of the City’s assets and liabilities, with the difference between the two reported as net position. Over time, increases or decreases in net position may serve as a useful indicator of whether the financial position of the City is improving or deteriorating.
The statement of activities presents information showing how the City’s net position changed during the most recent fiscal year. All changes in net position are reported as soon as the underlying event giving rise to the change occurs, regardless of the timing of the cash flows. Thus, revenues and expenses reported in this statement for some items will only result in cash flows in future fiscal periods (e.g., uncollected taxes and earned but unused vacation leave).
Both of the government-wide financial statements distinguish functions of the City that are principally supported by taxes and intergovernmental revenues (governmental activities) from other functions that are intended to recover all or a significant portion of their costs through user fees or charges (business-type activities). The governmental activities of the City include general government, public safety, public works, community service, and debt service. The business-type activities of the City include the water and sewer system and the solid waste disposal system.
The government-wide financial statements include not only the City itself (known as the primary government), but also, the following legally separate entities for which the City is financially accountable:
Parking Authority
Fort Smith Public Library
Advertising and Promotion Commission
Airport Commission
Financial information for these component units are reported separately from the financial information presented for the primary government itself.
The government-wide financial statements can be found on pages 34-37 of this report.
Fund financial statements. A fund is a grouping of related accounts that is used to maintain control over resources that have been segregated for specific activities or objectives. The City, like other state and local governments, uses fund accounting to ensure and demonstrate compliance with finance-related legal requirements. All of the funds of the City can be divided into three categories: governmental funds, proprietary funds, and fiduciary funds.

25
Governmental funds. Governmental funds are used to account for essentially the same functions reported as governmental activities in the government-wide financial statements. However, unlike the government-wide financial statements, governmental fund financial statements focus on the near-term inflows and outflows of spendable resources, as well as on balances of spendable resources available at the end of the fiscal year. Such information may be useful in evaluating a government’s near-term financing requirements. Because the focus of governmental funds is narrower than that of the government-wide financial statements, it is useful to compare the information presented for governmental funds with similar information presented for governmental activities in the government-wide financial statements. By doing so, readers may better understand the long-term impact of the government’s near-term financing decisions. Both the governmental fund balance sheet and the governmental fund statement of revenues, expenditures, and changes in fund balances provide a reconciliation to facilitate this comparison between governmental funds and governmental activities.
The City maintains 12 individual governmental funds. Information is presented separately in the governmental fund balance sheet and in the governmental fund statement of revenues, expenditures, and changes in fund balances for the General Fund, Street Maintenance Fund, Sales Tax Fund, LOPFI Contribution Fund, and the Sales and Use Tax Bond Fund that are considered to be major funds. Data from the other seven (7) governmental funds are combined into a single, aggregated presentation. Individual fund data for each of these nonmajor governmental funds is provided in the form of combining statements elsewhere in this report.
The basic governmental fund financial statements can be found on pages 38-42 of this report.
Proprietary funds. The City maintains two different types of proprietary funds. Enterprise Funds are used to report the same functions presented as business-type activities in the government-wide financial statements. The City uses Enterprise Funds to account for its water and sewer system and its solid waste system. Internal Service Funds are an accounting device used to accumulate and allocate costs internally among the City’s various functions for fuel and duplicating services, medical, dental and life insurance benefits, and workers’ compensation claims. The services provided by the internal service funds predominantly benefit the governmental rather than the business-type functions. They have been allocated between the governmental activities and the business type activities in the government-wide financial statements. Proprietary funds provide the same type of information as the government-wide financial statements, only in more detail.
The proprietary fund financial statements provide separate information for the Water and Sewer Fund and the Sanitation Fund, both of which are considered to be major funds of the City. The Working Capital, Employee Insurance and Workers’ Compensation Funds are the City’s internal service funds and are reported in a single aggregated presentation.
The basic proprietary fund financial statements can be found on pages 44-49 of this report.
Fiduciary fund. The City maintains a fiduciary fund for its OPEB plan trust that is held for the purpose of providing future medical claims of retirees that become participants. The plan trust is an irrevocable trust entered into by the City during 2009 for benefit of its participants.
The fiduciary fund financial statements can be found on pages 50-51 of this report.
Notes to the basic financial statements. The notes provide additional information that is essential to a full understanding of the data provided in the government-wide and fund financial statements. The notes to the basic financial statements can be found on pages 52-128 of this report.

26
Required Supplementary Information. In addition to the basic financial statements and accompanying notes, this report also presents certain required supplementary information concerning the City’s General Fund budget, the City’s Street Maintenance Fund budget and pension and other postemployment benefit information as listed in the table of contents. The City adopts an annual appropriation budget for its General Fund and its Street Maintenance Fund. Budgetary comparison schedules have been provided for the General Fund and the Street Maintenance Fund to demonstrate compliance with the annual budgets. Required supplementary information can be found on pages 129-144 of this report.
Other Information. The combining statements referred to earlier in connection with nonmajor governmental funds and internal service funds are presented immediately following the required supplementary information. Combining statements and schedules can be found on pages 145-161 of this report.
Government-Wide Financial Analysis
The 2017 financial statements were not restated for 2018 adoption of GASB 75, Accounting and Financial Reporting for Postemployment Benefits Other Than Pensions. Additional information for the effect of the adoption of GASB 75 can be found in Note 1 on page 52 of this report.
2018 2017 2018 2017 2018 2017
Current and other assets 107,594,106$ 100,051,378$ 158,137,579$ 82,248,021$ 265,731,685$ 182,299,399$
Capital assets 413,816,878 411,719,716 564,055,005 550,163,010 977,871,883 961,882,726
Total assets 521,410,984 511,771,094 722,192,584 632,411,031 1,243,603,568 1,144,182,125
Total deferred outflows of resources 14,984,297 13,490,239 2,733,027 2,856,546 17,717,324 16,346,785
Long-term liabilities 147,772,516 166,537,967 257,654,864 190,504,042 405,427,380 357,042,009
Other liabilities 14,708,221 16,811,388 17,421,263 16,797,225 32,129,484 33,608,613
Total liabilities 162,480,737 183,349,355 275,076,127 207,301,267 437,556,864 390,650,622
Total deferred inflows of resources 13,434,761 2,051,411 6,332,929 124,621 19,767,690 2,176,032
Net position:
Net investment in capital assets 337,638,439 326,142,910 391,608,271 385,564,986 729,246,710 711,707,896
Restricted 58,722,663 42,226,867 8,736,608 23,581,225 67,459,271 65,808,092
Unrestricted (35,881,319) (28,509,210) 43,171,676 18,695,478 7,290,357 (9,813,732)
Total net position 360,479,783$ 339,860,567$ 443,516,555$ 427,841,689$ 803,996,338$ 767,702,256$
City of Fort Smith
Net Position
Governmental Activities Business-Type Activities Total
As noted earlier, net position may serve over time as a useful indicator of a government’s financial position. The City’s assets and deferred outflow of resources exceeded liabilities and deferred inflows of resources by $804.0 million at the close of 2018.
The largest portion of the City’s net position $729.2 million or 90.7% reflects its investment in capital assets (e.g. land, buildings, improvements other than buildings, machinery and equipment, and infrastructure), plus unspent bond proceeds, less any related debt used to acquire those assets that is still outstanding. The City uses these capital assets to provide services to citizens; therefore, these assets are not available for future spending. Although the City’s investment in capital assets is reported net of related debt, it should be noted that the resources needed to repay debt must be provided from other sources, since capital assets themselves cannot be used to liquidate these liabilities.

27
An additional portion of the City’s net position (8.4%) represents resources that are subject to restrictions as to how they may be used. Of the total $67.5 million restricted net position, $24.9 million is restricted for bond retirement, $38.6 million is restricted for construction projects, $3.9 million is restricted for police and fire retirement contribution, and a very small amount is restricted for other purposes. The remaining balance of net position is $7.3 million.
The business-type activities reported a positive balance in unrestricted net position at the end of the current year, as was the case in the prior year. The governmental activities reported a negative balance in unrestricted net position primarily due to the net pension liabilities of $70.5 million.
The City’s net position increased by $32.7 million during 2018. The reasons for this overall increase are discussed in the following sections for governmental and business-type activities.
2018 2017 2018 2017 2018 2017
Revenues
Program revenues
Fees, fines, and charges
for services 5,844,498$ 5,572,301$ 74,670,767$ 69,659,743$ 80,515,265$ 75,232,044$
Operating grants
and contributions 13,983,299 13,072,923 - - 13,983,299 13,072,923
Capital grants
and contributions 2,962,846 3,343,621 - - 2,962,846 3,343,621
22,790,643 21,988,845 74,670,767 69,659,743 97,461,410 91,648,588
General revenues
Property taxes 12,929,340 12,674,326 - - 12,929,340 12,674,326
Sales taxes 60,050,705 59,100,140 - - 60,050,705 59,100,140
Utility franchise fees 6,840,478 6,304,008 - - 6,840,478 6,304,008
Unrestricted investment
earnings 1,220,764 317,642 1,219,925 401,542 2,440,689 719,184
Other 2,158,371 1,618,293 1,099,816 762,982 3,258,187 2,381,275
Total revenues 105,990,301 102,003,254 76,990,508 70,824,267 182,980,809 172,827,521
Expenses
General government 9,487,201 9,813,976 - - 9,487,201 9,813,976
Public safety 46,794,625 37,685,158 - - 46,794,625 37,685,158
Public works 16,116,687 16,485,834 - - 16,116,687 16,485,834
Community services 11,373,604 10,813,088 - - 11,373,604 10,813,088
Interest on long-term debt 2,991,999 4,528,084 - - 2,991,999 4,528,084
Water and sewer - - 51,098,433 56,118,173 51,098,433 56,118,173
Sanitation - - 12,462,283 14,930,172 12,462,283 14,930,172
Total expenses 86,764,116 79,326,140 63,560,716 71,048,345 150,324,832 150,374,485
Change in net position before transfers 19,226,185 22,677,114 13,429,792 (224,078) 32,655,977 22,453,036
Transfers (1,255,595) (3,995,559) 1,255,595 3,995,559 - -
Increase (decrease) in
net position 17,970,590 18,681,555 14,685,387 3,771,481 32,655,977 22,453,036
Net Position – beginning of year 339,860,567 321,179,012 427,841,689 433,218,071 767,702,256 754,397,083
Prior Period Adjustment - - - (9,147,863) - (9,147,863)
Restatement for Adoption of GASB 75 (Note 1 ) 2,648,626 - 989,479 - 3,638,105 -
Net Position - beginning of year, as Restated* 342,509,193 321,179,012 428,831,168 424,070,208 771,340,361 745,249,220
Net Position – end of year 360,479,783$ 339,860,567$ 443,516,555$ 427,841,689$ 803,996,338$ 767,702,256$
Governmental Activities Business-Type Activities Total
City of Fort Smith
Changes in Net Position
*The cumulative effect of applying GASB Statement No. 75, Accounting and Financial Reporting for Postemployment Benefits Other than Pensions resulted in the beginning net position for 2018 being restated.

28
Governmental Activities. During the current year, net position for governmental activities increased $17.1 million from the prior year for an ending balance of $370.8 million. The increase in the overall net position of governmental activities is the result of incremental increases in all revenues primarily due to the steady improvement in local economic conditions, despite a $9.7 million increase in expenses for public safety.
Total revenues increased $4.0 million to $106.0 million or 3.9%. Revenues from sales taxes increased $1.0 million to $60.1 million or 1.6%. The increase in the
City’s share of the county sales tax is accounted for in the General fund (1.9%). The City’s sales tax allocated for street projects and the sales tax allocated for the redemption of the Sales and Use Tax Bonds, Series 2012 and 2014 and fire and parks operations both increased 1.4% from 2017.
Unrestricted investment earnings increased $0.9 million from the prior year primarily due to improved interest rates on investments.
Operating grants and contributions increased $0.9 million or 7.0% to $14.0 million in 2018, primarily due to an increase in police and fire contributions during 2018.
Total expenses increased $7.4 million to $86.8 million or 9.4% from prior year. The increase in total expenses is primarily caused by an increase in pension expense for Arkansas Local Fire and Police (LOPFI) and an increase in the City’s other postemployment benefit expenses. This is offset by a decrease in interest on long-term debt of $1.5 million or 33.9%
Business-Type Activities. Net position for City’s business-type activities increased the by $14.7 million during the current year, reaching an ending balance of $443.5 million. Key elements of the increase are as follows:
The water and sewer system contributed $9.8 million to the increase in total net position. The operating income for the system totaled $13.8 million in 2018.
The solid waste system added $4.2 million to the increase in total net position. The operating income for the system in 2018 totaled $4.2 million.
Water and sewer system service charges contribute 77.5% of the operating revenue to business-type activities.
The solid waste system service charges accounted for 22.5% of the revenue to business-type activities.

29
Current year revenues for the business-type activities exceeded operating expenses by $18.0 million. This is due primarily to the increase in sewer rates. Water and Sewer and Sanitation operating expenses increased from 2017 by $0.7 million or 1.2% due to an increase in materials and supplies due to the increase in the capitalization threshold from $5 thousand to $20 thousand effective January 1, 2018, causing an increase in items expensed rather than capitalized.
Financial Analysis of the Government’s Funds
As noted earlier, the City uses fund accounting to ensure and demonstrate compliance with finance related requirements.
Governmental funds. The focus of the City’s governmental funds is to provide information on near-term inflows, outflows, and balances of spendable resources. Such information is useful in assessing the City’s financing requirements. In particular, unassigned fund balances may serve as a useful measure of a government’s net resources available for spending at the end of the fiscal year.
As of December 31, 2018, the City’s governmental funds reported combined ending fund balances of $84.6 million, an increase of $8.3 million in comparison with the prior year. Of this amount, $58.7 million represents restricted fund balance for construction projects, debt service coverage, police and fire retirement contributions, and other purposes. Approximately $1 million of the fund balances is non-spendable. A portion of the fund balance, $5.7 million, is assigned for specific uses by the City. The remainder of the balance, $19.2 million, is unassigned in the General Fund and is available for spending at the government’s discretion.
The General Fund is the chief operating fund of the City. At December 31, 2018, unassigned fund balance of the General Fund was $19.5 million, while the total fund balance was $20.8 million. As a measure of the General Fund’s liquidity, it may be useful to compare both unassigned fund balances and total fund balances to total fund expenditures, including transfers out. Unassigned fund balances represent 41.6% of total General Fund expenditures, including transfers out, while total fund balances represents 44.4% of that same amount. There was an increase of $3.4 million in total General Fund balance between years, a reflection of the City’s steadily improving economy and maintaining general fund expenditures at a consistent level

30
The Street Maintenance Fund, a special revenue fund, is presented as a major fund and reported $4.5 million of total fund balance, an increase of $1.3 million over the prior year. Revenues include gasoline tax and highway sales tax turnback from the state and federal transportation grants. Fund balance consists of $4.2 million assigned and $0.4 million restricted for street construction. This fund accounts for 5.4% of the total governmental fund balances.
The Sales Tax Fund, a special revenue fund, is presented as a major fund and accounts for 44.5% of the total governmental fund balances. Revenues include a one-percent (1%) local sales tax dedicated to streets, bridges and associated drainage. Fund balance increased $7.4 million during the year primarily due to a decline in $8.7 million in expenditures compared to the prior year.
The Sales & Use Tax Bond Fund had an increase in fund balance of $1.0 million during the year to $16.8 million. The City exercised an extraordinary redemption of $5.5 million from bonds outstanding during the year from surplus tax receipts. This fund accounts for 19.9% of the total governmental fund balances.
LOPFI Contribution Fund, a special revenue fund, is presented as a major fund and accounts for 4.6% of the total government fund balances. Revenues include a dedicated Property Tax and Insurance Turnback Revenues for police and fire pension contributions. Fund balance decreased $2.8 million during the year primarily due to a one time voluntary contribution of $2.0 million by the City to improve the funded status of the local plans.
Proprietary funds. The City’s proprietary funds provide the same information found in the government-wide financial statements, but with more detail.
Net position at the end of the year amounted to $412.8 million and $29.1 million for the Water and Sewer Fund and the Sanitation Fund, respectively. The increase in net position was $9.8 million for the Water and Sewer Fund and $4.2 million for the Sanitation Fund. Other factors concerning the finances of these funds have already been addressed in the discussion of the City’s business-type activities.
Budgetary Highlights
General Fund. The final amended General Fund budget had total appropriations of $53 million (total expenditures plus transfers out) compared to the original budget total of $50 million. The increase in appropriations of $3 million is attributed to capital outlay.
Revenue estimates for the General Fund remained consistent with the original budget of $49 million (total revenues plus transfers in).
Total actual revenue, including transfers in, for the General Fund was $50.2 million or $1.2 million more than the final budget estimates.
The budget and actual schedule for the General Fund may be found on page 142 in the required supplementary section of this document.
Capital Assets and Debt Administration
Capital assets. The City’s investment in capital assets for governmental and business-type activities as of December 31, 2018 amounts to $977.9 million, net of accumulated depreciation. This investment in capital assets includes land, buildings, water and sewer systems, improvements other than buildings, machinery and equipment, park and library facilities, streets, and drainage systems. The total increase in the City’s investment in capital assets was 1.7%, a 0.5% increase for governmental activities and a 2.5% increase for business-type activities.

31
City of Fort Smith
Capital Assets, Net of Accumulated Depreciation
2018 2017 2018 2017 2018 2017
Land 27,371,491$ 27,150,846$ 14,460,019$ 14,261,392$ 41,831,510$ 41,412,238$
Buildings 55,780,632 57,547,467 5,416,433 5,347,013 61,197,065 62,894,480
Water System - - 279,650,547 283,068,274 279,650,547 283,068,274
Sewer System - - 223,917,310 208,760,945 223,917,310 208,760,945
Improvement other than buildings 12,501,212 9,587,064 2,069,433 2,345,688 14,570,645 11,932,752
Infrastructure 285,317,770 263,231,933 - - 285,317,770 263,231,933
Machinery and equipment 20,916,231 20,260,953 15,399,908 13,391,715 36,316,139 33,652,668
Construction in progress 11,929,542 33,941,453 23,141,355 22,987,983 35,070,897 56,929,436
Total 413,816,878$ 411,719,716$ 564,055,005$ 550,163,010$ 977,871,883$ 961,882,726$
Governmental Activities Business-Type Activities Total
Major capital asset events during 2018 included the following:
Net reduction to construction in progress totaled $21.9 million. Of this amount, water and wastewater improvements accounted for an increase of $0.2 million, sanitation decreased $0.1 million and the general government and streets decreased by $22.0 million due to assets placed in service during the year.
Net additions to infrastructure totaled $22.1 million due to the completion of several street projects during 2018.
Net additions to the sewer system totaled $20.8 million and to the water system totaled $3.8 million in 2018.
Depreciation expense totaled $32.5 million.
Additional information on the City’s capital assets can be found in Note 3 on pages 71-79 of this report.
Long-term debt. At December 31, 2018, the City had $298.8 million of long-term bonds outstanding, including $227.2 million of bonds secured solely by specified revenue sources, (i.e. revenue bonds).
City of Fort Smith’s Outstanding Debt General Obligation and Revenue Bonds
2018 2017 2018 2017
Sales and Use Tax Bonds 71,665,000$ 84,400,000$ -$ -$ Revenue Bonds - - 227,155,000 168,905,000
Total 71,665,000$ 84,400,000$ 227,155,000$ 168,905,000$
Business-Type ActivitiesGovernmental Activities
The City’s total bonded debt increased by $45.5 million or 18.0% during 2018. Key factors in this increase was the issuance of the Water and Sewer Refunding and Construction Revenue Bond, Series 2018 of $130.7 million, which included the full refunding of the Water and Sewer Refunding and Construction Revenue Bond, Series 2008. The City maintains bond ratings as follows: an “A” rating from Standard & Poor’s on its water and sewer revenue bonds series 2011, 2012, 2015, 2016 and 2018; and an “AA” rating from Standard & Poor’s on its sales and use tax bonds series 2012 and 2014.

32
State statutes limit the amount of general obligation bonds a government entity may issue to 25% of its total assessed valuation. The current debt limitation for the City is $370 million. The City has no general obligation debt at December 31, 2018. Sales and use tax bonds are special debt of the City and are not considered general obligation bonds.
Additional information regarding the City’s long-term debt can be found in Note 4 on pages 80-92 of this report.
Economic Factors and the Next Year’s Budget and Rates
The year-end unemployment rate for the City was 3.5%, which is consistent with the 2017 rate. The state unemployment rate for 2018 was 3.6% and the national was 3.9%. The City is recovering from a down economy over the past few years.
The City expects a 1.0% increase in its tax revenue for 2019.
These factors were considered when the City prepared its 2019 Budget.
The Board of Directors considered these factors when the making spending priorities going into the 2019 budget year – critical equipment for the Police Department, pay increases for employees, city-wide, additional LOPFI contributions to reduce the outstanding pension liabilities, and the General Fund Capital Improvement Plan. The City’s General Fund budget for 2019 was approved at $44 million for regular programs and $7 million for Sales Tax programs. Continued efforts are being made to control spending and reduce costs where appropriate.
Request for Information
This financial report is designed to provide our citizens, taxpayers, customers, investors and creditors with a general overview of the City’s finances and to show accountability for the money it receives. Questions concerning any of the information provided in this report or requests for additional financial information should be addressed to the Director of Finance’s Office, Suite 512, 623 Garrison Avenue, Fort Smith, Arkansas 72903.

33
(This Page Intentionally Left Blank)

See accompanying notes to basic financial statements. 34
City of Fort Smith, Arkansas Statement of Net Position
December 31, 2018
Primary Government Component Units
Governmental Business-Type Governmental Business-TypeActivities Activities Total Activities Activities
Assets
Cash and cash equivalents 18,039,360$ 5,694,684$ 23,734,044$ 745,142$ 2,369,577$ Investments 51,228,658 48,850,132 100,078,790 698,854 1,876,533 Receivables, net
Property taxes and utility franchise fees 14,199,493 - 14,199,493 - - Sales taxes 3,744,530 - 3,744,530 253,254 - Accounts 668,337 14,266,995 14,935,332 175,808 161,313 Interest - - - - 18,149 Due from other governments 1,391,594 - 1,391,594 - 551,931
Internal balances 549,457 (549,457) - - - Inventories - 1,396,105 1,396,105 - 61,864 Prepaids and deposits 963,617 20,866 984,483 54,584 68,965 Restricted assets
Cash 225,621 223,375 448,996 - 79,866 Investments 15,164,665 87,865,285 103,029,950 - 955,893 Accounts receivable, net - 209,503 209,503 - - Sales tax receivable 1,377,651 - 1,377,651 - - Interest receivable 41,122 - 41,122 - - Prepaid items and deposits - 160,092 160,092 - -
Capital assets, net
Nondepreciable 39,301,033 37,601,374 76,902,407 427,132 12,346,036 Depreciable 374,515,845 526,453,631 900,969,476 329,639 26,563,557
Total Assets 521,410,984 722,192,584 1,243,603,568 2,684,413 45,053,684
Deferred Outflows of Resources
Deferred amounts on refunding - 2,728,152 2,728,152 - 70,807 Deferred outflows-pension 8,910,151 - 8,910,151 343,598 - Deferred outflows-pension contributions 6,065,809 - 6,065,809 95,945 - Deferred outflows-OPEB 8,337 4,875 13,212 - -
Total deferred outflows of resources 14,984,297 2,733,027 17,717,324 439,543 70,807

See accompanying notes to basic financial statements. 35
City of Fort Smith, Arkansas Statement of Net Position (Continued)
December 31, 2018
Primary Government Component Units
Governmental Business-Type Governmental Business-TypeActivities Activities Total Activities Activities
Liabilities
Accounts payable and
accrued expenses 4,966,761$ 7,191,555$ 12,158,316$ 174,769$ 889,652$ Other 207,664 1,670 209,334 - - Accrued interest 483,658 2,691,963 3,175,621 - - Deposits - 539,167 539,167 - - Unearned revenue 85,122 - 85,122 - - Noncurrent liabilities
Other long-term liabilities
due within one year 1,295,015 636,909 1,931,924 - 5 Current portion of long-term debt 7,670,000 6,360,000 14,030,000 - 210,000 Due in more than one year 147,772,516 257,654,864 405,427,380 1,638,782 1,700,537
Total liabilities 162,480,737 275,076,127 437,556,864 1,813,551 2,800,194
Deferred Inflows of Resources
Deferred amounts on refunding - 252,715 252,715 - - Deferred inflows-pension 3,037,433 - 3,037,433 241,024 - Deferred inflows-OPEB 10,397,328 6,080,214 16,477,542 - -
Total deferred inflows of resources 13,434,761 6,332,929 19,767,690 241,024 -
Net Position
Net investment in capital assets 337,638,439 391,608,271 729,246,710 756,771 37,070,400 Restricted for:
Construction projects 37,948,405 625,471 38,573,876 - 57,765 Debt service 16,809,059 8,111,137 24,920,196 - 383,758 Parks & recreation 25,667 - 25,667 - - Housing and rehabilitation 27,184 - 27,184 - - Police & fire retirement contributions 3,912,348 - 3,912,348 - - Tourism & promotion - - - 365,242 -
Unrestricted (deficit) (35,881,319) 43,171,676 7,290,357 (52,632) 4,812,374
Total net position 360,479,783$ 443,516,555$ 803,996,338$ 1,069,381$ 42,324,297$

See accompanying notes to basic financial statements. 36
City of Fort Smith, Arkansas Statement of Activities
For the Year Ended December 31, 2018
Net (Expense) Revenue and
Program Revenues Changes in Net Position
Fees, Fines, and Operating Capital Primary Government Component Units
Charges for Grants and Grants and Governmental Business-Type Governmental Business-Type
Expenses Services Contributions Contributions Activities Activities Total Activities Activities
Functions/ProgramsPrimary Government:
Governmental ActivitiesGeneral Government
Administration 5,377,383$ 833,830$ 1,282,524$ -$ (3,261,029)$ (3,261,029)$ Legal and courts 2,057,570 2,154,158 456,277 - 552,865 552,865
Finance 2,052,248 1,047,504 - - (1,004,744) (1,004,744)
Public safety
Police 23,687,812 90,191 3,366,238 132,321 (20,099,062) (20,099,062)
Fire 23,106,813 122,027 1,876,058 108,653 (21,000,075) (21,000,075)
Public works
Operations 505,908 - - - (505,908) (505,908)
Streets 13,213,917 389,717 4,078,058 2,087,687 (6,658,455) (6,658,455)
Traffic Control 2,396,862 - - - (2,396,862) (2,396,862)
Community services
Health and Social Services 126,906 - - - (126,906) (126,906)
Parks and Recreation 4,558,542 238,643 - - (4,319,899) (4,319,899)
Convention Center 2,179,183 782,643 - - (1,396,540) (1,396,540)
Transit 2,474,314 185,700 1,053,201 634,185 (601,228) (601,228)
Housing and Rehabilitation 2,034,659 85 1,870,943 - (163,631) (163,631)
Debt service
Interest 2,991,999 - - - (2,991,999) (2,991,999)
Total Governmental Activities 86,764,116 5,844,498 13,983,299 2,962,846 (63,973,473) (63,973,473)
Business-Type Activities:
Water and Sewer 51,098,433 57,858,066 - - - 6,759,633$ 6,759,633
Sanitation 12,462,283 16,812,701 - - - 4,350,418 4,350,418
Total Business-Type Activities 63,560,716 74,670,767 - - - 11,110,051 11,110,051
Total Primary Government 150,324,832$ 80,515,265$ 13,983,299$ 2,962,846$ (63,973,473)$ 11,110,051$ (52,863,422)$
Component Units:
Governmental
Advertising & Promotion 905,209$ -$ 4,600$ -$ (900,609)$
Public Library 2,983,639 200,354 165,613 - (2,617,672)
Subtotal 3,888,848 200,354 170,213 - (3,518,281)
Business-Type
Parking Authority 259,793 183,484 - - (76,309)$
Airport 4,675,033 2,908,921 - 3,437,563 1,671,451
Subtotal 4,934,826 3,092,405 - 3,437,563 1,595,142
Total Component Units 8,823,674$ 3,292,759$ 170,213$ 3,437,563$ (3,518,281) 1,595,142

37
City of Fort Smith, Arkansas Statement of Activities (Continued)
For the Year Ended December 31, 2018
Net (Expense) Revenue and
Changes in Net Position
Primary Government Component Units
Governmental Business-Type Governmental Business-Type
Activities Activities Total Activities Activities
General revenues
Property taxes 12,929,340$ -$ 12,929,340$ 1,483,569$ -$
Sales taxes 60,050,705 - 60,050,705 1,008,320 -
Gross receipts utility franchise fees 6,840,478 - 6,840,478 - -
Hospitality taxes - - - 799,364 -
Unrestricted investment earnings 1,220,764 1,219,925 2,440,689 4,593 50,868
Other 2,158,371 1,099,816 3,258,187 191,432 -
Transfers (1,255,595) 1,255,595 - - -
Total general revenues and transfers 81,944,063 3,575,336 85,519,399 3,487,278 50,868
Change in net position 17,970,590 14,685,387 32,655,977 (31,003) 1,646,010
Net position, beginning of year,
as previously reported 339,860,567 427,841,689 767,702,256 1,100,384 40,678,287
Restatement for adoption of GASB 75 (Note 1 ) 2,648,626 989,479 3,638,105 - -
Net position, beginning of year, as restated 342,509,193 428,831,168 771,340,361 1,100,384 40,678,287
Net position, end of year 360,479,783$ 443,516,555$ 803,996,338$ 1,069,381$ 42,324,297$

38
City of Fort Smith, Arkansas Balance Sheet – Governmental Funds
December 31, 2018
Sales Other TotalStreet LOPFI and Use Tax Governmental Governmental
General Maintenance Sales Tax Contribution Bond Funds Funds
Cash 7,793,237$ 1,206,625$ 6,974,826$ -$ -$ 201,879$ 16,176,567$ Investments 11,124,577 2,970,498 29,508,584 3,916,072 - 724,772 48,244,503 Receivables, net of allowance for uncollectibles
Property taxes and utility franchise fees 8,930,060 2,258,328 - 3,011,105 - - 14,199,493 Sales taxes 1,907,662 - 1,836,868 - - - 3,744,530 Accounts 540,552 1,200 101,470 - - 7,173 650,395
Due from other funds 127,836 - - - - - 127,836 Due from other governments 810,372 519,812 - - - 61,410 1,391,594 Restricted assets:
Cash - - - - 225,621 - 225,621 Investments - - - - 15,164,665 - 15,164,665 Sales taxes receivable - - - - 1,377,651 - 1,377,651 Interest receivable - - - - 41,122 - 41,122
Prepaid items 308,215 - - - - 504,041 812,256 Deposits 3,866 - 136,995 - - - 140,861
Total Assets 31,546,377$ 6,956,463$ 38,558,743$ 6,927,177$ 16,809,059$ 1,499,275$ 102,297,094$
Liabilities:Accounts payable and accrued liabilities 3,270,942$ 274,878$ 749,496$ 143,503$ -$ 143,874$ 4,582,693$ Retainage payable - - 172,434 - - 172,434 Due to other funds - - - - 301,292 301,292 Unearned revenue - - - - 85,122 85,122 Other 204,972 - - - 2,692 207,664
Total Liabilities 3,475,914 274,878 921,930 143,503 - 532,980 5,349,205
Deferred Inflows of ResourcesUnavailable grants 150,036 - - - - - 150,036 Unavailable property taxes 7,178,315 2,153,494 - 2,871,326 - - 12,203,135
Total deferred inflows of resources 7,328,351 2,153,494 - 2,871,326 - - 12,353,171
Fund Balances:Nonspendable 312,081 - 136,995 - - 504,041 953,117 Restricted for:
Construction projects - 357,047 37,499,818 - - 91,540 37,948,405 Debt service - - - - 16,809,059 - 16,809,059 Parks & recreation - - - - - 25,667 25,667 Housing and rehabilitation - - - - - 27,184 27,184 Police & fire retirement contributions - - - 3,912,348 - - 3,912,348
Assigned to:Convention center - - - - - 624,458 624,458 Construction projects 958,678 4,171,044 - - - - 5,129,722 Other purposes 9,168 - - - - - 9,168
Unassigned (deficit) 19,462,185 - - - - (306,595) 19,155,590
Total Fund Balances 20,742,112 4,528,091 37,636,813 3,912,348 16,809,059 966,295 84,594,718
Total Liabilities, Deferred Inflows of Resources and Fund Balances 31,546,377$ 6,956,463$ 38,558,743$ 6,927,177$ 16,809,059$ 1,499,275$ 102,297,094$
Assets
Liabilities, Deferred Inflows of Resources, and Fund Balances

See accompanying notes to basic financial statements. 39
City of Fort Smith, Arkansas Reconciliation of the Balance Sheet of Governmental Funds
to the Statement of Net Position
December 31, 2018
Total fund balances – governmental funds 84,594,718$
Amounts reported for governmental activities in the statement of net positionare different because:
Capital assets used in governmental activities are not financial resourcesand, therefore, are not reported in the funds. These assets consist of:
Land 27,371,491$ Buildings 86,677,706 Improvements other than buildings 24,167,271 Machinery and equipment 52,656,267 Infrastructure 426,782,436 Accumulated depreciation (215,767,835)
401,887,336 Construction in progress 11,929,542
Total 413,816,878$ 413,816,878
Some revenues in the governmental funds are unearned because they arenot collected within the prescribed time period after year end and are notconsidered available. On the accrual basis, however, those revenues wouldbe recognized regardless of when they are collected. 12,353,171
Deferred inflows and outflows related to pensions and OPEB are not due and payablein the current period and, therefore, are not reported in the funds. 1,549,536
Internal service funds are used by management to charge the costs of certain activities, such as fuel and insurance, to individual funds. A portionof the assets and liabilities are included in governmental activities in the statement of net position. 4,302,300
Some long-term liabilities are not due and payable in the current period and,therefore, are not reported in the funds. Those liabilities consist of:
Compensated absences 2,135,770$ Claims payable 82,500Sales tax bonds payable, net 75,694,781
Interest payable 483,658
Net pension liabilities 70,453,304 OPEB liabilities 7,286,807
Total 156,136,820$ (156,136,820)
Net position of governmental activities 360,479,783$

See accompanying notes to basic financial statements. 40
City of Fort Smith, Arkansas Statement of Revenues, Expenditures and Changes in Fund Balances – Governmental Funds
For the Year Ended December 31, 2018
Other TotalStreet LOPFI Sales and Use Governmental Governmental
General Maintenance Sales Tax Contribution Tax Bond Funds FundsRevenues
Property taxes 7,331,663$ 2,199,821$ -$ 2,933,857$ -$ -$ 12,465,341$ Sales taxes 22,419,834 - 21,503,354 - 16,127,517 - 60,050,705 Licenses and permits 1,881,334 203,424 - - - - 2,084,758 Utility franchise fees 6,840,478 - - - - - 6,840,478 Intergovernmental 3,961,754 6,064,275 - 1,712,138 - 2,003,879 13,742,046 Fines and forfeitures 2,037,330 - - 109,938 - - 2,147,268 Fees for services 570,311 - - - - 782,643 1,352,954 Interest 924,037 15,716 156,124 25,388 212,773 21,097 1,355,135 Increase in fair value of investments - - - - 25,666 - 25,666 Contributions 1,203,126 - 101,470 1,899,503 - - 3,204,099 Miscellaneous 498,239 73,123 30,169 670 - 1,171 603,372
Total Revenues 47,668,106 8,556,359 21,791,117 6,681,494 16,365,956 2,808,790 103,871,822
ExpendituresCurrent:
General government Administration 3,156,542 221,670 - - - - 3,378,212 Legal and courts 2,024,888 129,052 - - - - 2,153,940 Finance 1,598,545 516,481 - - - - 2,115,026 Public safety Police 14,218,898 - - 4,251,858 - 143,834 18,614,590 Fire 12,912,611 - - 5,379,375 - - 18,291,986 Public works Operations - 517,467 - - - - 517,467 Streets - 3,316,514 - - - - 3,316,514 Traffic Control - 1,917,819 - - - - 1,917,819 Community services Health and Social Services 118,441 - - - - - 118,441 Parks and Recreation 2,835,221 281,906 - - - 140 3,117,267 Convention Center - - - - - 1,535,760 1,535,760 Transit 2,147,988 - - - - - 2,147,988 Housing and Rehabilitation - - - - - 1,982,294 1,982,294 Other 1,854,140 - 32,205 - 22,800 - 1,909,145
Capital Outlay 4,861,702 261,929 12,494,534 - - 2,026,026 19,644,191 Debt Service:
Principal - - - - 12,735,000 - 12,735,000 Interest - - - - 2,589,697 - 2,589,697
Total Expenditures 45,728,976 7,162,838 12,526,739 9,631,233 15,347,497 5,688,054 96,085,337
Excess (deficiency) in revenues over (under) expenditures 1,939,130 1,393,521 9,264,378 (2,949,739) 1,018,459 (2,879,264) 7,786,485

See accompanying notes to basic financial statements. 41
City of Fort Smith, Arkansas Statement of Revenues, Expenditures and Changes in Fund Balances – Governmental Funds (Continued)
For the Year Ended December 31, 2018
Other Total
Street LOPFI Sales & Use Governmental GovernmentalGeneral Maintenance Sales Tax Contribution Tax Bond Funds Funds
Other Financing Sources (Uses)Transfers in 2,524,814$ -$ -$ 150,000$ -$ 777,000$ 3,451,814$ Transfers out (1,017,000) (115,000) (1,831,814) - - (2,963,814)
Total Other Financing Sources and Uses 1,507,814 (115,000) (1,831,814) 150,000 - 777,000 488,000
Net Change in Fund Balances 3,446,944 1,278,521 7,432,564 (2,799,739) 1,018,459 (2,102,264) 8,274,485
Fund Balances, beginning of year 17,295,168 3,249,570 30,204,249 6,712,087 15,790,600 3,068,559 76,320,233
Fund Balances, end of year 20,742,112$ 4,528,091$ 37,636,813$ 3,912,348$ 16,809,059$ 966,295$ 84,594,718$

See accompanying notes to basic financial statements. 42
City of Fort Smith, Arkansas Reconciliation of the Statement of Revenues, Expenditures and
Changes in Fund Balances of Governmental Funds to the Statement of Activities
For the Year Ended December 31, 2018
Net change in fund balances – total governmental funds 8,274,485$
Amounts reported for governmental activities in the statement of activitiesare different because:
Governmental funds report capital outlays as expenditures. However,in the government-wide statement of activities and changes in net position, the cost of those assets is allocated over their estimated useful lives asdepreciation expense. This is the amount of capital assets recordedin the current period. 19,644,191
Capital contributions to the Water and Sewer Fund are recognized as transfersout on the government-wide statement of activities (1,743,595)
Depreciation expense on capital assets is reported in the government-wide statement of activities and changes in net position, but they do not require the use of current financial resources. Therefore, depreciationexpense is not reported as an expenditure in governmental funds. (15,789,218)
The net effect of various miscellaneous transactions involving capital assets 15,026 (i.e., sales and donations) is to decrease net position.
The repayment of debt consumes current financial resourcesof governmental funds. This transaction does not have any effect onnet position. This amount is the net effect of these differencesin the treatment of long-term debt and related items. 12,735,000
Revenues in the statement of activities that do not provide current financialresources are not reported as revenues in the funds. 463,999
Some expenses, i.e. , the change in compensated absences liability, interest,net pension and OPEB liabilities, reported in the statement of activities and changes in net position do not require the use of current financial resources, and, therefore, are not reported as expenditures in the governmental funds. (8,381,866)
Internal service funds are used by management to charge the costs of certain activities, such as insurance and fuel, to individual funds. The netloss of the internal service funds is reported with governmental activities 2,752,568
Change in net position of governmental activities 17,970,590$

43
(This Page Intentionally Left Blank)

See accompanying notes to basic financial statements. 44
City of Fort Smith, Arkansas Statement of Fund Net Position –
Proprietary Funds
December 31, 2018
Enterprise Funds
Water and Internal ServiceSewer Sanitation Total Funds
Current AssetsCash -$ 4,463,135$ 4,463,135$ 3,094,342$ Investments 25,255,402 21,912,819 47,168,221 4,666,066 Receivables
Accounts, net of uncollectibles of $196,833; 11,123,022 3,133,480 14,256,502 28,435 $56,519 and $-0-
Accrued interest - - - - Restricted
Cash 223,375 - 223,375 - Investments 87,865,285 - 87,865,285 - Accounts receivable, net of - 209,503 209,503 -
uncollectibles of $628,510Interest receivable - - - -
Inventories 1,262,946 103,346 1,366,292 29,813 Prepaid items - 16,366 16,366 15,000 Due from other funds 173,456 - 173,456 -
Total Current Assets 125,903,486 29,838,649 155,742,135 7,833,656
Noncurrent AssetsRestricted
Prepaid items and deposits 160,092 - 160,092 - Capital assets
Land 14,086,247 373,772 14,460,019 - Buildings 1,925,102 5,208,689 7,133,791 - Improvements other than buildings - 23,253,316 23,253,316 - Leasehold improvements - 709,952 709,952 - Machinery and equipment 20,636,321 18,585,761 39,222,082 - Water system 411,525,519 - 411,525,519 - Sewer system 322,106,840 - 322,106,840 - Construction in progress 23,141,355 - 23,141,355 -
Less accumulated depreciation (240,787,019) (36,710,850) (277,497,869) -
Total Noncurrent Assets 552,794,457 11,420,640 564,215,097 -
Total Assets 678,697,943 41,259,289 719,957,232 7,833,656
Deferred outflows of resources Deferred amount on refunding 2,728,152 - 2,728,152 - Deferred outflows of resources - OPEB 3,620 1,255 4,875 -
Total deferred outflows of resources 2,731,772 1,255 2,733,027 -

See accompanying notes to basic financial statements. 45
City of Fort Smith, Arkansas Statement of Fund Net Position –
Proprietary Funds (Continued)
December 31, 2018
Enterprise Funds
Water and Internal ServiceSewer Sanitation Total Funds
Current liabilitiesAccounts payable and accrued liabilities 5,571,935$ 971,194$ 6,543,129$ 253,406$ Retainage payable 524,154 - 524,154 - Accrued vacation and sick leave 51,306 14,208 65,514 - Accrued interest 2,691,963 - 2,691,963 - Claims and judgments - - - 1,738,264 Revenue bonds payable 6,360,000 - 6,360,000 - Deposits 539,167 - 539,167 - Other 1,670 - 1,670 -
Total Current Liabilities 15,740,195 985,402 16,725,597 1,991,670
Noncurrent liabilitiesAccrued vacation and sick leave 803,801 222,590 1,026,391 - Landfill closure and postclosure care - 8,251,531 8,251,531 - Revenue bonds, net 244,115,721 - 244,115,721 - OPEB liabilities 3,164,159 1,097,062 4,261,221 -
Total Noncurrent Liabilities 248,083,681 9,571,183 257,654,864 -
Total Liabilities 263,823,876 10,556,585 274,380,461 1,991,670
Deferred inflows of resources Deferred amount on refunding 252,715 - 252,715 - Deferred inflows of resources - OPEB 4,514,847 1,565,367 6,080,214 -
Total deferred inflows of resources 4,767,562 1,565,367 6,332,929 -
Net PositionNet investment in capital assets 380,187,631 11,420,640 391,608,271 - Restricted for bond retirement 8,111,137 - 8,111,137 - Restricted for asset replacement 500,000 125,471 625,471 - Unrestricted 24,039,509 17,592,481 41,631,990 5,841,986
Total Net Position 412,838,277$ 29,138,592$ 441,976,869 5,841,986$
Reconciliation to government - wide statement of net position:
Adjustment to reflect the consolidation of internal service funds activities relatedto enterprise funds 1,539,686
Net position of business type activities 443,516,555$

See accompanying notes to basic financial statements. 46
City of Fort Smith, Arkansas Statement of Revenues, Expenses and Changes in
Fund Net Position – Proprietary Funds
For the Year Ended December 31, 2018
Enterprise Funds
Water and Internal Service
Sewer Sanitation Total Funds
Operating Revenues
Water service 26,585,834$ -$ 26,585,834$ -$
Sewer service 29,907,067 - 29,907,067 -
Other charges for services 1,204,906 16,647,589 17,852,495 11,366,996
Other 160,259 165,112 325,371 -
Total Operating Revenues 57,858,066 16,812,701 74,670,767 11,366,996
Operating Expenses
Personnel services 15,612,059 5,482,839 21,094,898 -
Contractual services 6,465,024 2,572,826 9,037,850 728,990
Materials and supplies 4,953,968 2,821,215 7,775,183 753,898
Heat, light, and power 1,988,553 100,561 2,089,114 -
Depreciation 15,035,344 1,647,423 16,682,767 -
Insurance claims and expenses - - - 8,166,794
Total Operating Expenses 44,054,948 12,624,864 56,679,812 9,649,682
Operating Income 13,803,118 4,187,837 17,990,955 1,717,314
Nonoperating Revenues (Expenses)
Interest revenue 935,822 284,103 1,219,925 24,688
Interest expense and fiscal charges (7,533,963) - (7,533,963) -
Other nonoperating revenues 1,088,658 11,158 1,099,816 -
Net Nonoperating Revenues (Expenses) (5,509,483) 295,261 (5,214,222) 24,688
Income Before Contributions and
Transfers 8,293,635 4,483,098 12,776,733 1,742,002
Capital contributions 1,743,595 - 1,743,595 -
Transfers in - 90,000 90,000 -
Transfers out (215,000) (363,000) (578,000) -
Change in Net Position 9,822,230 4,210,098 14,032,328 1,742,002
Net position, beginning of year, as previously reported 402,564,723 24,390,339 4,099,984
Restatement for adoption of GASB 75 (Note 1 ) 451,324 538,155 -
Net position, beginning of year, as restated 403,016,047 24,928,494 4,099,984
Net position, end of year 412,838,277$ 29,138,592$ 5,841,986$
Reconciliation to government - wide statement of activities:
Adjustment to reflect the consolidation of internal service funds activities related
to enterprise funds 653,059
Change in net position of business type activities for government-wide statement of activities 14,685,387$

47
(This Page Intentionally Left Blank)

See accompanying notes to basic financial statements. 48
City of Fort Smith, Arkansas Statement of Cash Flows – Proprietary Funds
For the Year Ended December 31, 2018
Enterprise Funds
Water and Internal Service
Sewer Sanitation Total Funds
Cash Flows from Operating Activities
Cash received from customers 57,499,542$ 16,997,609$ 74,497,151$ -$
Cash received from service users - - - 1,186,879
Cash received from city and employee contributions - - - 10,280,307
Cash payments for goods and services (16,491,249) (7,025,829) (23,517,078) (746,614)
Cash paid to employees (15,643,646) (5,467,539) (21,111,185) -
Cash payments for premiums and other operating expenses - - - (464,534)
Cash payments for claims paid - - - (8,126,390)
Cash received from other operating revenues 160,259 165,112 325,371 -
Net cash provided by operating activities 25,524,906 4,669,353 30,194,259 2,129,648
Cash Flows from Noncapital Financing Activities
Transfers in from other funds - 90,000 90,000 -
Transfers out to other funds (215,000) (363,000) (578,000) -
Net cash used in noncapital
financing activities (215,000) (273,000) (488,000) -
Cash Flows from Capital and Related Financing Activities
Proceeds from sale of capital assets 309,710 33,262 342,972 -
Acquisition and construction of capital assets (27,432,308) (1,398,859) (28,831,167) -
Proceeds from the issuance of bonds 146,928,446 - 146,928,446 -
Principal paid on bonds (72,430,000) - (72,430,000) -
Interest paid on bonds (8,823,561) - (8,823,561) -
Net cash provided by (used in) capital and
related financing activities 38,552,287 (1,365,597) 37,186,690 -
Cash Flows from Investing Activities
Proceeds from sales and maturities of investment securities 24,736,055 8,059,184 32,795,239 -
Outlays for purchases of investment securities (89,778,617) (8,347,104) (98,125,721) (25,597)
Interest on investments 795,334 287,920 1,083,254 25,597
Net cash used in investing activities (64,247,228) - (64,247,228) -
Net Increase (Decrease) in Cash (385,035) 3,030,756 2,645,721 2,129,648
Cash, beginning of year 608,410 1,432,379 2,040,789 964,694
Cash, end of year 223,375$ 4,463,135$ 4,686,510$ 3,094,342$

See accompanying notes to basic financial statements. 49
City of Fort Smith, Arkansas Statement of Cash Flows – Proprietary Funds (Continued)
For the Year Ended December 31, 2018
Enterprise Funds
Water and Internal Service
Sewer Sanitation Total Funds
Reconciliation of cash and restricted cash at December 31
to statement of net position
Cash -$ 4,463,135$ 4,463,135$ 3,094,342$
Restricted cash 223,375 - 223,375 -
Total 223,375$ 4,463,135$ 4,686,510$ 3,094,342$
Reconciliation of operating income to net cash
provided by operating activities
Operating income 13,803,118$ 4,187,837$ 17,990,955$ 1,717,314$
Adjustments to reconcile operating income
to net cash provided by operating activities
Depreciation 15,035,344 1,647,423 16,682,767 -
Change in assets, deferred outflows of resources, liabilities
and deferred inflows of resources
Accounts receivable (4,801,665) (1,824,708) (6,626,373) 13,344
Due from other funds (173,456) - (173,456) (136)
Inventory (191,835) 29,375 (162,460) 6,712
Prepaid items 14,120 (4,561) 9,559 109,550
Deferred outflows of resources - OPEB (3,620) (1,255) (4,875)
Accounts payable and accrued liabilities 1,965,948 355,030 2,320,978 195,015
Deposits (5,603) - (5,603) -
Liability for claims and judgments - - - 87,849
OPEB liabilities (4,631,465) (1,605,800) (6,237,265) -
Deferred inflows of resources - OPEB 4,514,847 1,565,367 6,080,214
Other liabilities (827) 320,645 319,818 -
Total adjustments 11,721,788 481,516 12,203,304 412,334
Net cash provided by operating activities 25,524,906$ 4,669,353$ 30,194,259$ 2,129,648$
Noncash investing, capital and financing activities:
Enterprise funds:
The Water and Sewer Fund received contributions of capital assets of $1,743,595 for 2018.

See accompanying notes to basic financial statements. 50
City of Fort Smith, Arkansas Statement of Fiduciary Net Position
OPEB Trust Fund
December 31, 2018
Assets
Current Assets
Investments:
Government money market funds 424,592$
Equities - agency bonds 179,408
US government bonds 736,594
Certificates of deposit 149,946
Total Investments 1,490,540
Total Current Assets 1,490,540
Total Assets 1,490,540
Liabilities
Current Liabilities
Accounts payable 3,726
Total Current Liabilities 3,726
Total Liabilities 3,726
Net Position
Net position restricted for postemployment benefits
other than pensions 1,486,814
Total Net Position 1,486,814$

See accompanying notes to basic financial statements. 51
City of Fort Smith, Arkansas Statement of Changes in Fiduciary Net Position
OPEB Trust Fund
For the Year Ended December 31, 2018
Additions:
Contributions
Employer 271,381$
Total contributions 271,381
Investment Earnings
Net increase in fair value of investments 27,907
Total investment earnings 27,907
Total additions 299,288
Deductions:
Benefits paid directly to participants 271,381
Management fees 25,666
Total deductions 297,047
Change in Net Position 2,241
Net Position Restricted for Postemployment
Benefits Other Than Pensions
Beginning of year 1,484,573
End of year 1,486,814$

City of Fort Smith, Arkansas Notes to Basic Financial Statements
December 31, 2018
52
Note 1: Nature of Operations and Summary of Significant Accounting Policies
Nature of Operations
The City of Fort Smith, Arkansas (the “City”) is a municipal corporation operating under the authority of Arkansas state statute. The City operates under a city administrator form of government. Seven elected directors and the Mayor set policy. The directors employ the City Administrator. The accounting and reporting policies of the City conform to accounting principles generally accepted in the United States of America (GAAP) as applied to governmental units. The Governmental Accounting Standards Board (GASB) is the standard-setting body accepted in the United States for establishing governmental accounting and financial reporting principles.
Adoption of Accounting Principles
GASB Statement No. 75 – Accounting and Financial Reporting for Postemployment Benefits Other than Pensions
Effective January 1, 2018, the City implemented GASB Statement No. 75, Accounting and Financial Reporting for Postemployment Benefits Other than Pensions (GASB 75). The requirements of this statement will improve the decision-usefulness of information in governmental entities financials reports and will enhance its value for assessing accountability and interperiod equity by requiring recognition of the entire net other postemployment benefits (OPEB) liability and a more comprehensive measure of OPEB expense. GASB 75 requires more extensive note disclosures as detailed in Note 8 and required supplementary information (RSI) about the net OPEB liabilities. The beginning net position has been restated to reflect the implementation of the new accounting standard as follows:
Governmental Activities
Business-type Activities
Water and Sewer Fund
Sanitation Fund
Net position at January 1, 2018, as Previously Reported 339,860,567$ 427,841,689$ 402,564,723$ 24,390,339$
Recording of OPEB items - implementation of GASB 75:Recording of net OPEB liability as of January 1, 2018 (17,952,697) (10,498,487) (7,795,624) (2,702,863) Elimination of OPEB liability as previously reported at January 1, 2018 20,601,323 11,487,966 8,246,948 3,241,018
Adjustment to beginning net position for GASB 75 implementation 2,648,626 989,479 451,324 538,155
Total Net Position, Beginning of Year, as Restated 342,509,193$ 428,831,168$ 403,016,047$ 24,928,494$
Proprietary Funds

City of Fort Smith, Arkansas Notes to Basic Financial Statements
December 31, 2018
53
GASB Statement No. 85 – Omnibus 2017
Effective January 1, 2018, the City implemented GASB Statement No. 85, Omnibus 2017. This statement addresses practice issues that have been identified during implementation and application of certain GASB standards and addresses a variety of topics, including issues related to blending component units, goodwill, fair value measurement and postemployment benefits. This statement had no major effect on the City’s financial statements in 2018. GASB Statement No. 86 – Certain Debt Extinguishment Issues
Effective January 1, 2018, the City implemented GASB Statement No. 86, Certain Debt Extinguishment Issues. The statement improves consistency in accounting and financial reporting for in-substance defeasance of debt by providing guidance for transactions in which cash and other monetary assets acquired with only existing resources – resources other than the proceeds of refunding debt – are placed in an irrevocable trust for the sole purpose of extinguishing debt. This statement had no effect on the City’s financial statements in 2018.
Reporting Entity
The City is a municipality governed by an elected mayor and a seven-member board of directors (Board). As required by GAAP, these financial statements present the City (Primary Government) and its component units. The component units are legally separate from the City, but are included in the City’s reporting entity because of the significance of their operational or financial relationships with the City based upon the criteria of GASB Statement 14, The Financial Reporting Entity, as amended by GASB Statement 80, Blending Requirements for Certain Component Units and GASB Statement 39, Determining whether Certain Organizations Are Component Units, as amended by GASB Statement 61, The Financial Reporting Entity: Omnibus. Generally, GASB Statements 14, 39, 61 and 80 require entities for which the City appoints a voting majority of the board and the entity imposes a financial benefit or burden to be included in the City’s financial reporting entity. Additionally, those entities that the nature and significance of their relationship with the City is such that exclusion from the City’s financial reporting entity would render the City’s financial statements incomplete or misleading, should also be included in the City’s reporting entity.
Those entities that meet the above established criteria for inclusion, and that meet either of the following criteria (1) provide services entirely or almost entirely for the City, or (2) whose board is substantially the same as the City’s board, are required to be included as part of the primary government’s financial statements through “blended” presentation. Those entities that meet the above established criteria for inclusion, but do not either (1) provide services entirely or almost entirely for the City, or (2) have the same or substantially the same board as the City, are required to be presented “discretely” or in a separate column as part of the City’s reporting entity, but not part of the primary government. Entities for which the City is accountable because it appoints a voting majority of the Board but is not financially accountable, are related organizations and would be disclosed in these notes.

City of Fort Smith, Arkansas Notes to Basic Financial Statements
December 31, 2018
54
All entities that are not included as “Blended Component Units” or “Discretely Presented Component Units” on the following page are excluded from the City’s financial reporting entity.
Blended Component Units
The City has no component units included as Blended Component Units during 2018.
Discretely Presented Component Units
Business-Type
Fort Smith Parking Authority (the Authority) - The Authority’s governing board is appointed by the City’s Board; the operation and administration of the Authority’s property is conducted by City personnel; and the legal liability for the Authority’s revenue bond obligation remains with the City. In addition, the City provides a subsidy to fund the Authority’s operations; however, the Authority functions almost entirely for the benefit of residents and other customers. The Authority is a special purpose government engaged solely in business-type activities and is discretely presented in the City’s basic financial statements. Separate financial statements are not prepared for the Authority. See Note 13 on pages 126-127 of these notes for condensed financial statements.
Airport Commission - The Airport Commission manages the Fort Smith Regional Airport and consists of seven members as appointed by the Mayor and confirmed by the Board. Debt is issued in the name of the City and the tax rate on aviation fuel must be approved by the Board. The Airport Commission is a special purpose government engaged solely in business-type activities and is discretely presented in the City’s basic financial statements. Financial statements of the Airport Commission can be obtained from the Airport’s administrative office located at 6700 McKennon Boulevard, Suite 200, Fort Smith, Arkansas 72903, or from the City Clerk’s office. See Note 13 on pages 126-127 of these notes for condensed financial statements.
Governmental
Advertising and Promotion Commission (the Commission) - The Commission was established during 1989 to promote the City and increase tourism. The Commission is governed by seven members appointed by the Board. The Mayor and one board member serve as two of the seven members of the Commission. The City levies taxes for the Commission’s revenue, performs administrative services for collection of taxes, and provides financial services to the Commission. However, the Commission functions for the benefit of the citizens and visitors to the City. The Commission is a special purpose government engaged in governmental activities and is discretely presented in the City’s basic financial statements. Separate financial statements are not prepared for the Commission. See Note 13 on pages 126-127 of these notes for condensed financial statements.

City of Fort Smith, Arkansas Notes to Basic Financial Statements
December 31, 2018
55
Public Library - The board of trustees for the Fort Smith Public Library manages the Public Library and consists of seven members appointed by the Mayor and confirmed by the Board. Debt is issued in the name of the City and the City levies the Public Library’s ad valorem tax annually. The Public Library is a special purpose government engaged in governmental activities and is discretely presented in the City’s basic financial statements. Financial statements of the Public Library can be obtained from the Library’s administrative office located at 3201 Rogers Avenue, Fort Smith, Arkansas, 72903, or from the City Clerk’s office. See Note 13 on pages 126-127 of these notes for condensed financial statements.
Related Organizations
The City’s Mayor and Board are also responsible for appointing members of the boards of other organizations, but the City’s accountability, for these organizations, does not extend beyond making the appointments. The Mayor and Board appoint the members of the Fort Smith Housing Authority and the Solid Waste Management District; however, the City cannot impose its will upon the Housing Authority or the Solid Waste Management District as stated in GASB Statements 14, 39, 61 and 80; therefore, the financial operations of these related organizations have not been included in the City’s basic financial statements.
Government-Wide and Fund Financial Statements
The basic financial statements include both government-wide (based on the City as a whole) and fund financial statements as follows:
Government-Wide Financial Statements
The government-wide financial statements report information on all of the nonfiduciary activities of the primary government and its component units. As a general rule, the effect of interfund activity has been eliminated from the government-wide financial statements. Interfund services provided and used are not eliminated in the process of consolidation. These statements distinguish between the governmental and business-type activities of the City. Governmental activities generally are financed through taxes, intergovernmental revenues and other nonexchange transactions. Business-type activities are financed in whole or in part by fees charged to external parties. Likewise, the primary government is reported separately from certain legally separate component units for which the primary government is financially accountable. The statement of activities demonstrates the degree to which the direct expenses of a given function or identifiable activity is offset by program revenues. Direct expenses are those that are clearly associated with a specific function or identifiable activity. Expenses that cannot be specifically identified to a particular function are charged to functions based on time spent for that function and are included in the functional categories. Program revenues include (a) charges to customers or applicants who purchase, use, or directly benefit from goods, services or privileges provided by a given function or identifiable activity and (b) grants and contributions that are restricted to meeting the operational or capital requirements of a particular program or identifiable activity. All other revenues are reported as general revenues.

City of Fort Smith, Arkansas Notes to Basic Financial Statements
December 31, 2018
56
Fund Financial Statements
The fund financial statements provide information about the City’s funds. Separate statements for each fund category, governmental, proprietary, and fiduciary, are presented. Proprietary funds include both enterprise and internal service funds. The emphasis of fund financial statements is on major governmental and major enterprise funds, each displayed in a separate column. All other governmental and enterprise funds are aggregated and reported as nonmajor funds. Internal service funds are also aggregated and reported in a single column.
The City reports the following major governmental funds:
The General Fund is the government’s primary operating fund. It accounts for all financial resources of the general government, except those required to be accounted for in another fund.
The Street Maintenance Fund is a special revenue fund that accounts for state gas turnback revenues and property taxes from the Sebastian County road tax allocation restricted for street and traffic control operations. Minor maintenance, repair, and construction of streets and traffic control signals as well as street lighting are included in this fund.
The Sales Tax Fund is a special revenue fund that accounts for resources from the City’s one percent (1%) local sales and use tax dedicated to the major street, bridge, and associated drainage projects.
The LOPFI Contribution Fund is a special revenue fund that accounts for the funding of contributions made to the Police and Fire Relief and Pension Plans administered by Arkansas LOPFI.
The Sales and Use Tax Bond Fund is a debt service fund that accounts for resources to repay general government related debt.
The City reports the following major enterprise funds:
The Water and Sewer Fund is an enterprise fund that accounts for the activities of the water and wastewater operations. The City operates water treatment plants and distribution lines and wastewater treatment plants, pumping stations and collection systems.
The Sanitation Fund is an enterprise fund that accounts for the activities of providing solid waste collection and disposal. The City’s landfill activities are included in this fund.
The City reports the following fiduciary fund type:
The OPEB Trust Fund is a pension trust fund that accounts for contributions to an irrevocable trust established to provide for future funding of retirees’ medical plan benefits.

City of Fort Smith, Arkansas Notes to Basic Financial Statements
December 31, 2018
57
Additionally, the City reports the following fund types:
Special Revenue Funds- The special revenue funds, which include federal and state grants, are used to account for the proceeds of specific revenue sources, other than major capital projects, that are legally restricted to expenditures for specified purposes. The City’s nonmajor special revenue funds are Community Development Block Grant (CDBG) Funds, Tilles Park Fund, Home Investment Partnership Act Fund, Special Grants Fund, Economic Development Fund, and Convention Center Fund.
Capital Projects Fund - The Sales and Use Tax Construction Fund is a capital projects fund that accounts for the proceeds of the Sales and Use Tax Refunding and Construction Bonds and the projects funded thereby.
Internal Service Funds- The internal service funds are used to account for centralized services, employee health care, and workers’ compensation coverage provided to the City departments on a cost-reimbursement basis.
Measurement Focus and Basis of Accounting
Government-Wide and Proprietary Funds
The government-wide, proprietary fund financial statements and fiduciary fund financial statements are reported using the economic resources measurement focus and accrual basis of accounting. Revenues are recorded when earned and expenses are recorded at the time liabilities are incurred, regardless of the timing of related cash flows.
Proprietary fund operating revenues and expenses are distinguished from nonoperating items. Operating revenues and expenses generally result from providing services in connection with the principal ongoing operations of the fund. All revenues and expenses not meeting this definition are reported as nonoperating items.

City of Fort Smith, Arkansas Notes to Basic Financial Statements
December 31, 2018
58
Nonexchange transactions, in which the City receives (or gives) value without directly giving (or receiving) equal value in exchange, include taxes, fines and forfeitures, grants, entitlements, and similar items; and contributions. Recognition standards are based on the characteristics and classes of nonexchange transactions. Property taxes are recognized as revenues in the year for which they are levied. Utility franchise fees, other taxes, and fines and forfeitures are recognized as revenues, net of estimated refunds and uncollectible amounts, in the accounting period when an enforceable legal claim to the assets arises and the use of resources is required or is first permitted. All of the utility franchise fees remitted to the City are based upon the gross receipts of the franchised utility. Grants, entitlements, and contributions are recognized as revenues, net of estimated uncollectible amounts, as soon as all eligibility requirements imposed by the provider have been met. Amounts received before all eligibility requirements have been met are reported as unavailable revenues. Grants and similar aid to other organizations are recognized as expenses as soon as recipients have met all eligibility requirements. Amounts paid before all eligibility requirements have been met are reported as prepaid items.
Governmental Fund Financial Statements
Governmental funds are reported using the current financial resources measurement focus and the modified accrual basis of accounting. With this measurement focus, only current assets and liabilities are generally included on the balance sheet. The statement of revenues, expenditures and changes in fund balances presents increases (revenues and other financing sources) and decreases (expenditures and other financing uses) in spendable resources. General capital asset acquisitions are reported as expenditures and proceeds of general long-term debt are reported as other financing sources. Under the modified accrual basis of accounting, revenues are recognized when both measurable and available. The City considers revenues reported in the governmental funds to be available if they are collectible within sixty (60) days after year-end with the exception of grant revenues that are considered available if collected within one year. Principal revenue sources considered susceptible to accrual include ad valorem taxes, sales taxes, utility franchise fees, grant revenues, and interest. Other revenues, such as fines and forfeitures and service charges, are considered to be measurable and available only when cash is received by the City. Expenditures generally are recorded when the related liability is incurred under the accrual basis of accounting, except for expenditures related to principal and interest on long-term debt, claims and judgments, and compensated absences which are recorded only when payment is due.
Cash and Investments
In order to facilitate cash management, the operating cash of certain funds is pooled into common bank accounts for the purpose of increasing income through combined investment activities. Investments are carried at fair value. Interest earned on investments is recorded in the funds in which the investments are recorded.
Inventories
Inventories, consisting primarily of gasoline and waterline materials, are valued on the average cost basis.
General government fund inventories are accounted for on the purchase method.

City of Fort Smith, Arkansas Notes to Basic Financial Statements
December 31, 2018
59
Capital Assets
Capital assets, which include infrastructure assets constructed since 1980, are reported in the government-wide financial statements and the fund financial statements for proprietary funds.
Capital assets are recorded at cost including interest during the construction period for business-type activities. Contributed property is recorded at acquisition value at the date of contribution. Depreciation is recorded on each class of depreciable property utilizing the straight-line method over the estimated useful lives of the assets, or on the units-of-production method based on filled capacity utilized for the City’s landfill.
The ranges of estimated useful lives, excluding improvements other than buildings for the Sanitation Fund, are as follows:
Capital Assets Useful Life
(Years)
Governmental activities: Buildings 10 to 50 Improvements other than buildings 5 to 50 Infrastructure
Streets 40 Bridges 30 Drainage 20
Machinery and equipment 5 to 20 Business-type activities: Enterprise funds:
Water and sewer system: Buildings 10 to 50 Water system 10 to 50 Sewer system 10 to 50 Machinery and equipment 3 to 10
Sanitation: Buildings 35 Leasehold improvements 10 to 30 Machinery and equipment 3 to 10
Discretely presented component units: Public Library
Fixtures and equipment 5 to 10 Transportation equipment 5
Parking Authority: Buildings 30 Machinery and equipment 3 to 10
Airport Commission: Buildings and improvements 10 to 30 Improvements other than buildings 5 to 20 Machinery and equipment 3 to 15 Furniture and fixtures 3 to 10 Ramps, runways, taxiways and improvements 3 to 50

City of Fort Smith, Arkansas Notes to Basic Financial Statements
December 31, 2018
60
Renewals and betterments of property and equipment are capitalized, whereas normal repairs and maintenance are charged to expense as incurred.
The City’s capitalization policy states that capital assets are defined as assets with an initial value or cost greater than or equal to $20,000 and an estimated useful life of greater than one year. Exceptions are for infrastructure assets that are defined as having a constructed project cost greater than or equal to $250,000.
Property Tax Revenue
Taxes are levied on November 1 and are due and payable at that time. Property taxes attach an enforceable lien on property the first following Monday in February (the lien date). All unpaid taxes levied November 1 become delinquent October 16 of the following year.
Sebastian County is the collecting agent for the levy and remits the collections to the City, net of a collection fee.
The City is permitted by Arkansas State Law to levy taxes up to $0.50 per $100 of assessed valuation on real and personal property for general governmental services, $0.50 per $100 of assessed valuation on real and personal property for the payment of principal and interest on long-term debt, $0.10 per $100 of assessed valuation on real and personal property for the police pension funds and $0.10 per $100 of assessed valuation on real and personal property for the fire pension funds. The combined tax rate levied by the City in 2018 to finance the above operations was $0.70 per $100 of assessed valuation on real and personal property, leaving a tax margin of $0.50 per $100 of assessed valuation on real and personal property. Approximately $7.4 million of additional taxes could be raised per year based on the current year’s assessed value of $1,085,359,343 for real property and $394,705,520 for personal property before the limit is reached.
Compensated Absences
The City allows nonuniformed employees to accumulate unused vacation of up to 160 hours, police to accumulate unused vacation of up to 160 hours, and firefighters to accumulate unused vacation of up to 240 hours for one year. Upon termination, any accumulated unused vacation time will be paid to the employees. Generally, City employees are allowed to accumulate unused sick leave up to a maximum of 120 days. Any accumulated unused sick leave over 45 days for nonuniformed employees hired prior to February 4, 1992, and any accumulated unused sick leave over 90 days for nonuniformed employees hired February 4, 1992, and thereafter is paid upon termination. At the end of term of service, police officers will be paid for any accumulated unused sick leave upon retirement to a maximum amount equal to three month’s salary for police officers at the rank held upon retirement. At the end of term of service, firefighters shall be paid for any accumulated unused sick leave upon retirement to a maximum amount of three month’s salary in the rank of Assistant Chief and above, and to a maximum amount of 728 hours for firefighters in the rank of Captain and below.

City of Fort Smith, Arkansas Notes to Basic Financial Statements
December 31, 2018
61
The City records a liability for compensated absences as the employee earns benefits attributable to services already rendered that are not contingent on a specific event that is outside the control of the City. All compensated absences are accrued when incurred in the government-wide and proprietary fund financial statements. A liability for these amounts is reported in the governmental funds only if they have matured such as a result of employee resignations and retirements.
Risk Management
The City maintains a medical self-insurance plan funded by the City and administered by a third party. The plan provides certain healthcare benefits to active and retired City employees. Substantially all regular, full-time City employees are eligible for these benefits. The City’s costs of providing these benefits, including premiums, totaled $7,742,109 in 2018, and are included in operating expenses in the Employee Insurance Fund. The City contributes fully for each employee and shares in the contribution for any dependents. Retired employees may continue coverage under the City’s policy, but must bear the entire cost of these contributions. See Note 8 on pages 116-121.
The City also makes contributions to fund a self-insured workers’ compensation program. The City contributed $1,153,675 in 2018 to fund this program. There have been no significant reductions in insurance coverage from the prior year and there were no settlements that exceeded insurance coverage in the past three fiscal years.
Sales Taxes
In November 1985, the City began assessing a 1% sales and use tax on retail sales in the City. The tax is collected by the state and remitted to the City, net of a collection fee. Taxes for this purpose totaled $21,503,354 for fiscal year 2018, and are included in the Sales Tax Fund’s sales tax revenues in the accompanying financial statements. Sales tax revenues are restricted for repair, maintenance, and improvement of City streets, bridges, and associated drainage. The City refers the tax to the voters every ten years for reapproval. The tax is currently extended through 2025.
In August 1994, Sebastian County began assessing a 1% sales and use tax on retail sales in the county. Each city within Sebastian County receives a portion of the tax based upon population of the city. Currently, the City receives approximately 78% of the county tax. The tax is collected by the state and remitted to the City, net of a collection fee. Taxes totaled $17,043,995 for fiscal year 2018. These taxes are included in the General Fund’s sales tax revenues. The County refers the tax to the voters every ten years for reapproval. The tax is currently in place through August 2024.
In March 2012, the citizens approved a referendum to continue the 1% sales and use tax on retail sales in the city to refund the Sales and Use Tax Construction Bonds, Series 2006, 2008 and 2009, to fund a new aquatics center, construct a new fire station, purchase and replace fire apparatus, improve existing fire stations, water improvements and wastewater improvements. The 1% sales tax revenue is split at ¾% for the repayment of the Sales and Use Tax Refunding and Construction Bonds, Series 2012 and 2014, and ¼% for fire and parks departments operating and capital asset costs. These taxes are collected by the state and remitted to the City net of a collection fee. The taxes for this purpose totaled $21,503,354 for fiscal year 2018, of which $ 5,375,839 is included in the General Fund’s sales tax revenue and $ 16,127,517 is included in the Sales and Use Tax Bond Fund’s sales tax revenue.

City of Fort Smith, Arkansas Notes to Basic Financial Statements
December 31, 2018
62
Statement of Cash Flows
For purpose of the statement of cash flows, the proprietary funds consider all highly liquid investments (including restricted assets) with a maturity of three months or less when purchased to be cash equivalents, which are classified as cash and restricted cash in the accompanying statement of fund net position.
Long-term Obligations
In the government-wide financial statements, long-term debt and other long-term obligations are reported as liabilities in governmental activities, business-type activities, and component units. These amounts are also reported as liabilities in the fund financial statements for proprietary funds. In governmental funds, long-term liabilities are only recorded to the extent that they are due and payable. Debt premiums, discounts and deferred losses on refunding are generally deferred and amortized over the shorter of refunded debt or refunded debt’s life using the straight-line method that approximates the effective interest method. Long-term debt is reported net of the applicable debt premium or discount and deferred losses on refundings
In the fund financial statements, governmental fund types recognize debt discounts and premiums during the current period. The face amount of the debt issued and discounts given are reported separately as other financing sources. Issuance costs, whether or not withheld from the actual proceeds received, are reported as debt service expenditures.
Restricted Assets
Assets are reported as restricted when constraints placed on them are either externally imposed by creditors, grantors, contributors, or laws or regulations of other governments or are imposed by law through constitutional provisions or enabling legislation.
When both restricted and unrestricted resources are available for use, generally it is the City’s policy to use restricted resources first. For projects funded by tax-exempt debt proceeds and other sources, the debt proceeds are used first.
Certain proceeds of the City’s general government sales and use tax bonds, as well as certain resources set aside for their repayment, are classified as restricted assets on the balance sheet because they are maintained in separate bank accounts and their use is limited by applicable bond covenants. The balance of the restricted asset accounts in the governmental activities are as follows:
Cash 225,621$ Investments 15,164,665 Interest receivable 41,122
Sales taxes receivable 1,377,651
Total restricted assets - governmental activities 16,809,059$

City of Fort Smith, Arkansas Notes to Basic Financial Statements
December 31, 2018
63
Certain proceeds of the City’s enterprise funds revenue bonds, as well as certain resources set aside for their repayment, are classified as restricted assets on the balance sheet because they are maintained in separate bank accounts and their use is limited by applicable bond covenants.
The balances of the restricted assets accounts in the enterprise funds are as follows:
Current Assets:
Cash - water and sewer meter deposit account 64,134$ Cash - water and sewer bond construction account 159,241 Investments - water and sewer depreciation account 1,407,446
Investments - water and sewer meter deposit account 376,290 Investments - water and sewer bond account 8,052,562
Investments - water and sewer bond construction account 78,028,987
Accounts receivable, net - solid waste cleanup program account 209,503 Total current assets - restricted 88,298,163
Noncurrent assets:
Prepaid items and deposits - water and sewer operating account 19,373 Prepaid items and deposits - water and sewer bond construction account 140,719
Total noncurrent assets 160,092
Total restricted assets - enterprise funds 88,458,255$
Unearned Revenue
Unearned revenue consists mainly of grant receipts and convention center rentals.
Estimates
The preparation of financial statements in accordance with accounting principles generally accepted in the United States of America requires management to make estimates and assumptions that affect the reported amounts of assets, deferred outflows of resources, liabilities and deferred inflows of resources and disclosure of contingent assets and liabilities at the date of the financial statements and the reported amounts of revenues and expenses/expenditures during the reporting period. Actual results could differ from these estimates.

City of Fort Smith, Arkansas Notes to Basic Financial Statements
December 31, 2018
64
Pensions
For purposes of measuring the net pension liability, deferred outflows of resources and deferred inflows of resources related to pensions, and pension expense, information about the fiduciary net position of the Fire Relief and Pension Plan, the Police Relief and Pension Plan, the Local Police and Fire Retirement System and the Arkansas Public Employee’s Retirement System (together, the Plans) and additions to/deductions from the Plans’ fiduciary net position have been determined on the same basis as they are reported by the Plans. For this purpose, benefit payments (including refunds of employee contributions) are recognized when due and payable in accordance with the benefit terms. Investments are reported at fair value.
Postemployment Benefits Other than Pensions (OPEB)
For purposes of measuring the net OPEB liability, deferred outflows of resources and deferred inflows of resources and OPEB expense associated with the City's OPEB Plan, information about the fiduciary net position of the Plan and additions to/deletions from the Plan’s fiduciary net position have been determined on the same basis as they are reported by the OPEB plan. For this purpose, the City recognizes benefit payments when due and payable with the benefit terms. Investments are reported at fair value.
Fund Balances – Governmental Funds
The fund balances for the City’s governmental funds are displayed in five components:
Nonspendable – Nonspendable fund balances are not in a spendable form or are required to remain intact.
Restricted – Restricted fund balances may be spent only for the specific purposes stipulated by external resource providers, constitutionally or through enabling legislation. Restrictions may be changed or lifted only with the consent of resource providers.
Committed – Committed fund balances may be used only for the specific purposes determined by ordinance of the Board of Directors (BOD). Commitments may be changed by issuance of an ordinance by the BOD.
Assigned – Assigned fund balances are intended to be used by the City for specific purposes as determined by management. In governmental funds other than the General Fund, assigned fund balances represent the amount that is not restricted or committed. This indicates that resources in other governmental funds are, at a minimum, intended to be used for the purpose of that fund. The Board of Directors (BOD) has by resolution authorized the City Administrator to assign fund balance. The BOD may also assign fund balance as it does when appropriating fund balance to cover a gap between estimated revenue and appropriations in the subsequent year’s appropriated budget.
Unassigned – Unassigned fund balance is the residual classification for the General Fund and includes all amounts not contained in other classifications. The General Fund is the only fund that can report a positive unassigned fund balance. However, in other governmental funds, if the amounts spent is more than the resources available for a specific purpose, then it may need to report a negative amount in unassigned fund balance.

City of Fort Smith, Arkansas Notes to Basic Financial Statements
December 31, 2018
65
The City considers restricted amounts to have been spent when an expenditure is incurred for purposes for which both restricted and unrestricted fund balance is available. The City applies committed amounts first, followed by assigned amounts, and then unassigned amounts when an expenditure is incurred for purposes for which amounts in any of those unrestricted fund balance classifications could be used.
Deferred Outflows/Inflows of Resources
In addition to assets, the statement of net position will sometimes report a separate section for deferred outflows of resources. This separate financial statement element, deferred outflows of resources, represents a consumption of net position that applies to a future period(s) and so will not be recognized as an outflow of resources (expense/ expenditure/reduction of liability) until then. The City has four items that qualify for reporting in this category. The first item is a deferred charge on refunding reported in the government-wide statement of net position and the proprietary funds statement of net position. A deferred charge on refunding results from the difference in the carrying value of refunded debt and its acquisition price. This amount is deferred and amortized to interest expense over the shorter of the life of the refunded or refunding debt. Two of the items are related to pensions, with one being the amount of contributions made to the pension plans after the measurement date, and the other the difference in investment experience between actual earnings and projected earnings on pension plan investments. Deferred outflows related to contributions made after the measurement date will be used in the next year to reduce net pension liability. The remaining amounts will be amortized to pension expense over future periods as shown within Note 7. The fourth item relates to deferred outflows of resources for OPEB items.
In addition to liabilities, the statement of net position and balance sheet – governmental funds will sometimes report a separate section for deferred inflows of resources. This separate financial statement element, deferred inflows of resources, represents an acquisition of net position that applies to a future period(s) and so will not be recognized as an inflow of resources (revenue) until that time. The government has four items that qualify as deferred inflows of resources as of December 31, 2018. The items reported in the statements are unavailable revenues in the governmental funds balance sheet, deferred inflows-pension in the government-wide statement of net position, deferred amounts on refunding and deferred inflows related to OPEB items in the government-wide statement of net position and the proprietary funds statement of net position. Unavailable revenue arises under the modified accrual basis of accounting and qualifies for reporting in this category. Accordingly, this item is only reported in the governmental funds balance sheet. Governmental funds report unavailable revenue from property taxes. These amounts are deferred and recognized as an inflow of resources in the period that the amounts become available. Deferred inflows-pension consists of the difference between the expected and actual experience related to the pension plans as well as the net difference in investment experience between actual earnings and projected earnings on pension plan investments. Deferred inflows- pension are amortized over future periods as shown within Note 7.
Note 2: Cash and Investments
The City maintains a cash and investment pool that is available for use by all City funds. In addition, investments are separately held by some of the City’s funds.

City of Fort Smith, Arkansas Notes to Basic Financial Statements
December 31, 2018
66
The City follows GASB Statement 3, Accounting and Financial Reporting for Certain Investments and for External Investment Pools, as amended by GASB Statement 40, Deposit and Investment Risk Disclosure and GASB Statement 79, Certain External Investment Pools and Pool Participants. The investments and deposits of the primary government are stated at quoted fair values. As a result, a net unrealized loss of $(25,666)is recorded as a decrease in fair value of investments for the primary government in 2018 related to the City’s governmental funds.
Deposits
Custodial credit risk is the risk that in the event of a bank failure, a government’s deposits may not be returned to it. The City’s deposit policy for custodial credit risk requires compliance with the provisions of state law.
State law requires collateralization of all deposits with federal depository insurance; bonds and other obligations of the U.S. Treasury, U.S. agencies or instrumentalities or the state of Arkansas. No legal opinion has been obtained regarding the enforceability of any of the collateral agreements.
At December 31, 2018, none of the City’s bank balances were uninsured and uncollateralized. These balances were exposed to custodial credit risk. Independent third parties held securities in the City’s name as collateral at December 31, 2018. The bank balances and carrying amount of the City’s deposits held as of December 31, 2018 were as follows:
Pooled and Nonpooled Funds
Bank Carrying
Description Balance Amount
Demand deposits 194,691,576$ 194,257,340$
Certificates of deposit 8,495,272 8,495,272
203,186,848$ 202,752,612$
Component Units
At year-end, the carrying amount of the Public Library’s deposits was $745,142 and the bank balance was $889,692 . At December 31, 2018, none of the balances were exposed to custodial credit risk.
At year-end, the carrying amount of the Airport Commission’s deposits was $3,405,336 and the bank balance was $4,805,176 . At December 31, 2018, none of the balances were exposed to custodial credit risk.

City of Fort Smith, Arkansas Notes to Basic Financial Statements
December 31, 2018
67
Investments
State statutes and City ordinances authorize the City to invest funds in direct obligations of the U.S. Government; obligations on which the principal and interest are fully guaranteed or are fully secured, insured or covered by commitments or agreements to purchase by the U.S. Government; obligations of agencies and instrumentalities created by an act of the United States Congress and authorized thereby to issue securities or evidence of indebtedness, regardless of guarantee of repayment by the U.S. Government; obligations of political subdivisions of the United States; certain obligations issued by the State Board of Education; short-term warrants of political subdivisions of the State of Arkansas and municipalities; the sale of federal funds with a maturity of not more than one business day; demand, savings or time deposits fully insured by a federal deposit insurance agency; repurchase agreements that are fully insured by obligations of the U. S. government, any U. S. state or any political subdivision thereof; securities of, or other interest in, any open-end type investment company or investment trust registered under the Investment Company Act of 1940, and which is considered a money market fund, provided that the portfolio is limited principally to U. S. Government obligations and the investment company or trust takes delivery of collateral either directly or through an authorized custodian; and bank certificates of deposit.
Arkansas statutes also authorize the City to invest no more than 20 percent of its capital base in corporate debt obligations; revenue bond issues of any U. S. state, municipality, or political subdivision; industrial development bonds for corporate obligors issued through any U. S. state or political subdivision; securities or interest in an open-end or closed-end management type investment company or trust registered under the Investment Company Act of 1940 with certain limitations; securities or interests issued, assumed, or guaranteed by certain international banks; and uninsured demand, savings or time deposits or accounts or any depository institution chartered by the United States, any U.S. state, or the District of Columbia.
The City pension funds are authorized to invest in obligations of the U.S. Treasury, U.S. agencies and instrumentalities, commercial paper, corporate stocks, bonds, and mutual funds.
The City’s investments, including accrued interest, held as of December 31, 2018, were as follows:
Pooled and Nonpooled Funds
Investment InvestmentFair Maturities Maturities
Description Value Less than 1 Year 1-5 Years
U.S. Treasury Bills 4,042,780$ 4,042,780$ -$
U.S. Treasury Notes 20,537,510 - 20,537,510
24,580,290$ 4,042,780$ 20,537,510$

City of Fort Smith, Arkansas Notes to Basic Financial Statements
December 31, 2018
68
In compliance with GASB 72, the City categorizes its fair value measurements within the fair value hierarchy established by generally accepted accounting principles. The hierarchy is based on the valuation inputs used to measure the fair value of the asset. Level 1 inputs are quoted prices in active markets for identical assets; Level 2 inputs are significant other observable inputs; Level 3 inputs are significant unobservable inputs.
The City has the following recurring fair value measurements as of December 31, 2018:
U.S. government obligations of $24,580,290 are valued using the option-adjusted discounted cash flow model (Level 1 inputs).
Money market funds of $424,592, equities of $179,408 and fixed income securities of $881,805 are valued using quoted market prices (Level 1 inputs).
Component Units
At year-end, the Advertising & Promotion Commission held $396,975 in U.S. Treasury Bills. The Advertising & Promotion Commission reports investments at fair value and the maturity dates of the bills are less than one year. The U.S. government obligations of $396,975 are valued using the option-adjusted discount cash flow model (Level 1 inputs).
At year-end, the Public Library held $301,879 in money market funds. The Public Library reports investments at fair value.
At year-end, the Parking Authority fund held $463,906 in U.S. Treasury Bills. The Parking Authority reports investments at fair value and the maturity dates of the bills are less than one year. The U.S. government obligations of $463,906 are valued using the option-adjusted discount cash flow model (Level 1 inputs).
At year-end, the Airport Commission held $78,100 in money market mutual funds. The Airport Commission reports investments at fair value.
Interest Rate Risk. The City’s investment policy does not limit investment maturities as a means of managing its exposure to fair value losses arising from increasing interest rates.
Credit Risk. The City’s investments at December 31, 2018, are securities issued and guaranteed by the U.S. Government.
Custodial Credit Risks. Custodial credit risk is the risk that in the event of the failure of the counterparty the City will not be able to recover the value of its investment or collateral securities that are in the possession of an outside party. While the City’s investment policy does not directly address custodial credit risk, all investments held by the City or by an agent of the City are in the City’s name.

City of Fort Smith, Arkansas Notes to Basic Financial Statements
December 31, 2018
69
The following schedules reconcile the carrying amounts of deposits and investments to the government-wide statement of net position:
Primary Government:
Carrying value of deposits - Pooled and nonpooled funds 202,752,612$
Deposits classified as investments (178,569,572)
24,183,040$
Cash as reported on the government-widestatement of net position 23,734,044$
Restricted cash as reported on the government-wide
statement of net position 448,996
24,183,040$
Carrying value of investments -Pooled and nonpooled funds 24,580,290$
Deposits classified as investments 178,569,572
203,149,862$
As reported on the government-widestatement of net position:
Investments 100,078,790$ Restricted investments 103,029,950 Restricted interest receivable 41,122
203,149,862$

City of Fort Smith, Arkansas Notes to Basic Financial Statements
December 31, 2018
70
Component Units:
GovernmentalCarrying value of deposits -
Public Library 745,142$ Carrying value of investments -
Advertising and Promotion
Commission 396,975 Public Library 301,879
1,443,996$
As reported on the government-widestatement of net position:
Cash 745,142$ Investments 698,854
1,443,996$
Business typeCarrying value of deposits -
Airport Commission 4,739,863$ Carrying value of investments -
Parking Authority 463,906 Airport Commission 78,100
5,281,869$
As reported on the government-widestatement of net position:
Cash 2,369,577$ Investments 1,876,533 Restricted cash 79,866 Restricted investments 955,893
5,281,869$

City of Fort Smith, Arkansas Notes to Basic Financial Statements
December 31, 2018
71
Note 3: Capital Assets
Capital assets activity for the year ended December 31, 2018 was as follows:
Primary Government:
December 31, Deletions/ December 31,2017 Additions Transfers 2018
Governmental activities:Capital assets not being depreciated
Land 27,150,846$ 200,000$ 20,645$ 27,371,491$ Construction in progress 33,941,453 15,924,405 (37,936,316) 11,929,542
Total capital assetsnot being depreciated 61,092,299 16,124,405 (37,915,671) 39,301,033
Capital assets being depreciatedBuildings 86,575,564 76,567 25,575 86,677,706 Improvements other than
buildings 20,418,282 - 3,748,989 24,167,271 Infrastructure 394,704,259 - 32,078,177 426,782,436 Machinery and equipment 49,074,218 1,699,624 1,882,425 52,656,267
Total depreciable capitalassets at historical cost 550,772,323 1,776,191 37,735,166 590,283,680
Less accumulated depreciation forBuildings 29,028,097 1,868,977 - 30,897,074 Improvements other than
buildings 10,831,218 834,841 - 11,666,059 Infrastructure 131,472,326 9,992,340 - 141,464,666 Machinery and equipment 28,813,265 3,093,060 (166,289) 31,740,036
Total accumulated depreciation 200,144,906 15,789,218 (166,289) 215,767,835
Capital assets beingdepreciated, net 350,627,417 (14,013,027) 37,901,455 374,515,845
Governmental activitiescapital assets, net 411,719,716$ 2,111,378$ (14,216)$ 413,816,878$

City of Fort Smith, Arkansas Notes to Basic Financial Statements
December 31, 2018
72
Primary Government:
December 31, Deletions/ December 31,2017 Additions Transfers 2018
Business-type activities:Capital assets not being depreciated:
Land 14,261,392$ 198,627$ -$ 14,460,019$ Construction in progress 22,987,983 23,650,971 (23,497,599) 23,141,355
Total capital assetsnot being depreciated 37,249,375 23,849,598 (23,497,599) 37,601,374
Capital assets being depreciated:Water system 407,683,157 771,780 3,070,582 411,525,519 Sewer system 301,311,737 1,879,730 18,915,373 322,106,840 Buildings 6,853,786 - 280,005 7,133,791 Improvements other than
buildings 23,253,316 - - 23,253,316 Leasehold improvements 709,952 - - 709,952 Machinery and equipment 33,835,775 5,246,202 140,105 39,222,082
Total depreciable capitalassets at historical cost 773,647,723 7,897,712 22,406,065 803,951,500
Less accumulated depreciation for:Water system 124,614,883 7,260,089 - 131,874,972 Sewer system 92,550,792 5,638,738 - 98,189,530 Buildings 1,506,774 210,584 - 1,717,358
Improvements other thanbuildings 20,907,627 276,256 - 21,183,883
Leasehold improvements 709,952 - - 709,952 Machinery and equipment 20,444,060 3,297,100 81,014 23,822,174
Total accumulated depreciation 260,734,088 16,682,767 81,014 277,497,869
Capital assets being
depreciated, net 512,913,635 (8,785,055) 22,325,051 526,453,631
Business-type activitiescapital assets, net 550,163,010$ 15,064,543$ (1,172,548)$ 564,055,005$

City of Fort Smith, Arkansas Notes to Basic Financial Statements
December 31, 2018
73
Depreciation expense was charged to functions/programs of the primary government as follows:
Governmental activities:General government -
Administration 51,270$ Legal 544 Finance 62,323
Public safety - Police 1,173,573 Fire 1,185,953
Public works - Streets 10,022,692 Traffic Control 515,264
Community services - Health and social services 8,465 Parks and recreation 1,692,825 Convention center 683,292 Transit 379,926 Housing and rehabilitation 13,091
Total governmental activities depreciation expense 15,789,218
Business type activities:Water and Sewer 15,035,344 Sanitation 1,647,423
Total business-type activities depreciation expense 16,682,767
Total depreciation expense 32,471,985$
Reconciliation of capital asset additions to the capital outlay in the Statement of Revenues, Expenditures and Changes in Fund Balances-Governmental Funds:
Capital asset activity (on page 71):Additions for capital assets not being
depreciated 16,124,405$ Additions for capital assets being
depreciated 1,776,191
17,900,596$
Capital outlay reported on the statementof revenues, expenditures and changesin fund balances - governmental funds 19,644,191$
Less: capital contributions to the Water and Sewer Fund (1,743,595)
17,900,596$

City of Fort Smith, Arkansas Notes to Basic Financial Statements
December 31, 2018
74
A non-cash contribution of $347,454 was sent from governmental activities to the water and sewer fund. Therefore, capital contributions to the Water and Sewer Fund and capital contributions per the Statement of Revenues, Expenses and Changes in Fund Net Position – Proprietary Funds totaled $1,743,595.
Capital asset activity for the year ended December 31, 2018, for the major enterprise funds was as follows:
Primary Government:
December 31, Additions/ Deletions/ December 31,2017 Transfers Transfers 2018
Water and Sewer Fund:Capital assets not being depreciated:
Land 13,887,620$ 198,627$ -$ 14,086,247$ Construction in progress 22,917,430 23,650,971 (23,427,046) 23,141,355
Total capital assetsnot being depreciated: 36,805,050 23,849,598 (23,427,046) 37,227,602
Capital assets being depreciated:Buildings 1,715,650 - 209,452 1,925,102 Water system 407,683,157 771,780 3,070,582 411,525,519 Sewer system 301,311,737 1,879,730 18,915,373 322,106,840
Machinery and equipment 16,745,153 3,877,914 13,254 20,636,321
Total depreciable capitalassets at historical cost 727,455,697 6,529,424 22,208,661 756,193,782
Less accumulated depreciation for:Buildings 66,490 53,920 - 120,410 Water system 124,614,883 7,260,089 - 131,874,972 Sewer system 92,550,792 5,638,738 - 98,189,530 Machinery and equipment 8,534,776 2,082,597 (15,266) 10,602,107
Total accumulated depreciation 225,766,941 15,035,344 (15,266) 240,787,019
Capital assets being depreciated, net 501,688,756 (8,505,920) 22,223,927 515,406,763
Total Water and Sewer Fund
capital assets, net 538,493,806$ 15,343,678$ (1,203,119)$ 552,634,365$

City of Fort Smith, Arkansas Notes to Basic Financial Statements
December 31, 2018
75
December 31, Deletions/ December 31,2017 Additions Transfers 2018
Sanitation Fund:Capital assets not being depreciated:
Land 373,772$ -$ -$ 373,772$ Construction in progress 70,553 - (70,553) -
Total capital assetsnot being depreciated: 444,325 - (70,553) 373,772
Capital assets being depreciated:Buildings 5,138,136 - 70,553 5,208,689 Improvements other than buildings 23,253,316 - - 23,253,316 Leasehold improvements 709,952 - - 709,952
Machinery and equipment 17,090,622 1,368,288 126,851 18,585,761
Total depreciable capitalassets at historical cost 46,192,026 1,368,288 197,404 47,757,718
Less accumulated depreciation for:Buildings 1,440,284 156,664 - 1,596,948 Improvements other
than buildings 20,907,627 276,256 - 21,183,883 Leasehold improvements 709,952 - - 709,952 Machinery and equipment 11,909,284 1,214,503 96,280 13,220,067
Total accumulated depreciation 34,967,147 1,647,423 96,280 36,710,850
Capital assets being depreciated, net 11,224,879 (279,135) 101,124 11,046,868
Total Sanitation fund
capital assets, net 11,669,204$ (279,135)$ 30,571$ 11,420,640$

City of Fort Smith, Arkansas Notes to Basic Financial Statements
December 31, 2018
76
Component Units-
December 31, Deletions/ December 31,2017 Additions Transfers 2018
Governmental Activities:
Public LibraryCapital assets not being depreciated:
Land 422,132$ -$ -$ 422,132$ Rare book collection 5,000 - - 5,000
Capital assets not being depreciated 427,132 - - 427,132
Capital assets being depreciated:Equipment 1,423,838 34,243 - 1,458,081 Transportation equipment 139,952 - - 139,952
Total depreciable capital 1,563,790 - 1,598,033 assets at historical cost -
Less accumulated depreciation 1,201,939 66,455 - 1,268,394
Capital assets being depreciated, net 361,851 (32,212) - 329,639
Governmental activitiescapital assets, net
Public Library 783,983$ (32,212)$ -$ 756,771$

City of Fort Smith, Arkansas Notes to Basic Financial Statements
December 31, 2018
77
December 31, Deletions/ December 31,2017 Additions Transfers 2018
Business-type activities:
Parking AuthorityCapital assets
not being depreciated:Land 1,359,160$ -$ -$ 1,359,160$
Capital assets being depreciated:Improvements other than buildings 2,490,438 20 - 2,490,458 Machinery and equipment 73,525 30,006 - 103,531
Total depreciable capitalassets at historical cost 2,563,963 30,026 - 2,593,989
Less accumulateddepreciation for:
Improvements other than buildings 2,490,438 20 - 2,490,458 Machinery and equipment 73,525 250 - 73,775 Total accumulated
depreciation 2,563,963 270 - 2,564,233
Capital assets being depreciated, net - 29,756 - 29,756
Business-type activitiescapital assets, net
Parking Authority 1,359,160$ 29,756$ -$ 1,388,916$

City of Fort Smith, Arkansas Notes to Basic Financial Statements
December 31, 2018
78
December 31, Deletions/ December 31,2017 Additions Transfers 2018
Airport Commission:Capital assets
not being depreciated:Land 6,324,706$ 51,757$ 455,217$ 6,831,680$
Construction in progress 1,247,870 3,383,616 (476,290) 4,155,196 Total capital assets notbeing depreciated 7,572,576 3,435,373 (21,073) 10,986,876
Capital assets being depreciated:Buildings 22,091,548 67,683 - 22,159,231
Runways & other airport infrastructure 55,412,227 - - 55,412,227
Equipment, furniture & fixtures, and other 12,295,921 366,047 (89,734) 12,572,234
Total depreciable capitalassets at historical cost 89,799,696 433,730 (89,734) 90,143,692
Less accumulateddepreciation for:Buildings 13,483,822 500,021 - 13,983,843
Runways & other airport infrastructure 37,800,339 1,642,194 - 39,442,533
Equipment, furniture & fixtures, and other 9,979,623 314,318 (110,426) 10,183,515 Total accumulated
depreciation 61,263,784 2,456,533 (110,426) 63,609,891
Capital assets
being depreciated, net 28,535,912 (2,022,803) 20,692 26,533,801 Business-type activities
capital assets, netAirport Commission 36,108,488$ 1,412,570$ (381)$ 37,520,677$

City of Fort Smith, Arkansas Notes to Basic Financial Statements
December 31, 2018
79
Construction-in-progress is composed of the following:
Expended toPrimary December 31,
Appropriation 2018 CommittedPrimary government:
Governmental activities 56,175,515$ 11,929,542$ 44,245,973$ Business-type activities
Water and sewer capital improvements 39,192,303 23,141,355 16,050,948
Total 95,367,818$ 35,070,897$ 60,296,921$
The City’s governmental construction projects include major street and drainage improvements, a new sports complex, additional trails and greenways, and a new fire training center. Funding is in place for these projects. The water and sewer capital improvement projects include the water and wastewater projects that are being funded by the Sales and Use Tax Refunding and Construction Bonds, Series 2012 and 2014. These assets are being transferred to the Water and Sewer Fund as contributed capital from a general government fund. Funds are available for these projects. The water and sewer capital improvement projects also include the neighborhood waterline improvements, wet weather wastewater improvements, and plant designs that are funded by the 2008 water and sewer system revenue bonds and utility operating revenues. The sanitation project currently includes construction of a new and expanded scale house for operations at the landfill and construction of a new road to the landfill. Funds are in place for both of these projects.
Reconciliation of Capital Assets to Net Investment in Capital Assets on the Statement of Net Position:
Water andGovernmental Sewer Sanitation Total
Primary Government:Net book value 413,816,878$ 552,634,365$ 11,420,640$ 564,055,005$ Current and noncurrent debt (76,178,439) (250,475,721) - (250,475,721) Restricted assets -
unspent bond/net proceeds - 78,028,987 - 78,028,987
Net investment in capital assets 337,638,439$ 380,187,631$ 11,420,640$ 391,608,271$
Governmental Business-TypeComponent Units:
Net book value 756,771$ 38,909,593$ Current and noncurrent debt - (1,839,193)
Net investment in capital assets 756,771$ 37,070,400$
Business-Type

City of Fort Smith, Arkansas Notes to Basic Financial Statements
December 31, 2018
80
Note 4: Long-Term Liabilities
Changes in long-term liabilities for the year ended December 31, 2018 were as follows:
Primary Government-
Balance Balance
January 1, December 31, Amount Due
2018 Increases Decreases 2018 in One Year
(as restated)
Governmental Activities:
Bonds Payable -
Sales tax bonds 84,400,000$ -$ 12,735,000$ 71,665,000$ 7,670,000$
Issuance premium 4,516,358 - 486,577 4,029,781 -
Sales tax bonds payable, net 88,916,358 - 13,221,577 75,694,781 7,670,000
Compensated Absences 1,978,716 157,054 - 2,135,770 128,146
Employee insurance/workers'
compensation 1,200,115 366,319 399,565 1,166,869 1,166,869
OPEB liabilities 17,952,697 - 10,665,890 7,286,807 - Net pension liabilities 62,573,908 7,879,396 * - * 70,453,304 -
Total other long-term liabilities 83,705,436 8,402,769 11,065,455 81,042,750 1,295,015
Total governmental
activities long-term liabilities 172,621,794$ 8,402,769$ 24,287,032$ 156,737,531$ 8,965,015$
Business-Type Activities
Bonds Payable -
Revenue bonds 168,905,000$ 130,680,000$ 72,430,000$ 227,155,000$ 6,360,000$
Add issuance premium 8,241,166 16,248,445 1,168,890 23,320,721 -
Revenue bonds payable, net 177,146,166 146,928,445 73,598,890 250,475,721 6,360,000
Compensated absences 1,050,812 57,625 16,532 1,091,905 65,514
Claims Payable-Employee insurance
and worker's compensation 450,300 431,284 310,189 571,395 571,395
OPEB liabilities 10,498,487 - 6,237,266 4,261,221 -
Closure/postclosure landfill costs 7,930,886 320,645 - 8,251,531 -
Total other long-term liabilities 19,930,485 809,554 6,563,987 14,176,052 636,909 Total business-type activities
long-term liabilities 197,076,651$ 147,737,999$ 80,162,877$ 264,651,773$ 6,996,909$
* Net increase is shown.

City of Fort Smith, Arkansas Notes to Basic Financial Statements
December 31, 2018
81
Reconciliation of governmental activities to the government-wide statement of net position:
Current Liabilities:
Current portion of long-term debt 7,670,000$
Noncurrent liabilities:
Due within one year 1,295,015
Due in more than one year 147,772,516
Total governmental activities long-term liabilities 156,737,531$
Reconciliation of business-type activities to the government-wide statement of net assets:
Current Liabilities:
Current portion of long-term debt 6,360,000$
Noncurrent liabilities:
Due within one year 636,909
Due in more than one year 257,654,864
Total business-type activities long-term liabilities 264,651,773$
The claims payable for employee insurance and workers’ compensation are related to the internal service fund allocations. The internal service funds serve governmental funds as well as the two enterprise funds, therefore, the claims allocations are applied to governmental and business-type activities as applicable. For governmental activities, the General Fund generally liquidates claims and compensated absences.
The other postemployment benefit (OPEB) liabilities are related to healthcare benefits for retirees. The OPEB liabilities apply to governmental and business-type activities as applicable. For governmental activities, the General Fund generally liquidates OPEB liabilities.

City of Fort Smith, Arkansas Notes to Basic Financial Statements
December 31, 2018
82
Changes in long-term liabilities for the year ended December 31, 2018 for the major enterprise funds were as follows:
Balance Balance
January 1, December 31, Amount Due
2018 Increases Decreases 2018 in One Year
(as restated)
Water and Sewer Fund:
Bonds Payable -
Revenue bonds 168,905,000$ 130,680,000$ 72,430,000$ 227,155,000$ 6,360,000$
Add issuance premium 8,241,166 16,248,445 1,168,890 23,320,721 -
Revenue bonds payable, net 177,146,166 146,928,445 73,598,890 250,475,721 6,360,000
Compensated absences 840,880 30,759 16,532 855,107 51,306 OPEB liabilities 7,795,624 - 4,631,465 3,164,159 -
Other long-term liabilities 8,636,504 30,759 4,647,997 4,019,266 51,306
Total water and sewer fund 185,782,670$ 146,959,204$ 78,246,887$ 254,494,987$ 6,411,306$
Sanitation Fund:
Compensated absences 209,932$ 26,866$ -$ 236,798$ 14,208$
OPEB liabilities 2,702,863 - 1,605,801 1,097,062 -
Closure/postclosure landfill costs 7,930,886 320,645 - 8,251,531 -
Other long-term liabilities 10,843,681 347,511 1,605,801 9,585,391 14,208
Total sanitation fund 10,843,681$ 347,511$ 1,605,801$ 9,585,391$ 14,208$
Reconciliation of changes in long-term liabilities for the major enterprise funds to the statement of fund net position for proprietary funds:
Water and Sanitation
Sewer Fund FundCurrent Liabilities
Revenue bonds payable 6,360,000$ -$
Accrued vacation and sick leave 51,306 14,208
Noncurrent Liabilities:
Landfill closure and
postclosure care - 8,251,531
Revenue bonds, net 244,115,721 -
Accrued vacation and sick leave 803,801 222,590
OPEB liabilities 3,164,159 1,097,062
Total long-term liabilities for
major enterprise funds 254,494,987$ 9,585,391$

City of Fort Smith, Arkansas Notes to Basic Financial Statements
December 31, 2018
83
Changes in long-term liabilities for the year ended December 31, 2018, for the component units were as follows:
Balance Balance
December 31, December 31, Amount Due
2018 Increases Decreases 2018 in One Year
Component Units:
Business-type activities
Parking Authority:
Compensated absences 661$ -$ 119$ 542$ 33$
Airport Commission:
Bonds payable - revenue bonds 2,110,000 - 200,000 1,910,000 210,000
Total business-type activities 2,110,661$ -$ 200,119$ 1,910,542$ 210,033$
Governmental activities
Public LibraryNet pension liabilities 1,742,013$ -$ (103,231)$ 1,638,782$ -$
Total governmental activities 1,742,013$ -$ (103,231)$ 1,638,782$ -$
Total Component Units 3,852,674$ -$ 96,888$ 3,549,324$ 210,033$
Operating Leases
The City leases office space under a noncancelable operating lease. Total costs for the lease to the General Fund were $310,000 for the year ended December 31, 2018. The future minimum lease payments for the lease is $362,000 with $310,000 due in 2019 and $52,000 due in 2020.
Capital Leases
In accordance with Amendment 78 of the Arkansas Constitution, Arkansas state statutes limit the amount of short-term financing, including capital leases, the City may have in any fiscal year to five percent (5%) of the assessed valuation of property within the City. The limit applies to the reporting entity governmental activities. The governmental activities had no capital leases payable considered short-term financing as of December 31, 2018. The limit as of December 31, 2018 was $74.0 million; therefore, management believes the City is in compliance with state statutes for short-term financing at December 31, 2018.

City of Fort Smith, Arkansas Notes to Basic Financial Statements
December 31, 2018
84
Sales and Use Tax Bonds- Governmental Activities
On May 22, 2012, the City issued $110,660,000 Sales and Use Tax Refunding and Improvement Bonds, Series 2012. The bonds were issued to advance refund the outstanding Sales and Use Tax Refunding and Improvement Bonds, Series 2006, Sales and Use Tax Bonds, Series 2008, and Sales and Use Tax & Water and Sewer Revenue Bonds, Series 2009. The 2006 and 2008 Bonds were redeemed on September 1, 2013 and the 2009 Bonds were redeemed September 1, 2014. The reacquisition price exceeded the carrying amount of the old debt by $1,483,000. The unamortized amount is netted against the new debt and is being amortized over the refunded debt’s life using the straight-line method. The bonds were also issued to fund $39.4 million in wastewater improvements; $20.7 million in water system improvements; $8.6 million in fire improvements; and $4 million in aquatic center improvements. The bonds are due May 1, 2013 through May 1, 2027 in varying amounts with interest ranging from 1% to 5%, payable semiannually. The effective interest rate on the 2012 bonds is 3.05%. On March 13, 2012, voters approved the reauthorization of two ½% sales and use taxes for these bonds and for operation costs. The bonds are supported by .75% sales and use tax. The bonds are subject to mandatory redemption in inverse order from surplus tax collections on any payment date. During 2014, $1,555,000 of the 2012 bonds was called. The remaining .25% sales and use tax is used for fire and park operations.
On February 27, 2014, the city issued $34.295 million in Sales and Use Tax Bonds, Series 2014. Citizens approved the bonds in a referendum on March 13, 2012. These are additional bonds for water and wastewater improvements. A total of $6 million is allocated to water improvements including transmission lines, water storage and pump stations. A total of $28 million is allocated to wastewater improvements including wet weather sewer improvements. The 2014 Bonds are supported by the ¾% local sales and use tax that supports the 2012 Sales and Use Tax Bonds and were issued on parity with the 2012 Bonds. The 2014 Bonds carry interest ranging from 2% to 5% through May 1, 2029. The bonds are subject to mandatory redemption in inverse order on any interest payment date from the collection of excess sales taxes. During 2014, $1,555,000 of the 2012 bonds were called.
Bond Retirement - The City is required to maintain a debt service reserve equal to $5,533,000 during the life of the 2012 Bonds and $1,714,750 during the life of the 2014 Bonds. The City held U.S. Treasury Bills at a carrying amount of $5,495,820 at December 31, 2018 for the 2012 Bonds and $1,713,733 for the 2014 Bonds. The U.S. Treasury Bills for the 2012 Bonds and 2014 Bonds met requirements once interest was considered.

City of Fort Smith, Arkansas Notes to Basic Financial Statements
December 31, 2018
85
Maturity Schedule – The debt service requirements for the Sales Tax Bonds at December 31, 2018 is as follows:
Sales Tax Bonds Maturity SchedulePrincipal Interest
2019 7,670,000$ 2,758,475$ 2020 7,960,000 2,459,550 2021 8,270,000 2,142,450 2022 8,590,000 1,812,750 2023 8,930,000 1,421,450
2024-2028 30,245,000 2,040,035
Total 71,665,000 12,634,710$
Add unamortized bond premium 4,029,781
Net bonds outstanding at December 31, 2018 75,694,781$

City of Fort Smith, Arkansas Notes to Basic Financial Statements
December 31, 2018
86
Revenue Bonds - Business-Type Activities
Revenue bonds outstanding at December 31, 2018, are comprised of the following individual issues:
Water and Sewer:
$18,920,000 of Series 2011 Water and Sewer Refunding Revenue Bonds; due in varying amounts through October 1, 2023 with interest ranging from 2% to 4.5% payable semiannually $ 8,120,000
$13,250,000 of Series 2012 Water and Sewer Refunding Revenue Bonds;
due in varying amounts through October 1, 2019 with interest ranging from 2% to 3.807% payable semiannually 2,070,000
$35,000,000 of Series 2015 Water and Sewer Refunding and
Construction Revenue Bonds; due in varying amounts through October 1, 2040 with interest ranging from 2% to 4% payable semiannually 32,340,000
$56,955,000 of Series 2016 Water and Sewer Refunding Revenue Bonds;
due in varying amounts through October 1, 2032 with interest ranging from 1.7% to 4.4% payable semiannually 53,945,000
$130,680,000 of Series 2018 Water and Sewer Refunding and
Construction Revenue Bonds; due in varying amounts through October 1, 2035 with interest ranging from 2% to 5% payable semiannually 130,680,000
Bonds outstanding, December 31, 2018 227,155,000 Unamortized bond premium 23,320,721
Net bonds outstanding, December 31, 2018 $ 250,475,721

City of Fort Smith, Arkansas Notes to Basic Financial Statements
December 31, 2018
87
Water and Sewer-
On August 6, 2008, the City issued $117,420,000 Water and Sewer Refunding and Construction Revenue Bonds, Series 2008. The 2008 Bonds were issued to advance refund the 2002A Bonds and to provide funding for improvements to the water and sewer facilities. The sewer improvements include extensions in growth areas of the City and the water improvements include the Mountainburg water treatment plant rehabilitation and expansion, the replacement of neighborhood water lines, and the Howard Hill elevated water storage tank. The 2008 Bonds advance refunded $66.475 million of the outstanding Series 2002A Bonds. The carrying amount of the old debt exceeded the reacquisition price by $440,770. The unamortized amount is netted against the new debt and is being amortized over the refunded debt’s life using the straight-line method. The 2008 Bonds were issued as additional bonds on a parity of security with the 2005B and 2007 bonds. In December 2016, the City partially refunded the outstanding Series 2008 Bonds with the issuance of the Water and Sewer Refunding Revenue Bonds, Series 2016. In September 2018, the City fully refunded the outstanding Series 2008 Bonds with the issuance of the Water and Sewer Refunding and Construction Revenue Bonds, Series 2018.
On November 10, 2011, the City issued $18,920,000 Water and Sewer Refunding Revenue Bonds, Series 2011, to refund the outstanding $2,325,000 of 2002B Series Bonds and to refund the outstanding $16,595,000 of 2002C Series Bonds. The reacquisition price exceeded the carrying amount of the old debt by $93,625. The unamortized amount is netted against the new debt and is being amortized over the refunded debt’s life using the straight-line method. The deferred amount on refunding was $31,209 as of December 31, 2018. The City completed the refunding to obtain an economic gain of $1,372,849 over the remaining life of the bonds.
On February 23, 2012, the City issued $13,250,000 Water and Sewer Revenue Refunding Bonds, Series 2012, to refund the outstanding 2005A Water and Sewer Revenue Refunding Bonds. The bonds are due in varying amounts on October 1, 2012 through 2019 with interest rates ranging from 2% to 3.807%, payable semiannually. The reacquisition price exceeded the carrying amount of the old debt by $265,391. The unamortized amount is netted against the new debt and is being amortized over the refunded debt’s life using the straight-line method. The deferred amount on refunding was $0 as of December 31, 2018. The City completed the refunding to reduce its total debt service payments over the next seven (7) years by $1,803,168 and to obtain an economic gain of $1,115,323.
On December 1, 2015, the City issued $35,000,000 Water and Sewer Refunding and Construction Revenue Bonds, Series 2015, to finance the cost of acquiring, constructing, and equipping water and sewer improvements, current refunding of the City’s Water and Sewer Revenue Bonds, Series 2005B, providing a debt service reserve and paying costs incidental thereto. The bonds are due in varying amounts on October 1, 2015 through 2040 with interest rates ranging from 2% to 4%, payable semiannually. The old amount of debt exceeded the reacquisition price by $59,621. The unamortized amount is netted against the new debt and is being amortized over the refunded debt’s life using the straight-line method. The deferred amount on refunding was $41,735 as of December 31, 2018. The City completed the refunding to reduce its total debt service payments over the next ten (10) years by $547,391 and to obtain an economic gain of $493,245.

City of Fort Smith, Arkansas Notes to Basic Financial Statements
December 31, 2018
88
On December 1, 2016, the City issued $56,955,000 Water and Sewer Refunding Revenue Bonds, Series 2016, to finance the cost of acquiring, constructing, and equipping water and sewer improvements, current full refunding of the City’s Water and Sewer Revenue Bonds, Series 2007 and partial refunding of the City’s Water and Sewer Revenue Bonds, Series 2008, providing a debt service reserve and paying costs incidental thereto. The bonds are due in varying amounts on October 1, 2017 through 2032 with interest rates ranging from 1.7% to 4.4%, payable semiannually. The reacquisition price exceeded the old amount of debt exceeded by $3,092,522. The unamortized amount is netted against the new debt and is being amortized over the refunded debt’s life using the straight-line method. The deferred amount on refunding was $2,530,346 as of December 31, 2018. The City completed the refunding to reduce its total debt service payments over the next fifteen (15) years by $4,629,701 and to obtain an economic gain of $3,691,784.
On September 1, 2018, the City issued $130,680,000 Water and Sewer Refunding and Construction Revenue Bonds, Series 2018, to finance the cost of acquiring, constructing, and equipping water and sewer improvements, current full refunding of the City’s Water and Sewer Revenue Bonds, Series 2008, providing a debt service reserve and paying costs incidental thereto. The bonds are due in varying amounts on October 1, 2020 through 2035 with interest rates ranging from 2% to 5%, payable semiannually beginning April 1, 2019 through October 1, 2035. The reacquisition price exceeded the old amount of debt exceeded by $29,338. The unamortized amount is netted against the new debt and is being amortized over the refunded debt’s life using the straight-line method. The deferred amount on refunding was $18,135 as of December 31, 2018. The City completed the refunding to reduce its total debt service payments over the next fifteen (14) years by $14,835,319 and to obtain an economic gain of $9,837,592.
The Series 2011, 2012, 2015, 2016 and 2018 Revenue Bonds are collateralized by revenue of the water and sewer system and the various special funds established by the authorizing bond ordinances. The ordinances provide that the revenue of the system is to be used first to pay operating and maintenance expenses of the system, second to establish and maintain the revenue bond funds and third to pay the cost of replacements made necessary by the depreciation of the system. Any remaining revenues may then be used for redemption of the bonds prior to maturity, as discussed previously, for the purchase of bonds at a price not to exceed par and accrued interest, for construction, extension, betterments and improvements to the system, or for any other lawful purpose.
Per the Bond Authorizing Ordinances, the City covenants that the rates shall, if and when necessary, from time to time, be increased in such manner as will produce net revenues (net revenues being defined as gross revenues of the System less the amounts required to pay the costs of operation, maintenance, and repair of the System, including all expense items properly attributable to the operation and maintenance of the System in accordance with generally accepted accounting principles applicable to municipal water and sewer systems (excluding depreciation, interest and amortization expenses)) at least equal to 110% of current year’s debt service on all System Bonds and the amount needed to make the deposits into the Depreciation Fund and the Debt Service Reserve and to reimburse bond insurers for any amounts owed in connection with a Qualified Surety Bond.

City of Fort Smith, Arkansas Notes to Basic Financial Statements
December 31, 2018
89
The ordinances also contain provisions that, among other items, restrict the issuance of additional revenue bonds unless the special funds noted above contain the required amounts and certain financial ratios are met. As of December 31, 2018, the City is in compliance with all applicable requirements. However, the City may not authorize or issue any such additional bonds ranking on a parity of security with outstanding Bonds, unless and until either: (1) there shall have been procured and filed with the Trustee a statement by an Accountant reciting that, based upon necessary investigation, the net revenues of the System for the fiscal year immediately preceding the fiscal year in which it is proposed to issue such additional bonds shall equal not less than 125% of the average annual principal and interest requirements on the System Bonds then outstanding and the additional bonds proposed to be issued; or (2) there shall have been procured and filed with the Trustee a statement by an Accountant reciting, based upon necessary investigation, that the net revenues of the system for the next ensuing fiscal year as reflected by a certificate of a duly qualified consulting engineer not in the regular employ of the City and approved by the Trustee, and taking into consideration any rate increase, shall be equal to not less than 130% of the average annual principal and interest requirements on all of the System Bonds then outstanding and the additional bonds then proposed to be issued. Restricted accounts required by the bond ordinances are as follows:
Bond Retirement - The City is required to restrict funds for the payment of principal, interest, and trustee and paying agents’ fees up to a maximum of $1,892,000 related to the 2011 Bonds, $1,325,000 related to the 2012 Bonds, $2,331,150 related to the 2015 Bonds, $5,695,500 related to the 2016 Bonds and $13,068,000 related to the 2018 Bonds. The City held surety bonds valued at $1,892,000, $1,325,000, $2,329,768, $5,695,500 and $13,068,000 at December 31, 2018 for this purpose, respectively. The surety bond for the 2015 Bonds met requirements once accrued interest was considered.
Asset Replacement- The City is required to deposit 3% of the gross revenues of the water and sewer system for the then preceding month plus $5,000 per month until the sum of $500,000 has been accumulated in the Depreciation Fund. Amounts are to be used for replacements made necessary by the depreciation of the system. The City has accumulated $500,000 for asset replacement as of December 31, 2018. Amounts are reported in restricted investments in the fund level and government-wide financial statements.

City of Fort Smith, Arkansas Notes to Basic Financial Statements
December 31, 2018
90
Maturity Schedule
Aggregate debt service requirements at December 31, 2018 for business-type activity related bonds were as follows:
Total Business-Type Activities
Principal Interest
2019 6,360,000$ 10,468,180$ 2020 7,930,000 9,958,090 2021 9,070,000 9,680,213 2022 10,375,000 9,263,263 2023 10,680,000 8,961,000
2024-2028 60,860,000 37,341,250
2029-2033 75,630,000 21,973,650 2034-2038 41,860,000 4,403,450 2039-2042 4,390,000 265,000
Total 227,155,000 112,314,096$
Add unamortized bond premium 23,320,721
Net bonds outstanding
as of December 31, 2018 250,475,721$
Water and Sewer

City of Fort Smith, Arkansas Notes to Basic Financial Statements
December 31, 2018
91
Pledged Revenues for the City
The following is a summary of pledged revenues for the City for the year ended December 31, 2018.
Debt Revenue Pledged
Total Pledged Revenue
Portion of Pledged Revenue Stream
Percentage Portion of Pledged Revenue
Stream
Remaining Principal, Interest
and Fees
Period Revenue Will Not Be Available for
Other Purposes
Governmental Activities:Sales and Use Tax Refunding and Improvement Bonds - Series 2012 3/4 Cent City Sales Tax 16,127,517$ 8,880,000$ 55.1% 61,742,438$ Until 2027
Sales and Use Tax Bonds - Series 2014 3/4 Cent City Sales Tax 16,127,517 3,855,000 23.9% 22,557,272 Until 2028
84,299,710
Business-Type Activities:Water and Sewer Refunding Revenue Bonds, Series 2011
Revenues of the Enterprise Fund 59,882,546 1,485,000 2.5% 9,051,876$ Until 2023
Water and Sewer Refunding Revenue Bonds, Series 2012
Revenues of the Enterprise Fund 59,882,546 2,000,000 3.3% 2,148,800 Until 2019
Water and Sewer Refunding and Construction Revenue Bonds, Series 2015
Revenues of the Enterprise Fund 59,882,546 865,000 1.4% 51,239,800 Until 2040
Water and Sewer Refunding Revenue Bonds, Series 2016
Revenues of the Enterprise Fund 59,882,546 1,820,000 3.0% 74,474,200 Until 2032
Water and Sewer Refunding and Construction Revenue Bonds, Series 2018
Revenues of the Enterprise Fund 59,882,546 - 0.0% 202,554,420 Until 2035
339,469,096
Component Units Revenue Bonds-Business-Type Activities
Airport Commission-
On August 2, 2011, the Airport Commission issued $3,205,000 of City of Fort Smith, Arkansas Airport Refunding and Improvement Revenue Bonds, Series 2011, to refund the remaining outstanding Series 1999 Bonds. The bonds bear interest at 1.5% to 5.35%, payable semi-annually and the bonds are payable in annual installments through October 1, 2026. All the bonds still outstanding may be redeemed at the Airport’s option on or after October 1, 2020. At December 31, 2018, bonds payable were $1,910,000.
Maturities of revenue bonds payable for succeeding years are as follows:
Principal Interest
2019 210,000$ 94,567$ 2020 215,000 85,328 2021 225,000 75,330 2022 240,000 64,530 2023 250,000 52,770
2024-2026 770,000 79,853
Total Payments 1,910,000$ 452,378$

City of Fort Smith, Arkansas Notes to Basic Financial Statements
December 31, 2018
92
The bond covenants require the maintenance of the following restricted account:
Bond Retirement - The Airport Commission is required to maintain funds for the payment of principal, interest and trustee and paying agents’ fees of $383,758 , which are classified as restricted assets on the balance sheet, as of December 31, 2018. The Airport Commission held cash and investments equal to this amount at December 31, 2018.
Applicability of Federal Arbitrage Regulations
Debt issuances of the City and various Authorities issued after the Tax Reform Act of 1986 are subject to the federal arbitrage regulations. The arbitrage rebate regulations require that all earnings from the investment of gross proceeds of a bond issue in excess of the amount that could have been earned had the yield on the investment been equal to the yield on the bonds be remitted to the federal government. These rules carry strict penalties for noncompliance including taxability of interest retroactive to the date of the issue. City management believes the City is in compliance with these rules and regulations.
At December 31, 2018, the City has no arbitrage payable.
Conduit Debt Obligations
From time to time, the City has issued various bonds to provide financial assistance to private sector entities for the acquisition and construction of industrial and commercial facilities deemed to be in the public interest. The bonds are secured by the property financed and are payable solely from payments received on the underlying mortgage loans. Upon repayment of the bonds, ownership of the acquired facilities transfers to the private-sector entity served by the bond issuance. Neither the state, the City, nor any political subdivision thereof is obligated in any manner for repayment of the bonds. Accordingly, the bonds are not reported in the accompanying financial statements.
As of December 31, 2018, there were fourteen series of Industrial Development Revenue Bonds outstanding with an aggregate principal amount payable of $$461,906,067, one series of Fair and Exhibition Facilities Bonds outstanding with an aggregate principal amount payable of $446,611, and one series of Residential Housing Facilities Board Multi-Family Housing Revenue Bonds outstanding with an aggregate principal payable of $6,375,000.
Prior year defeasance of debt. In prior years, the government defeased general obligation public improvement bonds by placing the proceeds of the new bonds in an irrevocable trust account to provide for all future debt service payments on the old bonds. Accordingly, the trust account assets and the liability for the defeased bonds are not included in the government’s financial statements. At December 31, 2018, none of the defeased bonds remain outstanding.

City of Fort Smith, Arkansas Notes to Basic Financial Statements
December 31, 2018
93
Note 5: Risk Management
The City is exposed to various risks of loss related to the City’s self-insurance of workers’ compensation and health and other medical benefits provided to employees and retirees, and their dependents and beneficiaries. The City accounts for these programs through the Employee Insurance Fund and Workers’ Compensation Fund. Each fund is an internal service fund. In addition, the City limits property and casualty losses and manages risk through the purchase of insurance policies with several different carriers. The City has not recognized any settlements that exceeded insurance coverage during the past three years.
All funds of the City participate in the City’s insurance programs and make payments to the respective self-insurance funds based on estimates of the amounts needed to pay prior and current year claims and to establish a reserve for future claims. The Airport Commission and the Fort Smith Public Library participate in the City’s health plans by making contributions as required by the City. At December 31, 2018, the net position (deficit) was $5,756,892 and $(77,321)in the Employee Insurance and Workers’ Compensation Funds, respectively. The claims liability balances of $723,415 and $1,014,849 reported in the Employee Insurance and Workers’ Compensation Funds, respectively, are based on the requirements of GASB Statement 10, Accounting and Financial Reporting for Risk Financing and Related Insurance Issues, which requires that a liability for claims be reported if information prior to the issuance of the financial statements indicates that it is probable that a liability has been incurred at the date of the financial statements and the amount of the loss can be reasonably estimated. The claims liability includes the effect of specific incremental claims, adjustment expenses, and if probable and material, salvages and subrogation. These liabilities include accruals for claims incurred but not reported, based upon the City’s historical claims rate. These liabilities are the City’s best estimate based on available information. Changes in the reported liabilities during 2018 are detailed below:
Employee Workers'Insurance Compensation
Self-insurance liability, December 31, 2016 856,356$ 609,885$
Current year claims and changes in estimate 8,795,729 1,156,274 Claim payments (8,791,271) (976,558)
Self-insurance liability, December 31, 2017 860,814 789,601
Current year claims and changes in estimate 7,140,176 1,114,467 Claim payments (7,277,575) (889,219)
Self-insurance liability, December 31, 2018 723,415$ 1,014,849$

City of Fort Smith, Arkansas Notes to Basic Financial Statements
December 31, 2018
94
Note 6: Deferred Compensation Plan
The City offers its employees a deferred compensation plan created in accordance with Internal Revenue Code Section 457. International City Management Association Retirement Corporation (ICMARC) administers the Plan. All assets and income of the trust are for the exclusive benefit of eligible employees and their beneficiaries. The City does not have any fiduciary responsibility or administrative duties relating to the deferred compensation plan other than remitting employees’ contributions to the trustees. Accordingly, the City has not presented the assets and liabilities from the plan in these basic financial statements. Deferred compensation investments are held by outside trustees. Plan investments are chosen by the individual (employee) participant and include mutual funds whose focus is on stocks, bonds, treasury securities, money market-type investments or a combination of these.
The Plan, available to all permanent City employees, permits them to defer until future years up to 25% of annual gross earnings not to exceed $17,500. The deferred compensation is not available to employees until termination, retirement, death, or unforeseeable emergency.
Note 7: Pension Plans
The City of Fort Smith, Arkansas participates in one defined contribution plan as described below. The City also participates in four defined benefit pension plans; which are comprised of two agent multiple-employer defined benefit pension plans and two cost-sharing multiple-employer defined benefit pension plans, each of which are described and illustrated in detail below.
Aggregate amounts for the four pension plans are as follows:
FRPF PRPF LOPFI APERS Total
Net pension liability 20,213,584$ 21,284,607$ 28,851,157$ 103,956$ 70,453,304$ Deferred outflows of resources 9,895 11,455 8,874,994 13,807 8,910,151 Deferred outflows of resources - contributions 1,439,040 1,334,976 3,284,942 6,851 6,065,809 Deferred inflows of resources - - 3,024,791 12,642 3,037,433 Pension expense 3,503,902 4,612,574 5,385,741 15,775 13,517,992
(a) Public Employees Retirement System (Defined Contribution Plan)
Plan Description
Effective April 1, 1997, the Public Employees’ Retirement System (PERS) was converted to a money purchase retirement plan, a defined contribution plan, that is qualified under Section 401(a) of the Internal Revenue Code (the 401(a)Plan). ICMARC serves as administrator of the 401(a) Plan. All full-time, non-uniformed employees with the exception of the three district judges and the District Court Clerk are covered by the 401(a) Plan. Each participant has a plan account to which the contributions are made and each participant manages their account by selecting various investments options offered by ICMARC.

City of Fort Smith, Arkansas Notes to Basic Financial Statements
December 31, 2018
95
The present value of each PERS active member account at March 31, 1997, was transferred to ICMARC in the participant’s name. An annuity contract from an insurance company was purchased to continue to provide benefit payments to beneficiaries of PERS. The remaining balance of approximately $1,700,000 was transferred to the Employee Insurance Fund to provide for future employee benefits. Additionally, the contract was purchased whereby all beneficiaries will receive a 3% cost of living adjustment every three years beginning January 1, 1998. The present value of the deferred members of PERS may be withdrawn or rolled into a qualified plan at the member’s choice.
Benefits Provided
Plan benefits are based upon the total amount of money in an individual’s account at retirement. Plan provisions and contribution rates are established by the 401(a) Plan agreement between the Board and ICMARC. Approval from both the Board and ICMARC is required for 401(a) Plan amendments.
Contributions
Employees make no contributions to the 401(a) Plan; however, the City makes contributions equal to 5% of each covered employees’ earnings. Employer contributions to the PERS plan totaled $2,706,837 for 2018.
(b) Arkansas Public Employees’ Retirement System
On January 1, 2005, the district court clerk became a member of the Arkansas Public Employees’ Retirement System (APERS). APERS is administered by the state as a defined benefit plan. The employer contribution rate was 14.50% of covered payroll 2018. The Clerk’s contribution rate was 4.7% of covered payroll for 2018. The City’s contributions to the Plan for the year ended December 31, 2018 were $13,702 .
Benefits Provided
Benefits under APERS are calculated depending on the member’s hire date, with retirees separated into two separate categories; the non-contributory plan applies to all persons hired prior to July 1, 2005, while the new contributory plan applies to all employees hired on or after July 1, 2005. Under both plans, a member may retire with full benefits at either the age of 65 with five years of service, or at any age with 28 years of service. The member may retire with reduced benefits at either the age of 55 with five years of service or at any age with 25 years of service. The reduction is equal to one-half of one percent for each month retirement precedes normal retirement age or one-percent for each month below 28 years of actual service, whichever is less. Under the non-contributory plan, the benefit calculation is equal to a factor of 1.72% of the member’s final average salary multiplied by the years and months of credited service. Under the new contributory plan, the benefit calculation is equal to a factor of 2.00% of the members final average salary multiplied by the years of credited service. Under each plan, an additional .5% of the member’s final average salary is awarded for each year of credited service exceeding 28 years. The minimum monthly benefit is $150, excluding any age and beneficiary option reductions.

City of Fort Smith, Arkansas Notes to Basic Financial Statements
December 31, 2018
96
Under both the non-contributory and contributory plan, the member’s final average salary is the highest 36 calendar months of covered compensation. In addition, a cost-of-living adjustment of 3% annually is included in the current benefits.
Covered payroll for the clerk was $91,675 for the fiscal year ended December 31, 2018. There is one retired clerk receiving benefits from APERS.
Pension Liabilities, Pension Expense, and Deferred Outflows of Resources and Deferred Inflows of Resources Related to Pensions
At December 31, 2018, the City reported a liability of $103,956 for its proportionate share of the net pension liability. The net pension liability was measured as of June 30, 2018, and the total pension liability used to calculate the net pension liability was determined by an actuarial valuation as of that date. The City’s proportion of the net pension liability was based on the ratio of the City’s actual contributions to the Plan during the measurement period to total employee contributions to the Plan of the year for the measurement period. At June 30, 2018, the City’s proportion was 0.00471258%, which is a decrease of .00001294% from its proportion as of June 30, 2017, of .00484195%.
For the year ended December 31, 2018, the City recognized pension expense of $15,775. At December 31, 2018, the City reported deferred outflows of resources and deferred inflows of resources related to pensions from the following sources:
Deferred Outflows Deferred Inflowsof Resources of Resources
Differences between expected and actualexperience 1,653$ 1,091$
Change of assumptions 11,828 6,429
Changes in proporation and differences betweenCity contributions and share of contributions - 2,491
Changes in proportion 326 -
Net difference between projected and actualearnings on pension plan investments - 2,631
Contributions subsequent to the measurement date 6,851 -
Total 20,658$ 12,642$

City of Fort Smith, Arkansas Notes to Basic Financial Statements
December 31, 2018
97
The amount reported as deferred outflows of resources related to pensions resulting from contributions subsequent to the measurement date of $ 6,851 will be recognized as a reduction of the net pension liability for the year ending December 31, 2019. Other amounts reported as deferred outflows of resources and deferred inflows of resources related to the Plan will be recognized in pension expense as follows:
Year EndingDecember 31,
2019 7,526$ 2020 3,321 2021 (5,219) 2022 (4,463)
Total 1,165$
Actuarial Assumptions
The total pension liability in the June 30, 2018 actuarial valuation was determined using the following actuarial assumptions, applied to all periods included in the measurement:
Actuarial Cost Method Entry Age NormalInflation 2.50 percent (3.25 percent in prior year)Discount rate 7.15 percent (7.15 percent in prior year)Salary increases 3.25 to 9.85 percent, including inflation (3.95 to 9.85
percent, including inflation, in prior year)Investment rate of return 7.15 percent, net of pension plan investment expense,
including inflation (7.15 percent, including inflation, in prior year)
Mortality rates were based on the RP-2014 weighted generational mortality tables for healthy annuitant, disability, or employee death in service as applicable. The tables applied credibility adjustments of 135% for males and 125% for females and were adjusted for fully generational mortality improvements using Scale MP-2017. The actuarial assumptions used in the June 30, 2019 valuation were based on the results of an actuarial experience study for the period from July 1, 2012 through June 30, 2017, and were applied to all prior periods included in the measurement.
Long-term Expected Return on Plan Assets
The long-term expected rate of return on pension plan investments was determined using a building block method in which best-estimate ranges of expected future real rates of return for each major asset class. These ranges are combined to produce the long-term expected rate of return by weighting the expected future real rates of return by the current asset allocation percentage and by adding expected price inflation. The long-term expected rates of return are shown in the table below:

City of Fort Smith, Arkansas Notes to Basic Financial Statements
December 31, 2018
98
Asset Class Target AllocationLong-Term Expected Real
Rate of Return
Broad Domestic Equity 37% 5.97%International Equity 24% 6.07%Real Estate Related Assets 16% 4.59%Absolute Return 5% 3.15%Domestic Fund 18% 0.83%
Total 100%
Long-term Expected Real Rate of Return
Discount Rate
In the June 30, 2018 actuarial valuation, a single discount rate of 7.15% (7.15% in prior year) was used to measure the total pension liability. This single discount rate was based on the expected rate of return on pension plan investments of 7.15%. The projection of cash flows, based on the assumptions made, found that the pension plan’s net position was available to make all projected future benefit payments of current plan members. Therefore, the long-term expected rate of return on pension plan investments was applied to all periods of projected benefit payments to determine the total pension liability.
Sensitivity of the City’s Proportionate Share of the Net Pension Liability to Changes in the Discount Rate
The following table presents the City’s proportionate share of the net pension liability calculated using the discount rate of 7.15 percent, as well as what the City’s proportionate share of the net pension liability would be if it were calculated using a discount rate that is 1-percentage-point lower (6.15 percent) or 1-percentage-point higher (8.15 percent) than the current rate:
1% DecreaseCurrent Single Rate
Assumption 1% Increase6.15% 7.15% 8.15%
City's proportionate share of the net pension liability 169,964$ 103,956$ 49,506$
Sensitivity of the Net Pension Liability to theSingle Discount Rate Assumption

City of Fort Smith, Arkansas Notes to Basic Financial Statements
December 31, 2018
99
Fort Smith Public Library – Arkansas Public Employees’ Retirement System (Component Unit)
Plan Description
The Fort Smith Public Library (the Organization) participates in the Arkansas Public Employees Retirement Systems (APERS). APERS is a cost-sharing, multiple employer, defined benefit plan which covers all State employees who are not covered by another authorized plan. The plan was established by the authority of the Arkansas General Assembly with passage of Act 177 of 1957. The costs of administering the plan are paid out of investment earnings.
The general administration and responsibility for the proper operation of the System is vested in the nine members of the Board of Trustees of the Arkansas Public Employees Retirement System (the Board). Membership includes three state and three non-state employees, all appointed by the Governor, and three ex-officio trustees, including the Auditor of the State, the Treasurer of the State and the Director of the Department of Finance and Administration.
The state of Arkansas issues an annual report that includes financial statements and required supplementary information for APERS. That report may be obtained by writing to Arkansas Public Employees Retirement System, One Union National Plaza, 124 West Capitol, Suite 400, Little Rock, Arkansas 72201.
Funding Policy: The Organization contributes an actuarially determined amount to the plan, which was 14.75% of annual covered payroll at December 31, 2018. Contributions made by the Organization were $ $189,784 and $ $189,225 for the years ended December 31, 2018 and 2017, respectively. Employees are not required to contribute to the plan.
Benefits Provided
Benefit provisions are set forth in Arkansas Code Annotated, Title 24, Chapters 5 and 6 and may only be amended by the Arkansas General Assembly 6. APERS provides retirement, disability and death benefits. Retirement benefits are determined as a percentage of the member’s highest 3-year average compensation times the member’s years of service. The percentage used is based upon whether a member is contributory or non-contributory as follows:
Contributory, prior to 7/1/2005 2.07% Contributory, on or after 7/1/2005, but prior to 7/1/2007 2.03% Contributory, on or after 7/1/2017 2.00% Non-Contributory 1.72%
Members are eligible to retire with a full benefit under the following conditions:
At age 65 with 5 years of service, At any age with 28 years actual service, At age 60 with 20 years of actual service if under the old contributory plan (prior to
July 1, 2005), or At age 55 with 35 years of credited service for elected or public safety officials.
City of Fort Smith, Arkansas Notes to Basic Financial Statements
December 31, 2018
100
Members may retire with a reduced benefit at age 55 with at least 5 years of actual service or at any age with 25 years of actual service. Members are eligible for disability benefits with 5 years of service. Disability benefits are computed as an age and service benefit, based on service and pay at disability. Death benefits are paid to a surviving spouse as if the member had 5 years of service and the monthly benefit is computed as if the member had retired and elected Joint & 75% Survivor option. A cost-of-living adjustment of 3% of the current benefit is added each year. Contributions Contribution requirements are set forth in Arkansas Code Annotated, Title 24, Chapter 4. The contributions are expected to be sufficient to finance the costs of benefits earned by members during the year and make a level payment that, if paid annually over a reasonable period of future years, will fully cover the unfunded costs of benefit commitments for services previously rendered (A.C.A. 24-2-701)(a)). Members who began service prior to July 1, 2005 are not required to make contributions to APERS. Members who began service on or after July 1, 2005 are required to contribute 5% of their salary. Employers are required to contribute at a rate established by the Board of Trustees of APERS based on an actuary’s determination of a rate required to fund the plan (A.C.A. 24-2-701(c)(3)). Employers contributed 14.50% of compensation for the fiscal year ended December 31, 2018. In some cases, an additional 2.5% of member and employer contributions are required for elected officials. APERS Fiduciary Net Position Detailed information about APERS’s fiduciary net position is available in the separately issued APERS Financial Report available at http://www.apers.org/annualreports. Measurement Date The collective net pension liability was measured as of June 30, 2018, and the total pension liability used to calculate the net pension liability was determined by an actuarial valuation as of that date. Each employer’s proportion of the net pension liability was based on the employer’s share of contributions to the pension plan relative to the total contributions of all participating employers. The Library’s proportion at June 30, 2018, was 0.0064893% which is a decrease of 0.00063572% from its proportion as of June 30, 2017 of .007284649%.

City of Fort Smith, Arkansas Notes to Basic Financial Statements
December 31, 2018
101
Actuarial Assumptions The total pension liability in the June 30, 2018 actuarial valuation was determined using the following actuarial assumptions, applied to all periods included in the measurement:
Actuarial Cost Method Entry Age Normal Amortization Method Level Percentage of Payroll, Closed (Level Dollar, Closed
for District Judges New Plan and Paid Off Old Plan and District Judges Still Paying Old Plan)
Remaining Amortization Period 25 years (9.6 years for District Judges New Plan/Paid Off Old Plan and 19 years for District Judges Still Paying Old Plan)
Asset Valuation Method 4-Year smoothed market; 25% corridor (Market Value for Still Paying Old Plan)
Inflation 3.25% wage inflation; 2.50% price inflation Salary Increases 3.25% - 9.85% including inflation (3.25% - 6.96%
including inflation for District Judges) Investment Rate of Return 7.15% Retirement Age Experience-based table of rates that are specific to the type
of eligibility condition Mortality Table Based on RP-2014 weighted generational mortality tables
for healthy annuitant, disability, or employee death in service, as applicable. The tables applied credibility adjustments of 135% for males and 125% for females and were adjusted for fully generational mortality improvements using Scale MP-2017
The actuarial assumptions used in the valuation were based on an experience study covering the period July 1, 2012 through June 30, 2017. Long-term Expected Return on Plan Assets
The long-term expected rate of return on pension plan investments was determined using a building-block method in which best-estimate ranges of expected future real rates of return are developed for each major asset class. These ranges are combined to produce the long-term expected rate of return by weighting the expected future real rates of return by the current asset allocation percentage and by adding expected price inflation. Best estimates of arithmetic real rates of return for the 10-year period from 2018 to 2027 were based upon capital market assumptions provided by the plan's investment consultant(s). For each major asset class that is included in the pension plan's current asset allocation as of June 30, 2018, these best estimates are summarized in the following table:

City of Fort Smith, Arkansas Notes to Basic Financial Statements
December 31, 2018
102
Asset Class Target AllocationLong-Term Expected Real
Rate of Return
Broad Domestic Equity 37% 5.97%International Equity 24% 6.07%Real Estate Related Assets 16% 4.59%Absolute Return 5% 3.15%Domestic Fund 18% 0.83%
Total 100%
Long-term Expected Real Rate of Return
Single Discount Rate A single discount rate of 7.15% was used to measure the total pension liability. This single discount rate was based on the expected rate of return on pension plan investments of 7.15%. The projection of cash flows used to determine this single discount rate assumed that plan member contributions will be made at the current contribution rate and that employer contributions will be made at rates equal to the difference between actuarially determined contribution rates and the member rate. Based on these assumptions, the pension plan’s fiduciary net position was projected to be available to make all projected future benefit payments of current plan members. Therefore, the long-term expected rate of return on pension plan investments was applied to all periods of projected benefit payments to determine the total pension liability.
Regarding the sensitivity of the net pension liability to changes in the single discount rate, the following presents the plan's net pension liability, calculated using a single discount rate of 7.15%, as well as what the plan's net pension liability would be if it were calculated using a single discount rate that is 1-percentage point lower (6.15 percent) or 1-percentage point higher (8.15 percent):
1% DecreaseCurrent Single Rate
Assumption 1% Increase6.15% 7.15% 8.15%
City's proportionate share of the net pension liability 2,679,326$ 1,638,782$ 780,416$
Sensitivity of the Net Pension Liability to theSingle Discount Rate Assumption
Pension Liabilities, Pension Expense, and Deferred Outflows of Resources and Deferred Inflows of Resources to Pensions At December 31, 2018, the Library reported a liability of $1,638,782 for its proportionate share of the net pension liability.

City of Fort Smith, Arkansas Notes to Basic Financial Statements
December 31, 2018
103
The Organization had a pension contribution liability of $10,380 accrued at December 31, 2018. The Organization’s proportionate share of pension expense was $269,593 for the year ended December 31, 2018. At December 31, 2018, the Organization reported deferred outflows or resources and deferred inflows of resources related to pensions from the following resources: Library
Deferred Outflows Deferred Inflowsof Resources of Resources
Differences between expected and actualexperience 26,063$ 17,203$
Change of assumptions 186,459 101,346
Net difference between projectedand actual earnings on pensionplan investments - 41,469
Changes in proportion 126,847 81,006
Organization contributions subsequent to the measurement date 100,174 -
Total 439,543$ 241,024$
$100,174 reported as deferred outflows of resources related to pensions resulting from Organization contributions subsequent to the measurement date will be recognized as a reduction of the net pension liability in the year ending December 31, 2019, other amounts reported as deferred outflows of resources and deferred inflows of resources related to pensions will be recognized in pension expense as follows:
Net ReductionYear Ending in Pension
December 31, Expense
2019 124,458$ 2020 59,144 2021 (53,576) 2022 (31,681)
98,345$

City of Fort Smith, Arkansas Notes to Basic Financial Statements
December 31, 2018
104
(c) Fire Relief and Pension Plan (“FRPF) (the Old Fire Plan)
Plan Description
The Fire Relief and Pension Plan (“FRPF”) is an agent multiple-employer defined benefit pension plan for employees of the Fire Department who were hired prior to January 1, 1983. The Old Plan was established in accordance with Arkansas statutes and were closed, by state law, to new employees effective January 1, 1983. On September 20, 1990, the City entered into an agreement with the Arkansas local police and fire (LOPFI) retirement system whereby LOPFI assumed responsibility for administration and a portion of the obligation of the Old Plans pursuant to Act 364 of 1981, as amended, and Act 655 of 1983 of the General Assembly of the State of Arkansas. Per the Agreement between the City and LOPFI, the City will contribute an actuarially determined rate sufficient to support the current plan benefit levels and fund the Old Fire Plan’s net pension obligation over a 30 year open amortization period. The Old Fire Plan’s benefit structure remains unchanged under the administration by LOPFI. The assets of the Old Fire Plan are included in the pooled assets of the LOPFI system and a financial report that includes disclosures about the elements of the basic financial statements is available on the LOPFI’s website at www.lopfi-prb.com
Benefits
The FRPF provides retirement benefits for firemen who have completed 20 years of service. Disability benefits are available to firemen who become permanently disabled, unless the disability is the direct result of gainful employment performed outside the fire department. The FRPF also provides benefits for surviving spouses and dependent children of deceased firemen. No participants’ benefits vest until normal retirement age. At normal requirement age, participants may elect to continue working and enter the Deferred Retirement Option Plan for up to 5 years. All firemen hired after January 1, 1983, participate in the Arkansas Local Police and Fire Retirement System created by Act 364 of 1981 and detailed later in this footnote. Therefore, the Firemen’s Fund is effectively closed to new members.
Pension benefit provisions and all other requirements, including vesting, are established by state statute. Participants in the Old Fire Plan became eligible for membership as of the first date of employment. Members of the Old Fire Plan who retire with 20 years of credited service are entitled to a retirement benefit payable monthly for life equal to one-half of the participant’s annual salary. Employees become vested after 20 years of service. Members with more than 25 years of service credit may be entitled to a maximum of 100% of their highest annual salary.
At the December 31, 2017 valuation and measurement date, the following were covered by the benefit terms:
Retirees and beneficiaries 106 DROP members 1
Total 107

City of Fort Smith, Arkansas Notes to Basic Financial Statements
December 31, 2018
105
Contributions
Arkansas state statutes require yearly contributions at a level percentage of covered payroll sufficient to cover the costs of benefit commitments made to participants for their service rendered in that year and, over a reasonable period of time, to fully cover the unfunded costs of benefit commitments for services previously rendered. The City is required to contribute the actuarially required normal costs and amortized costs of the unfunded actuarial accrued liability. In addition, active employees are required to make contributions equal to 6% of their gross salary to the Old Plans. The contributions for the 2018 plan year were based upon the December 31, 2017, actuarial report. Contributions to the Plan by the City were $1,439,040 for the year ended December 31, 2018.
Net Pension Liability
The City’s net pension liability of $20,213,584 as of December 31, 2018 was measured as of December 31, 2017, and the total pension liability used to calculate the net pension liability was determined by an actuarial valuation as of December 31, 2017.
Actuarial Assumptions
The total pension liability in the December 31, 2017 actuarial valuation was determined using the following actuarial assumptions, applied to all periods included in the measurement for the Old Fire Plan:
Valuation date December 31, 2017 Cost method Entry age normal Asset valuation method Smooth market over a period of 5 years Amortization method Level percentage Amortization period 21 years beginning January 1, 2017
Assumptions:
Inflation rate – price 2.75 percent (3.00 percent in prior year) Wage inflation 3.75 percent (4.00 percent in prior year) Investment rate of return 7.75 percent (7.75 percent in prior year)
Mortality rates for retirees, beneficiaries, and DROP members were based on the gender distinct RP-2000 Combined Mortality Table, projected to 2017 and set forward two years for males. For disabled members, the mortality rates are the rates applicable to non-disabled lives set forward 10 years.
Actuarial assumptions used in the December 31, 2017, valuation were based on the results of actuarial experience studies. The experience study in FRPF was for the period January 1, 2008 through December 31, 2011, first used in the December 31, 2012 valuation. Assumptions are reviewed annually. No additional changes were made for the 2017 valuation.

City of Fort Smith, Arkansas Notes to Basic Financial Statements
December 31, 2018
106
Long-term Expected Return on Plan Assets
The long-term expected rate of return on pension plan investments was determined using a building block method in which best-estimate ranges of expected future real rates of return. The rates were built on a target allocation for all pension funds; the target for an individual fund will vary within the guidelines of Arkansas law and regulation. The long-term expected rates of return are shown in the table below:
Asset Class Target AllocationLong-Term Expected Real
Rate of Return
Domestic Fixed Income 27% 0.78%Domestic Equity 42% 5.58%Foreign Equity 18% 7.38%Alternative Investments 10% 6.23%Cash 3% 0.00%
Total 100%
Discount Rate
The discount rate used to measure the total pension liability was 7.75%. The projection of cash flows used to determine the discount rate assumed that employer contributions will be made at the rates specified in statute. Based on that assumption, the pension plan’s fiduciary net position was projected to be available to make all projected future benefit payments of retired and DROP members. Therefore, the long-term expected rate of return on pension plan investments was applied to all periods of projected benefit payments to determine the total pension liability.
Changes in the Net Pension Liability
Total Pension Plan Fiduciary Net PensionLiability Net Position Liability
(a) (b) (a) - (b)
Balance at January 1, 2018 32,284,383$ 13,109,268$ 19,175,115$ Changes for the year:
Interest 2,387,422 - 2,387,422 Differences between expected and actual experience 138,769 - 138,769 Assumption changes 1,767,387 - 1,767,387 Contributions - employer - 1,540,550 (1,540,550) Contributions - employee - - - Net investment income - 1,736,826 (1,736,826) Benefit payments, including refunds of employee
contributions (2,957,863) (2,957,863) - Administrative expense - (22,267) 22,267
Net Changes 1,335,715 297,246 1,038,469
Balance at December 31, 2018 33,620,098$ 13,406,514$ 20,213,584$

City of Fort Smith, Arkansas Notes to Basic Financial Statements
December 31, 2018
107
There were no benefit changes during the year. The assumed investment rate of return remained 7.75%, the wage inflation assumption decreased from 4.00% to 3.75% and the price inflation assumption was decreased from 3.00% to 2.75%.
Sensitivity of the Net Pension Liability to the Changes in the Discount Rate
The following table presents the City’s net pension liability using the current rate as compared to what the net pension liability would be if it were calculated using a discount rate that is 1-percentage point lower or 1-percentage higher than the current rate:
1% DecreaseCurrent Single Rate
Assumption 1% Increase6.00% 7.00% 8.00%
City's Net Pension Liability 23,356,755$ 20,213,584$ 17,535,364$
Sensitivity of the Net Pension Liability to theSingle Discount Rate Assumption
Pension Plan Fiduciary Net Position
Detailed information about the pension plan’s fiduciary net position is available in the separately issued LOPFI financial report.
Pension Liabilities, Pension Expense, and Deferred Outflows of Resources
For the year ended December 31, 2018, the City recognized pension expense of $ 3,503,902 . At December 31, 2018, the City reported deferred outflows of resources related to pensions from the following sources:
Deferred Outflows
of Resources
Net difference between projected and actualearnings on pension plan investments 9,895$
Contributions subsequent to the measurement date 1,439,040
Total 1,448,935$

City of Fort Smith, Arkansas Notes to Basic Financial Statements
December 31, 2018
108
The amount reported as deferred outflows of resources related to pensions resulting from contributions subsequent to the measurement date of $ 1,439,040 will be recognized as a reduction of the net pension liability for the year ending December 31, 2019. Other amounts reported as deferred outflows of resources related to pensions will be recognized in pension expense as follows:
Year EndingDecember 31,
2019 148,240$ 2020 123,667 2021 (106,683) 2022 (155,329)
Total 9,895$
Arkansas LOPFI plan administration policy, as required by state statutes, contains the following provisions: segregate all of the plan’s retired participants and fund future benefit payments at 100%; remove these retirees as City obligations while the City realizes the remaining, net unfunded obligation on the segregated retirees; amortize these funded, accrued liabilities over a closed period of 40 years that began September 20, 1990; if the length of the financing period for unfunded liabilities causes closed plan assets to temporarily dip below zero, Arkansas LOPFI would loan the shortages until the financing period is complete as, at that time, Arkansas LOPFI will have been fully reimbursed including investment credits.
(d) Police Relief and Pension Plan (“PRPF) (the Old Police Plan)
Plan Description
The Police Relief and Pension Plan (“PRPF”) is an agent multiple-employer defined benefit pension plans for employees of the Police Department who were hired prior to January 1, 1983. The Old Plans were established in accordance with Arkansas statutes and were closed, by state law, to new employees effective January 1, 1983. On September 20, 1990, the City entered into an agreement with the Arkansas Local Police and Fire (LOPFI) Retirement System whereby LOPFI assumed responsibility for administration and a portion of the obligation of the Old Police Plan pursuant to Act 364 of 1981, as amended, and Act 655 of 1983 of the General Assembly of the State of Arkansas. Per the Agreement between the City and LOPFI, the City will contribute an actuarially determined rate sufficient to support the current plan benefit levels and fund the Old Police Plan’s net pension obligation over a 30-year open amortization period. The Old Police Plan’s benefit structure remains unchanged under the administration by LOPFI. The assets of the Old Police Plan are included in the pooled assets of the LOPFI system and a financial report that includes disclosures about the elements of the basic financial statements is available on the LOPFI’s website at www.lopfi-prb.com.

City of Fort Smith, Arkansas Notes to Basic Financial Statements
December 31, 2018
109
Benefits
The PRPF provides retirement benefits for policemen who have completed 20 years of service. Disability benefits are available to policemen who become permanently disabled, unless the disability is the direct result of gainful employment performed outside the police department. The PRPF also provides benefits for surviving spouses and dependent children of deceased policemen. No participants’ benefits vest until normal retirement age. At normal requirement age, participants may elect to continue working and enter the Deferred Retirement Option Plan for up to 5 years. All firemen hired after January 1, 1983, participate in the Arkansas Local Police and Fire Retirement System created by Act 364 of 1981 and detailed later in this footnote. Therefore, the Firemen’s Fund is effectively closed to new members.
Pension benefit provisions and all other requirements, including vesting, are established by state statute. Participants in the Old Plans became eligible for membership as of the first date of employment. Members of the Old Plans who retire with 20 years of credited service are entitled to a retirement benefit payable monthly for life equal to one-half of the participant’s annual salary. Employees become vested after 20 years of service. Members with more than 25 years of service credit may be entitled to a maximum of 100% of their highest annual salary.
At the December 31, 2017 valuation and measurement date, the following were covered by the benefit terms:
Retirees and beneficiaries 85
Total 85 Contributions
Arkansas state statutes require yearly contributions at a level percentage of covered payroll sufficient to cover the costs of benefit commitments made to participants for their service rendered in that year and, over a reasonable period of time, to fully cover the unfunded costs of benefit commitments for services previously rendered. The City is required to contribute the actuarially required normal costs and amortized costs of the unfunded actuarial accrued liability. In addition, active employees are required to make contributions equal to 6% of their gross salary to the Old Police Plan. The contributions for the 2018 plan year were based upon the December 31, 2017, actuarial report. Contributions by the City to the Plan for the year ended December 31, 2018 were $ 1,334,976 .
Net Pension Liability
The City’s net pension liability of $21,284,607 as of December 31, 2018 was measured as of December 31, 2017, and the total pension liability used to calculate the net pension liability was determined by an actuarial valuation as of December 31, 2017.

City of Fort Smith, Arkansas Notes to Basic Financial Statements
December 31, 2018
110
Actuarial Assumptions
The total pension liability in the December 31, 2017 actuarial valuation was determined using the following actuarial assumptions applied to all periods included in the measurement for the Old Police Plan.
Valuation date December 31, 2017 Cost method Entry age Asset valuation method Smooth market over a period of 5 years Amortization method Level percentage Amortization period 21 years beginning January 1, 2017 Assumptions:
Inflation rate – price 2.75 percent (3.00 percent in prior year) Wage inflation 3.75 percent (4.00 percent in prior year) Investment rate of return 7.75 percent (7.75 percent in prior year)
Mortality rates for retirees, beneficiaries, and DROP members were based on the gender distinct RP-2000 Combined Mortality Table, projected to 2017 and set forward two years for males. For disabled members, the mortality rates are the rates applicable to non-disabled lives set forward 10 years.
Actuarial assumptions used in the December 31, 2017 valuation were based on the results of actuarial experience studies. The experience study in PRPF was for the period January 1, 2008 through December 31, 2011, first used in the December 31, 2012 valuation. Assumptions are reviewed annually. No additional changes were made for the 2017 valuation.
Long-term Expected Return on Plan Assets
The long-term expected rate of return on pension plan investments was determined using a building block method in which best-estimate ranges of expected future real rates of return. The rates were built on a target allocation for all pension funds; the target for an individual fund will vary within the guidelines of Arkansas law and regulation. The long-term expected rates of return are shown in the table below:
Asset Class Target AllocationLong-Term Expected Real
Rate of Return
Domestic Fixed Income 27% 0.78%Domestic Equity 42% 5.58%Foreign Equity 18% 7.38%Alternative Investments 10% 6.23%Cash 3% 0.00%
Total 100%

City of Fort Smith, Arkansas Notes to Basic Financial Statements
December 31, 2018
111
Discount Rate
The discount rate used to measure the total pension liability was 7.75%. The projection of cash flows used to determine the discount rate assumed that employer contributions will be made at the rates specified in statute. Based on that assumption, the pension plan’s fiduciary net position was projected to be available to make all projected future benefit payments of retired and DROP members. Therefore, the long-term expected rate of return on pension plan investments was applied to all periods of projected benefit payments to determine the total pension liability
Changes in the Net Pension Liability
Total Pension Plan Fiduciary Net PensionLiability Net Position Liability
(a) (b) (a) - (b)
Balance at January 1, 2018 26,513,645$ 7,879,029$ 18,634,616$ Changes for the year:
Interest 1,940,131 - 1,940,131 Differences between expected and actual experience 1,495,866 - 1,495,866 Assumption changes 1,627,412 - 1,627,412 Contributions - employer - 1,429,779 (1,429,779) Contributions - employee - - - Net investment income - 996,413 (996,413) Benefit payments, including refunds of employee
contributions (2,959,388) (2,959,388) - Administrative expense - (12,774) 12,774
Net Changes 2,104,021 (545,970) 2,649,991
Balance at December 31, 2018 28,617,666$ 7,333,059$ 21,284,607$
There were no benefit changes during the year. The assumed investment rate of return remained 7.75%, the wage inflation assumption decreased from 4.00% to 3.75% and the price inflation assumption was decreased from 3.00% to 2.75%.
Sensitivity of the Net Pension Liability to the Changes in the Discount Rate
The following table presents the City’s net pension liability using the current rate as compared to what the net pension liability would be if it were calculated using a discount rate that is 1-percentage point lower or 1-percentage higher than the current rate:
1% DecreaseCurrent Single Rate
Assumption 1% Increase6.00% 7.00% 8.00%
City's Net Pension Liability 24,277,838$ 21,284,607$ 18,794,188$
Sensitivity of the Net Pension Liability to theSingle Discount Rate Assumption

City of Fort Smith, Arkansas Notes to Basic Financial Statements
December 31, 2018
112
Pension Plan Fiduciary Net Position
Detailed information about the pension plan’s fiduciary net position is available in the separately issued LOPFI financial report.
Pension Liabilities, Pension Expense, and Deferred Outflows of Resources and Deferred Inflows of Resources Related to Pensions
For the year ended December 31, 2018, the City recognized pension expense of $ 4,612,574 .
At December 31, 2018, the City reported deferred outflows of resources related to pensions from the following sources:
Deferred Outflows
of Resources
Net difference between projected and actualearnings on pension plan investments 11,455$
Contributions subsequent to the measurement date 1,334,976
Total 1,346,431$
The amount reported as deferred outflows of resources related to pensions resulting from contributions subsequent to the measurement date of $ 1,334,976 will be recognized as a reduction of the net pension liability for the year ending December 31, 2019. Other amounts reported as deferred outflows of resources related to pensions will be recognized in pension expense as follows:
Year EndingDecember 31,
2019 87,250$ 2020 73,692 2021 (60,375) 2022 (89,112)
Total 11,455$
Arkansas LOPFI plan administration policy, as required by state statutes, contains the following provisions: segregate all of the plan’s retired participants and fund future benefit payments at 100%; remove these retirees as City obligations while the City realizes the remaining, net unfunded obligation on the segregated retirees; amortize these funded, accrued liabilities over a closed period of 40 years that began September 20, 1990; if the length of the financing period for unfunded liabilities causes closed plan assets to temporarily dip below zero, Arkansas LOPFI would loan the shortages until the financing period is complete as, at that time, Arkansas LOPFI will have been fully reimbursed including investment credits.

City of Fort Smith, Arkansas Notes to Basic Financial Statements
December 31, 2018
113
(e) Arkansas Local Police and Fire Retirement System (the New Plans)
Plan Description
The Arkansas Local Police and Fire Retirement System (LOPFI) is a statewide cost-sharing multiple-employer defined benefit pension plan administered by the LOPFI Board of Trustees. LOPFI provides retirement, disability and survivor benefits to police and fire employees of political subdivisions of the State of Arkansas. LOPFI was created by Act 364 of the 1981 General Assembly. Employees hired after January 1, 1983, whose political subdivision had a retirement system in effect at July 1, 1981, are eligible to participate in the plan. LOPFI issues a publicly available report, which may be obtained by writing to LOPFI, 620 West 3rd Street, Little Rock, Arkansas 72201, or by calling (501) 682-1745.
Benefits Provided
LOPFI provides for a retirement benefit paid to the Member on a monthly basis. The monthly benefit is based on a formula provided by law for the Member’s lifetime. The Member has several options in calculating the benefit, which is normally the result of these factors: age of retirement, retirement multiplier, amount of the credit services (years and months), and final average pay (FAP). Each option available to the member provides for a different calculation based on these factors.
Contributions
Contributions to LOPFI are made by both the members and the employers. Member contribution rates are established by the LOPFI Board of Trustees. The employer contributions are actuarially determined on an annual basis. The City contributes 22.51% of covered employee salaries’ to the new plan for firefighters and 16.29% of covered employee salaries’ to the new plan for police officers. Employees contributed $1,415,802 to the contributory plan for the year ended December 31, 2018. City contributions to the new plans for the year ended December 31, 2018, were $3,284,942 and were equal to 100% of the required contributions for each year.
Pension Liabilities, Pension Expense, Deferred Outflows of Resources and Deferred Inflows of Resources Related to Pensions
At December 31, 2018, the City reported a liability of $28,851,157 for its proportionate share of the net pension liability. The net pension liability was measured as of December 31, 2017, and the total pension liability used to calculate the net pension liability was determined by an actuarial valuation as of that date. The City’s proportion of the net pension liability was based on the ratio of the City’s actual contributions to the Plan during the measurement period to the total employer contributions to the Plan of the group for the measurement period. At December 31, 2017, the City’s proportion was 4.0601% which is a decrease 0.2585% from the City’s proportion of 4.3186% at December 31, 2016.

City of Fort Smith, Arkansas Notes to Basic Financial Statements
December 31, 2018
114
For the year ended, December 31, 2018, the City recognized pension expense of $ 5,385,741 . At December 31, 2018, the City reported deferred outflows of resources and deferred inflows or resources related to pensions from the following sources:
Deferred Outflows Deferred Inflows
of Resources of Resources
Differences between expected and actualexperience 1,444,405$ 2,496$
Changes of assumptions 7,376,073 - Net difference between projected and actual
earnings on pension plan investments - 673,722 Changes in proportion 54,516 2,348,573 Contributions subsequent to the measurement date 3,284,942 -
Total 12,159,936$ 3,024,791$
The amount reported as deferred outflows of resources related to pensions resulting from contributions subsequent to the measurement date of $ 3,284,942 will be recognized as a reduction of the net pension liability for the year ending December 31, 2019. Other amounts reported as deferred outflows of resources and deferred inflows of resources related to the Plan will be recognized in pension expense as follows:
Year EndingDecember 31,
2019 2,429,897$ 2020 2,294,102 2021 1,142,198 2022 (15,994)
Total 5,850,203$

City of Fort Smith, Arkansas Notes to Basic Financial Statements
December 31, 2018
115
Actuarial Assumptions
The total pension liability in the December 31, 2017 actuarial valuation was determined using the following actuarial assumptions, applied to all periods included in the measurement:
Actuarial cost method Entry age normalPrice Inflation 2.75 percent (3.00 percent in prior year)Wage Inflation 3.75 percent (3.75 percent in prior year)Salary increases 4.25 to 18.75 percent, including inflation
(4.50 to 19.00 percent, including inflation, in prior year)
Investment rate of return 7.75 percent, net of pension plan investment expense, including inflation (7.75 percent, including inflation, in prior year)
Mortality rates were based on the RP-2000 Combined Health Mortality Table Projected to 2017 Table, set forward two years for men. Disability post-retirement mortality was assumed to be the same as standard post-retirement mortality set forward an additional 10 years.
The actuarial assumptions used in the December 31, 2017 valuation were based on the results of an actuarial study for the period January 1, 2017 to December 31, 2017. As a result of the 2017 actuarial study, the expectation of life after disability was adjusted in the December 31, 2017 actuarial evaluation to more closely reflect actual experience.
Long-term Expected Return on Plan Assets
The long-term expected rate of return on pension plan investments was determined using a building block method in which best-estimate ranges of expected future real rates of return. The rates were built on a target allocation for all pension funds; the target for an individual fund will vary within the guidelines of Arkansas law and regulation. The long-term expected rates of return are shown in the table below:
Asset Class Target AllocationLong-Term Expected Real
Rate of Return
Domestic Fixed Income 27% 0.78%Domestic Equity 42% 5.58%Foreign Equity 18% 7.38%Alternative Investments 10% 6.23%Cash 3% 0.00%
Total 100%

City of Fort Smith, Arkansas Notes to Basic Financial Statements
December 31, 2018
116
Discount Rate
In the December 31, 2017 actuarial valuation, a single discount rate of 7.00% (7.75% in prior year) was used to measure the total pension liability. This single discount rate was based on the expected rate of return on pension plan investments of 7.00% (7.75% in prior year). The projection of cash flows, based on the assumptions made, found that the pension plan’s net position was available to make all projected future benefit payments of current plan members. Therefore, the long-term expected rate of return on pension plan investments was applied to all periods of projected benefit payments to determine the total pension liability.
Sensitivity of the City’s Proportionate Share of the Net Pension Liability to the Changes in the Discount Rate
The following table presents the City’s proportionate share of the net pension liability calculated using the discount rate of 7.00 percent, as well as what the City’s proportionate share of the net pension liability would be if it were calculated using a discount rate that is 1-percentage-point lower (6.00 percent) or 1-percentage-point higher (8.00 percent) than the current rate:
1% DecreaseCurrent Single Rate
Assumption 1% Increase6.00% 7.00% 8.00%
City's proportionate share of the net pension liability 45,442,309$ 28,851,157$ 15,480,052$
Sensitivity of the Net Pension Liability to theSingle Discount Rate Assumption
Pension Plan Fiduciary Net Position
Detailed information about the pension plan’s fiduciary net position is available in the separately issued LOPFI financial report.
Note 8: Other Postemployment Benefits (OPEB)
General Information about the OPEB Plan
The City of Fort Smith sponsors and administers an informal single-employer defined benefit healthcare plan (City of Fort Smith Other Postemployment Benefit Plan) that provides coverage for medical, dental and vision benefits. Arkansas statute provides that any municipal city official or employee vested in any of the City’s retirement plans with 20 years of service and attains 55 years of age may continue to participate in the City’s healthcare plan after retirement. In addition, members employed at least 5 years with age plus service exceeding 70 at retirement are eligible for benefits. The State of Arkansas has the authority to establish and amend the requirements of this statute. The City does not issue stand-alone financial statements of the plan but all required information is presented in this report.

City of Fort Smith, Arkansas Notes to Basic Financial Statements
December 31, 2018
117
Contributions: The contribution requirements of plan members are established by City Board of Directors and may be amended as needed. Plan members pay the entire cost of monthly insurance premiums at the same rate charged to active employees and receive a benefit from the blended premium rate from all of the employees participating in the City’s health insurance plans. Employees are required to elect the coverage at the time of termination. The City is not required to make contributions to the plan on behalf of the retirees. However, benefit payments made directly by the employer are reported as employer contributions. The plan has 1012 active participants and 41 retirees and beneficiaries receiving benefits who pay monthly premiums between $431 for single coverage and $869 for family coverage. Administrative costs of the plan are financed through investment earnings and employer contributions.
Summary of Significant Accounting Policies
Basis of Accounting: The financial statements of the plan are presented as a trust fund in the City’s Comprehensive Annual Financial Report (CAFR) and are prepared on the accrual basis of accounting. Employer contributions, if made, are recognized when due and the employer has made a formal commitment to provide the contributions. Benefits and refunds are recognized when due and payable in accordance with the terms of the plan.
Method Used to Value Investments: Fund investments are reported at fair value. The City’s investment policies are defined in Note 1 of the financial statements.
Plan Membership
Plan membership as of December 31, 2018 is as follows:
Active members 1,012 Inactive members receiving benefits 41 Inactive members not yet receiving benefits -
1,053
Investments
The plan’s policy in regard to the allocation of invested assets is established by the City. The long-term expected rate of return for each major asset class included in the asset allocation at the end of 2018 is as follows:
Asset ClassTarget
Allocation
Long-term Expected Real Rate of Return
Equities 13.00% 6.00%Fixed income 59.00% 3.00%Money market 28.00% -0.40%Total 100.00%
The long-term rate of return also included an expected 2.5% inflation for 2018. The long-term expected rate of return at December 31, 2018 was 4.0%.

City of Fort Smith, Arkansas Notes to Basic Financial Statements
December 31, 2018
118
Net OPEB Liability
The net OPEB liability is measured as the total OPEB liability, less the amount of the plan’s fiduciary net position. A single discount rate of 4.11% was used to measure the total OPEB liability as of December 31, 2018. The long-term rate of return on OPEB plan investments was determined using a building block method in which best-estimate ranges of expected future real rates of return.
Actuarial assumptions: The total OPEB liability was determined by an actuarial valuation as of December 31, 2018, using the following actuarial assumptions, applied to all periods included in the measurement, unless otherwise specified:
Actuarial cost method:
Entry Age Normal Inflation:
2.5 percent per year
Payroll growth 3.25 percent Health care cost trend rates:
8.00 percent initial, decreasing 0.5 percent per year to an ultimate rate of 4.5 percent
Single discount rate:
4.11 percent at 12/31/18 (4.00 percent at 12/31/17) Cost Method Allocation of Actuarial Present Value of Future Benefits for services
prior and after the Measurement Date was determined using Entry Age Normal Level & of Salary method where:
Service for each individual participant, payable from date of employment to date of retirement, is sufficient to pay for the participant’s benefit at retirement; and
Annual Service Cost is a constant percentage of the participant’s salary that is assumed to increase according to the Payroll Growth,
Retirement age:
Expected retirement ages of general employees are based on information provided by the Arkansas Public Employees Retirement System (APERS)
Mortality:
RPH-2018 Total Dataset Mortality Table fully generational using Scale MP-2018 (RPH-2018 table is created based on RPH-2014 Total Dataset Mortality Table with 8 years to MP-2014 mortality improvement backed out, projected to 2018 using MP-2018 improvement)
The actuarial assumptions used in the December 31, 2018 valuation were based on the results of an actuarial experience study for the period January 1, 2016 – December 31, 2016.
The Plan uses a yield for 20-year tax-exempt general obligation municipal bonds with an average rating of AA/Aa or higher to determine the bond rate. The bond index range as of December 31, 2018 was 3.64%-4.11%. The Trust maintains a minimal fiduciary net position; therefore, the single discount rate is used that results in a total actuarial present value of all projected benefit payments equal to the sum of the actuarial present values of benefit payments determined through an iterative process as prescribed by GASB.

City of Fort Smith, Arkansas Notes to Basic Financial Statements
December 31, 2018
119
The components of the net OPEB liability of the City at December 31, were as follows:
Increase (Decrease)Total OPEB Plan Fiduciary Net OPEB
Liability Net Position Liability(a) (b) (a) -(b)
Balance at January 1, 2018 (as restated) 29,935,757$ 1,484,573$ 28,451,184$
Changes for the year:Service cost 688,122 - 688,122 Interest 1,219,581 - 1,219,581 Contributions - employer - 271,381 (271,381) Changes of assumptions (18,537,237) - (18,537,237) Net investment income - 27,907 (27,907) Administrative fees - (25,666) 25,666 Benefit payments (271,381) (271,381) -
Net Changes (16,900,915) 2,241 (16,903,156)
Balance at December 31, 2018 13,034,842$ 1,486,814$ 11,548,028$
The schedule of investment return for the City’s OPEB Plan is as follows for the years ended December 31,
2018
Annual money-weighted rate of return,
net of investment expense 0.15%
Sensitivity of the total OPEB liability to changes in the discount rate: Below is a table providing the sensitivity of the net OPEB liability to changes in the discount rate as of December 31, 2018. In particular, the table presents the plan’s net OPEB liability if it were calculated using a single discount rate that is one-percentage-point lower or one-percentage-point higher than the assumed rate:
1% DecreaseCurrent Single Rate
Assumption 1% Increase
3.11% 4.11% 5.11%
Net OPEB liability 12,869,771$ 11,548,028$ 10,360,967$
Sensitivity of the Net OPEB Liability to theSingle Discount Rate Assumption

City of Fort Smith, Arkansas Notes to Basic Financial Statements
December 31, 2018
120
Sensitivity of the total OPEB liability to changes in the healthcare cost trend rates: Below is a table providing the sensitivity of the net OPEB liability to changes in the health care trend rates as of December 31, 2018. In particular, the table presents the plan’s net OPEB liability if it were calculated using a single health care trend rate that is one-percentage-point lower or one-percentage-point higher than the assumed rate:
1% DecreaseCurrent Single Rate
Assumption 1% Increase
7.00%-3.50% 8.00%-4.50% 9.00%-5.50%
Net OPEB liability 10,037,886$ 11,548,028$ 13,330,125$
Sensitivity of the Net OPEB Liability to theHealth Care Trend Rate
OPEB Expenses and Deferred Outflows/Inflows of Resources related to OPEB
For the year ended December 31, 2018, the City recognized a reduction in OPEB expense of $(167,444). At December 31, 2018, the City reported deferred outflows or resources and deferred inflows of resources related to OPEB from the following sources:
Deferred DeferredOutflows of Inflows ofResources Resources
Changes of assumptions -$ (16,477,544)$ Net difference between projected and
actual earnings on OPEB planinvestments 13,212 -
13,212$ (16,477,544)$
2018

City of Fort Smith, Arkansas Notes to Basic Financial Statements
December 31, 2018
121
Amounts reported as deferred outflows of resources and deferred inflows or resources at December 31, 2018, related to OPEB will be recognized as OPEB expense as follows:
Year ending December 31,
2019 (2,056,390)$ 2020 (2,056,390) 2021 (2,056,390) 2022 (2,056,390) 2023 (2,059,693)
Thereafter (6,179,079)
(16,464,332)$
The City’s policy in regard to the allocation in invested assets is established and may be amended by the City’s Board of Directors, which is the Plan’s Board, by a majority vote of its members. It is the policy of the Board to pursue an investment strategy that reduces risk.
The fair value of individual investments that represented 5% or more of the Plan’s net position restricted for postemployment benefits other than pensions was as follows:
Investment Fair Value
Federated Treasury Obligations Fd 68 424,592$ ISHARES AGENCY BOND ETF 179,408 ISHARES 1-3 YEAR TREASURY BOND ETF 159,714 ISHARES 3-7 YEAR TREASURY BOND ETF 131,719 ISHARES 7-10 YEAR TREASURY BOND ETF 109,410 ISHARES CORE U.S. AGGREGATE BOND ETF 149,086 ISHARES SHORT TREASURY BOND ETF 84,821 ISHARES TIPS BOND ETF 101,844 BMO HARRIS BANK NA DEATH PUT FDIC CERT 149,946
December 31, 2018

City of Fort Smith, Arkansas Notes to Basic Financial Statements
December 31, 2018
122
Note 9: Commitments and Contingencies
Litigation
In the course of business, a number of claims and lawsuits arise from individuals seeking compensation for personal injury and/or property damage resulting from accidents occurring in the City. In addition, the City has been named as a defendant in a number of lawsuits relating to personnel and contractual matters. Management does not believe that the outcome of these claims will have a material adverse effect on the City’s financial position. The City appropriates funds necessary to meet settlements and awards. The City accrues a liability when it is incurred and when the contingency is probable and reasonably estimable. At December 31, 2018, the City has accrued a liability in the amount of $82,500.
Contingencies
The City has received federal and state financial awards in the form of grants and entitlements that are subject to review and audit by the grantor agencies. Such audits could result in requests for reimbursement by the grantor agency for expenditures disallowed under terms and conditions specified in the grant agreements. In the opinion of City management, such disallowances, if any, will not be significant.
In 2015, the City entered into a Consent Decree with the United States Environmental Protection Agency (EPA), the United States Department of Justice (DOJ), and the Arkansas Department of Environmental Quality (ADEQ). The Consent Decree addresses the City’s compliance with the Federal Clean Water Act involving dry and wet weather overflows from the sanitary sewer system and ongoing maintenance. There have been no penalties associated with the Consent Decree assessed in 2018.
Note 10: Individual Fund Disclosures
Interfund receivables and payables as of December 31, 2018 are as follows:
Fund Receivables Payables
Governmental Funds:General Fund 127,836$ -$ Special Revenue Funds - 301,292
Proprietary Funds:Water and Sewer 173,456 -
Total 301,292$ 301,292$

City of Fort Smith, Arkansas Notes to Basic Financial Statements
December 31, 2018
123
Interfund transfers in (out) for the year ended December 31, 2018, is as follows:
Fund In OutPrimary Government - Governmental Funds:
Major funds:General Fund 2,524,814$ 1,017,000$ Special revenue - Street Maintenance Fund - 115,000 Sales Tax Fund - 1,831,814 LOPFI Contribution 150,000 -
Non-major funds:Special revenue 777,000 -
Total governmental funds 3,451,814 2,963,814
Proprietary Funds:Water and Sewer Fund - 215,000 Sanitation Fund 90,000 363,000
Total proprietary funds 90,000 578,000
Total primary government 3,541,814$ 3,541,814$
Transfers
The transfers out from the General Fund include $777,000 to the Convention Center Fund for the annual revenue estimate. The transfers out from the Sales Tax Fund include $1,831,814 to the General Fund is for the funding allocation of expenses based on the City’s 2018 Budget.
Note 11: Landfill Closure and Postclosure Care Costs
In October 1991, the EPA issued rules and regulations which require the City to place a final cover on its Municipal Solid Waste Landfill (MSWLF) when it stops accepting waste and to perform certain maintenance and monitoring functions at the site for a period of 30 years following closure of the site.
In 1994, the City adopted GASB Statement 18, Accounting for Municipal Solid Waste Landfill Closure and Postclosure Care Costs. This statement requires that the City recognize a portion of the closure and postclosure care costs referred to above as an operating expense in each fiscal year based on landfill capacity used as of each fiscal year-end, even though such costs will be paid only near or after the date that the landfill stops accepting waste.

City of Fort Smith, Arkansas Notes to Basic Financial Statements
December 31, 2018
124
The City’s permitted landfill capacity is 60,222,935 cubic yards. The life of the landfill is projected at 125 years. The landfill was opened on October 9, 1993. The City’s reported landfill closure and postclosure care liability at December 31, 2018, is $ 8,251,531 . The remaining estimated closure and postclosure care costs of approximately $37.2 million will be recognized as the remaining capacity is filled. The percentage of landfill capacity used to date was approximately 20.7% at December 31, 2018. These amounts are based upon annual engineering estimates of what it would cost to perform all closure and postclosure costs, based on the City’s approved closure plan, through December 31, 2018. Actual costs may be significantly higher due to inflation, changes in technology, or changes in regulations by the Arkansas Department of Environmental Quality.
The City is required by state and federal laws and regulations to make annual contributions to a trust to finance closure and postclosure care costs. The amount of financial assurance required by the state as of December 31, 2018, is $8,152,348. In order to comply with this requirement, BancorpSouth issued an irrevocable standby letter of credit that is pledged to the Arkansas Department of Environmental Quality in the amount of $8,325,000 at December 31, 2018. The City has also pledged a certificate of deposit investment as collateral for the letter of credit. The City will increase the value of the letter of credit and certificate of deposit held as collateral to meet the required level of financial assurance during 2018.
Note 12: New Applicable GASB Standards
GASB Statement No. 83 – Certain Asset Retirement Obligations This statement addresses issues in accounting and financial reporting for certain asset retirement obligations (AROs), including establishing criteria for determining the timing and pattern of recognition of a liability and a corresponding deferred outflow of resources for AROs. This statement is effective for periods beginning after June 15, 2019, with earlier application encouraged. GASB Statement No. 84 – Fiduciary Activities This statement provides for greater consistency and comparability by establishing specific criteria for identifying activities that should be reported as fiduciary activities and clarifying whether and how business-type activities should report their fiduciary activities. This statement is effective for periods beginning after December 15, 2019, with earlier application encouraged.
GASB Statement No. 87 – Leases This statement increases the usefulness of government’s financial statements by requiring recognition of certain lease assets and liabilities for leases that previously were classified as operating leases and recognized as inflows of recourses and outflows of resources based on the payment provision of the contract. Under this Statement, a lessee is required to recognize a lease liability and an intangible right-to-use lease asset, and a lessor is required to recognize a lease receivable and a deferred inflow of resources, thereby enhancing the relevance and consistency of information about governments’ leasing activities. This statement is effective for reporting periods beginning after June 15, 2021, with earlier application encouraged.

City of Fort Smith, Arkansas Notes to Basic Financial Statements
December 31, 2018
125
GASB Statement No. 88 – Certain Disclosures Related to Debt, Including Direct Borrowings and Direct Placements This statement defines debt for purposes of disclosure in notes to financial statements as a liability that arises from a contractual obligation to pay cash (or other assets that may be used in lieu of cash) in one or more payments to settle an amount that is fixed at the date the contractual obligation is established and requires that additional essential information related to debt be disclosed in notes to financial statements, including unused lines of credit; assets pledged as collateral for the debt; and terms specified in debt agreements related to significant events of default with finance-related consequences, significant termination events with finance-related consequences, and significant subjective acceleration clauses. This statement is effective for reporting periods beginning after June 15, 2019, with earlier application encouraged. GASB Statement No. 89 – Accounting for Interest Cost Incurred before the End of a Construction Period
The objective of this statement is to enhance the relevance and comparability of information about capital assets and the cost of borrowing for a reporting period and to simplify accounting for interest cost incurred before the end of a construction period. This statement is effective for periods beginning after December 15, 2020, with earlier application encouraged. GASB Statement No. 90 – Majority Equity Interests
The objective of this statement is to provide consistency in the reporting of majority equity interests and improve the relevance of information related to certain component units. This statement is effective for periods beginning after December 15, 2019, with earlier application encouraged. GASB Statement No. 91 – Conduit Debt Obligations
The primary objectives of this statement are to provide a single method of reporting conduit debt obligations by issuers and eliminate diversity in practice associated with commitments extended by issuers, arrangements associated with conduit debt obligations and related note disclosures. The requirements of this statement are effective for reporting periods beginning after December 15, 2021, with earlier application encourage The City has not yet determined the potential impact of implementing the statements above.

City of Fort Smith, Arkansas Notes to Basic Financial Statements
December 31, 2018
126
Note 13: Condensed Financial Statements-Discretely Presented Component Units
The following presents condensed financial statements for each of the four discretely presented component units:
Statement of Net Position December 31, 2018
Governmental Business-Type
Advertising
and Promotion Commission Public Library Total
Parking Authority
Airport Commission Total
Assets
Current assets 396,975$ 1,277,413$ 1,674,388$ 473,187$ 4,713,245$ 5,186,432$
Sales taxes receivable from
the City - 253,254 253,254 - - -
Capital assets, net of accumulated
depreciation, as applicable - 756,771 756,771 1,388,916 37,520,677 38,909,593
Noncurrent assets - - - - 957,659 957,659
Total assets 396,975 2,287,438 2,684,413 1,862,103 43,191,581 45,053,684
Deferred Outflows of Resources
Deferred outflow related to pension - 439,543 439,543 - - -
Deferred amount on refunding - - - - 70,807 70,807
Total deferred outflows of resources - 439,543 439,543 - 70,807 70,807
Liabilities
Current liabilities 31,733 143,036 174,769 73,219 1,026,433 1,099,652
Noncurrent liabilities - 1,638,782 1,638,782 542 1,700,000 1,700,542
Total liabilities 31,733 1,781,818 1,813,551 73,761 2,726,433 2,800,194
Deferred Inflows of Resources
Deferred inflow related to pension - 241,024 241,024 - - -
Total deferred inflows of resources - 241,024 241,024 - - -
Net Position
Net investment in capital assets - 756,771 756,771 1,388,916 35,681,484 37,070,400
Restricted 365,242 - 365,242 - 441,523 441,523
Unrestricted (deficit) - (52,632) (52,632) 399,426 4,412,948 4,812,374
Total net position 365,242$ 704,139$ 1,069,381$ 1,788,342$ 40,535,955$ 42,324,297$

City of Fort Smith, Arkansas Notes to Basic Financial Statements
December 31, 2018
127
Statement of Activities For the Year Ended December 31, 2018
Net (Expense) Revenue and
Program Revenues Changes in Net Position
Fees, Fines, and Operating Governmental Activities
Charges for Grants and Advertising and Public
Expenses Services Contributions Promotion Library Total
Advertising/Promotion 905,209$ -$ 4,600$ (900,609)$ -$ (900,609)$
Public Library 2,983,639 200,354 165,613 - (2,617,672) (2,617,672)
Total 3,888,848$ 200,354$ 170,213$ (900,609) (2,617,672) (3,518,281)
General revenues
Property taxes - 1,483,569 1,483,569
Sales taxes - 1,008,320 1,008,320
Hospitality hotel/motel taxes 799,364 - 799,364
Unrestricted investments earnings 2,168 2,425 4,593
Other 6,754 184,678 191,432
Total general revenues 808,286 2,678,992 3,487,278
Change in net position (92,323) 61,320 (31,003)
Net position, beginning, as previously stated 457,565 642,819 1,100,384
Net position, ending 365,242$ 704,139$ 1,069,381$
Net (Expense) Revenue andProgram Revenues Changes in Net Position
Fees, Fines, and Capital Business-Type Activities
Charges for Grants and Parking Airport
Expenses Services Contributions Authority Commission Total
Parking Authority 259,793$ 183,484$ -$ (76,309)$ -$ (76,309)$
Airport Commission 4,675,033 2,908,921 3,437,563 - 1,671,451 1,671,451
Total 4,934,826$ 3,092,405$ 3,437,563$ (76,309) 1,671,451 1,595,142
General revenues
Unrestricted investment earnings 2,543 48,325 50,868
Total general revenues 2,543 48,325 50,868
Change in net position (73,766) 1,719,776 1,646,010
Net position, beginning 1,862,108 38,816,179 40,678,287
Net position, ending 1,788,342$ 40,535,955$ 42,324,297$

City of Fort Smith, Arkansas Notes to Basic Financial Statements
December 31, 2018
128
Note 14: Subsequent Events
Subsequent events have been evaluated through June 15, 2020, the date at which the financial statements were available to be issued.
As a result of the spread of the COVID-19 coronavirus, economic uncertainties have arisen which may negatively affect the financial position, results of operations and cash flows of the City. The duration of these uncertainties and the ultimate financial effects cannot be reasonably estimated at this time.
The City invests in various investment securities. Investment securities are exposed to various risks such as interest rate, market and credit risks. Due to the level of risk associated with certain investment securities, it is at least reasonably possible that changes in the values of investment securities will occur in the near term and that such changes could materially affect the amounts reported in the accompanying statements of financial position.

129
REQUIRED SUPPLEMENTARY INFORMATION

130
City of Fort Smith, Arkansas Required Supplementary Information
Agent Multiple-Employer Plan
Schedule of the City’s Net Pension
Liability and Related Ratios – FRPF (the Old Fire Plan)
Fiscal Year Ended December 31, 2018 2017 2016 2015
Total Pension LiabilityService Cost -$ -$ -$ -$ Interest 2,387,422 2,458,896 2,531,326 2,601,031 Benefit Changes - - - - Difference between expected and actual experience 138,769 (151,195) 116,585 385,846 Assumption Changes 1,767,387 - 680,689 - Benefit Payments, including refunds
of employee contributions (2,957,863) (3,502,026) (2,982,945) (4,733,419)
Net Change in Total Pension Liability 1,335,715 (1,194,325) 345,655 (1,746,542)
Total Pension Liability - Beginning 32,284,383 33,478,708 33,133,053 34,879,595
Total Pension Liability - Ending (a) 33,620,098$ 32,284,383$ 33,478,708$ 33,133,053$
Plan Fiduciary Net PositionContributions - Employer* 1,540,550$ 1,666,114$ 1,866,654$ 1,741,331$ Contributions - Member - 747 4,708 5,118 Net Investment Income 1,736,826 784,066 26,779 1,131,513 Benefit Payments, including refunds
of employee contributions (2,957,863) (3,502,026) (2,982,945) (4,733,419) Administrative Expense (22,267) (25,264) (33,915) (26,887) Deferred Retirement Option Distributions - - - - Reconciliation Adjustment - - - -
Net Change in Plan Fiduciary Net Position 297,246 (1,076,363) (1,118,719) (1,882,344)
Plan Fiduciary Net Position - Beginning 13,109,268 14,185,631 15,304,350 17,186,694
Plan Fiduciary Net Position - Ending (b) 13,406,514$ 13,109,268$ 14,185,631$ 15,304,350$
City's Net Pension Liability (a) - (b) 20,213,584$ 19,175,115$ 19,293,077$ 17,828,703$
Plan Fiduciary Net Position as a Percentageof Total Pension Liability 39.88% 40.61% 42.37% 46.19%
Covered Payroll 74,302$ 86,657$ 156,943$ -$
City's Net Pension Liability as a Percentage of Covered Payroll 27204.63% 22127.60% 12293.05% N/A
* Includes assets reported as State Insurancce Tax Turnback Money
Information in this schedule has been determined as of the measurement date (December 31 of the year prior to the most recent fiscal year-end) of the City’s net pension liability.
This schedule is presented to illustrate the requirement to show information for 10 years. However, until a full 10-year trend is compiled under the provisions of GASB 68, the City will only present available information.
(1): Assumption changes for 2017 include a decrease in the price inflation from 3.75 to 3.00 percent and a salary increase from 3.75 to 4.00 percent. There was no change in investment rate of return 7.75 percent in 2017.
(2): Assumption changes for 2018 include an increase in the price inflation from 3.00 to 3.75 percent and a salary decrease from 4.00 to 3.75 percent. There was no change in investment rate of return of 7.75 percent.

131
City of Fort Smith, Arkansas Required Supplementary Information
Agent Multiple-Employer Plan
Schedule of the City’s Pension
Contributions – FRPF (the Old Fire Plan)
FY Ended December 31,
Actuarially Determined Contribution
(ADC)Actual
Contribution
Contribution Deficiency (Excess) Covered Payroll
Actual Contribution as a % of Covered
Payroll
2018 1,439,040$ 1,439,040$ -$ 86,750$ 1658.84%2017 1,835,156 1,835,156 - 74,302 2469.86%2016 1,418,363 1,418,363 - 84,626 1676.04%2015 1,609,084 1,609,084 - 156,943 1025.27%
Key Assumptions for ADC:
Methods and Assumptions Used to Determine Contribution Rates:Actuarial Cost Method Individual Entry-Age NormalAmortization Method Closed Amortization Period based on projected future payrollRemaining Amortization Period 20 years beginning January 1, 2019Asset Valuation Method 5-Year smoothed market; 20% corridor (for funding purposes)Price Inflation 2.75%Salary Increases
Investment Rate of Return 7.75%Retirement Age
Mortality
Other Information:Notes There were no benefit changes during the year.
3.75%, which is the portion of the individual pay increase assumptions attributable to wage inflation
Experience-based table of rates that are specific to the type of eligibility condition. Last updated for the 2012 valuation pursuant to an experience study of the period 2008-2011.RP-2000 Combined Mortality Table, projected to 2017 and set forward two years for men. For disabled lives, the mortality rates are the rates applicable to non-disabled lives set forward 10 years.
Information in this schedule has been determined as of the City’s most recent fiscal year-end.
This schedule is presented to illustrate the requirement to show information for 10 years. However, until a full 10-year trend is compiled under the provisions of GASB 68, the City will only present available information.

132
City of Fort Smith, Arkansas Required Supplementary Information
Agent Multiple-Employer Plan
Schedule of the City’s Net Pension
Liability and Related Ratios – PRPF (the Old Police Plan)
Fiscal Year Ended December 31, 2018 2017 2016 2015
Total Pension LiabilityService Cost -$ -$ -$ -$ Interest 1,940,131 1,962,715 1,968,295 1,944,283 Benefit Changes - - - - Difference Between Actual & Expected Experience 1,495,866 385,696 652,213 614,152 Assumption Changes 1,627,412 - 396,928 - Benefit Payments, including refunds
of employee contributions (2,959,388) (2,320,229) (2,271,315) (2,245,252)
Net Change in Total Pension Liability 2,104,021 28,182 746,121 313,183
Total Pension Liability - Beginning 26,513,645 26,485,463 25,739,342 25,426,159
Total Pension Liability - Ending (a) 28,617,666$ 26,513,645$ 26,485,463$ 25,739,342$
Plan Fiduciary Net PositionContributions - Employer* 1,429,779$ 1,509,135$ 1,596,703$ 1,554,845$ Contributions - Member - - - 490 Net Investment Income 996,413 463,067 15,584 624,174 Benefit Payments, including refunds
of employee contributions (2,959,388) (2,320,229) (2,271,315) (2,245,252) Administrative Expense (12,774) (15,173) (19,925) (14,832) Deferred Retirement Option Distributions - - - - Reconciliation Adjustment - - - -
Net Change in Plan Fiduciary Net Position (545,970) (363,200) (678,953) (80,575)
Plan Fiduciary Net Position - Beginning 7,879,029 8,242,229 8,921,182 9,001,757
Plan Fiduciary Net Position - Ending (b) 7,333,059$ 7,879,029$ 8,242,229$ 8,921,182$
City's Net Pension Liability (a) - (b) 21,284,607$ 18,634,616$ 18,243,234$ 16,818,160$
Plan Fiduciary Net Position as a Percentageof Total Pension Liability 25.62% 29.72% 31.12% 34.66%
Covered Payroll -$ -$ -$ -$
City's Net Pension Liability as a Percentage of Covered Payroll N/A N/A N/A N/A
* Includes assets reported as State Insurancce Tax Turnback Money
Information in this schedule has been determined as of the measurement date (December 31 of the year prior to the most recent fiscal year-end) of the City’s net pension liability.
This schedule is presented to illustrate the requirement to show information for 10 years. However, until a full 10-year trend is compiled under the provisions of GASB 68, the City will only present available information.
(1): Assumption changes for 2017 include an increase in the price inflation from 3.75 to 3.00 percent and a salary increase from 3.75 to 4.00 percent. There was no change in investment rate of return 7.75 percent in 2017.
(2): Assumption changes for 2018 include an increase in the price inflation from 3.00 to 3.75 percent and a salary decrease from 4.00 to 3.75 percent. There was no change in investment rate of return of 7.75 percent.

133
City of Fort Smith, Arkansas Required Supplementary Information
Agent Multiple-Employer Plan
Schedule of the City’s Pension
Contributions – PRPF (the Old Police Plan)
FY Ended December 31,
Actuarially Determined Contribution
(ADC)Actual
Contribution
Contribution Deficiency (Excess) Covered Payroll
Actual Contribution as a % of Covered
Payroll
2018 1,334,976$ 1,334,976$ -$ -$ N/A2017 1,069,269$ 1,069,269$ -$ -$ N/A2016 1,256,207$ 1,256,207$ -$ -$ N/A2015 1,372,907$ 1,372,907$ -$ -$ N/A
Key Assumptions for ADC:
Methods and Assumptions Used to Determine Contribution Rates:Actuarial Cost Method Individual Entry-Age NormalAmortization Method Closed Amortization Period based on projected future payrollRemaining Amortization Period 20 years beginning January 1, 2019Asset Valuation Method 5-Year smoothed market; 20% corridor (for funding purposes)Price Inflation 2.75%Salary IncreasesInvestment Rate of Return 7.75%Retirement Age
Mortality
Other Information:Notes There were no benefit changes during the year.
3.75%, which is the portion of the individual pay increase assumptions
Experience-based table of rates that are specific to the type of eligibility condition. Last updated for the 2012 valuation pursuant to an experience study of the period 2008-2011.RP-2000 Combined Mortality Table, projected to 2017 and set forward two years for men. For disabled lives, the mortality rates are the rates applicable to non-disabled lives set forward 10 years.
Information in this schedule has been determined as of the City’s most recent fiscal year-end.
This schedule is presented to illustrate the requirement to show information for 10 years. However, until a full 10-year trend is compiled under the provisions of GASB 68, the City will only present available information.

134
City of Fort Smith, Arkansas Required Supplementary Information
Schedule of the City’s Proportionate Share of the Net
Pension Liability – LOPFI (the New Plans)
Plan Fiscal Year Ended December 31, 2018 2017 2016 2015
City's proportion of the net pensionliability 4.0601% 4.3186% 4.9028% 4.9183%
City's proportionate share of the netpension liability 28,851,157$ 24,639,054$ 25,717,186$ 17,804,470$
City's covered payroll 16,657,860$ 15,585,218$ 16,226,346$ 17,203,371$
City's proportionate share of the netpension liability as a percentage of itscovered payroll 173.20% 158.09% 158.49% 103.49%
Plan fiduciary net position as apercentage of the total pensionliability 72.87% 72.87% 72.92% 79.14%
Information in this schedule has been determined as of the measurement date (December 31 of the year prior to the most recent fiscal year-end) of the City’s net pension liability.
This schedule is presented to illustrate the requirement to show information for 10 years. However, until a full 10-year trend is compiled under the provisions of GASB 68, the City will only present available information.

135
City of Fort Smith, Arkansas Required Supplementary Information
Schedule of City’s Contributions – LOPFI (the New Plans)
Plan Fiscal Year Ended December 31, 2018 2017 2016 2015
Actuarially required contribution 3,284,942$ 2,904,425$ 2,674,571$ 3,043,184$
Contributions in relation to theactuarially required contribution (3,284,942) (2,904,425) (2,674,571) (3,043,184)
Contribution deficiency (excess) -$ -$ -$ -$
City's covered payroll 16,657,860$ 15,585,218$ 16,226,346$ 17,203,371$
Contributions as a percentage ofcovered payroll 19.72% 18.64% 16.48% 17.69%
Information in this schedule has been determined as of the City’s most recent fiscal year-end.
This schedule is presented to illustrate the requirement to show information for 10 years. However, until a full 10-year trend is compiled under the provisions of GASB 68, the City will only present available information.

136
City of Fort Smith, Arkansas Required Supplementary Information
Schedule of the City’s Proportionate Share of the Net
Pension Liability – APERS
Plan Fiscal Year Ended June 30, 2018 2017 2016 2015
City's proportion of the net pensionliability 0.0047% 0.0048% 0.0048% 0.0049%
City's proportionate share of the netpension liability 103,956$ 125,123$ 115,180$ 90,125$
City's covered payroll 91,675$ 87,267$ 92,221$ 87,267$
City's proportionate share of the netpension liability as a percentage of itscovered payroll 113.40% 143.38% 124.90% 103.27%
Plan fiduciary net position as apercentage of the total pensionliability 79.59% 75.65% 75.50% 80.39%
Information in this schedule has been determined as of the measurement date (June 30 of the year prior to the most recent fiscal year-end) of the City’s net pension liability.
This schedule is presented to illustrate the requirement to show information for 10 years. However, until a full 10-year trend is compiled under the provisions of GASB 68, the City will only present available information.

137
City of Fort Smith, Arkansas Required Supplementary Information
Schedule of City’s Contributions – APERS
Plan Fiscal Year Ended June, 2018 2017 2016 2015
Actuarially required contribution 13,702$ 12,872$ 12,654$ 12,815$
Contributions in relation to theactuarially required contribution (13,702) (12,872) (12,654) (12,815)
Contribution deficiency (excess) -$ -$ -$ -$
City's covered payroll 91,675$ 87,267$ 92,221$ 87,267$
Contributions as a percentage ofcovered payroll 14.95% 14.75% 13.72% 14.68%
Information in this schedule has been determined as of the City’s most recent fiscal year-end.
This schedule is presented to illustrate the requirement to show information for 10 years. However, until a full 10-year trend is compiled under the provisions of GASB 68, the City will only present available information.

138
City of Fort Smith, Arkansas Required Supplementary Information
Fort Smith Public Library - APERS
Schedule of the Library's Proportionate Share of the Net Pension Liabiltiy - APERS
2018 2017 2016 2015 2014
Organization's proportion of the net pensionliability(asset) 0.07428966% 0.06648929% 0.07284649% 0.07559378% 0.07345205%
Organization's proportionate share of the netpension liability 1,638,782$ 1,718,177$ 1,742,013$ 1,392,236$ 1,042,220$
Organization's covered payroll 1,286,673$ 1,304,997$ 1,319,906$ 1,345,315$ 1,298,642$
Organization's proportionate share of the netpension liability as a percentage of itscovered payroll 127.37% 131.66% 131.98% 103.49% 80.25%
Plan fiduciary net position as apercentage of the total pensionliability 79.59% 75.65% 75.50% 80.39% 84.15%
Schedule of Library Contributions Last Fiscal Year
2018 2017 2016 2015 2014
Actuarially required contribution 189,784$ 189,225$ 191,379$ 198,569$ 193,238$
Contributions in relation to theactuarially required contribution (205,249) (173,760) (191,379) (198,569) (193,238)
Contribution deficiency (excess) (15,465)$ 15,465$ -$ -$ -$
Organization's covered payroll 1,286,673$ 1,304,997$ 1,319,906$ 1,345,315$ 1,298,642$
Contributions as a percentage ofcovered payroll 14.75% 14.50% 14.50% 14.76% 14.88%
Notes to Schedules:
Only the five fiscal years are presented because 10-year data is not yet available.

139
City of Fort Smith, Arkansas Required Supplementary Information
Other Postemployment Benefit Plan
Schedule of Changes in the City’s Net OPEB Liability and Related Ratios
Year Ended December 31, 2018
Total OPEB LiabilityService Cost 688,122$ Interest 1,219,581 Changes of Benefit TermsDifferences Between Expected
and Actual Experience - Changes of Assumptions (18,537,237) Benefit Payments (271,381)
Net Change in Total OPEB Liability (16,900,915)
Total OPEB Liability - Beginning 29,935,757
Total OPEB Liability - Ending (a) 13,034,842$
Plan Fiduciary Net PositionContributions - Employer 271,381$ Net Investment Income 27,907 Benefit Payments (271,381) Administrative Expense (25,666)
Net change in Fiduciary Net Position 2,241
Plan Fiduciary Net Position - Beginning 1,484,573
Plan Fiduciary Net Position - Ending (b) 1,486,814$
City's Net OPEB Liability - Ending (a) - (b) 11,548,028$
Plan fiduciary net position as apercentage of the total OPEBliability 11.41%
Covered-employee payroll 45,273,921$
City's Net OPEB Liability as a Percentage of covered-employee payroll 25.51%
Notes to the Schedule OPEB schedules under GASB Statement 75 included in the required supplementary information are intended to show information for ten years. GASB Statement 75 was implemented in 2018; therefore, only one year is shown. Additional years’ information will be added as it becomes available. Changes in assumption. In 2018, the assumed single discount rate was increased from 4.00 to 4.11 percent. The inflation rate remained 2.50 percent between years. The health care cost trend increased from 7.5 to 8.0 percent, decreasing 0.5 percent per year to an ultimate rate of 4.5 percent.

140
City of Fort Smith, Arkansas Required Supplementary Information
Other Postemployment Benefit Plan
Schedule of City Contributions
Year Ended December 31, 2018
Actuarially determined contribution 1,923,660$
Contributions in relation to theactuarially determined contribution (271,381)
Contribution deficiency (excess) 1,652,279$
City's covered-employee payroll 45,273,921$
Contributions as a percentage ofcovered-employee payroll 0.60%
Notes to Schedule:
Valuation Date:
Actuarially determined contributions are calculated as of December 31
Methods and assumptions used to determine contribution rates:
Actuarial cost method:
Entry Age Normal
Inflation:
2.5 percent per year Health care cost trend rates:
8.0 percent initial, decreasing 0.5 percent per year to an ultimate rate of 4.5 percent (7.5 percent initial, decreasing 0.5 percent per year to an ultimate in the prior year) rate of 4.5 percent
Single discount rate:
4.11 percent (4.0 percent in the prior year) Retirement age:
Expected retirement ages of general employees are based on information provided by the Arkansas Public Employees Retirement System (APERS)
Mortality:
RPH-2018 Total Data Set Mortality Table fully generational using Scale MP-2018 (RP-2014 Mortality Table with Improvement Scale MP-2016 in the prior year)
OPEB schedules under GASB Statement 75 included in the required supplementary information are intended to show information for ten years. GASB Statement 75 was implemented in 2018; therefore, only one year is shown. Additional years’ information will be added as it becomes available.

141
City of Fort Smith, Arkansas Required Supplementary Information
Other Postemployment Benefit Plan
Schedule of Investment Returns
Year Ended December 31, 2018
Annual money-weighted rate of return,
net of investment expense 0.15%
OPEB schedules under GASB Statement 75 included in the required supplementary information are intended to show information for ten years. GASB Statement 75 was implemented in 2018; therefore, only one year is shown. Additional years’ information will be added as it becomes available.

142
City of Fort Smith, Arkansas Required Supplementary Information
Schedule of Revenues, Expenditures and Changes in Fund Balances
Budget and Actual – General Fund
For the Year Ended December 31, 2018
Actual
GAAP Variance with
Original Final Basis Final Budget
RevenuesTaxes 7,087,000$ 7,087,000$ 7,331,663$ 244,663$ Sales taxes 22,569,000 22,065,000 22,419,834 354,834 Licenses and permits 2,194,225 2,094,225 1,881,334 (212,891) Utility franchise fees 6,654,000 6,654,000 6,840,478 186,478 Intergovernmental 5,043,656 5,046,819 3,961,754 (1,085,065) Fines and forfeitures 2,300,000 2,300,000 2,037,330 (262,670) Fees for services 599,663 596,500 570,311 (26,189) Interest 80,000 80,000 924,037 844,037 Contributions - - 1,203,126 1,203,126 Miscellaneous 100,000 115,026 498,239 383,213
46,627,544 46,038,570 47,668,106 1,629,536
ExpendituresCurrent:
General government Administration 3,576,688 3,540,610 3,156,542 (384,068) Legal 2,080,630 2,055,030 2,024,888 (30,142) Finance 1,753,950 1,712,881 1,598,545 (114,336) Public safety Police 16,676,834 16,219,515 14,218,898 (2,000,617) Fire 12,961,577 13,043,293 12,912,611 (130,682) Community services Health and social services 140,610 140,610 118,441 (22,169) Parks and recreation 2,493,889 3,335,540 2,835,221 (500,319) Transit 2,252,521 2,194,052 2,147,988 (46,064) Other 2,511,331 2,577,770 1,854,140 (723,630)
Capital outlay 4,714,060 7,373,087 4,861,702 (2,511,385)
49,162,090 52,192,388 45,728,976 (6,463,412)
Excess (deficiency) of revenues over (under) expenditures (2,534,546) (6,153,818) 1,939,130 (4,833,876)
Other Financing Sources (Uses):Transfers in 2,835,339 2,766,419 2,524,814 (241,605) Transfers out (1,017,000) (1,017,000) (1,017,000) -
1,818,339 1,749,419 1,507,814 (241,605)
(716,207) (4,404,399) 3,446,944 (5,075,481)
Fund Balances, beginning of year 14,439,056 17,295,168 17,295,168 -
Fund Balances, end of year 13,722,849$ 12,890,769$ 20,742,112$ (5,075,481)$
Budgeted Amounts
Total revenues
Total expenditures
Total other financing sources and uses
Net change in fund balances

143
City of Fort Smith, Arkansas Required Supplementary Information
Schedule of Revenues, Expenditures and Changes in Fund Balances
Budget and Actual – Street Maintenance Fund
For the Year Ended December 31, 2018
Actual
GAAP Variance with
Original Final Basis Final Budget
RevenuesTaxes 2,128,402$ 2,342,500$ 2,199,821$ (142,679)$ Licenses and permits 223,100 200,000 203,424 3,424 Intergovernmental 6,007,593 5,990,000 6,064,275 74,275 Interest 12,000 5,200 15,716 10,516 Miscellaneous 35,000 61,150 73,123 11,973
8,406,095 8,598,850 8,556,359 (42,491)
ExpendituresCurrent:
General government Administration 255,823 258,987 221,670 (37,317) Legal 114,000 114,000 129,052 15,052 Finance 583,903 570,267 516,481 (53,786) Public works Operations 557,615 568,665 517,467 (51,198) Streets 4,026,598 3,687,098 3,316,514 (370,584) Traffic control 2,056,169 2,041,349 1,917,819 (123,530) Community services Parks and recreation 209,050 300,832 281,906 (18,926) Other 593,500 683,614 - (683,614)
Capital Outlay - 228,000 261,929 33,929
8,396,658 8,452,812 7,162,838 (1,289,974)
Excess (deficiency) of revenues over (under) expenditures 9,437 146,038 1,393,521 (1,332,465)
Other Financing Uses:Transfers out (115,000) (115,000) (115,000) -
Total Other Financing Uses (115,000) (115,000) (115,000) -
Net Change in Fund Balances (105,563) 31,038 1,278,521 (1,332,465)
Fund Balances, beginning of year 2,516,637 3,292,536 3,249,570 -
Fund Balances, end of year 2,411,074$ 3,323,574$ 4,528,091$ (1,332,465)$
Total expenditures
Total revenues
Budgeted Amounts

144
City of Fort Smith, Arkansas Notes to Required Supplementary Information
December 31, 2018
Budgets and Budget Accounting
By December 1 of each year, the City Administrator is required to submit to the Board of Directors (“Board”) a proposed budget for the fiscal year beginning on the following January 1. The operating budget includes proposed expenditures and the means of financing them. Public hearings are conducted prior to adoption of the budget to allow citizen input. The state statute governing adoption of annual budgets requires the Board to approve the budget prior to February 1. For practical purposes, the Board usually adopts the budget in December.
Annual budgets are legally adopted on a basis consistent with generally accepted accounting principles for the General fund and the Street Maintenance Fund, a special revenue fund. Budget and actual schedules are presented at the department level that is the legal level of budgetary control.
Appropriations in all budgets funds lapse at the end of the fiscal year even if they have related encumbrances. Encumbrances are commitments related to unperformed (executory) contracts for goods or services (i.e., purchase orders, contracts and commitments). Encumbrance accounting is utilized to the extent necessary to assure effective budgetary control and accountability and to facilitate effective cash planning and control. While all appropriations and encumbrances technically lapse at year end, valid outstanding encumbrances (those for which performance under the executory contract is expected in the next year) are reappropriated and become part of the subsequent year’s budget pursuant to state regulations, and the encumbrances are automatically reestablished in the next year.

145
COMBINING AND INDIVIDUAL FUND FINANCIAL STATEMENTS AND
SCHEDULES SECTION

146
City of Fort Smith, Arkansas Nonmajor Governmental Funds
For the Year Ended December 31, 2018
Special Revenue Funds:
Community Development Block Grant (CDBG) - To account for the operations of projects utilizing CDBG grant funds and community development department funds. Such revenues are restricted to expenditures for specified projects by the Department of Housing and Urban Development.
Tilles Park- To account for donations received from the Tilles family estate. The money received is restricted for upgrading and maintaining Tilles Park.
HOME Investment Partnership Act- To account for federal funds administered by the Community Housing Development Organizations (CHDO) and other subrecipients to provide assistance for affordable housing.
Special Grants- To account for federal, state, and local grants received by the City. Current grants include: Department of Justice grants for personnel and equipment, Arkansas historic preservation grants, and a local grant from Sebastian County for drug law enforcement projects. These funds are restricted to expenditures for approved projects of the various agencies.
Economic Development- To account for State grants provided as pass-through funding to local entities for infrastructure improvements.
Convention Center- To account for operations of the convention center. The rental revenue generated by the center and a subsidy from the General Fund are accounted for in this fund. The City has an agreement with the Advertising & Promotion Commission (A & P) whereby the A & P manage the center.
Capital Projects Fund:
Sales and Use Tax Construction Fund- To account for the proceeds of the Sales and Use Tax Refunding and Construction Bonds and the projects funded thereby.

147
City of Fort Smith, Arkansas Combining Balance Sheet – Nonmajor Governmental Funds
December 31, 2018
CapitalProjects
HOME TotalCommunity Investment Sales NonmajorDevelopment Partnership Special Convention & Use Tax GovernmentalBlock Grant Tilles Park Act Grants Center Construction Funds
AssetsCash 9,251$ -$ 27,184$ 2,059$ 163,385$ -$ 201,879$ Investments - 25,667 - 168,307 530,798 - 724,772 Receivables, net of allowance
for uncollectiblesAccounts - - - - 7,173 - 7,173
Due from other governments 37,159 - 16,505 7,746 - - 61,410 Deposits - - - - - 504,041 504,041
Total assets 46,410$ 25,667$ 43,689$ 178,112$ 701,356$ 504,041$ 1,499,275$
Liabilities and Fund BalancesLiabilities:
Accounts payable and accrued liabilities 49,390$ -$ 16,505$ 1,450$ 76,529$ -$ 143,874$
Due to other funds 127,836 - - - - 173,456 301,292 Unearned revenues - - - 85,122 - - 85,122 Other 2,323 - - - 369 - 2,692
Total liabilities 179,549 - 16,505 86,572 76,898 173,456 532,980
Fund Balances:Nonspendable - - - - - 504,041 504,041 Restricted for:
Construction projects - - - 91,540 - - 91,540 Parks & recreation - 25,667 - - - - 25,667 Housing and rehabilitation - - 27,184 - - - 27,184
Assigned to:Convention center - - - - 624,458 - 624,458
Unassigned (deficit) (133,139) - - - - (173,456) (306,595)
Total Fund Balances (133,139) 25,667 27,184 91,540 624,458 330,585 966,295
46,410$ 25,667$ 43,689$ 178,112$ 701,356$ 504,041$ 1,499,275$
Special Revenue
Total liabilities and fund balances

148
City of Fort Smith, Arkansas Combining Statement of Revenues, Expenditures and Changes in Fund Balance –
Nonmajor Governmental Funds For the Year Ended December 31, 2018
Special Revenue Capital Projects
HOME TotalCommunity Investment Sales NonmajorDevelopment Partnership Special Convention & Use Tax GovernmentalBlock Grant Tilles Park Act Grants Center Construction Funds
RevenuesIntergovernmental 1,070,051$ -$ 800,892$ 132,936$ -$ -$ 2,003,879$ Fees for services - - - - 782,643 - 782,643 Interest - 136 - 925 2,808 17,228 21,097 Miscellaneous 57 - - - 1,114 - 1,171
Total revenues 1,070,108 136 800,892 133,861 786,565 17,228 2,808,790
ExpendituresCurrent:
Public safety Police - - - 143,834 - - 143,834 Community services Parks and Recreation - - - 140 - - 140 Convention Center - - - - 1,535,760 - 1,535,760 Housing and Rehabilitation 1,208,586 - 773,708 - - - 1,982,294 Capital Outlay - - - - 83,173 1,942,853 2,026,026
Total expenditures 1,208,586 - 773,708 143,974 1,618,933 1,942,853 5,688,054
Excess (deficiency) of revenues over (under) expenditures (138,478) 136 27,184 (10,113) (832,368) (1,925,625) (2,879,264)
Other Financing Sources (Uses)Transfers in - - - - 777,000 - 777,000
Total Other Financing Sources and Uses - - - - 777,000 - 777,000
Net Change in Fund Balances (138,478) 136 27,184 (10,113) (55,368) (1,925,625) (2,102,264)
Fund Balances, beginning of year 5,339 25,531 - 101,653 679,826 2,256,210 3,068,559
Fund Balances, end of year (133,139)$ 25,667$ 27,184$ 91,540$ 624,458$ 330,585$ 966,295$

149
City of Fort Smith, Arkansas Internal Service Funds
For the Fiscal Year Ended December 31, 2018
Working Capital- To account for the accumulation and allocation of costs associated with fuel and duplicating services.
Employee Insurance- To account for monthly premiums contributed by the City and its employees for health insurance coverage and to provide for payment of life insurance premiums. The plan is self-insured with a third party administrator acting as paying agent for claims. Premiums are accumulated in this fund for the payment of employee insurance claims.
Workers’ Compensation- To account for amounts contributed for workers’ compensation. Workers’ compensation contributions are accumulated in this fund for the payment of workers’ compensation claims.

150
City of Fort Smith, Arkansas Combining Statement of Net Position
Internal Service Funds
December 31, 2018
Working Employee Workers'
Capital Insurance Compensation Total
Assets
Current Assets
Cash 182,180$ 2,546,666$ 365,496$ 3,094,342$
Investments - 4,088,277 577,789 4,666,066
Receivables, net of allowance for uncollectibles
Accounts - 28,435 - 28,435
Inventory 29,813 - - 29,813
Prepaid items & deposits - - 15,000 15,000
Total Current Assets 211,993 6,663,378 958,285 7,833,656
Total Assets 211,993 6,663,378 958,285 7,833,656
Liabilities
Current Liabilities
Accounts payable and accrued liabilities 49,578 183,071 20,757 253,406
Claims and judgments - 723,415 1,014,849 1,738,264
Total Current Liabilities 49,578 906,486 1,035,606 1,991,670
Total Liabilities 49,578 906,486 1,035,606 1,991,670
Net Position
Unrestricted (deficit) 162,415 5,756,892 (77,321) 5,841,986
Net Position 162,415$ 5,756,892$ (77,321)$ 5,841,986$

151
City of Fort Smith, Arkansas Combining Statement of Revenues, Expenses and
Changes in Fund Net Position
Internal Service Funds
For the Year Ended December 31, 2018
Working Employee Workers'Capital Insurance Compensation Total
Operating RevenuesCharges for services - internal 777,041$ 9,548,612$ 643,467$ 10,969,120$ Charges for services - external - 397,876 - 397,876
Total Operating Revenues 777,041 9,946,488 643,467 11,366,996
Operating ExpensesContractual services - 464,534 264,456 728,990 Materials and supplies 753,898 - - 753,898 Insurance claims and expenses - 7,277,575 889,219 8,166,794
Total Operating Expenses 753,898 7,742,109 1,153,675 9,649,682
Operating Income (Loss) 23,143 2,204,379 (510,208) 1,717,314
Nonoperating RevenuesInvestment earnings - 21,630 3,058 24,688
Total Nonoperating Revenues - 21,630 3,058 24,688
Income 23,143 2,226,009 (507,150) 1,742,002
Change in Net Position 23,143 2,226,009 (507,150) 1,742,002
Net position, beginning of year 139,272 3,530,883 429,829 4,099,984
Net position, ending of year 162,415$ 5,756,892$ (77,321)$ 5,841,986$

152
City of Fort Smith, Arkansas Combining Statement of Cash Flows
Internal Service Funds
For the Year Ended December 31, 2018
Working Employee Workers'Capital Insurance Compensation Total
Cash Flows from Operating Activities:Cash received from service users 776,905$ 409,974$ -$ 1,186,879$ Cash received from city and employee contributions - 9,548,612 731,695 10,280,307 Cash payments for goods and services (746,614) - - (746,614) Cash payments for premiums and other operating expenses - (464,534) - (464,534) Cash payments for claims paid - (7,237,171) (889,219) (8,126,390)
Net cash provided by (used for) operating activities 30,291 2,256,881 (157,524) 2,129,648
Cash Flows from Investing ActivitiesOutlays for purchases of investment securities - (22,400) (3,197) (25,597) Interest on investments - 22,400 3,197 25,597
Net cash provided by (used for) investingactivities - - - -
Net increase (decrease) in cash 30,291 2,256,881 (157,524) 2,129,648
Cash, beginning of year 151,889 289,785 523,020 964,694
Cash, ending of year 182,180$ 2,546,666$ 365,496$ 3,094,342$
Reconciliation of Operating Income (Loss) to Net CashProvided by (Used for) Operating ActivitiesOperating income (loss) 23,143$ 2,204,379$ (510,208)$ 1,717,314$ Change in assets and liabilities
Accounts receivable - 12,098 1,246 13,344 Due from other funds (136) - - (136) Inventory 6,712 - - 6,712 Prepaid items - 4,117 105,433 109,550 Accounts payable and accrued liabilities 572 173,686 20,757 195,015 Liability for claims and judgments - (137,399) 225,248 87,849
Total adjustments 7,148 52,502 352,684 412,334
Net cash provided by (used for) operating activities 30,291$ 2,256,881$ (157,524)$ 2,129,648$

153
City of Fort Smith, Arkansas Discretely Presented Component Units
For the Fiscal Year Ended December 31, 2018
Governmental Fund Types – Special Revenue Funds
Advertising and Promotion- To account for the operations of the Advertising and Promotion Commission utilizing revenues from the hotel/motel (hospitality) tax. These revenues are restricted to expenditures of the Advertising and Promotion Commission to promote the City and increase tourism.
Public Library- To account for the operations of the Fort Smith Public Library in providing library services to citizens.
Proprietary Fund Types – Enterprise Funds
Parking Authority- To account for the provision of parking facilities within the City. All services necessary to provide such services are accounted for in this fund including, but not limited to, administration, operations, maintenance, financing, and related debt service.
Airport Commission- To account for the provision of regional airport services. All activities necessary to provide such services are accounted for in this fund, including but not limited to, administration, operations, maintenance, financing, and related debt service.

154
City of Fort Smith, Arkansas Combining Statement of Net Position
Governmental Component Units
December 31, 2018
Advertising and Promotion Commission
Public Library Total
Assets
Cash -$ 745,142$ 745,142$ Investments 396,975 301,879 698,854 Receivables, net of allowance for uncollectibles
Sales taxes - 253,254 253,254 Accounts - 175,808 175,808
Prepaid items - 54,584 54,584 Capital assets
Nondepreciable - 427,132 427,132 Depreciable - 329,639 329,639
Total Assets 396,975 2,287,438 2,684,413
Deferred outflows of resources Deferred outflow related to pension - 439,543 439,543
Total deferred outflows of resources - 439,543 439,543
LiabilitiesAccounts payable and accrued liabilities 31,733 143,036 174,769 Net pension liability - 1,638,782 1,638,782
Total Liabilities 31,733 1,781,818 1,813,551
Deferred inflows of resources Deferred inflow related to pension - 241,024 241,024
Total deferred inflows of resources - 241,024 241,024
Net Position
Net investment in capital assets - 756,771 756,771 Restricted for:
Tourism & promotion 365,242 - 365,242 Unrestricted (deficit)
Library - (52,632) (52,632)
Total Net Position 365,242$ 704,139$ 1,069,381$
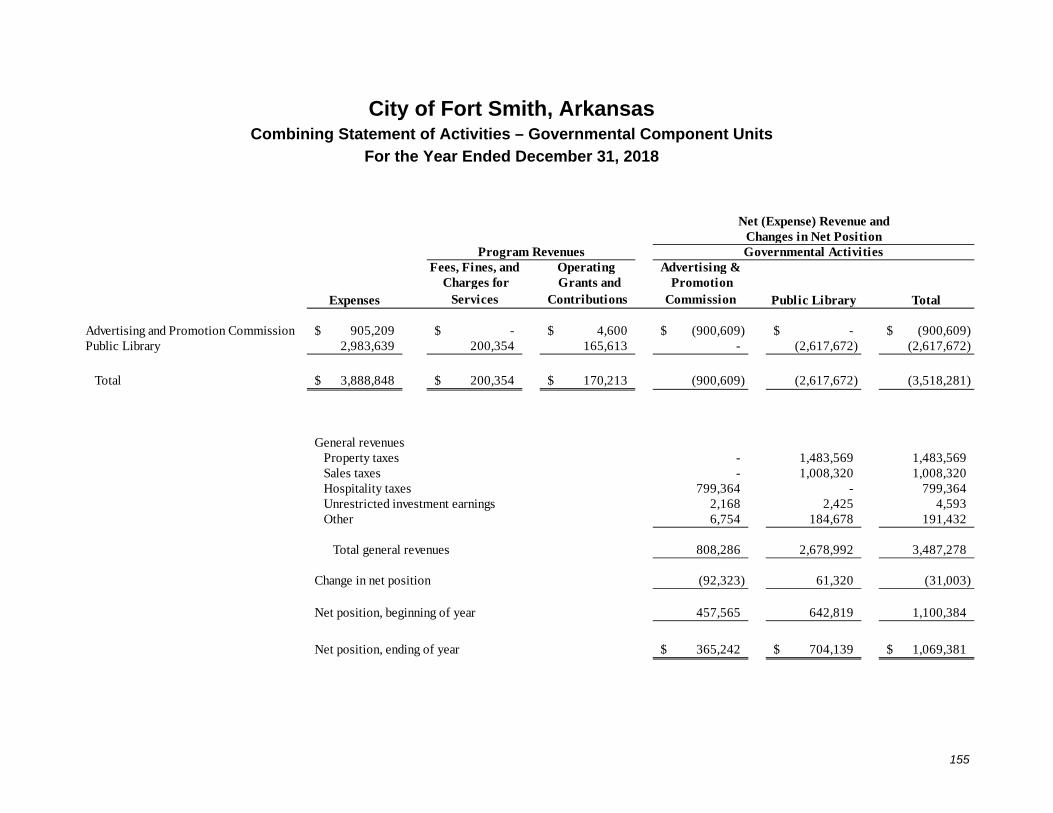
155
City of Fort Smith, Arkansas Combining Statement of Activities – Governmental Component Units
For the Year Ended December 31, 2018
Net (Expense) Revenue and
Changes in Net PositionProgram Revenues Governmental Activities
Fees, Fines, and Operating Advertising &
Expenses Charges for
Services Grants and
Contributions Promotion Commission Public Library Total
Advertising and Promotion Commission 905,209$ -$ 4,600$ (900,609)$ -$ (900,609)$ Public Library 2,983,639 200,354 165,613 - (2,617,672) (2,617,672)
Total 3,888,848$ 200,354$ 170,213$ (900,609) (2,617,672) (3,518,281)
General revenuesProperty taxes - 1,483,569 1,483,569 Sales taxes - 1,008,320 1,008,320 Hospitality taxes 799,364 - 799,364 Unrestricted investment earnings 2,168 2,425 4,593 Other 6,754 184,678 191,432
Total general revenues 808,286 2,678,992 3,487,278
Change in net position (92,323) 61,320 (31,003)
Net position, beginning of year 457,565 642,819 1,100,384
Net position, ending of year 365,242$ 704,139$ 1,069,381$

156
City of Fort Smith, Arkansas Balance Sheet – Advertising and Promotion
Governmental Component Unit
December 31, 2018
Assets: Investments 396,975$
Total Assets 396,975$
Liabilities and Fund Balance:Current: Accounts payable and accrued liabilities 31,733$
Total Liabilities 31,733
Fund Balance:Restricted for: Tourism & promotion 365,242
Total Liabilities and Fund Balance 396,975$

157
City of Fort Smith, Arkansas Statement of Revenues, Expenditures and Changes in Fund Balance
Advertising and Promotion - Governmental Component Unit
For the Year Ended December 31, 2018
Revenues
Taxes 799,364$ Interest 2,168Contributions 4,600 Other 6,754
Total revenues 812,886
Expenditures
Other 834,581
Capital outlay 70,628
Total Expenditures 905,209
Deficiency of revenues over expenditures (92,323)
Net change in fund balance (92,323)
Fund Balance, beginning of year 457,565
Fund Balance, end of year 365,242$

158
City of Fort Smith, Arkansas Combining Statement of Net Position
Business-Type Component Units December 31, 2018
Parking Airport
Authority Commission TotalAssets
Current Assets Cash -$ 2,369,577$ 2,369,577$ Investments 463,906 1,412,627 1,876,533 Receivables, net of allowance for uncollectibles
Accounts 7,600 153,713 161,313 Accrued interest - 18,149 18,149
Restricted Cash - 78,100 78,100 Grants and other governments - 551,931 551,931 Prepaid items and deposits 1,681 67,284 68,965 Inventory - 61,864 61,864
Total Current Assets 473,187 4,713,245 5,186,432
Noncurrent Assets Restricted
Cash - 1,766 1,766 Investments - 955,893 955,893
Capital assets Nondepreciable 1,359,160 10,986,876 12,346,036 Depreciable 29,756 26,533,801 26,563,557
Total Noncurrent Assets 1,388,916 38,478,336 39,867,252
Total Assets 1,862,103 43,191,581 45,053,684
Deferred Outflows of Resources Deferred amount on refunding - 70,807 70,807
Total deferred outflows of resources - 70,807 70,807
Liabilities
Current liabilitiesAccounts payable and accrued liabilities 73,219 816,433 889,652 Payable from restricted assets:
Revenue bonds payable, current - 210,000 210,000
Total Current Liabilities 73,219 1,026,433 1,099,652
Noncurrent liabilitiesDue within one year 5 - 5 Due in more than one year 537 1,700,000 1,700,537
Total Noncurrent Liabilities 542 1,700,000 1,700,542
Total Liabilities 73,761 2,726,433 2,800,194
Net Position
Net investment in capital assets 1,388,916 35,681,484 37,070,400 Restricted for bond retirement - 383,758 383,758 Restricted for capital projects - 57,765 57,765 Unrestricted 399,426 4,412,948 4,812,374
Total Net Position 1,788,342$ 40,535,955$ 42,324,297$

159
City of Fort Smith, Arkansas Combining Statement of Activities – Business-Type Component Units
For the Year Ended December 31, 2018
Net (Expense) Revenue andProgram Revenues Changes in Net Position
Fees, Fines, and Capital Business-Type ActivitiesCharges for Grants and Parking Airport
Expenses Services Contributions Authority Commission Total
Parking Authority 259,793$ 183,484$ -$ (76,309)$ -$ (76,309)$ Airport Commission 4,675,033 2,908,921 3,437,563 - 1,671,451 1,671,451
Total 4,934,826$ 3,092,405$ 3,437,563$ (76,309) 1,671,451 1,595,142
General revenuesUnrestricted investment earnings 2,543 48,325 50,868
Total general revenues 2,543 48,325 50,868
Change in net position (73,766) 1,719,776 1,646,010
Net position, beginning of year 1,862,108 38,816,179 40,678,287
Net position, ending of year 1,788,342$ 40,535,955$ 42,324,297$

160
City of Fort Smith, Arkansas Combining Statement of Cash Flows – Business-Type Component Units
For the Year Ended December 31, 2018
Parking AirportAuthority Commission Total
Operating ActivitiesCash received from customers 176,538$ 2,919,987$ 3,096,525$ Cash payments for goods and services (119,493) (1,292,198) (1,411,691) Cash paid to employees (70,297) (790,093) (860,390)
Net cash provided by (used for) operating activities (13,252) 837,696 824,444
Capital and Related Financing ActivitiesProceeds from capital grants - 2,672,972 2,672,972 Passenger facility charges received - 346,760 346,760 Acquisition and construction of capital assets (30,025) (3,443,267) (3,473,292) Principal paid on bonds - (200,000) (200,000) Interest paid on bonds - (98,468) (98,468)
Net cash used for capital and related financing activities (30,025) (722,003) (752,028)
Investing ActivitiesProceeds from sales and maturities of investment securities 32,833 2,200,044 2,232,877 Outlays for purchases of investment securities - (2,168,519) (2,168,519) Interest on investments 2,628 38,959 41,587
Net cash provided by investing activities 35,461 70,484 105,945
Net increase (decrease) in cash and restricted cash (7,816) 186,177 178,361
Cash and restricted cash, January 1 7,816 2,263,266 2,271,082
Cash and restricted cash, December 31 -$ 2,449,443$ 2,449,443$
Reconciliation of cash and restricted cash at December 31to statement of net position
Cash -$ 2,369,577$ 2,369,577$ Restricted cash - 79,866 79,866
Total -$ 2,449,443$ 2,449,443$

161
City of Fort Smith, Arkansas Combining Statement of Cash Flows – Business-Type Component Units
(Continued)
For the Year Ended December 31, 2018
Parking AirportAuthority Commission Total
Reconciliation of Operating Loss to Net CashProvided by Operating Activities
Operating loss (76,309)$ (1,648,179)$ (1,724,488)$ Adjustments to reconcile operating loss to net
cash provided by (used for) operating activitiesDepreciation 250 2,456,533 2,456,783
Change in assets and liabilitiesAccounts receivable (6,946) 11,066 4,120 Inventory - (7,683) (7,683) Prepaid items - (2,493) (2,493) Accounts payable and accrued liabilities 69,872 28,452 98,324 Liabilities for accrued vacation and sick leave (119) - (119)
Total adjustments 63,057 2,485,875 2,548,932
Net cash provided by (used for) operating activities (13,252)$ 837,696$ 824,444$

162
(This Page Intentionally Left Blank)

163
STATISTICAL SECTION

164
City of Fort Smith, Arkansas Statistical Section
This section of the City of Fort Smith comprehensive annual financial report (CAFR) presents detailed information as a context for understanding what the information in the financial statements, note disclosures, and required supplementary information reflects about the City’s overall financial health. Contents Page
Financial Trends (Tables 1-5)
These schedules contain trend information to assist the reader in understanding how the City’s financial performance and well-being have changed over time .................................................................... 165
Revenue Capacity (Tables 6-11)
These schedules contain information to help the reader assess the City’s most significant revenue sources, local sales taxes and property taxes ................................................................................................ 171
Debt Capacity (Tables 12-15)
These schedules present information to help the reader assess the affordability of the City’s current levels of outstanding debt and the City’s ability to issue additional debt in the future ............................................................................................................ 177
Demographic and Economic Information (Tables 16-17)
These schedules offer demographic and economic indicators to assist the reader in understanding the environment within which the City’s financial activities take place ................................................................... 181
Operating Information (Tables 18-20)
These schedules contain service and infrastructure data to help the reader understand how the information in the City’s financial report relates to services the City provides and the activities it performs ....................................................................................................................... 183
Continuing Disclosure Requirement Information (Tables 21-22)
These schedules provide information required to be disseminated for investors of City debt. By including this data, the CAFR may be used as the document that provides all debt covenant required reports and information .................................................................................................................. 186
Sources: Unless otherwise noted, the information in these schedules is derived from the comprehensive annual financial reports for the relevant year.

165
Table 1
City of Fort Smith, Arkansas Net Position by Component
Last Ten Years
(Accrual Basis of Accounting)
(Unaudited)
2009 2010 2011 2012 2013 2014 2015 2016 2017 2018
Governmental activities
Net investment in capital assets 294,746,494$ 305,663,999$ 323,022,637$ 323,907,222$ 315,027,429$ 301,383,411$ 301,292,326$ 310,422,734$ 326,142,910$ 337,638,439$
Restricted 24,205,366 23,050,850 39,016,328 45,995,375 41,087,435 46,649,301 50,358,284 49,252,066 48,938,954 58,722,663
Unrestricted (deficit) 38,763,651 34,297,504 15,010,176 11,588,210 11,619,202 8,929,780 (41,489,044) (38,495,788) (28,509,210) (35,881,319)
Total governmental activities net position 357,715,511$ 363,012,353$ 377,049,141$ 381,490,807$ 367,734,066$ 356,962,492$ 310,161,566$ 321,179,012$ 346,572,654$ 360,479,783$
Business-Type activities
Net investment in capital assets 293,549,646$ 314,941,959$ 324,215,779$ 329,000,477$ 359,247,688$ 378,186,724$ 350,202,002$ 397,064,645$ 385,564,986$ 391,608,271$
Restricted 24,102,177 24,385,436 18,608,798 18,173,298 18,623,298 19,073,298 20,677,094 23,582,119 23,581,225 8,736,608
Unrestricted (deficit) (3,057,942) (7,596,655) 2,270,311 8,023,382 5,289,216 649,154 34,468,082 12,571,307 18,695,478 43,171,676
Total business-type activities net position 314,593,881$ 331,730,740$ 345,094,888$ 355,197,157$ 383,160,202$ 397,909,176$ 405,347,178$ 433,218,071$ 427,841,689$ 443,516,555$
Primary governmentNet investment in capital assets 588,296,140$ 620,605,958$ 647,238,416$ 652,907,699$ 674,275,117$ 679,570,135$ 651,494,328$ 707,487,379$ 711,707,896$ 729,246,710$
Restricted 48,307,543 47,436,286 57,625,126 64,168,673 59,710,733 65,722,599 71,035,378 72,834,185 65,808,092 67,459,271
Unrestricted (deficit) 35,705,709 26,700,849 17,280,487 19,611,592 16,908,418 9,578,934 (7,020,962) (25,924,481) (9,813,732) 7,290,357
Total primary government net position 672,309,392$ 694,743,093$ 722,144,029$ 736,687,964$ 750,894,268$ 754,871,668$ 715,508,744$ 754,397,083$ 767,702,256$ 803,996,338$

166
Table 2
City of Fort Smith, Arkansas Changes in Net Position
Last Ten Fiscal Years (Accrual Basis of Accounting)
(Unaudited)
2009 2010 2011 2012 2013 2014 2015 2016 2017 2018
Expenses
Governmental Activities:
General government 8,783,548$ 9,464,539$ 9,874,051$ 9,373,912$ 10,566,809$ 11,782,229$ 10,540,138$ 9,334,980$ 9,813,976$ 9,487,201$
Public safety 31,836,140 32,350,902 34,009,318 37,263,101 40,463,203 37,468,682 40,059,753 39,229,896 37,685,158 46,794,625
Public works 12,169,873 13,226,363 14,541,350 14,541,430 16,688,875 16,828,138 16,228,119 15,992,699 16,485,834 16,116,687 Community services 13,438,158 12,165,578 10,732,048 11,633,976 11,431,562 17,875,559 11,598,167 10,593,837 10,813,088 11,373,604
Interest on long-term debt 3,917,534 3,838,008 2,933,735 4,099,571 4,958,960 4,948,763 4,702,341 4,390,585 4,528,084 2,991,999
Total governmental activities expenses 70,145,253 71,045,390 72,090,502 76,911,990 84,109,410 88,903,371 83,128,518 79,541,996 79,326,140 86,764,116
Business-Type Activities:
Water and Sewer 34,198,511 37,974,129 38,875,863 41,283,645 42,203,035 42,807,102 43,775,895 49,436,840 56,118,174 51,098,433
Sanitation 11,403,090 11,670,602 11,287,956 12,361,032 12,185,883 13,298,931 12,160,733 11,623,625 14,930,172 12,462,283
Total business-type activities expenses 45,601,601 49,644,731 50,163,819 53,644,677 54,388,918 56,106,033 55,936,628 61,060,465 71,048,346 63,560,716
Total primary government expenses 115,746,854$ 120,690,121$ 122,254,321$ 130,556,667$ 138,498,328$ 145,009,404$ 139,065,146$ 140,602,461$ 150,374,486$ 150,324,832$
Program Revenues
Governmental Activities:
Charges for servicesGeneral government 3,644,887$ 3,874,758$ 3,935,526$ 3,864,179$ 4,011,708$ 3,590,637$ 3,984,533$ 4,138,125$ 3,697,496$ 4,035,492$
Public safety 245,863 312,543 325,298 358,888 1,430,302 183,031 166,741 174,925 206,292 212,218
Public works 1,200 4,605 9,535 261,792 421,635 266,627 254,686 335,684 346,439 389,717
Community services 1,003,750 1,153,674 994,444 1,099,960 1,657,307 1,210,185 1,199,131 1,170,521 1,322,074 1,207,071
Operating grants and contributions 12,754,491 13,142,881 12,269,135 10,982,501 12,914,448 13,925,772 15,087,846 13,482,510 13,072,923 13,983,299
Capital grants and contributions 1,763,263 1,357,800 1,796,754 3,394,792 3,388,287 3,197,429 3,540,688 12,349,015 3,343,621 2,962,846 Total governmental activities program revenues 19,413,454 19,846,261 19,330,692 19,962,112 23,823,687 22,373,681 24,233,625 31,650,780 21,988,845 22,790,643 Business-Type Activities:
Charges for services
Water and sewer 35,652,828 38,509,851 40,818,042 41,049,517 37,805,650 35,918,255 43,606,954 53,271,406 54,902,198 57,858,066 Sanitation 12,560,096 13,246,801 12,337,186 12,640,422 15,068,421 13,291,198 13,756,356 14,791,432 14,757,545 16,812,701
Capital grants and contributions 3,683,324 512,378 638,698 1,245,672 1,968,216 - - - - - Total business-type activities program revenues 51,896,248 52,269,030 53,793,926 54,935,611 54,842,287 49,209,453 57,363,310 68,062,838 69,659,743 74,670,767
Total primary government program revenues 71,309,702$ 72,115,291$ 73,124,618$ 74,897,723$ 78,665,974$ 71,583,134$ 81,596,935$ 99,713,618$ 91,648,588$ 97,461,410$
Net (expense) revenueGovernmental activities (50,731,799)$ (51,199,129)$ (52,759,810)$ (56,949,878)$ (60,285,723)$ (60,285,723)$ (66,529,690)$ (58,894,893)$ (57,337,295)$ (63,973,473)$ Business-Type activities 6,294,647 2,624,299 3,630,107 1,290,934 453,369 453,369 (6,896,580) 1,426,682 (1,388,602) 11,110,051
Total primary government net expense (44,437,152)$ (48,574,830)$ (49,129,703)$ (55,658,944)$ (59,832,354)$ (59,832,354)$ (73,426,270)$ (57,468,211)$ (58,725,897)$ (52,863,422)$
Fiscal

167
Table 2 (Continued) City of Fort Smith, Arkansas Changes in Net Position (Continued)
Last Ten Fiscal Years (Accrual Basis of Accounting)
(Unaudited)
2009 2010 2011 2012 2013 2014 2015 2016 2017 2018
General Revenues and Other Changes
in Net Position
Governmental activities:
TaxesProperty taxes 12,267,731$ 10,623,101$ 13,143,979$ 10,927,877$ 11,514,707$ 11,447,651$ 11,715,689$ 12,255,857$ 12,674,326$ 12,929,340$
Sales taxes 52,601,763 52,091,471 53,838,552 54,489,254 54,291,940 55,823,661 56,850,299 58,893,332 59,100,140 60,050,705
Utility franchise fees 5,990,452 6,492,100 6,571,993 6,071,893 6,478,637 6,780,156 6,388,844 5,974,790 6,304,008 6,840,478
Unrestricted grants and contributions 226,195 10,085 - 55,357 - - - - - -
Unrestricted investment earnings 538,627 163,172 18,480 474 364,291 85,627 152,888 64,861 317,642 1,220,764
Insurance proceeds from hail storm 1,778,572 - - - - - - - - -
Other 1,318,649 1,199,332 1,539,449 527,041 3,462,503 2,108,585 1,397,078 2,043,676 1,618,293 2,158,371 Transfers (34,020,953) (14,083,290) (8,315,855) (12,190,491) (27,638,513) (20,487,564) (16,408,142) (20,323,854) (3,995,559) (1,255,595)
Total governmental activities 40,701,036 56,495,971 66,796,598 59,881,405 48,473,565 55,758,116 60,096,656 58,908,662 76,018,850 81,944,063
Business-type activities:
Unrestricted investment earnings 343,471 89,914 14,459 61,383 68,600 87,230 80,875 193,749 401,542 1,219,925
Other 1,116,923 339,356 1,403,727 609,901 1,403,727 1,403,727 138,309 350,917 762,982 1,099,816
Transfers 34,020,953 14,083,290 8,315,855 12,190,491 27,638,513 20,487,564 16,408,142 20,323,854 3,995,559 1,255,595 Total business-type activities 35,481,347 14,512,560 9,734,041 12,861,775 29,110,840 21,978,521 16,627,326 20,868,520 5,160,083 3,575,336
Total primary government 76,182,383$ 71,008,531$ 76,530,639$ 72,743,180$ 77,584,405$ 77,736,637$ 76,723,982$ 79,777,182$ 81,178,933$ 85,519,399$
Changes in Net Position
Governmental activities (10,030,763)$ 5,296,842$ 14,036,788$ 2,931,527$ (11,812,158)$ (10,771,574)$ 1,201,763$ 11,017,446$ 18,681,555$ 17,970,590$ Business-type activities 41,775,994 17,136,859 13,364,148 14,152,709 27,963,029 14,748,974 18,054,008 27,870,893 3,771,481 14,685,387
Total primary government 31,745,231$ 22,433,701$ 27,400,936$ 17,084,236$ 16,150,871$ 3,977,400$ 19,255,771$ 38,888,339$ 22,453,036$ 32,655,977$
Fiscal Year

168
Table 3
City of Fort Smith, Arkansas Changes in Fund Balances of Governmental Funds
Last Ten Fiscal Years (Modified Accrual Basis of Accounting)
(Unaudited)
2009 2010 2011 2012 2013 2014 2015 2016 2017 2018
Revenues
Taxes (1) 69,476,528$ 69,689,304$ 71,868,941$ 72,036,723$ 72,257,168$ 74,337,156$ 74,880,735$ 77,077,945$ 78,253,489$ 79,356,524$
Licenses and permits 1,559,950 1,489,526 1,628,157 1,553,688 1,612,104 1,623,061 1,609,554 1,991,228 1,829,600 2,084,758
Intergovernmental 13,117,444 12,881,250 12,552,267 12,672,787 13,423,088 15,018,681 15,109,545 22,571,712 14,075,150 13,742,046
Fines and forfeitures 2,098,901 2,299,274 2,356,809 2,408,231 2,570,173 2,121,646 2,508,139 2,362,403 2,086,363 2,147,268 Charges for services 1,172,312 1,237,853 1,108,213 1,277,269 1,333,228 1,340,413 1,317,163 1,287,951 1,452,156 1,352,954
Investment earnings 566,378 166,106 18,480 141,141 383,964 185,589 262,136 168,689 442,148 1,380,801
Contributions 1,511,328 1,338,330 1,341,458 1,395,068 2,707,215 2,046,589 3,518,989 3,259,813 2,341,394 3,204,099
Miscellaneous 189,946 341,329 470,997 343,630 769,159 367,470 303,595 741,307 585,585 603,372
Total revenues 89,692,787 89,442,972 91,345,322 91,828,537 95,056,099 97,040,605 99,509,856 109,461,048 101,065,885 103,871,822
Expenditures
General government 8,226,444 7,879,961 7,969,047 7,972,590 8,316,034 8,544,169 8,346,483 7,714,771 8,012,962 7,647,178
Public safety 30,697,704 30,032,414 31,659,461 31,596,228 34,497,803 33,985,035 36,145,342 33,527,587 32,844,745 36,906,576 Public works 5,254,628 5,870,159 6,450,755 5,734,913 7,461,123 7,341,039 6,645,539 6,291,652 5,983,213 5,751,800
Community services 9,338,549 7,987,136 7,144,380 7,236,525 7,199,963 8,404,310 9,091,293 8,155,214 7,947,477 8,901,750
Other 1,830,124 2,335,524 2,368,766 1,812,324 1,772,276 1,636,526 1,760,379 1,448,839 1,543,680 1,909,145
Capital outlay 31,766,713 34,187,241 31,670,727 30,928,218 49,788,131 41,638,644 39,788,772 50,789,749 30,415,836 19,644,191 Debt service
Principal 17,785,000 16,805,000 17,495,000 1,940,000 12,905,000 11,315,000 11,240,000 11,425,000 12,320,000 12,735,000
Interest 2,917,861 3,040,386 2,367,651 2,688,400 3,575,061 4,217,236 4,247,774 3,938,833 4,138,267 2,589,697
Issuance costs 259,839 75,892 - 349,650 - 400,062 - - - -
Total expenditures 108,076,862 108,213,713 107,125,787 90,258,848 125,515,391 117,482,021 117,265,582 123,291,645 103,206,180 96,085,337
Excess (deficiency) of revenuesover (under) expenditures (18,384,075) (18,770,741) (15,780,465) 1,569,689 (30,459,292) (20,441,416) (17,755,726) (13,830,597) (2,140,295) 7,786,485
Other financing sources and (uses)Transfers in 29,689,472 6,809,336 3,531,999 77,142,266 3,632,186 36,885,129 1,833,771 1,060,810 2,881,246 3,451,814 Transfers out (64,000,227) (6,269,982) (3,077,367) (76,972,738) (3,849,710) (36,937,129) (1,775,248) (962,881) (1,959,000) (2,963,814) Insurance proceeds from hail storm 1,778,572 - - - - - - - - - Premiums on bond issuance 236,307 16,217 - 6,269,913 - 1,028,741 - - - - Bond issuance 29,150,000 3,595,000 - 110,660,000 - 34,295,000 - - - -
Escrow deposits - - - (53,700,952) - - - - - -
Capital leases - - - - - - - - - - Total other financing sources (uses) (3,145,876) 4,150,571 454,632 63,398,489 (217,524) 35,271,741 58,523 97,929 922,246 488,000
Net change in fund balances (21,529,951)$ (14,620,170)$ (15,325,833)$ 64,968,178$ (30,676,816)$ 14,830,325$ (17,697,203)$ (13,732,668)$ (1,218,049)$ 8,274,485$
Debt service as a % of noncapitalexpenditures 27.1% 26.8% 26.3% 7.8% 21.8% 20.5% 20.0% 21.2% 22.6% 20.0%
(1) See Table 6 for detail of tax revenues.

169
Table 4
City of Fort Smith, Arkansas Fund Balances of Governmental Funds
Last Ten Fiscal Years (Modified Accrual Basis of Accounting)
(Unaudited)
2009 2010 2011 2012 2013 2014 2015 2016 2017 2018
General Fund
Reserved 2,772,912$ -$ -$ -$ -$ -$ -$ -$ -$ -$
Unreserved 5,772,601 - - - - - - - - -
Nonspendable - 126,037 66,707 264,783 44,106 73,340 56,438 190,121 190,100 312,081
Restricted - 1,467,461 283,616 - - - - - - -
Assigned - 1,910,794 1,407,063 4,450,203 1,205,979 1,406,631 1,701,712 1,319,552 1,121,752 967,846 Unassigned - 4,938,318 5,983,015 4,269,917 10,435,252 10,197,081 7,712,281 13,383,861 15,983,316 19,462,185
Total general fund 8,545,513 8,442,610 7,740,401 8,984,903 11,685,337 11,677,052 9,470,431 14,893,534 17,295,168 20,742,112
All other governmental funds
Reserved 68,080,708 - - - - - - - - -
Unreserved, reported in:
Special revenue funds 12,771,282 - - - - - - - - - Capital projects funds 709,966 - - - - - - - - -
Nonspendable - 343,606 526,015 673,709 701,931 339,952 179,311 194,052 641,036 641,036
Restricted - 62,360,676 51,037,382 114,702,230 79,671,763 95,030,923 79,584,620 59,530,245 52,846,439 58,722,663 Committed - 508,840 443,933 - - - - - - -
Assigned - 3,781,567 363,735 453,802 2,078,797 1,920,226 2,036,588 2,923,499 5,537,590 4,795,502
Unassigned (deficit) - - - - - - - (3,048) - (306,595)
Total all other governmental funds 81,561,956 66,994,689 52,371,065 115,829,741 82,452,491 97,291,101 81,800,519 62,644,748 59,025,065 63,852,606
Total governmental fund balances 90,107,469$ 75,437,299$ 60,111,466$ 124,814,644$ 94,137,828$ 108,968,153$ 91,270,950$ 77,538,282$ 76,320,233$ 84,594,718$
The City of Fort Smith adopted GASB 54 for fiscal year ending 12/31/2010. In the schedule above all years prior to 2011 are stated in its original form and therefore are not directly comparable to 2011 or later.

170
Table 5
City of Fort Smith, Arkansas General Fund Revenues, Expenditures, and Fund Balance
Continuing Disclosure Requirement Last Ten Fiscal Years
(Modified Accrual Basis of Accounting) (Unaudited)
2009 2010 2011 2012 2013 2014 2015 2016 2017 2018
Revenues 36,683,453$ 37,014,019$ 37,744,298$ 38,056,106$ 43,930,416$ 43,702,563$ 44,355,055$ 44,912,352$ 45,290,927$ 47,668,106$
Expenditures 41,671,672 39,433,872 40,670,109 38,750,928 42,663,082 45,643,048 45,169,301 38,905,420 41,298,295 45,728,976
Excess (deficiency) of revenues over (under) expenditures (4,988,219) (2,419,853) (2,925,811) (694,822) 1,267,334 (1,940,485) (814,246) 6,006,932 3,992,632 1,939,130
Other financing sources (uses) 2,777,499 2,366,950 2,223,602 1,634,238 1,738,186 1,932,200 (1,392,375) (583,829) (1,590,998) 1,507,814
Net change in fund balances (2,210,720) (52,903) (702,209) 939,416 3,005,520 (8,285) (2,206,621) 5,423,103 2,401,634 3,446,944
Fund balance, January 1 10,706,233 8,495,513 8,442,610 7,740,401 8,679,817 11,685,337 11,677,052 9,470,431 14,893,534 17,295,168
Fund balance, December 31 8,495,513$ 8,442,610$ 7,740,401$ 8,679,817$ 11,685,337$ 11,677,052$ 9,470,431$ 14,893,534$ 17,295,168$ 20,742,112$

171
Table 6
City of Fort Smith, Arkansas General Governmental Taxes by Source
Last Ten Fiscal Years
(Unaudited)
Fiscal Ad Valorem Sales Utility
Year Taxes Taxes (1) Franchise Fees Total
2009 10,884,313$ 52,601,763$ 5,990,452$ 69,476,528$
2010 11,105,733 52,091,471 6,492,100 69,689,304
2011 11,458,396 53,838,552 6,571,993 71,868,941
2012 11,475,576 54,489,254 6,071,893 72,036,723 2013 11,486,591 54,291,940 6,478,637 72,257,168
2014 11,733,339 55,823,661 6,780,156 74,337,156
2015 11,641,592 56,850,299 6,388,844 74,880,735
2016 12,209,823 58,893,332 5,974,790 77,077,945
2017 12,849,341 59,100,140 6,304,008 78,253,489
2018 12,465,341 60,050,705 6,840,478 79,356,524
(1) The City began collecting a 1% sales tax for street projects in November 1985, a 1/2% sales tax
for bond retirement in January 1998 through June 2004, and the City share of the county 1%
sales tax in August 1994. In May 2006, the City began collecting a 1% sales tax for bond retirement.
The sales taxes for bond retirement are now used to support the 2012 sales and use tax bonds.This 1% sales tax, reapproved in March 2012, is split 3/4% for bond retirement and 1/4% for
General Fund programs. The 2012 sales and use tax bonds were issued for general government
uses and business-type activities. The business-type activity improvements are recorded as
contributions on the fund financial statements.

172
Table 7
City of Fort Smith, Arkansas Local Sales and Use Tax Collections
And Direct and Overlapping Local Tax Rates Continuing Disclosure Requirement
Last Ten Fiscal Years
(Unaudited)
1% City City Share 1% or 3/4% City 1/4% City OverlappingSales & Use 1% County Sales & Use Sales & Use Direct Sebastian
Fiscal Tax Allocated Sales & Use Tax Allocated Tax Allocated City County
Year for Street (1) Tax (2) for Bonds (3) Fire & Parks (3) Total Tax Rate Tax Rate
2009 18,777,493$ 15,046,777$ 18,777,493$ -$ 52,601,763$ 2.00% 1.00%2010 18,599,727 14,892,017 18,599,727 - 52,091,471 2.00% 1.00%2011 19,341,760 15,155,032 19,341,760 - 53,838,552 2.00% 1.00%2012 19,605,123 15,279,008 18,836,899 768,224 54,489,254 2.00% 1.00%2013 19,468,975 15,353,991 14,601,731 4,867,243 54,291,940 2.00% 1.00%2014 20,099,013 15,625,636 15,074,259 5,024,753 55,823,661 2.00% 1.00%2015 20,380,151 16,090,921 15,284,934 5,094,293 56,850,299 2.00% 1.00%2016 21,156,154 16,580,569 15,867,457 5,289,152 58,893,332 2.00% 1.00%2017 21,204,143 16,691,854 15,903,107 5,301,036 59,100,140 2.00% 1.00%2018 21,503,354 17,043,995 16,127,517 5,375,839 60,050,705 2.00% 1.00%
Total 200,135,893$ 157,759,800$ 168,414,884$ 31,720,540$ 558,031,117$
(1) The City Sales and Use Tax allocated for construction, repair and maintenance of street, bridge and associated drainage improvements was initially assessed in 1985 for a period of 10 years. The tax has been reauthorized through 2025. The tax is accounted for in the Sales Tax Fund, a special revenue fund. (2) Sebastian County began assessing a 1% Sales and Use Tax August 1, 1994. The City receives a share of the tax based upon its population within Sebastian County. The City allocates its share of the tax to its General Fund. The tax has been reauthorized through 2024. (3) Prior to May 2006, the City assessed two 1/2 % City sales and use taxes to total 1% for bond redemption. The first 1/2% was allocated to redeem the City of Fort Smith Sales and Use Tax Bonds, Series 1997. The 1997 Bonds were issued to fund the construction for the convention center, public library facilities, and riverfront park projects. The tax became effective January 1, 1998. The second 1/2% was allocated to redeem the City of Fort Smith Sales and Use Tax Bonds, Series 2001. The 2001 Bonds were issued to fund a portion of the Lake Fort Smith water supply expansion project and to fund wastewater improvements. The tax for the 2001 Bonds became effective May 1, 2001. The 1997 Bonds were redeemed in June 2004 and now the entire 1% tax is allocated to the repayment of the 2001 Bonds. In May 2006, the 1% sales and use tax was approved to support the issuance of City of Fort Smith Sales and Use Tax Refunding and Construction Bonds, Series 2006. The 2006 Bonds were issued to refund the outstanding 2001 Bonds, acquire a public safety and utility radio communication system, and provide wastewater improvements in accordance with an EPA administrative order. In November 2008, additional sales and use tax bonds were issued to provide more funding for the radio project and the wastewater projects. In September 2009, additional sales and use tax bonds were issued for more wastewater projects. The 2009 Bonds will be paid with the sales and use tax once the 2006 and 2008 Bonds are redeemed. The 2009 Bonds interest payments are currently being supported by a temporary sewer rate that is in effect until the 2006 and 2008 Bonds are redeemed. In January 2010, the City issued additional sales and use tax bonds for even more wastewater projects. The 2006, 2008, and 2010 Bonds are supported by the 1% sales and use tax. Once these bonds are redeemed, the 1% sales and use tax will support the 2009 Bonds and the temporary sewer rate will be discontinued. The 2010 were redeemed in full during 2010. In May 2012, the city issued sales and use tax bonds to provide for water improvements, wastewater improvements, fire facilities and apparatus, and for an aquatics park in conjunction with Sebastian County. The outstanding 2006, 2008 and 2009 bonds were called by the 2012 bonds. The temporary sewer rate was removed in early July 2012. Beginning October 1, 2012, the 1% sales tax is split with 3/4% allocated to the redemption of the 2012 bonds and 1/4% allocated to operations in the fire and parks departments.

173
Table 8
City of Fort Smith, Arkansas Property Tax Levies and Collections
Last Ten Fiscal Years
(Unaudited)
Outstanding
Delinquent
Percent of Delinquent Collection Outstanding Taxes as a
Fiscal Total Tax Current Tax Levy Tax Total Tax Percent of Delinquent Percent of
Year Levy (1) Collections Collections Collections Collections Current Levy Taxes Current Levy
2009 8,328,466$ 7,702,929$ 92.49% 305,640$ 8,008,569$ 96.16% 402,909$ 4.84%2010 9,518,247 9,035,518 94.93% 411,376 9,446,894 99.25% 527,023 5.54%
2011 9,730,326 9,299,637 95.57% 344,396 9,644,033 99.11% 453,411 4.66%
2012 10,048,916 9,514,504 94.68% 396,701 9,911,205 98.63% 705,667 7.02%
2013 10,213,111 8,317,052 81.44% 424,158 8,741,210 85.59% 394,097 3.86%
2014 10,551,660 7,740,390 73.36% 1,318,456 9,058,846 85.85% 523,298 4.96%
2015 10,656,912 8,643,537 81.11% 302,693 8,946,230 83.95% 429,658 4.03%
2016 11,638,707 10,869,598 93.39% 349,161 11,218,759 96.39% 419,948 3.61%2017 12,098,453 10,807,866 89.33% 362,954 11,170,820 92.33% 927,633 7.67%
2018 12,634,135 10,584,574 83.78% 410,578 10,995,152 87.03% 640,218 5.07%
(1) Total tax levy is based upon valuation of previous year and has been adjusted for the homestead tax relief for property owners
which became effective for the 2001 fixcal year. The tax levy for this schedule represents the City's levy for its General Fund and forthe police and fire pension contributions in the LOPFI Fund, a special revenue fund. The city also receives one-half of the collections
from the county levy in its Street Maintenance Fund, a special revenue fund.

174
Table 9
City of Fort Smith, Arkansas Assessed and Estimated Actual Value of Taxable Property
Last Ten Fiscal Years
(Unaudited)
Ratio of Direct
Total Assessed Tax
to Total Rate
Fiscal Assessed Estimated Assessed Estimated Assessed Estimated Estimated (per $100
Year (1) Value Actual Value Value Actual Value Value Actual Value Actual assessed value)
2009 837,275,432$ 4,186,377,160$ 335,318,153$ 1,676,590,765$ 1,172,593,585$ 5,862,967,925$ 20.00% 0.70
2010 873,592,440 4,367,962,200 336,466,947 1,682,334,735 1,210,059,387 6,050,296,935 20.00% 0.70
2011 941,388,230 4,706,941,150 353,247,975 1,766,239,875 1,294,636,205 6,473,181,025 20.00% 0.70
2012 968,690,035 4,843,450,175 357,156,805 1,785,784,025 1,325,846,840 6,629,234,200 20.00% 0.70
2013 980,472,019 4,902,360,095 367,266,450 1,836,332,250 1,347,738,469 6,738,692,345 20.00% 0.70
2014 989,630,922 4,948,154,610 361,225,320 1,806,126,600 1,350,856,242 6,754,281,210 20.00% 0.70
2015 1,013,693,663 5,068,468,315 355,566,010 1,777,830,050 1,369,259,673 6,846,298,365 20.00% 0.70 2016 1,048,822,152 5,244,110,760 374,525,310 1,872,626,550 1,423,347,462 7,116,737,310 20.00% 0.70
2017 1,067,629,242 5,338,146,210 374,356,480 1,871,782,400 1,441,985,722 7,209,928,610 20.00% 0.70
2018 1,085,359,343 5,426,796,715 394,705,520 1,973,527,600 1,480,064,863 7,400,324,315 20.00% 0.70
(1) Fiscal year is year of valuation.
The assessed value of real and personal property within the city limits is used as the basis for applying the city's property tax rates shown.
Personal PropertyReal Property Total

175
Table 10
City of Fort Smith, Arkansas Property Tax Rates and Tax Levies
All Direct and Overlapping Governments
Last Ten Fiscal Years
(Unaudited)
Tax rates (per $100 of assessed valuation):
Fiscal Real Personal Real Personal Real Personal Real Personal Real Personal
Year (1) Property Property Property Property Property Property Property Property Property Property
2009 0.70$ 0.70$ 0.80$ 0.80$ 3.65$ 3.65$ 0.10$ 0.10$ 5.25$ 5.25$
2010 0.70 0.70 0.80 0.80 3.65 3.65 0.10 0.10 5.25 5.25
2011 0.70 0.70 0.80 0.80 3.65 3.65 0.10 0.10 5.25 5.25
2012 0.70 0.70 0.80 0.80 3.65 3.65 0.10 0.10 5.25 5.25 2013 0.70 0.70 0.80 0.80 3.65 3.65 0.10 0.10 5.25 5.25
2014 0.70 0.70 0.80 0.80 3.65 3.65 0.10 0.10 5.25 5.25
2015 0.70 0.70 0.80 0.80 3.65 3.65 0.10 0.10 5.25 5.25 2016 0.70 0.70 0.80 0.80 3.65 3.65 0.10 0.10 5.25 5.25
2017 0.70 0.70 0.80 0.80 3.65 3.65 0.10 0.10 5.25 5.25
2018 0.70 0.70 0.80 0.80 3.65 3.65 0.10 0.10 5.25 5.25
2009 7.00$ 7.00$ 8.00$ 8.00$ 36.50$ 36.50$ 1.00$ 1.00$ 52.50$ 52.50$
2010 7.00 7.00 8.00 8.00 36.50 36.50 1.00 1.00 52.50 52.50
2011 7.00 7.00 8.00 8.00 36.50 36.50 1.00 1.00 52.50 52.50 2012 7.00 7.00 8.00 8.00 36.50 36.50 1.00 1.00 52.50 52.50 2013 7.00 7.00 8.00 8.00 36.50 36.50 1.00 1.00 52.50 52.50 2014 7.00 7.00 8.00 8.00 36.50 36.50 1.00 1.00 52.50 52.50
2015 7.00 7.00 8.00 8.00 36.50 36.50 1.00 1.00 52.50 52.50 2016 7.00 7.00 8.00 8.00 36.50 36.50 1.00 1.00 52.50 52.50 2017 7.00 7.00 8.00 8.00 36.50 36.50 1.00 1.00 52.50 52.50 2018 7.00 7.00 8.00 8.00 36.50 36.50 1.00 1.00 52.50 52.50
(1) Fiscal year is year of levy.
Overlapping Rates
Overlapping Rates
Overlapping Rates
Total Direct &
Sebastian County FS Public LibraryCity of Fort Smith FS School District
Overlapping Rates
Total Direct &

176
Table 11
City of Fort Smith, Arkansas Principal Taxpayers
Current Year and Nine Years Ago
(Unaudited)
Percentage Percentage
Taxable of Total Taxable of Total
Assessed Assessed Assessed Assessed
Name of Taxpayer (1) Valuation (2) Rank Valuation Valuation (2) Rank Valuation
Oklahoma Gas & Electric Co. 41,804,915$ 1 2.90%
Wal-Mart Sam's Club 20,430,555 2 1.42% 9,999,012$ 5 0.80%Cox Communications 21,586,830 3 1.50%
Mars Petcare US, Inc. 19,831,595 4 1.38%
Mercy Medical Center 18,844,255 5 1.31%ABB (formerly Baldor Electric Company) 18,548,165 6 1.29% 28,890,033 1 2.31%
Cellco Partnership 18,259,260 7 1.27%
Gerber Products Company 17,778,560 8 1.23% 4,712,701 10 0.38%
Dixie Consumer Products 17,013,250 9 1.18%OK Farms, Inc 14,621,595 10 1.01% 22,364,015 3 1.79%
Stephens Production 25,802,974 2 2.06%
Whirpool Corporation 19,940,197 4 1.59%
Southwestern Electric Power 9,051,710 6 0.72%
FS Mall Partners (Central Mall) 8,471,442 7 0.68%
Farmers Bank 6,772,921 8 0.54%Southwestern Bell Telephone 5,768,694 9 0.46%
208,718,980$ 14.47% 141,773,699$ 11.34%(1) Sebastian County Assessor's Office.
(2) Property taxes collected in 2018 are based upon 2017 assessed valuation of $1,441,985,722. Property taxes collected in 2009 were based uponthe 2008 assessed valuation of $1,250,202,816.
2018 2009

177
Table 12
City of Fort Smith, Arkansas Computation of Direct and Estimated Overlapping Debt
December 31, 2018
(Unaudited)
Total Direct and
Outstanding Estimated Estimated
Bonded Percent Overlapping
Taxing Jurisdiction Debt (1) Applicable (2) Bonded Debt
Direct:
City of Fort Smith 78,963,653$ 100% 78,963,653$
Overlapping:
Fort Smith Special School District 149,945,118 100% 149,945,118
Greenwood School District 42,325,000 5% 2,116,250
Sebastian County - 76% -
Total Overlapping 192,270,118 152,061,368
Total direct and estimatedoverlapping bonded debt 271,233,771$ 231,025,021$
Ratio, direct and estimated overlappingdebt to fiscal 2017 assessed valuation (3) 16.0%
Per capita direct and estimated
overlapping bonded debt (4) 2,642$
(1) Excluding self-supporting debt.
(2) The percentage applicable to the City of Fort Smith is based on the relative assessed values within the City.
(3) From Table 9, $1,480,064,863
(4) Based on the estimated population for 2018 in Table 16.

178
Table 13
City of Fort Smith, Arkansas Computation of Legal Debt Margin
Last Ten Fiscal Years
(Unaudited)
2009 2010 2011 2012 2013 2014 2015 2016 2017 2018
Net assessed value (1) 872,593,585$ 1,210,059,387$ 1,294,636,205$ 1,325,846,840$ 1,347,738,469$ 1,350,856,242$ 1,369,259,673$ 1,423,347,462$ 144,985,722$ 1,480,064,863$ Plus exempt property (2) - - - - - - - - - -
Total assessed value 1,134,811,514$ 1,210,059,387$ 1,294,636,205$ 1,325,846,840$ 1,347,738,469$ 1,325,846,840$ 1,347,738,469$ 1,350,856,242$ 1,350,856,242$ 1,480,064,863$
assessed value (3) 218,148,396$ 302,514,847$ 323,659,051$ 331,461,710$ 336,934,617$ 337,714,061$ 342,314,918$ 355,836,866$ 360,496,431$ 370,016,216$ - - - - - - - - - -
Debt Margin 218,148,396$ 302,514,847$ 323,659,051$ 331,461,710$ 336,934,617$ 337,714,061$ 342,314,918$ 355,836,866$ 360,496,431$ 370,016,216$
(1) From Table 7.(2) Not available
(3) Limitation is established by state statute.(4) lncludes general obligation debt net of assets available for bond retirement.
Debt limit - 25% of total
Amount of debt applicable to limit (4)

179
Table 14
City of Fort Smith, Arkansas Ratios of Outstanding Debt by Type
Last Ten Fiscal Years
(Unaudited)
Sales Sales Total PercentageTax Notes Capital Revenue Tax Capital Primary of Personal Per
Fiscal Year Bonds Payable Leases Bonds Bonds Leases Government Income (1) Capita (1)
2009 83,108,248$ 970,000$ 96,209$ 193,336,746$ -$ 759,641$ 278,270,844$ 3.1% 3,245 2010 70,142,001 495,000 49,134 186,251,924 - 514,572 257,452,631 2.7% 2,986 2011 52,894,533 - - 179,222,398 - 677,219 232,794,150 2.4% 2,671 2012 115,161,914 - 294,355 174,755,817 - 910,196 291,122,282 3.1% 3,329 2013 101,838,920 - 160,439 168,766,139 - 1,066,493 230,042,219 2.4% 2,631 2014 125,361,084 - 281,239 162,626,345 - 355,190 282,394,551 3.0% 3,238 2015 113,634,511 - 173,163 188,028,416 - - 301,836,090 3.2% 3,452 2016 101,722,935 - 88,100 184,391,017 - - 286,202,052 2.9% 3,245 2017 88,916,358 - - 177,146,166 - - 266,062,524 2.7% 3,004 2018 75,694,781 - - 250,475,721 - - 326,170,502 3.1% 3,713
Note: Details regarding the City's outstanding debt can be found in the notes to the financial statements.
(1) See Table 16 for the personal income and population data.
Governmental Activities Business-Type Activities

180
Table 15
City of Fort Smith, Arkansas Revenue Bonds Debt Service Coverage
Last Ten Fiscal Years
(Unaudited)
Direct Net RevenueFiscal Operating Available forYear Revenue (1) Expenses (2) Debt Services Principal Interest (3) Total Coverage
2009 37,118,841$ 21,489,095$ 15,629,746$ 5,665,000$ 9,335,000$ 15,000,000$ 104%2010 38,661,437 20,872,208 17,789,229 5,910,000 9,089,126 14,999,126 119%2011 40,820,838 20,759,793 20,061,045 6,170,000 8,828,313 14,998,313 134%2012 41,080,985 22,019,792 19,061,193 4,045,000 7,968,048 12,013,048 159%2013 37,841,132 22,867,856 14,973,276 5,705,000 7,896,016 13,601,016 110%2014 36,176,568 23,037,349 13,139,219 5,870,000 7,728,715 13,598,715 97%2015 43,646,523 24,179,774 19,466,749 6,085,000 (5) 7,567,304 13,652,304 143%2016 53,684,097 26,705,909 26,978,188 6,675,000 (6) 7,836,058 14,511,058 186%2017 55,851,653 27,161,854 28,689,799 6,275,000 7,374,703 13,649,703 210%2018 59,882,546 29,019,604 30,862,942 6,170,000 (7) 7,720,005 13,890,005 222%
2009 12,675,503$ 10,058,856$ 4,304,150$ 945,000$ 113,716$ 1,058,716$ 405%2010 13,390,293 10,476,471 2,616,647 1,020,000 83,220 1,103,220 247%2011 12,675,503 10,142,163 2,913,822 1,060,000 21,465 1,081,465 264%2012 12,927,934 10,925,530 2,533,340 - - - N/A2013 15,278,747 10,820,344 4,458,403 - - - N/A2014 (4) 13,638,922 11,598,608 4,458,403 - - - N/A2015 (4) 13,827,406 10,846,954 2,980,452 - - - N/A2016 (4) 14,857,037 10,181,649 4,675,388 - - - N/A2017 (4) 14,972,614 11,868,266 3,104,348 - - - N/A2018 (4) 17,107,962 10,977,441 6,130,521 - - - N/A
(1) For purposes of this schedule, revenue includes operating revenue, interest revenue, and gross other nonoperating revenue.(2) Excludes depreciation expense and amortization expense.(3) Total interest paid for the fiscal year is presented in this schedule for revenue bonds only and it does not include capitalized interest or accrued interest.
2018 reconciliation of interest paid reported on this schedule to the statement of revenues, expenses, and changes in fund net assets for the proprietary funds:
Water & Sewer
Interest paid - this schedule 7,720,005$ Bond expenses (959,902) Accrued interest - 12/31/17 (1,918,103) Accrued interest - 12/31/18 2,691,963
Interest expense and fiscal charges - statement of revenues, expenses, and changes in fund net position 7,533,963$
(4) The solid waste system revenue bonds were redeemed in full during 2011. There are no revenue bonds outstanding at December 31, 2012 - 2017 for the solid waste system.
(7) For the purposes of this schedule, the principle amount was adjusted for the 2008 full bond refunding and the amount that was expected to be retired in 2018 relating to these bonds.
(6) For the purposes of this schedule, the principle amount was adjusted for the 2007 full bond refunding and 2008 partial bond refunding and the amount that was expected to be retired in 2016 relating to these bonds.
(5) For the purposes of this schedule, the principle amount was adjusted for the 2005B bond refunding and the amount that was expected to be retired in 2015 relating to these bonds.
Solid Waste System
Debt Service Requirements
Water and Sewer System

181
Table 16
City of Fort Smith, Arkansas Demographic Statistics
Last Ten Fiscal Years
(Unaudited)
Education
Personal Level in SchoolFiscal City County Income (2) Per Capita Median Years of Enrollment Unemployment Year Population (1) Population (1) (in thousands) Income (2) Age (3) Schooling (3) (4) Rate (2)
2009 85,747 123,597 9,054,458 30,896 35.4 12 13,792 8.2%2010 86,209 125,744 9,395,000 31,266 35.0 12 14,109 8.5%2011 87,155 126,948 9,537,232 31,891 35.0 12 13,896 8.6%2012 87,443 127,304 9,503,067 33,876 35.0 12 14,048 7.7%2013 87,443 127,304 9,469,141 34,892 35.0 12 14,313 8.1%2014 87,215 127,463 9,478,220 34,711 35.7 12 14,317 5.5%2015 87,443 126,716 9,546,448 37,340 35.0 12 14,918 5.4%2016 88,194 127,793 9,778,769 34,065 37.8 12 14,341 4.3%2017 88,570 128,107 9,964,566 35,956 38.1 12 14,407 4.1%2018 87,845 127,753 10,491,067 37,047 35.0 12 14,181 3.6%
Data Sources:(1) Bureau of the Census(2) U.S. Department of Commerce(3) Community Development Department's estimate.(4) Fort Smith School District* Estimate

182
Table 17
City of Fort Smith, Arkansas Principal Employers
Continuing Disclosure Requirement
Current Year and Nine Years Ago
(Unaudited)
Percentage Percentageof Total City of Total City
Employer Employees Rank Employment Employees Rank Employment
O. K. Industries 3,183 1 2.7% 2,200 3 1.6%
Mercy Medical Center 3,100 2 2.6% 1,774 6 1.3%Fort Smith Public Schools 2,200 3 1.9% 2,170 4 1.6%Baptist Health 1,806 4 1.5% 4,748 1 3.5%ArcBest Corp. 1,662 5 1.4% 898 9 0.7%ABB (Formerly Baldor Electric Co) 1,614 6 1.4% 2,262 2 1.7%University of Arkansas at Fort Smith 1,162 7 1.0% 946 8 0.7%City of Fort Smith 1,064 8 0.9% 904 10 0.7%
Bost, Inc. 1,000 9 0.9%Rheem Manufacturing 900 10 0.8% 1,702 7 1.3%Whirlpool Corporation 1,800 5 1.3%
Total 17,691 15.0% 19,404 14.5%
Data Sources:Chamber of Commerce
U.S. Department of Labor, employment totals: 2019 117,573 2009 134,200
2018 2009

183
Table 18
City of Fort Smith, Arkansas Full-time Equivalent City Government Employees by Function
Last Ten Fiscal Years
(Unaudited)
Function 2009 2010 2011 2012 2013 2014 2015 2016 2017 2018
General government 125 127 127 126 126 125 126 132 134 138 Public safety:
Police Officers 168 170 170 163 163 163 162 164 163 163 Civilians 52 59 59 59 59 59 59 55 55 52
FireFirefighters and officers 129 129 129 129 149 149 149 149 149 149 Civilians 3 3 3 3 3 3 3 3 3 4
Public works:Operations 5 5 5 5 5 5 5 5 5 5 Streets 46 46 46 46 54 54 53 53 54 52 Traffic control 13 13 13 13 13 13 13 14 13 14
Parks and recreation 58 58 58 58 64 64 63 61 64 58 Transit 36 36 36 36 35 34 33 33 33 34 Water and sewer 191 192 189 191 192 196 223 264 270 302 Sanitation 78 78 78 78 78 78 79 88 86 91
Total 904 916 913 907 941 943 968 1,021 1,029 1,062

184
Table 19
City of Fort Smith, Arkansas Capital Asset Statistics by Function
Last Ten Fiscal Years (Unaudited)
Function 2009 2010 2011 2012 2013 2014 2015 2016 2017 2018
Police:Stations 1 1 1 1 1 1 1 1 1 1
Sub-stations 8 8 8 8 8 8 8 8 8 8 Patrol units 12 12 12 12 12 12 12 12 12 10
Fire:Stations 10 10 10 10 11 11 11 11 11 11
Apparatus 21 21 21 18 17 17 17 30 27 27 Streets
Streets (miles) 590 590 590 590 590 590 590 503 505 505
Streetlights 6,029 6,029 6,053 6,053 6,053 6,053 6,600 6,778 6,053 6,200 Traffic signals 146 146 149 149 149 149 150 151 149 154
Parks and recreationParks acreage (square feet) 273 273 273 273 273 276 286 325 325 536 Parks 25 25 25 25 25 26 28 28 28 28
Swimming pools 1 1 1 1 1 1 1 1 1 1 Water splashpad 1 1 1 1 1 1 2 2 2 4
Tennis courts 12 12 12 12 12 12 12 12 12 12 Skatepark 1 1 1 1 1 1 1 1 1 2 Community centers 5 5 5 5 5 5 5 5 5 5
Convention center - Theater -seats 1,331 1,331 1,331 1,331 1,331 1,331 1,331 1,331 1,331 1,331 Theater -area (square feet) 4,200 4,200 4,200 4,200 4,200 4,200 4,200 4,200 4,200 4,200 Exhibit Hall -area (square feet) 40,000 40,000 40,000 40,000 40,000 40,000 40,000 40,000 40,000 40,000
Transit buses 20 20 20 20 20 19 16 16 16 16 Water and sewer
Water mains (miles) 626 626 626 626 626 626 702 702 720 721
Average daily production capacity
(thousands of gallons) 59,000 41,999 63,400 63,400 63,400 63,400 63,400 63,400 63,400 63,400
Average daily consumption (thousands of gallons) 37,004 26,473 30,532 30,532 21,267 22,137 20,862 20,878 20,878 29,182
Sanitary sewers (miles) 516 516 500 500 545 545 516 522 500 562
Sanitation
Collection trucks 52 53 53 45 45 45 45 44 44 44
Landfill capacity (in cubic yards) 66,151,721 65,872,831 65,585,500 65,343,244 65,023,707 64,998,995 63,895,067 61,612,281 50,314,801 49,952,321
NA - not available

185
Table 20
City of Fort Smith, Arkansas Operating Indicators by Function
Last Ten Fiscal Years (Unaudited)
Function 2009 2010 2011 2012 2013 2014 2015 2016 2017 2018
Police:Physical arrest 9,776 10,073 8,820 9,324 8,781 8,155 9,026 9,854 9,521 8,621
Parking violations 5,702 7,622 5,984 5,649 5,312 4,320 5,197 4,904 1,991 1,723 Traffic violations 19,593 16,296 14,841 14,841 14,946 11,343 14,165 11,657 18,389 16,777
FireNumber of calls answered 7,825 8,026 8,158 8,793 8,688 10,148 10,071 10,223 10,763 11,337
TransitPassenger trips 177,991 191,221 198,165 206,329 215,591 204,097 194,869 190,418 191,124 204,695
Water and sewer
New connections 345 450 371 299 314 269 246 325 283 305 Average daily production (thousands of gallons) 23,934 26,473 30,532 28,554 26,850 22,137 26,859 28,767 26,859 29,182 Average daily sewage flow (thousands of gallons) 19,473 16,844 17,421 15,200 14,684 17,100 21,040 15,030 15,010 16,660
SanitationWaste disposal (cubic yards/day) 1,040 1,137 1,052 1,352 1,024 1,024 1,024 1,533 2,368 1,169

186
Table 21
City of Fort Smith, Arkansas Solid Waste System Statistics
Continuing Disclosure Requirement
Last Ten Fiscal Years
(Unaudited)
Annual #Sanitation Cubic Yardage
Fiscal System of WasteYear Customers at Landfill
2009 312,972 1,124,130 39 yrs 66,151,721 cubic yards2010 317,124 1,229,905 39 yrs 65,872,831 cubic yards2011 321,048 1,137,597 21 yrs 65,585,500 cubic yards2012 323,988 1,466,643 19 yrs 65,343,244 cubic yards2013 327,036 1,107,403 16 yrs 65,023,707 cubic yards2014 330,300 1,037,201 12 yrs 64,998,995 cubic yards2015 351,660 1,367,035 14 yrs 63,895,067 cubic yards2016 357,036 1,765,715 10 yrs 61,612,281 cubic yards2017 418,938 2,497,533 4 yrs 50,314,801 cubic yards2018 436,439 2,860,013 3 yrs 49,952,321 cubic yards
(1) This is the remaining life of the current cell being filled at the landfill. Theentire landfill has a remaining life of 125 years.
StorageUseful Life
Remaining (1) at Landfillof Landfill Capacity
Remaining

187
(This Page Intentionally Left Blank)

188
Table 22
City of Fort Smith, Arkansas Water and Sewer Statistics
Continuing Disclosure Requirement (Unaudited)
Average Maximum Total Average
Daily Daily Water Use Daily
Fiscal Water Use Water Use for Year Sewage FlowYear in Gallons in Gallons in Gallons in Gallons
2014 22,137,000 38,157,000 8,079,966,000 17,100,000 2015 26,859,000 36,791,000 9,803,481,000 21,040,000 2016 28,767,000 40,783,000 10,528,668,000 15,029,524 2017 20,434,686 36,791,000 7,458,660,308 15,010,000
2018 21,643,923 39,341,000 7,900,031,920 16,660,000
Water CustomersFiscal Year Residential Commercial Wholesale Other Total
2014 29,346 4,222 13 151 33,732 2015 29,474 4,205 13 158 33,850
2016 29,789 4,296 13 165 34,263 2017 29,915 4,238 13 168 34,334 2018 29,976 4,341 13 176 34,506
Sewer CustomersFiscal Year Residential Commercial Government Total
2015 27,185 3,664 94 30,943 2016 27,526 3,696 92 31,314
2017 27,633 3,628 90 31,351
2017 27,633 3,628 90 31,351
2018 27,697 3,693 90 31,480

189
Table 22 (Continued)
City of Fort Smith, Arkansas Water and Sewer Statistics (Continued)
Continuing Disclosure Requirement (Unaudited)
For 2017: % of Gross
Entity Water Sewer Total Revenues
City of Van Buren 3,371,913$ -$ 3,371,913$ 6.14%
OK Foods 2,588,258 195,955 2,784,213 5.07%
Gerber Products 712,288 - 712,288 1.30%
Gerdau Macsteel 414,188 1,719,453 2,133,641 3.89%
Sparks Medical Center 219,674 345,986 565,660 1.03%
Mars Petcare US 259,644 138,143 397,787 0.72%
St. Edward Mercy Medical Center 150,659 - 150,659 0.27%
The Links Fort Smith - 190,587 190,587 0.35%
Twin River 141,780 427,094 568,874 1.04%
Pernod Ricard (Hiram Walker) 73,581 - 73,581 0.13%
James River Dixie 88,171 293,849 382,020 0.70%
Simmons - 225,494 225,494 0.41%
Owens Corning - 168,773 168,773 0.31%
Sebastian County Park/Jail - 182,994 182,994 0.33%
Top Ten Users 8,020,156$ 3,888,328$ 11,908,484$ 21.69%
For 2018: % of Gross
Entity Water Sewer Total Revenues
OK Foods 1,986,076$ 191,382$ 2,177,458$ 3.76%
Gerber Products 591,672 - 591,672 1.02%
Gerdau Macsteel 305,017 1,207,552 1,512,569 2.61%
Sparks Medical Center 165,134 264,092 429,226 0.74%
Mars Petcare US 162,353 34,902 197,255 0.34%
St. Edward Mercy Medical Center 132,319 302,160 434,479 0.75%
The Links Fort Smith 144,380 144,380 0.25%
Twin River 117,772 314,071 431,843 0.75%
Pernod Ricard (Hiram Walker) 45,829 - 45,829 0.08%
James River Dixie 135,207 292,695 427,902 0.74%
Simmons 74,442 195,902 270,344 0.47%
Glatfelter - 32,753 32,753 0.06%
Top Ten Users 3,715,821$ 2,979,889$ 6,695,710$ 11.57%