
CITY OF FLORENCE, ALABAMA ELECTRICITY, GAS ... › document_center › utilities › Florence...We...
74
CITY OF FLORENCE, ALABAMA ELECTRICITY, GAS, AND WATER AND WASTEWATER DEPARTMENTS FINANCIAL STATEMENTS JUNE 30, 2015 and 2014
Transcript of CITY OF FLORENCE, ALABAMA ELECTRICITY, GAS ... › document_center › utilities › Florence...We...

CITY OF FLORENCE, ALABAMA
ELECTRICITY, GAS, AND WATER AND WASTEWATER DEPARTMENTS
FINANCIAL STATEMENTS
JUNE 30, 2015 and 2014

CITY OF FLORENCE, ALABAMA ELECTRICITY, GAS, AND WATER AND WASTEWATER DEPARTMENTS
T A B L E O F C O N T E N T S
PAGE
Independent Auditor’s Report 1 – 2 Management Discussion and Analysis 3 – 14 Financial Statements: Electricity Department Statements of Net Position 15 Statements of Revenues, Expenses, and Changes in Fund Net Position 16 Statements of Cash Flows 17 – 18 Gas Department Statements of Net Position 19 Statements of Revenues, Expenses, and Changes in Fund Net Position 20 Statements of Cash Flows 21 – 22 Water and Wastewater Department Statements of Net Position 23 Statements of Revenues, Expenses, and Changes in Fund Net Position 24 Statements of Cash Flows 25 – 26 Notes to Financial Statements 27 – 48 Required Supplementary Information: Electricity Department Schedule of Revenues, Expenses, and Changes in Fund Net Position— Budget and Actual (GAAP Budgetary Basis) 49 Gas Department Schedule of Revenues, Expenses, and Changes in Fund Net Position— Budget and Actual (GAAP Budgetary Basis) 50 Water and Wastewater Department Schedule of Revenues, Expenses, and Changes in Fund Net Position— Budget and Actual (GAAP Budgetary Basis) 51
Schedule of Changes in the Net Pension Liability and Related Ratios 52 Schedule of Employer Contributions 53 Schedule of Funding Progress 54 Supplementary Schedules Section: Graphical Representations Source of Funds 55 Use of Funds 56 Electricity Department Schedule of Utility Plant in Service and Accumulated Depreciation 57 Gas Department Schedule of Utility Plant in Service and Accumulated Depreciation 58 Water and Wastewater Department Schedule of Utility Plant in Service and Accumulated Depreciation 59 Schedule of Revenues and Expenses—Killen System 60

Charles L. Watkins, CPA
M. Buddy Johnsey, III, CPA
Member of American Institute of CPA’s AICPA Private Companies
Practice Section Alabama Society of CPA’s
The CPA. Never Underestimate The Value.®
516 East Mobile Street • Florence, Alabama 35630-4747 • Phone (256) 767-0021 • Fax (256) 767-1491 www.wjpg.com
INDEPENDENT AUDITOR’S REPORT
Honorable Mayor and City Council City of Florence, Alabama Electricity, Gas, and Water and Wastewater Departments We have audited the accompanying financial statements of the Electricity, Gas, and Water and Wastewater Departments of the City of Florence, Alabama, as of and for the years ended June 30, 2015 and 2014, and the related notes to the financial statements, as listed in the table of contents. Management’s Responsibility for the Financial Statements Management is responsible for the preparation and fair presentation of these financial statements in accordance with accounting principles generally accepted in the United States of America; this includes the design, implementation, and maintenance of internal control relevant to the preparation and fair presentation of financial statements that are free from material misstatement, whether due to fraud or error. Auditor’s Responsibility Our responsibility is to express opinions on these financial statements based on our audits. We conducted our audits in accordance with auditing standards generally accepted in the United States of America. Those standards require that we plan and perform the audits to obtain reasonable assurance about whether the financial statements are free from material misstatement. An audit involves performing procedures to obtain audit evidence about the amounts and disclosures in the financial statements. The procedures selected depend on the auditor’s judgment, including the assessment of the risks of material misstatement of the financial statements, whether due to fraud or error. In making those risk assessments, the auditor considers internal control relevant to the entity’s preparation and fair presentation of the financial statements in order to design audit procedures that are appropriate in the circumstances, but not for the purpose of expressing an opinion on the effectiveness of the entity’s internal control. Accordingly, we express no such opinion. An audit also includes evaluating the appropriateness of accounting policies used and the reasonableness of significant accounting estimates made by management, as well as evaluating the overall presentation of the financial statements. We believe that the audit evidence we have obtained is sufficient and appropriate to provide a basis for our audit opinions. Opinions In our opinion, the financial statements referred to above present fairly, in all material respects, the financial position of the Electricity, Gas, and Water and Wastewater Departments of the City of Florence, Alabama, as of June 30, 2015 and 2014, and the changes in financial position and cash flows thereof for the years then ended in accordance with accounting principles generally accepted in the United States of America.

Page 2 Emphasis of Matter As discussed in Note 1, the financial statements present only the Electricity, Gas, and Water and Wastewater Departments of the City of Florence, Alabama and do not purport to, and do not, present fairly the financial position of the City of Florence, Alabama, as of June 30, 2015 and 2014, the changes in its financial position, or, where applicable, its cash flows for the years then ended in accordance with accounting principles generally accepted in the United States of America. Our opinion is not modified with respect to this matter. Change in Accounting Principle As discussed in Note 14 to the financial statements, in 2015, the Departments adopted new accounting guidance, GASB Statement No. 68, Accounting and Financial Reporting for Pensions and GASB Statement No. 71, Pension Transition for Contributions Made Subsequent to the Measurement Date. Our opinion is not modified with respect to this matter. Other Matters Required Supplementary Information
Accounting principles generally accepted in the United States of America require that the management’s discussion and analysis, budgetary comparison information, and pension schedules on pages 3 through 14 and pages 49 through 54 be presented to supplement the financial statements. Such information, although not a part of the financial statements, is required by the Governmental Accounting Standards Board, who considers it to be an essential part of financial reporting for placing the financial statements in an appropriate operational, economic, or historical context. We have applied certain limited procedures to the required supplementary information in accordance with auditing standards generally accepted in the United States of America, which consisted of inquiries of management about the methods of preparing the information and comparing the information for consistency with management’s responses to our inquiries, the financial statements, and other knowledge we obtained during our audit of the financial statements. We do not express an opinion or provide any assurance on the information because the limited procedures do not provide us with sufficient evidence to express an opinion or provide any assurance. Other Information
Our audits were conducted for the purpose of forming opinions on the financial statements of the Electricity, Gas, and Water and Wastewater Departments of the City of Florence, Alabama. The supplementary schedules are presented for purposes of additional analysis and are not a required part of the financial statements. The supplementary schedules are the responsibility of management and were derived from and relate directly to the underlying accounting and other records used to prepare the financial statements. Such information has been subjected to the auditing procedures applied in the audit of the financial statements and certain additional procedures, including comparing and reconciling such information directly to the underlying accounting and other records used to prepare the financial statements or to the financial statements themselves, and other additional procedures in accordance with auditing standards generally accepted in the United States of America. In our opinion, the supplementary schedules are fairly stated, in all material respects, in relation to the financial statements as a whole.
The Watkins Johnsey Professional Group, P.C. Florence, Alabama February 11, 2016

Page 3
CITY OF FLORENCE, ALABAMA ELECTRICITY, GAS, AND WATER AND WASTEWATER DEPARTMENTS
MANAGEMENT’S DISCUSSION AND ANALYSIS FISCAL YEAR 2015
FINANCIAL HIGHLIGHTS
• The individual enterprise funds experienced the following changes in net position: Electricity decreased $4.7 million or 6%; Gas decreased $1.5 million or 3%; Water and Wastewater increased $.4 million or .6%.
• The individual enterprise funds experienced the following changes in net utility plant: Electricity
increased $5.0 million or 6%; Gas increased $.8 million or 3%; Water and Wastewater increased $2.3 million or 2%.
• The individual enterprise funds experienced the following changes in operating revenues:
Electricity decreased $1.6 million or 1%; Gas increased $.8 million or 4%; Water and Wastewater increased $.7 million or 4%.
• The individual enterprise funds experienced the following changes in operating expenses:
Electricity decreased $.3 million or .2%; Gas increased $.6 million or 3%; Water and Wastewater increased $45,000 or .3%.
• The individual enterprise funds experienced the following changes in nonoperating revenues:
Electricity decreased about $22,200 or 14%; Gas increased about $3,700 or 3%; Water and Wastewater decreased about $4,400 or 53%.
• The individual enterprise funds experienced the following changes in nonoperating expenses:
Electricity decreased $20,800 or 6%; Gas had no nonoperating expenses in FY 2014 or 2015; Water and Wastewater increased $405,000 or 20%.
OVERVIEW OF THE FINANCIAL STATEMENTS Florence Utilities is accounted for through three separate enterprise funds – Electricity, Natural Gas, and Water and Wastewater. This annual report contains the financial statements of each of these funds. This annual report consists of three parts: Management’s Discussion and Analysis, Financial Statements, and Supplementary Information. The financial statements also include notes that explain in more detail some of the information in the financial statements. REQUIRED FINANCIAL STATEMENTS The financial statements of Florence Utilities report information about Florence Utilities using accounting methods similar to those used by private sector companies. These statements offer short-term and long-term financial information about its activities. The Statement of Net Position includes all of each fund’s assets, deferred outflows of resources, liabilities, and deferred inflows of resources and provides information about the nature and amounts of investments in resources (assets) and the obligations to Florence Utilities’ creditors (liabilities). It also provides the basis for computing rate of return, evaluating the capital structure of Florence Utilities, and assessing the liquidity and financial flexibility of Florence Utilities.

Page 4
All of the current year’s revenues and expenses are accounted for in the Statement of Revenues, Expenses, and Changes in Fund Net Position. This statement measures the success of Florence Utilities’ operations over the past year and can be used to determine whether Florence Utilities has successfully recovered all of its costs through its user fees and other charges, profitability, and credit worthiness. The other required financial statement is the Statement of Cash Flows. The primary purpose of this statement is to provide information about Florence Utilities cash receipts and cash payments during the reporting period. This statement reports cash receipts, cash payments, and net changes in cash resulting from operating, investing, and financing activities; and provides answers to such questions as where did the cash come from, what was cash used for, and what was the change in the cash balance during the reporting period. FINANCIAL ANALYSIS OF FLORENCE UTILITIES One of the most important questions asked about Florence Utilities’ finances is “Is Florence Utilities, as a whole, better off or worse off as a result of the year’s activities?” The Statements of Net Position and the Statements of Revenues, Expenses, and Changes in Fund Net Position report information about Florence Utilities’ activities in a way that will help answer this question. These two statements report the net position of each fund and the changes in them. You can think of each fund’s net position as one way to measure financial health or financial position. Over time, increases or decreases in net position are one indicator of whether its financial health is improving or deteriorating. However, other non-financial factors need to be considered, such as the changes in economic conditions, weather, customer growth, and regulatory and legislative mandates. Electricity Department The Electricity Department’s net position decreased from last year by $4,662,039 or about 6%. The summaries below focus on the Electricity Department’s net position and changes in net position during the years presented.
Electricity DepartmentStatements of Net Position
Increase / (Decrease)FY 2015 FY 2014 Dollars Percent
Current Assets 39,206,110$ 40,339,754$ (1,133,644)$ -2.81%Capital Assets, Net 82,315,981 77,349,662 4,966,319 6.42%Other Noncurrent Assets 7,214,641 11,243,642 (4,029,001) -35.83%
Total Assets 128,736,732 128,933,058 (196,326) Deferred Outflows of Resources 1,781,779 131,987 1,649,792 1249.97%
Total 130,518,511$ 129,065,045$ 1,453,466$ 1.13%
Current Liabilities 27,247,935$ 26,739,700$ 508,235$ 1.90%Noncurrent Liabilities 22,680,188 17,552,312 5,127,876 29.21%
Total Liabilities 49,928,123$ 44,292,012$ 5,636,111$ 12.72%
Deferred Inflows of Resources 479,394$ -$ 479,394$ N/A
Net Investment in Capital Assets 72,754,891$ 70,523,632$ 2,231,259$ 3.16%Restricted for Debt Service 983,728 981,628 2,100 0.21%Unrestricted 6,372,375 13,267,773 (6,895,398) -51.97%
Total Net Position 80,110,994$ 84,773,033$ (4,662,039)$ -5.50%

Page 5
Changes in the Electricity Department’s net position can be determined by reviewing the following condensed Statements of Revenues, Expenses, and Changes in Fund Net Position for the years presented. As the table below indicates, operating revenues decreased approximately $1.6 million or about 1% from FY 2014. During FY 2015, TVA had twelve rate changes to its distributors under its Total Monthly Fuel Cost Adjustment provisions. Florence Utilities passed these rate changes along to our customers. Our corresponding rate changes were revenue neutral for us. The Electricity Department experienced an approximate 3% decrease in kilowatt-hours sold in FY 2015 compared to FY 2014. The Electricity Department continues to experience very low interest revenues caused by very low interest rates. The Electricity Department experienced a decrease in nonoperating expenses by $20,756 or about 6%. The Electricity Department’s restated beginning net position reflects the cumulative effect of a $5,537,736 decrease due to the implementation of GASB Statement No. 68 and Statement No. 71.
Electricity DepartmentStatements of Revenues, Expenses, and Changes in Fund Net Position
Increase / (Decrease)FY 2015 FY 2014 Dollars Percent
Operating Revenues 122,288,703$ 123,872,164$ (1,583,461)$ -1.28%
Operating ExpensesCost of Sales 98,677,848$ 98,841,170$ (163,322)$ -0.17%Operations 9,003,944 9,068,833 (64,889) -0.72%Maintenance 5,267,929 5,510,894 (242,965) -4.41%Depreciation 4,929,365 4,775,924 153,441 3.21%Taxes and Tax Equivalents 3,319,618 3,275,364 44,254 1.35%
Total Operating Expenses 121,198,704$ 121,472,185$ (273,481)$ -0.23%
Operating Income 1,089,999$ 2,399,979$ (1,309,980)$ -54.58%
Nonoperating Revenues (Expenses)Nonoperating Revenues 140,468$ 162,669$ (22,201)$ -13.65%Nonoperating Expenses (354,770) (375,526) 20,756 -5.53%
Total Nonoperating Revenues (Exp) (214,302)$ (212,857)$ (1,445)$ -0.68%
Change in Net Position 875,697$ 2,187,122$ (1,311,425)$ -59.96%
Total Net Position - Beginning, Restated 79,235,297 82,585,911 (3,350,614) -4.06%
Total Net Position - Ending 80,110,994$ 84,773,033$ (4,662,039)$ -5.50%

Page 6
Gas Department The Gas Department’s net position decreased from last year by $1,500,782 or about 3%. The summaries below focus on the Gas Department’s net position and changes in net position during the years presented.
Gas DepartmentStatements of Net Position
Increase / (Decrease)FY 2015 FY 2014 Dollars Percent
Current Assets 14,316,160$ 14,102,049$ 214,111$ 1.52%Capital Assets, Net 32,016,513 31,170,225 846,288 2.72%
Total Assets 46,332,673$ 45,272,274$ 1,060,399$ 2.34%
Deferred Outflows of Resources 264,827$ -$ 264,827$ 100.00%
Current Liabilities 1,643,478$ 1,462,214$ 181,264$ 12.40%Noncurrent Liabilities 2,800,295 324,742 2,475,553 762.31%
Total Liabilities 4,443,773$ 1,786,956$ 2,656,817$ 148.68%
Deferred Inflows of Resources 169,191$ -$ 169,191$ 100.00%
Net Investment in Capital Assets 32,016,513$ 31,170,225$ 846,288$ 2.72%Unrestricted 9,968,023 12,315,093 (2,347,070) -19.06%
Total Net Position 41,984,536$ 43,485,318$ (1,500,782)$ -3.45%
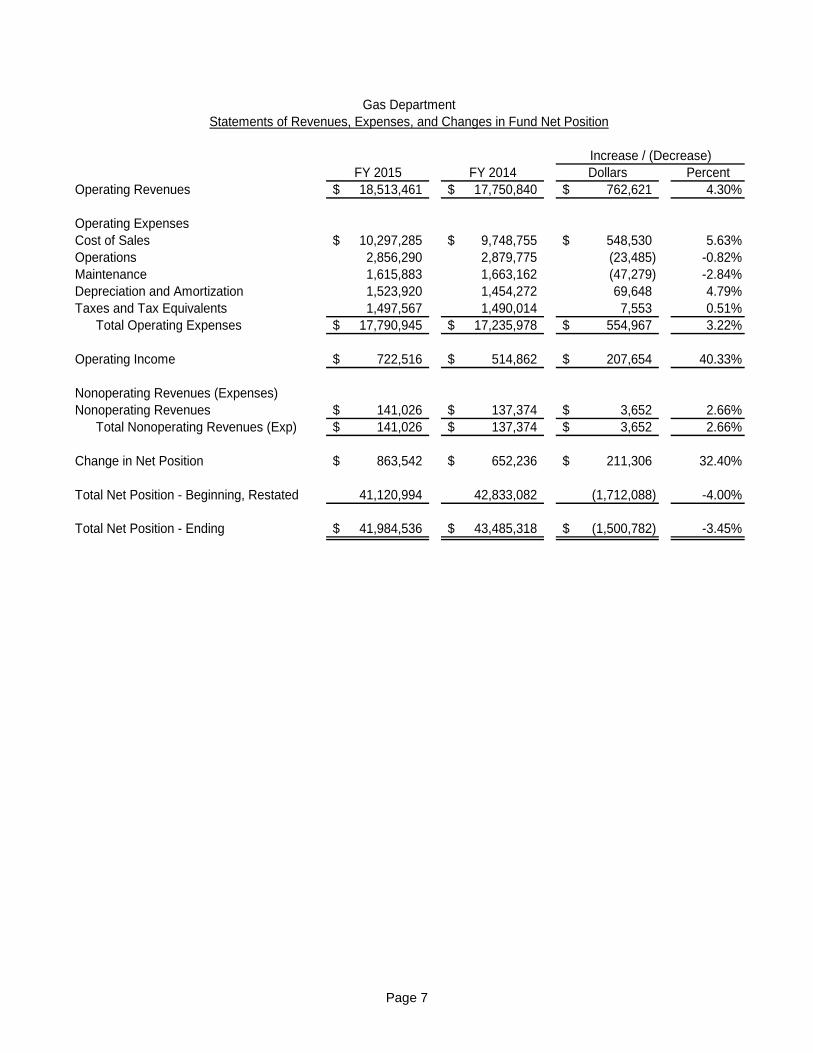
Changes in the Gas Department’s net position can be determined by reviewing the following condensed Statements of Revenues, Expenses, and Changes in Fund Net Position for the years presented. As the following table indicates, operating revenues increased approximately $.8 million or about 4% from FY 2014. The last general rate change in FY 2015 was effective February 2015. The Gas Department experienced an approximate 10.0% decrease in overall sales volume in FY 2015 compared to FY 2014. Cost of sales increased by $.5 million or about 6% due to a large customer changing from transport only customer to purchasing gas from the Department. The Gas Department experienced an increase in nonoperating revenues of $3,652 or about 3%. The Gas Department did not have nonoperating expenses in FY 2014 or FY 2015. The Gas Department’s restated beginning net position reflects the cumulative effect of a $2,364,324 decrease due to the implementation of GASB Statement No. 68 and Statement No. 71.
Page 7
Gas DepartmentStatements of Revenues, Expenses, and Changes in Fund Net Position
Increase / (Decrease)FY 2015 FY 2014 Dollars Percent
Operating Revenues 18,513,461$ 17,750,840$ 762,621$ 4.30%
Operating ExpensesCost of Sales 10,297,285$ 9,748,755$ 548,530$ 5.63%Operations 2,856,290 2,879,775 (23,485) -0.82%Maintenance 1,615,883 1,663,162 (47,279) -2.84%Depreciation and Amortization 1,523,920 1,454,272 69,648 4.79%Taxes and Tax Equivalents 1,497,567 1,490,014 7,553 0.51%
Total Operating Expenses 17,790,945$ 17,235,978$ 554,967$ 3.22%
Operating Income 722,516$ 514,862$ 207,654$ 40.33%
Nonoperating Revenues (Expenses)Nonoperating Revenues 141,026$ 137,374$ 3,652$ 2.66%
Total Nonoperating Revenues (Exp) 141,026$ 137,374$ 3,652$ 2.66%
Change in Net Position 863,542$ 652,236$ 211,306$ 32.40%
Total Net Position - Beginning, Restated 41,120,994 42,833,082 (1,712,088) -4.00%
Total Net Position - Ending 41,984,536$ 43,485,318$ (1,500,782)$ -3.45%

Page 8
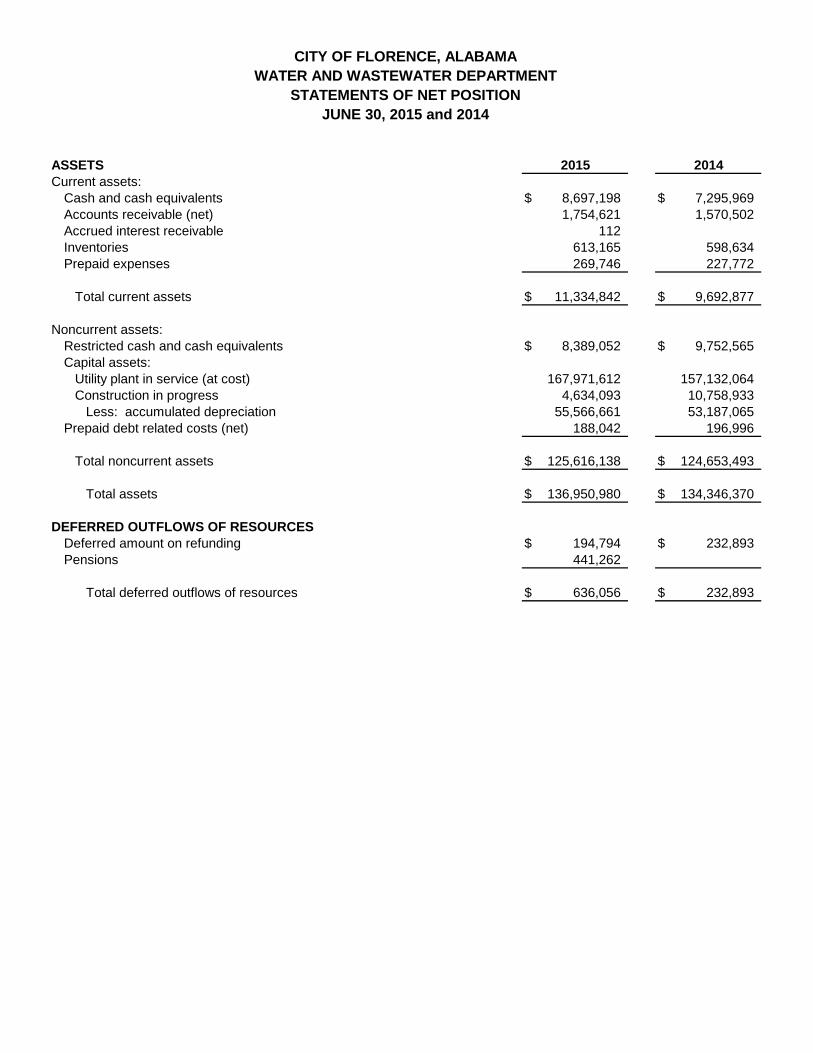
Water and Wastewater Department The Water and Wastewater Department’s net position increased from last year by $438,988 or about 1%. The summaries below focus on the Water and Wastewater Department’s net position and changes in net position during the years presented.
Water and Wastewater DepartmentStatements of Net Position
Increase / (Decrease)FY 2015 FY 2014 Dollars Percent
Current Assets 11,334,842$ 9,692,877$ 1,641,965$ 16.94%Capital Assets, Net 117,039,044 114,703,932 2,335,112 2.04%Other Noncurrent Assets 8,577,094 9,949,561 (1,372,467) -13.79%
Total Assets 136,950,980$ 134,346,370$ 2,604,610$ 1.94%
Deferred Outflows of Resources 636,056$ 232,893$ 403,163$ 173.11%
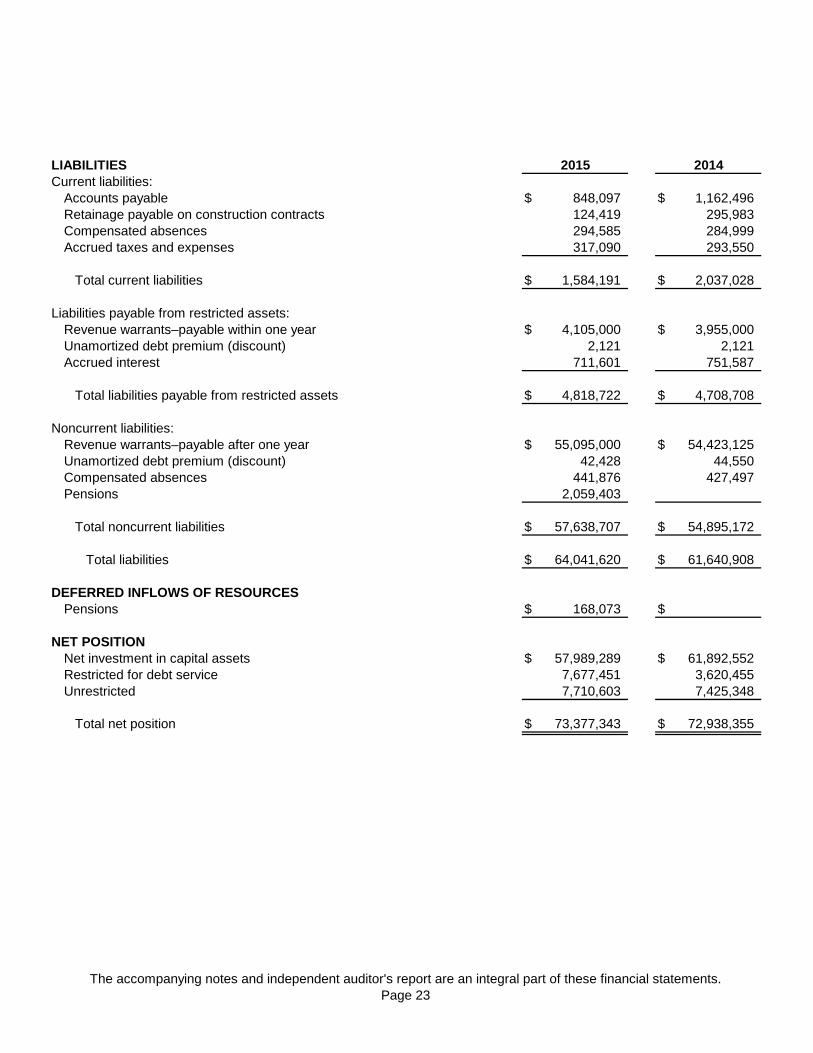
Current Liabilities 6,402,913$ 6,745,736$ (342,823)$ -5.08%Noncurrent Liabilities 57,638,707 54,895,172 2,743,535 5.00%
Total Liabilities 64,041,620$ 61,640,908$ 2,400,712$ 3.89%
Deferred Inflows of Resources 168,073$ -$ 168,073$ 100.00%
Net Investment in Capital Assets 57,989,289$ 61,892,552$ (3,903,263)$ -6.31%Restricted for Debt Service 7,677,451 3,620,455 4,056,996 112.06%Unrestricted 7,710,603 7,425,348 285,255 3.84%
Total Net Position 73,377,343$ 72,938,355$ 438,988$ 0.60%
Changes in the Water and Wastewater Department’s net position can be determined by reviewing the following condensed Statements of Revenues, Expenses, and Changes in Fund Net Position for the years presented. As the following table indicates, operating revenues increased approximately $.7 million or about 4% from FY 2014 revenues. The increase in operating revenues was largely due to a rate increase implemented July 2014. Operating expenses increased by about $45,400 or about .3%. The Water and Wastewater Department experienced a decrease in nonoperating revenues of about $4,400 or 53%. The Water and Wastewater Department experienced an increase in nonoperating expenses of $405,000 or 20% primarily due to nonrecurring retirements of capital assets that were not fully depreciated in FY 2015. The Water and Wastewater Department’s restated beginning net position reflects the cumulative effect of a $1,883,333 decrease due to the implementation of GASB Statement No. 68 and Statement No. 71.

Page 9
Water and Wastewater DepartmentStatements of Revenues, Expenses, and Changes in Fund Net Position
Increase / (Decrease)FY 2015 FY 2014 Dollars Percent
Operating Revenues 19,126,420$ 18,418,797$ 707,623$ 3.84%
Operating ExpensesWater Treatment and Pumping 2,896,453$ 2,875,811$ 20,642$ 0.72%Sewage Disposal 2,017,003 2,270,622 (253,619) -11.17%Transmission and Distribution 1,597,297 1,387,053 210,244 15.16%Accounting and Collections 930,891 980,305 (49,414) -5.04%Administrative and General 1,789,913 1,824,139 (34,226) -1.88%Depreciation 3,458,344 3,335,619 122,725 3.68%Taxes and Tax Equivalents 1,638,279 1,609,253 29,026 1.80%
Total Operating Expenses 14,328,180$ 14,282,802$ 45,378$ 0.32%
Operating Income 4,798,240$ 4,135,995$ 662,245$ 16.01%
Nonoperating Revenues (Expenses)Nonoperating Revenues 3,965$ 8,410$ (4,445)$ -52.85%Nonoperating Expenses (2,479,884) (2,075,194) (404,690) 19.50%
Total Nonoperating Revenues (Exp) (2,475,919)$ (2,066,784)$ (409,135)$ 19.80%
Change in Net Position 2,322,321$ 2,069,211$ 253,110$ 12.23%
Total Net Position - Beginning, Restated 71,055,022 70,869,144 185,878 0.26%
Total Net Position - Ending 73,377,343$ 72,938,355$ 438,988$ 0.60%
BUDGETARY HIGHLIGHTS As required, the City Council adopts a budget for each enterprise fund comprising the Florence Utilities. The FY 2015 original budgets for the Gas and Water and Wastewater Departments were adopted on July 15, 2014. The original budget for the Electricity Department was adopted on October 7, 2014. The budgets for the Electricity Department, Gas Department, and the Water and Wastewater Department were not amended in FY 2015. A budget comparison statement is prepared monthly for each department for internal use and is distributed to elected officials and the appropriate management personnel. A budget comparison report is included for the Electricity Department, Gas Department, and the Water and Wastewater Department in the Required Supplementary Information Section of this annual report. Following is a summarized report and brief explanation of highlights.

Page 10
Electricity Department
Electricity DepartmentSchedule of Revenues, Expenses, and Changes in Fund Net Position
Budget and Actual (GAAP Budgetary Basis)For the Year Ended June 30, 2015
Final VarianceBudget Actual Dollars Percent
Operating Revenues 120,956,000$ 122,288,703$ 1,332,703$ 1.10%Operating Expenses 119,202,200 121,198,704 (1,996,504) -1.67%Operating Income 1,753,800$ 1,089,999$ (663,801)$ -37.85%Nonoperating Revenues (Expenses) (172,300) (214,302) (42,002) -24.38%Change in Net Position 1,581,500$ 875,697$ (705,803)$ -44.63%Total net position - beginning, restated 79,235,297 79,235,297 Total net position - ending 80,816,797$ 80,110,994$ (705,803)$ -0.87%
As the above budget report shows, the Electricity Department did not meet the budgeted Change in Net Position by $705,803 or approximately 45%. As you can see on the budget schedule in the required supplementary information, the cost of sales of electricity accounted for most of the budget operating expenses variance amount. The remaining total variance is due to smaller variances, both positive and negative, over a large number of accounts. Gas Department
Gas DepartmentSchedule of Revenues, Expenses, and Changes in Fund Net Position
Budget and Actual (GAAP Budgetary Basis)For the Year Ended June 30, 2015
Final VarianceBudget Actual Dollars Percent
Operating Revenues 19,707,200$ 18,513,461$ (1,193,739)$ -6.06%Operating Expenses 19,478,200 17,790,945 1,687,255 8.66%Operating Income 229,000$ 722,516$ 493,516$ 215.51%Nonoperating Revenues (Expenses) 154,500 141,026 (13,474) -8.72%Change in Net Position 383,500$ 863,542$ 480,042$ 125.17%Total net position - beginning, restated 41,120,994 41,120,994 Total net position - ending 41,504,494$ 41,984,536$ 480,042$ 1.16%
The Gas Department exceeded the budgeted Change in Net Position by $480,042, or approximately 125%. As you can see on the budget schedule in the required supplementary information, the total variance is accounted for by a combination of positive and negative variances. The large variance in budgeted operating revenues was largely offset by the variance in cost of sales.

Page 11
Water and Wastewater Department
Water and Wastewater DepartmentSchedule of Revenues, Expenses, and Changes in Fund Net Position
Budget and Actual (GAAP Budgetary Basis)For the Year Ended June 30, 2015
Final VarianceBudget Actual Dollars Percent
Operating Revenues 19,475,300$ 19,126,420$ (348,880)$ -1.79%Operating Expenses 15,322,800 14,328,180 994,620 6.49%Operating Income 4,152,500$ 4,798,240$ 645,740$ 15.55%Nonoperating Revenues (Expenses) (2,002,250) (2,475,919) (473,669) -23.66%Change in Net Position 2,150,250$ 2,322,321$ 172,071$ 8.00%Total net position - beginning, restated 71,055,022 71,055,022 0.00%Total net position - ending 73,205,272$ 73,377,343$ 172,071$ 0.24%
The Water and Wastewater Department exceeded the budgeted Change in Net Position by $172,071, or approximately 8%. As you can see on the budget schedule in the required supplementary information, there was a combination of positive and negative variances for many accounts. The more significant variances are water sales, sewage disposal expense, depreciation expense, and loss on disposition of assets. CAPITAL ASSETS AND DEBT ADMINISTRATION Capital Assets At the end of FY 2015, capital assets comprised the majority of each fund’s assets. The following are summaries highlighting each fund’s changes in capital assets. Information that is more detailed is presented for each department in the supplementary schedules section. Electricity Department
Electricity DepartmentCapital Assets, Net
FY 2015
Increase / (Decrease)FY 2015 FY 2014 Dollars Percent
Utility Plant in Service (at Cost) 162,127,921$ 156,353,379$ 5,774,542$ 3.69%Construction in Progress 5,720,497 4,260,295 1,460,202 34.27%Less: Accumulated Depreciation (85,532,437) (83,264,012) (2,268,425) 2.72%Net Utility Plant 82,315,981$ 77,349,662$ 4,966,319$ 6.42%
As the above table shows, the Electricity Department experienced a 6.42% increase in net utility plant. In FY 2015, the Department spent the remaining approximately $3.5 million of warrant proceeds on capital projects authorized in the warrant documents. The Department plans to finance capital expenditures in FY 2016 through cash generated from current operations and cash reserves.

Page 12
Gas Department
Gas DepartmentCapital Assets, Net
FY 2015
Increase / (Decrease)FY 2015 FY 2014 Dollars Percent
Utility Plant in Service (at Cost) 56,049,850$ 54,829,398$ 1,220,452$ 2.23%Acquisition Adjustment (net ofamortization) 168,802 179,463 (10,661) -5.94%Construction in Progress 12,002 104,418 (92,416) -88.51%Less: Accumulated Depreciation (24,214,141) (23,943,054) (271,087) 1.13%Net Utility Plant 32,016,513$ 31,170,225$ 846,288$ 2.72%
As the above table shows, the Gas Department increased net utility plant by 2.7%. The increase in capital assets was largely due to installation of radio read meters. The Department plans to finance capital expenditures in FY 2016 through cash reserves and cash generated from current operations. Water and Wastewater Department
Water and Wastewater DepartmentCapital Assets, Net
FY 2015
Increase / (Decrease)FY 2015 FY 2014 Dollars Percent
Utility Plant in Service (at Cost) 167,971,612$ 157,132,064$ 10,839,548$ 6.90%Construction in Progress 4,634,093 10,758,933 (6,124,840) -56.93%Less: Accumulated Depreciation (55,566,661) (53,187,065) (2,379,596) 4.47%Net Utility Plant 117,039,044$ 114,703,932$ 2,335,112$ 2.04%
As the above table shows, the Water and Wastewater Department increased net utility plant by 2.04%. In FY 2015, the Department spent a significant amount on capital improvements. At year-end, there were several large projects in progress. In FY 2015, the Department spent about $1.5 million of Series 2011 Revenue Warrants’ proceeds on approved capital projects. The Department spent about $5.1 million of proceeds from the 2013 SRF warrants and about $143,000 from TVA and the Florence Industrial Economic Development funds. The Department plans to finance capital expenditures in FY 2016 with cash reserves, cash generated from current operations, various grants, and the remaining proceeds from the Water and Sewer Revenue Warrants, Series 2011.
Page 13
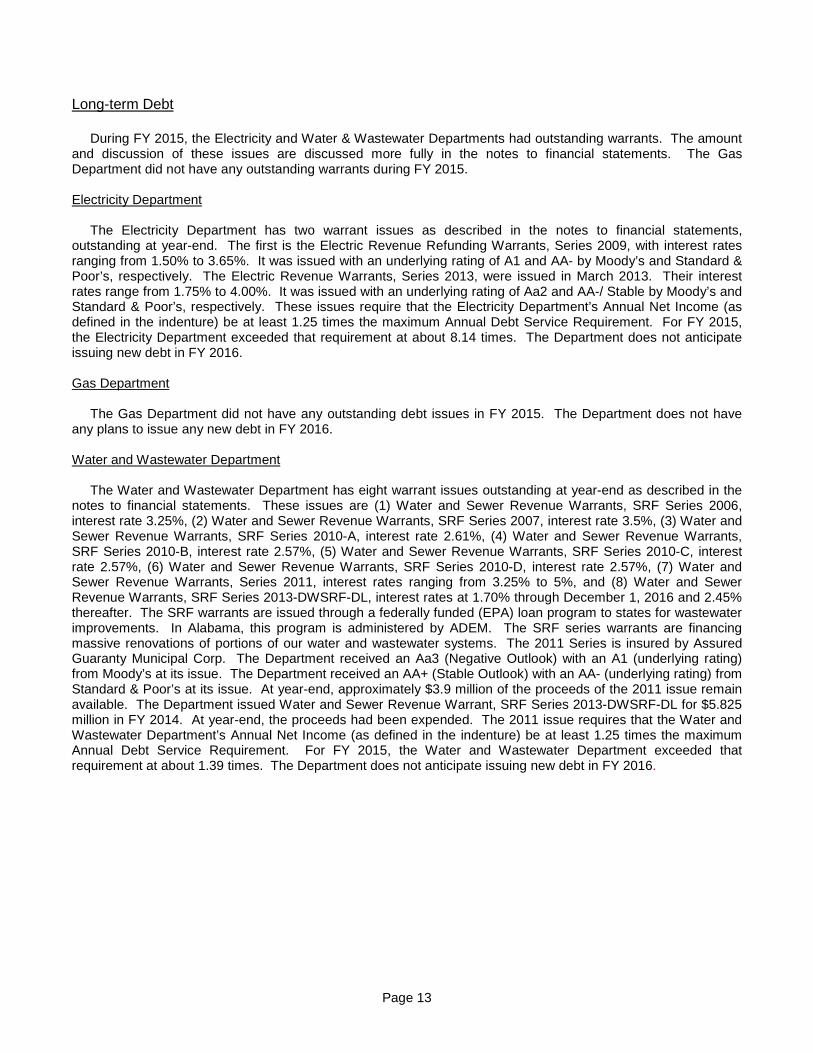
Long-term Debt During FY 2015, the Electricity and Water & Wastewater Departments had outstanding warrants. The amount and discussion of these issues are discussed more fully in the notes to financial statements. The Gas Department did not have any outstanding warrants during FY 2015. Electricity Department The Electricity Department has two warrant issues as described in the notes to financial statements, outstanding at year-end. The first is the Electric Revenue Refunding Warrants, Series 2009, with interest rates ranging from 1.50% to 3.65%. It was issued with an underlying rating of A1 and AA- by Moody’s and Standard & Poor’s, respectively. The Electric Revenue Warrants, Series 2013, were issued in March 2013. Their interest rates range from 1.75% to 4.00%. It was issued with an underlying rating of Aa2 and AA-/ Stable by Moody’s and Standard & Poor’s, respectively. These issues require that the Electricity Department’s Annual Net Income (as defined in the indenture) be at least 1.25 times the maximum Annual Debt Service Requirement. For FY 2015, the Electricity Department exceeded that requirement at about 8.14 times. The Department does not anticipate issuing new debt in FY 2016. Gas Department The Gas Department did not have any outstanding debt issues in FY 2015. The Department does not have any plans to issue any new debt in FY 2016. Water and Wastewater Department The Water and Wastewater Department has eight warrant issues outstanding at year-end as described in the notes to financial statements. These issues are (1) Water and Sewer Revenue Warrants, SRF Series 2006, interest rate 3.25%, (2) Water and Sewer Revenue Warrants, SRF Series 2007, interest rate 3.5%, (3) Water and Sewer Revenue Warrants, SRF Series 2010-A, interest rate 2.61%, (4) Water and Sewer Revenue Warrants, SRF Series 2010-B, interest rate 2.57%, (5) Water and Sewer Revenue Warrants, SRF Series 2010-C, interest rate 2.57%, (6) Water and Sewer Revenue Warrants, SRF Series 2010-D, interest rate 2.57%, (7) Water and Sewer Revenue Warrants, Series 2011, interest rates ranging from 3.25% to 5%, and (8) Water and Sewer Revenue Warrants, SRF Series 2013-DWSRF-DL, interest rates at 1.70% through December 1, 2016 and 2.45% thereafter. The SRF warrants are issued through a federally funded (EPA) loan program to states for wastewater improvements. In Alabama, this program is administered by ADEM. The SRF series warrants are financing massive renovations of portions of our water and wastewater systems. The 2011 Series is insured by Assured Guaranty Municipal Corp. The Department received an Aa3 (Negative Outlook) with an A1 (underlying rating) from Moody’s at its issue. The Department received an AA+ (Stable Outlook) with an AA- (underlying rating) from Standard & Poor’s at its issue. At year-end, approximately $3.9 million of the proceeds of the 2011 issue remain available. The Department issued Water and Sewer Revenue Warrant, SRF Series 2013-DWSRF-DL for $5.825 million in FY 2014. At year-end, the proceeds had been expended. The 2011 issue requires that the Water and Wastewater Department’s Annual Net Income (as defined in the indenture) be at least 1.25 times the maximum Annual Debt Service Requirement. For FY 2015, the Water and Wastewater Department exceeded that requirement at about 1.39 times. The Department does not anticipate issuing new debt in FY 2016.

Page 14
ECONOMIC FACTORS AND NEXT YEAR’S BUDGET AND RATES The geographic area served by Florence Utilities is facing a slightly decreasing economic environment. The Florence MSA’s unemployment rate for August 2015 was 7.8% as compared to 7.4% for August 2014. The State of Alabama’s unemployment rates were 6.2% for August 2015 and 6.9% for August 2014. Early in FY 2015, Hillshire Brands closed its plant in Florence, one of our larger customers in all services. In addition to the economic environment, the weather is an important factor in determining utility sales. Although it is impossible to predict the weather in the upcoming year, sales in kilowatt-hours for FY 2016 through September 2015 for electricity have increased from the same period last year by 2.5%. Sales in dekatherms to commercial and industrial natural gas customers for the period from July 2015 through September 2015, as compared to sales for the same period in the previous fiscal year, have decreased approximately 13.7%. The decrease in sales volume was due to the loss of two customers, Hillshire Brands and Hon. FY 2016 sales revenues from water and wastewater operations through September 2015 have decreased about .01% over the same period in FY 2015. The City Council adopted the Gas Department’s and the Water and Wastewater Department’s FY 2016 budgets on June 16, 2015. The City Council adopted the Electricity Department’s FY 2016 budget on October 6, 2015. There have not been any budget amendments for FY 2016 at this point. The City’s power contract with TVA provides for a Total Monthly Fuel Cost Adjustment (TMFCA) on sales to its distributors. Florence Utilities passes any rate increases or decreases caused by TVA action on to its customers. The Gas Department’s rate ordinance allows for gas rate changes without further City Council action. The Department last implemented a rate increase in December 2015. The volatility of natural gas makes this ability for quick rate action important for the Department’s financial health. On June 17, 2014, the City Council approved a rate increase for the Water and Wastewater Department, effective July 1, 2014. The new rate ordinance includes a provision to increase the water and sewer rates annually based upon increase in Consumer Price Index, subject to certain restrictions. The Water and Wastewater Department had a rate increase effective July 1, 2015. The ordinance is available for review on the City’s website at www.florenceutilities.com along with some prior rate ordinances. CONTACTING FLORENCE UTILITIES FINANCIAL MANAGER This financial report is designed to provide the Electricity Department’s, Gas Department’s, and Water and Wastewater Department’s ratepayers and creditors with a general overview of their finances and to demonstrate Florence Utilities’ accountability for the money it receives. A limited number of prior years’ audited financial statements are available online at the Florence Utilities website at www.florenceutilities.com and the Electronic Municipal Market Access (EMMA) website of the Municipal Securities Rulemaking Board. If you have questions about this report or need additional financial information, contact the Controller of Utilities, Florence Utilities, P.O. Box 877, Florence, AL 35631.

This page intentionally blank.

CITY OF FLORENCE, ALABAMAELECTRICITY DEPARTMENT
STATEMENTS OF NET POSITIONJUNE 30, 2015 and 2014
ASSETS 2015 2014Current assets:
Cash and cash equivalents $ 18,250,351 $ 18,031,573Accounts receivable (net) 12,151,384 13,017,763Accrued interest receivable 1,112 1,473Inventories 1,591,349 1,646,232Prepaid expenses 7,211,914 7,642,713
Total current assets $ 39,206,110 $ 40,339,754
Noncurrent assets:Restricted cash and cash equivalents $ 1,008,918 $ 4,478,098 Capital assets:
Utility plant in service (at cost) 162,127,921 156,353,379Construction in progress 5,720,497 4,260,295
Less: accumulated depreciation 85,532,437 83,264,012Receivables from customers for conservation loans 6,205,723 6,765,544
Total noncurrent assets $ 89,530,622 $ 88,593,304
Total assets $ 128,736,732 $ 128,933,058
DEFERRED OUTFLOWS OF RESOURCESDeferred amount on refunding $ 105,589 $ 131,987 Pensions 1,676,190
Total deferred outflows of resources $ 1,781,779 $ 131,987

The accompanying notes and independent auditor's report are an integral part of these financial statements.Page 15
LIABILITIES 2015 2014Current liabilities:
Accounts payable $ 17,821,251 $ 17,612,585 Retainage payable 195,308 219,615 Customer deposits 7,223,809 6,963,490 Compensated absences 616,862 619,915 Accrued taxes and expenses 579,874 536,288
Total current liabilities $ 26,437,104 $ 25,951,893
Liabilities payable from restricted assets:Revenue warrants–payable within one year $ 790,000 $ 765,000 Unamortized debt premium (discount) (4,359) (4,359) Accrued interest 25,190 27,166
Total liabilities payable from restricted assets $ 810,831 $ 787,807
Noncurrent liabilities:Revenue warrants–payable after one year $ 8,890,000 $ 9,680,000 Unamortized debt premium (discount) (8,962) (13,320) Advances from TVA for conservation loans 6,380,922 6,955,761 Compensated absences 925,293 929,871 Pensions 6,492,935
Total noncurrent liabilities $ 22,680,188 $ 17,552,312
Total liabilities $ 49,928,123 $ 44,292,012
DEFERRED INFLOWS OF RESOURCESPensions $ 479,394 $
NET POSITIONNet investment in capital assets $ 72,754,891 $ 70,523,632Restricted for debt service 983,728 981,628Unrestricted 6,372,375 13,267,773
Total net position $ 80,110,994 $ 84,773,033

The accompanying notes and independent auditor's report are an integral part of these financial statements.Page 16
CITY OF FLORENCE, ALABAMAELECTRICITY DEPARTMENT
STATEMENTS OF REVENUES, EXPENSES, AND CHANGES IN FUND NET POSITIONFOR THE YEARS ENDED JUNE 30, 2015 and 2014
2015 2014Operating revenues:
Electric sales:Residential $ 63,828,720 $ 65,166,034 Small commercial 12,629,064 12,790,311 Large commercial 40,480,260 40,607,942 Public street and highway lighting 2,290,716 2,228,496
Forfeited discounts 1,111,117 1,128,948 Rents from electric property 1,333,326 1,307,616 Other operating revenues 615,500 642,817
Total operating revenues $ 122,288,703 $ 123,872,164
Operating expenses:Costs of sales $ 98,677,848 $ 98,841,170 Operations 9,003,944 9,068,833 Maintenance 5,267,929 5,510,894 Depreciation 4,929,365 4,775,924 Taxes and tax equivalents 3,319,618 3,275,364
Total operating expenses $ 121,198,704 $ 121,472,185
Operating income $ 1,089,999 $ 2,399,979
Nonoperating revenues (expenses):Interest revenues $ 11,719 $ 20,457 Merchandising revenues (net of costs) 67,882 103,848 Miscellaneous nonoperating income 28,298 13,749 Gain on disposition of assets 32,569 24,615 Interest expense (324,014) (344,770) Amortization of debt related costs (30,756) (30,756)
Total nonoperating revenues (expenses) $ (214,302) $ (212,857)
Change in net position $ 875,697 $ 2,187,122
Total net position—beginning, as restated 79,235,297 82,585,911
Total net position—ending $ 80,110,994 $ 84,773,033

The accompanying notes and independent auditor's report are an integral part of these financial statements.Page 17
CITY OF FLORENCE, ALABAMAELECTRICITY DEPARTMENT
STATEMENTS OF CASH FLOWSFOR THE YEARS ENDED JUNE 30, 2015 and 2014
2015 2014Cash flows from operating activities:
Receipts from customers and users $ 123,251,261 $ 123,906,145 Receipts from interfund services provided 2,096,602 2,281,981 Payments to suppliers (103,209,095) (104,428,664) Payments to employees for services and
benefits—exclusive of capitalized costs (10,974,613) (10,847,236) Payments for interfund services used (3,075,892) (3,105,218)
Net cash provided by operating activities $ 8,088,263 $ 7,807,008
Cash flows from noncapital financing activities:Change in receivables from customers for conservation loans $ 559,821 $ 87,733 Change in advances from TVA for conservation loans (574,839) (98,540)
Net cash provided (used) by noncapital financing activities $ (15,018) $ (10,807)
Cash flows from capital and related financing activities:Purchase and construction of capital assets (net) $ (9,901,002) $ (7,516,654) Proceeds from disposition of assets 82,982 279,509 Removal costs of retirements of capital assets (426,717) (500,918) Salvage value of retirements of capital assets 2,696 Principal paid on capital debt (765,000) (745,000) Interest paid on capital debt (325,990) (346,477)
Net cash used for capital and related financing activities $ (11,335,727) $ (8,826,844)
Cash flows from investing activities:Interest on investments $ 12,080 $ 21,288
Net cash provided by investing activities $ 12,080 $ 21,288
Net decrease in cash and cash equivalents $ (3,250,402) $ (1,009,355)
Balances—beginning of the year 22,509,671 23,519,026
Balances—end of the year $ 19,259,269 $ 22,509,671
Classified as:Current assets $ 18,250,351 $ 18,031,573 Restricted assets 1,008,918 4,478,098
Totals $ 19,259,269 $ 22,509,671

The accompanying notes and independent auditor's report are an integral part of these financial statements.Page 18
CITY OF FLORENCE, ALABAMAELECTRICITY DEPARTMENT
STATEMENTS OF CASH FLOWSFOR THE YEARS ENDED JUNE 30, 2015 and 2014
(Continued)
2015 2014Reconciliation of operating income to net cash provided (used) by operating activities:
Operating income $ 1,089,999 $ 2,399,979 Adjustments to reconcile operating income to net cash provided (used) by operating activities:
Depreciation $ 5,310,986 $ 5,126,341 Income from merchandising revenues (net of costs) 67,882 103,848 Miscellaneous nonoperating income 28,298 13,749
Changes in assets, deferred outflows of resources, liabilities, and deferred inflows of resources:
Receivables (net) 866,379 (83,616) Inventories 54,883 66,101 Prepaid expenses 430,799 (519,280) Deferred outflows of resources–pensions (593,498)Accounts and other payables 220,315 765,507 Customer deposits 260,319 (65,621) Net pension liability (127,493) Deferred inflows of resources–pensions 479,394
Total adjustments $ 6,998,264 $ 5,407,029
Net cash provided by operating activities $ 8,088,263 $ 7,807,008

CITY OF FLORENCE, ALABAMAGAS DEPARTMENT
STATEMENTS OF NET POSITIONJUNE 30, 2015 and 2014
ASSETS 2015Current assets:
Cash and cash equivalents $ 10,397,408 $ 12,167,777Accounts receivable (net) 675,580 760,894Accrued interest reveivable 788 739Inventories 1,340,842 1,131,583Prepaid expenses 1,901,542 41,056
Total current assets $ 14,316,160 $ 14,102,049
Noncurrent assets:Capital assets:
Utility plant in service (at cost) $ 56,049,850 $ 54,829,398Acquisition adjustment (net of amortization) 168,802 179,463Construction in progress 12,002 104,418
Less: accumulated depreciation 24,214,141 23,943,054
Total noncurrent assets $ 32,016,513 $ 31,170,225
Total assets $ 46,332,673 $ 45,272,274
DEFERRED OUTFLOWS OF RESOURCESPensions $ 264,827 $
2014
The accompanying notes and independent auditor's report are an integral part of these financial statements.Page 19
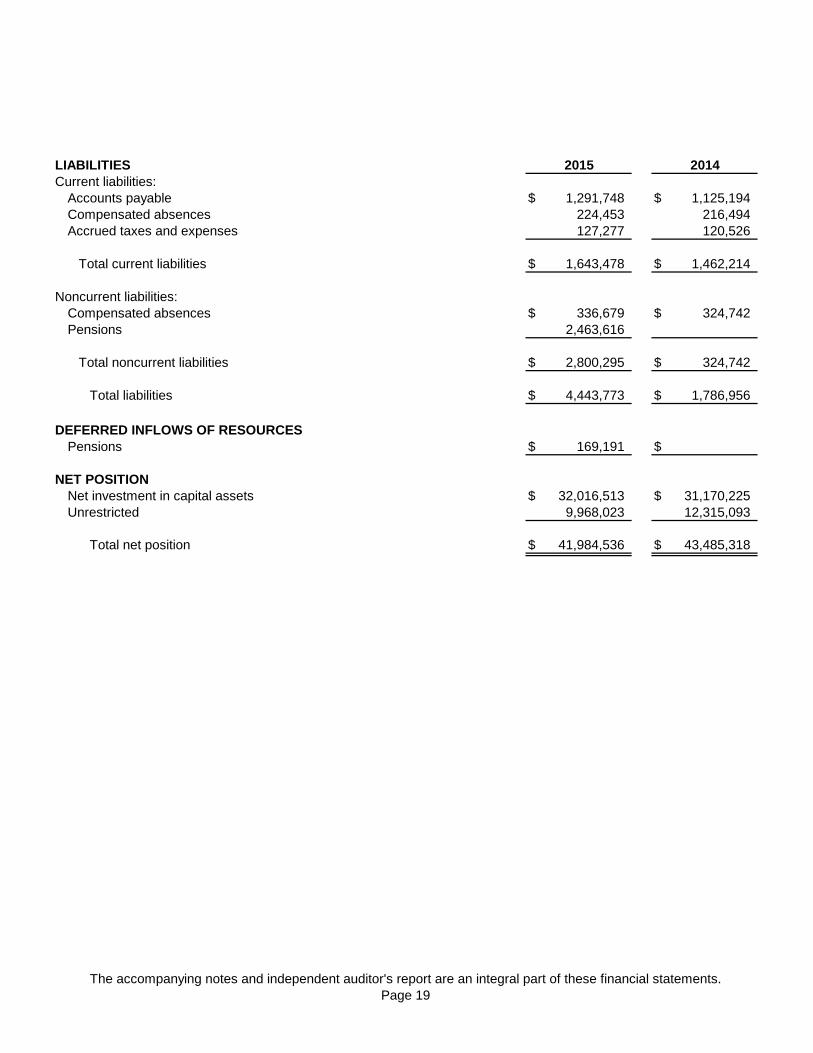
LIABILITIES 2014Current liabilities:
Accounts payable $ 1,291,748 $ 1,125,194Compensated absences 224,453 216,494Accrued taxes and expenses 127,277 120,526
Total current liabilities $ 1,643,478 $ 1,462,214
Noncurrent liabilities:Compensated absences $ 336,679 $ 324,742Pensions 2,463,616
Total noncurrent liabilities $ 2,800,295 $ 324,742
Total liabilities $ 4,443,773 $ 1,786,956
DEFERRED INFLOWS OF RESOURCESPensions $ 169,191 $
NET POSITIONNet investment in capital assets $ 32,016,513 $ 31,170,225Unrestricted 9,968,023 12,315,093
Total net position $ 41,984,536 $ 43,485,318
2015
The accompanying notes and independent auditor's report are an integral part of these financial statements.Page 20
CITY OF FLORENCE, ALABAMAGAS DEPARTMENT
STATEMENTS OF REVENUES, EXPENSES, AND CHANGES IN FUND NET POSITIONFOR THE YEARS ENDED JUNE 30, 2015 and 2014
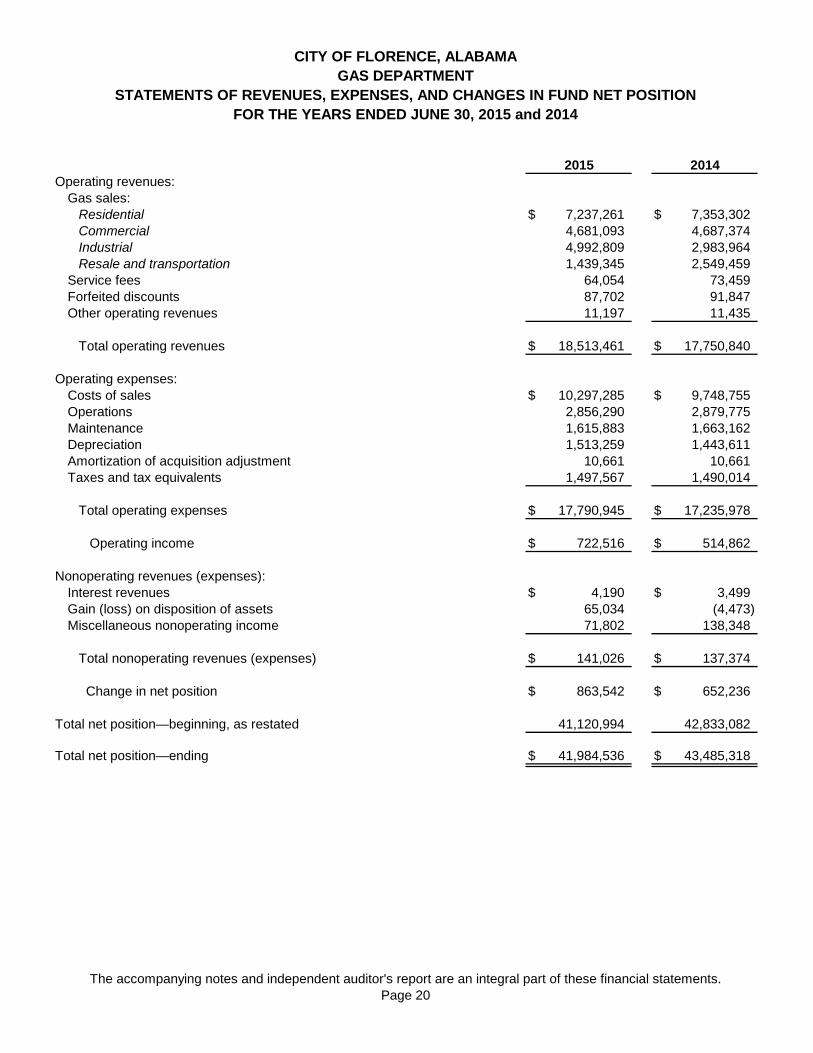
2015 2014Operating revenues:
Gas sales:Residential $ 7,237,261 $ 7,353,302Commercial 4,681,093 4,687,374Industrial 4,992,809 2,983,964Resale and transportation 1,439,345 2,549,459
Service fees 64,054 73,459Forfeited discounts 87,702 91,847Other operating revenues 11,197 11,435
Total operating revenues $ 18,513,461 $ 17,750,840
Operating expenses:Costs of sales $ 10,297,285 $ 9,748,755Operations 2,856,290 2,879,775Maintenance 1,615,883 1,663,162Depreciation 1,513,259 1,443,611Amortization of acquisition adjustment 10,661 10,661Taxes and tax equivalents 1,497,567 1,490,014
Total operating expenses $ 17,790,945 $ 17,235,978
Operating income $ 722,516 $ 514,862
Nonoperating revenues (expenses):Interest revenues $ 4,190 $ 3,499Gain (loss) on disposition of assets 65,034 (4,473)Miscellaneous nonoperating income 71,802 138,348
Total nonoperating revenues (expenses) $ 141,026 $ 137,374
Change in net position $ 863,542 $ 652,236
Total net position—beginning, as restated 41,120,994 42,833,082
Total net position—ending $ 41,984,536 $ 43,485,318

The accompanying notes and independent auditor's report are an integral part of these financial statements.Page 21
CITY OF FLORENCE, ALABAMAGAS DEPARTMENT
STATEMENTS OF CASH FLOWSFOR THE YEARS ENDED JUNE 30, 2015 and 2014
2015 2014Cash flows from operating activities:
Receipts from customers and users $ 18,671,980 $ 18,105,155Receipts from interfund services provided 142,234 130,913Payments to suppliers (13,163,200) (10,658,792)Payments to employees for services and
benefits—exclusive of capitalized costs (2,933,089) (2,997,208)Payments for interfund services used (2,187,261) (2,231,708)
Net cash provided by operating activities $ 530,664 $ 2,348,360
Cash flows from capital and related financing activities:Purchase and construction of capital assets (net) $ (2,343,743) $ (1,717,770)Proceeds from disposition of assets 66,800 Removal costs of retirements of capital assets (28,231) (19,624)
Net cash used for capital and related financing activities $ (2,305,174) $ (1,737,394)
Cash flows from investing activities:Interest on investments $ 4,141 $ 2,760
Net cash provided by investing activities $ 4,141 $ 2,760
Net increase (decrease) in cash and cash equivalents $ (1,770,369) $ 613,726
Balances—beginning of the year 12,167,777 11,554,051
Balances—end of the year $ 10,397,408 $ 12,167,777
Classified as:Current assets $ 10,397,408 $ 12,167,777

The accompanying notes and independent auditor's report are an integral part of these financial statements.Page 22
CITY OF FLORENCE, ALABAMAGAS DEPARTMENT
STATEMENTS OF CASH FLOWSFOR THE YEARS ENDED JUNE 30, 2015 and 2014
(Continued)
2015 2014Reconciliation of operating income to net cash provided (used) by operating activities:
Operating income $ 722,516 $ 514,862Adjustments to reconcile operating income to net cash provided (used) by operating activities:
Depreciation $ 1,513,259 $ 1,443,611Amortization of acquisition adjustment 10,661 10,661Miscellaneous nonoperating income 71,802 138,348
Changes in assets, deferred outflows of resources, liabilities, and deferred inflows of resources:
Receivables (net) 85,314 209,792Inventories (209,259) (163,550)Prepaid expenses (1,860,486) (21,287)Deferred outflows of resources–pensions 33,972Accounts and other payables 193,201 215,923Net pension liability (199,507)Deferred inflows of resources–pensions 169,191
Total adjustments $ (191,852) $ 1,833,498
Net cash provided by operating activities $ 530,664 $ 2,348,360
CITY OF FLORENCE, ALABAMAWATER AND WASTEWATER DEPARTMENT
STATEMENTS OF NET POSITIONJUNE 30, 2015 and 2014
ASSETS 2015 2014Current assets:
Cash and cash equivalents $ 8,697,198 $ 7,295,969Accounts receivable (net) 1,754,621 1,570,502Accrued interest receivable 112Inventories 613,165 598,634Prepaid expenses 269,746 227,772
Total current assets $ 11,334,842 $ 9,692,877
Noncurrent assets:Restricted cash and cash equivalents $ 8,389,052 $ 9,752,565Capital assets:
Utility plant in service (at cost) 167,971,612 157,132,064Construction in progress 4,634,093 10,758,933
Less: accumulated depreciation 55,566,661 53,187,065Prepaid debt related costs (net) 188,042 196,996
Total noncurrent assets $ 125,616,138 $ 124,653,493
Total assets $ 136,950,980 $ 134,346,370
DEFERRED OUTFLOWS OF RESOURCESDeferred amount on refunding $ 194,794 $ 232,893Pensions 441,262
Total deferred outflows of resources $ 636,056 $ 232,893
The accompanying notes and independent auditor's report are an integral part of these financial statements.Page 23
LIABILITIES 2015 2014Current liabilities:
Accounts payable $ 848,097 $ 1,162,496Retainage payable on construction contracts 124,419 295,983Compensated absences 294,585 284,999Accrued taxes and expenses 317,090 293,550
Total current liabilities $ 1,584,191 $ 2,037,028
Liabilities payable from restricted assets:Revenue warrants–payable within one year $ 4,105,000 $ 3,955,000Unamortized debt premium (discount) 2,121 2,121Accrued interest 711,601 751,587
Total liabilities payable from restricted assets $ 4,818,722 $ 4,708,708
Noncurrent liabilities:Revenue warrants–payable after one year $ 55,095,000 $ 54,423,125Unamortized debt premium (discount) 42,428 44,550Compensated absences 441,876 427,497Pensions 2,059,403
Total noncurrent liabilities $ 57,638,707 $ 54,895,172
Total liabilities $ 64,041,620 $ 61,640,908
DEFERRED INFLOWS OF RESOURCESPensions $ 168,073 $
NET POSITIONNet investment in capital assets $ 57,989,289 $ 61,892,552Restricted for debt service 7,677,451 3,620,455Unrestricted 7,710,603 7,425,348
Total net position $ 73,377,343 $ 72,938,355

The accompanying notes and independent auditor's report are an integral part of these financial statements.Page 24
CITY OF FLORENCE, ALABAMAWATER AND WASTEWATER DEPARTMENT
STATEMENTS OF REVENUES, EXPENSES, AND CHANGES IN FUND NET POSITIONFOR THE YEARS ENDED JUNE 30, 2015 and 2014
2015 2014Operating revenues:
Water sales:Residential $ 6,494,500 $ 6,040,488Commercial 3,336,827 3,318,484Resale 1,608,353 1,460,919
Sewer service sales:Residential 3,999,834 3,719,846Commercial 3,398,803 3,586,655
Forfeited discounts 155,048 148,033Other operating revenues 133,055 144,372
Total operating revenues $ 19,126,420 $ 18,418,797
Operating expenses:Water treatment and pumping $ 2,896,453 $ 2,875,811Sewage disposal 2,017,003 2,270,622Transmission and distribution 1,597,297 1,387,053Accounting and collections 930,891 980,305Administrative and general 1,789,913 1,824,139Depreciation 3,458,344 3,335,619Taxes and tax equivalents 1,638,279 1,609,253
Total operating expenses $ 14,328,180 $ 14,282,802
Operating income $ 4,798,240 $ 4,135,995
Nonoperating revenues (expenses):Interest revenues $ 3,965 $ 8,410Gain (loss) on disposition of assets (521,016) (353)Interest expense (1,913,938) (2,019,911)Debt issuance costs expense (10,000)Amortization of debt related costs (44,930) (44,930)
Total nonoperating revenues (expenses) $ (2,475,919) $ (2,066,784)
Change in net position $ 2,322,321 $ 2,069,211
Total net position—beginning, as restated 71,055,022 70,869,144
Total net position—ending $ 73,377,343 $ 72,938,355

The accompanying notes and independent auditor's report are an integral part of these financial statements.Page 25
CITY OF FLORENCE, ALABAMAWATER AND WASTEWATER DEPARTMENT
STATEMENTS OF CASH FLOWSFOR THE YEARS ENDED JUNE 30, 2015 and 2014
2015 2014Cash flows from operating activities:
Receipts from customers and users $ 18,561,446 $ 18,349,951Receipts from interfund services provided 158,634 201,615Payments to suppliers (4,070,705) (2,904,172)Payments to employees for services and
benefits—exclusive of capitalized costs (4,455,950) (4,412,354)Payments for interfund services used (2,615,283) (2,705,611)
Net cash provided by operating activities $ 7,578,142 $ 8,529,429
Cash flows from capital and related financing activities:Purchase and construction of capital assets (net) $ (6,442,514) $ (11,754,004)Proceeds from disposition of assets 30,283Net proceeds from capital debt 4,776,875 1,048,125Principal paid on capital debt (3,955,000) (3,810,000)Interest paid on capital debt (1,953,924) (2,058,418)Payment of debt issuance costs (10,000)
Net cash used for capital and related financing activities $ (7,544,280) $ (16,584,297)
Cash flows from investing activities:Interest on investments $ 3,854 $ 8,410
Net cash provided by investing activities $ 3,854 $ 8,410
Net increase (decrease) in cash and cash equivalents $ 37,716 $ (8,046,458)
Balances—beginning of the year 17,048,534 25,094,992
Balances—end of the year $ 17,086,250 $ 17,048,534
Classified as:Current assets $ 8,697,198 $ 7,295,969Restricted assets 8,389,052 9,752,565
Totals $ 17,086,250 $ 17,048,534

The accompanying notes and independent auditor's report are an integral part of these financial statements.Page 26
CITY OF FLORENCE, ALABAMAWATER AND WASTEWATER DEPARTMENT
STATEMENTS OF CASH FLOWSFOR THE YEARS ENDED JUNE 30, 2015 and 2014
(Continued)
2015 2014Reconciliation of operating income to net cash provided (used) by operating activities:
Operating income $ 4,798,240 $ 4,135,995Adjustments to reconcile operating income to net cash provided (used) by operating activities:
Depreciation $ 3,556,103 $ 3,364,080Change in assets and liabilities:
Receivables (net) (184,119) 327,951Inventories (14,531) (1,354)Prepaid expenses (41,974) (14,390)Deferred outflows of resources–pensions (83,567)Accounts and other payables (438,458) 717,147Net pension liability (181,625)Deferred inflows of resources–pensions 168,073
Total adjustments $ 2,779,902 $ 4,393,434
Net cash provided by operating activities $ 7,578,142 $ 8,529,429

CITY OF FLORENCE, ALABAMA ELECTRICITY, GAS, AND WATER AND WASTEWATER DEPARTMENTS
NOTES TO FINANCIAL STATEMENTS JUNE 30, 2015 and 2014
(Continued)
Page 27
NOTE 1—SUMMARY OF SIGNIFICANT ACCOUNTING POLICIES The Florence Utilities (the “Utilities”) are comprised of the Electricity, Gas, and Water and Wastewater Departments of the City of Florence, Alabama. The Utilities provide electricity, natural gas, water and wastewater services to the City of Florence (the “City”) and various areas of Lauderdale County. The financial statements of the Utilities have been prepared in accordance with accounting principles generally accepted in the United States of America (GAAP) as applied to governmental units. The Governmental Accounting Standards Board (GASB) is the accepted standard setting body for establishing governmental accounting and financial reporting principles. Basis of Accounting and Financial Statement Presentation: These three (3) enterprise funds are included as blended component units in the financial statements of the City of Florence, Alabama. The Department managers supervise the daily operations of providing services to citizens and are accountable to the Mayor and City Council. Financial statements are presented for each department. The footnotes are presented separately for each department, where applicable, and jointly for areas where common descriptions exist. The City and all related departments have adopted the provisions of GASB Statement No. 34, “Basic Financial Statements—and Management’s Discussion and Analysis—for State and Local Governments”. Statement No. 34 established standards for external financial reporting for all state and local governmental entities, which includes a statement of net position or balance sheet, a statement of revenues, expenses, and changes in fund net position, and a statement of cash flows. It requires the classification of net position into three components—net investment in capital assets; restricted; and unrestricted. These classifications are defined as follows:
♦ Net investment in capital assets—This component of net position consists of capital assets, including restricted capital assets, net of accumulated depreciation and reduced by the outstanding balances of any bonds, mortgages, notes, or other borrowings that are attributable to the acquisition, construction, or improvements of those assets. If there are significant unspent related debt proceeds at year-end, the portion of the debt attributable to the unspent proceeds are not included in the calculation of net investment in capital assets. Rather, that portion of the debt is included in the same net position component as the unspent proceeds.
♦ Restricted net position—This component of net position consists of constraints placed on
net position use through external constraints imposed by creditors (such as through debt covenants), grantors, contributors, or law or regulations of other governments or constraints imposed by law through constitutional provisions or enabling legislation.
♦ Unrestricted net position—This component of net position consist of net position that
does not meet the definition of “restricted” or “net investment in capital assets.” In addition, the Statement requires the reporting of capital contributions as a change in net position, the presentation of the Statement of Cash Flows using the direct method, and the inclusion of Management’s Discussion and Analysis (MD&A) that provides an analysis of the Utilities’ overall financial position and results of operations.

CITY OF FLORENCE, ALABAMA ELECTRICITY, GAS, AND WATER AND WASTEWATER DEPARTMENTS
NOTES TO FINANCIAL STATEMENTS JUNE 30, 2015 and 2014
(Continued)
Page 28
NOTE 1—SUMMARY OF SIGNIFICANT ACCOUNTING POLICIES (Continued) The financial statements of the Utilities are prepared primarily on the accrual basis of accounting, whereby revenues are recognized when earned and expenses are recognized when incurred, with the exception of the accounting for unbilled revenues. The Utilities do not accrue any unbilled revenue from the dates of the most recent meter readings to the statement of net position date. However, revenues are recorded through the complete billing cycle that could include revenues subsequent to the year-end. This policy has been consistently followed and is an accepted accounting treatment followed by public utility systems. Accounts Receivable—Trade: The Electricity department acts as billing and collection agent for other City departments and other county utilities. Inventories: Inventories are presented at the lower of average cost or market on a first-in, first-out basis and are expensed when used. Inventories consist primarily of materials and supplies held for consumption or construction projects. Debt Premiums, Discounts, and Issuance Costs: Debt premiums and discounts are deferred and amortized over the term of the related debt using the straight-line method. Bonds and warrants payable are reported net of the applicable premium or discount. Debt issuance costs are expensed when incurred. Deferred Inflows/Outflows from Current Refunding or Advance Refunding of Debt: The difference between the reacquisition price and the net carrying amount of the old debt is reported as a deferred outflow of resources or a deferred inflow of resources and recognized as a component of interest expense in a systematic and rational manner over the remaining life of the old debt or the life of the new debt, whichever is shorter. Prepaid Expenses: Payments made to vendors that reflect costs applicable to future accounting periods are recorded as prepaid items using the consumption method by recording a current asset for the prepaid amounts and reflecting the expenses in the year in which they are consumed. Cash and Cash Equivalents: For purposes of the statement of cash flows, the Utilities consider all currency, demand deposits, certificates of deposit, and money market accounts with financial institutions and short-term U. S. Government securities to be cash equivalents. Revenues and Expenses: Operating revenues and expenses consist of those revenues and expenses that result from the ongoing principal operations of the Utilities. Operating revenues consist primarily of charges for services. Nonoperating revenues and expenses consist of those revenues and expenses that are related to financing and investing types of activities and result from nonexchange transactions or ancillary activities. Pensions: For purposes of measuring the net pension liability, deferred outflows of resources and deferred inflows of resources related to pensions, and pension expense, information about the fiduciary net position of the City of Florence, Alabama Employees’ Retirement Plan (“CFAERP”) and additions to/deductions from CFAERP’s fiduciary net position have been determined on the same basis as they are reported by CFAERP. For this purpose, benefit payments (including refunds of employee contributions) are recognized when due and payable in accordance with the benefit terms. Investments are reported at fair value.

CITY OF FLORENCE, ALABAMA ELECTRICITY, GAS, AND WATER AND WASTEWATER DEPARTMENTS
NOTES TO FINANCIAL STATEMENTS JUNE 30, 2015 and 2014
(Continued)
Page 29
NOTE 1—SUMMARY OF SIGNIFICANT ACCOUNTING POLICIES (Continued) Net Position: Net position represents the difference between assets, deferred outflows of resources, liabilities, and deferred inflows of resources. Net position reported as net investment in capital assets consists of capital assets, net of accumulated depreciation, reduced by the outstanding balance of any borrowing used for the acquisition, construction, or improvement of those assets. Net position is reported as restricted when there are limitations imposed on their use either through constitutional provisions or enabling legislation adopted or through external restriction imposed by creditors, grantors, or laws or regulations of other governments. When both restricted and unrestricted resources are available for use, it is the Utilities' policy to use restricted resources first, then unrestricted resources as they are needed. The Utilities have restricted net position relative to those resources necessary to comply with various covenants of bond financing agreements. Compensated Absences: The Utilities accrue its liability for earned but unpaid compensated absences costs. The City’s annual leave policy provides for a minimum of five (5) days and a maximum of twenty-one (21) days (Electricity department employees-maximum of twenty-six (26) days) of annual leave to all regular full-time employees, depending on years of service and date of hire and has been accrued as a liability at the current rate of pay. The sick leave policy provides that all regular full-time employees earn sick leave at the rate of one and one-quarter (1.25) days per month of employment. Sick leave accumulates automatically without limit. After fifteen (15) years of continuous service, accumulated sick leave is accrued as a liability at a rate of one (1) day out of every five (5) days at the current rate of pay. Upon separation of employment for employees with fifteen (15) or more years of service, the City deposits the employee’s sick leave accrual into a Post-Employment Health Plan (PEHP) account. This monetary benefit is non-taxable to the employee; however, its use is restricted to fund future health insurance premiums. In addition to the sick leave, the Utilities currently contribute $25 per month per employee into a separate PEHP account. The use of these funds is restricted to allowable medical expenses and can only be accessed after termination of employment. Reclassifications: Certain amounts presented in the prior year data have been reclassified in order to be consistent with the current year’s presentation. Estimates: The preparation of financial statements in conformity with U.S. generally accepted accounting principles requires management to make estimates and assumptions that affect the reported amounts of assets and liabilities and disclosure of contingent assets and liabilities at the date of the financial statements and the reported amounts of revenues and expenses during the reporting period. Actual results could differ from those estimates. NOTE 2—UTILITY PLANT Electricity Department Utility plant is stated at historical cost. Major renewals and betterments, including internal labor cost, are recorded to utility plant, while general routine maintenance and replacements that do not extend the useful life or improve the assets are charged to operations in the period incurred. Depreciation is computed using the straight-line method over the estimated useful lives of the assets, which is from 5 to 50 years. Depreciation for the fiscal year 2015 totaled $5,310,986 of which $4,929,365 was charged against income. Amounts applicable to certain transportation equipment, which was allocated to various accounts on the basis of vehicle usage, totaled $381,621 for the year ended June 30, 2015. Depreciation for the fiscal year 2014 totaled $5,126,341 of which $4,775,924 was charged against income. Amounts applicable to certain transportation equipment, which was allocated to various accounts on the basis of vehicle usage, totaled $350,417 for the year ended June 30, 2014.

CITY OF FLORENCE, ALABAMA ELECTRICITY, GAS, AND WATER AND WASTEWATER DEPARTMENTS
NOTES TO FINANCIAL STATEMENTS JUNE 30, 2015 and 2014
(Continued)
Page 30
NOTE 2—UTILITY PLANT (Continued) As of June 30, 2015 and 2014, nondepreciable capital assets consist of land, land rights, and right-of-ways in the amount of $1,155,380 and $1,146,566, respectively. A summary of utility plant in service is presented below:
Balance Additions Retirements BalanceBeginning and and Endof Year Reclassifications Reclassifications of Year
Transmission plant 31,693,972$ 3,366,965$ 894,360$ 34,166,577$ Distribution plant 106,811,680 3,569,535 854,027 109,527,188 General plant 17,847,727 1,504,300 917,871 18,434,156
Totals 156,353,379$ 8,440,800$ 2,666,258$ 162,127,921$
During the 2011 fiscal year, the Department recorded a capital contribution of $1,388,735 as a reduction in capitalized utility plant in accordance with regulatory standards. For financial reporting, the capital contribution was reported as an increase in net position in accordance with GASB standards. The Department is depreciating the capital contribution using the straight-line method over the estimated useful lives of the assets, which is from 25 to 44 years. Current and prior year depreciation amounted to $39,655. As of June 30, 2015 and 2014, accumulated depreciation amounted to $158,620 and $118,965, respectively. Gas Department Utility plant is stated at historical cost. Major renewals and betterments, including internal labor cost, are recorded to utility plant, while general routine maintenance and replacements that do not extend the useful life or improve the assets are charged to operations in the period incurred. Depreciation is computed using the straight-line method over the estimated useful lives of the assets, which is from 5 to 50 years. Depreciation expense amounted to $1,513,259 for 2015 and $1,443,611 for 2014. As of June 30, 2015 and 2014, nondepreciable capital assets consist of land, land rights, and right-of-ways in the amount of $320,825 and $320,747, respectively. A summary of utility plant in service is presented below:
Balance Additions Retirements BalanceBeginning and and Endof Year Reclassifications Reclassifications of Year
Transmission plant 9,959,247$ 194,203$ -$ 10,153,450$ Distribution plant 37,327,957 1,866,985 593,212 38,601,730 General plant 7,542,194 374,970 622,494 7,294,670
Totals 54,829,398$ 2,436,158$ 1,215,706$ 56,049,850$
CITY OF FLORENCE, ALABAMA ELECTRICITY, GAS, AND WATER AND WASTEWATER DEPARTMENTS
NOTES TO FINANCIAL STATEMENTS JUNE 30, 2015 and 2014
(Continued)
Page 31
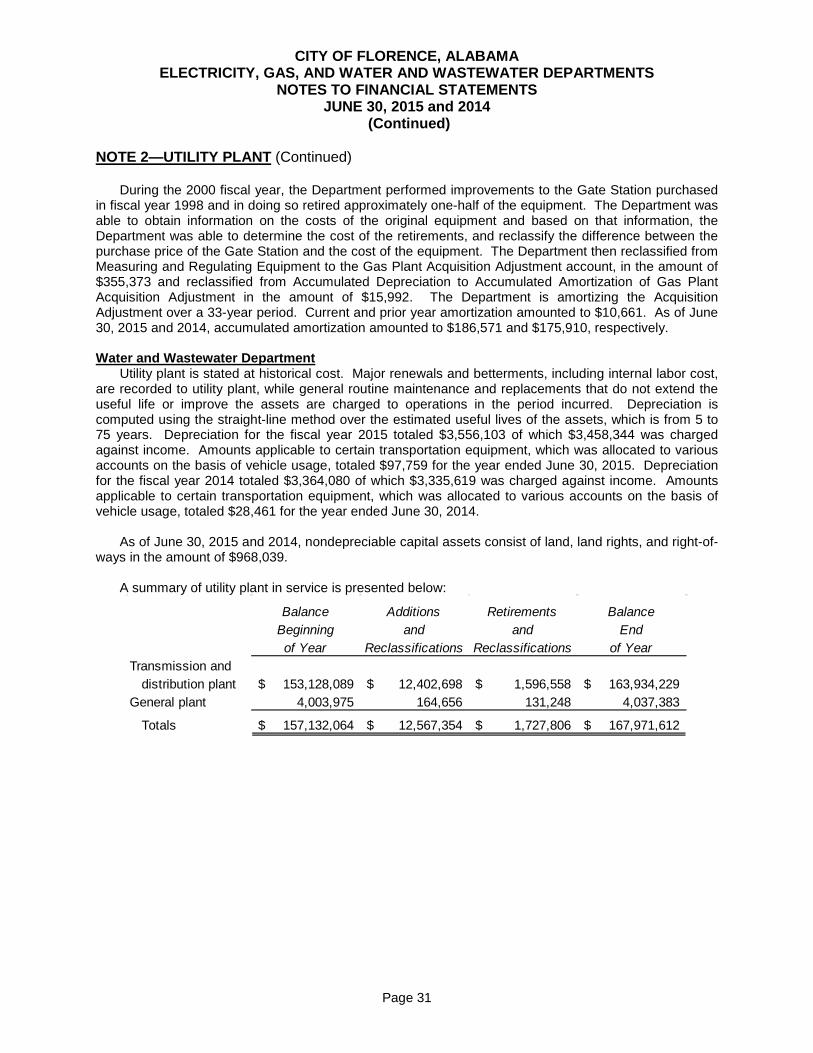
NOTE 2—UTILITY PLANT (Continued) During the 2000 fiscal year, the Department performed improvements to the Gate Station purchased in fiscal year 1998 and in doing so retired approximately one-half of the equipment. The Department was able to obtain information on the costs of the original equipment and based on that information, the Department was able to determine the cost of the retirements, and reclassify the difference between the purchase price of the Gate Station and the cost of the equipment. The Department then reclassified from Measuring and Regulating Equipment to the Gas Plant Acquisition Adjustment account, in the amount of $355,373 and reclassified from Accumulated Depreciation to Accumulated Amortization of Gas Plant Acquisition Adjustment in the amount of $15,992. The Department is amortizing the Acquisition Adjustment over a 33-year period. Current and prior year amortization amounted to $10,661. As of June 30, 2015 and 2014, accumulated amortization amounted to $186,571 and $175,910, respectively. Water and Wastewater Department Utility plant is stated at historical cost. Major renewals and betterments, including internal labor cost, are recorded to utility plant, while general routine maintenance and replacements that do not extend the useful life or improve the assets are charged to operations in the period incurred. Depreciation is computed using the straight-line method over the estimated useful lives of the assets, which is from 5 to 75 years. Depreciation for the fiscal year 2015 totaled $3,556,103 of which $3,458,344 was charged against income. Amounts applicable to certain transportation equipment, which was allocated to various accounts on the basis of vehicle usage, totaled $97,759 for the year ended June 30, 2015. Depreciation for the fiscal year 2014 totaled $3,364,080 of which $3,335,619 was charged against income. Amounts applicable to certain transportation equipment, which was allocated to various accounts on the basis of vehicle usage, totaled $28,461 for the year ended June 30, 2014. As of June 30, 2015 and 2014, nondepreciable capital assets consist of land, land rights, and right-of-ways in the amount of $968,039. A summary of utility plant in service is presented below:
Balance Additions Retirements BalanceBeginning and and Endof Year Reclassifications Reclassifications of Year
Transmission anddistribution plant 153,128,089$ 12,402,698$ 1,596,558$ 163,934,229$
General plant 4,003,975 164,656 131,248 4,037,383
Totals 157,132,064$ 12,567,354$ 1,727,806$ 167,971,612$
CITY OF FLORENCE, ALABAMA ELECTRICITY, GAS, AND WATER AND WASTEWATER DEPARTMENTS
NOTES TO FINANCIAL STATEMENTS JUNE 30, 2015 and 2014
(Continued)
Page 32
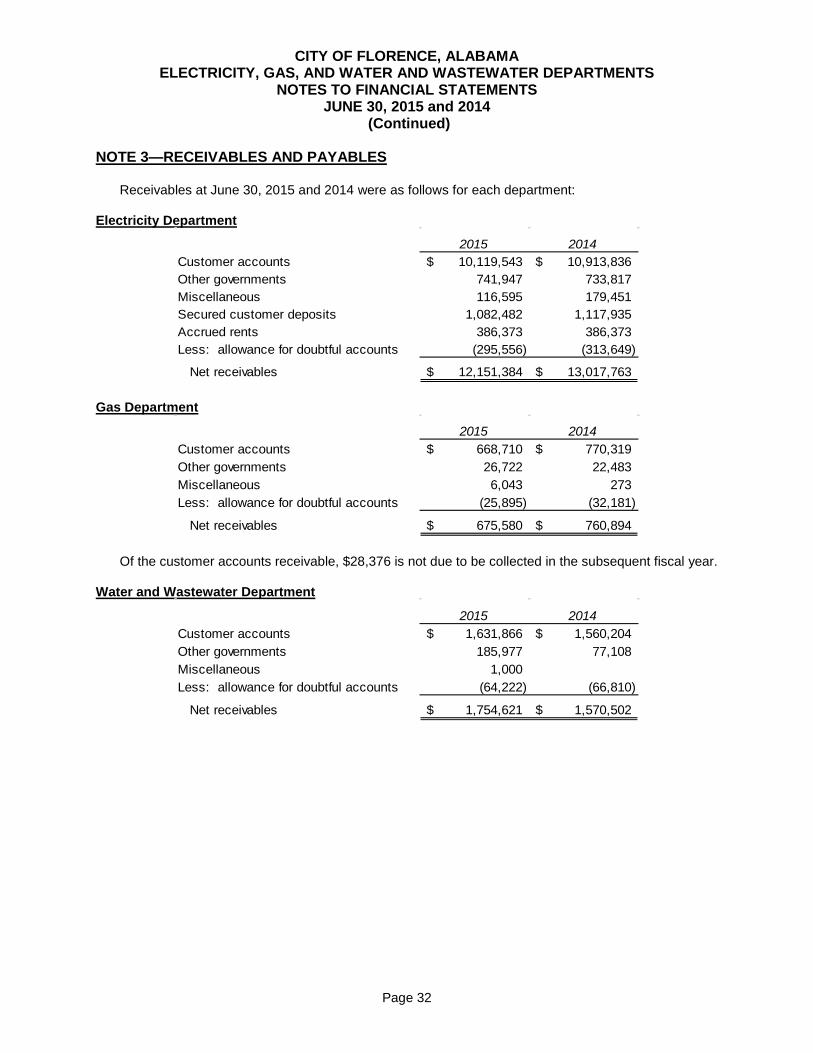
NOTE 3—RECEIVABLES AND PAYABLES Receivables at June 30, 2015 and 2014 were as follows for each department: Electricity Department
2015 2014Customer accounts 10,119,543$ 10,913,836$ Other governments 741,947 733,817 Miscellaneous 116,595 179,451 Secured customer deposits 1,082,482 1,117,935 Accrued rents 386,373 386,373 Less: allowance for doubtful accounts (295,556) (313,649)
Net receivables 12,151,384$ 13,017,763$
Gas Department
2015 2014Customer accounts 668,710$ 770,319$ Other governments 26,722 22,483 Miscellaneous 6,043 273 Less: allowance for doubtful accounts (25,895) (32,181)
Net receivables 675,580$ 760,894$
Of the customer accounts receivable, $28,376 is not due to be collected in the subsequent fiscal year. Water and Wastewater Department
2015 2014Customer accounts 1,631,866$ 1,560,204$ Other governments 185,977 77,108 Miscellaneous 1,000 Less: allowance for doubtful accounts (64,222) (66,810)
Net receivables 1,754,621$ 1,570,502$

CITY OF FLORENCE, ALABAMA ELECTRICITY, GAS, AND WATER AND WASTEWATER DEPARTMENTS
NOTES TO FINANCIAL STATEMENTS JUNE 30, 2015 and 2014
(Continued)
Page 33
NOTE 3—RECEIVABLES AND PAYABLES (Continued) Payables at June 30, 2015 and 2014 were as follows for each department: Electricity Department
2015 2014Vendors 18,034,120$ 17,863,466$ Salaries and benefits 547,502 490,252 Other governments 14,811 14,770
Totals 18,596,433$ 18,368,488$
Gas Department
2015 2014Vendors 694,003$ 687,815$ Salaries and benefits 127,277 120,526 Other governments 597,745 437,379
Totals 1,419,025$ 1,245,720$
Water and Wastewater Department
2015 2014Vendors 553,395$ 1,186,208$ Salaries and benefits 196,127 178,703 Other governments 540,084 387,118
Totals 1,289,606$ 1,752,029$
NOTE 4—STORAGE GAS Gas Department The Department has purchased a volume of gas storage capacity from certain gas suppliers. This gas is purchased in off demand periods during the year and is sold during peak demand periods. Payment for the gas is made when allotted to the storage facility by the supplier. The Department expenses the gas as it is sold and used by customers. At June 30, 2015 and 2014, the Department had $1,002,753 and $774,200, respectively, in storage gas that is valued using the weighted average method.

CITY OF FLORENCE, ALABAMA ELECTRICITY, GAS, AND WATER AND WASTEWATER DEPARTMENTS
NOTES TO FINANCIAL STATEMENTS JUNE 30, 2015 and 2014
(Continued)
Page 34
NOTE 5—RESTRICTED ASSETS Revenue warrants issued by the Utilities require that certain amounts from debt proceeds and debt service outlays be deposited into restricted funds, which are expended for their specified purposes. These funds are invested in government securities that are carried at fair value. Electricity Department Special funds created for capital construction and debt service by the Series 2009 and Series 2013 Warrant Indentures are invested in short-term U.S. Government obligations, as follows:
2015 2014Series 2009 Debt Service Reserve Fund 725,000$ 725,000$ Series 2009 Warrant Funds 75,594 75,488 Series 2013 Debt Service Reserve Fund 192,869 192,869 Series 2013 Warrant Funds 15,455 15,437 Series 2013 Construction Fund 3,469,304
Total restricted cash and cash equivalents 1,008,918$ 4,478,098$
Water and Wastewater Department Special funds created for capital construction and debt service by the Series 2011 and SRF Warrant Indentures are invested in short-term U.S. Government obligations, as follows:
2015 2014SRF Series 2006 Warrant Funds 116,069$ 116,174$ SRF Series 2007 Warrant Funds 456,276 447,921 SRF Series 2010-A Warrant Funds 736,586 716,862 SRF Series 2010-B Warrant Funds 1,244,149 1,215,910 SRF Series 2010-C Warrant Funds 1,203,895 1,175,227 SRF Series 2010-D Warrant Funds 301,108 295,100 Series 2011 Warrant Funds 404,848 404,848 Series 2011 Construction Fund 3,926,121 5,380,523
Total restricted cash and cash equivalents 8,389,052$ 9,752,565$

CITY OF FLORENCE, ALABAMA ELECTRICITY, GAS, AND WATER AND WASTEWATER DEPARTMENTS
NOTES TO FINANCIAL STATEMENTS JUNE 30, 2015 and 2014
(Continued)
Page 35
NOTE 6—TVA POWER AND CONSERVATION PROGRAMS Electricity Department
Conservation Program The Department has entered into a contract with TVA to establish a joint home energy conservation program that provides eligible customers with arranged financing for home energy conservation improvements. As a part of this contract, the Department is a fiscal intermediary for the conservation loans provided by the program. The Department had at June 30, 2015 and 2014, a total of $6,205,723 and $6,765,544, respectively, of energy conservation loans due from customers participating in the program. These loans are to be repaid in monthly installments by the customer over a 10-year period at an interest rate established by TVA. Under the terms of the contract, as amended, the Department has received advances on these conservation loans in the amount of $6,380,922 and $6,955,761 as of June 30, 2015 and 2014, respectively.
Power Program The Department participates in the TVA Power Invoice Prepayment Program. This program allows the Department to transfer funds electronically, which are nonrefundable, on a weekly basis to be applied to the monthly TVA power invoice. An early payment credit is computed on a daily basis at a rate established monthly by TVA and is added to the prepayment account. This rate has been slightly higher than the interest rate currently earned on temporary cash investments with local banks. The prepayment balances of $7,042,017 and $7,450,425 as of June 30, 2015 and 2014, respectively, are reflected as prepayments in the financial statements. NOTE 7—LONG-TERM OBLIGATIONS Electricity Department Long-term obligations activity for the year ended June 30, 2015 was as follows:
ElectricRevenue Electric
Refunding RevenueWarrants, Warrants,
Series 2009 Series 2013 TotalsBalance—beginning of year 4,095,000$ 6,350,000$ 10,445,000$ Less: principal paid on debt 765,000 765,000
Balance—end of year 3,330,000$ 6,350,000$ 9,680,000$

CITY OF FLORENCE, ALABAMA ELECTRICITY, GAS, AND WATER AND WASTEWATER DEPARTMENTS
NOTES TO FINANCIAL STATEMENTS JUNE 30, 2015 and 2014
(Continued)
Page 36
NOTE 7—LONG-TERM OBLIGATIONS (Continued) The Department issued Electric Revenue Refunding Warrants, Series 2009, dated June 1, 2009, in the amount of $7,250,000 with interest rates ranging from 1.50% to 3.65% for the current refunding of the Electric Revenue Warrants, Series 1999. The net revenues of the system are irrevocably pledged for payment of the principal and interest of the warrants. Principal is payable annually on June 1. Interest is payable semi-annually on each June 1 and December 1. The Department issued Electric Revenue Warrants, Series 2013, dated March 1, 2013, in the amount of $6,350,000 with interest rates ranging from 1.75% to 4.00% for the purpose of purchasing and constructing capital improvements to the system. The net revenues of the system are irrevocably pledged for payment of the principal and interest of the warrants. Principal is payable annually beginning on June 1, 2020. Interest is payable semi-annually on each June 1 and December 1. Debt service over the remaining term of the warrants is summarized as follows:
PrincipalMaturities and
Fiscal ScheduledYear Mandatory Total
Ending Redemption Interest DebtJune 30 Payments Payable Service
2016 790,000$ 302,275$ 1,092,275$ 2017 815,000 276,205 1,091,205 2018 850,000 247,680 1,097,680 2019 875,000 217,080 1,092,080 2020 385,000 185,143 570,143
2021–2025 2,050,000 806,675 2,856,675 2026–2030 2,330,000 528,000 2,858,000 2031–2033 1,585,000 128,600 1,713,600
Totals 9,680,000$ 2,691,658$ 12,371,658$
Less: portion due within one year 790,000
Long-term debt at June 30, 2015 8,890,000$
All interest costs were expensed for the fiscal years presented.

CITY OF FLORENCE, ALABAMA ELECTRICITY, GAS, AND WATER AND WASTEWATER DEPARTMENTS
NOTES TO FINANCIAL STATEMENTS JUNE 30, 2015 and 2014
(Continued)
Page 37
NOTE 7—LONG-TERM OBLIGATIONS (Continued) Water and Wastewater Department Long-term obligations activity for the year ended June 30, 2015 was as follows:
Water Water Waterand Sewer and Sewer and SewerRevenue Revenue Revenue
Warrants, SRF Warrants, SRF Warrants, SRFSeries 2006 Series 2007 Series 2010-A
Balance—beginning of year 2,910,000$ 7,160,000$ 5,650,000$ Add: proceeds from debtLess: principal paid on debt 185,000 370,000 715,000
Balance—end of year 2,725,000$ 6,790,000$ 4,935,000$
Water Water Waterand Sewer and Sewer and SewerRevenue Revenue Revenue
Warrants, SRF Warrants, SRF Warrants, SRFSeries 2010-B Series 2010-C Series 2010-D
Balance—beginning of year 9,540,000$ 9,165,000$ 2,305,000$ Add: proceeds from debtLess: principal paid on debt 1,215,000 1,175,000 295,000
Balance—end of year 8,325,000$ 7,990,000$ 2,010,000$
Water Waterand Sewer and SewerRevenue RevenueWarrants, Warrants, SRF
Series 2011 Series 2013 TotalsBalance—beginning of year 20,600,000$ 1,048,125$ 58,378,125$ Add: proceeds from debt 4,776,875 4,776,875 Less: principal paid on debt 3,955,000
Balance—end of year 20,600,000$ 5,825,000$ 59,200,000$
The Department issued Water and Sewer Revenue Warrants, SRF Series 2006, dated January 15, 2006 in the amount of $4,030,000 bearing an interest rate of 3.25%. The warrants were issued for constructing wastewater treatment and related facilities in connection with the sanitary sewer system. The warrants were issued under the State of Alabama Revolving Fund (SRF) and are administered jointly by the Alabama Water Pollution Control Authority (AWPCA) and the Alabama Department of Environmental Management (ADEM). The revenues of the system are pledged for payment of the principal and interest of these warrants. Principal is payable annually on February 15. Interest is payable semi-annually on each February 15 and August 15.

CITY OF FLORENCE, ALABAMA ELECTRICITY, GAS, AND WATER AND WASTEWATER DEPARTMENTS
NOTES TO FINANCIAL STATEMENTS JUNE 30, 2015 and 2014
(Continued)
Page 38
NOTE 7—LONG-TERM OBLIGATIONS (Continued) The Department issued Water and Sewer Revenue Warrants, SRF Series 2007, dated September 15, 2007 in the amount of $8,825,000 bearing an interest rate of 3.50%. The warrants were issued for making certain improvements to the sanitary sewer system. The warrants were issued under the SRF and are administered jointly by the AWPCA and ADEM. The net revenues of the system are pledged for payment of the principal and interest of the warrants. Principal is payable annually on August 15. Interest is payable semi-annually on each February 15 and August 15. The Department issued Water and Sewer Revenue Warrants, Series 2010-A-CWSRF-BL, dated July 13, 2010, in the amount of $8,260,000 bearing an interest rate of 2.61% for the current refunding of the Water and Sewer Revenue Warrants, SRF Series 2000. The warrants were issued under the SRF and are administered jointly by the AWPCA and ADEM. The net revenues of the system are pledged for payment of the principal and interest of these warrants. Principal is payable annually on August 15. Interest is payable semi-annually on each February 15 and August 15. The Department issued Water and Sewer Revenue Warrants, Series 2010-B-CWSRF-BL, dated August 13, 2010, in the amount of $12,920,000 bearing an interest rate of 2.57% for the current refunding of the Water and Sewer Revenue Warrants, SRF Series 1998. The warrants were issued under the SRF and are administered jointly by the AWPCA and ADEM. The net revenues of the system are pledged for payment of the principal and interest of these warrants. Principal is payable annually on August 15. Interest is payable semi-annually on each February 15 and August 15. The Department issued Water and Sewer Revenue Warrants, Series 2010-C-CWSRF-BL, dated August 13, 2010, in the amount of $12,460,000 bearing an interest rate of 2.57% for the current refunding of the Water and Sewer Revenue Warrants, SRF Series 1999. The warrants were issued under the SRF and are administered jointly by the AWPCA and ADEM. The net revenues of the system are pledged for payment of the principal and interest of these warrants. Principal is payable annually on August 15. Interest is payable semi-annually on each February 15 and August 15. The Department issued Water and Sewer Revenue Warrants, Series 2010-D-CWSRF-BL, dated August 13, 2010, in the amount of $3,125,000 bearing an interest rate of 2.57% for the current refunding of the Water and Sewer Revenue Warrants, SRF Series 1999B. The warrants were issued under the SRF and are administered jointly by the AWPCA and ADEM. The net revenues of the system are pledged for payment of the principal and interest of these warrants. Principal is payable annually on August 15. Interest is payable semi-annually on each February 15 and August 15. The Department issued Water and Sewer Revenue Warrants, Series 2011, dated June 1, 2011, in the amount of $20,600,000 with interest rates ranging from 3.25% to 5.00%. The warrants were issued for capital improvements to upgrade the water treatment plants and the replacement of the Cypress Creek electrical system. The net revenues of the system are pledged for payment of the principal and interest of these warrants. Principal is payable annually beginning on August 15, 2021. Interest is payable semi-annually on each February 15 and August 15.

CITY OF FLORENCE, ALABAMA ELECTRICITY, GAS, AND WATER AND WASTEWATER DEPARTMENTS
NOTES TO FINANCIAL STATEMENTS JUNE 30, 2015 and 2014
(Continued)
Page 39
NOTE 7—LONG-TERM OBLIGATIONS (Continued) The Department issued Water and Sewer Revenue Warrants, Series 2013-DWSRF-DL, dated October 15, 2013, in the amount of $5,825,000 with interest rates ranging from 1.70% to 2.45%. The warrants were issued for capital improvements to upgrade the water treatment plants, the acquisition of and installation of automatic meter reading equipment, and capital improvements to the Wilson Lake intake equipment. The net revenues of the system are pledged for payment of the principal and interest of these warrants. Interest in the amount of $309,728 has been accrued on the warrants until February 15, 2017 and the Department, as part of the capital projects, capitalized that interest. Principal is payable annually beginning on August 15, 2017. Interest is payable semi-annually on each February 15 and August 15 beginning in February 2017. Debt service over the remaining term of the warrants is summarized as follows:
PrincipalMaturities and
Fiscal ScheduledYear Mandatory Total
Ending Redemption Interest DebtJune 30 Payments Payable Service
2016 4,105,000$ 1,845,357$ 5,950,357$ 2017 4,255,000 1,762,107 6,017,107 2018 4,640,000 1,756,001 6,396,001 2019 4,805,000 1,629,469 6,434,469 2020 4,985,000 1,498,225 6,483,225
2021–2025 11,225,000 6,147,839 17,372,839 2026–2030 8,900,000 4,665,630 13,565,630 2031–2035 11,090,000 2,481,035 13,571,035 2036–2037 5,195,000 232,818 5,427,818
Totals 59,200,000$ 22,018,481$ 81,218,481$
Less: Portion due within one year 4,105,000
Long-term debt at June 30, 2015 55,095,000$
Interest costs incurred for fiscal year 2015 amounted to $1,913,938 all of which was expensed. Interest costs incurred for fiscal year 2014 amounted to $2,329,639 of which $2,019,911 was expensed and $309,728 was capitalized.

CITY OF FLORENCE, ALABAMA ELECTRICITY, GAS, AND WATER AND WASTEWATER DEPARTMENTS
NOTES TO FINANCIAL STATEMENTS JUNE 30, 2015 and 2014
(Continued)
Page 40
NOTE 8—PENSION AND DEFERRED COMPENSATION PLANS Pension Plan
Plan Description—The City’s defined benefit pension plan, City of Florence, Alabama Employees’ Retirement Plan (CFAERP), provides pensions, disability, death, and termination benefits for all permanent full-time employees of the City. CFAERP is a single-employer defined benefit pension plan.
Benefits Provided—Retirement benefits for general employees are calculated as follows:
Normal Retirement The monthly amount accrued or purchased under the employer’s retirement annuity plan in effect prior to October 1, 1966, plus for each month of credited service, an amount calculated as follows:
• Before July 1, 1957, 1/24th of 1% of first $350 of monthly earnings on October 1, 1966, plus 3/24ths of 1% of the excess;
• From July 1, 1957 to October 1, 1966, 1/12th of .58% of first $350 of monthly earnings on October 1, 1966, plus 1/12th of 1.66% of the excess;
• From October 1, 1966 to October 1, 1979, 1/12th of 1.58% of first $350 of monthly earnings, plus 1/12th of 3.16% of the excess;
• From October 1, 1979 to October 1, 1988, 1/12th of 2.10% of first $350 of monthly earnings, plus 1/12th of 3.26% of the excess;
• After October 1, 1988, 1/12th of 2.31% of first $350 of monthly earnings, plus 1/12th of 3.586% of the excess.
Effective October 1, 1992, participant accrued benefits were increased by 10%.
Early Retirement Monthly benefit determined in same manner as normal retirement benefit, based on participant’s accrued benefit as of early retirement date, and reduced by 1/180th for each of the first 24 months and 1/360th for each additional month that the early retirement date precedes age 62. However, a participant who has attained age 62 with 5 years of credited service, or age 57 with 30 years of total service, or age 52 with 25 years of total service may retire early and receive normal retirement benefit with no reduction for early commencement.
Disability Benefit Monthly benefit equal to the accrued benefit as of the disability retirement date.
Death Benefit A lump sum cash payment equal to the excess (if any) of the participant’s contributions plus credited interest over the pension payments (if any) received by the participant.
Termination Benefit An amount equal to the participant’s accrued benefit. Instead of a deferred benefit, a participant may withdraw contributions with interest.
Benefits are payable as an annuity over the lifetime of the participant, with a minimum payout of the
participant’s contribution plus interest. Other benefit options include: • 120 months certain and life annuity. • Contingent annuitant option with either 100%, 66 2/3%, or 50% of the annuity being payable
to the contingent annuitant for life after the participant’s death. • Lump-sum cash payment (only available if attained age 55 with 5 years of credited service
early retirement or attained age 65 normal retirement).

CITY OF FLORENCE, ALABAMA ELECTRICITY, GAS, AND WATER AND WASTEWATER DEPARTMENTS
NOTES TO FINANCIAL STATEMENTS JUNE 30, 2015 and 2014
(Continued)
Page 41
NOTE 8—PENSION AND DEFERRED COMPENSATION PLANS (Continued) Employees Covered by Benefit Terms—At September 30, 2014, the following employees were covered by the benefit terms:
Active employees who have not reached age 65 653Active participants attaining Normal Retirement Age 65 11Inactive participants (19 in pay status) 84
Total participants 748
Contributions—The authority to establish and amend the contribution requirements of the CFAERP belongs to the City Council. The Council establishes rates based on an actuarially determined rate recommended by an independent actuary. The actuarially determined rate is the estimated amount necessary to finance the costs of benefits earned by employees during the year, with an additional amount to finance any unfunded accrued liability.
For the year ended September 30, 2014, the active employee contribution rate was 2.56% on the first
$350 of monthly compensation and 5.12% of monthly compensation in excess of $350. The City contributes 2.75 times the employee contribution.
Net Pension Liability—The City’s net pension liability was measured as of June 30, 2014, and the
total pension liability used to calculate the net pension liability was determined by an actuarial valuation as of that date.
Actuarial Assumptions—The total pension liability in the September 30, 2014 actuarial valuation
was determined using the following actuarial assumptions, applied to all periods included in the measurement:
Inflation 2.50%Salary increases 3.00%Investment rate of return 7.50%, net of investment expenses
Mortality rates were based on the RP-2000 Mortality for Employees, Healthy Annuitants, and
Disabled Annuitants Table for Males or Females, as appropriate, projected to 2018 with adjustments for mortality improvements based on Scale AA.
The long-term expected rate of return on pension plan investments was determined using a building-
block method in which best-estimate ranges of expected future real rates of return (expected returns, net of pension plan investment expense and inflation) are developed for each major asset class. These ranges are combined to produce the long-term expected rate of return by weighting the expected future real rates of return by the target asset allocation percentage and by adding expected inflation. The target allocation and best estimates of arithmetic real rates of return for each major asset class are summarized in the following table:

CITY OF FLORENCE, ALABAMA ELECTRICITY, GAS, AND WATER AND WASTEWATER DEPARTMENTS
NOTES TO FINANCIAL STATEMENTS JUNE 30, 2015 and 2014
(Continued)
Page 42
NOTE 8—PENSION AND DEFERRED COMPENSATION PLANS (Continued)
Target Long-Term ExpectedAsset Class Allocation Real Rate of Return
Core Fixed Income 30.00% 4.67%Intermediate-Term Bonds 10.00% 4.34%Large Cap US Equity 22.00% 7.90%Small Cap US Equity 3.00% 9.11%Mid Cap US Equity 5.00% 8.50%Non-US Equity 5.00% 9.28%Developed Foreign Equity 7.00% 8.81%Real Estate (REITs) 6.00% 7.95%Emerging Markets Equity 3.00% 11.05%US Large Growth 3.00% 8.67%US Large Value 4.00% 7.74%US Small Growth 2.00% 10.10%
Discount Rate—The discount rate used to measure the total pension liability was 7.50%. The
projection of cash flows used to determine the discount rate assumed that employee contributions will be made at the current contribution rate and that City contributions will be made at 2.75 times the employee contributions. Based on those assumptions, the pension plan’s fiduciary net position was projected to be available to make all projected future benefit payments of current active and inactive employees. Therefore, the long-term expected rate of return on pension plan investments was applied to all periods of projected benefit payments to determine the total pension liability.
Changes in the Net Pension Liability—The following table shows the components of the changes
in the net pension liability:
Total Pension Plan Fiduciary Net PensionLiability Net Position Liability
Balance as of September 30, 2014 103,053,884$ 80,400,416$ 22,653,468$ Changes for the year:
Service cost 2,854,759 2,854,759 Interest on total pension liability 7,603,781 7,603,781 Effect of plan changes - Effect of economic/demographic
gains/losses 1,537,047 1,537,047 Effect of assumption changes/inputs - Benefit payments (9,216,405) (9,216,405) - Employer contributions 3,710,391 (3,710,391) Member contributions 1,349,233 (1,349,233) Net investment income 7,950,048 (7,950,048) Administrative expenses (378,171) 378,171
Balance as of September 30, 2015 * 105,833,066$ 83,815,512$ 22,017,554$
* The measurement date is one year earlier than the reporting date.

CITY OF FLORENCE, ALABAMA ELECTRICITY, GAS, AND WATER AND WASTEWATER DEPARTMENTS
NOTES TO FINANCIAL STATEMENTS JUNE 30, 2015 and 2014
(Continued)
Page 43
NOTE 8—PENSION AND DEFERRED COMPENSATION PLANS (Continued) Sensitivity of the Net Pension Liability to Changes in the Discount Rate—The following presents the net pension liability of the City, calculated using the discount rate of 7.50%, as well as what the City’s net pension liability would be if it were calculated using a discount rate that is 1-percentage-point lower (6.50%) or 1-percentage-point higher (8.50%) than the current rate:
Current1% Decrease Discount Rate 1% Increase
(6.50%) (7.50%) (8.50%)Total Pension Liability 115,380,523$ 105,833,066$ 98,705,597$ Fiduciary Net Position 83,815,512 83,815,512 83,815,512
Net Pension Liability 31,565,011$ 22,017,554$ 14,890,085$
Pension Expense and Deferred Outflows of Resources and Deferred Inflows of Resources Related to Pensions—For the year ended September 30, 2014, the City recognized pension expense of $3,345,018. At September 30, 2014, the City reported deferred outflows of resources and deferred inflows of resources related to pensions from the following sources:
Deferred DeferredOutflows of Inflows ofResources Resources
Contributions made subsequent to themeasurement date of September 30, 2014 4,005,400$ -$
Differences in expected and actual experience 1,399,061 Differences between projected and actual earnings 1,669,602
Amounts reported as deferred outflows of resources and deferred inflows of resources related to pensions will be recognized in pension expense as follows:
Year EndedSeptember 30 Amount
2016 (279,415)$ 2017 (279,415) 2018 (279,415) 2019 (279,413) 2020 137,986
Thereafter * 709,131
* Additional future deferred outflows and inflowsof resources may impact these amounts.
Deferred outflows of resources resulting from employer contributions made subsequent to the measurement date in the amount of $4,005,400 will be recognized as a reduction of the net pension liability in the year ending September 30, 2016. The Utilities have recorded their proportionate share of the net pension liability, deferred outflows of resources, deferred inflows of resources, and pension expense based on the actuarial valuation of the CFAERP.

CITY OF FLORENCE, ALABAMA ELECTRICITY, GAS, AND WATER AND WASTEWATER DEPARTMENTS
NOTES TO FINANCIAL STATEMENTS JUNE 30, 2015 and 2014
(Continued)
Page 44
NOTE 8—PENSION AND DEFERRED COMPENSATION PLANS (Continued) Deferred Compensation Plan The City offers its employees access to deferred compensation plans created in accordance with Internal Revenue Code Section 457. These plans, available to all City employees, permit them to defer a portion of their salary until future years. Participation in the plans is optional. The deferred compensation is not available to employees until termination, retirement, death, or unforeseeable emergency. As required by Federal regulations, these plan assets are held in trust for the exclusive benefit of participants and their beneficiaries. The City has no fiduciary relationship with the trust. In accordance with professional standards, the assets of these plans are not reported in the City’s financial statements. NOTE 9—POSTRETIREMENT BENEFITS PLAN
Plan Description—The City of Florence, Alabama administers a single-employer defined benefit postretirement benefits plan. The plan provides medical, dental, and life insurance benefits to eligible retired City employees. Benefit provisions are established and may be amended by the City Council. The plan does not issue a publicly available financial report.
Funding Policy—The contribution requirements for plan members and the City are established and may be amended by the City Council. The City pays the entire cost of these benefits. A portion of the annual required contribution is financed on a pay-as-you-go basis.
Annual OPEB Cost and Net OPEB Obligation—The City’s annual other postemployment benefits (OPEB) cost (expense) is calculated based on the annual required contribution of the employer (ARC), an amount actuarially determined in accordance with the parameters of GASB Statement No. 45. The ARC represents a level of funding that, if paid on an ongoing basis, is projected to cover normal cost each year and amortize any unfunded actuarial liabilities (or funding excess) over a period not to exceed thirty years. The following table shows the components of the City’s annual OPEB cost for the year, the amount actually contributed to the plan, and changes in the City’s net OPEB obligation to the plan:
Annual required contribution 883,366$ Interest on prior year net OPEB obligation - Adjustment to annual required contribution - Annual OPEB cost 883,366$ Contributions made 883,366 Increase (decrease) in net OPEB obligation -$ Net OPEB obligation—beginning of year -
Net OPEB obligation—end of year -$

CITY OF FLORENCE, ALABAMA ELECTRICITY, GAS, AND WATER AND WASTEWATER DEPARTMENTS
NOTES TO FINANCIAL STATEMENTS JUNE 30, 2015 and 2014
(Continued)
Page 45
NOTE 9—POSTRETIREMENT BENEFITS PLAN (Continued)
PercentageFiscal Annual of Annual NetYear OPEB OPEB Cost OPEB
Ended Cost Contributed ObligationSeptember 30, 2014 883,366$ 100.0% -$ September 30, 2013September 30, 2012 756,308 100.0% - September 30, 2011September 30, 2010 460,057 100.0% -
Three-Year Trend Information
The City has elected to perform an actuarial valuation of the plan on a biennial basis.
Funded Status and Funding Progress—As of October 1, 2013, the most recent actuarial valuation date, the plan was 9.7% funded. The actuarial accrued liability for benefits was $11.7 million and the actuarial value of assets was $1.1 million, resulting in an unfunded actuarial accrued liability (UAAL) of $10.6 million. The covered payroll (annual payroll of active employees covered by the plan) was $29.6 million, and the ratio of the UAAL to the covered payroll was 35.8%.
Actuarial valuations of an ongoing plan involve estimates of the value of reported amounts and
assumptions about the probability of occurrence of events far into the future. Examples include assumptions about future employment, mortality, and the healthcare cost trend. Amounts determined regarding the funded status of the plan and the annual required contribution of the employer are subject to continual revision as actual results are compared with past expectations and new estimates are made about the future. The schedule of funding progress, presented as RSI following the notes to the financial statements, presents multiyear trend information about whether the actuarial value of plan assets is increasing or decreasing over time relative to the actuarial accrued liabilities for benefits.
Actuarial Methods and Assumptions—Projections of benefits for financial reporting purposes are based on the substantive plan (the plan as understood by the employer and the plan members) and include the types of benefits provided at the valuation date. Actuarial calculations reflect a long-term perspective and employ methods and assumptions that are designed to reduce short-term volatility in actuarial accrued liabilities and the actuarial value of assets. In the October 1, 2013 actuarial valuation, the unit credit actuarial cost method was used. The actuarial assumptions included a discount rate of 5.0%, which is based on the historical and expected returns that the City earns on its investments, projected salary increases of 3.5% per year, and an annual healthcare cost trend of 5.6% initially that is reduced by decrements to an ultimate rate of 4.5% after eighty (80) years. These rates included a 2.75% inflation assumption. The UAAL is being amortized as a level percentage of projected payroll on a closed basis. The remaining amortization period at October 1, 2013 was twenty-four (24) years.

CITY OF FLORENCE, ALABAMA ELECTRICITY, GAS, AND WATER AND WASTEWATER DEPARTMENTS
NOTES TO FINANCIAL STATEMENTS JUNE 30, 2015 and 2014
(Continued)
Page 46
NOTE 10—LEASE COMMITMENTS Electricity Department The Department entered into a "Use Facilities" lease with TVA on April 21, 1983. This lease provides the Department with the use of facilities located in the Wilson Hydro Area. The lease shall continue in effect, for the term of the Power Contract dated July 6, 1966, between TVA and the City of Florence and shall include any extension, renewal, or replacement thereof. The Department is on a five (5) year rolling Power Contract. Therefore, the future minimum lease payments will always be five (5) years until the Department informs TVA of its intent to cancel the contract. Effective April 1, 2007, the monthly charge was recomputed to $16,781. Payments under the lease amounted to $201,372 for the fiscal years presented. The future minimum annual rental payments for the succeeding five (5) years are as follows:
FiscalYear
Ending Amount2016 201,372$ 2017 201,372 2018 201,372 2019 201,372 2020 201,372
Total 1,006,860$
NOTE 11—DEPOSITS AND INVESTMENTS On April 17, 2007, the City adopted an investment policy to formalize the framework for the City's investment activities. The policy generally limits its investments to non-negotiable certificates of deposit. For the Electricity Department, the policy allows funds to be invested in the TVA Prepaid Power Program and the TVA Discounted Energy Unit Program. Under the terms of bond indentures, the Utilities are required to deposit into certain bond funds for debt service. These investments are governed by the bond indenture, held by the paying agent as required under the indenture, and are invested in U. S. Government securities. The custodial credit risk for deposits is the risk that, in the event of a bank failure, the Utilities will not be able to cover deposits or will not be able to recover collateral securities that are in the possession of an outside party. The Utilities' deposits at year-end were entirely covered by federal depository insurance or by the Security for Alabama Funds Enhancement Program (SAFE Program). The SAFE Program was established by the Alabama Legislature and is governed by the provisions contained in the Code of Alabama 1975, Sections 41-14A-1 through 41-14A-14. Under the SAFE Program, all public funds are protected through a collateral pool administered by the Alabama State Treasurer’s Office. Under this program, financial institutions holding deposits of public funds must pledge securities as collateral against those deposits. In the event of failure of a financial institution, securities pledged by that financial institution would be liquidated by the State Treasurer to replace the public deposits not covered by the Federal Depository Insurance Corporation (FDIC). If the securities pledged fail to produce adequate funds, every institution participating in the pool would share the liability for the remaining balance.

CITY OF FLORENCE, ALABAMA ELECTRICITY, GAS, AND WATER AND WASTEWATER DEPARTMENTS
NOTES TO FINANCIAL STATEMENTS JUNE 30, 2015 and 2014
(Continued)
Page 47
NOTE 12—RISK MANAGEMENT The City’s risk management activities are accounted for through three (3) self-insurance funds. The purpose of these funds is to administer employee health, property and liability, and workers’ compensation insurance programs of the City on a cost-reimbursement basis. These funds account for the risk financing activities of the City but do not constitute a transfer of risk from the City. The City retains a risk of loss on the employee health, property and liability, and a portion of workers’ compensation insurance. For the insured portion of workers’ compensation insurance, there have been no reductions in insurance coverage. Settlement amounts have not exceeded insurance coverage for the current year or the three prior years. Additional information related to the self-insurance funds can be requested from the City’s Insurance department. The Utilities remit payments to these self-insurance funds and any liability resulting to the Utilities will be paid from these funds. NOTE 13—CONTINGENCIES AND COMMITMENTS The Utilities are party to certain legal actions arising in the ordinary course of business. In management’s opinion, the Utilities have adequate insurance coverage and/or legal defenses, if needed, and do not believe that they will materially affect the Utilities operations or financial position. Amounts received or receivable from grantor agencies are subject to audit and adjustment by grantor agencies. Any disallowed claims, including amounts already collected, may constitute a liability of the applicable funds or the general fund. The amount, if any, which may be disallowed by the grantor, cannot be determined at this time although the Utilities expect such amounts to be immaterial. Electricity Department The Department enters into agreements with contractors for the construction and expansion of the system and for system maintenance. As of June 30, 2015, open contracts for construction totaled $3,746,861 of which $1,680,717 had been recorded as cumulative construction in progress. As of June 30, 2015, open contracts for system maintenance totaled $4,224,651 of which $708,655 had been recorded as current maintenance expense. As of June 30, 2014, open contracts for construction totaled $1,354,295 of which $731,272 had been recorded as cumulative construction in progress. As of June 30, 2014, open contracts for system maintenance totaled $4,224,651 of which $1,734,713 had been recorded as current maintenance expense. Gas Department The Department entered into an agreement with two (2) energy suppliers to purchase natural gas in the futures market. This agreement allows the Department to purchase gas at current rates for delivery at a future time. If the quantities of gas purchased are not needed for resale during the month for which it was purchased, the Department could transport the gas to its storage facilities, or the Agreement allows the suppliers to re-purchase the gas at market price. Thus, management does not believe that the risk of loss from the purchase commitment would materially affect the Department’s operations or financial position. As of June 30, 2015 and 2014, the Department had made purchase commitments amounting to $13,177,254 and $14,484,744, respectively, for the subsequent fiscal year's gas needs.

CITY OF FLORENCE, ALABAMA ELECTRICITY, GAS, AND WATER AND WASTEWATER DEPARTMENTS
NOTES TO FINANCIAL STATEMENTS JUNE 30, 2015 and 2014
(Continued)
Page 48
NOTE 13—CONTINGENCIES AND COMMITMENTS (Continued) Water and Wastewater Department The Department enters into agreements with contractors for the construction and expansion of the system. As of June 30, 2015, open contracts for construction totaled $4,770,780 of which $4,069,815 had been recorded as cumulative construction in progress. As of June 30, 2015, open contracts for system maintenance totaled $789,370 of which $210,981 had been recorded as current maintenance expense. As of June 30, 2014, open contracts for construction totaled $15,246,977 of which $8,442,669 had been recorded as cumulative construction in progress. As of June 30, 2014, open contracts for system maintenance totaled $189,544 of which $53,651 had been recorded as current maintenance expense. NOTE 14—RESTATEMENT In June 2012, GASB issued Statement No. 68, Accounting and Financial Reporting for Pensions. In November 2013, GASB issued Statement No. 71, Pension Transition for Contributions Made Subsequent to the Measurement Date. The requirements of these GASB pronouncements are effective for fiscal years beginning after June 15, 2014. Due to the implementation of these new statements, the following has been restated: Electricity Department
Net PositionBalance as of June 30, 2014, as previously stated 84,773,033$ Cumulative effect of the change in accounting principle related to:
Deferred outflows of resources 1,082,692 Net pension liability (6,620,428)
Balance as of June 30, 2014, as restated 79,235,297$
Gas Department
Net Position
Balance as of June 30, 2014, as previously stated 43,485,318$ Cumulative effect of the change in accounting principle related to:
Deferred outflows of resources 298,799 Net pension liability (2,663,123)
Balance as of June 30, 2014, as restated 41,120,994$
Water and Wastewater Department
Net Position
Balance as of June 30, 2014, as previously stated 72,938,355$ Cumulative effect of the change in accounting principle related to:
Deferred outflows of resources 357,695 Net pension liability (2,241,028)
Balance as of June 30, 2014, as restated 71,055,022$
REQUIRED SUPPLEMENTARY INFORMATION
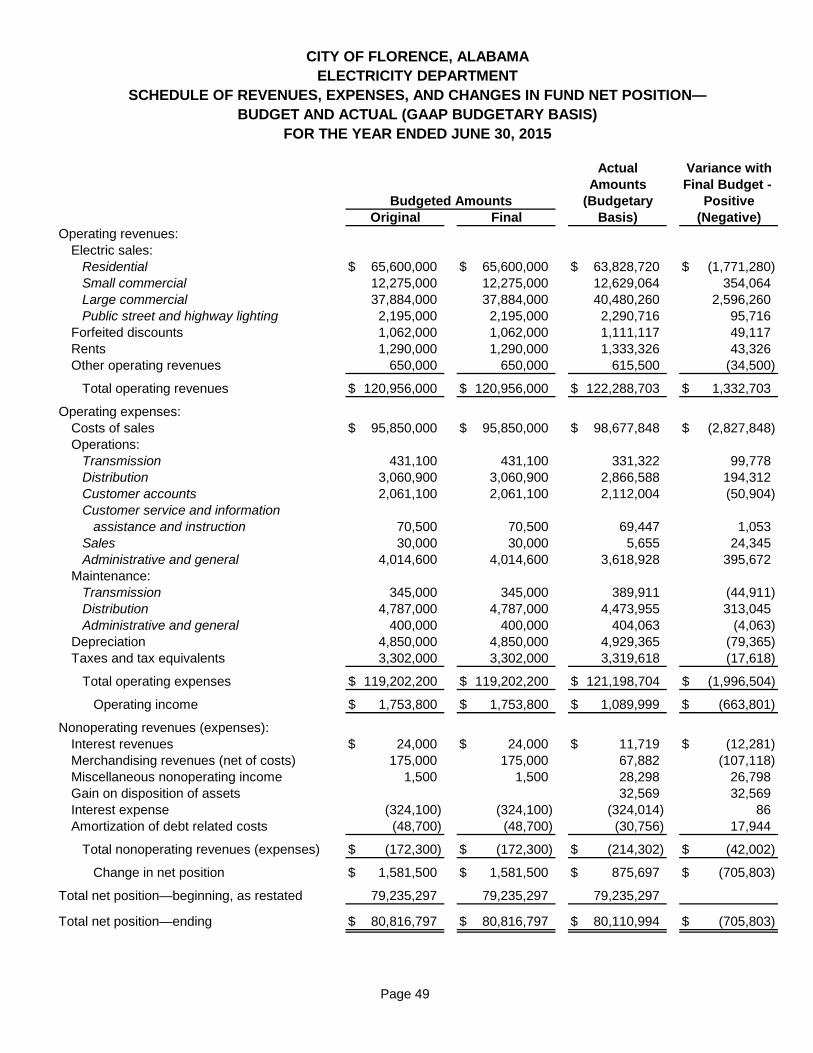
Page 49
CITY OF FLORENCE, ALABAMAELECTRICITY DEPARTMENT
SCHEDULE OF REVENUES, EXPENSES, AND CHANGES IN FUND NET POSITION—BUDGET AND ACTUAL (GAAP BUDGETARY BASIS)
FOR THE YEAR ENDED JUNE 30, 2015
Actual Variance withAmounts Final Budget -
Budgeted Amounts (Budgetary PositiveOriginal Final Basis) (Negative)
Operating revenues:Electric sales:
Residential $ 65,600,000 $ 65,600,000 $ 63,828,720 $ (1,771,280)Small commercial 12,275,000 12,275,000 12,629,064 354,064Large commercial 37,884,000 37,884,000 40,480,260 2,596,260Public street and highway lighting 2,195,000 2,195,000 2,290,716 95,716
Forfeited discounts 1,062,000 1,062,000 1,111,117 49,117Rents 1,290,000 1,290,000 1,333,326 43,326Other operating revenues 650,000 650,000 615,500 (34,500)
Total operating revenues $ 120,956,000 $ 120,956,000 $ 122,288,703 $ 1,332,703
Operating expenses:Costs of sales $ 95,850,000 $ 95,850,000 $ 98,677,848 $ (2,827,848)Operations:
Transmission 431,100 431,100 331,322 99,778Distribution 3,060,900 3,060,900 2,866,588 194,312Customer accounts 2,061,100 2,061,100 2,112,004 (50,904)Customer service and information
assistance and instruction 70,500 70,500 69,447 1,053Sales 30,000 30,000 5,655 24,345Administrative and general 4,014,600 4,014,600 3,618,928 395,672
Maintenance:Transmission 345,000 345,000 389,911 (44,911)Distribution 4,787,000 4,787,000 4,473,955 313,045Administrative and general 400,000 400,000 404,063 (4,063)
Depreciation 4,850,000 4,850,000 4,929,365 (79,365)Taxes and tax equivalents 3,302,000 3,302,000 3,319,618 (17,618)
Total operating expenses $ 119,202,200 $ 119,202,200 $ 121,198,704 $ (1,996,504)
Operating income $ 1,753,800 $ 1,753,800 $ 1,089,999 $ (663,801)
Nonoperating revenues (expenses):Interest revenues $ 24,000 $ 24,000 $ 11,719 $ (12,281)Merchandising revenues (net of costs) 175,000 175,000 67,882 (107,118)Miscellaneous nonoperating income 1,500 1,500 28,298 26,798Gain on disposition of assets 32,569 32,569Interest expense (324,100) (324,100) (324,014) 86Amortization of debt related costs (48,700) (48,700) (30,756) 17,944
Total nonoperating revenues (expenses) $ (172,300) $ (172,300) $ (214,302) $ (42,002)
Change in net position $ 1,581,500 $ 1,581,500 $ 875,697 $ (705,803)
Total net position—beginning, as restated 79,235,297 79,235,297 79,235,297
Total net position—ending $ 80,816,797 $ 80,816,797 $ 80,110,994 $ (705,803)

Page 50
CITY OF FLORENCE, ALABAMAGAS DEPARTMENT
SCHEDULE OF REVENUES, EXPENSES, AND CHANGES IN FUND NET POSITION—BUDGET AND ACTUAL (GAAP BUDGETARY BASIS)
FOR THE YEAR ENDED JUNE 30, 2015
Actual Variance withAmounts Final Budget -
Budgeted Amounts (Budgetary PositiveOriginal Final Basis) (Negative)
Operating revenues:Gas sales:
Residential $ 7,079,400 $ 7,079,400 $ 7,237,261 $ 157,861Commercial 4,595,000 4,595,000 4,681,093 86,093Industrial 6,259,300 6,259,300 4,992,809 (1,266,491)Resale and transportation 1,581,800 1,581,800 1,439,345 (142,455)
Service fees 84,000 84,000 64,054 (19,946)Forfeited discounts 95,400 95,400 87,702 (7,698)Other operating revenues 12,300 12,300 11,197 (1,103)
Total operating revenues $ 19,707,200 $ 19,707,200 $ 18,513,461 $ (1,193,739)
Operating expenses:Costs of sales $ 11,877,800 $ 11,877,800 $ 10,297,285 $ 1,580,515Operations:
Transmission 157,300 157,300 122,196 35,104Distribution 340,300 340,300 437,864 (97,564)Customer accounts 622,000 622,000 603,884 18,116Sales 40,700 40,700 56,762 (16,062)Administrative and general 1,837,500 1,837,500 1,635,584 201,916
Maintenance:Transmission 1,600 1,600 878 722Distribution 1,577,400 1,577,400 1,552,355 25,045Administrative and general 55,200 55,200 62,650 (7,450)
Depreciation 1,450,000 1,450,000 1,513,259 (63,259)Amortization of acquisition adjustment 10,700 10,700 10,661 39Taxes and tax equivalents 1,507,700 1,507,700 1,497,567 10,133
Total operating expenses $ 19,478,200 $ 19,478,200 $ 17,790,945 $ 1,687,255
Operating income (loss) $ 229,000 $ 229,000 $ 722,516 $ 493,516
Nonoperating revenues (expenses):Interest revenues $ 5,000 $ 5,000 $ 4,190 $ (810)Gain (loss) on disposition of assets 10,000 10,000 65,034 55,034Miscellaneous nonoperating income 139,500 139,500 71,802 (67,698)
Total nonoperating revenues (expenses) $ 154,500 $ 154,500 $ 141,026 $ (13,474)
Change in net position $ 383,500 $ 383,500 $ 863,542 $ 480,042
Total net position—beginning, as restated 41,120,994 41,120,994 41,120,994
Total net position—ending $ 41,504,494 $ 41,504,494 $ 41,984,536 $ 480,042

Page 51
CITY OF FLORENCE, ALABAMAWATER AND WASTEWATER DEPARTMENT
SCHEDULE OF REVENUES, EXPENSES, AND CHANGES IN FUND NET POSITION—BUDGET AND ACTUAL (GAAP BUDGETARY BASIS)
FOR THE YEAR ENDED JUNE 30, 2015
Actual Variance withAmounts Final Budget -
Budgeted Amounts (Budgetary PositiveOriginal Final Basis) (Negative)
Operating revenues:Water sales:
Residential $ 6,471,000 $ 6,471,000 $ 6,494,500 $ 23,500Commercial 3,475,200 3,475,200 3,336,827 (138,373)Resale 1,470,300 1,470,300 1,608,353 138,053
Sewer service sales:Residential 3,989,100 3,989,100 3,999,834 10,734Commercial 3,716,100 3,716,100 3,398,803 (317,297)
Forfeited discounts 148,600 148,600 155,048 6,448Other operating revenues 205,000 205,000 133,055 (71,945)
Total operating revenues $ 19,475,300 $ 19,475,300 $ 19,126,420 $ (348,880)
Operating expenses:Water treatment and pumping $ 3,070,500 $ 3,070,500 $ 2,896,453 $ 174,047Sewage disposal 2,320,800 2,320,800 2,017,003 303,797Transmission and distribution 1,893,400 1,893,400 1,597,297 296,103Accounting and collections 1,056,700 1,056,700 930,891 125,809Administrative and general 1,890,100 1,890,100 1,789,913 100,187Depreciation 3,353,100 3,353,100 3,458,344 (105,244)Taxes and tax equivalents 1,738,200 1,738,200 1,638,279 99,921
Total operating expenses $ 15,322,800 $ 15,322,800 $ 14,328,180 $ 994,620
Operating income $ 4,152,500 $ 4,152,500 $ 4,798,240 $ 645,740
Nonoperating revenues (expenses):Interest revenues $ 10,350 $ 10,350 $ 3,965 $ (6,385)Gain (loss) on disposition of assets (521,016) (521,016)Interest expense (1,954,000) (1,954,000) (1,913,938) 40,062Amortization of debt related costs (58,600) (58,600) (44,930) 13,670
Total nonoperating revenues (expenses) $ (2,002,250) $ (2,002,250) $ (2,475,919) $ (473,669)
Change in net position $ 2,150,250 $ 2,150,250 $ 2,322,321 $ 172,071
Total net position—beginning, as restated 71,055,022 71,055,022 71,055,022
Total net position—ending $ 73,205,272 $ 73,205,272 $ 73,377,343 $ 172,071

Page 52
TOTAL PENSION LIABILITYService cost $ 2,854,759 Interest 7,603,781 Effect of plan changesEffect of economic/demographic gains or losses 1,537,047 Effect of assumption changes or inputsBenefit payments (9,216,405)
Net change in total pension liability $ 2,779,182
Total pension liability, beginning 103,053,884 Total pension liability, ending (a) $ 105,833,066
FIDUCIARY NET POSITIONContributions–employer $ 3,710,391 Contributions–employee 1,349,233 Investment income, net of investment expenses 7,950,048 Benefit payments (9,216,405) Administrative expenses (378,171)
Net change in plan fiduciary net position $ 3,415,096
Fiduciary net position, beginning 80,400,416 Fiduciary net position, ending (b) $ 83,815,512
Net pension liability, ending (a-b) $ 22,017,554
Fiduciary net position as a percentage of total pension liability 79.20%
Covered-employee payroll $ 29,557,478
Net pension liability as a percentage of covered-employee payroll 74.49%
CITY OF FLORENCE, ALABAMA
SEPTEMBER 30, 2014
EMPLOYEES' RETIREMENT PLANSCHEDULE OF CHANGES IN THE NET PENSION LIABILITY AND RELATED RATIOS

Page 53
Fiscal Year Actuarially Actual Contribution Contribution asEnded Determined Employer Deficiency Covered a Percentage of
September 30 Contribution Contribution (Excess) Payroll Covered Payroll2006 3,309,955$ 3,187,574$ 122,381$ 23,418,971$ 13.61%2007 3,257,216 3,330,693 (73,477) 24,300,964 13.71%2008 2,435,104 3,726,546 (1,291,442) 25,653,135 14.53%2009 2,315,374 4,029,198 (1,713,824) 26,289,687 15.33%2010 2,260,178 3,563,874 (1,303,696) 26,775,834 13.31%2011 2,920,660 3,888,126 (967,466) 28,074,105 13.85%2012 3,377,314 3,765,076 (387,762) 28,743,659 13.10%2013 3,764,645 3,878,051 (113,406) 27,759,757 13.97%2014 4,139,524 3,710,391 429,133 29,562,601 12.55%2015 4,023,027 4,005,400 17,627 29,557,478 13.55%
Notes to ScheduleValuation date:
Actuarially determined contribution rates are calculated as of June 30, one year prior to the end of the fiscal year in which the contributions are reported.
Methods and assumptions used to determine the contribution rates:Actuarial cost method: Entry age normal Amortization method: Level dollar of payroll, closedRemaining amortization period: 26 yearsAsset valuation method: 4-year smoothed marketCorridor: 90.00% to 110.00% of marketInflation: 2.50%Salary increases: 3.00%Investment rate of return: 7.50%, net of investment expensesCost of living adjustments: NoneRetirement age: Normal–Attained age 65; Early–Attained age 55 with 5 years credited service, or attained age 52 with 25 years of total serviceTurnover: Annual rates ranging from 12.00% at age 25 to 0.00% at age 55Mortality: RP-2000 Mortality for Employees, Healthy Annuitants, and Disabled Annuitants Table, projected to 2018 per Scale AA
CITY OF FLORENCE, ALABAMASchedule of Employer Contributions
Employees' Retirement Plan

Page 54
Actuarial Actuarial Accrued Unfunded UAAL as aActuarial Value of Liability (AAL)— AAL Funded Covered Percentage ofValuation Assets Unit Credit (UAAL) Ratio Payroll Covered Payroll
Date (a) (b) (b - a) (a / b) (c) ((b - a) / c) October 1, 2013 1,142,548$ 11,719,967$ 10,577,419$ 9.7% 29,562,601$ 35.8%October 1, 2011 683,821 8,666,316 7,982,495 7.9% 28,103,737 28.4%October 1, 2009 483,054 4,487,605 4,004,551 10.8% 25,726,624 15.6%
CITY OF FLORENCE, ALABAMASchedules of Funding Progress
Postretirement Benefits Plan
The City has elected to perform an actuarial valuation of the plan on a biennial basis.

SUPPLEMENTARY SCHEDULES SECTION

CITY OF FLORENCE, ALABAMAELECTRICITY, GAS, AND WATER AND WASTEWATER DEPARTMENT
SOURCE OF FUNDSJUNE 30, 2015
Percentages in graphs may not add up to 100 percent due to rounding.Page 55
52%
10%
33%
2% 3%ELECTRICITY
Residential
Small commercial
Large commercial
Public street and highway lighting
Other operating revenues
39%
25%
27%
8% 1%GAS
Residential
Commercial
Industrial
Resale and transportation
Other operating revenues
34%
17%8%
21%
18%2%
WATER AND WASTEWATER
Residential water sales
Commercial water sales
Resale water sales
Residential sewer service sales
Commercial sewer service sales
Other operating revenues

CITY OF FLORENCE, ALABAMAELECTRICITY, GAS, AND WATER AND WASTEWATER DEPARTMENT
USE OF FUNDSJUNE 30, 2015
Percentages in graphs may not add up to 100 percent due to rounding.Page 56
81%
8%
4%4% 3%
ELECTRICITY
Costs of sales
Operations
Maintenance
Depreciation
Taxes and tax equivalents
58%
16%
9%
9%
8%GAS
Costs of sales
Operations
Maintenance
Depreciation and amortization
Taxes and tax equivalents
20%
14%
11%7%
13%
24%
11%
WATER AND WASTEWATER
Water treatment and pumping
Sewage disposal
Transmission and distribution
Accounting and collections
Administrative and general
Depreciation
Taxes and tax equivalents

ELECTRICITY DEPARTMENT

CITY OF FLORENCE, ALABAMAELECTRICITY DEPARTMENT
SCHEDULE OF UTILITY PLANT IN SERVICEAND ACCUMULATED DEPRECIATION
JUNE 30, 2015
UTILITY PLANT Balance Additions Retirements Balance
Beginning and and EndDescription of Year Reclassifications Reclassifications of Year
Transmission plant:Land and land rights $ 596,894 $ 8,814 $ - $ 605,708Clearing land and right of ways 90,378 90,378Structures and improvements 53,927 16,475 70,402Station equipment 20,429,705 3,082,560 879,778 22,632,487Towers and fixtures 32,266 32,266Poles and fixtures 5,120,910 233,466 12,393 5,341,983Overhead conductors and devices 5,369,892 25,650 2,189 5,393,353
Total transmission plant $ 31,693,972 $ 3,366,965 $ 894,360 $ 34,166,577
Distribution plant:Land and land rights $ 69,040 $ - $ - $ 69,040Station equipment 2,846,481 2,846,481Poles, towers, and fixtures 23,085,405 1,140,810 103,085 24,123,130Overhead conductors and devices 22,328,909 204,042 118,935 22,414,016Underground conduit 2,735,952 137,145 440 2,872,657Underground conductors and devices 9,636,887 480,327 6,597 10,110,617Line transformers 23,701,079 646,365 389,113 23,958,331Services 8,592,342 325,701 125,660 8,792,383Meters 4,095,000 100,915 73,812 4,122,103Installation on customer premises 2,461,024 103,147 26,094 2,538,077Street lighting and signal systems 7,259,561 431,083 10,291 7,680,353
Total distribution plant $ 106,811,680 $ 3,569,535 $ 854,027 $ 109,527,188
General plant:Land and land rights $ 390,254 $ - $ - $ 390,254Structures and improvements 3,530,217 406,408 16,643 3,919,982Office furniture and equipment 3,272,996 211,453 235,576 3,248,873Transportation equipment 6,504,651 747,464 445,639 6,806,476Stores equipment 43,707 43,707Tools, shop, and garage equipment 3,147,059 40,952 140,037 3,047,974Laboratory equipment 56,457 56,457Power operated equipment 316,625 316,625Communication equipment 402,508 3,250 79,527 326,231Miscellaneous equipment 183,253 94,773 449 277,577
Total general plant $ 17,847,727 $ 1,504,300 $ 917,871 $ 18,434,156
Total utility plant in service $ 156,353,379 $ 8,440,800 $ 2,666,258 $ 162,127,921

Page 57
ACCUMULATED DEPRECIATIONBalance Retirements- Balance
Beginning Original Removal Endof Year Accrual Cost Costs Salvage of Year
$ - $ - $ - $ - $ - $ - - -
48,031 1,297 49,32813,788,704 748,248 879,778 214,721 13,442,453
32,266 32,2663,206,938 210,980 12,393 3,025 3,402,5003,782,172 161,607 2,189 534 3,941,056
$ 20,858,111 $ 1,122,132 $ 894,360 $ 218,280 $ - $ 20,867,603
$ - $ - $ - $ - $ - $ - 2,237,912 113,859 2,351,771
10,207,331 707,477 103,085 25,159 10,786,56414,907,770 613,252 118,935 29,028 15,373,0591,810,714 111,588 440 107 1,921,7554,519,458 394,888 6,597 1,610 4,906,1396,486,269 538,176 389,113 94,968 6,540,3643,376,472 260,620 125,660 30,669 3,480,763
332,987 111,895 73,812 18,015 353,0551,696,355 124,953 26,094 6,369 1,788,8456,096,205 380,004 10,291 2,512 6,463,406
$ 51,671,473 $ 3,356,712 $ 854,027 $ 208,437 $ - $ 53,965,721
$ - $ - $ - $ - $ - $ - 1,075,745 92,179 14,810 1,153,1142,662,805 159,210 233,170 2,588,8454,152,928 399,500 401,075 4,151,353
35,398 1,651 37,0492,349,357 119,985 138,781 2,330,561
38,080 1,811 39,891101,056 24,480 125,536209,994 17,158 79,172 147,980109,065 16,168 449 124,784
$ 10,734,428 $ 832,142 $ 867,457 $ - $ - $ 10,699,113
$ 83,264,012 $ 5,310,986 $ 2,615,844 $ 426,717 $ - $ 85,532,437

GAS DEPARTMENT

CITY OF FLORENCE, ALABAMAGAS DEPARTMENT
SCHEDULE OF UTILITY PLANT IN SERVICEAND ACCUMULATED DEPRECIATION
JUNE 30, 2015
UTILITY PLANT Balance Additions Retirements Balance
Beginning and and End Description of Year Reclassifications Reclassifications of Year
Transmission plant:Land and land rights $ 120,667 $ 24 $ - $ 120,691Structures and improvements 142,993 142,993Mains 7,048,566 169,570 7,218,136Measuring and regulating equipment 2,647,021 24,609 2,671,630
Total transmission plant $ 9,959,247 $ 194,203 $ - $ 10,153,450
Distribution plant:Land and land rights $ 42,685 $ 54 $ - $ 42,739Structures and improvements 154,621 154,621Mains 19,405,066 336,140 30,488 19,710,718Measuring and regulating equipment 4,940,916 1,207,148 519,905 5,628,159Services 12,088,738 318,424 42,819 12,364,343Other distribution equipment 15,621 15,621Corrosion 680,310 5,219 685,529
Total distribution plant $ 37,327,957 $ 1,866,985 $ 593,212 $ 38,601,730
General plant:Land and land rights $ 157,395 $ - $ - $ 157,395Structures and improvements 2,708,018 15,083 2,723,101Office furniture and equipment 677,172 52,429 211,851 517,750Transportation equipment 1,575,666 87,084 134,246 1,528,504Stores equipment 17,798 17,798Tools, shop and garage equipment 19,756 896 20,652Laboratory equipment 32,258 32,258Power operated equipment 1,859,608 206,152 213,793 1,851,967Communication equipment 77,610 5,564 40,962 42,212Miscellaneous equipment 398,324 7,762 21,642 384,444Other tangible property 18,589 18,589
Total general plant $ 7,542,194 $ 374,970 $ 622,494 $ 7,294,670
Total utility plant in service $ 54,829,398 $ 2,436,158 $ 1,215,706 $ 56,049,850

Page 58
ACCUMULATED DEPRECIATIONBalance Retirements- Balance
Beginning Original Removal Endof Year Accrual Cost Costs of Year
$ - $ - $ - $ - $ - 135,013 5,720 140,733
2,388,613 142,692 2,531,3051,776,893 79,780 1,856,673
$ 4,300,519 $ 228,192 $ - $ - $ 4,528,711
$ - $ - $ - $ - $ - 154,621 154,621
5,084,771 391,158 30,488 6 5,445,4352,037,054 158,535 519,905 1,675,6845,372,603 366,796 42,819 28,225 5,668,355
14,746 469 15,215680,310 5,220 685,530
$ 13,344,105 $ 922,178 $ 593,212 $ 28,231 $ 13,644,840
$ - $ - $ - $ - $ - 2,574,523 135,778 2,710,301
575,269 30,514 211,670 394,1131,219,236 106,981 134,180 1,192,037
11,748 1,110 12,85816,150 1,211 17,36125,729 2,778 28,507
1,453,276 67,175 213,793 1,306,65877,324 1,371 40,962 37,733
326,587 15,971 20,124 322,43418,588 18,588
$ 6,298,430 $ 362,889 $ 620,729 $ - $ 6,040,590
$ 23,943,054 $ 1,513,259 $ 1,213,941 $ 28,231 $ 24,214,141

WATER AND WASTEWATER DEPARTMENT

CITY OF FLORENCE, ALABAMAWATER AND WASTEWATER DEPARTMENTSCHEDULE OF UTILITY PLANT IN SERVICE
AND ACCUMULATED DEPRECIATIONJUNE 30, 2015
UTILITY PLANT Balance Additions Retirements Balance
Beginning and and End Description of Year Reclassifications Reclassifications of Year
Transmission and distribution plant:Land and land rights $ 968,039 $ - $ - $ 968,039Supply source 9,790,847 1,493,338 285,500 10,998,685Pumping structures 6,019,239 52,636 6,071,875Sewer plant and system 93,923,232 108,563 94,031,795Reservoirs and standpipes 1,734,100 3,255 1,737,355Purification building and equipment 18,189,564 10,409,737 620,654 27,978,647Transmission mains and appurtenances 6,210,473 6,210,473Distribution mains and appurtenances 11,224,871 215,280 11,440,151Customer services 3,895,236 112,279 670,892 3,336,623Fire hydrants 568,930 568,930Miscellaneous structures and improvements 603,558 7,610 19,512 591,656
Total transmission and distribution plant $ 153,128,089 $ 12,402,698 $ 1,596,558 $ 163,934,229
General plant:Office furniture and equipment $ 598,784 $ 22,196 $ 20,911 $ 600,069Transportation equipment 1,897,559 101,199 1,796,360Tools and equipment 1,381,879 141,617 9,138 1,514,358Communication equipment 60,139 843 60,982Laboratory equipment 65,614 65,614
Total general plant $ 4,003,975 $ 164,656 $ 131,248 $ 4,037,383
Total utility plant in service $ 157,132,064 $ 12,567,354 $ 1,727,806 $ 167,971,612

Page 59
ACCUMULATED DEPRECIATIONBalance Additions Retirements Balance
Beginning and and Endof Year Reclassifications Reclassifications of Year
$ - $ - $ - $ - 4,298,757 (3,307,541) 128,475 862,7411,065,195 3,700,034 4,765,229
25,594,674 1,800,517 27,395,1911,095,840 35,180 1,131,0205,525,115 717,449 259,331 5,983,2332,408,688 105,271 2,513,9596,736,088 189,582 6,925,6702,643,945 81,673 670,892 2,054,726
290,949 12,105 303,054294,464 15,639 5,318 304,785
$ 49,953,715 $ 3,349,909 $ 1,064,016 $ 52,239,608
$ 488,877 $ 23,050 $ 19,725 $ 492,2021,535,961 76,794 83,628 1,529,1271,118,018 95,821 9,138 1,204,701
51,502 3,867 55,36938,992 6,662 45,654
$ 3,233,350 $ 206,194 $ 112,491 $ 3,327,053
$ 53,187,065 $ 3,556,103 $ 1,176,507 $ 55,566,661

Page 60
CITY OF FLORENCE, ALABAMAWATER AND WASTEWATER DEPARTMENT
SCHEDULE OF REVENUES AND EXPENSES—KILLEN SYSTEMFOR THE YEARS ENDED JUNE 30, 2015 and 2014
2015 2014Operating revenues:
Water sales:Residential $ 1,362,752 $ 1,263,024Commercial 404,629 356,901
Forfeited discounts 17,688 17,105Other operating revenues 10,466 15,183
Total operating revenues $ 1,795,535 $ 1,652,213
Operating expenses:Water treatment and pumping $ 507,976 $ 502,952Transmission and distribution 238,321 230,725Accounting and collections 102,372 112,969Administrative and general 138,458 145,563Depreciation 52,763 97,951Taxes and tax equivalents 20,775 20,809
Total operating expenses $ 1,060,665 $ 1,110,969
Operating income $ 734,870 $ 541,244
Nonoperating revenues (expenses):Interest revenues $ 317 $ 673Gain (loss) on disposition of assets 1,800Interest expense (126,313) (126,313)Debt issuance costs expense (800)Amortization of debt related costs (888) (845)
Total nonoperating revenues (expenses) $ (125,084) $ (127,285)
Income before capital contributions $ 609,786 $ 413,959