City in Flux
22
CITY IN FLUX Samuel Barran
-
Upload
samuel-barran -
Category
Documents
-
view
214 -
download
0
description
Research booklet for my project entitled City in Flux
Transcript of City in Flux

2
CITY IN FLUXSamuel Barran
1
Michael Wesely
“The frame-work is an architectural view, but it”s only the frame. Time itself is the subject,
manifesting itself in many details. The details are the essential things that tell the story, and for that
reason it is important to look closely ”
Michael Wesely
Michael Wesely is a long exposure photographer. He takes the idea and puts it to the extreme with the record for the longest exposure in history (4 years). He likes to show the construction of abuildings over time. Some of his work includes; Central Park, Museum of Modern Art etc.
Wesely secures a pinhole camera in place and leaves it in various places in the city for extended periods of time. This is the best and most literal example of a city changing and goes to show how much a city can change without you noticing.
This exemplifies the ‘city in flux’. It’s a great way to show the correlation between the city and time and how time is captured through the long exposure. The premise is extremely interesting but so time consuming when on the scale Wesely is on.
Dresdner Bank, Frankfurt, 3 year exposure, taken from Wesely’s book ‘open shutter’
Central Park, 1 year exposure, taken from Wesely’s book ‘open shutter’

2
Slinkachu
“The street based side of my work plays with the notion of surprise and I aim to encourage city-
dwellers to be more aware of their surroundings. The scenes I set up...aim to reflect the loneliness and melancholy of living in the big city, almost
being lost and overwhelmed.”
Slinkachu
Slinkachu is a London based photographer that uses miniature models to depict small scenes around the city. Normally they are quite comedic, what enchants me about his work is the use of everyday litter that he’s found around the street, for example the Marlboro packet with the cigarette butt. The image is quite funny but it’s the clever use of litter and props with the models help to make this a successful piece. Slinkachu makes a comment on how minuscule our existence is within the city and how everyday the city is changing around us.
The use of litter is something I definitely would like to investigate into, I find it fascinating to think about some pieces of litter and why someone would throw away different items.
3
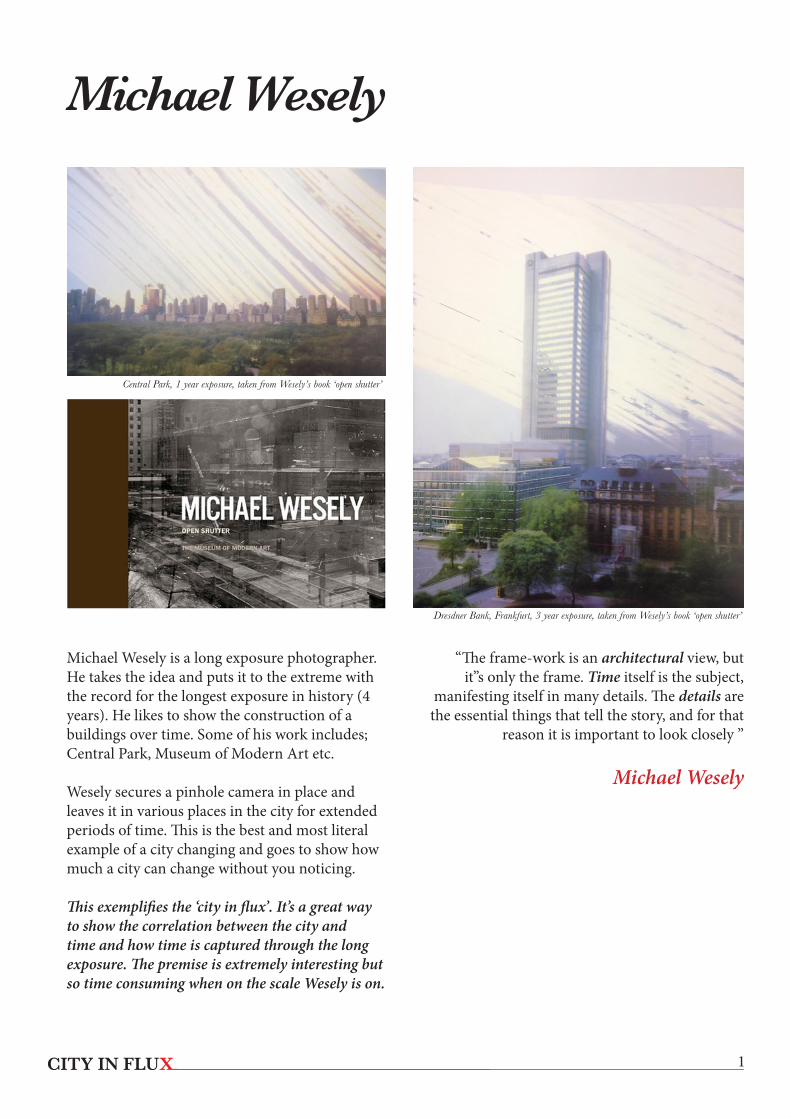
Chris Jordan
“Each image portrays a specific quantity of something...My hope is that images representing
these quantities might have a different effect than the raw numbers alone...Statistics can feel
abstract, making it difficult to connect with and make meaning of...This project visually examines these vast and bizarre measures of our society, in
large intricately detailed prints assembled from thousands of smaller photographs”
Chris Jordan
Chris Jordans work is another example of someone giving a statement using litter. Like Wesely though he’s taken it to the extreme and used thousands of pieces in each artwork. The examples I’ve given are not even the biggest. The first body of work produced in this style was a comment on different statistics in US. The cigarette butts piece (see above) is the depiction of the amount of cigarettes that are smoked and discarded every 15 seconds in the US.
I like the balance of art work and interesting facts which make these pieces really exceptional. They show just how much litter is and how much we don’t care about the environment around us.
The artwork is incredibly detailed and intricate, I like the use of objects to depict another image. This unfortunately depicts the city going through an ugly and dirty stage of change.
Return of the Dinosaurs, John Sibbick, made from 240,000 plastic bags
Made from 139,000 cigarette butts (see below)

4
I Am Legend
I Am legend is a fictional film based on a novel of the same name. In the film the worlds population has been turned into vampires. Only one man remains in the city. The city is derelict and is overgrown.
I have an idea to introduce nature into my chosen city through photoshop. I like the idea of something being so untouched that nature grows from it. It’s also a dark future and the city really helps with the films bleak atmosphere.
“We didn't want to make an apocalyptic movie where the landscape felt apocalyptic. A lot of
the movie takes place on a beautiful day. There's something magical about the empty city as opposed
to dark and scary that was the ideal that the cast and crew wanted."
Francis LawrenceDirector of I Am Legend
5
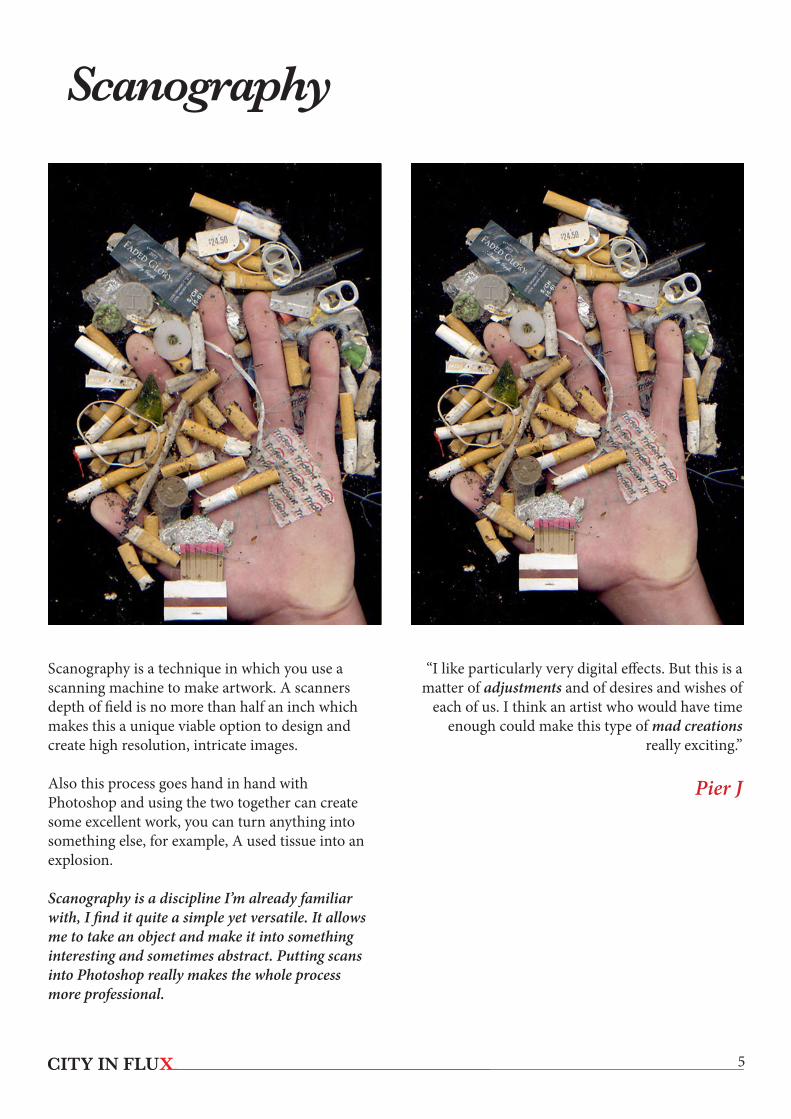
Scanography
“I like particularly very digital effects. But this is a matter of adjustments and of desires and wishes of
each of us. I think an artist who would have time enough could make this type of mad creations
really exciting.”
Pier J
Scanography is a technique in which you use a scanning machine to make artwork. A scanners depth of field is no more than half an inch which makes this a unique viable option to design and create high resolution, intricate images.
Also this process goes hand in hand with Photoshop and using the two together can create some excellent work, you can turn anything into something else, for example, A used tissue into an explosion.
Scanography is a discipline I’m already familiar with, I find it quite a simple yet versatile. It allows me to take an object and make it into something interesting and sometimes abstract. Putting scans into Photoshop really makes the whole process more professional.
6
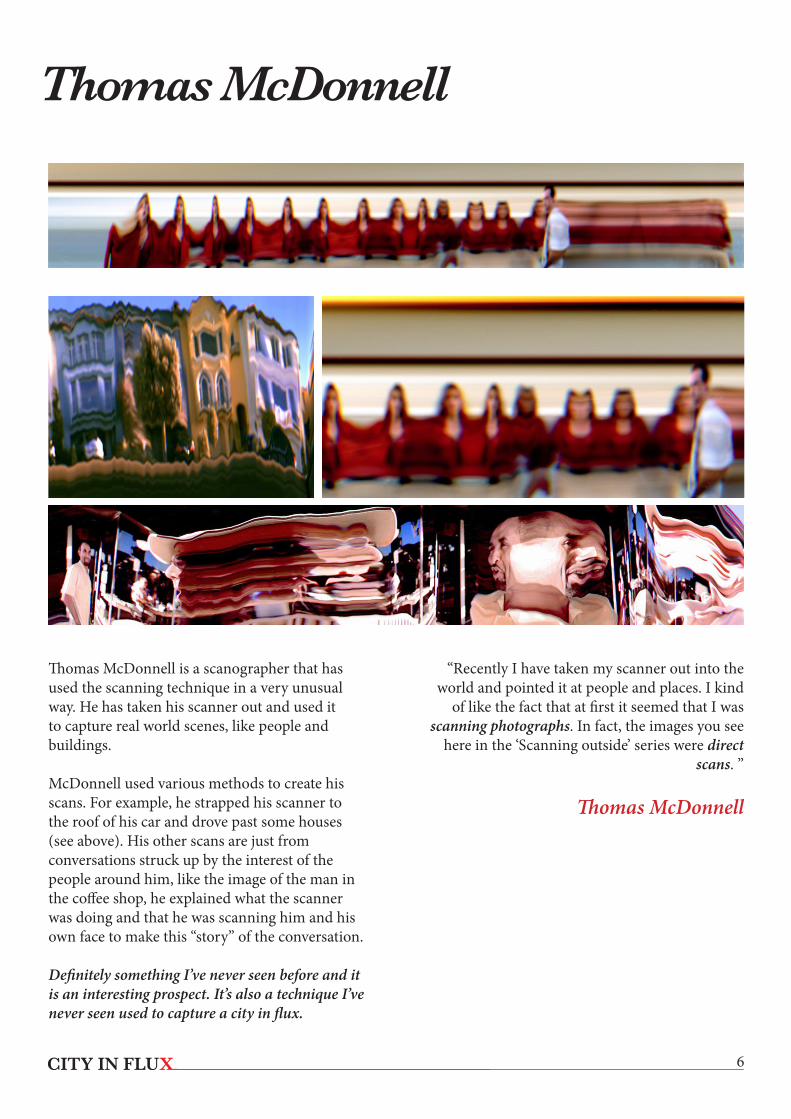
Thomas McDonnell
“Recently I have taken my scanner out into the world and pointed it at people and places. I kind
of like the fact that at first it seemed that I was scanning photographs. In fact, the images you see
here in the ‘Scanning outside’ series were direct scans. ”
Thomas McDonnell
Thomas McDonnell is a scanographer that has used the scanning technique in a very unusual way. He has taken his scanner out and used it to capture real world scenes, like people and buildings.
McDonnell used various methods to create his scans. For example, he strapped his scanner to the roof of his car and drove past some houses (see above). His other scans are just from conversations struck up by the interest of the people around him, like the image of the man in the coffee shop, he explained what the scanner was doing and that he was scanning him and his own face to make this “story” of the conversation.
Definitely something I’ve never seen before and it is an interesting prospect. It’s also a technique I’ve never seen used to capture a city in flux.

7
Nicholas Felton
“My chief concern is that the finished graphic be highly scannable and easily digested. For me, this means the elimination of complicated keys
and fiddly connections between labels and items. Relationships should be as direct and unadorned as possible and free of unnecessary design flourishes.”
Nicholas Felton
Nicholas Felton has produced some incredible infographics. The way he presents his annual reports is something spectacular. I love the background colour, it looks like a black with film over it. I also like the futuristic approach to the statistics. Everything looks space age and advanced but when you read the information it is easy to understand.
Infographics are a great way of showing a city in flux. They can document everything that goes on in the city and the people that live there. Each city has different statistics and no city is the same, so looking at this type of information can be really useful in understanding how the city changes and how that effects us.

8
Typography
As proven here type is still something that you can create an intricate shapes and images with and is still a good way to show a city in flux. The London bridge image is proof of some Graphic Design work that represents everything fun to do in London. (Other two examples were made by me).
This piece is particularly clever, I really like this technique and think it works really well to convey a message about a desired subject, in this instance its London bridge. The image was made to showcase all the events and attractions at London for example; London Eye.
Typography is another interesting way to design. It’s a great interest of mine and part I find most difficult about designing. The right or wrong font can make or break your work and it’s important to make a conscious decision when deciding on what to choose.
9
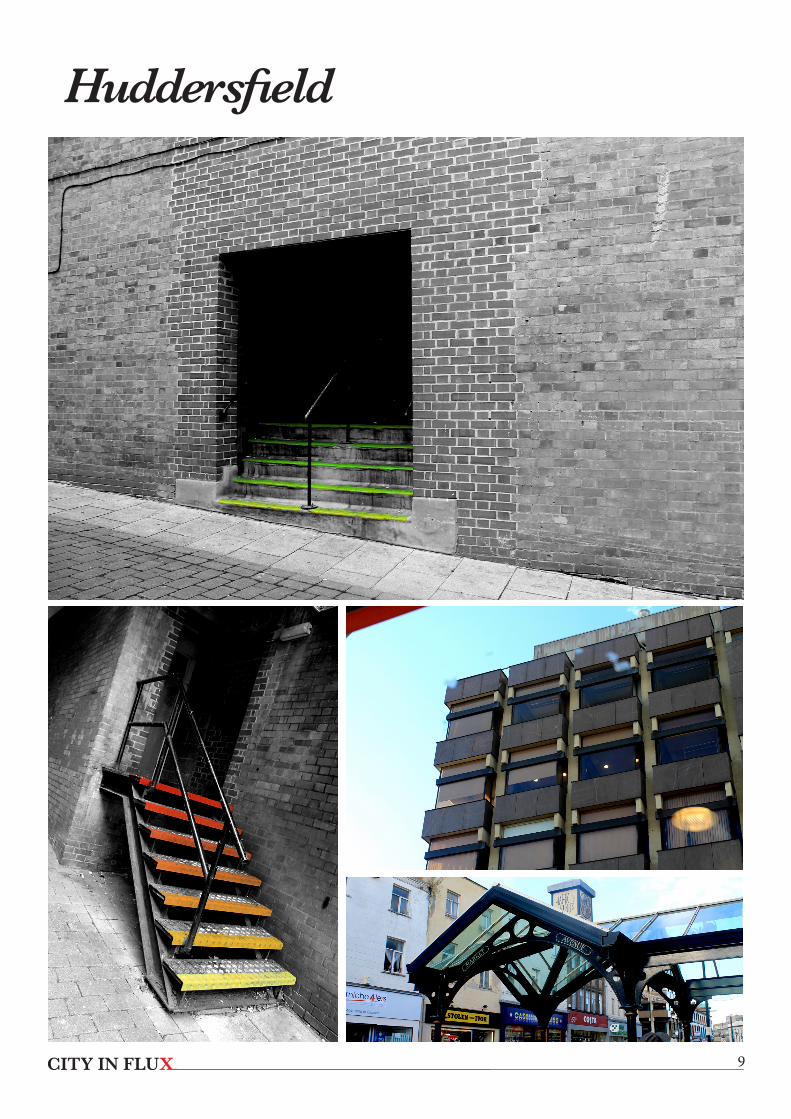
Huddersfield
10
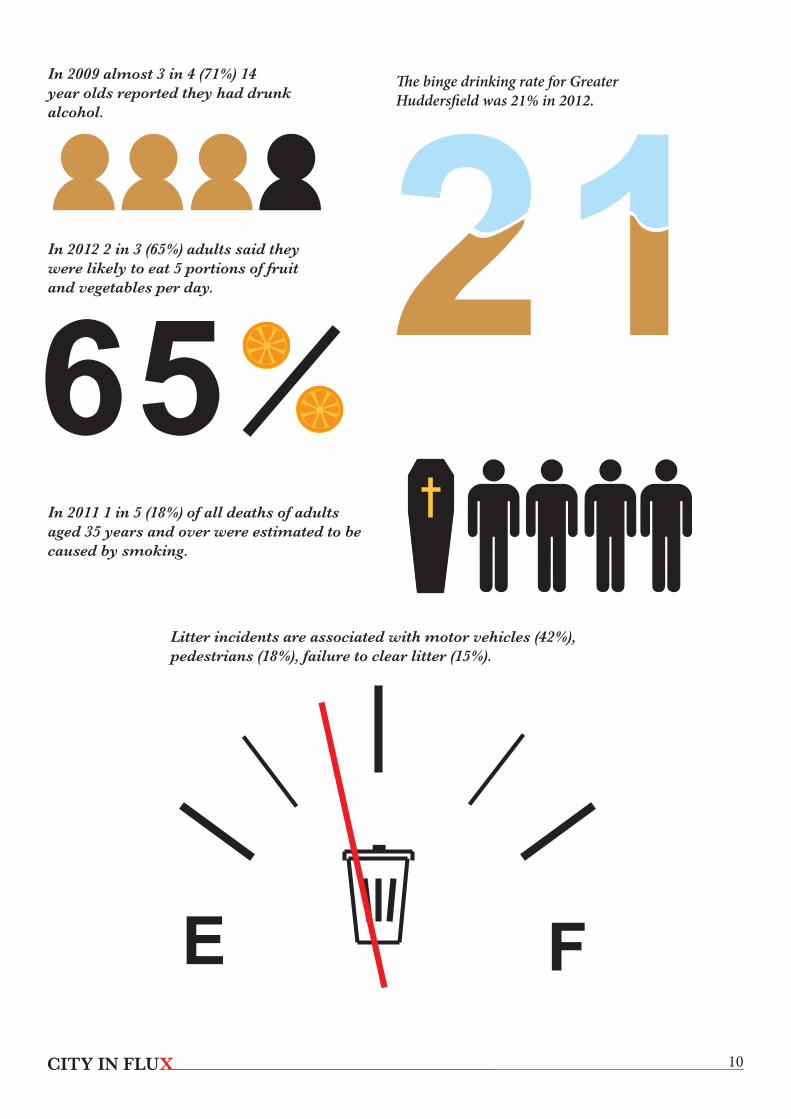
In 2009 almost 3 in 4 (71%) 14 year olds reported they had drunk alcohol.
In 2009 almost 3 in 4 (71%) 14 year olds re-ported they had drunk alcohol.
In 2012 2 in 3 (65%) adults said they were like-ly to eat 5 portions of fruit and vegetables per
65was 21% in 2012
Litter incidents are associated with motor vehicles (42%), pedestrians (18%), failure to clear litter (15%).
E F
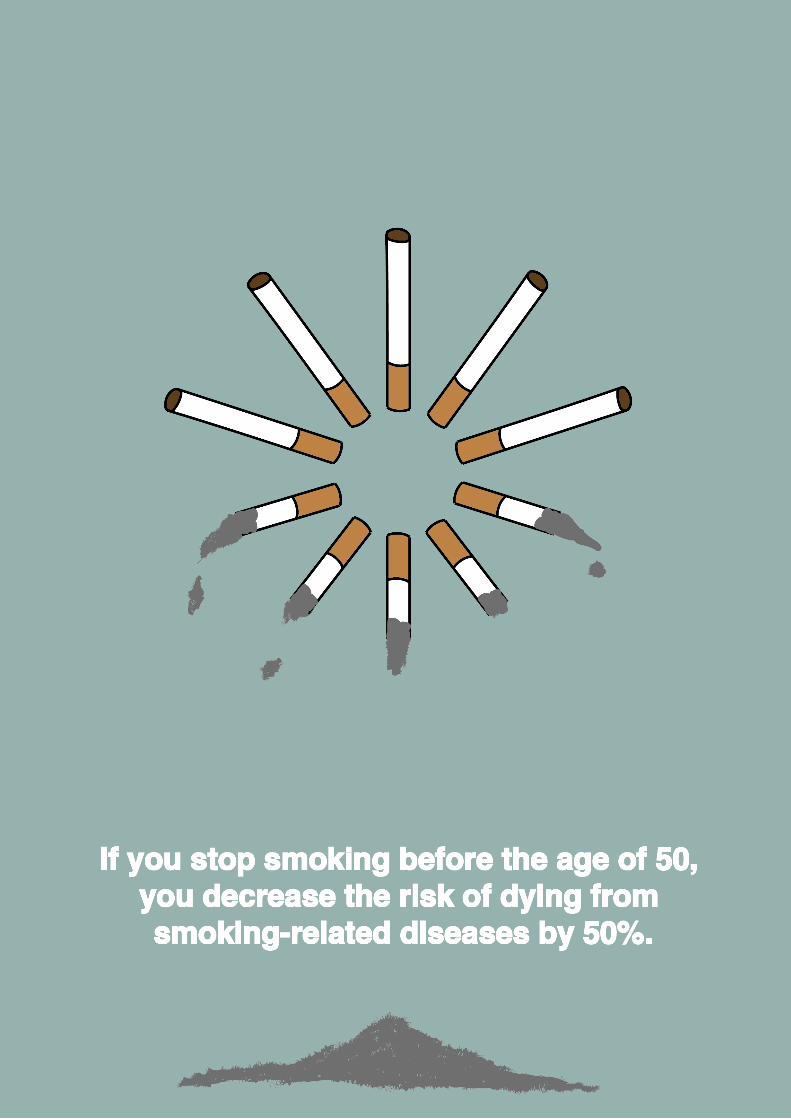
In 2011 1 in 5 (18%) of all deaths of adults aged 35 years and over were estimated to be caused by smoking.
In 2009 almost 3 in 4 (71%) 14 year olds re-ported they had drunk alcohol.
In 2012 2 in 3 (65%) adults said they were like-ly to eat 5 portions of fruit and vegetables per
65was 21% in 2012
Litter incidents are associated with motor vehicles (42%), pedestrians (18%), failure to clear litter (15%).
E F
In 2011 1 in 5 (18%) of all deaths of adults aged 35 years and over were estimated to be caused by smoking.
In 2012 2 in 3 (65%) adults said they were likely to eat 5 portions of fruit and vegetables per day.
In 2009 almost 3 in 4 (71%) 14 year olds re-ported they had drunk alcohol.
In 2012 2 in 3 (65%) adults said they were like-ly to eat 5 portions of fruit and vegetables per
65was 21% in 2012
Litter incidents are associated with motor vehicles (42%), pedestrians (18%), failure to clear litter (15%).
E F
In 2011 1 in 5 (18%) of all deaths of adults aged 35 years and over were estimated to be caused by smoking.
Litter incidents are associated with motor vehicles (42%), pedestrians (18%), failure to clear litter (15%).
In 2009 almost 3 in 4 (71%) 14 year olds re-ported they had drunk alcohol.
In 2012 2 in 3 (65%) adults said they were like-ly to eat 5 portions of fruit and vegetables per
65was 21% in 2012
Litter incidents are associated with motor vehicles (42%), pedestrians (18%), failure to clear litter (15%).
E F
In 2011 1 in 5 (18%) of all deaths of adults aged 35 years and over were estimated to be caused by smoking.
In 2011 1 in 5 (18%) of all deaths of adults aged 35 years and over were estimated to be caused by smoking.
The binge drinking rate for Greater Huddersfield was 21% in 2012.
11
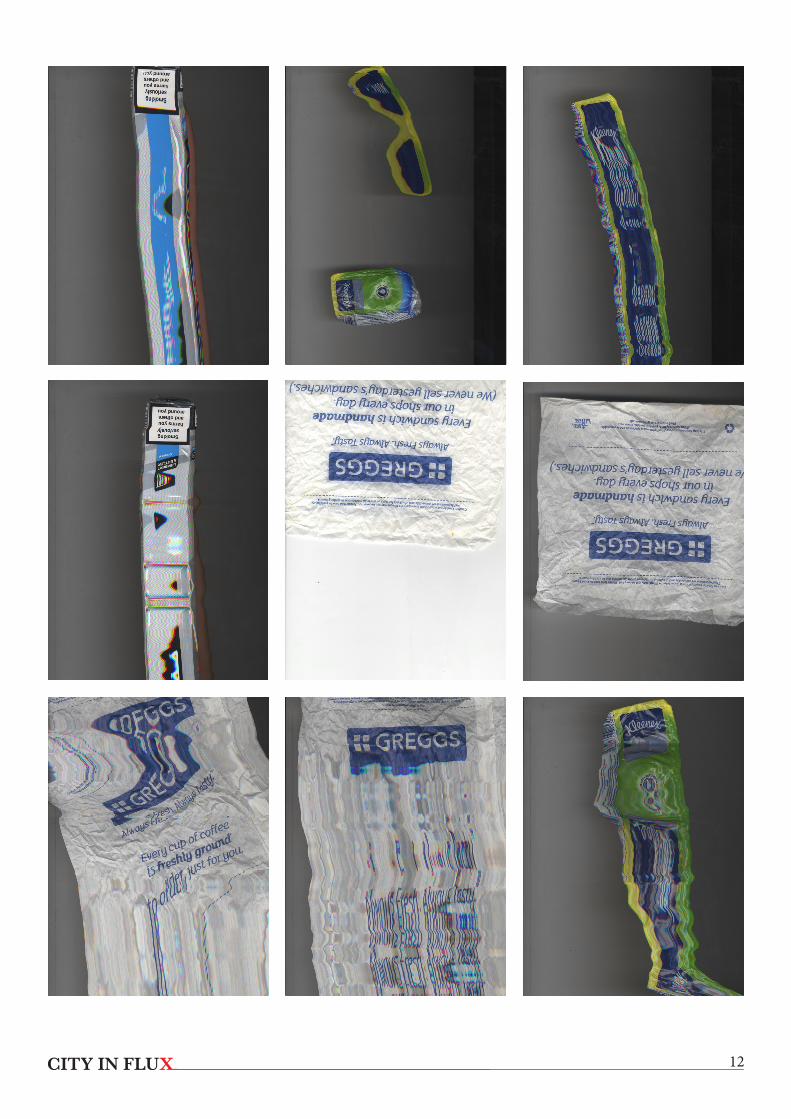
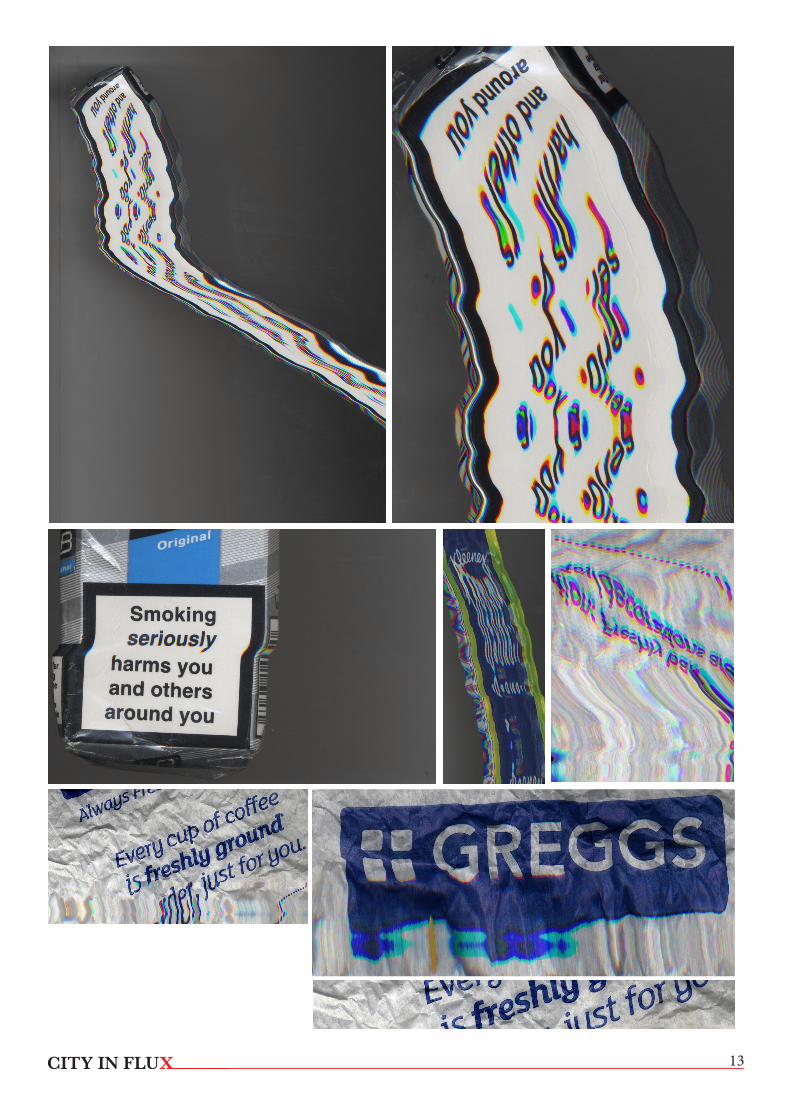
Concept 1- Scanography
Concept 1 is the idea to comment on some statistics I found interesting about Huddersfield and presenting them through the discipline of scanography.
I feel scanography is an effective and quirky way of showcasing statistics and hope to prove this in my experimentation. I find that when producing scannergrams some parts can look really interesting and unique so I will be cropping some of my experimentation on parts that I think look particularly intriguing.
From my research I drew great inspiration on the concept from Chris Jordan, his presentation of facts about Amercia is such a creative format I wanted to produce something similar using my favourite technique.
I aim to collect certain things I and friends have found around the city and relate it to a relevant fact, scan it in various different positions until I produce something I can edit in Photoshop.
Statistics are accurate facts that prove that any city is in flux. With the constant changing of the city around them the populus will change with it; Opinions, Attitudes, Happiness, Depression etc.
Statistics are a measurement of a city in flux“ ”
12
”
13

14
15
Concept 2- Grass in Greener
Concept 2 is my idea to look into what would happen if the huddersfield population suddenly abandoned the city and left it for 30 years. I want to represent what I would think it would look like in my mind. I like the idea of something that was once so busy and alive, to be so desolate and quiet. I aim to use photoshop to create the desired effect I want to produce.
I was inspired by “I Am Legend” as I loved the way they made an iconic city like New York City to look so empty and untouched. They used nature and wildlife to show this. I would like to use a similar effect.
It’s a really good way to send a message about the preservation of our city and how we have to look after it.
I excited about this concept because I haven’t had chance to use Photoshop in a challenging sense so far. I would love to learn new techniques that will help me towards producing something great for this concept.

16
Concept 3- Long Exposure
Concept 3’s sole inspiration is Michael Wesely. Ever since I saw his first piece I’ve been extremely interested to experiment with long exposure. It’s something that is totally new to me but Wesely does reap the rewards from it.
It’s also a great discipline to show a City in Flux, it captures the city over a period of time, even a short exposure catches something because the city is literally changing around us.
I know I don’t have time and money to produce the great feats of Michael Wesely’s long exposure times, but I would like to produce at least a couple of long exposures and experiment with what I can do with them.

17
The population of Huddersfield area is currently approximately 423,000.
The University of Huddersfield has over 21,000 students from over 120 countries - many of whom choose to stay in the area once they graduate
21% of the Huddersfield population are from a minority ethnic background.
There are 2,300 businesses in the creative and digital sector.
A total of 13,930 employers are based within the Huddersfield area, employing 150,200 individuals.
In fact the area lies third in the UK, behind Birmingham and Leeds, for the largest manufacturing employment base in the country, with 32,000 jobs in the industry.
here are over 500 business, retail and industrial parks across the Huddersfield area
93.5% of Huddersfield graduates had found jobs or had moved on to further study within six months of leaving the university.
The binge drinking rate for Greater Huddersfield was 21% in 2012.
In 2011 1 in 5 (18%) of all deaths of adults aged 35 years and over were estimated to be caused by smoking.
Litter incidents are associated with motor vehicles (42%), pedestrians (18%), failure to clear litter (15%).
Huddersfield Statistics
18
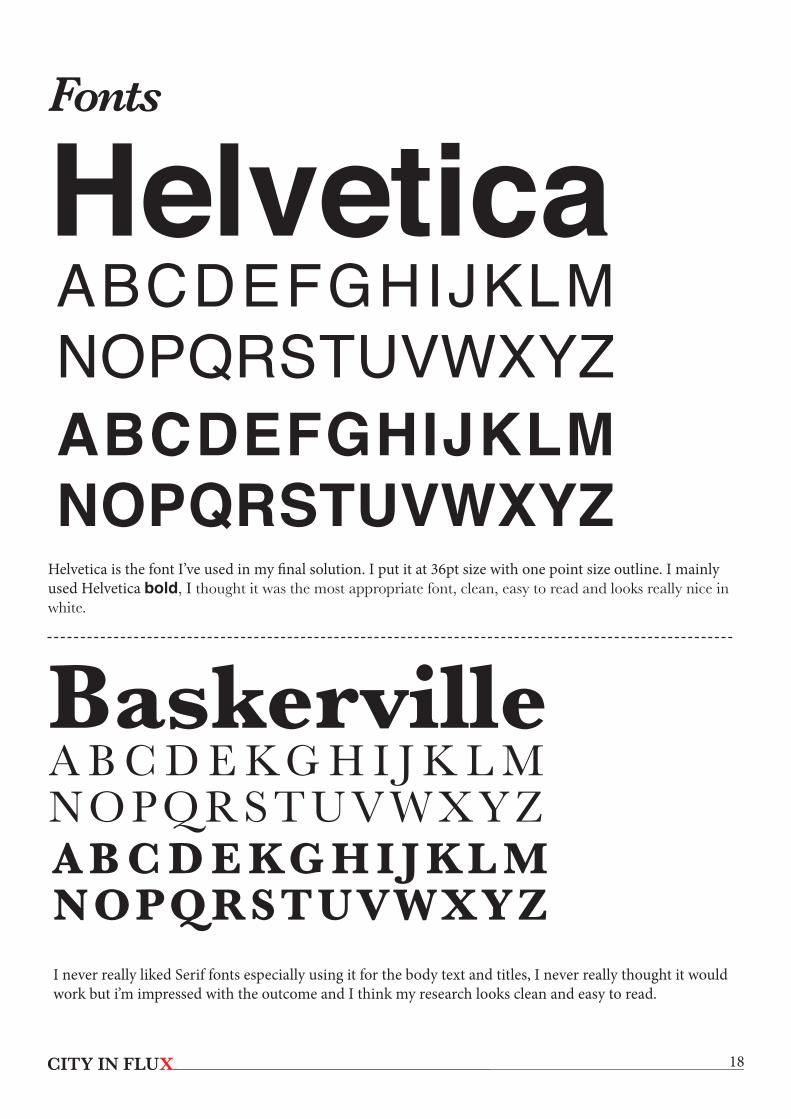
Fonts
Helvetica
Baskerville Helvetica is the font I’ve used in my final solution. I put it at 36pt size with one point size outline. I mainly used Helvetica bold, I thought it was the most appropriate font, clean, easy to read and looks really nice in white.
ABCDEFGHIJKLMNOPQRSTUVWXYZ
ABCDEFGHIJKLMNOPQRSTUVWXYZ
A B C D E K G H I J K L MNOPQRSTUVWXYZ
A B C D E KG H I J K L MNOPQRSTUVWXYZ
I never really liked Serif fonts especially using it for the body text and titles, I never really thought it would work but i’m impressed with the outcome and I think my research looks clean and easy to read.
19
Concept 4 is the idea of presenting information, facts and statistics, similar to concept 1 but with a different final outcome. I would like to present my findings and my designs in a Concertina. During my experimentation period I thought I’d try to produce some infographics (previously unknown territory) and thoroughly enjoyed it. I’ve always had a interest in reading statistics and love to see new ways people are presenting information. Also after looking at Nicholas Felton’s work and it really inspired to me to produce my own.
I want to do a concertina because it’s a fun, unique and interesting way of presenting infographics and it’s not been done before.
Concept 4- Infographic Concertina
2

1