City Centre West Housing Market Profile - Sheffield Centre West Housing Market Profile This profile...
49
City Centre West Housing Market Profile This profile contains information about the population, housing stock, market performance and demand for housing in the City Centre West HMA. The Housing Market Area Profiles have been developed as a guide for future housing delivery on sites located across the city. The profiles offer recommendations on the housing that would be suitable to meet the current need in the area and diversify the stock that is available in order to attract households to the area. The profiles also provide useful evidence and data on the population and housing levels across Sheffield which can be utilised in other reports and publications. This HMA data is compared with the Sheffield average to put the area in the wider context of the city. The data used in this profile is from a number of sources, including the 2011 Census, 2013 Strategic Housing Market Assessment (SHMA), Experian, Council data and Land Registry sales. The SHMA data is based on a household survey of a statistically representative sample of 3,363 households living in Sheffield and accords well with the spatial, tenure & demographic profile of the city. Prior to the analysis the data was weighted by household type to ensure that it is representative as possible thus compensating for non-response bias. More information on the data can be found in the sources section of the profiles. A summary of the City Centre West profile, including the housing recommendations for the area can be found here (add link) The profile includes the following sections: Section 1 - Area description: A description of the neighbourhoods within the HMA Section 2 - Household profile: Demographics of the population and the households in the HMA Section 3 - Economic profile: Employment and incomes Section 4 - Housing profile: Current housing available, including the type, size, tenure and adequacy of the housing Section 5 - Neighbourhood profile: Neighbourhood satisfaction, crime and educational attainment Section 6 - Recently moved to HMA: People who have moved into the HMA and the reasons for this Section 7 - Supply from moving households: Supply of housing that might become available in the HMA by households moving in the next 5 years Section 8 - Demand from existing households: Future demand for housing from existing households planning to move to the HMA, including demand for different types, sizes and tenures of home Section 9 - Existing households that could not move in the last 5 years and the reasons why Section 10 - Newly forming households: Demand for housing from new households who may form in the next 5 years Section 11 - Supply and Demand balance - Details about the estimated supply of housing in the HMA, and how this matches with demand. Identifi es shortfalls or surpluses of different sizes and tenures of homes to act as a guide for development. Section 12 - Social rented market: Details of the social housing stock and turnover Section 13 - Home ownership market: Average house prices, property sales, completions and the income required to afford to buy a property Section 14 - Private rented market: Average private rents and the income required to afford to rent a home Section 15 - Housing affordability - Level of income spent on housing costs, difficulties affording housing costs and housing benefit claimants Section 16 - Older people's accommodation: Supply of older people's accommodation and the demand for this in the HMA Section 17 - Care and support needs: Disabled households and the demand for adaptations, and care and support from the SHMA Section 18 – Summary: Brief conclusions drawing out the key points from the sections. Section 19 – Housing recommendations: Recommendations on the types of housing that is needed in the area to meet demand and attract households to the area. 1
Transcript of City Centre West Housing Market Profile - Sheffield Centre West Housing Market Profile This profile...

City Centre West Housing Market Profile
This profile contains information about the population, housing stock, market performance and demand for housing in the City Centre West HMA. The Housing Market Area Profiles have been developed as a guide for future housing delivery on sites located across the city. The profiles offer recommendations on the housing that would be suitable to meet the current need in the area and diversify the stock that is available in order to attract households to the area. The profiles also provide useful evidence and data on the population and housing levels across Sheffield which can be utilised in other reports and publications. This HMA data is compared with the Sheffield average to put the area in the wider context of the city. The data used in this profile is from a number of sources, including the 2011 Census, 2013 Strategic Housing Market Assessment (SHMA), Experian, Council data and Land Registry sales. The SHMA data is based on a household survey of a statistically representative sample of 3,363 households living in Sheffield and accords well with the spatial, tenure & demographic profile of the city. Prior to the analysis the data was weighted by household type to ensure that it is representative as possible thus compensating for non-response bias. More information on the data can be found in the sources section of the profiles. A summary of the City Centre West profile, including the housing recommendations for the area can be found here (add link) The profile includes the following sections: Section 1 - Area description: A description of the neighbourhoods within the HMA Section 2 - Household profile: Demographics of the population and the households in the HMA Section 3 - Economic profile: Employment and incomes Section 4 - Housing profile: Current housing available, including the type, size, tenure and adequacy of the housing Section 5 - Neighbourhood profile: Neighbourhood satisfaction, crime and educational attainment Section 6 - Recently moved to HMA: People who have moved into the HMA and the reasons for this Section 7 - Supply from moving households: Supply of housing that might become available in the HMA by households moving in the next 5 years Section 8 - Demand from existing households: Future demand for housing from existing households planning to move to the HMA, including demand for different types, sizes and tenures of home Section 9 - Existing households that could not move in the last 5 years and the reasons why Section 10 - Newly forming households: Demand for housing from new households who may form in the next 5 years Section 11 - Supply and Demand balance - Details about the estimated supply of housing in the HMA, and how this matches with demand. Identifies shortfalls or surpluses of different sizes and tenures of homes to act as a guide for development. Section 12 - Social rented market: Details of the social housing stock and turnover Section 13 - Home ownership market: Average house prices, property sales, completions and the income required to afford to buy a property Section 14 - Private rented market: Average private rents and the income required to afford to rent a home Section 15 - Housing affordability - Level of income spent on housing costs, difficulties affording housing costs and housing benefit claimants Section 16 - Older people's accommodation: Supply of older people's accommodation and the demand for this in the HMA Section 17 - Care and support needs: Disabled households and the demand for adaptations, and care and support from the SHMA Section 18 – Summary: Brief conclusions drawing out the key points from the sections. Section 19 – Housing recommendations: Recommendations on the types of housing that is needed in the area to meet demand and attract households to the area.
1

Section 1: Area description
The City Centre West Housing Market Area stretches west from the City Centre inner ring road towards the north-west neighbourhoods of Crookes and Walkley. The area is dominated by Victorian and inter-war terraced houses and semi-detached properties. The area also contains a number of council estates predominately situated in the tower blocks at Highfield and Upperthorpe. Although the area contains some of the most popular neighbourhoods in Sheffield, benefitting from the proximity to the universities and hospitals, it also contains some of the city’s most deprived neighbourhoods. The HMA also has a large private rented market, popular with students and young professionals. Students living in high density accommodation and on the university fringe next to older residents in cosmopolitan locations make up a large proportion of the City Centre West's households, along with professional singles and couples in their 20s and 30s, . The area also has significant numbers of older residents living in inner suburban properties and more affluent couples and families enjoying the easy access to city centre life this area offers. Currently, development sites with the potential to deliver 5,000 dwellings have been identified. Most of these sites are on brownfield land and have capacity for more than 25 dwellings. The area contains the neighbourhoods of: Broomhall – is a conservation area which is situated just west of the ring road on the edge of the City Centre. The housing is divided into three zones including social rented properties adjacent to the ring road on the Hanover estate, Victorian villas in the conservation areas and terraces further west, and new-build flats and apartments to the south east. The population of Broomhall includes students and many different BME groups, in particular a substantial Somali community, focussed at Hanover flats. Broomhill – is a conservation area that is located a mile west of the City Centre. It is home to major hospitals and to Sheffield University, and near to Botanical Gardens. The A57 Glossop Road which runs through the area is a major radial transport routes for the city leading to suburban areas and Derbyshire. Students make up the majority of the community, especially during term time exerting housing pressure on private rented accommodation. Crookes – Crookes lies around 2 ½ miles from the City Centre close to the University of Sheffield and Sheffield hospitals. The area has a high population density and attracts large numbers of students mainly living in multiple-occupancy privately-rented accommodation. The majority of houses are privately owned late Victorian and Edwardian terraces. The district shopping centre, situated along the main Crookes Road offers a wide range of shops, but does experience problems with traffic and parking. The neighbourhood benefits from its close proximity to the green belt with green space found at both Clough Fields and the Bolehills, which has spectacular views and forms the boundary with the Walkley Bank neighbourhood. Crookesmoor – is located 1 mile west of the City Centre, Crookesmoor is situated close to the universities and hospitals making it popular with students and medical professionals. The majority of the housing stock in this area is Victorian. There are a range of sizes and styles of properties, predominantly in private ownership. Many of the larger properties have been sub-divided into apartments for student use. The area has good access to the public green spaces such as Crookes Valley Park and leisure facilities provided by the universities. Crosspool - is a suburban neighbourhood, located high above the Rivelin Valley 2 ½ miles from the City Centre. The A57 Manchester Road, one of the city's main arterial routes, runs through the neighbourhood, end route to Glossop and Manchester. Crosspool is a popular suburb with excellent access to the countryside and a shopping centre offering a mix of shops and restaurants. It comprises mainly of owner-occupied inter-war semi-detached properties and multi occupancy private rented accommodation catering for students, graduates and medical professionals.
2

Endcliffe – runs west from a line around 1 mile west-south-west of the City Centre, between Ecclesall Road and Clarkehouse Road, to a point west of the A57 Manchester Road in the grounds of Tapton School. Attractive and very green, Endcliffe has good shops and amenities nearby and contains the Botanical Gardens and Endcliffe Park; a substantial green space which has many facilities and direct links to the Peak District. The neighbourhood contains a varied mix of housing types from grand Victorian villas to 1960's and 1970's flats and a large student village owned by the University of Sheffield. Heeley - lies immediately to the north of Meersbrook Park, and 1½ miles south of the City Centre. The neighbourhood is bordered to the west by the Sheffield to London railway line, and extends south eastwards up the Meersbrook Valley. Heeley has a range of housing types, including larger brick built terraces and substantial Victorian homes overlooking the park. Tenure is mixed with some newer social housing available in the north west of the neighbourhood and significant proportions of privately rented properties as well as owner occupied homes. There is an extensive range of shops and services available along the London Road and light industrial and retail units in Heeley Bottom. Highfield - is situated adjacent to the City Centre inner ring road with Bramall Lane, home of Sheffield United FC, at the heart of the area. The area is densely and diversely populated, consisting mainly of terraced housing. Highfield also includes light industrial, wholesale and retail, with a strip of large stores along Queens Road. There is a large and well used community and conference centre at the former St Mary's Church and a hotel next to the football ground. High traffic volumes combined with very limited public green space, litter and graffiti problems impact heavily on the local environment. Nether Edge - is a conservation area that lies about a mile south-west of the City Centre. Predominantly residential, most houses are Victorian, with concentrations of early 20th Century brick terraces towards Abbeydale Road. Many properties are still divided and a large student population remains in the area whilst development pressures on potential sites are intense. There are also a number of commercial hotels located in larger converted properties. Residents living towards Abbeydale Road have good access to public transport and a range of amenities. Publicly accessible green space is limited despite the neighbourhood's leafy appearance. Sharrow - is less than a mile south-west of the City Centre and is one of Sheffield's most diverse neighbourhoods in terms of housing types and tenures, population, ethnicity and relative affluence. Housing includes grand Victorian villas, turn of the century red brick terraces and a concentration of 1960’s social housing on the Washington Estate. There are a number of neighbourhood facilities in Sharrow, including a library on London Road and the Old Sharrow Junior School. As well as many specialist shops and a diverse range of restaurants along London Road. A large student village has recently been built in this neighbourhood. Upperthorpe – lies 1 mile west of the City Centre and is known for its high-rise flats, maisonettes and the Birkendale area which consists of large Victorian villas. Upperthorpe is well serviced with facilities, which include a medical centre, post office, local shops, a Tesco, Healthy Living Centre, Victorian-era public baths and a library. Walkley – lies around 2 miles from the City Centre across a steep hillside with striking views over the Don Valley. It is densely populated, mainly consisting of Victorian terraced properties with some modern flats and bungalows. Most housing in Walkley is privately owned and popular as multi-occupancy rented accommodation for students, medical professionals and recent graduates, although there is some evidence that the student market in Walkley has shrunk in size. South Road provides the main focus for the Walkley neighbourhood with a range of shops and facilities, including a supermarket and library.
3
4

2. Household profile
Table 1 - Households and population
Figure 1 - Age Profile
CCW Sheffield
Households 36,106 229928
Population 96,457 552698
Average household size 2.67 2.40
Table 2 - Age profile
CCW CCW % Sheffield
0-14 11163 12% 17%
15-24 34783 36% 18%
25-34 16257 17% 14%
35-49 14695 15% 20%
50-64 10208 11% 16%
65-79 6419 7% 11%
80+ 2932 3% 4%
Total 96,457
Table 3 - Ethnic origin of household
CCW CCW % Sheffield
BME 25,995 27% 19%
Non-BME 70,246 73% 81%
The household profile data is from the Census 2011.
The City Centre West HMA (CCW) covers 6.1 square miles. The population in the CCW is younger than in Sheffield overall. More than a third of City Centre West HMA residents are 15 - 24 years of age, which is double the proportion citywide at 36% vs 18%. There are lower percentages of residents who are 35 or over, at 36% vs 52% and also fewer 0 - 14 year olds. This age spread is likely to be due to high densities of students and young professionals in the Broomhall, Broomhill, Highfield, Sharrow, Nether Edge, Endcliffe, Crookes and Walkley neighbourhoods. There is a higher proportion of BME residents in this HMA than citywide. The Broomhall, Highfield, Upperthorpe and Sharrow neighbourhoods have the largest BME populations. Part of this may be due to the large number of students in this HMA, as one fifth of all students in the city are international.
0%
5%
10%
15%
20%
25%
30%
35%
40%
0-14 15-24 25-34 35-49 50-64 65-79 80+
CCW Sheffield
5

Table 4 - Household type Figure 2 - Household type
CCW CCW % Sheffield
One person household 12061 35% 35%
Couple 5947 17% 19%
Couple with dependent
children
4859 14% 20%
Couple with non dependant
children
1084 3% 6%
Lone parent with dependant
children1634 5% 8%
Lone parent with non
dependant children 721 2% 3%
All full-time students 3870 11% 3%Other 4353 13% 7%
Total 34529
The proximity to the City Centre and proliferation of private rented housing make this HMA popular with young professionals and students. The two main student residences for the University of Sheffield are located within the Endcliffe neighbourhood and there are particularly high densities of student housing along Ecclesall Road, London Road and Shoreham Street, increasing the number of all student households in this HMA to 11% compared to 3%. The large amount of shared rented accommodation may account for the 13% of 'other' households. The number of one person and couple households are close to the city average, but there are far fewer households with dependent children. This reflects the younger adult profile of the area and may also be due to the large amount flats, which tend to be smaller with less outdoor space. 'The age profile (Table 2) shows a 'bulge' in the age profile in this area in the 15 - 35 age group, and the mosaic profile adds some more detail to this picture. 'Student scene' is the most numerous group, but there is also a significant population of younger people, such as the 'Career Builders' or 'Central Pulse' who work and who enjoy living in the vibrant neighbourhoods of the City Centre West. In addition to this there are significant populations of young families and of older households who are likely to look for a different offer in terms of housing and services to the younger demographic.
0%
5%
10%
15%
20%
25%
30%
35%
40%
On
e p
erso
n h
ou
seh
old
Co
up
le
Co
up
le w
ith
dep
en
den
tch
ildre
n
Co
up
le w
ith
no
n d
epen
dan
tch
ildre
n
Lon
e p
are
nt
wit
h d
epen
dan
tch
ildre
n
Lon
e p
are
nt
wit
h n
on
de
pe
nd
ant
child
ren
All
full-
tim
e st
ud
en
ts
Oth
er
CCW Sheffield
6

City Centre West's most numerous household types (Mosaic category)
CategoryNumber of
householdsDescription
Student Scene 8879 Students living in high density accommodation close to universities and educational centres
Learners & Earners 6963 Inhabitants of the university fringe where students and older residents mix in cosmopolitan locations
Career Builders 3628 Singles and couples in their 20s and 30s progressing in their field of work from commutable properties
Ageing Access 3070 Older residents owning small inner suburban properties with good access to amenities
Central Pulse 1303 Youngsters renting city centre flats in vibrant locations close to jobs and night life
Uptown Elite 1133 High status households owning elegant homes in accessible inner suburbs where they enjoy city life in comfort
Cafés and Catchments 1013 Affluent families with growing children living in upmarket housing in city environs
Midlife Stopgap 968 Maturing singles in employment who are renting short-term affordable homes
Primary Ambitions 837
High Rise Residents 812 Renters of social flats in high rise blocks where levels of need are significant
Mosaic' is Experian’s s consumer classification designed to help explain the demographics, lifestyles, preferences and behaviours of the UK adult population.
Forward-thinking younger families who sought affordable homes in good suburbs which they may now be out-growing
Section 2: Summary • The population in the CCW is much younger than the city average, with over half of residents being aged between 15 and 34 years old.
• There is a low overall proportion of households with dependent children. However the Mosaic profile does show that the CCW population includes a significant
number of, often affluent, households who would provide a market for family housing in the area.
• There is a high proportion of student and 'other' households which is likely to be due to the large number of students and shared houses.
7

3. Economic profileTable 5 - Working status CCW CCW % Sheffield
Full time employed 22284 28% 34%
Part time employed 7533 9% 14%
Self employed 4894 6% 7%
Unemployed 2786 3% 5% Figure 3 - Working status
Full-time student (employed) 10875 14% 6%
Retired 5436 7% 13%
Student (including full-time
students)20658 26% 11%
Looking after home or family 1919 2% 4%
Long-term sick or disabled 2243 3% 4%
Other 1299 2% 2%
Total 79927
Table 6 - Occupation CCW CCW % Sheffield
Professional occupations 12551 30% 20%
Associate professional and
technical occupations 565313% 11%
Elementary occupations 5324 13% 12%
Sales and customer service
occupations 451611% 10%
Administrative and secretarial
occupations 38659% 11%
Managers, directors and senior
officials 32058% 8%
Caring, leisure and other service
occupations 30857% 10%
Skilled trades occupations 2661 6% 11%Process plant and machine
operatives 1674 4% 7%
Total 42534
The information in Table 5 and 6 is from the 2011 Census.
0%
5%
10%
15%
20%
25%
30%
35%
40%
CCW Sheffield
Fewer people are in either full or part time employment in the CCW than citywide. The HMA has a large student population, wit h 2 in every 5 residents being a student. This is owing to the HMAs proximity to the two universities' main campuses making the City Centre and City Centre West HMAs particularly notable for being home to the majority of the city’s university students during term time. Due to the younger demographic of the HMA, there are nearly half the number of retired people compared to citywide (7% vs 13% ). People living in this HMA tend to work in professional sectors rather than in manual and entry level jobs. This may be due in part to the proximity to the two universities and Hallamshire Teaching Hospital.
8

Table 7 - JSA Claimants
CCW Sheffield
Total number of claimants 990 8540
% of working population
claiming JSA1.4% 2.3%
Figure 4 - Average household incomes by Wards in the CCW
Table 8 - Proportions of households by income band (%)
CCW Sheffield
Median average income £27,337 £27,230
<£10,000 20% 11%
£10,000-£14,999 14% 15%
£15,000-£19,999 9% 11%
£20,000-£24,999 11% 14%
£25,000-£29,999 11% 11%
£30,000-£39,999 13% 16%
£40,000-£49,999 9% 10%
£50,000-£59,999 5% 6%
£60,000-£74,999 4% 4%
£75,000+ 3% 3%
- JSA data is the December 2016 claimant rate from the Office of National Statistics, and also includes people who claim Universal Credit for reason of unemployment. - The income data in Table 8 and Figure 4 is from Mosaic 2016.
The median income in the CCW is similar to citywide, but a high proportion of households earning under £10,000 which are likely to be students. Median incomes vary significantly by ward. Crookes and Crosspool has a much higher median income at £32,538 compared to City at £27,230. Students generally have lower than average incomes, which is reflected in the lower incomes in the City ward where many students reside.
The JSA claimant rate is lower in this area which reflects the high proportion of students. Those on lower incomes who would be eligible for Housing Benefit may choose to live in other HMAs where private rented accommodation is more affordable.
The SHMA asked homeowners how much equity they thought they had in their property and this is shown in Table 9. Table 10 is the level of savings all existing households said they have regardless of the tenure they live.
£-
£5,000
£10,000
£15,000
£20,000
£25,000
£30,000
£35,000
Broomhill &Sharrow
Vale
City Crookes &Crosspool
NetherEdge &
Sharrow
Sheffield Walkley
Wards
9

Table 9 - Equity of existing households
CCW % Sheffield
Negative Equity 0% 2%
Up to £9,999 3% 5%
£10,000-£24,999 3% 5%
£25,000-£49,999 7% 9%
£50,000-£99,000 16% 23%
£100,000-£149,999 20% 23%
£150,000-£249,999 27% 21%
£250,000-£349,000 13% 7%
£350,000+ 11% 5%
Table 10 - Savings of existing households
CCW % Sheffield
Up to £4,999 44% 45%
£5,000-£9,999 13% 14%
£10,000-£14,999 8% 8%
£15,000-£19,999 4% 5%
£20,000-£24,999 4% 4%
£25,000-£29,999 4% 4%
£30,000-£39,999 2% 3%
£40,000-£49,999 3% 3%
£50,000-£74,999 3% 3%
£75,000 15% 12%
No homeowners in the CCW said they were in negative equity, compared to 2% citywide and nearly double the citywide proportion have equity of £250k or more, which suggests a strong housing market. This reflects the large number of high value properties in the area where the significant increase in house prices over the last 20 years has resulted in many homeowners having significant equity in their property. House prices in the CCW have risen by 20% between 2010 - 2016.
The savings of households in the CCW are comparable to citywide, with nearly half of households having less than £5,000, although it needs to be taken into account that the majority of student households will have little or no savings. Those households with limited savings will have limited choices if they are looking to buy a typical property in the more expensive neighbourhoods in the CCW, such as; Crosspool, Endcliffe, Walkley and Nether Edge. They will therefore need to look in the more affordable neighbourhoods or for a smaller properties in the area. The slightly above average income levels of those in this area results in a greater proportion of households having savings of £75,000 or more. This makes it possible for households to save extra funds for a deposit to buy a property and enables them to purchase higher end properties at favourable lending rates.
Section 3: Summary The area's Median income is similar to citywide at around £27,000. There is a lower proportion of people in full or part time employment than citywide. This will be due to the high proportion of full time students in the
HMA, 40% of the population. 55% of households have an income of less than £25,000, slightly more than the 51% citywide figure. There is a lower proportion of unemployed people and JSA claimants in this HMA, owing to the high number of students. The main occupation is professional and there are lower numbers of people in manual or service roles. No households were in negative equity at the time of the 2013 SHMA, reflecting the strong housing market in the area.
10

4. Housing profile Figure 5 - Property type
Table 11 - Property types in area
CCW CCW % Sheffield
Detached House/Bungalow 3135 9% 14%
Semi-Detached House/Bungalow 7159 20% 37%
Terraced House 13565 38% 27%
Flat, Maisonette or Apartment 11818 33% 21%
Other 6 0% 0%
Shared Dwelling 423 1% 0%
Total 36106
Table 12 - Housing tenures in area Figure 6 - Property tenure
CCW CCW % Sheffield
Owned 16377 45% 58%
Shared Ownership 189 1% 0%
Council rent 4012 11% 18%
RP rent 2237 6% 7%
Private rent 12901 36% 16%Other 390 1% 1%
Total 36106
The information on the housing profile is from the 2011 Census
0%
5%
10%
15%
20%
25%
30%
35%
40%
Det
ach
edH
ou
se/B
un
galo
w
Sem
i-D
etac
hed
Ho
use
/Bu
nga
low
Terr
aced
Ho
use
Flat
, Mai
son
ette
or
Ap
artm
ent
CCW Sheffield
0%
10%
20%
30%
40%
50%
60%
70%
Owned Council rent RP rent Private rent Other
CCW Sheffield
Terraced housing is the most common property type in the CCW and makes up over a third of all accommodation in the Walkley, Crookes, Crookesmoor and Nether Edge neighbourhoods. Much of the terraced housing in higher value neighbourhoods of this HMA is larger than in other areas of the city, with many properties being of stone rather than brick construction. Flats are the second most frequent type, making up a third of all properties. Again, this type of accommodation is more prolific in some neighbourhoods, particularly Highfield and Upperthorpe where a number of council owned tower blocks are situated, and Broomhall, Broomhill and Crookesmoor where there are a number of high density Purpose Built Student Accommodation developments. Additionally a number of flats above commercial properties or within subdivided larger houses in this HMA. There is a smaller proportion of detached and semi-detached family housing in the area. These properties tend to be located in the outlying neighbourhoods such as Crosspool, Endcliffe and Lodgemoor. This means that they are popular with families and can command higher prices than the city average for the same property types.
11

Table 13 - Size of homes in area
Figure 7 - Number of bedrooms
Number of bedrooms CCW CCW % Sheffield
0 beds 112 0% 1%
1 bed 6402 18% 31%
2 bed 8171 23% 37%
3 bed 12040 33% 29%
4 or more bed 9381 26% 2%
Total 36106
Table 14 - Vacancy and turnover levels
CCW CCW % Sheffield
Number of properties 41471 247234
Number of vacant properties 929 2.2% 1.8%
Long term vacant properties 453 1.1% 0.8%
0%
5%
10%
15%
20%
25%
30%
35%
40%
1 bed 2 bed 3 bed 4 or more bed
CCW Sheffield
The information in Table 14 about vacant properties is taken from data on the Council Tax Register December 2016. 'Long term vacant properties' is defined as those that have been vacant for 6 months or more.
The most common tenure in this area is home ownership, but this is lower than citywide at 45% vs 58%. Sheffield's private rented sector is particularly concentrated in this HMA where it makes up over a third of all accommodation, compared to 16% across the city. This issue to it being the tenure of choice for the majority of student and younger households. There is a lower amount of socially rented stock at 17% vs 25% across Sheffield.
The vacancy rate for the CCW is slightly higher than citywide at 2.2%. A slightly higher proportion of these properties remain empty for 6 months or more, which suggests that there may be falling demand for properties in this area. Some students are moving out of the peripheries of this area towards the City Centre, which may account for some privately rented properties becoming harder to let and hence being vacant.
There is a greater number of one bed properties in the CCW, which reflects the high incidence of flats. There are slightly fewer two and three bedroom properties than citywide, which could be owing to the lower amount of semi-detached properties. The CCW has a large number of properties with 4 or more bedrooms. This may be due to the large amount of new Purpose Built Student Accommodation, which is often in the form of larger cluster flats with between 4 and 10 rooms, such as the Endcliffe Edge and Ranmoor student villages in the Endcliffe neighbourhood. There are also a large number of older privately rented Houses in Multiple Occupation and larger Victorian villas accommodating shared households.
12

Table 15 - Recent housing completions in HMA
CCW Sheffield
2010/11 91 942
2011/12 59 638 Figure 8 - Completions in the last 5 years
2012/13 239 933
2013/14 132 974
2014/15 241 1812
2015/16 467 1621
Total 1229 6920
Table 16 - Housing adequacy
CCW Sheffield
4630 14%
49%
33%
38%
14%
25%
15%
13%
14%
8%
15%
5%
2%
7%
2%
5%
8%
7%
6%
There's no heating
Neighbourhood services are inadequate
5%
Not enough bedrooms 19%
16%
19%
10%
5%
CCW %
Households living in inadequate housing 13%
50%
Re
aso
ns
for
ho
use
ho
ld li
vin
g in
inad
eq
uat
e
ho
usi
ng:
Needs improvements/repairs
Too small
Affecting the health of me or my household
Too large
Property facilities are inadequate 18%
Suffering harassment from my landlord
7%
Garden is difficult to maintain
5%
Tenancy is insecure
Suffering harassment from my neighbours
3%Difficult to access
4%
Too costly to heat
Location of home is undesirable
63%
38%
Rent or mortgage is too expensive
The information in Table 16 is based on responses to the 2013 SHMA. Households were asked if their home was adequate for their needs. If they thought it was inadequate they were asked for the reasons. This was a multiple choice question and households could select as many options as they liked. The percentages therefore represent the proportion of households who chose this reason as one of their options, which is why the percentages in the table do not add up 100%.
Table 15 shows the number of properties built in the HMA and in Sheffield.
0
50
100
150
200
250
300
2010/11 2011/12 2012/13 2013/14 2014/15
Completions
18% of the city's new build development has taken place in the CCW over the last 6 years. Completions 2015/16 saw the highest number of completions in this period, a large majority of which were apartments of purpose built student accommodation.
13

Table 17 - Occupancy
CCW % Sheffield
% overcrowded 2% 3%
% under occupying 68% 71%
% under occupying in SRS 21% 40%
13% of households in the City Centre West thought their housing was inadequate. Nearly two thirds of these households said that their property was inadequate because it was in need of improvements or repairs. A further half of the households stated that their property was too costly to heat. This reflects the older nature of much of the terraced housing stock in this area, which will naturally be in need of more frequent repairs and is not as well insulated as properties of more modern construction. 38% of those who found their property inadequate stated that it was because it was too small, a similar proportion to elsewhere in the city. A higher proportion of people felt their rent or mortgage was too expensive, and reflects the increase in property and rental prices in the area. This may reveal that people would like to live in bigger properties, but that sufficient affordable properties are not accessible to them due to higher costs and lower incomes. More people said that they were suffering harassment from their landlord than citywide, reflecting the greater number of privately rented properties in the HMA. Only half of the city average of 15% said that the location of their home was undesirable, suggesting general satisfaction with the neighbourhood. The levels of overcrowding and under occupancy in this area are lower than in Sheffield overall. A fifth of households in the CCW social rented sector are deemed to be under occupying their properties, which is nearly half the city average. This may be due to the lower number of larger social rented properties in the area, and the high demand as described in Section 12.
The information in Table 17 is from the 2013 SHMA and is based on households needing one less or one more bedroom than the household size needs.
Section 4: Summary Terraced houses and flats are the most common property types in the CCW. There are fewer detached and semi-detached properties, with the proportion being much lower than citywide. A larger supply of these property types
may attract more families to the area. A large number of flats in the CCW are Purpose Built Student Accommodation which is often arranged into cluster flats of 4 or more bedrooms. There is a concentration of privately rented properties in this HMA, making up 36% of properties compared to 16% citywide. Three bedroom properties are most frequent and there are more properties with one bedroom or four or more bedrooms than citywide. This is likely to
be due to the large number of flats and villa style terraced properties. 18% of the city's new build development has taken place in the CCW over the last 6 years, the majority of which are apartments. Of those who found their home inadequate, two thirds said that this was due to the property being in need of improvements or repairs and a further half
because they found it costly to heat.
14

5. Neighbourhood profile
Table 18 - Neighbourhood Satisfaction
% of households satisfied with
their neighbourhood
Public
transport 48% 45%
Access to
parks and
open spaces 43% 39%
Shopping
facilities 42% 38%
Low crime
levels 36% 38%
Good
neighbours 34% 38%
Condition of
roads and 64% 72%
Cleaner 42% 46%
Parking
facilities 26% 36%
Affordability
of homes 24% 28%
Traffic
congestion 23% 26%
Education
provision
ASB levels
Crime levels
Five
ne
igh
bo
urh
oo
d q
ual
itie
s th
at m
ake
a gr
eat
pla
ce t
o li
ve
Five
ne
igh
bo
urh
oo
d
qu
alit
ies
that
ne
ed
imp
rovi
ng
CCW Sheffield
Cleaner streets
Condition of
roads and
Cleaner streets
77% 69%
Public transport
Shopping
facilities
Low crime
levels
Condition of
roads/pavemen
ts
The information in Table 18 is from the 2013 SHMA and measures neighbourhood satisfaction. The households were asked to chose the: a) Most important neighbourhood qualities that make a great place to live; and b) Neighbourhood qualities that need improving in their neighbourhood. This was a multiple choice question and households could select as many options as they liked. The percentages therefore represent the proportion of households who chose this reason as one of their options, which is why the percentages in the table do not add up 100%. The top 5 answers for each question are shown in the table. A higher percentage means that more people chose this as an option and therefore the issue is more important in this area.
Table 18 shows that over three-quarters of households are satisfied with the CCW as a place to live, which is higher than Sheffield overall. Public transport, open spaces and shopping are seen as the most important qualities which make a place great to live in, but are not seen as a priority for improvement, suggesting that residents are satisfied with these. Many neighbourhoods in this area either benefit from larger high quality open spaces such as Endcliffe Park, or have easy access to the Peak District National Park. Many neighbourhoods in this area have good shopping provision, with district centres located on London Road and Ecclesall Road. Nearly two-thirds of people thought that the conditions of the roads and pavements were in need of improvement, which is slightly lower than the Sheffield average. The Streets Ahead programme may be helping to increase the satisfaction with this. Nearly half of respondents thought that the cleanliness of the streets in their neighbourhood needed improving. Other areas people thought needed improving were: parking facilities, affordability of homes and traffic congestion.
15

Table 19 - Crime/ASB incidents
CCW Sheffield
No. of crime incidents 7089 43365
Crime per 1000 population 73 78
No. of ASB incidents 6143 40758
ASB incidents per 1000
population64 74
Table 20 - School performance
CCW Sheffield
No. of primary schools 13 119% pupils meeting the expected
standard in reading, writing and 54% 52%
No. of secondary schools 6 30
Pupils achieving a grade C or
above in English & Maths
GCSE's
77% 59%
The level of crime and ASB in this HMA is slightly lower than citywide. This is reflected in the opinion of residents in this area that low crime levels are important in a good neighbourhood, but that reducing crime levels is not a priority for improvement. Crime and ASB levels vary significantly between neighbourhoods; Broomhall and Highfield had the most recorded crime and ASB in 2016.
Table 19 is from South Yorkshire Police statistics and shows the number of crime and ASB incidents from December 2015 to November 2016. This is then calculated by 1000 of the population to indicate the rate of crime and ASB as compared with citywide.
Table 20 includes provisional figures from the Department of Education for 2016.
Attainment at the 13 primary schools in the City Centre West as a whole is around the city average. Although achievement in this measure at individual schools ranges from 32% to 70%. All the secondary schools in this area have higher attainment levels than citywide. The private schools of Birkdale School for boys and Sheffield High School for girls have the highest GCSE attainment, but these are fee paying schools and will not be accessible to all households living in the area. Notre Dame has the third highest attainment with 81% of pupils achieving A*-C grades in English and Maths.
Several main roads run through this HMA, leading to traffic congestion, and the large number of shared properties in student areas with multiple car owners, often in dense terraced housing, means that parking in an issue in many neighbourhoods. Permit systems to limit the number of car owners per property are already in operation in many student areas. The universities have taken a range of measures to discourage students from driving to their campuses, such as a car share scheme at the University of Sheffield for students and staff, thus reducing the congestion problems in these areas.
16

6. Recently moved to HMA
Table 21 - Moved in last five years
CCWCCW % of
householdsSheffield
Moved into HMA in the last 5
years15723 44% 70909
Moved into HMA from outside
Sheffield4610 29% 14328
Table 22 - Top five reasons for moving Figure 9 - Previous location of in-migrants
CCW % Sheffield %
Move to a larger home 27%Move to a larger
home28%
A bigger garden 19%Move to smaller
home20%
To be closer to work or a new
job17% A bigger garden 19%
End of tenancy 16%Move to a better
neighbourhood18%
Wanted to buy own home 15%Condition of
property14%
The information in Tables 21 & 22 is from the 2013 SHMA and shows the households who moved into their present home in the last five years and the reasons for this move. This helps us understand the demand and draws to this area. This was a multiple choice question and households could select as many options as they liked. The percentages therefore represent the proportion of households who chose this reason as one of their options, which is why the percentages in the table do not add up to 100%.
Section 5: Summary Over three-quarters of households are satisfied with the CCW as a place to live.
Public transport, open spaces and shopping are seen as the most important qualities which make a place great to live in.
Nearly two-thirds of people thought that the conditions of the roads and pavements were in need of improvement, which is smaller than citywide.
The level of crime and ASB in this HMA is slightly lower than citywide.
Attainment at primary schools in the CCW is slightly higher than the city average, but achievement at the secondary schools is significantly higher at 77% vs 59% of pupils achieving A* - C grade GCSEs in English and Maths.
0%
10%
20%
30%
40%
50%
60%
70%
80%CCW Sheffield
17

7. Existing supply becoming available from moving households
Table 23 - Households moving in the next 5 years
CCW Sheffield
% of households moving from
this area in the next 5 years42% 28%
Turnover of households per year 8% 6%
% of households moving out of
Sheffield26% 18%
Figure 10 - Property types becoming available from households moving
The supply information is from the 2013 SHMA. This data provides a guide on the percentage of households in the area that said they expect to move in the next five years, and therefore the types of properties there are likely to become available through the turnover of the existing stock. This informs the supply and demand balance in Section 11.
0%
5%
10%
15%
20%
25%
30%
35%
40%
45%CCW % Sheffield
Section 6: Summary Nearly half of CCW residents have moved in the past 5 years compared to 31% citywide and it is second highest turnover in Sheffield after the City Centre.
This is due to the large number of rental properties and high proportion of students. Moving into a larger home with a bigger garden were the main reasons for moving which mirrors citywide. However the supply of larger properties is
concentrated in certain neighbourhoods in the area including, Endcliffe, Crookesmoor and Broomhill. 16% of people had moved because their tenancy ended, which is much higher than citywide and highlights the large number of rental properties in the
CCW. Figure 8 shows that the CCW has a higher percentage of in-migrants from elsewhere in the UK and overseas. This will be partly due to the large number of
UK and overseas students studying at the universities who stay in accommodation in this HMA.
42% of households in the CCW intend to move in the next 5 years, which is a largest turnover of households in the city. Just over a quarter of these households intend to move out of Sheffield. This is largely due to the high number of students who moved here from outside Sheffield in order to study. Over 30,000 students will leave the universities each year, being replaced by new intake. Many of these students will leave Sheffield when they complete their studies. Of those within the HMA who need to move home within the next 5 years, over half intend to move within the next year. A further fifth need to move within the next 1 - 2 years. This high turnover reflects the large number of privately rented properties in this HMA, where one year tenancies are standard. Students also usually move to a new property during each year of study, so this high turnover does not necessarily mean that there is an issue with the quality or management of the housing stock.
18

Table 24 - Households moving in next 5 years current dwelling type
CCW % Sheffield
Detached House/Bungalow 6% 12%
Semi-detached
House/Bungalow18% 30%
Terraced 34% 28%
Flat 41% 29%
Other 1% 0%
Figure 11 - Property tenures becoming available from moving households
Table 25 - Households moving in next 5 years -current tenure
CCW % Sheffield
Owned 34% 53%
Shared Ownership 0% 1%
Council rent 5% 15%
RP rent 3% 5%
Private rent 55% 26%
Other 2% 1%
0%
10%
20%
30%
40%
50%
60%
Owned SharedOwnership
Council rent RP rent Private rent Other
CCW % Sheffield
Over half of all those in the CCW that intend to move over the next 5 years are in rented accommodation. This reflects the larger proportion of privately rented properties in the CCW (36%) with households in this tenure generally moving more frequently than others with tenancies usually lasting for 1 year. Students typically live in private rented accommodation, moving to a new property each September, which will account for many of those households in privately rented accommodation intending to move within the next 5 years.
Reflecting the stock profile of the CCW, the majority of properties becoming vacant will be either terrace houses or flats, leaving a small supply of available detached and semi-detached houses. The high proportion of people moving out of flats will be due in part to the student villages located within this HMA and the high turnover of one bedroom social rented properties (Section 13).
19

Table 26 - Households moving in next 5 years -current bed size
CCW % Sheffield
1 bed 20% 16%
2 bed 16% 26%
3 bed 21% 37%
4 bed 42% 21%
Table 27 - Top five reasons for wanting to move
CCW % Sheffield %
Move to a larger home 21%Move to a larger
home27%
Move to cheaper
accommodation20%
Move to a smaller
home20%
Tenancy ending 20%Move to a better
neighbourhood16%
Be closer to work or a new job 17%Condition of
current property12%
Move to a smaller home 15%For cheaper
accommodation12%
Properties with 4 or more bedrooms are the most likely to become available in this HMA over the next 5 years. 42% of properties expected to become vacant have 4+ bedrooms, but they make up only a quarter of the stock. This high turnover of larger properties may be due to the large number of student cluster flats which generally have between 5 and 10 bedrooms and are occupied by a new group of tenants each year. A lower proportion of the stock of three bedroom properties are likely to become available, suggesting that residents living in properties of this size are more settled, with a higher proportion of owner occupiers. Only 16% of the stock becoming available has two bedrooms which will limit the options available for those seeking a smaller property in the area.
Section 7: Summary 42% of existing households in the CCW intend to move in the next 5 years which is the largest turnover in Sheffield. Over half of all those in the CCW who
intend to move over the next 5 years are in rented accommodation.
There will be a small supply of properties becoming available for sale or social rent. Fewer two and three bedroom properties are likely to become available over the next 5 years.
Reflecting the stock profile of the CCW the majority of properties becoming vacant will be either terraced houses or flats.
Properties with 4 or more bedrooms are the most likely to become available within this HMA, which are likely to be shared student houses rather than family homes. As a fifth of households want to move to a larger home.
Moving because of the end of the tenancy and for work reflects the younger population in this area that are more mobile and typically living in the private rented sector which have shorter tenancies.
The 2013 SHMA asked households the reasons why they want to move in the next five years. This was a multiple choice question and households could select as many options as they liked. The percentages therefore represent the proportion of households who chose this reason as one of their options, which is why the percentages in the table do not add up 100%.
A fifth of households want to move to a larger home and moving to cheaper accommodation is also which could reflect the higher house prices and rents. The tenancy ending is a common reason for households moving which will be due to the large private rented market in this area and the tendency for 6 to 12 months to tenancies. Moving to be closer to work could be students leaving the area or Sheffield once they have secured a job after graduation.
20

8. Demand from Sheffield households moving to the CCW
Table 28 - Existing household level of demand - next 5 years
CCW
Percentage of Sheffield
households intending to move
within or to the HMA
27%
Figure 12 - Property type households would like and expect
Table 29 - Property type households would like
CCW % Sheffield
Detached house 29% 34%
Semi-detached house 26% 30%
Terraced house 25% 11%
Flat or maisonette 16% 18%
Bungalow 3% 7%
Other 0% 0%
Table 30 - Property type households expect
CCW % Sheffield
Detached house 8% 12%
Semi-detached house 19% 29%
Terraced house 45% 26%
Flat or maisonette 22% 26%
Bungalow 2% 7%
Other 4% 1%
This section discusses the demand from households that expect to move within or to this HMA in the next 5 years. The 2013 SHMA asked households who planned to move within or to this area what properties they would 'Like' and 'Expect'. 'Like' is used to measure the aspirations of households and gaps in the market, while 'Expect' generally reflects the current stock in the area and the households financial constraints. The moving preferences of these households acts as guide to the inform the housing that is needed in the area, and informs the supply and demand balance in Section 11. The housing requirements recommended in Section 19 consider this alongside the current population and housing stock in the area, the available housing development sites, and the future aspirations and sustainability of the area.
0%
5%
10%
15%
20%
25%
30%
35%
40%
45%
50%
Det
ach
ed h
ou
se
Sem
i-d
eta
ched
ho
use
Terr
aced
ho
use
Flat
or
mai
son
ett
e
Bu
nga
low
Oth
er
Like Expect
Over a quarter of households moving in Sheffield are intending to move within or to the CCW which is the highest level of demand in the city. A quarter are single people and the next most common households are a couple and families with dependent children.
21

Table 31 - Tenure households would like
Figure 13 - Demand for tenures in area -expect and like
CCW % Sheffield
Owned 45% 59%
Shared Ownership 0% 1%
Council rent 9% 18%
RP rent 3% 5%
Private rent 35% 16%
Other 8% 3%
Table 32 - Tenure households expect
CCW % Sheffield
Owned 34% 46%
Shared Ownership 3% 4%
Council rent 8% 18%
RP rent 1% 2%
Private rent 45% 26%
Other 9% 5%
0%
10%
20%
30%
40%
50%
Ow
ned
Shar
edO
wn
ersh
ip
Co
un
cil r
ent
RP
ren
t
Pri
vate
ren
t
Oth
er
Like Expect
Tables 29 and 30 show that the highest proportion of households moving to the CCW would like a detached of semi-detached house. However, they are realistic about their expectations when asked what type of property they expect to live in, with 45% stating a terraced house, which is in line with the stock profile of the area. The expectation for terrace housing may be owing to its affordability and the small supply of other house types in the area. Detached properties are the most expensive in the area, selling at an average of £323,632 per property, putting them outside of the budget for the lower income households living in the CCW. Terrace properties are an average of £210k cheaper than detached properties and £75k cheaper than semi-detached ones, making them the most affordable property type. See Table 47. Table 30 shows that 22% of people intending to move over the next 5 years expect to live in a flat, but Table 23 shows that 41% of those moving out will be leaving a flat, suggesting that there may be an oversupply of flats in the coming years.
10% more people expect to live in the private rented sector than would like to, implying that many people will live in this area in this sector even though it is not their tenure of choice. Many of those living in the CCW are younger households and who will not have the requisite savings or a sufficient income to move into home ownership in this area. There is low demand for social rented housing in the CCW. This could be due to the numbers of students and younger households in the area that tend to live in the private rented sector, and would probably need to wait for a long time before being allocated a social rented property. However, this lower demand is not reflected in the number of bids received for socially rented properties (section 12), which is higher for properties in this HMA than the city average. This demand for socially rented properties is therefore likely to be coming from households living in the other HMAs in the city. The high demand for 'other' housing in this HMA is likely to be for PBSA.
Tables 31 and 32 show that almost half of households expecting to live in the CCW would like to own their own home, but only a third expect to. This reflects the smaller supply of home ownership properties in the area and the higher house prices in some neighbourhoods, such as Endcliffe and Nether Edge, which will be unaffordable for some households.
22

Table 33 - Bed size households would like Figure 14 - Demand in area by number of bedrooms - expect and like
CCW % Sheffield
One 12% 11%
Two 20% 29%
Three 32% 30%
Four or more 37% 30%
Table 34 - Bed size households expect
CCW % Sheffield
One 17% 20%
Two 33% 35%
Three 26% 26%
Four or more 25% 20%
0%
5%
10%
15%
20%
25%
30%
35%
40%
One Two Three Four or more
Like Expect
Around a third of all households would like to move into a three bedroom property, but only a quarter expect to move into this property type. However, only a fifth of properties expected to become available have three bedrooms (Table 25), implying that there will be a shortage of these properties going forward. A quarter of households expect to move into a four bedroom property. Table 24 shows that this demand will be met by moving households in the CCW. More people expect to live in a one bed property than would like to. This may reflect the high proportion of one bedroom flats in the area, and the higher rental and property prices in this HMA, meaning many households cannot afford the additional space which they would like. Although more households also expect to move to a two bedroom property than would like, the turnover of this existing stock implies that there will be shortage of two bed properties in the area.
Section 8: Summary
Over a quarter of households moving in Sheffield are intending to move within or to the CCW which is the highest level of demand in the city.
Nearly half of households moving into the CCW expect a terrace house, which reflects the large supply in the area.
There is low demand for socially rented properties from within the CCW which means that the high demand for this area comes from households moving from other HMAs.
Nearly half of households in the CCW would like to own a property, but only a third expect to. This reflects the lower levels of home ownership in the area and the large number of young households that may not have the sufficient income or savings to access home ownership.
There is high demand in this area for properties which have three or more bedrooms, but the turnover is likely to be insufficient to meet this need. It is therefore likely that some of this need will have to be met in other parts of the city such as, the City Centre, South and South East.
More households expect to live in a one and two bed property than would like. The demand for one bedroom properties is likely to be met by the turnover of the existing stock, but there could be a shortfall in two bedroom properties.
23

9. Existing households that cannot move
Table 35 - Want to move but cannot
CCW CCW % Sheffield
Yes, for less than a year 1662 9% 16% Figure 15 - Would like to move but cannot
Yes, for 1-2 years 1402 8% 10%
Yes, for 2-3 years 61 0% 4%
Yes, for 3-5 years 217 1% 3%
Yes, for over 5 years 496 3% 6%
No 13874 78% 61%
Table 36 - Top five reasons cannot move
Family reasons
CCW
Cannot afford the house deposit
Cannot afford moving costs
Lack of affordable rented housing
Family reasons
Cannot afford the monthly mortgage payment
Sheffield
Cannot afford the house
Cannot afford moving costs
Cannot afford the monthly
Lack of affordable rented
The 2013 SHMA asked households if they would like to move but cannot and the reasons for this. This is shown in Tables 35 & 36.
0%
10%
20%
30%
40%
50%
60%
70%
80%
90%
Yes, for lessthan a year
Yes, for 1-2years
Yes, for 2-3years
Yes, for 3-5years
Yes, forover 5 years
No
CCW Sheffield
Section 9: Summary The percentage of households which have been unable to move in the CCW over the last 5 years is lower than citywide at 19% co mpared to 33%, but this
still equates to over 3,000 households.
This suggests the area has some pent up demand which could be realised if the restrictions to moving were relieved, therefore creating a greater housing requirement in the area.
The cost of a deposit and moving are the main reasons these households have been unable to move. This is likely to be the con sequence of the low saving levels shown in Table 10, as mortgages with a smaller deposit have higher interest rates and are therefore more expensive mon thly payments.
The lack of affordable rented housing is a cited by more people as their reason for being unable to move than citywide, reflecting the higher private rents in this HMA.
24
10. Newly forming households demand
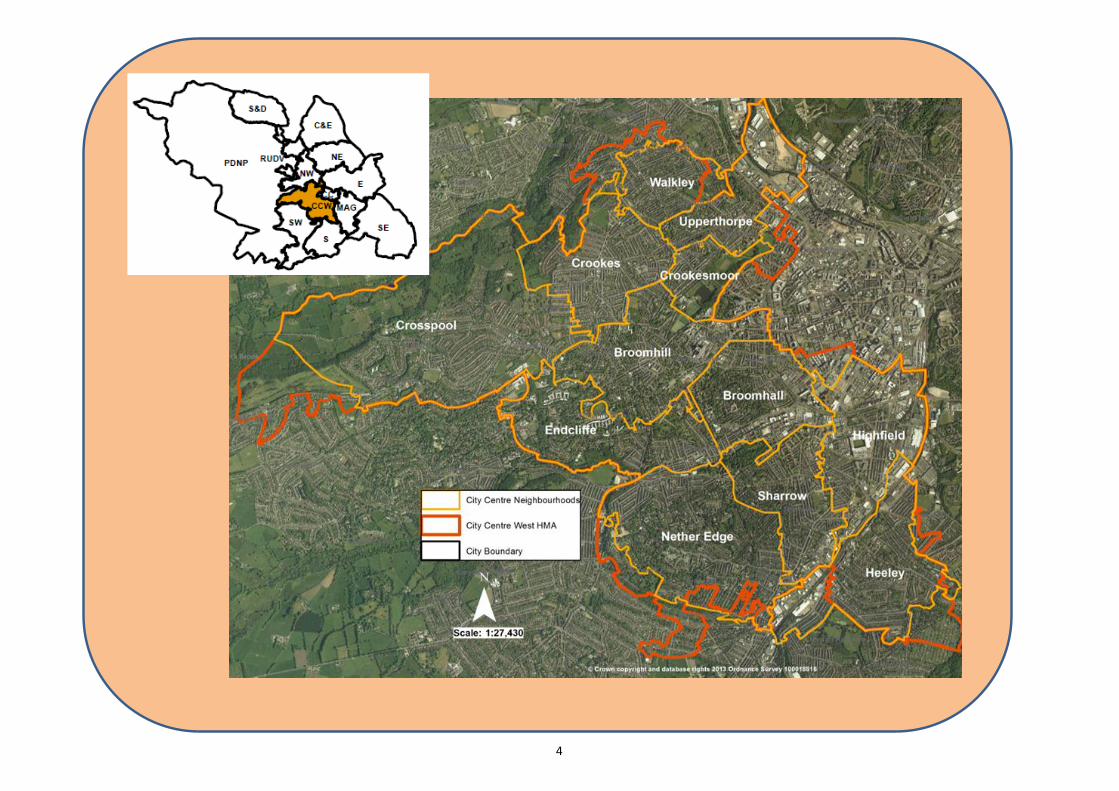
Table 37 - Number of newly forming households expected to form
CCW Sheffield
No. of newly forming
households 1664 11345
Proportion in city 15%
Table 38 - Type of household forming
CCW % Sheffield
Single adult 87% 67%
Lone parent 0% 2%
Couple 11% 25%
Couple with children 3% 2%
Other 0% 3%
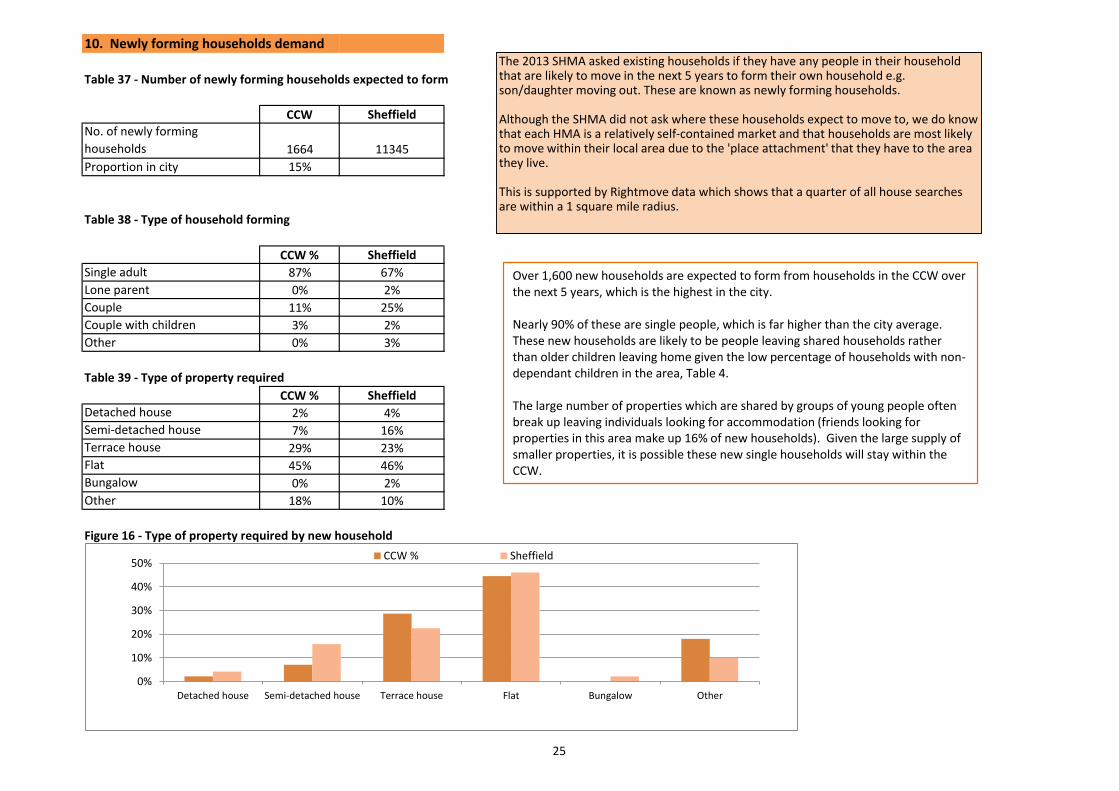
Table 39 - Type of property required
CCW % Sheffield
Detached house 2% 4%
Semi-detached house 7% 16%
Terrace house 29% 23%
Flat 45% 46%
Bungalow 0% 2%
Other 18% 10%
Figure 16 - Type of property required by new household
The 2013 SHMA asked existing households if they have any people in their household that are likely to move in the next 5 years to form their own household e.g. son/daughter moving out. These are known as newly forming households. Although the SHMA did not ask where these households expect to move to, we do know that each HMA is a relatively self-contained market and that households are most likely to move within their local area due to the 'place attachment' that they have to the area they live. This is supported by Rightmove data which shows that a quarter of all house searches are within a 1 square mile radius.
0%
10%
20%
30%
40%
50%
Detached house Semi-detached house Terrace house Flat Bungalow Other
CCW % Sheffield
Over 1,600 new households are expected to form from households in the CCW over the next 5 years, which is the highest in the city. Nearly 90% of these are single people, which is far higher than the city average. These new households are likely to be people leaving shared households rather than older children leaving home given the low percentage of households with non-dependant children in the area, Table 4. The large number of properties which are shared by groups of young people often break up leaving individuals looking for accommodation (friends looking for properties in this area make up 16% of new households). Given the large supply of smaller properties, it is possible these new single households will stay within the CCW.
25

Table 40 - Tenure of property required Figure 17 - Tenure of Property required
CCW % Sheffield
Owned 9% 25%
Shared Ownership 0% 2%
Council rent 1% 22%
RP rent 0% 2%
Private rent 63% 33%
Other 26% 16%
Table 41 - Bed size of property required
CCW % Sheffield Figure 18 - Bed size of property require
1 bed 64% 41%
2 bed 24% 49%
3 bed 8% 9%
4 bed 4% 1%
The majority of newly forming households require private rented properties (63%). This will be due to the large supply of private rented properties in this area and the accessibility of the market, as renters do not require a large deposit or large. This market also offers households flexibility as it is easier to change location.
0%
10%
20%
30%
40%
50%
60%
70%
Owned SharedOwnership
Council rent RP rent Private rent Other
CCW % Sheffield
0%
10%
20%
30%
40%
50%
60%
70%
1 bed 2 bed 3 bed 4 bed
CCW % Sheffield
Nearly half of newly forming households require a flat, reflecting that the vast majority are single people, for whom renting or buying an entire house would be more expensive. It will also be due to flats making up a third of all stock in this HMA, and their suitability as a first property because of their size and affordability. There is a lower demand for detached and semi-detached houses than in other areas of the city, which may be because they are significantly more expensive than other types of housing in this HMA and are in short supply.
Nearly two-thirds of newly forming households require a one bedroom property. This is likely to be due to the vast majority of these households being comprised of a single person, and the affordability of one bedroom properties compared to larger ones. As the demand for one bed properties from established households is lower than the expected turnover there should be a sufficient supply of these properties available to accommodate these newly forming households.
26

Table 42 - Mosaic groups likely to contain newly forming households
CategoryNumber of
householdsDescription
Learners & Earners 6963 Inhabitants of the university fringe where students and older residents mix in cosmopolitan locations
Career Builders 3628 Singles and couples in their 20s and 30s progressing in their field of work from commutable properties
Flying solo 433 Young singles on starter salaries choosing to rent homes in family suburbs
Midlife Stopgap 968 Maturing singles in employment who are renting short-term affordable homes
Section 10: Summary 1,600 new households are expected to form in the CCW over the next 5 years.
90% of newly formed households will be single people, much higher than the city average. Given the large supply of smaller properties, it is possible these will stay within the CCW. While a large proportion will be younger people, all age groups will be represented.
Nearly half of newly forming households require a flat.
There is lower demand for detached and semi-detached houses than in other areas of the city.
Two-thirds of newly forming households require a one bedroom property, reflecting that most are single person households and that smaller properties are more affordable.
The SHMA questionnaire identified one bed flats as the most required property type and private rented as the tenure of choice for most newly forming households in the City Centre West. This might be expected given the number of students and other largely young single people in the neighbourhood. However, the most common mosaic groups also include people who are likely to be moving on to a different type of property and tenure. 'Learners and Earners', 'Career Builders' and 'Flying Solo' represent non - student or slightly older demographics. The respondents to the survey who were aiming for larger properties, or to become owner occupiers are likely to come from these population groups. The 'Midlife Stopgap' group are representative of the older residents of the city Centre West, who may have experienced a change in the make up of their household and have a requirement for a different property type. Their needs will not be met by large private rented developments aimed largely at young people.
27

11. Supply and demand balanceFigure 19 - Supply and demand balance by tenure Figure 20 - Supply and demand balance by bed size
Section 11: Summary
• Figure 19 suggests that there is shortfall of all tenure types in the CCW apart from the 'other tenure'. The other is likely to be student accommodation and there is a large supply of this in the area.
• Despite the private rented market making up 36% of stock in this area, the SHMA suggests that there is still a shortage. However this will dependent on the future numbers of students that move to the area and any further increases of purpose built student accommodation in the City Centre which might drive students from the CCW. It is likely that this movement of students will free up private rented accommodation for other households types and the demand for this tenure will be met by the current supply.
• Three and two bedroom properties make up the greatest shortfalls in this area due to the lower expect turnover of the existing stock. An increase in the provision of these types would meet the needs of families.
• Figure 20 indicates that there is an over supply of 4+ bed properties, however these are likely student cluster flats rather than larger family homes which are needed in the area.
-50%
-40%
-30%
-20%
-10%
0%
10%
20%
30%
40%
50%
Owned Sharedownership
Councilrent
RP rent Private rent Other
City Centre West Sheffield
-12%
-10%
-8%
-6%
-4%
-2%
0%
2%
4%
6%
8%
10%
1 bed 2 bed 3 bed 4+ bed
City Centre West Sheffield
This section shows the balance between supply and demand for different dwellings in this area. This compares the supply of housing becoming available through the turnover of existing stock (Section 7) with the demand for housing in the area. The demand is based on what the existing households said they would like in Section 8 and what the newly forming households require in Section 10. The proportion of demand for each property is compared against the proportion of supply. If demand is higher than supply this will show as a negative, shortfall on the graph (the bar will be below the 0% line). If supply is higher than demand, the bar will be above the 0% line and shows as a surplus. For example, if 20% of demand was for terraced houses, and 15% of supply was terraced houses, this would show as a minus 5% shortfall of this type of housing on the graph (the bar would be 5% below the 0% line). This section discusses the tenure and bed size as the type is not directly comparable.
28

12. Social rented market
Table 43 - Current social stock in the area
Council/RSL CCW CCW % Sheffield
Council stock 3947 68% 39,996RP stock 1833 32% 17,411
Total social stock 5780 57,407 Figure 21 - Social stock by bedroom size
Table 44 - Social stock by bedroom size
CCW CCW % Sheffield
Bedsit 80 1% 1%
One 2844 50% 31%
Two 1667 29% 37%
Three 946 17% 29%
Four or more 143 3% 2%
Total 5680
Table 43 shows the amount of social housing stock the area has, compared with Sheffield overall. This includes both Council owned and those owned by Registered Providers. Table 44 and Figure 21 show the social stock by bed size, not all the bed size information is available for all the RP stock.
0%
10%
20%
30%
40%
50%
60%
Bedsit One Two Three Four or more
CCW Sheffield
The CCW has the fourth largest supply of socially rented properties of all the HMAs, with over 5,700 properties, the majority of which are Council owned. These are mainly located in the neighbourhoods of Sharrow, Upperthorpe and Broomhall. One bedroom properties make up half of the social rented stock, with the next most frequent being two bedroomed properties. This is due to the majority of social rented properties in the CCW being comprised of flats. The CCW has a smaller percentage of 3 bedroom properties compared to city wide. This is due in part to the prevalence of flats and also the low supply of post-war semi-detached properties which are common in many other areas of the city. There are 143 larger social rented properties in the CCW, which is the third highest supply of all the HMAs. Details of numbers of bedrooms were not available for 100 RP properties in this area.
29

Table 45 - Social housing demand
Indicators CCW Sheffield
CBL lettings 2016 322 4526
Average number of bids per
advertised social property 58 45
Average days to re-let SCC
property55 60
SHMA affordable housing
shortfall415 725
Figure 22 - Social lets by bed size
Table 46 - Social stock let by bedroom size
CCW CCW % Sheffield
Bedsit 7 2% 2%
One 219 68% 45%
Two 68 21% 36%
Three 28 9% 16%
Four or more 0 0% 1%
Total 322
Table 45 shows a number of indicates that measure social housing demand. • CBL lets 2016 - number of council and RP properties that were let through Choice
Based Lettings • Average number of bids - a high number can show demand for the properties • Average days to re-let - a low number suggests that the property or area are
popular • SHMA affordable housing shortfall - This is the number of affordable homes that
the area and Sheffield need per annum for the next 5 years.
There was a higher turnover of one bedroom properties than any other size, with them making up two-thirds of the social stock let in the CCW during 2016. The proportion of two bedroom properties let reflects the stock, but fewer three bed properties were available. None of the areas four bed properties were let during 2016, limiting the opportunities for families in need of accommodation of this size.
0%
10%
20%
30%
40%
50%
60%
70%
80%
Bedsit One Two Three Four or more
CCW Sheffield322 social rented properties were let in the CCW during 2016. This makes up 6% of the stock which is a lower turnover of all social rented stock than citywide at 8%. The average number of bids per property is higher than citywide and the properties take less time to re-let. This area has the highest shortfall of affordable homes in the city and could be result of this large private rented market in the area. Coupled with the lower turnover, this shows a strong demand for social rented properties in the CCW and indicates that if the supply in the area was increased, there would be sufficient demand for it.
30

Table 47 - Average number of bids on social stock by bed size
CCW Sheffield Figure 23 - Average no. of bids by bed size
Bedsit 34 42
One 63 44
Two 51 46
Three 38 34
Four or more N/A 53
The most bids per unit were for one bedroomed properties, at an average of 63 compared to 44 citywide. This evidences a strong demand for one bedroom properties in the CCW. This greater demand may be due to the popularity of the CCW as a place to live and the younger demographic of the population who are more likely to be on lower incomes and single person households. Households who are affected by the welfare reforms and looking to downsize in other HMAs, may be bidding for one bedroom properties in the CCW as it has a large supply of them. Two and three bedroom properties in the area attracted less bids than one beds, however, numbers of bids for these properties were still higher than the city average.
Section 12: Summary The CCW has the fourth largest number of socially rented properties of all the HMAs, with over 5,700 properties. These are mainly flats which are located
in the Sharrow and Broomhall neighbourhoods.
The CCW has the largest shortfall of affordable homes in the city.
One bedroom properties make up half of the social rented stock in this area.
322 social rented properties were let in the CCW during 2016, which makes up 6% of the stock.
The average number of bids per property is higher than citywide, showing a strong demand for social rented properties in the CCW.
One bedroomed properties made up two thirds of the social stock let in the CCW during 2016 and have the highest level of bids.
0
10
20
30
40
50
60
70
Bedsit One Two Three Four ormore
CCW Sheffield
31

13. Home ownership market
Table 48 - Average house price
CCW Sheffield
2009 £138,064 £129,418
2010 £146,338 £126,808
2011 £131,617 £124,359 Figure 24 - Average houses prices since 2009
2012 £155,949 £125,342
2013 £147,156 £130,141
2014 £157,431 £141,246
2015 £171,641 £144,767
2016 £166,322 £149,968
Figure 25 - Average house price by property type 2016
Table 49 - Average house price by type of property
CCW Sheffield
Detached £327,979 £260,312
Flat £112,296 £104,157
Semi-detached £264,129 £161,128
Terraced £135,899 £104,157
The house price information in Tables 48 & 49 is taken from Land Registry sales. The sale data for each HMA has been weighted against the UK House Price Index average price for the city. This is done to ensure that the average house price for each area is not skewed by the number or types of sales in the particular quarter, and to ensure that it gives a true reflection of the property values.
£0
£20,000
£40,000
£60,000
£80,000
£100,000
£120,000
£140,000
£160,000
£180,000
£200,000
2009 2010 2011 2012 2013 2014 2015 2016
CCW Sheffield
The average house price in the CCW is 15% higher than the Sheffield average, and has increased 33% since the post crash low point of 2011. House prices are not equal across the neighbourhoods and there is a great disparity of over £193,000 between the high prices commanded in the affluent Endcliffe neighbourhood (£269,467) and those in the more affordable Broomhall (£76,386).
£0
£50,000
£100,000
£150,000
£200,000
£250,000
£300,000
£350,000
Detached Flat Semi-detached Terraced
CCW Sheffield
32

Figure 26 - Number of sales and price paid, by property type 2016
Although prices for all property types in this HMA are higher than the city average the price difference for some property types is greater than for others. Semi detached properties are 65% higher than the city average, whereas flats sell for 9% above the average. The difference is largely explained by the fact that detached and semi detached properties are most common in the more expensive neighbourhoods in the City Centre West, whereas for flats there is both a greater supply and they are located in the more affordable neighbourhoods. The mean average prices can hide some of the factors in the market important to buyers. The mean average semi detached is over £270,000 as this includes several properties that sell at over £500,000. However as figure 26 shows most sales of semis are at lower prices than £270,000 and the market for semi detached properties in CCW begins at around £120,000 in Upperthorpe and Heeley.
33

Table 50 - Ability to afford an entry level property
CCW Sheffield
Average house price £166,322 £149,968
Typical home mover deposit £46,570 £41,991
Typical home mover income
required £36,070 £32,523
Entry level house price £108,608 £101,000
Typical first time buyer deposit £16,291 £15,150
Typical first time buyer income
required £25,859 £24,048
Average house price ratio 6.08 5.51
Figure 27 - Income needed to afford to buy a property in City Centre West
Table 51 - Average deposit held
CCW Sheffield
All Households £99,120 £83,818
Newly forming households £5,909 £5,229
No equity households £8,106 £6,248
Table 50 shows the incomes needed to buy a average price property and an entry level price in the area. For the average house price the income required is based on providing a 28% deposit and getting a 72% mortgage worth 3.32 times the household income for the average house price. For the entry level house price the income required is based on providing a 15% deposit and getting a 85% mortgage worth 3.57 times the household income for the average entry level house price. This are the typical deposits and income multiples provided by the Council of Mortgage Lenders for home movers and first time buyers in December 2016.
The average entry level property would be affordable for households earning the median income of £27,337, but the average priced property is unaffordable. However, given the varying house prices and incomes in the CCW, the affordability can depend on the neighbourhood in which households are looking to buy. 142 of the 1253 properties that sold in the area in 2016 sold for under £100,000, which would be affordable to a household with the median income, and although these were mostly in Broomhall (74) and Highfield (18), it was possible to buy at this price in most of the area neighbourhoods. The average house price to income ratio is higher than citywide which
On average, households need to have a deposit over £16,000 to afford an entry level house in the CCW with an 80% mortgage, but households in this HMA which are not already home owners are unlikely to be able to afford this as they only have an average deposit of around £8,000. This suggests that first time buyers will need some assistance to afford the deposit, either from their family or Government initiatives, such as Help to Buy. Households that are currently renting in the private or social sector are unlikely to achieve home ownership in this HMA and may need to look elsewhere to buy a property.
Table 51 is from the 2013 SHMA and shows the average deposit households are likely to have in this HMA based on the levels of savings, equity and other financial resources. The 'all households' includes all tenures while those with no equity is households living in the rented sectors and also homeowners with negative or no equity in their property.
£0
£5,000
£10,000
£15,000
£20,000
£25,000
£30,000
£35,000
£40,000
Typical home mover income requiredTypical first time buyer income required
Income needed for mortgage CCW Median Income
34

Table 52 - Property sales 2016
CCW Sheffield
Total sales in 2016 1253 6752
Turnover of owner occupied
stock8% 5%
New build sales 14 193
Sales at £250k-£500k 265 1093
Sales over £500k 44 1093
Figure 28 - Property sales since 2009
The total sales in the last year shown in Table 52 is based on all private property sales from 2016. Table 53 shows types of sales during 2016, and Figure 28 shows the trend in sales from 2009.
Table 51 shows that the 1253 sales in 2016 in the CCW this equates to a turnover of 8% of the privately owned stock in the area. This is higher than citywide and shows a strong demand for properties in the area. Sales in the CCW reflect citywide patterns in that they fell in 2015 compared to the previous year, but increased in 2016. The large private rented sector may well account for the increased sales in the Jan - Mar quarter, up to 305 in 2016, compared to 245 in 2015, as buy to let properties were purchased before the change in stamp duty. The increase was less pronounced between April and September when 581 properties were sold compared to 557 in 2015. The majority of sales were in the popular neighbourhoods of Nether Edge and Crookes, which appeal to a range of households. The least occurred in Crookesmoor, and Upperthorpe, indicating a low turnover of stock and also reflecting the large number of rented properties and student accommodation in these neighbourhoods.
0
200
400
600
800
1000
1200
1400
2009 2010 2011 2012 2013 2014 2015 2016
Total sales New build sales
There were 14 new build sales in the CCW in 2016, despite the fact that there were 467 new build completions in the CCW in 15/16. Other than 19 houses, they were all apartments or student accommodation. This would suggest that the majority of new development in the area is aimed at the rental, not owner occupation market. The City Centre West accounts for a large proportion of sales over £250,000 in the city, showing a strong market for aspirational homes in particular areas of this HMA. Most of these higher house prices were in Broomhill, Endcliffe, Crosspool and Nether Edge.
35

Table 53 - 2016 Sales by property type
Figure 29 - 2015 sales by property type
CCW CCW % Sheffield
Detached 100 8% 8%
Flat 318 25% 25%
Semi-detached 185 15% 15%
Terraced 650 52% 52%
Over half of properties sold in CCW up in 2016 were terrace houses which reflects the large number of this type of stock in the area. However, the 'terrace' description cover properties that range in price from £55, 000 to over £1 million. There was a higher percentage of flats sold in this HMA than citywide, which will offer accommodation for single and couple households. However fewer family houses were sold, with detached properties only making up 8% of all the sales, and semi detached 15%. These detached property sales were mainly located in Crosspool and Nether Edge.
0%
10%
20%
30%
40%
50%
60%
Detached Flat Semi-detached Terraced
CCW Sheffield
Section 13: Summary • The average house price in the CCW is 15% higher than the Sheffield average with house prices increasing by 33% since 2011.
• Average property prices are highest in the Endcliffe, Crosspool and Nether Edge neighbourhoods.
• House prices are not equal across neighbourhoods and there is a disparity of £193,000 between the high prices commanded in the affluent Endcliffe neighbourhood and those in the less affluent Broomhall.
• Prices of semi-detached properties in the CCW are 39% higher, and flats 7% higher than for these types of property citywide.
• Average entry level properties in the CCW are affordable for households with the median income of £27,337 but average priced properties are not., Although there are some areas in the CCW such as Broomhall and Upperthorpe with properties that most households could afford with the average income and deposit.
36

14. Private Rented Market
Table 54 - Average monthly private rent (mean)
CCW Sheffield Figure 30 - Average private rent by bed size
2010 £522 £526
2011 £553 £554
2012 £576 £569
2013 £598 £586
2014 £535 £558
2015 £506 £561
2016 £578 £603
Table 55 - Average monthly private rent by bed size 2016 (median)
CCW Sheffield
Bedsit £525 £500
One bed £525 £550
Two bed £650 £600
Three bed £750 £650
Four or more bed £1,278 £1,100
Shared £347 £355
Figure 56 - Income needed to afford average private rent property
CCW Sheffield
Yearly rent £6,934 £7,236
Income needed to afford £27,736 £28,944
The average (mean) private rent data is taken from rental information for properties advertised for let by estate agents through
£0
£200
£400
£600
£800
£1,000
£1,200
£1,400
Bedsit One bed Two bed Three bed Four or morebed
Shared
CCW Sheffield
Section 14: Summary • Approximately 42% of all the properties advertised for private rent in Sheffield during
2016 were in the CCW, reflecting how much larger this tenure is in comparison to most of the other HMAs.
• Although the average advertised rent in this area was £25 below the citywide average this was because of the high proportion of lets for shared properties , bedsits and 1 bedroom properties, many of which will have been let to the CCW's large student population.
• For properties with 2 or more bedrooms the average rent in the CCW is above the city average. This makes private renting more expensive for those households that do not wish to share or need a larger property, such as families with children.
• The annual income required to afford the average private rent property in CCW is slightly higher than the median income for this area, which means many people in this area may be forced to live in shared properties or rent smaller homes than they may require.
• Rental prices vary significantly across the HMA, with the highest rent being in Crosspool at £796 a month and the lowest in Endcliffe and Crookesmoor at £471 and £439 respectively.
37

15. Housing Affordability
Table 57 - Proportion of income spent on housing costs
CCW % Sheffield
Below 15% 29% 35%
15%-25% 18% 18%
25%-35% 15% 14%
35%-45% 10% 8%
45% or above 10% 7%
Don't know 18% 18%
Table 58 - Difficulties with housing costs
CCW % Sheffield
Yes, Rent/mortgage 10% 9%
Yes, Fuel bills 25% 23%
Yes, Council tax 15% 13%
Yes, Other bills 11% 13%
No 65% 58%
Table 59 - Claiming Housing Benefits
CCW CCW % Sheffield
Social rented 4053 75% 81%
Private rented 1325 25% 19%
Working age claimant 3714 69% 69%
Pension age claimant 1664 31% 31%
Total 5378
% of all households claiming HB 15% 20%
The SHMA 2013 asked households how much of their income is spent on rent/mortgage and if people have difficulties with their bills, 25% or below is considered an affordable amount. This is captured in Table 57. Table 58 was a multiple choice question and therefore will not total 100% as people can struggle to pay more than one housing cost. The information in Table 59 is from the Council Housing Benefit records from December 2016 and shows the number of claimants in private and social accommodation (not hostel). Please note we do not have records for the tenure and age breakdown for all claimants.
Section 15: Summary 47% of households spend less than a quarter of their income on housing
costs compared to 53% citywide.
65% of households said they do not have difficulties with their housing bills which is higher than the citywide proportion.
16% of households claim Housing Benefit in the CCW, which is lower than the citywide proportion.
Two -thirds of HB claimants are in the social rented sector, which is high given that only a third of all rented properties in the CCW are socially rented.
HB claimants who are in the private rental sector will struggle as the average rent for all property types is higher than the Local Housing allowance (LHA) rate. The average 1 bed is £525 while the LHA maximum is £411.
The percentage of pension age claimants is the same as citywide despite the population being lower. This may be due to the lower levels of home ownership, meaning older people are more likely to social rent than in other HMAs.
Almost half of all households spend less than a quarter of their income on their rent or mortgage, which means that only a small proportion of people feel they have difficulties with their housing costs. This suggests that the CCW is a relatively affordable place to live or that people are willing to budget for housing costs in order to live in their preferred location. Most households do not have difficulties paying their housing costs, but a higher percentage of households than citywide said they have problems with their fuel bills, Council Tax and rent/mortgage.
15% of households in 2015 claimed Housing Benefits to help pay towards their rent, which was lower than the proportion of households citywide. The majority of the claimants are working age people. A higher percentage of private rented tenants claim Housing Benefits in CCW than in Sheffield overall and this reflects the large private rented market in this area. It also shows that the private rented sector is not only providing accommodation for students as they cannot claim benefits.
38

16. Older People's Accommodation
Table 60 - Older people's housing
CCW Sheffield
Number of units/beds - all types 1806 9545
Population aged 65 or above 9351 61488
Older people's housing per
1,000 older population193 155
Table 61 - Older Household Mosaic Categories (Top 6)
CategoryNumber of
householdsDescription
Ageing Access 3,070 Older residents owning small inner suburban properties with good access to amenities
Legacy Elders 776 Elders now mostly living alone in comfortable suburban homes on final salary pensions
Dependent Greys 710 Ageing social renters with high levels of need in centrally located developments of small units
Aided Elderly 444 Supported elders in specialised accommodation including retirement homes and complexes of small homes
Estate Veterans 356 Longstanding elderly renters of social homes who have seen neighbours change to a mix of owners and renters
Diamond Days 294 Retired residents in sizeable homes whose finances are secured by significant assets and generous pensions
The information in Tables 60 & 61 is taken from a variety of sources, including: • Council stock data • RP stock data • Private data from the Elderly Accommodation Council. • Mosaic The units/beds is the individual properties or beds available per person. This total is than divided by 1000 of the older population to calculate whether there is a sufficient supply of older accommodation to meet the needs of the population in the area. The information in Table 60 shows the demand for social rented sheltered housing schemes during 2016.
The CCW has a lower than average proportion of older people but this population is varied in terms of tenure, assets and support needs. It is well served in comparison to other areas of the city and has more units/bed available per 1,000 of the older population than citywide. The majority of households aged over 65 own their properties outright and this housing equity will make it easier to access specialist accommodation or more age-friendly general needs housing if the need arises. Around half of the units / beds provided are in the social rented sector, suggesting a relatively good supply of affordable accommodation for older people who require specialist accommodation in the CCW.
39

Table 62 - Older people's accommodation - existing provision
Sheffield
Schemes Beds/Units Beds
/Units
Care Home 23 987 3801
Extra Care 1 37 566
Sheltered 17 473 2414
Social age banded housing (60+) NA 309 2456
Total schemes 41
Table 63 - SCC Social rented sheltered housing demand
CCW Sheffield
No. of SCC properties let 2016 8 186
Average bids 5 6
Days to re-let 61 66
Table 64 - Percentage of moving households that are over 65 years
HMA area CCW Sheffield
65-79 6% 15%
80+ 4% 4%
Table 65 - Would like older people's accommodation
Like CCW % SheffieldNo, Independent
accommodation 78%75%
No, Independent
accommodation with support 0%7%
Yes, Residential/ nursing home 10% 2%
Yes, Extra care housing 0% 2%
Yes, social rented sheltered
housing 0%11%
Yes, Other purpose-built
supported housing 12%3%
CCWNearly a third of all private older people's schemes are located in the CCW. This high density may be related to the desirability of some of the neighbourhoods and their proximity to both green spaces and the city centre. Older people's accommodation is distributed across all of the HMA's neighbourhoods with the exception of Upperthorpe, which has just one care home. The social sheltered schemes are mainly located in the neighbourhoods of Broomhill, where there are 6, and Nether Edge and Highfield, which each have 4 schemes. Nether Edge has significantly more care homes than any other HMA, the largest of these is in Langsett, at the edge of the HMA boundary, which has 120 bed spaces. Only 8 sheltered housing units were let in the two council run schemes during 2016. The bid levels were similar to citywide average but on average took 5 days fewer to relet. This suggests a healthy demand for the Council's existing sheltered stock in this area.
The information in Tables 64 to 66 is taken from the SHMA and measures the percentages of older households aged 65 and over that intend to move in the area in the next five years and the type of accommodation that they would like and expect to get.
10% of existing households moving in the CCW are 65 years and over, and these older households generally require independent accommodation without support, reflecting the life expectancy and health levels of older people in this area. Only 9% of the older households moving expect older person's accommodation, with some demand for other purpose built supported housing and residential/nursing homes.
40

Table 66 - Expect older people's accommodation
Expect CCW % Sheffield
No, Independent
accommodation 82%79%
No, Independent
accommodation with support 9%4% Figure 32 - Type of accommodation that older households require
Yes, Residential/ nursing home 9% 1%
Yes, Extra care housing 0% 2%
Yes, social rented sheltered
housing 0%12%
Yes, Other purpose-built
supported housing 0%2%
Table 67 - Supply / demand balance for retirement housing
CCW Sheffield
2015 Shortfall -47 -2430
2034 Shortfall -173 -4767 0%
10%
20%
30%
40%
50%
60%
70%
80%
90%
No, Independentaccommodation
No, Independentaccommodation
with support
Yes, Residential/nursing home
Yes, Otherpurpose-built
supported housing
Like Expect
The information in Table 64 indicates the balance in demand and supply for older people's specialist independent living housing (such as sheltered and extra-care) and is taken from "Retirement Housing in Sheffield, Supply and Demand to 2034", University of Sheffield (2016).
Section 16: Summary The CCW has a diverse older population that includes a large number of households who own their own homes outright; their housing equity should give
them more options for moving to specialist accommodation or more suitable general needs housing if the need or desire arises. The area is relatively well served by its current supply of existing specialist older people's accommodation, which largely meets current demand levels .
The existing accommodation is evenly distributed across the neighbourhoods within the HMA. The CWW contains over a quarter of the city's care homes and a much higher number than other HMAs in the city. 21 of the older people's schemes in
the CCW are socially rented sheltered accommodation, which constitutes a quarter of this type of stock across Sheffield. Most demand among older households planning to move is for housing for independent living, suggesting there should be a healthy demand for age-
friendly properties available for sale if they are built. More information about older people's accommodation in the city and the demand for this across the HMA's can be found in the 'Sheffield Guide to
Developing Older People's Accommodation' which is available at: https://www.sheffield.gov.uk/in-your-area/housing-services/housing-strategies/developing-older-peoples-accommodation.html
41

17. Care and Support Needs
Table 68 - Disabled households
CCW % Sheffield
Disabled people (Census) 13% 19%
Disabled household (SHMA) 20% 25%
Figure 33 - Type of disability
Table 69 - Type of disability or limiting long term illness
CCW % Sheffield
Long Term Limiting Illness 26% 33%
A physical disability 20% 24%
Mental health problem 18% 13%
Other 13% 14%
Learning or development
disability12% 6%
Autism 4% 4%
Dementia 3% 2%
A sensory disability 3% 5%
Coginitive impairment (brain
injury)2% 0%
This section discusses the care and support needs for disabled people and the demand for adapted properties from existing households. Table 68 shows the percentage of disabled people from the Census 2011 and the percentage of households containing a disabled person from the 2013 SHMA. Both the datasets are shown to measure the proportion of disabled people per household. Table 69 and Figure 33 show the types of disability people have. This is from the SHMA as this is not provided in the Census.
The Census and SHMA show that the CCW has a lower level of people with a disability or long term illness than citywide. This reflects the younger population in the area as the Census shows that 41% of disabled people in the City Centre West are over 65 years. An additional reason for the lower levels of disability will be the lower indices of deprivation as higher rates of deprivation are linked to increased disability, with many of the neighbourhoods in this HMA being relatively affluent.
0%
5%
10%
15%
20%
25%
30%
35%CCW % Sheffield
Of those who consider themselves to have a disability in the CCW, long term limiting illness and physical disability are the most common forms. There is a higher proportion of people with a mental health problem than in other areas and double the proportion of people with a learning or development disability in the CCW than citywide. These are things which it is more difficult to cater for by the provision of bespoke or specially adapted housing. These barriers should be considered when developing new housing in the area.
42

Table 70 - Domiciliary Care Hours (per week)
CCW Sheffield
Current Domiciliary Hours 2603 23715
Average hours per household 0.07 0.10
Unmet Domiciliary Hours 222 2634
Total Domiciliary Hours 2825 26349
Table 71 - Adequacy of home for disabled resident needs
CCW % Sheffield
Adequate 61% 64%
Inadequate 39% 36%
Table 72 - Need to move to resolve difficulty for disabled resident
CCW % Sheffield
Yes 30% 25%
No 70% 75%
The 2013 SHMA asked households with a disabled person if their home is adequate and if not whether they need to move to resolve this difficulty. This is shown in Tables 71 & 72. Households with a disabled resident were asked what kind of support or adaptation they would need to help them stay in their property, as shown in Table 73.
Households in the CCW receive over 2,600 hours per week of domiciliary care, which is below the citywide average of domiciliary hours delivered per household. This below average supply is likely to be due to the larger young population in the area and the smaller number of disabled residents. The most hours are delivered in Crookes, although Crosspool and Nether Edge have larger populations of older and disabled households.
Over 60% of disabled households feel their home is adequate for their needs which is slightly lower than citywide. However, fewer people feel they need to move to resolve this difficulty which suggests that only minor adaptations are needed to make the properties adequate to meet the household's needs.
Table 70 shows the total hours per week that residents in the area receive domiciliary care and the unmet need. Domiciliary care is floating support going into the home to allow people to live independently.
43

Table 73 - Support and adaptations needed to stay in the current property
Figure 34 - Adaptations needed
CCW Sheffield
Bathroom adaptations 27% 53%
Handrails/grabrails 25% 56%
Citywide alarm system 23% 23%
Vertical lift/stair lift 22% 28%
Access to property/ramp 20% 29%
Safe access to garden/external
area 19% 17%
Assistance maintaining
home/garden 18% 10%
Wheelchair adaptations 17% 19%
Ground floor toilet 12% 24%
Extension/extra room 9% 5%
Kitchen adaptations 7% 5%
Downstairs bedroom 4% 6%
Table 74 - Resident in household receives care
CCW % Sheffield
Yes receives care 12% 15%
Yes care is adequate 85% 72%
A much lower proportion of households in the CCW say they need adaptations to stay in their property than citywide. This is likely to be due to the lower proportion of households with a physical disability. Around a quarter of households with a disabled resident think that they need the following four adaptations to stay in their home: bathroom adaptations and handrails/grab rails, but this need is smaller than citywide. There is a greater demand for help to maintain the home and garden which could suggest that a handy person scheme would be popular in the area.
The 2013 SHMA asked if anyone in the household receives care and if this is inadequate. Households were also asked if someone needed care and what they needed. This shown in Tables 74 and 75.
0%
10%
20%
30%
40%
50%
60%CCW Sheffield
44

Table 75 - Care and support needs Figure 35 - Care and support needed
CCW Sheffield
Looking after the garden 40% 49%
Looking after the home 23% 38%
Preparing meals 20% 18%
Having someone to act on
your/their behalf 19% 16%
Claiming benefits or managing
finances 16% 28%
Participate in social activities 15% 18%
Personal safety of security 11% 21%
Personal care 10% 16%
Table 75 shows that the proportion of people receiving care in the CCW is slightly lower than citywide, but that more people thought the care was adequate at 85% vs 72%. The two main types of care required were looking after the garden or home. This suggests that vulnerable people in the area would benefit from accessing a handy person scheme.
0%
10%
20%
30%
40%
50%
60%
CCW Sheffield
Section 17: Summary The Census and SHMA show that the CCW has a lower level of people with a disability or long term illness than citywide.
Long term limiting illness and physical disability are the most common forms of disability in the CCW.
9% of all domiciliary care hours received in Sheffield are in the CCW and there is lower than unmet need at 147 hours per week.
Over 60% of disabled households feel their home is adequate for their needs, which is slightly lower than citywide.
A much lower proportion of households in the CCW say they need adaptations to stay in their property than citywide.
The lower number of adaptations needed implies that stock in this area is adequate to meet the needs of the disabled population.
45

18. City Centre West Summary
Household Profile City Centre West is similar to the City Centre HMA, as students and young single people are the largest population groups. The Mosaic profile includes groups of often affluent families such as 'Cafes and Catchments' and 'Primary Ambition' who would provide a market for family
housing. 'Student scene and 'Learners and Earners' are the largest Mosaic groups. However, the area is more diverse than the City Centre and includes more suburban neighbourhoods, more of a mix of tenures and more families and
older people. There is a higher proportion of BME residents in this HMA than citywide. The Broomhall, Highfield, Upperthorpe and Sharrow neighbourhoods have the
largest BME populations. This is partly due to Part of this may be due to the large number of students in this HMA, as one fifth of all students in the city are international.
Economic Profile As students make up 40% of the area's population, there is a lower proportion of unemployed people than citywide. The claimant rate is 1.4% compared
to 2.3% citywide. The median income is slightly lower than citywide at £27,337. However, this varies considerably between wards. Average incomes in predominantly student areas, such as City Ward (£21,020), are considerably lower. The highest median income is found in the Crookes
and Crosspool Ward where it is £32,538 per annum. For those in employment, the occupation profile tends towards the higher incomes, for example 30% are employed in professional occupations compared
to 20% citywide. Equity levels are high, 51% of households included in the SHMA survey estimated that they had over £150,000 equity. Savings levels are quite high in the non-student households, 27% of all households in the area estimated that they had over £25,000 savings. Housing Profile The housing stock in the CCW includes a large proportion of terraces (38% compared to the city's 27%) and flats and maisonettes (33% compared to the
city's 21%). The amount of private rented sock is the main feature of the tenure profile at 36% of the stock compared to 16% citywide. The neighbourhoods in the City Centre West vary greatly. Highfield and Broomhall have an increasing number of modern purpose built rented
accommodation, Sharrow includes a significant amount of Council owned social accommodation and Endcliffe and Crosspool are relatively prosperous suburban areas.
2% of households were over-occupying compared to 3% citywide and 68% were under-occupying compared to 71% citywide. This HMA has seen a lot of new development with 1229 properties completed in the past 6 years, mainly apartments.
Neighbourhood Profile The SHMA survey found higher than average satisfaction levels among residents in the City Centre West. Access to public transport, parks and open spaces and shopping facilities were particularly valued by local households. The area overall enjoys lower levels of crime and anti-social behaviour than in Sheffield generally, with some neighbourhoods experiencing extremely low
levels. The condition of roads and pavements and cleaner streets are seen as priorities for improvement. The Streets Ahead programme should be helping to
address some of these problems. Secondary school performance is very good, which increases the attraction of the area to families with children.
46
Supply and demand balance (sections 7 to 11) The 2013 SHMA estimated the supply and demand balance in the City Centre West based on the preferences and expectations expressed in the SHMA
survey. the SHMA suggested a shortfall of all tenures, but especially Private rent despite the private rented market making up 36% of stock in this area However, the demand for private rent is dependent on the future numbers of students and any development in the City Centre HMA that might draw in a
larger proportion of the student market. Three and two bedroom properties make up the greatest shortfalls in this area and there are fewer larger family homes in the area as the existing four
bedroom stock tends to be in houses in multiple occupation that are private rented. An increase in the provision of houses with two, three and four bedrooms would meet the needs of families and newly forming households. Housing market (sections 12 to 14) The average property price is £166,322 compared to £149,968 citywide. Average prices for detached (£327,979 vs £260,312) and semi-detached (£264,129 vs £161,128) properties are much higher than citywide. Demand is
driven by the low supply in the area and the tendency for them to be located in a small number of popular neighbourhoods. The differential for flats was smaller.
21% of sales are at prices above £250,000. The City Centre West's median income (£27,337) is below the income required to afford average properties (£36,070) but higher than the income needed
to afford an entry level property (25,859). However households need a significant deposit to afford to purchase these properties. However, there is a large difference between neighbourhoods. There are properties, mostly flats, available in some neighbourhoods for £95, 000 or less,
which would be affordable for households with the median income (and a deposit). Private rents in the CCW are generally similar, or slightly higher than the citywide average for each property type. The median 2 bed is £650pcm compared
to £600 in Sheffield.
Housing Market
An income of £27,736 is required to rent the average property. The only property type affordable for the median income would be a shared room,
affordable with an income of £16,656.
All social housing that was let attracted more bids than elsewhere in the city. The one bedroom properties were particularly sought after attracting an
average 66 bids compared to 44 elsewhere in the city
Older people's independent living housing
The City Centre West has a lower than average older population, only 10% of residents are aged over 65 years.
It also has 47 older people's schemes located in this HMA, 55% of which are in the socially rented sector. The distribution across neighbourhoods is fairly
even.
Therefore the provision for older people is reasonably good compared to other parts of the city, and the projected shortfall in specialist accommodation
for older people is smaller than other HMA's, but is still 173 properties by 2034.
More housing designed to accessible and wheelchair accessible and adaptable standards is required in all parts of the city to meet current need and the
requirements of a growing older population.
47

19. City Centre West Housing Recommendations
Recommendations In summary as a guide, there is need for following house types in the City Centre West to help diversify the stock and addres s unmet need: Family housing for sale - The more suburban neighbourhoods of the City Centre West offer a great opportunity for the development of Family housing for sale with 2, 3, and 4
bedrooms. These would include Crookes, Crosspool, Endcliffe, Nether Edge and Devonshire Quarter in the city centre. These are desirable areas with low crime and high performing schools. These would add to the city’s stock of homes in the £250,000+ bracket.
Social rented properties The proportion of social housing in the area is low considering the popularity of the area and the SHMA estimated an affordab le housing shortfall of 415
properties over the 5 years from 2013. Adding social housing of all types would increase the opportunities for people seeking social housing to access low cost, goo d quality housing. New social apartments should be mostly one beds, as these are most in demand, but also two and three bed houses as demand is high and fewer become
available. Homes with 2 bedrooms for sale in high demand neighbourhoods, including Starter Homes Despite there being an ample supply of terraced properties and flats in the area, these homes are located in a few neighbourh oods and there is demand for
more two bedroom properties for sale across the City Centre West. The mosaic profile indicates that the area's population of groups such as 'Career Builders' (average income around £36,000) o r 'Central Pulse' (average
income around £30.000) are a pool of younger people with the income levels to provide a market for new build properties for f irst time buyers for example Starter Homes.
The delivery of smaller homes in the neighbourhoods of Nether Edge, Crookesmoor and Endcliffe would make this HMA more access ible to first time buyers and those with lower incomes. Delivery in neighbourhoods such as Sharrow or Broomhall would help diversify the housing stock and tenure mix in those areas.
Care and Support Needs
The City Centre West has a lower percentage of disabled households than citywide and a much lower proportion of households in the CCW say they need
adaptations to stay in their property than citywide.
Double the proportion of disabled households have a learning disability and suitable accommodation for this client group should be considered.
The lower number of adaptations needed implies that stock in this area is adequate to meet the needs of the disabled population.
A higher proportion of households also said that they required help maintaining their home / garden reflecting the number of larger properties in this
HMA.
48

Sources
Sheffield Strategic Housing Market Assessment 2013
Sheffield Housing Market Bulletin
Sheffield House Price Summary
Local Area Partnerships
Sheffield Community Profiles
Older people's independent living housing There will be some need for new provision of older people's independent living accommodation in the area. With equity levels being high in this area, the
majority of this accommodation should be for sale and shared ownership but some additional affordable rent provision is also required.
49