CITIZEN REPORT CARD ON MUNICIPAL SERVICES IN · PDF fileTable 1: Citizen Report Card -...
70
www.iwaweb.org CITIZEN REPORT CARD ON MUNICIPAL SERVICES IN AFGHANISTAN 2017
Transcript of CITIZEN REPORT CARD ON MUNICIPAL SERVICES IN · PDF fileTable 1: Citizen Report Card -...
www.iwaweb.org
CITIZEN REPORT CARD ON MUNICIPAL SERVICES IN AFGHANISTAN
2017


INTEGRITY WATCH AFGHANISTAN
CITIZEN REPORT CARD ON MUNICIPAL SERVICES IN AFGHANISTAN 2017 3
Cover photos: Integrity Watch Afghanistan
Copyright © 2017 by Integrity Watch Afghanistan. All rights reserved.
Published by Integrity Watch Afghanistan
Kolola Poshta, Kabul, Afghanistan
Email: [email protected]
Website: www.iwaweb.org
Integrity Watch is an Afghan civil society organization committed to increasing transparency, accountability, and integrity in Afghanistan. Integrity Watch was created in October 2005 and established itself as an independent civil society organization in 2006. The head office of Integrity Watch is in Kabul with provincial programmatic outreach in Balkh, Bamyan, Herat, Kabul, Kapisa, Kunduz, Nangarhar, Paktia, and Parwan provinces of Afghanistan.
Over the last decade, Integrity Watch’s work focused on: Community Monitoring, Research, and Advocacy.
Ever since its establishment, Integrity Watch has tried to encourage active citizenship and community mobilization through its programs. The community monitoring work included development of community monitoring tools, mobilizing and training communities to monitor infrastructure projects, public services, courts, and extractives industries.
The research work focused on policy-oriented research measuring trends, perceptions and experiences of corruption and covering wide range of corruption related issues including security and justice sectors, extractive
industries, public finance and budget management, and aid effectiveness. The objective is to develop new, ground-breaking empirical research in order to set the agenda, influence decision-makers, bring to the public attention non-documented and un-explored issues.
Integrity Watch has taken up a pioneering role in advocating for knowledge-based decision-making and informed public debate on corruption and integrity issues. The advocacy work includes facilitation of policy dialogue on issues related to integrity, transparency, and accountability. IWA’s policy advocacy has been to examine accountability of the government and service providers to the communities they serve. The issues focused on to date are access to information, budget transparency and accountability, aid transparency and effectiveness, effective public service delivery, and anti-corruption.
ABOUT INTEGRITY WATCH

Integrity Watch would like to express its appreciation and gratitude to the team responsible for the production of this report. We extend our appreciation to many people but in particular to the report’s author, Toby Mendel, human rights lawyer specialising in freedom of expression, the right to information and democracy rights, and Executive Director of the Centre for Law and Democracy, and to Ezatullah ADIB, Research Manager of Integrity Watch Afghanistan, for defining the methodology, collecting the data, and for Statistical Analysis of the findings of the survey.
We would like to acknowledge the Afghan Government Authorities and all those who take part in facilitating this study in Kabul and all provinces. Our special thank goes to Nasir Ahmad Kohi, Naseema Malikzai, Dr. Ahmad Shah,
Mohammad Jamil, Mohammad Hanif Hashimy and all Field Coordinators, Field Enumerators, Quality Control Officers and interviewees for their tremendous work and support in the field.
We would also like to thank Sayed Ikram Afzali, Nasir Timory and all other reviewers who took the time to review and comment on the initial drafts of this report.
Finally, the management and support staff of Integrity Watch Afghanistan provided the necessary administrative and logistical assistance that allowed the project to run smoothly.
ACKNOWLEDGEMENTS

2
INTEGRITY WATCH AFGHANISTAN
CITIZEN REPORT CARD ON MUNICIPAL SERVICES IN AFGHANISTAN 2017
TABLE OF CONTENT
About Integrity Watch ..................................................................................................................................................... iiAcknowledgements .........................................................................................................................................................1ACRONYMS... ...................................................................................................................................................................1Executive Summary .........................................................................................................................................................2Introduction... ..................................................................................................................................................................5Methodology ...................................................................................................................................................................7Overview of Citizen Report Cards ..................................................................................................................................10Overview of Survey .......................................................................................................................................................13General Perceptions of Municipal Services ...................................................................................................................15Perceptions of Key Services ...........................................................................................................................................18Bribes........... .................................................................................................................................................................37Cross-cutting Themes ....................................................................................................................................................38Conclusion and Recommendations ...............................................................................................................................43Annexes........ .................................................................................................................................................................47
TABLES
Table 1: Citizen Report Card - Sampling Plan .................................................................................................................. 8
Table 2: Example of How Average Community Scores Are Calculated .......................................................................... 13
Table 3: Ten Most Popular Reasons for Visiting the Municipality ................................................................................. 15
Table 4: Scores by Question by District of Kabul ........................................................................................................... 29
Table 5: Score of Each District over Time ...................................................................................................................... 31
Table 6: Average Scores by Question in Kabul over Time .............................................................................................. 34
Table 7: Change of Score by District by Question From 2015 to 2017 .......................................................................... 35
INTEGRITY WATCH AFGHANISTAN
CITIZEN REPORT CARD ON MUNICIPAL SERVICES IN AFGHANISTAN 2017 3
FIGURES
Figure 1: Have you, or anyone in your family visited the Municipality in the pat one year? .......................................................... 15
Figure 2: Generally speaking, are you satisfied or dissatisfied with the quality of the services provided by the Municipality? ..16
Figure 3: How satisfied are you? ........................................................................................................................................................ 16
Figure 4: How do you rate the overall services provided by the Municipality? ............................................................................... 16
Figure 5: In the past one year, have the quality of the services provided by the Municipality improved or worsened? ..............17
Figure 6: Comparison of 9 city ............................................................................................................................................................ 25
Figure 7: Have you, or anyone in your family visited the Municipality in the past one year? ........................................................ 26
Figure 8: ............................................................................................................................................................................................... 27
Figure 9: How do you rate the overall services provided by the Manucipality? .............................................................................. 27
Figure 10: In the past one year, have the quaity of the services provided by the Manucipality inproved or worsened? .............27
Figure 11: Indicator 8, Bas Stand ........................................................................................................................................................ 30
Figure 12: Indicator 16, Effectiveness of Complains Mechanism ..................................................................................................... 30
Figure 13: Have you, or anyone in your family visited the Municipality in the past one year? ...................................................... 38
Figure 14:Generally speaking, are you satisfied or dissatisfied with the quality of the services provided by the Municipality? .39
Figure 15: How do you rate the overall services provided by the Municipality? ............................................................................. 39
Figure 16: How do you rate the overall services provided by the Municipality? ............................................................................. 40
Figure 17: Have you, or anyone in your family visited the Municipality in the past one year? ...................................................... 40
Figure 18: How do you rate the overall services provided by the Municipality? ............................................................................. 41
Figure 19: Generally speaking, are you satisfied or dissatisfied with the quality of the services provided by the Municipality? 41
1
INTEGRITY WATCH AFGHANISTAN
CITIZEN REPORT CARD ON MUNICIPAL SERVICES IN AFGHANISTAN 2017
CRC Citizens Report Card
IWA Integrity Watch Afghanistan
CSC Community Score Card
CSPro Census and Survey Processing System
SPSS Statistical Package for Social Sciences
NGO Non-Governmental Organization
MD Municipality District
ATI Access to Information
OCAI Oversight Commission on Access to Informaiton
ACRONYMS
Executive Summary
CITIZEN REPORT CARD ON MUNICIPAL SERVICES IN AFGHANISTAN 2017 2
In Afghanistan, as in many countries, serious problems remain in terms of the provision of municipal services. Although these are not as high profile as some of the other activities of government, such as conducting foreign relations, they are often far more relevant to the day-to-day lives of citizens. The management of issues like municipal transportation, housing construction permits and collection of waste have a huge impact on the lives of ordinary people.
Despite this, in many countries, a sort of democratic deficit has emerged at the local level whereby relatively few citizens even bother to vote, let alone engage in local politics in less formal ways, such as through advocacy or monitoring. This is exacerbated by a more general lack of accountability on the part of public agencies, which operate as monopolies and are thus not really subject to consumer pressure. This can create a vicious circle around the provision of municipal services, whereby citizens become less and less engaged as performance drops.
Citizen Report Cards (CRC) are designed to address this problem. Although they revolve around an opinion survey, if done properly they represent far more than that. The survey itself, inasmuch as it is targeted at a representative sample of the users of a service or subjects of a governance system, is a way of objectively assessing citizens’ views about the quality of services or public agencies. If the survey is accompanied by appropriate dissemination and advocacy strategies, aimed at reforming the government service in question, the whole process becomes one of exerting social pressure to improve municipal services rather than just a survey.
To address the problem of poor municipal service delivery in Afghanistan, Integrity Watch Afghanistan (IWA) conducted two Community Scorecard assessments of services in Kabul in 2014 and 2016. In 2017, the programme was extended to cover eight additional cities, and the approach was transformed from a Community Scorecard into a CRC exercise. This report assesses the results of the survey that was administered as part of that process.
The survey starts out with six general questions to gauge the extent to which people interact with municipalities and their general impressions about the performance of municipalities. The results are quite stark, showing that in only 37% of households had even one member visited the municipality in the last year, while only 13% of respondents were “fully satisfied” with the services they received. This
points to a clear need for municipalities to undertake measures to increase engagement with citizens.
The core part of the survey asks respondents to give a rating of ‘Very Bad’, ‘Bad’, ‘Fair/Just OK’, ‘Good’ or ‘Very Good’ in relation to 16 different indicators. Eleven of these refer to core service areas for municipalities in the country, such as garbage collection, providing bus shelters and maintaining infrastructure. Five refer to governance issues, of which the core ones are providing access to information, promoting participation in decision-making, being accountable and providing effective complaints opportunities. The results are quite dramatic. The overall score for all indicators is 54%, or between ‘Bad’ and ‘Fair/Just OK’. Only two indicators score above 60%, which is equivalent to just a ‘Fair/Just OK’ rating.
When the results are broken down by indicator and city, only 2% achieve a score of 80% or ‘Good’, which is arguably the goal to which all municipalities should be working for all indicators, and only 13% score 70% or more, the midway point between a ‘Fair/Just OK’ and ‘Good’ rating. The results are even bleaker for Kabul which, when broken down by district, has less than one-half of one percent of its score reaching 80%, or ‘Good’, and only 2.5% receiving a score of 70%. This clearly demonstrates the need for dramatic improvement across all cities and districts of Kabul and across all indicators.
To ensure progress in this regard, municipalities should, at a minimum, adopt clear plans for improving performance against set targets over time. These could include reaching threshold CRC survey scores, for example of 60% for one-half of the indicators and 70% for one-quarter of the indicators within a two-year period. They should also commit to undertaking the actions which may be needed to do this, such as training staff, providing the leadership and management direction needed to change attitudes, combating corruption and so on.
Importantly, performance on the governance indicators is even worse, with not a single score of 70% or more across all cities and districts for the four main indicators in this group. This points to a particular need to improve performance in this area, not only to address the direct performance failure but also because levering up performance on these indicators can have a positive knock-on effect on performance in relation to all of the service indicators. The link between better governance, and especially the sorts of governance issues covered in the survey, and improving service delivery is well established.
EXECUTIVE SUMMARY
3
INTEGRITY WATCH AFGHANISTAN
CITIZEN REPORT CARD ON MUNICIPAL SERVICES IN AFGHANISTAN 2017
The CRC survey suggests that only a tiny percentage of respondents, namely 1.6%, paid a bribe to receive a municipal service. On its face, that is tremendous news, suggesting that this problem is not at all widespread in Afghanistan. The problem, however, is that this result is completely at odds with other research on this in Afghanistan, including another survey conducted by IWA on the Access to Information Law, essentially concurrently with this survey. More research is therefore needed to find out what the real situation is here.
The CRC survey showed that women engage far less actively at the municipal level than men, which may not come as a surprise for many given the general challenges with achieving gender equality in Afghanistan. However, this is perhaps a particular gender equality problem given that the role played by women in family life means that this sort of exclusion will likely have a knock-on effect in the sense of also excluding their families, and especially their children, from accessing municipal services and benefits. It is, as a result, of the greatest importance that targeted efforts be made to address this problem.
Other groups in need of targeted efforts to ensure equal access to municipal services include those with lower levels of education and certain ethnic groups, in particular Hazaras and Pashtuns.
Key Recommendations ▪ Municipalities should invest in measures to address the
low level of engagement by citizens with municipalities, including by publicising the services they provide and their benefits, and, where necessary, putting in place new systems to facilitate interactions.
▪ All cities and all districts in Kabul need to do much better in terms of delivering services across all of the 16 indicators covered by the CRC exercise, including by adopting clear plans, with clear targets, for improving service delivery.
▪ Particular attention should be given to improving performance on the governance indicators, including because this can have a positive knock-on effect on the delivery of other services.
▪ More research should be done looking into the question of whether and to what extent local residents in municipalities pay small bribes to obtain services.
▪ Special efforts should be made to reach out to women with a view to engaging them more at the municipal level.
▪ Similar efforts should be made to reach out to citizens with lower levels of education and those ethnic groups which engage less with municipalities.

Mazar-e-Sharif: is the provincial capital of Balkh province. The city is among the three top in terms of public satisfaction with municipality services.
5
INTEGRITY WATCH AFGHANISTAN
CITIZEN REPORT CARD ON MUNICIPAL SERVICES IN AFGHANISTAN 2017
The services provided by municipalities are some of the most important public services provided to citizens. Although they are not as high profile as many central government activities, such as defence or foreign relations, their actual impact on the people is often much greater. For most people, local road conditions, the collection of garbage, public transportation and housing construction affect their lives far more directly and importantly than relations with other countries.
Despite this, or perhaps because of it, public control over municipal actors and the services they provide is often limited. This applies both to formal political oversight systems, such as elections, which often attract far less public engagement than national elections, and to the more informal, but equally important, day-to-day systems of control which take place through approaches such as monitoring, advocacy and media reporting.
The system of Citizen Report Cards (CRCs) was developed largely to address this problem, as well as the wider problem of lack of accountability of public agencies. Unlike private sector actors, who need to compete to retain their customers, public agencies are often monopolies whose clients, often the whole citizenry, are forced to remain as customers because there is no alternative means of obtaining the service.
CRCs are a tool to engage citizens in assessing the delivery of priority public services and specific public agencies as part of the system of municipal government. Although a citizen survey is at the heart of a CRC exercise, it goes far beyond that in both scope and significance. By directing the survey at users of municipal services, or targets of municipal governance, a CRC survey represents an objective assessment of users’ satisfaction, a sort of rating of the target services or public agencies involved.1 Presenting the results in a report card format, along the lines of the report cards that are issued to school or university students, facilitates the standardisation of results. This, in turn, allows for comparative assessments between services and agencies, as well as longitudinal assessments over time.
In addition, most CRC exercises do not end with the survey and the production of a report on the results, including the report cards. A key characteristic of CRC exercises is that a programme of public dissemination and advocacy
1 http://www.pria-academy.org/pdf/2.m4-2-Citizen-Report-Cards-Civicus.pdf
follows the preparation of the report on the results. The medium- to longer-term aim of this advocacy is reform of the target services or agencies, with a view to addressing shortcomings, gaps in service provision and other problems. As such, CRCs are more a social process than a simple survey event.
In Afghanistan, as in other countries, insufficient accountability and citizen oversight at the local or municipal level has contributed to a situation where service provision is far less than optimal. To help address this problem, Integrity Watch Afghanistan (IWA) conducted two Community Scorecard exercises in the 22 different districts of Kabul in 2014 and 2016, with reports being produced in 20152 and 2016.3 After reviewing the results of these exercises, in 2017 IWA decided to expand the scope of the exercise to cover nine cities in nine provinces of Afghanistan, and to change the methodology to a CRC approach.
This report provides an overview of the results of a CRC survey conducted in 2017. The core part of the survey involves the same questions as the earlier Community Scorecard exercises conducted in Kabul. Most of the questions – 11 out of the 16 – focus on the provision of core municipal services such as solid waste and wastewater collection, bus shelters, car parking, roads, parks and green spaces, registration of documents and licensing, tax collection, regulation of private construction and sanitation.
Going beyond the scope of a traditional CRC, the current exercise also assesses five governance issues, namely public cooperation in keeping the municipality clean, access to information, public participation in planning and decision-making, accountability and systems for complaints. IWA believes that these core governance issues are key to the successful delivery and improvement of municipal services and that to focus only on services would be to fail to cover a key area where reforms are needed to improve municipal services.
The CRC survey was conducted according to accepted and tested survey methodologies, and the use of rigorous quality control measures to ensure that the methodology was respected. These features of the survey are described
2 Integrity Watch Afghanistan, Kabul Municipality Services From the Eyes of Community: A Community Scorecard Approach (Kabul: Integrity Watch Afghanistan, 2016).
3 Integrity Watch Afghanistan, Community Scorecard of Kabul Municipality 2016 (Kabul: Integrity Watch Afghanistan, 2016).
INTRODUCTION

Introduction
CITIZEN REPORT CARD ON MUNICIPAL SERVICES IN AFGHANISTAN 2017 6
in the first substantive section of this report, namely Methodology. This is followed by a section reviewing the development, goals and overall approach of CRCs, titled Overview of Citizen Report Cards.
The following four sections focus on the survey itself and its results. The first, Overview of Survey, describes the survey instrument and the different sections into which it is divided. The second, General Perceptions of Municipal Services, reviews the first six questions on the survey, which assess general issues such as whether or not respondents have visited the municipality in the last year and for what reason, whether they were satisfied, partially or fully, with the services provided, their overall assessment of services in the municipality and their view on whether the quality of services has improved or deteriorated over the last year.
The third, and longest, section, Perceptions of Key Services, focuses on the specific responses to the 16 service and governance indicators described above. This section, in turn, is broken down into three sub-sections. The first, Performance Across the Indicators, looks at the overall or aggregated results of the survey, broken down by indicator. This allows for a comparative assessment of how, overall, municipalities are doing in terms of the different services or governance issues covered. The second sub-section, Performance by City, breaks down the results by city, comparing how each city performs on the different indicators, as well as overall.
The final (third) sub-section here focuses on Kabul. For Kabul, as in the two previous Community Scorecard exercises, the results are broken down according to
performance in the 22 districts of Kabul. This sub-section compares the results across these districts. It also looks at longitudinal performance, comparing the results achieved in the current exercise with the 2016 and 2016 Community Scorecard assessments. Although this was a different methodology, the parallels are close enough to warrant undertaking this comparative analysis.
The fourth section focusing on the survey results, titled Bribes, looks at the results of the last three questions on the survey, which ask whether the respondent paid a bribe to obtain the service, the purpose of the bribe and whether or not this resulted in the service being provided.
A final substantive section provides a brief overview of the results broken down along various demographic or cross cutting themes. The specific themes assessed here are the gender, education, age and ethnicity of the respondent, and the combined income of the household being surveyed. For purposes of this report, the focus is on responses to the first six general questions of the survey. A more detailed assessment of cross cutting responses to the 16 service and governance indicators covered by the survey could be the subject of a separate report.
The report ends with a conclusion and set of recommendations for change.
7
INTEGRITY WATCH AFGHANISTAN
CITIZEN REPORT CARD ON MUNICIPAL SERVICES IN AFGHANISTAN 2017
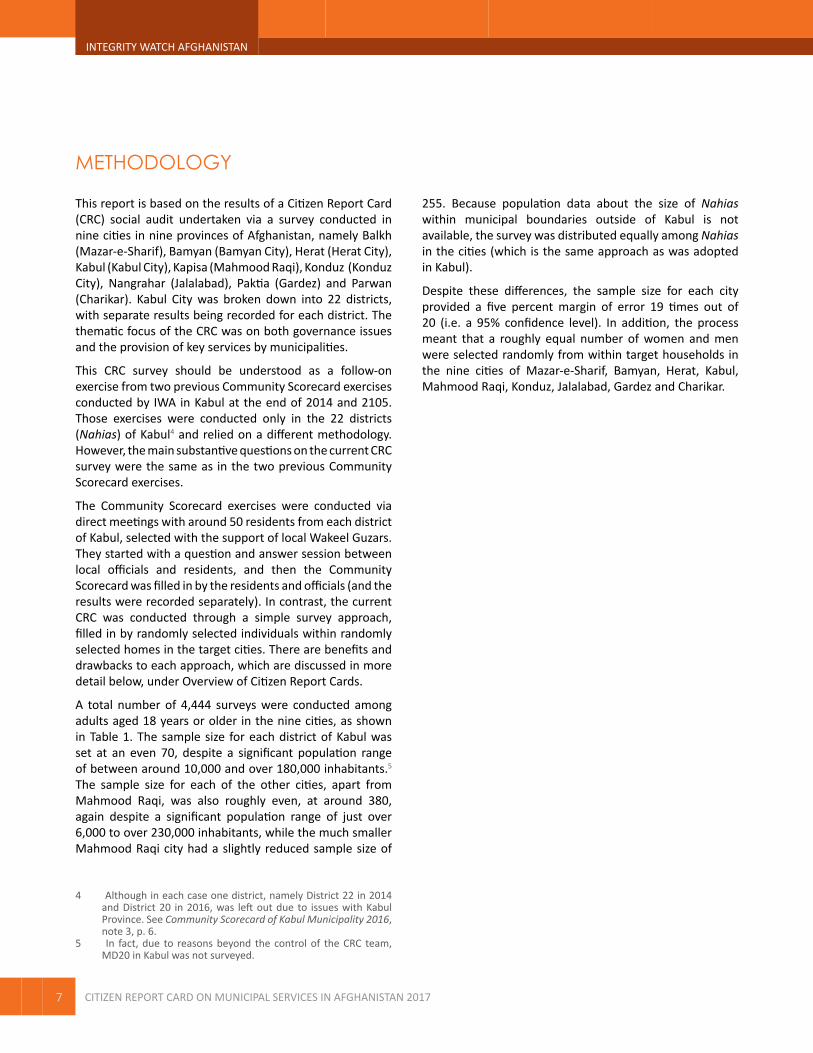
This report is based on the results of a Citizen Report Card (CRC) social audit undertaken via a survey conducted in nine cities in nine provinces of Afghanistan, namely Balkh (Mazar-e-Sharif), Bamyan (Bamyan City), Herat (Herat City), Kabul (Kabul City), Kapisa (Mahmood Raqi), Konduz (Konduz City), Nangrahar (Jalalabad), Paktia (Gardez) and Parwan (Charikar). Kabul City was broken down into 22 districts, with separate results being recorded for each district. The thematic focus of the CRC was on both governance issues and the provision of key services by municipalities.
This CRC survey should be understood as a follow-on exercise from two previous Community Scorecard exercises conducted by IWA in Kabul at the end of 2014 and 2105. Those exercises were conducted only in the 22 districts (Nahias) of Kabul4 and relied on a different methodology. However, the main substantive questions on the current CRC survey were the same as in the two previous Community Scorecard exercises.
The Community Scorecard exercises were conducted via direct meetings with around 50 residents from each district of Kabul, selected with the support of local Wakeel Guzars. They started with a question and answer session between local officials and residents, and then the Community Scorecard was filled in by the residents and officials (and the results were recorded separately). In contrast, the current CRC was conducted through a simple survey approach, filled in by randomly selected individuals within randomly selected homes in the target cities. There are benefits and drawbacks to each approach, which are discussed in more detail below, under Overview of Citizen Report Cards.
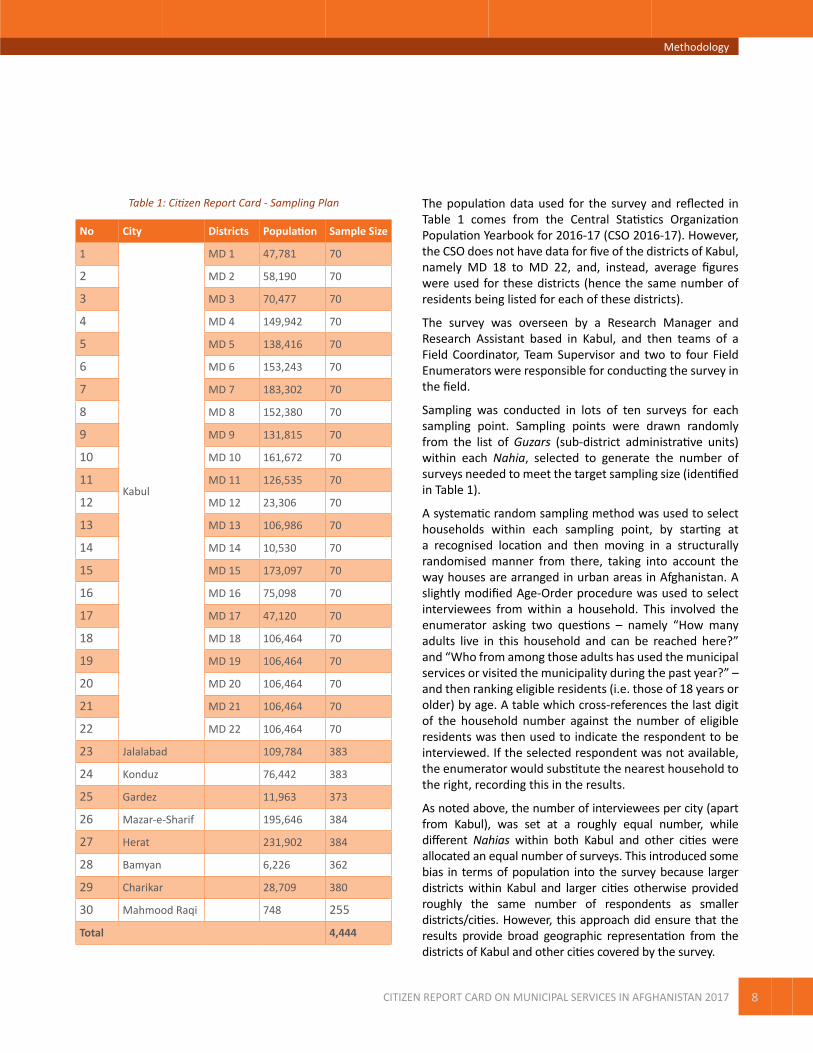
A total number of 4,444 surveys were conducted among adults aged 18 years or older in the nine cities, as shown in Table 1. The sample size for each district of Kabul was set at an even 70, despite a significant population range of between around 10,000 and over 180,000 inhabitants.5 The sample size for each of the other cities, apart from Mahmood Raqi, was also roughly even, at around 380, again despite a significant population range of just over 6,000 to over 230,000 inhabitants, while the much smaller Mahmood Raqi city had a slightly reduced sample size of
4 Although in each case one district, namely District 22 in 2014 and District 20 in 2016, was left out due to issues with Kabul Province. See Community Scorecard of Kabul Municipality 2016, note 3, p. 6.
5 In fact, due to reasons beyond the control of the CRC team, MD20 in Kabul was not surveyed.
255. Because population data about the size of Nahias within municipal boundaries outside of Kabul is not available, the survey was distributed equally among Nahias in the cities (which is the same approach as was adopted in Kabul).
Despite these differences, the sample size for each city provided a five percent margin of error 19 times out of 20 (i.e. a 95% confidence level). In addition, the process meant that a roughly equal number of women and men were selected randomly from within target households in the nine cities of Mazar-e-Sharif, Bamyan, Herat, Kabul, Mahmood Raqi, Konduz, Jalalabad, Gardez and Charikar.
METHODOLOGY
Methodology
CITIZEN REPORT CARD ON MUNICIPAL SERVICES IN AFGHANISTAN 2017 8
The population data used for the survey and reflected in Table 1 comes from the Central Statistics Organization Population Yearbook for 2016-17 (CSO 2016-17). However, the CSO does not have data for five of the districts of Kabul, namely MD 18 to MD 22, and, instead, average figures were used for these districts (hence the same number of residents being listed for each of these districts).
The survey was overseen by a Research Manager and Research Assistant based in Kabul, and then teams of a Field Coordinator, Team Supervisor and two to four Field Enumerators were responsible for conducting the survey in the field.
Sampling was conducted in lots of ten surveys for each sampling point. Sampling points were drawn randomly from the list of Guzars (sub-district administrative units) within each Nahia, selected to generate the number of surveys needed to meet the target sampling size (identified in Table 1).
A systematic random sampling method was used to select households within each sampling point, by starting at a recognised location and then moving in a structurally randomised manner from there, taking into account the way houses are arranged in urban areas in Afghanistan. A slightly modified Age-Order procedure was used to select interviewees from within a household. This involved the enumerator asking two questions – namely “How many adults live in this household and can be reached here?” and “Who from among those adults has used the municipal services or visited the municipality during the past year?” – and then ranking eligible residents (i.e. those of 18 years or older) by age. A table which cross-references the last digit of the household number against the number of eligible residents was then used to indicate the respondent to be interviewed. If the selected respondent was not available, the enumerator would substitute the nearest household to the right, recording this in the results.
As noted above, the number of interviewees per city (apart from Kabul), was set at a roughly equal number, while different Nahias within both Kabul and other cities were allocated an equal number of surveys. This introduced some bias in terms of population into the survey because larger districts within Kabul and larger cities otherwise provided roughly the same number of respondents as smaller districts/cities. However, this approach did ensure that the results provide broad geographic representation from the districts of Kabul and other cities covered by the survey.
Table 1: Citizen Report Card - Sampling Plan
No City Districts Population Sample Size
1
Kabul
MD 1 47,781 70
2 MD 2 58,190 70
3 MD 3 70,477 70
4 MD 4 149,942 70
5 MD 5 138,416 70
6 MD 6 153,243 70
7 MD 7 183,302 70
8 MD 8 152,380 70
9 MD 9 131,815 70
10 MD 10 161,672 70
11 MD 11 126,535 70
12 MD 12 23,306 70
13 MD 13 106,986 70
14 MD 14 10,530 70
15 MD 15 173,097 70
16 MD 16 75,098 70
17 MD 17 47,120 70
18 MD 18 106,464 70
19 MD 19 106,464 70
20 MD 20 106,464 70
21 MD 21 106,464 70
22 MD 22 106,464 70
23 Jalalabad 109,784 383
24 Konduz 76,442 383
25 Gardez 11,963 373
26 Mazar-e-Sharif 195,646 384
27 Herat 231,902 384
28 Bamyan 6,226 362
29 Charikar 28,709 380
30 Mahmood Raqi 748 255
Total 4,444

9
INTEGRITY WATCH AFGHANISTAN
CITIZEN REPORT CARD ON MUNICIPAL SERVICES IN AFGHANISTAN 2017
Mahmood Raqi, Kapisa: Almost all of the residents have visited the city’s municipality at least once.
Methodology
CITIZEN REPORT CARD ON MUNICIPAL SERVICES IN AFGHANISTAN 2017 10
11
INTEGRITY WATCH AFGHANISTAN
CITIZEN REPORT CARD ON MUNICIPAL SERVICES IN AFGHANISTAN 2017
The content of the survey is described in more detail below, under Overview of Survey. In terms of the process of developing the survey, the core part of it contained 16 questions about both governance issues and the services provided by municipalities. These questions had already been developed for purposes of the Community Scorecard exercises conducted in Kabul in 2014 and 2016. As part of that process, and to make sure that the questions were comprehensive and covered the core services of Kabul Municipality, the research team tested the questions both with municipality staff and local residents in Kabul. The questions were finalised after incorporating relevant comments generated during the test phase.
The survey instrument was translated using standard, quality translation techniques. Following that, the research team organised cognitive testing of the survey among its own members, to verify that the translation and the words used were understood equally in the different target languages.
Several forms of quality control were incorporated into the process and unique IDs were provided to each sample and enumerator, as well as to each household covered, to facilitate this. Enumerators were selected from the cities where the survey was to be conducted, to enhance the level of comfort of participants and to take advantage of local knowledge. At the same time, enumerators were required to have extensive experience in surveying, as well as higher education.
Various formal systems of quality control were employed, including Accompanied Interviews, Spot Checks, Back Checks, Final Scrutiny in the Field and Statistical Tests During Data Entry. In terms of Accompanied Interviews, the Team Supervisor accompanied each team and observed the interview process closely to ensure that it was unbiased and the fieldwork was carried out properly. For this purpose, the Team Supervisor observed ten percent of the field interviews.
In terms of Spot Checks, the Field Coordinator and Team Supervisor both made unannounced, surprise visits and spot checks while the fieldwork was being undertaken. This allowed verification that the interviews were being done properly. In addition, Back Checks were conducted by Field Coordinators and the research team from HQ on a randomly selected 25% of the interviews to make sure the information marked in the questionnaire reflected the true opinion of the respondents. These back checks were done
through house visits or phone calls. The Research Manager selected a few questions for purposes of back checks, while the Field Coordinator selected the 25% of completed questionnaires to be back checked.
In terms of Scrutiny in the Field, once the interviews were completed, the Team Supervisor carefully checked completed questionnaires daily before leaving the area to ensure that they were filled in accurately. If gaps or mistakes were found or answers appeared to be inconsistent, the Team Supervisor sent the enumerator back to the household to correct the mistake.
Very careful quality control was also exercised over the processing of the data, including through statistical tools. A database was created within CSPro for data entry, due to its inherent capacities in the areas of data entry, verification, modification and editing, while Statistical Package for Social Sciences (SPSS) was used for analysis. To facilitate correct data entry, the database design was tailored to match the questionnaire, and automated error messages were enabled for missing or incorrect data (for example, data that did not correspond to the possible range of responses). Experienced data entry clerks were hired and provided with tailored training. Data entry clerks were given IDs and allocated surveys/questions on a random basis to facilitate verification of their work. Twenty percent of the data was verified by another data entry clerk than the one who entered the data in the first place. The data management officer also randomly checked ten percent of the data and, where multiple errors were detected, the data entry clerk was asked to re-enter all of the data in the relevant range.
Overall, the process was undertaken in accordance with accepted CRC standards, as set out in a leading CRC manual.6 As a result, the results provide a reliable indication of the perceptions of citizens in the relevant cities regarding the governance issues and provision of services covered.
6 See Improving Local Governance and Service Delivery: Citizen Report Card Learning Tool Kit: Print Version of the Learning Toolkit: 2007. Available at: http://www.citizenreportcard.com/crccom/crc/pdf/manual.pdf.
Overview of Citizen Report Cards
CITIZEN REPORT CARD ON MUNICIPAL SERVICES IN AFGHANISTAN 2017 12
A Citizen Report Card (CRC) exercise on public services is not just an ordinary opinion poll. It is, rather, an exercise which is designed to gather and then present publicly the actual experiences people have had in terms of the quality and performance of public agencies. In most cases, the process involves broad citizen, civil society and often also official engagement at each level, and has as a wider goal the improvement of the performance of public agencies. It normally goes well beyond the survey exercise, involving follow-up steps designed to promote institutional reforms, including through disseminating the results and otherwise using them for advocacy purposes. The survey will cover only those individuals who have had direct experience in the use of the specific services being assessed or who have interacted with the public agencies being assessed. The results of the survey will be presented in a comparative ‘report card’ format, which allows for benchmarking and comparison between services/agencies over time.7
CRCs originated in the early 1990s in Bangalore, India, when a local NGO, the Public Affairs Center, used them to try to promote public sector reform. The core idea behind CRCs was to serve as a surrogate for the role of competition in the private sector, given that public agencies are normally monopolies which lack competitive incentives to respond to the needs of their clients, i.e. citizens. Exposing public agencies to credible citizen assessments of their performance can at least partially recreate the consumer pressure that drives private companies to do better.
The name is derived from the key way in which the results are presented, namely in an analogous form to a report card which would be issued to a student. To do this, CRCs rely on credible statistical methods to average out the inputs from all survey participants, which include a representative sample of all relevant citizens (i.e. those using the service or falling within the jurisdiction of the public agency). The results are then presented in comparable formats, normally as comparative scores. The scores themselves represent the collective view of survey participants of the service, which gives them an objectivity that may not be present with other feedback techniques.
The Bangalore exercise appears to have been quite successful, with the repeated application of the exercise three times over a period of ten years having resulted in
7 See, for example, Anu Pekkonen, Citizen Report Cards (CIVICUS). Available at: http://www.civicus.org/documents/toolkits/PGX_H_Citizen%20Report%20Cards.pdf.
significant improvements in service performance.8 A report on the exercise by CIVICUS states:
In addition to improvements in service delivery, the exercise resulted in the increase of “social capital” within the local community. The initiative led to the formation of over 100 community based organizations and a unique state-citizen partnership forum to catalyze and assist the service providers to upgrade their services and responsiveness.9
Integrity Watch Afghanistan identifies four key potential benefits of CRCs:10
1. As diagnostic tool:
The CRC can provide citizens and governments with qualitative and quantitative information about prevailing standards and gaps in service delivery. As a result, the CRC:
▪ is a powerful tool when the monitoring of services is weak;
▪ provides a comparative picture about the quality of services; and
▪ compares feedback across locations/demographic groups to identify where service provision is significantly weak.
2. As an accountability tool:
The CRC reveals areas where the institutions responsible for service provision have not achieved mandated or expected service standards.
▪ Findings can be used to identify and demand specific improvements in services.
▪ Officials can be stimulated to work towards addressing specific issues.
8 See, for example, Samuel Paul, Citizen Report Cards: A Case Study (Public Affairs Centre). Available at: http://siteresources.worldbank.org/INTPCENG/1143141-1116501474243/20507527/CRC_Case.doc.
9 Anu Pekkonen, Citizen Report Cards, note 7.10 See Azatullah Adib, Research Collection Plan: Citizen Report
Card of Municipality Services.
OVERVIEW OF CITIZEN REPORT CARDS

13
INTEGRITY WATCH AFGHANISTAN
CITIZEN REPORT CARD ON MUNICIPAL SERVICES IN AFGHANISTAN 2017
3. As a benchmarking tool:
The CRC, if conducted periodically, can track changes in service quality over time.
▪ Comparison of findings across CRCs will reveal improvements or deterioration in service delivery.
▪ Conducting CRCs before and after introducing a new programme or policy can help measure its impact.
4. To reveal hidden costs:
Citizen feedback can expose extra costs beyond the mandated fees for using public services. The CRC thus:
▪ conveys information regarding the proportion of the population who pay bribes (either demanded or freely given) and the size of these payments; and
▪ estimates the amount of private resources spent to compensate for poor service provision.
Recognition of these benefits prompted IWA, after a comprehensive study of its potential, to use a CRC method to try to help improve service delivery by municipalities in Afghanistan. It may be noted that this is different from the Community Scorecard approach used in the previous assessments of services in Kabul alone. There are pros and cons of each approach. In general, the CRC approach allows for input from a more representative sample of the population. For example, in the Community Scorecard exercises, women only represented seven percent of all participants,11 whereas in the current CRC exercise, women accounted for roughly 50% of participants. On the other hand, the Community Scorecard approach allows for more front-end engagement between users and service providers. At the same time, this can always be built into the post-survey phase of a CRC exercise.
11 See Community Scorecard of Kabul Municipality 2016, note 3, p. 6.
According to a World Bank Note, a successful CRC exercise requires four main ingredients:
In general, an effective CRC undertaking requires a skilled combination of four things: i) an understanding of the socio-political context of governance and the structure of public finance, ii) technical competence to scientifically execute and analyze the survey, iii) a media and advocacy campaign to bring out the findings into the public domain, and iv) steps aimed at institutionalizing the practice for iterative civic actions.12
The World Bank Note identifies seven key steps in a CRC process, and these are repeated in the CIVICUS report. These are:
1. Identify scope, actors and purpose
At this stage, the types of services or public agencies that are being assessed need to be identified, along with the bodies who will carry out the exercise and the segments of the population that will be surveyed.
2. Develop the questionnaire
At this stage, the questionnaire will be developed. Consultations should be held with both users and service providers to identify the issues to be assessed. Ideally the draft questionnaire will be pre-tested or piloted to allow for further refinement. In addition to need, considerations at this stage include the available human and financial resources, which may impose its own limitations.
3. Sampling
At this stage, the sampling design, size and scope of the survey need to be decided upon.
4. Execution of the survey
This stage should start with selection and training of the survey team, including enumerators, followed by the roll-out of the actual survey, including quality control measures.
12 Citizen Report Card Surveys - A Note on the Concept and Methodology, Note No. 91, February 2004. Available at: http://siteresources.worldbank.org/I N T P C E N G / 1 1 4 3 3 8 0 - 1 1 1 6 5 0 6 2 6 7 4 8 8 / 2 0 5 1 1 0 6 6 /reportcardnote.pdf
Overview of Citizen Report Cards
CITIZEN REPORT CARD ON MUNICIPAL SERVICES IN AFGHANISTAN 2017 14
5. Data entry and statistical analysis
This stage involves entering the data into a (preferably specifically tailored) database (again with quality control measures) and then analysing it using statistical software.
6. Reporting and dissemination of findings
This stage is most context dependent and depends on all of the local circumstances. In most cases, a report will be prepared which presents the findings, including the Report Cards themselves, and provides a social analysis of the statistical results prepared in the previous stage. Often, dissemination involves the media, given their ability to reach out to the general public, but information technology tools are also often employed. A package of advocacy measures, involving actors beyond those who were directly involved in the conduct of the survey, should ideally be envisaged at this point.
7. Institutionalisation
Institutionalisation should flow from a successful programme of dissemination and advocacy, but this may also depend on political will and other factors (such as available resources). Institutionalisation may also take time. In the case of Bangalore, for example, serious improvements were only recorded on the third CRC, conducted nine years after the first one.
15
INTEGRITY WATCH AFGHANISTAN
CITIZEN REPORT CARD ON MUNICIPAL SERVICES IN AFGHANISTAN 2017
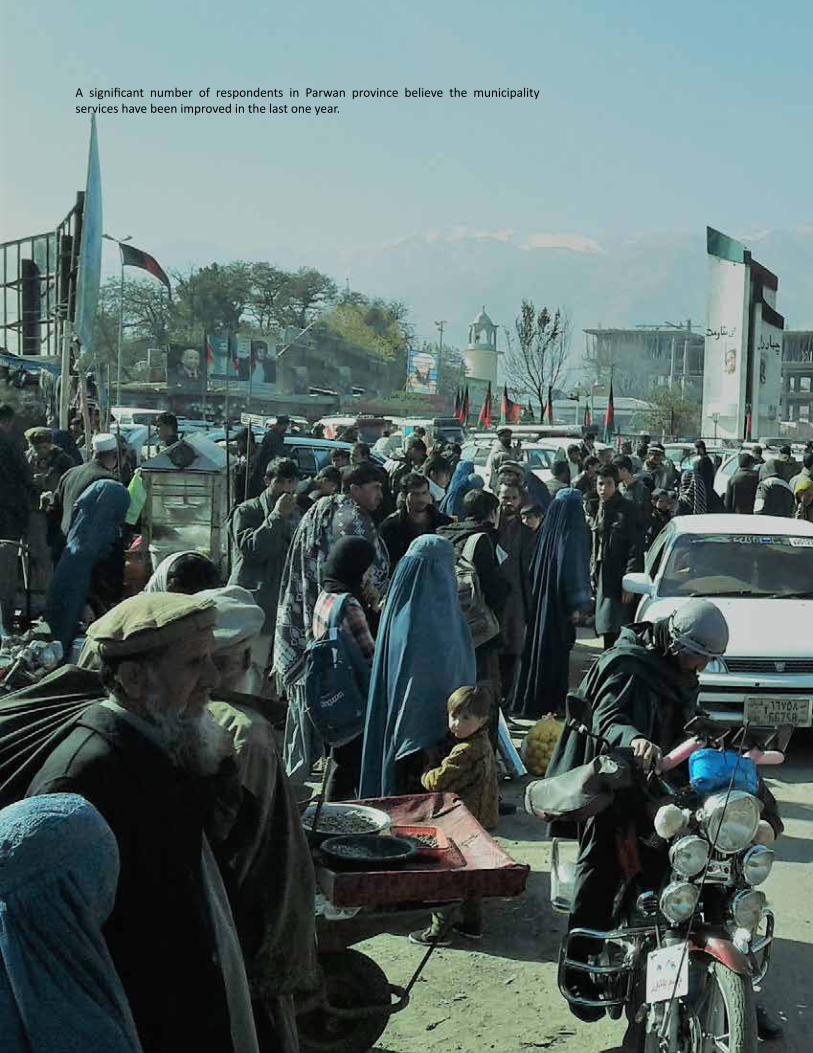
A significant number of respondents in Parwan province believe the municipality services have been improved in the last one year.
Overview of Citizen Report Cards
CITIZEN REPORT CARD ON MUNICIPAL SERVICES IN AFGHANISTAN 2017 16
17
INTEGRITY WATCH AFGHANISTAN
CITIZEN REPORT CARD ON MUNICIPAL SERVICES IN AFGHANISTAN 2017
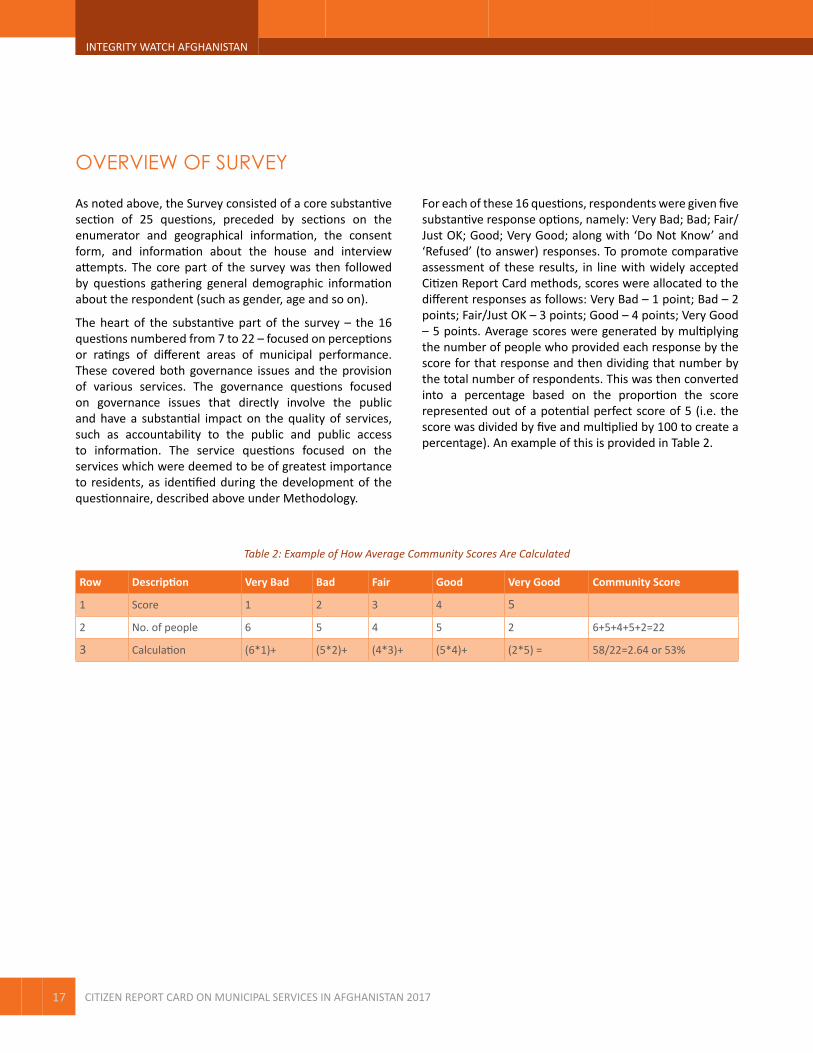
As noted above, the Survey consisted of a core substantive section of 25 questions, preceded by sections on the enumerator and geographical information, the consent form, and information about the house and interview attempts. The core part of the survey was then followed by questions gathering general demographic information about the respondent (such as gender, age and so on).
The heart of the substantive part of the survey – the 16 questions numbered from 7 to 22 – focused on perceptions or ratings of different areas of municipal performance. These covered both governance issues and the provision of various services. The governance questions focused on governance issues that directly involve the public and have a substantial impact on the quality of services, such as accountability to the public and public access to information. The service questions focused on the services which were deemed to be of greatest importance to residents, as identified during the development of the questionnaire, described above under Methodology.
For each of these 16 questions, respondents were given five substantive response options, namely: Very Bad; Bad; Fair/Just OK; Good; Very Good; along with ‘Do Not Know’ and ‘Refused’ (to answer) responses. To promote comparative assessment of these results, in line with widely accepted Citizen Report Card methods, scores were allocated to the different responses as follows: Very Bad – 1 point; Bad – 2 points; Fair/Just OK – 3 points; Good – 4 points; Very Good – 5 points. Average scores were generated by multiplying the number of people who provided each response by the score for that response and then dividing that number by the total number of respondents. This was then converted into a percentage based on the proportion the score represented out of a potential perfect score of 5 (i.e. the score was divided by five and multiplied by 100 to create a percentage). An example of this is provided in Table 2.
OVERVIEW OF SURVEY
Table 2: Example of How Average Community Scores Are Calculated
Row Description Very Bad Bad Fair Good Very Good Community Score
1 Score 1 2 3 4 5
2 No. of people 6 5 4 5 2 6+5+4+5+2=22
3 Calculation (6*1)+ (5*2)+ (4*3)+ (5*4)+ (2*5) = 58/22=2.64 or 53%

Overview of Survey
CITIZEN REPORT CARD ON MUNICIPAL SERVICES IN AFGHANISTAN 2017 18
The specific questions in this part of the survey asked respondents how they rated the following services:
▪ Solid Waste Management (question 7)
▪ Documents Registration and Licensing Process (question 8)
▪ Drainage – Removal of Surface and Sub-surface Wastewater (question 9)
▪ Sanitation (question 10)
▪ Construction of Roads, Streets and Sidewalks (question 11)
▪ Public Parks, Planting and Green Spaces (question 12)
▪ Car Parking (question 13)
▪ Bus Stands Provision (question 14)
▪ Fairness, Transparency and Accountability of Tax Collection (question 15)
▪ Maintenance of Infrastructure (question 16)
▪ Standardisation of Private Constructions (question 17)
▪ Public Cooperation with the Municipality in Keeping the City Clean (question 18)
▪ Public Access to Information – to the Municipality Services, Budget, Contracts … (question 19)
▪ Public Participation in Municipal Planning and Decision Making Process (question 20)
▪ Accountability to the Public (question 21)
▪ Complaints Mechanism and its Effectiveness (question 22)
These were the same questions as had been posed in the two previous Community Scorecard exercises conducted in the different Nahias of Kabul (but not in other cities), in 2016 and 2016. The main part of this Report focuses on responses to these questions and it is found in the following but one section.
The first question on the survey was a preliminary question – namely whether anyone in the respondent’s family had visited the municipality in the last year – while the following five questions assessed general perceptions about respondents’ experiences with the municipality, such as how satisfied or not they were with municipal services. The following section of this Report reviews responses to these questions.
The last three questions on the survey – questions 23-25 – asked respondents whether or not they had paid a bribe for any municipal services and, if so, what was the purpose of the bribe and whether it resulted in the service being provided. The section of this Report following the one on the responses on different services analyses responses to these questions.

19
INTEGRITY WATCH AFGHANISTAN
CITIZEN REPORT CARD ON MUNICIPAL SERVICES IN AFGHANISTAN 2017
The first substantive question here, question 1 of the survey, asks whether the respondent or anyone in his or her family have “visited the Municipality” in the last year, while question 2 asks the reason for the visit. Figure 1 shows the global results from this question. It is encouraging that the number of ‘do not know’ and ‘refused’ responses to this is very low, as it should be (because normally people should know if they visited the municipality and not be concerned about providing an answer).
However, the results are somewhat surprising, given that over 60% of respondents indicated that neither they nor anyone else in their family had visited the municipality in the last year, while less than 40% said they had. Given the enormous centrality of municipal services to almost everyone, and given that the question extended to the whole family of the respondent, these seem to be very low positive response rates. At the same time, it is possible that there might have been some underreporting based on the idea that in some cases respondents might not have been aware of all of the interactions their family members had had with the municipality (for example, a child might not have known about a visit by a parent to the municipality).
Figure 1: Have you, or anyone in your family visited the Municipality in the past year?
Yes
No
Do not know
Refused
1% 0,16%
37%
62%
Question 2, asked those who answered in the affirmative to question 1, the reason the person had visited the municipality. The rates of responses to the 57 most common responses were tabulated and the ten most popular reasons, along with the percentage this represented from among the valid responses, are provided in Table 3.
Table 3: Ten Most Popular Reasons for Visiting the Municipality
Reason Frequency Percentage
Tax payment (Safa-e) 421 27.8
ID card approval 210 13.9
Sanitation 84 5.6
Waste collection and management 74 4.9
Providing public sector land plots 56 3.7
Road reconstruction 55 3.6
Business license 45 3.0
Asphalt the street 37 2.4
Getting work license
Passport verification (two different issues at the same score)
32 2.1
Items 1, 2, 3, 6, 8 and 10 (both items) appear to be fairly ordinary or understandable reasons to visit the municipality, namely to make payments or to obtain personal services (such as ID cards or passports), benefits (public land plots) or licences. However, the other items (4, 5, 7 and 9) appear to reflect service failure situations. I.e. these issues should normally be addressed as part of the regular provision of services – in this case relating to sanitation, waste, and road repair and maintenance – but which were presumably not being done properly, necessitating a visit to the municipality.
The relatively higher visit rates associated with sanitation and waste collection may suggest more serious problems in these areas. Sanitation was in tenth place overall among the 16 indicators assessed, while solid waste was seventh (i.e. in the top half) but wastewater was 12th. These results might also reflect a perception that visits on these issues are more likely to achieve results.
The overall responses to question 3, on whether or not respondents were satisfied with the quality of the services provided by the municipality, are shown in Figure 2 (only two options were provided here, namely ‘satisfied’ or ‘dissatisfied’). Interestingly, this suggests that over one-half (nearly 56%) of citizens are satisfied with the services they are receiving from their respective municipalities in Afghanistan.
However, these results need to be read in conjunction with the results from question 4 (shown in Figure 3), on how
GENERAL PERCEPTIONS OF MUNICIPAL SERVICES

General Perceptions of Municipal Services
CITIZEN REPORT CARD ON MUNICIPAL SERVICES IN AFGHANISTAN 2017 20
satisfied respondents were with the services, for which again only two options were provided, namely ‘partly satisfied’ or ‘fully satisfied’. This indicates that more than three-quarters of all respondents were only partly satisfied with the services. Put differently, and combining the two results, only 13% of citizens were fully satisfied with the service they received. Depending to some extent on how respondents understood the idea of being ‘fully satisfied’, this is a very low rate of achievement for municipal services in Afghanistan.
Figure 2: Generally speaking, are you satisfied or dissatisfied with the quality of the services provided by the Municipality?
Satisfied
Dissatisfied
44%
56%
Figure 3: How satisfied are you?
Partly Satisfied
Fully Satisfied
24%
76%
Question 5, which can been seen as a precursor to the questions in the main body of the survey, assessing key governance and service indicators, asked respondents how
they rated the overall services provided by the municipality. The range of responses here, in common with the main body questions, included Very Bad; Bad; Fair/Just OK; Good; Very Good (as well as the residual categories Do Not Know and Refused (to answer), which elicited extremely low response rates for this question). The results are provided in Figure 4. Only 29% of respondents found services to be ‘good’ or ‘very good’, with only seven percent falling into the latter category. The same number found services to be ‘fair/just OK’, while 32% rated services as ‘bad’ or ‘very bad’.
Looked at from a different (more statistical) perspective, and using the scoring approach described above under Overview of Survey, this generates a score for this question of 2.77 or a percentage of 55%, or what might be described as a very weak passing grade.13 It may be noted that the Kabul overall score for this question was essentially the same as the national score, at 2.71 or 54%.
Figure 4: How do you rate the overall services provided by the Municipality?
Very Bad
Bad
Fair/Just Ok
Good
Very Good
7%17%
25%
29%
22%
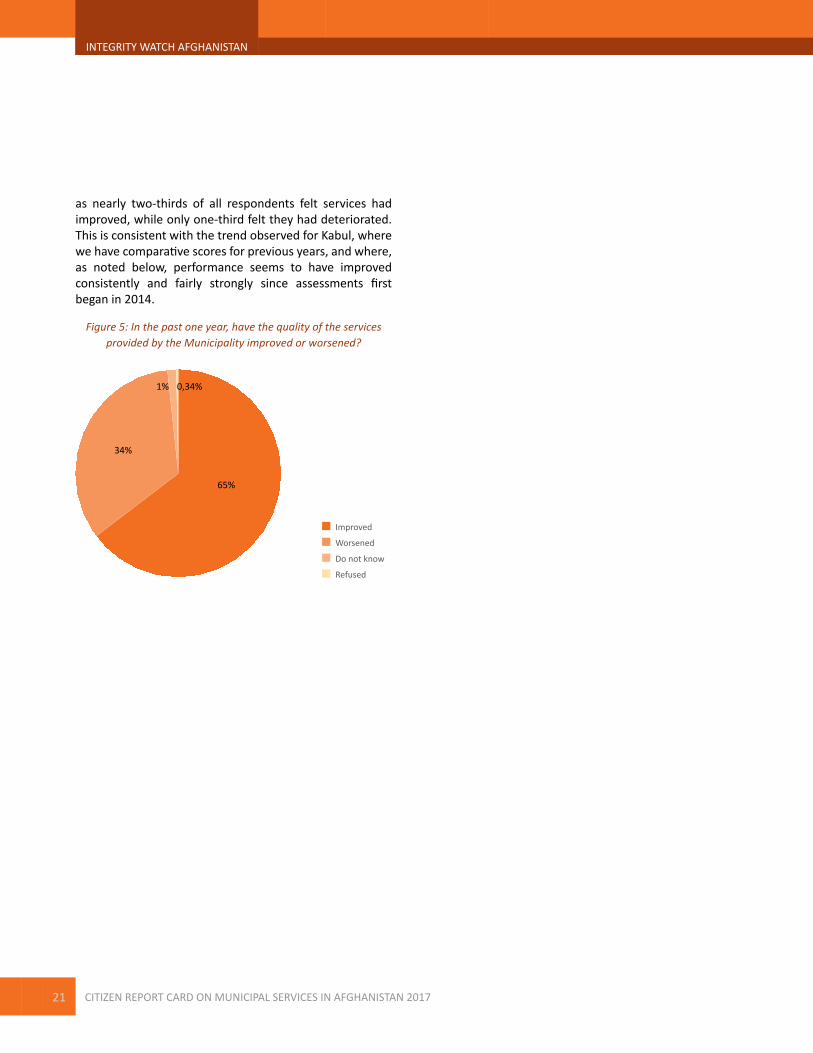
The final question in this part of the survey, question 6, asked respondents whether they thought the quality of services provided by the municipality had improved or worsened during the past one-year period, allowing for two answers, namely ‘improved’ or ‘worsened’. The results, provided in Figure 5, are rather encouraging inasmuch
13 Note that even though more respondents thought services were very bad than very good and bad than good, this generates a passing percentage – i.e. above 50 percent – because the lowest possible score would be 20 percent (i.e. if everyone gave the service a very bad rating). In other words, the percentage methodology essentially starts with a floor of 20 percent.
21
INTEGRITY WATCH AFGHANISTAN
CITIZEN REPORT CARD ON MUNICIPAL SERVICES IN AFGHANISTAN 201721
INTEGRITY WATCH AFGHANISTAN
as nearly two-thirds of all respondents felt services had improved, while only one-third felt they had deteriorated. This is consistent with the trend observed for Kabul, where we have comparative scores for previous years, and where, as noted below, performance seems to have improved consistently and fairly strongly since assessments first began in 2014.
Figure 5: In the past one year, have the quality of the services provided by the Municipality improved or worsened?
Improved
Worsened
Do not know
Refused
65%
34%
1% 0,34%
Perceptions of Key Services
CITIZEN REPORT CARD ON MUNICIPAL SERVICES IN AFGHANISTAN 2017 2222
There is clearly a great difference between providing services and governance, even though the literature on governance suggests a closer link between them than one might normally assume (based largely on the assumption – also reflected in the core theory behind CRC exercises, as outlined above under Overview of Citizen Report Cards – that better governance will lead to better provision of services). Despite that, as the analysis below suggests, performance was very varied across these types of indicators, with no clear pattern emerging (i.e. municipalities did not appear to perform consistently better or worse in either area).
This section of the Report, which is the longest section, is divided into three sub-sections. The first assesses overall performance across all 16 indicators, looking at which did best and worst and so on. The second compares performance by city. The third, and last, compares performance by district within Kabul. Here, it is possible to provide a longitudinal (temporal) comparison, based on the results of the previous exercises conducted in Kabul, with the caveat that these were done following a different methodology.
Questions 7-22 of the survey assessed the performance of municipalities across 16 different indicators. The large majority of these, the first eleven or questions 7-17 to be exact, referred to the provision of specific services, such as the management of solid and liquid waste, transportation (car parking and bus stands), infrastructure maintenance and so on. These are listed in order below.
Service Indicators:
▪ Solid Waste Management (question 7)
▪ Documents Registration and Licensing Process (question 8)
▪ Drainage – Removal of Surface and Sub-surface Wastewater (question 9)
▪ Sanitation (question 10)
▪ Construction of Roads, Streets and Sidewalks (question 11)
▪ Public Parks, Planting and Green Spaces (question 12)
▪ Car Parking (question 13)
▪ Bus Stands Provision (question 14)
▪ Fairness, Transparency and Accountability of Tax Collection (question 15)
▪ Maintenance of Infrastructure (question 16)
▪ Standardisation of Private Constructions (question 17)
The remaining five, namely questions 18-22, referred to governance issues, namely public cooperation in cleanliness activities, access to information, participation in decision-making, accountability and complaints mechanisms. These are again listed in order below.
Governance:
▪ Public Cooperation with the Municipality in Keeping the City Clean (question 18)
▪ Public Access to Information – to the Municipality Services, Budget, Contracts … (question 19)
▪ Public Participation in Municipal Planning and Decision Making Process (question 20)
▪ Accountability to the Public (question 21)
▪ Complaints Mechanism and its Effectiveness (question 22)
PERCEPTIONS OF KEY SERVICES
23
INTEGRITY WATCH AFGHANISTAN
CITIZEN REPORT CARD ON MUNICIPAL SERVICES IN AFGHANISTAN 201723
INTEGRITY WATCH AFGHANISTAN
COMMUNITY SCORECARD OF KABUL MUNICIPALITY 2016
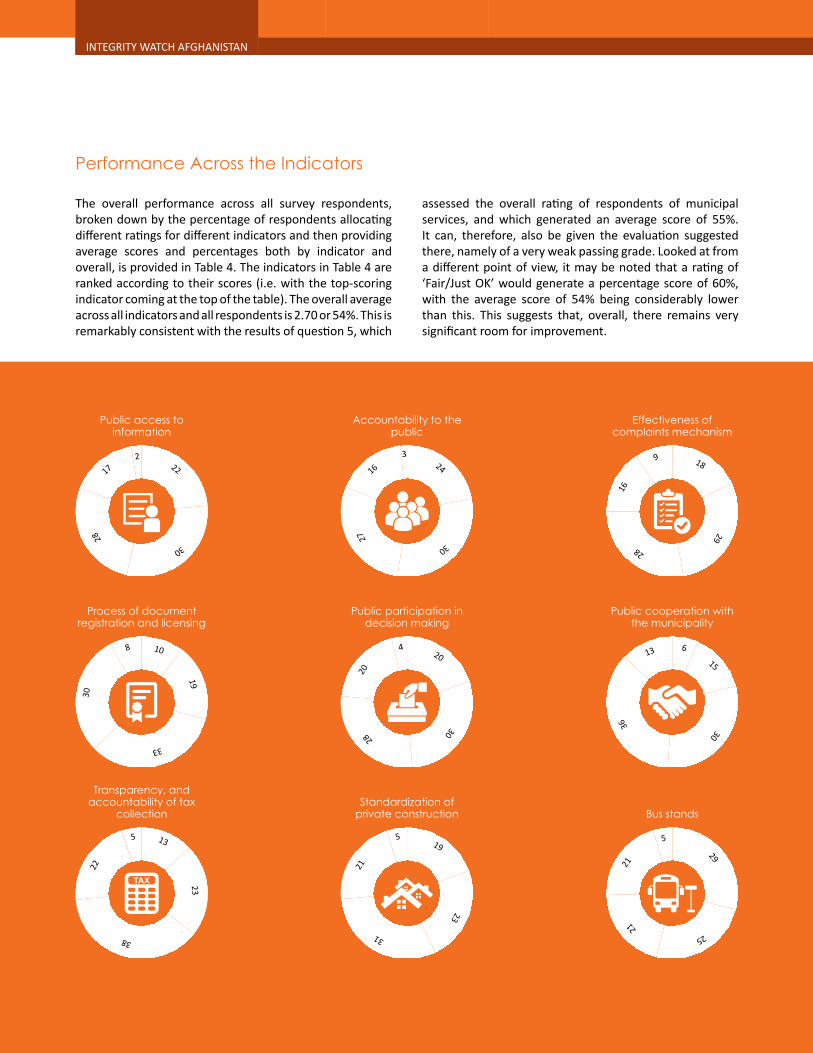
assessed the overall rating of respondents of municipal services, and which generated an average score of 55%. It can, therefore, also be given the evaluation suggested there, namely of a very weak passing grade. Looked at from a different point of view, it may be noted that a rating of ‘Fair/Just OK’ would generate a percentage score of 60%, with the average score of 54% being considerably lower than this. This suggests that, overall, there remains very significant room for improvement.
The overall performance across all survey respondents, broken down by the percentage of respondents allocating different ratings for different indicators and then providing average scores and percentages both by indicator and overall, is provided in Table 4. The indicators in Table 4 are ranked according to their scores (i.e. with the top-scoring indicator coming at the top of the table). The overall average across all indicators and all respondents is 2.70 or 54%. This is remarkably consistent with the results of question 5, which
Accountability to the public
Process of document registration and licensing
Transparency, and accountability of tax
collection
Public access to information
Public participation in decision making
Standardization of private construction
Effectiveness of complaints mechanism
Public cooperation with the municipality
Bus stands
24
30
27
163
22
30
28
172 18
29
28
16
9
615
30
36
13
29
25
2121
5
20
3028
20
4
19
23
31
21
5
10
19
33
30
8
13
23
38
22
5
Performance Across the Indicators
Perceptions of Key Services
CITIZEN REPORT CARD ON MUNICIPAL SERVICES IN AFGHANISTAN 2017 24
Part One: Methodology
24COMMUNITY SCORECARD OF KABUL MUNICIPALITY 2016
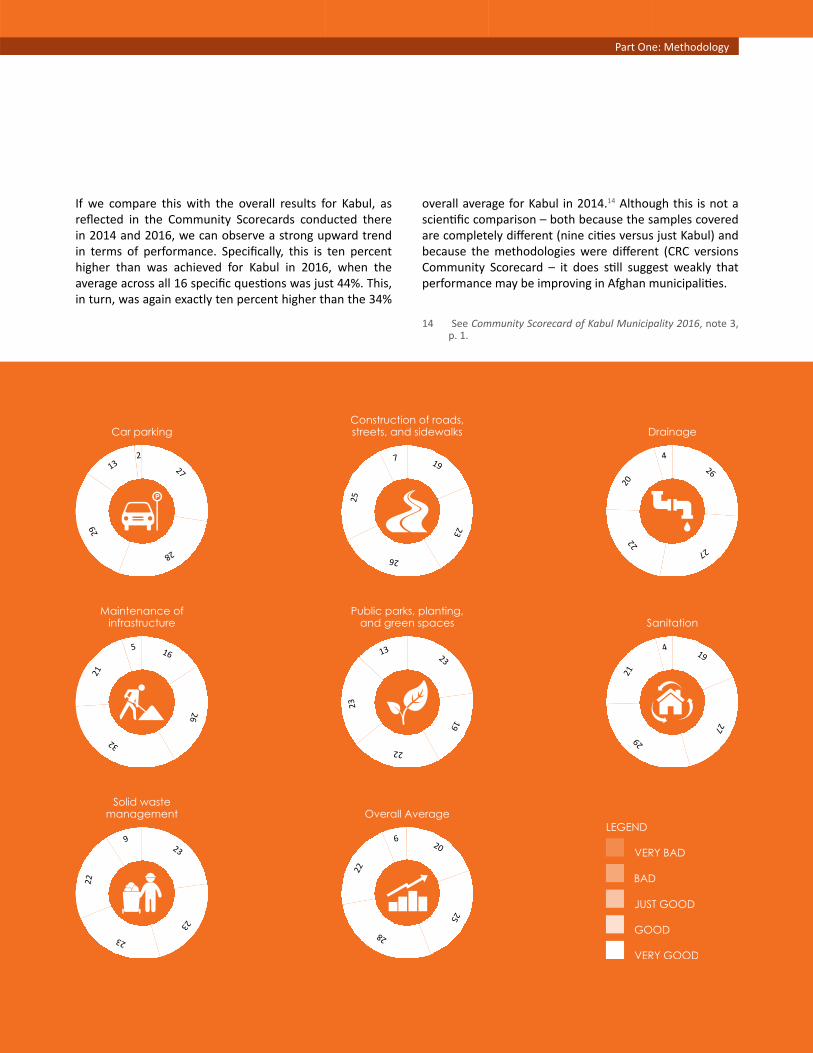
If we compare this with the overall results for Kabul, as reflected in the Community Scorecards conducted there in 2014 and 2016, we can observe a strong upward trend in terms of performance. Specifically, this is ten percent higher than was achieved for Kabul in 2016, when the average across all 16 specific questions was just 44%. This, in turn, was again exactly ten percent higher than the 34%
overall average for Kabul in 2014.14 Although this is not a scientific comparison – both because the samples covered are completely different (nine cities versus just Kabul) and because the methodologies were different (CRC versions Community Scorecard – it does still suggest weakly that performance may be improving in Afghan municipalities.
14 See Community Scorecard of Kabul Municipality 2016, note 3, p. 1.
Car parking
Maintenance of infrastructure
Solid waste management
Construction of roads, streets, and sidewalks
Public parks, planting, and green spaces
Overall Average
Drainage
Sanitation
27
28
29
132
16
26
32
21
5
23
23
23
22
9
19
23
26
25
7
23
19
22
23
13
20
25
28
22
6
26
272220
4
19
27
2921
4
25
INTEGRITY WATCH AFGHANISTAN
CITIZEN REPORT CARD ON MUNICIPAL SERVICES IN AFGHANISTAN 2017
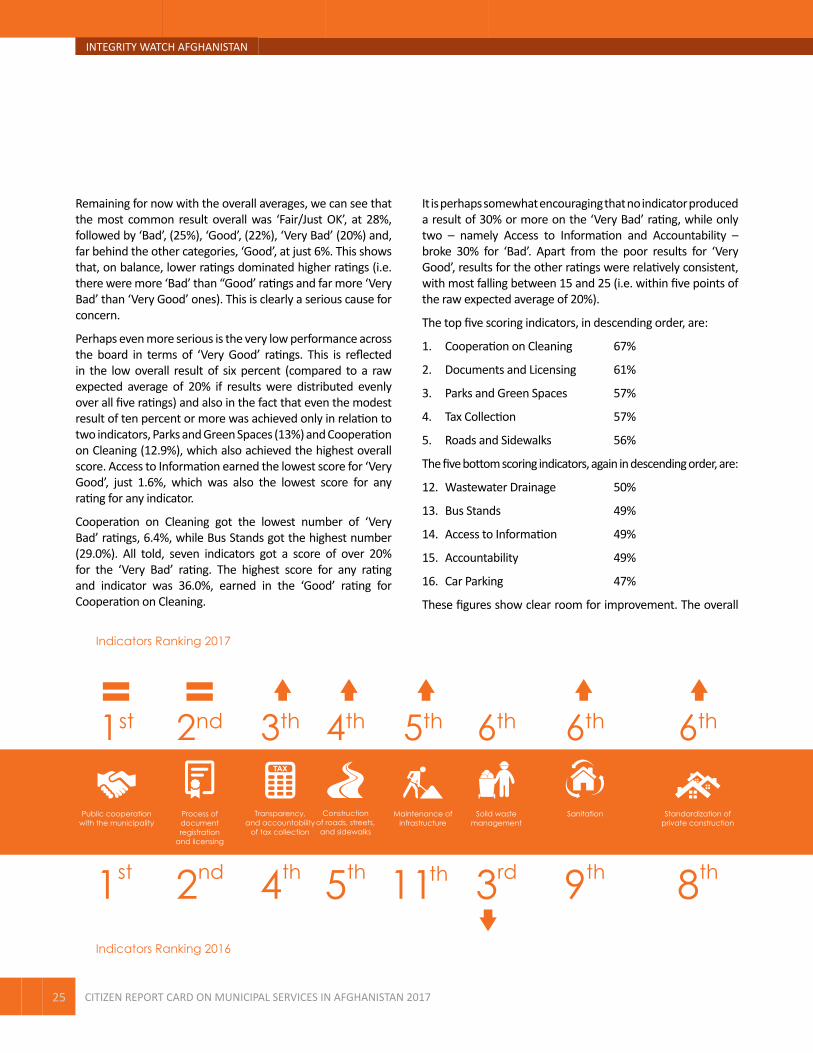
It is perhaps somewhat encouraging that no indicator produced a result of 30% or more on the ‘Very Bad’ rating, while only two – namely Access to Information and Accountability – broke 30% for ‘Bad’. Apart from the poor results for ‘Very Good’, results for the other ratings were relatively consistent, with most falling between 15 and 25 (i.e. within five points of the raw expected average of 20%).
The top five scoring indicators, in descending order, are:
1. Cooperation on Cleaning 67%
2. Documents and Licensing 61%
3. Parks and Green Spaces 57%
4. Tax Collection 57%
5. Roads and Sidewalks 56%
The five bottom scoring indicators, again in descending order, are:
12. Wastewater Drainage 50%
13. Bus Stands 49%
14. Access to Information 49%
15. Accountability 49%
16. Car Parking 47%
These figures show clear room for improvement. The overall
Remaining for now with the overall averages, we can see that the most common result overall was ‘Fair/Just OK’, at 28%, followed by ‘Bad’, (25%), ‘Good’, (22%), ‘Very Bad’ (20%) and, far behind the other categories, ‘Good’, at just 6%. This shows that, on balance, lower ratings dominated higher ratings (i.e. there were more ‘Bad’ than “Good’ ratings and far more ‘Very Bad’ than ‘Very Good’ ones). This is clearly a serious cause for concern.
Perhaps even more serious is the very low performance across the board in terms of ‘Very Good’ ratings. This is reflected in the low overall result of six percent (compared to a raw expected average of 20% if results were distributed evenly over all five ratings) and also in the fact that even the modest result of ten percent or more was achieved only in relation to two indicators, Parks and Green Spaces (13%) and Cooperation on Cleaning (12.9%), which also achieved the highest overall score. Access to Information earned the lowest score for ‘Very Good’, just 1.6%, which was also the lowest score for any rating for any indicator.
Cooperation on Cleaning got the lowest number of ‘Very Bad’ ratings, 6.4%, while Bus Stands got the highest number (29.0%). All told, seven indicators got a score of over 20% for the ‘Very Bad’ rating. The highest score for any rating and indicator was 36.0%, earned in the ‘Good’ rating for Cooperation on Cleaning.
1st 2nd 6th3th 4th 13th9th6th6th 11th 16th14th9th 14th12th5th
Indicators Ranking 2017
Indicators Ranking 2016

Perceptions of Key Services
CITIZEN REPORT CARD ON MUNICIPAL SERVICES IN AFGHANISTAN 2017 26
average score only breaks 60% for two indicators, namely Cooperation on Cleaning and Documents and Licensing. Given that, as noted above, this just represents an average rating of ‘Fair/Just OK’, the goal should be at least that level of achievement for all indicators, with at least some indicators having much higher scores.
As noted above, there does not appear to be any particular division here between governance and service indicators. It is true that only one governance indicator appears in the top-scorers list, albeit at the very top, while two appear in the bottom-scorers list. But, given that less than one-third of the indicators are governance indicators, one would expect there to be one or two in any group of five indicators.
That said, four of the five governance indicators appear in the bottom one-half of the 16 indicators. Furthermore, the one governance indicator in the top one-half (and indeed the top scoring indicator overall), namely Public Cooperation with the Municipality in Keeping the City Clean, is rather different from the other governance indicators. Although it is technically a governance indicator, since it is about cooperation (participation) rather than the provision of a service, it is clearly less ‘hardcore’ in terms of governance than the other indicators in this group, namely access to information, participation in decision-making, complaints and accountability. This, then, does suggest that municipalities
perform less well in the area of governance than in terms of service delivery.
Otherwise, in terms of trends it is hard to identify any pronounced trends. Car Parking is ranked last, while Bus Stands, another transportation indicator, is fourth from the bottom. But Roads and Sidewalks, a third transportation indicator, is in fourth place (from the top).
Apart from the two outlying top-scoring indicators, all of the other 14 fall within a ten percent range in terms of their average scores, namely from 47 to 57%. In other words, the range of scores is fairly limited, suggesting relatively equal performance across most indicators.
There is a remarkable degree of consistency between the top- and bottom-scoring indicators in the current CRC and the 2016 Community Scorecard conducted in Kabul. Four of the five top-scoring indicators are the same – namely Cooperation on Cleaning, Documents and Licensing, Tax Collection and Roads and Sidewalks – with each appearing in exactly the same position on each exercise. Similarly, four of the five bottom-scoring indicators are the same – namely Bus Stands, Access to Information, Accountability and Car Parking – although in this case they do not fall into exactly the same positions.
1st 2nd 6th3th 4th 13th9th6th6th 11th 16th14th9th 14th12th5th
Indicators Ranking 2017
Indicators Ranking 2016
27
INTEGRITY WATCH AFGHANISTAN
CITIZEN REPORT CARD ON MUNICIPAL SERVICES IN AFGHANISTAN 2017
20
11
11
12
7
10
6
15
9
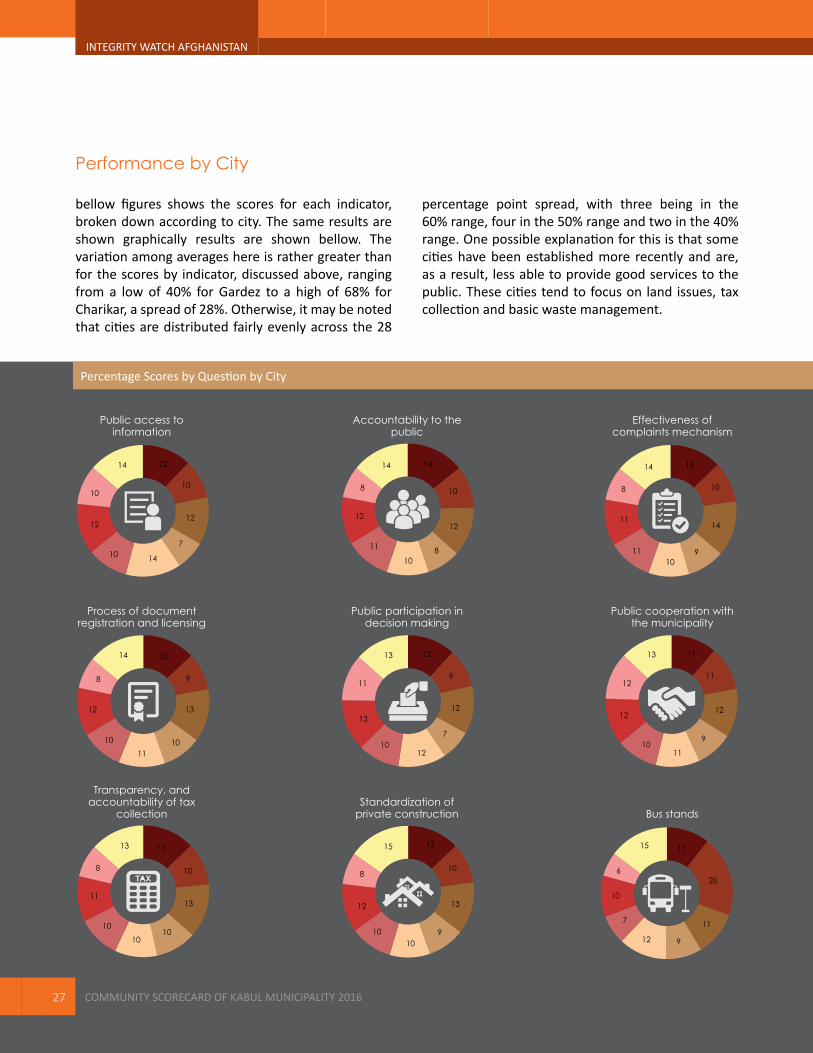
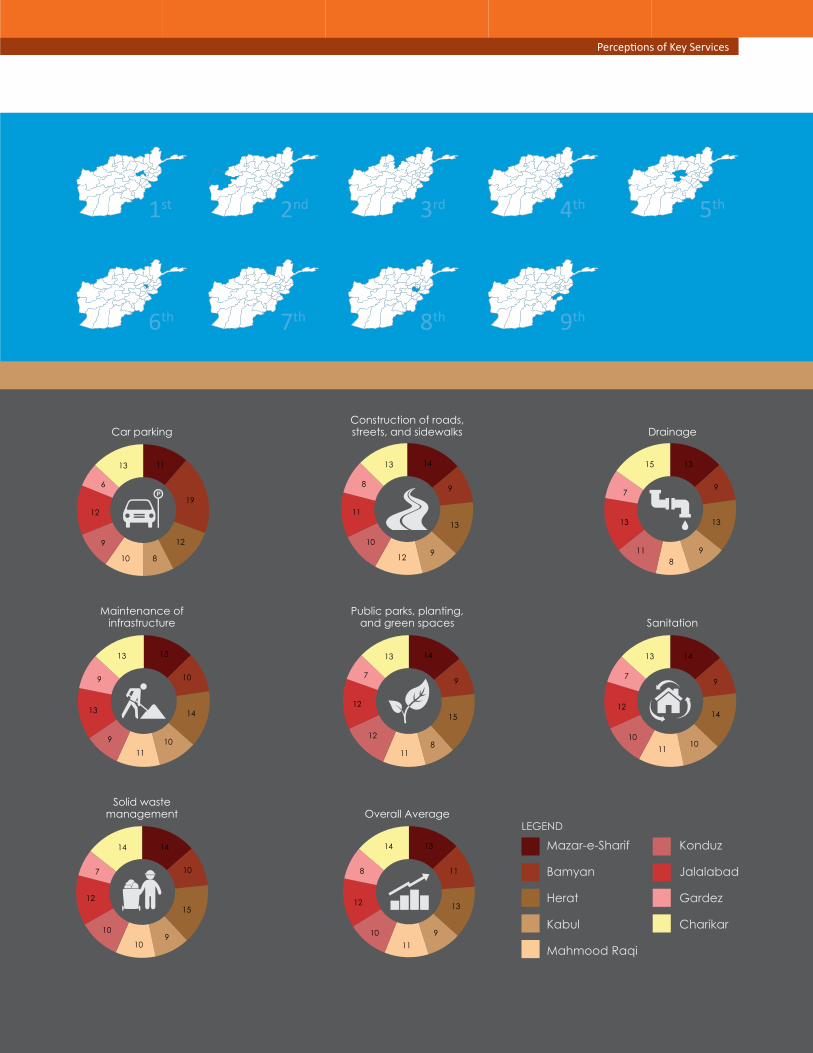
percentage point spread, with three being in the 60% range, four in the 50% range and two in the 40% range. One possible explanation for this is that some cities have been established more recently and are, as a result, less able to provide good services to the public. These cities tend to focus on land issues, taxcollection and basic waste management.
bellow figures shows the scores for each indicator, broken down according to city. The same results are shown graphically results are shown bellow. The variation among averages here is rather greater than for the scores by indicator, discussed above, ranging from a low of 40% for Gardez to a high of 68% for Charikar, a spread of 28%. Otherwise, it may be noted that cities are distributed fairly evenly across the 28
Performance by City
27 COMMUNITY SCORECARD OF KABUL MUNICIPALITY 2016
Accountability to the public
Process of document registration and licensing
Transparency, and accountability of tax
collection
Public access to information
Public participation in decision making
Standardization of private construction
Effectiveness of complaints mechanism
Public cooperation with the municipality
Bus stands
Percentage Scores by Question by City
9
13
13
11
10
12
8
14
10
10
13
13
13
8
11
10
1010
10
13
13
1010
12
8
15
9
11
11
12
1110
12
12
13
9
10
12
12
1410
12
10
14
7
9
12
12
1210
13
11
13
7
10
14
12
10
11
12
8
14
8
10
13
14
1011
11
8
14
9
Perceptions of Key Services
CITIZEN REPORT CARD ON MUNICIPAL SERVICES IN AFGHANISTAN 2017 2828COMMUNITY SCORECARD OF KABUL MUNICIPALITY 2016
Car parking
Maintenance of infrastructure
Solid waste management
Construction of roads, streets, and sidewalks
Public parks, planting, and green spaces
Overall Average
Drainage
Sanitation
Percentage Scores by Question by City
14
10
15
910
10
12
7
14
9
13
13
811
13
7
15
9
9
14
14
1110
12
7
13
10
9
14
13
12
10
11
8
13
9
9
14
15
11
12
12
7
13
8
19
11
12
10
9
12
6
13
8
10
13
14
119
13
9
13
10
11
13
13
1110
12
8
14
9
Charikar68%
CITY RANKING
Mahmood Raqi54%
Herat64%
Konduz50%
Mazar-e-Sharif63%
Kabul44%
Jalalabad59%
Gardez40%
Bamyan55%
1st
6th
2nd
7th
3rd
8th
4th
9th
5th
29
INTEGRITY WATCH AFGHANISTAN
CITIZEN REPORT CARD ON MUNICIPAL SERVICES IN AFGHANISTAN 2017
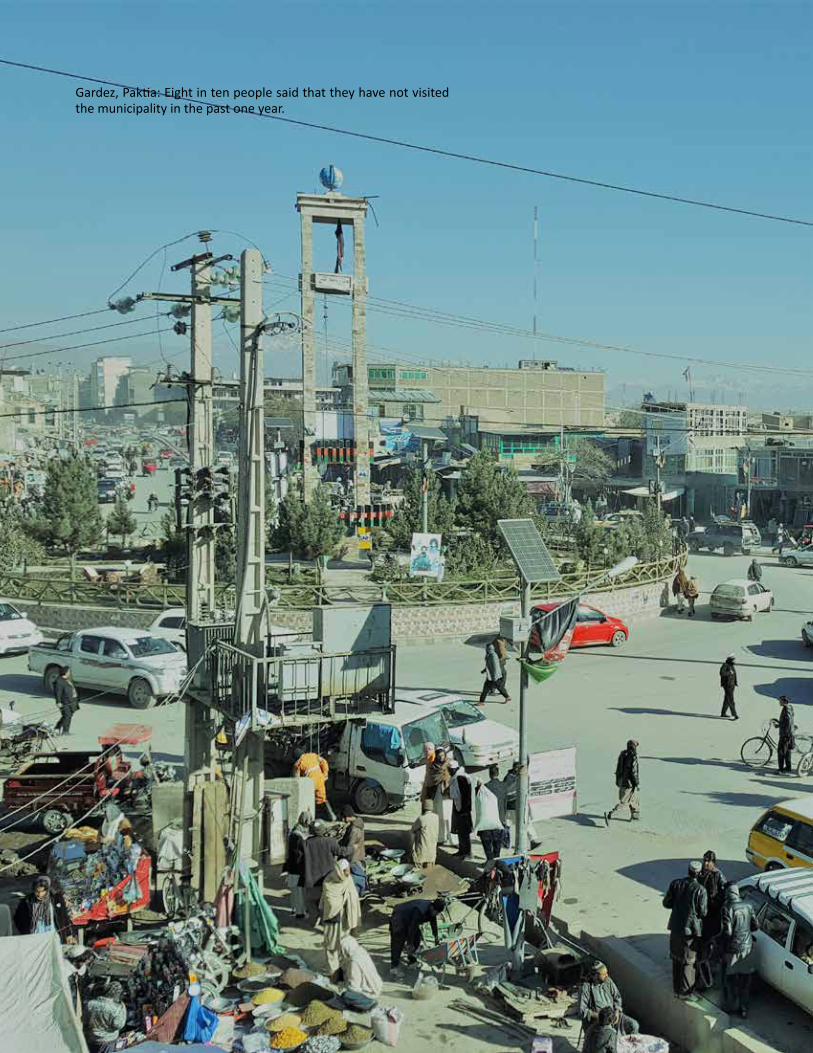
Gardez, Paktia: Eight in ten people said that they have not visited the municipality in the past one year.

Perceptions of Key Services
CITIZEN REPORT CARD ON MUNICIPAL SERVICES IN AFGHANISTAN 2017 30

31
INTEGRITY WATCH AFGHANISTAN
CITIZEN REPORT CARD ON MUNICIPAL SERVICES IN AFGHANISTAN 2017
Figure 6: Comparison of 9 citiesEff
ectiv
enes
s of c
ompla
ints m
echa
nism
Acco
untab
ility t
o the
publi
c
Publi
ce pa
rticip
ation
in de
cision
mak
ing
Publi
ce ac
cess
to in
forma
tion
Publi
ce co
oper
ation
with
the m
unici
pality
Stand
ardiz
ation
of pr
ivate
cons
tructi
on
Main
tena
nce o
f infra
struc
ture
Trans
pare
ncy a
nd ac
coun
tabilit
y of t
ax co
llecti
on
Bus s
tands
Car p
arkin
g
Publi
ce pa
rks,pl
antin
g,and
gree
n spa
ces
cons
turcti
on of
road
s,stre
ets,a
nd si
dewa
lks
Sanit
ation
Drain
age
Proc
ess o
f doc
umen
t reg
istrati
on an
d lice
nsing
Solid
was
te m
anag
emen
t
100%
90%
80%
70%
60%
50%
40%
30%
20%
10%
0%
2,4 3,0 3,4 3,7 2,4 2,7 2,6 2,8 2,3 2,8 3,0 2,7 1,9 3,1 2,6
3,3 3,4 3,4 3,8 3,83,7 3,3 3,3 3,5 3,53,1 3,4 3,43,2 3,2
2,4 2,4 2,4 2,4 2,42,4 3,2 2,5 2,5 2,52,6
4,74,6
2,3 2,1
2,8 3,0 2,9 3,5 3,1 3,5 3,3
2,62,8
4,0 3,4 3,4 2,9 3,5 3,6
3,3 3,33,3 3,0 3,0 3,3 3,1 3,2 3,2
2,52,7
2,7 3,5 3,0 3,5
1,91,8 2,9 2,4 3,4 2,2 2,0
1,41,4
1,8 2,1 1,7 1,61,62,1
2,52,6 2,6 3,0 2,5 2,2 2,61,7 2,2 3,1 2,5 2,5 2,4 2,8
2,5
2,7 3,2 3,1 3,4 2,9 3,2 2,8 2,4 2,9 3,3 2,8 2,8 3,0 3,2 3,0
2,3
3,2
2,3
3,1
2,9
1,9
2,5
2,6
2,1 1,9 1,9 1,8 2,7 2,2 2,4 2,5 2,1 1,8 2,0 2,4 2,3 2,1 2,12,6
Kabul Nangrahar Konduz Paktia Balkh Herat Bamyan Parwan Kapisa

Perceptions of Key Services
CITIZEN REPORT CARD ON MUNICIPAL SERVICES IN AFGHANISTAN 2017 32
More information would be needed to assess these differences. For example, one contributing factor might be differences in expectations in different cities, based on factors such as the local culture, the degree of development (with more developed cities generally being expected to have higher expectations) and local political factors (such as local politicians having made bold promises about service delivery). Another might be the development trajectory of the city. Residents of a city that had experienced strong developmental growth might tend to be more satisfied than those of a city which was stagnating, even if an objective comparison of service delivery showed that the second city was doing better.
These results may be cross-referenced against some of the results from the General Perceptions part of the survey, broken down by city. An interesting initial issue is the percentage of household that had visited the municipality in the last year. The overall result for this question was 37% having visited, and about 62% not having visited. figure 7 shows the results for this question broken down by city. Mahmood Raqi is a clear outlier here, with fully 97% of respondents indicating that they had visited the municipality. In terms of overall performance, Mahmood Raqi was a middle-scoring city. The was followed by Konduz, towards the lower end of the middle-scoring cities, with 70% having visited. Gardez was at the other end of the spectrum, with just 20% having visited; it may be noted that Gardez was also the weakest performing city overall. Bamyan, a middle-performing city, was just ahead of this, at 23%. Overall, there does not appear to be much correlation between the rate of visiting the municipality and the overall performance of a city.
There is a general need for many cities in Afghanistan to initiate public awareness programmes. Often, people in the provinces do not know about the services the municipality is responsible for providing. This is clear from the question they have asked which illustrates the level of local knowledge they have.
Figure 7: Have you, or anyone in your family visited the Municipality in the past one year?
100%
80%
60%
40%
20%
0%
53%47%
50%
30%
80%
59%
66%
76%
54%
3%
50%
70%
20%
41%
34%
23%
46%
97%
Kabul
Nangrahar
Konduz
Paktia
Balkh
Herat
Bamyan
Parwan
Kapisa
NoYes
figure 8 shows general levels of satisfaction with municipal services, broken down by city. Three cities – namely Herat, Mahmood Raqi and Balkh, in descending order – show satisfaction levels of above 75%, another three – namely Charikar, Konduz and Jalalabad – manifest satisfaction levels of above 50%, while the remaining three – namely Kabul, Bamyan and Gardez – show satisfaction levels of below 50%.
These results do roughly line up with the scores shown in Table 5, with two of the three highest satisfaction cities also being 60+ percentage scoring cities and one being a 50+ city. Similarly, two of the three medium satisfaction cities are in the 50+ scoring group, while both of the lowest scoring cities are also the least satisfied, with Gardez being at the bottom of both lists. However, Charikar, the highest scoring city is only in the medium satisfaction group.
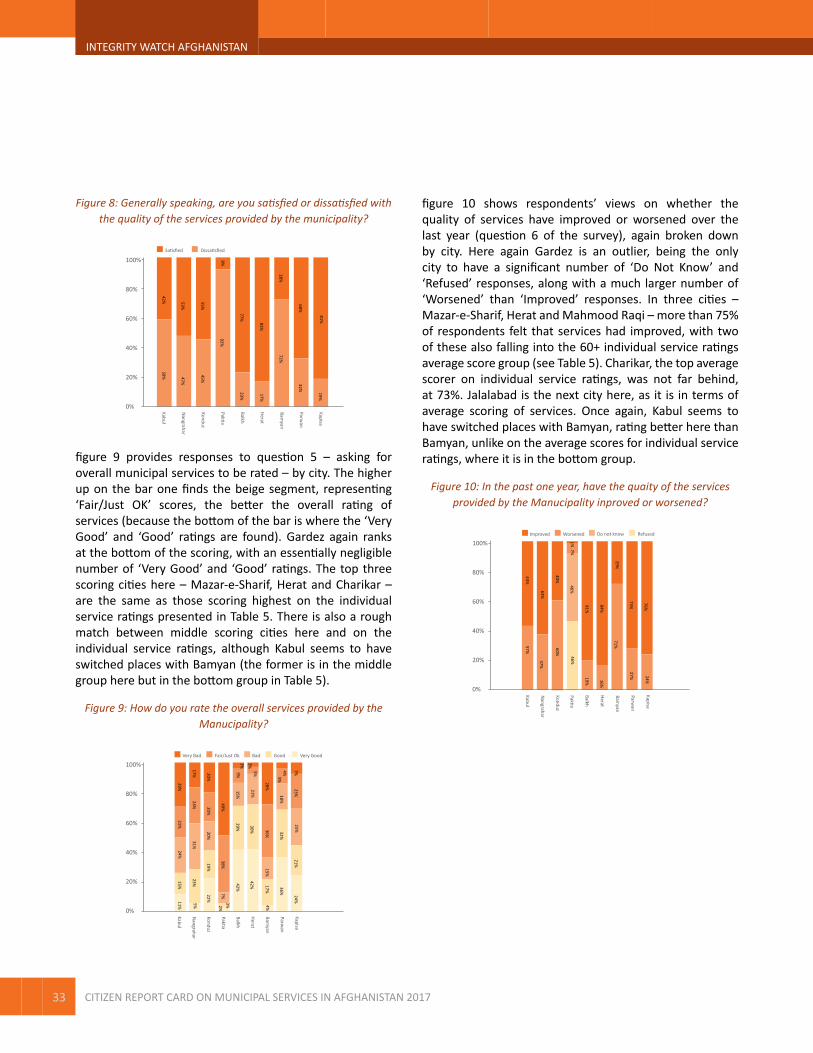
33
INTEGRITY WATCH AFGHANISTAN
CITIZEN REPORT CARD ON MUNICIPAL SERVICES IN AFGHANISTAN 2017
figure 10 shows respondents’ views on whether the quality of services have improved or worsened over the last year (question 6 of the survey), again broken down by city. Here again Gardez is an outlier, being the only city to have a significant number of ‘Do Not Know’ and ‘Refused’ responses, along with a much larger number of ‘Worsened’ than ‘Improved’ responses. In three cities – Mazar-e-Sharif, Herat and Mahmood Raqi – more than 75% of respondents felt that services had improved, with two of these also falling into the 60+ individual service ratings average score group (see Table 5). Charikar, the top average scorer on individual service ratings, was not far behind, at 73%. Jalalabad is the next city here, as it is in terms of average scoring of services. Once again, Kabul seems to have switched places with Bamyan, rating better here than Bamyan, unlike on the average scores for individual service ratings, where it is in the bottom group.
Figure 10: In the past one year, have the quaity of the services provided by the Manucipality inproved or worsened?
100%
80%
60%
40%
20%
0%
43%57%
37%
60%
19% 16%
71%
27% 24%76%
73%
29%
84%
81%
7%1%
46%
40%
63%
46%
Kabul
Nangrahar
Konduz
Paktia
Balkh
Herat
Bamyan
Parwan
Kapisa
Improved Worsened Do not know Refused
Figure 8: Generally speaking, are you satisfied or dissatisfied with the quality of the services provided by the municipality?
100%
80%
60%
40%
20%
0%
42% 53%
55%
8%
77%
83%
28%
68%
81%
58% 47%
45%
92%
23%
17%
72%
32%
19%
Kabul
Nangrahar
Konduz
Paktia
Balkh
Herat
Bamyan
Parwan
Kapisa
Dissatisfied Satisfied
figure 9 provides responses to question 5 – asking for overall municipal services to be rated – by city. The higher up on the bar one finds the beige segment, representing ‘Fair/Just OK’ scores, the better the overall rating of services (because the bottom of the bar is where the ‘Very Good’ and ‘Good’ ratings are found). Gardez again ranks at the bottom of the scoring, with an essentially negligible number of ‘Very Good’ and ‘Good’ ratings. The top three scoring cities here – Mazar-e-Sharif, Herat and Charikar – are the same as those scoring highest on the individual service ratings presented in Table 5. There is also a rough match between middle scoring cities here and on the individual service ratings, although Kabul seems to have switched places with Bamyan (the former is in the middle group here but in the bottom group in Table 5).
Figure 9: How do you rate the overall services provided by the Manucipality?
100%
80%
60%
40%
20%
0%
29%21%
24%15%
11%
17%24%
31%23%
5%
20%20%
20%19%
22%
49%38%
7%2%
3%
9%3%
15%29%
42%
5%3%
21%30%
42%
28%36%
15%17%
4%
18%9%
4%32%
36%
7%23%
25%21%
24%
Kabul
Nangrahar
Konduz
Paktia
Balkh
Herat
Bamyan
Parwan
Kapisa
Very Bad BadFair/Just Ok Good Very Good

Perceptions of Key Services
CITIZEN REPORT CARD ON MUNICIPAL SERVICES IN AFGHANISTAN 2017 34
Table 4 shows the scores broken down by district of Kabul and question (with questions running horizontally across the top of the table and districts running vertically along the left side of the table). The lowest scoring district is MD18, with an average score of just 35% (albeit still a strong improvement over its 2016 score, as discussed below), while the top-scoring district is MD2, with an average score of 56%. In some respects, this remains a relatively small spread of just 21 percentage points (far smaller, for example, than the 32 percentage point spread among Kabul districts in the 2016 Community Scorecard exercise).
A top score of 56% is hardly impressive for a city like Kabul, taking into account that a ‘Fair/Just OK’ rating generates a score of 60% (i.e. 56% is even lower than a ‘Fair/Just OK’
average rating). From among the 21 districts surveyed, only six, or less than 29%, achieved a score of 50% or more, which could be considered to be a minimal passing score. Most of the districts – 13 in total – scored in the 40-49% range, while two were in the 30-39% range. There is obviously a lot of room for improvement.
Thus, Kabul is relatively poor in overall performance, although the National Unity Government promised to focus on improving the overall services of the municipality. Overall, people are not happy with the services provided by the municipality as it seems the authorities are not even able to keep the city clean or collect waste on a reliable basis.
Performance by District Within Kabul

35
INTEGRITY WATCH AFGHANISTAN
CITIZEN REPORT CARD ON MUNICIPAL SERVICES IN AFGHANISTAN 2017
Tabl
e 4:
Sco
res b
y Q
uesti
on b
y Di
stric
t of K
abul
Q7
Q8
Q9
Q10
Q11
Q12
Q13
Q14
Q15
Q16
Q17
Q18
Q19
Q20
Q21
Q22
Av.
%
MD1
2.9
3.1
2.3
2.6
3.0
2.5
2.0
2.0
2.5
2.4
2.1
3.0
1.9
1.9
1.9
2.2
2.4
48
MD2
2.8
3.1
3.0
2.7
3.0
2.7
2.3
2.9
3.2
2.7
2.4
3.6
2.6
2.6
2.6
2.6
2.8
56
MD3
2.8
3.2
2.9
2.9
3.2
3.1
2.4
2.5
2.9
2.8
2.8
3.4
1.8
2.1
2.0
2.3
2.7
54
MD4
2.7
3.3
2.9
2.7
2.9
2.5
2.1
2.7
3.0
2.5
3.1
3.4
2.6
2.7
2.2
2.3
2.7
55
MD5
2.2
3.0
2.6
2.1
3.2
2.9
1.8
2.5
2.9
2.8
2.0
3.2
1.7
2.2
2.1
2.0
2.5
49
MD6
2.6
3.0
2.4
2.3
2.5
2.4
1.9
2.4
2.5
2.4
2.1
3.2
2.3
2.2
2.3
2.0
2.4
48
MD7
2.4
2.9
2.5
2.3
2.9
2.3
1.8
2.8
2.8
2.7
2.2
3.3
1.8
2.0
2.0
2.0
2.4
48
MD8
2.2
3.0
2.2
2.5
2.9
2.8
1.6
2.4
2.8
2.7
2.1
3.0
1.9
2.2
1.9
2.3
2.4
48
MD9
2.3
3.2
2.0
2.3
2.5
2.5
2.6
2.4
3.1
2.7
2.7
3.4
1.7
1.8
1.9
1.9
2.4
49
MD1
02.
42.
92.
02.
42.
62.
41.
71.
72.
72.
32.
13.
12.
02.
32.
02.
22.
346
MD1
13.
13.
62.
82.
53.
02.
82.
33.
03.
33.
03.
03.
52.
02.
11.
82.
22.
855
MD1
21.
92.
71.
92.
42.
12.
21.
71.
82.
52.
11.
93.
01.
51.
81.
72.
12.
142
MD1
33.
23.
22.
72.
63.
51.
81.
74.
03.
23.
02.
63.
71.
61.
81.
92.
32.
754
MD1
41.
62.
31.
82.
82.
12.
91.
51.
82.
32.
52.
13.
01.
91.
91.
82.
12.
243
MD1
53.
22.
92.
02.
42.
51.
92.
12.
32.
92.
62.
53.
71.
62.
01.
71.
92.
448
MD1
62.
33.
01.
92.
22.
42.
01.
92.
12.
72.
12.
33.
21.
92.
02.
02.
32.
345
MD1
73.
03.
42.
72.
32.
92.
22.
53.
13.
12.
73.
03.
61.
91.
92.
32.
22.
754
MD1
81.
12.
21.
21.
91.
81.
51.
11.
62.
21.
82.
02.
61.
71.
71.
41.
81.
735
MD1
91.
92.
71.
72.
41.
71.
61.
51.
82.
72.
12.
73.
51.
41.
61.
81.
72.
041
MD2
11.
82.
71.
62.
41.
61.
21.
51.
72.
62.
03.
13.
41.
31.
71.
81.
72.
040
MD2
21.
41.
91.
32.
11.
72.
21.
41.
72.
11.
72.
02.
61.
71.
61.
51.
81.
836
Av.
2.4
2.9
2.2
2.4
2.6
2.3
1.9
2.3
2.8
2.5
2.4
3.3
1.8
2.0
1.9
2.1
2.4
47

Perceptions of Key Services
CITIZEN REPORT CARD ON MUNICIPAL SERVICES IN AFGHANISTAN 2017 36
In terms of specific indicators, only five of the 16, or 31%, scored an average of 2.5 or above, representing a 50% score, namely those relating to Documents and Licensing, Road and Sidewalks, Tax Collection, Infrastructure and Cooperation on Cleaning. Only one indicator, relating to Cooperation on Cleaning, scored more than 60%. This is very consistent with the overall ratings, with four of these five, not including Infrastructure, also appearing in the overall top-five list, where Cooperation on Cleaning was again the top-scoring indicator by quite a healthy margin.
The bottom five indicators, which ranged from 36% to 42%, included four of the five governance indicators, along with Car Parking. This represented an overlap of three indicators – Access to Information, Accountability and Car Parking – with the bottom five scoring indicators overall, albeit with much lower scores (overall, the bottom five ranged from 47 to 50%), reflecting the generally low scores in Kabul.
There is a lack of adequate car parking in Kabul and the municipality performs weakly in this area. There are also serious accountability gaps, for example demonstrated by the absence of public accountability events with the people. Again, the provision of information by Kabul city is limited, including in terms of proactive disclosure, and there is very limited consultation with people or efforts to foster public participation.
In terms of top and bottom overall scores, questions 7 and 13 (on Solid Waste Management and Car Parking, respectively) have the dubious distinction of getting a truly terrible rating of only 1.1 from a whole district, in both cases MD18, which means that almost everyone in the district gave those services a rating of ‘Very Bad’. Four other indicators, namely on Wastewater Drainage, Parks and Green Spaces, Access to Information and Accountability, respectively, got one or more ratings of below 1.5 from whole districts, again a disturbingly low score. In all but one case, the bottom rating was given by MDs 18, 21 and/or 22, which were also the three overall bottom-ranking districts.
Question 14, on Bus Stands, can claim the highest rating from a whole district, namely of 4.0, which is equivalent to an average rating of ‘Good’. Three other indicators – namely Documents and Licensing, Roads and Sidewalks and Cooperation on Cleaning – got one or more whole district ratings of above 3.5, which is between ‘Good’ and ‘Fair/Just OK’. In all but one case, MD 13 was among those which gave these top ratings (although that district is tied for fourth position among the districts).
Overall, the range of ratings for a particular indicator among the different districts tended to be quite small. Only two indicators, Solid Waste Management and Bus Stands, had a spread of more
than 2 full points (i.e. the difference between highest score given by any district and the lowest score), while the spread for 14 indicators (about two-thirds of the total), was less than 1.5 points. This means that perceptions among districts about a given area of performance tended not to vary that much. figure 11 and figure 12 show, respectively, the indicators with the greatest and smallest spreads.
Figure 11: Indicator 8, Bas Stand
5
4
3
2
1
02,0 2,9 2,5 2,7 2,5 2,4 2,8 2,4 2,4 1,7 3,0 1,8 4,0 1,8 2,3 2,1 3,1 1,6 1,8 1,7 1,7
Dist
rict 1
Dist
rict 2
Dist
rict 3
Dist
rict 4
Dist
rict 5
Dist
rict 6
Dist
rict 7
Dist
rict 8
Dist
rict 9
Dist
rict 1
1
Dist
rict 1
2
Dist
rict 1
4
Dist
rict 1
6
Dist
rict 1
7
Dist
rict 1
8
Dist
rict 1
9
Dist
rict 2
1
Dist
rict 2
2
Dist
rict 1
5
Dist
rict 1
3
Dist
rict 1
0Figure 12: Indicator 16, Effectiveness of Complains Mechanism
3
2
1
0
Dist
rict 1
Dist
rict 2
Dist
rict 3
Dist
rict 4
Dist
rict 5
Dist
rict 6
Dist
rict 7
Dist
rict 8
Dist
rict 9
Dist
rict 1
1
Dist
rict 1
2
Dist
rict 1
4
Dist
rict 1
6
Dist
rict 1
7
Dist
rict 1
8
Dist
rict 1
9
Dist
rict 2
1
Dist
rict 2
2
Dist
rict 1
5
Dist
rict 1
3
Dist
rict 1
0
2,2 2,2 2,2 2,22,6 2,3 2,3 2,3 2,32,32,0 2,0 2,0 1,9 1,92,1 2,1 1,8 1,81,7 1,7
Despite its overall poor performance, the average score for Kabul was still up a modest three percent from the 2016 exercise, at 47% compared to 44% at that time. Table 5 shows the score differences between 2017 and 2016, and also those differences adjusted for the overall gain of three percent in 2017. It is immediately clear that there have been significant changes since 2017. Of course this might be partly explained by the very different methodologies employed. Apart from anything else, the CRC methodology resulted in a roughly equal number of women participants, whereas the Community
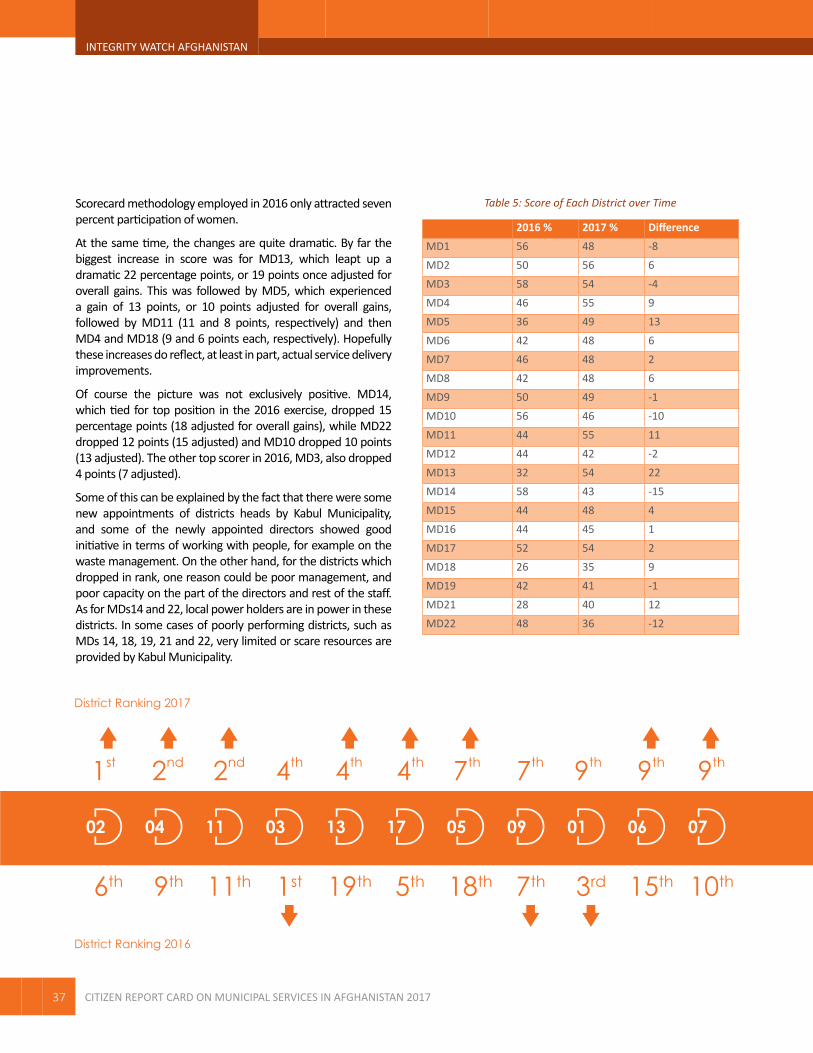
37
INTEGRITY WATCH AFGHANISTAN
CITIZEN REPORT CARD ON MUNICIPAL SERVICES IN AFGHANISTAN 2017
Table 5: Score of Each District over Time
2016 % 2017 % DifferenceMD1 56 48 -8MD2 50 56 6MD3 58 54 -4MD4 46 55 9MD5 36 49 13MD6 42 48 6MD7 46 48 2MD8 42 48 6MD9 50 49 -1MD10 56 46 -10MD11 44 55 11MD12 44 42 -2MD13 32 54 22MD14 58 43 -15MD15 44 48 4MD16 44 45 1MD17 52 54 2MD18 26 35 9MD19 42 41 -1MD21 28 40 12MD22 48 36 -12
Scorecard methodology employed in 2016 only attracted seven percent participation of women.
At the same time, the changes are quite dramatic. By far the biggest increase in score was for MD13, which leapt up a dramatic 22 percentage points, or 19 points once adjusted for overall gains. This was followed by MD5, which experienced a gain of 13 points, or 10 points adjusted for overall gains, followed by MD11 (11 and 8 points, respectively) and then MD4 and MD18 (9 and 6 points each, respectively). Hopefully these increases do reflect, at least in part, actual service delivery improvements.
Of course the picture was not exclusively positive. MD14, which tied for top position in the 2016 exercise, dropped 15 percentage points (18 adjusted for overall gains), while MD22 dropped 12 points (15 adjusted) and MD10 dropped 10 points (13 adjusted). The other top scorer in 2016, MD3, also dropped 4 points (7 adjusted).
Some of this can be explained by the fact that there were some new appointments of districts heads by Kabul Municipality, and some of the newly appointed directors showed good initiative in terms of working with people, for example on the waste management. On the other hand, for the districts which dropped in rank, one reason could be poor management, and poor capacity on the part of the directors and rest of the staff. As for MDs14 and 22, local power holders are in power in these districts. In some cases of poorly performing districts, such as MDs 14, 18, 19, 21 and 22, very limited or scare resources are provided by Kabul Municipality.
02 04 11 03 13 17 05 09 01 06 07 08 15 10 16 14 12 19 21 22 18
District Ranking 2016
6th 10th15th3rd7th18th5th19th1st11th9th 16th 21th8th20th17th12th2nd14th4th13th
District Ranking 2017
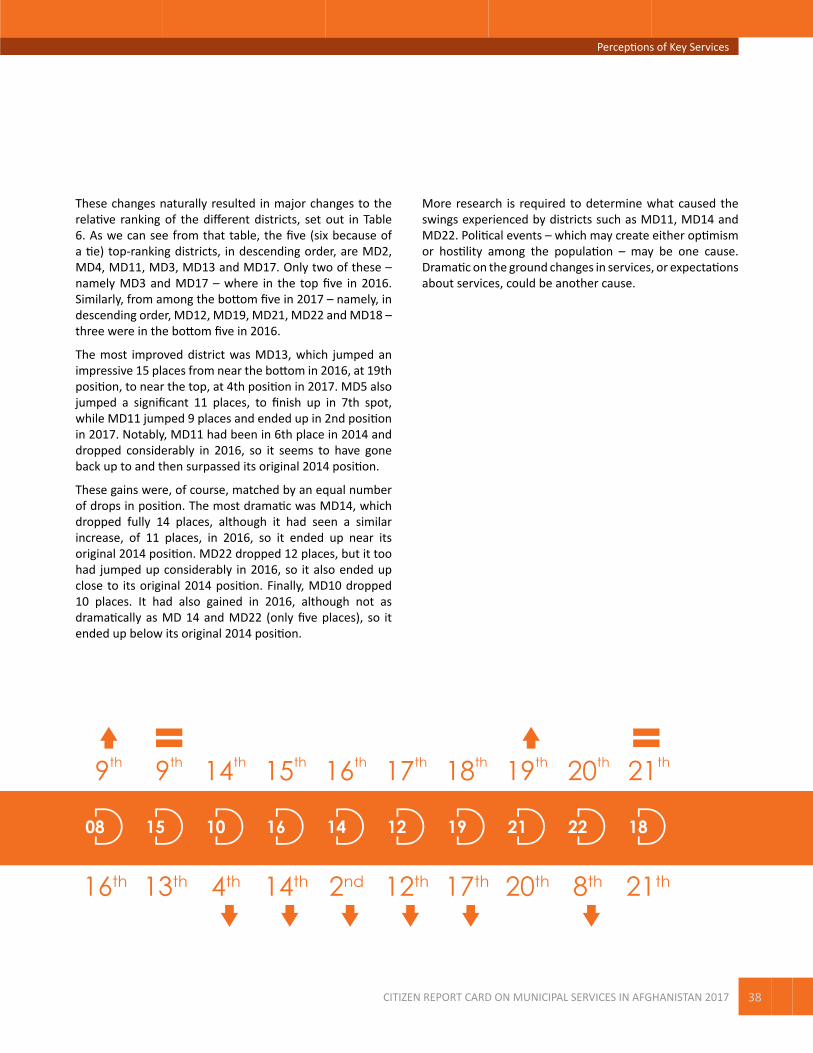
Perceptions of Key Services
CITIZEN REPORT CARD ON MUNICIPAL SERVICES IN AFGHANISTAN 2017 38
These changes naturally resulted in major changes to the relative ranking of the different districts, set out in Table 6. As we can see from that table, the five (six because of a tie) top-ranking districts, in descending order, are MD2, MD4, MD11, MD3, MD13 and MD17. Only two of these – namely MD3 and MD17 – where in the top five in 2016. Similarly, from among the bottom five in 2017 – namely, in descending order, MD12, MD19, MD21, MD22 and MD18 – three were in the bottom five in 2016.
The most improved district was MD13, which jumped an impressive 15 places from near the bottom in 2016, at 19th position, to near the top, at 4th position in 2017. MD5 also jumped a significant 11 places, to finish up in 7th spot, while MD11 jumped 9 places and ended up in 2nd position in 2017. Notably, MD11 had been in 6th place in 2014 and dropped considerably in 2016, so it seems to have gone back up to and then surpassed its original 2014 position.
These gains were, of course, matched by an equal number of drops in position. The most dramatic was MD14, which dropped fully 14 places, although it had seen a similar increase, of 11 places, in 2016, so it ended up near its original 2014 position. MD22 dropped 12 places, but it too had jumped up considerably in 2016, so it also ended up close to its original 2014 position. Finally, MD10 dropped 10 places. It had also gained in 2016, although not as dramatically as MD 14 and MD22 (only five places), so it ended up below its original 2014 position.
More research is required to determine what caused the swings experienced by districts such as MD11, MD14 and MD22. Political events – which may create either optimism or hostility among the population – may be one cause. Dramatic on the ground changes in services, or expectations about services, could be another cause.
02 04 11 03 13 17 05 09 01 06 07 08 15 10 16 14 12 19 21 22 18
District Ranking 2016
6th 10th15th3rd7th18th5th19th1st11th9th 16th 21th8th20th17th12th2nd14th4th13th
District Ranking 2017

39
INTEGRITY WATCH AFGHANISTAN
CITIZEN REPORT CARD ON MUNICIPAL SERVICES IN AFGHANISTAN 2017
mechanism – recorded relatively low increases despite having low starting points to begin with (ranging from 26% to 30%). Between 2014 and 2017 the improvements for these four issues increased by only 8 to 12 percent, while between 2016 and 2107, as noted above, two of the four actually declined by four percent and none recorded improvements of above two percent. The overall result was that these four issues, along with parking, recorded the lowest scores in 2017. This is a matter of concern given that improvements in these governance issues are needed to drive improvements in all other issues. In other words, once governance systems are improved, we could expect that to create the impetus for improvements in all areas of service delivery.
Table 7 shows the change, in terms of percentage score, of the results between 2016 and 2017, broken down by district. Changes of between -5% and +5% are highlighted in yellow, changes above +5% are coded green and those below -5% are marked red. The first thing to note, as reflected in the almost random sequence of colours in the table, is that results were clearly not consistent across questions and districts. Indeed, no column (representing questions) or row (representing districts) is a uniform colour.
The section above looks at the performance of each district of Kabul over time. This section, in contrast, looks at the performance in terms of different questions within Kabul, the only city where there were previous results, over time. Table 6 shows the average scores in all districts for each question in 2014 (the first Community Scorecard assessment), 2016 (the second Community Scorecard assessment) and 2017 (the first Citizen Report Card survey). Despite the differences between these methodologies, it is still interesting to compare the results.
As Table 6 shows, the average scores have increased steadily since 2014, from 34% t0 44% to 47%, although by far the most important increase was between 2014 and 2016 when the average jumped by ten percent. Between 2014 and 2017, Infrastructure recorded the greatest overall increase, of 1.1 points or 22%, followed by private construction (20%) and then bus stands, tax collection and cooperation on cleaning (18%). At the other end of the spectrum, the weakest improvement was in terms of solid waste management (four percent), followed by parks and green spaces and access to information (eight percent). The results for just 2016 to 2017 are similar, again with infrastructure, cooperation on cleaning, bus stands and tax collection, along with roads and sidewalks, coming in the top two scoring questions. Access to information and public participation actually declined by four percent over this period, while solid waste management and accountability failed to improve at all.
The overall improvements recorded are very welcome. At the same time, given the low starting point – and overall average of just 34% – one would expect some improvement. Furthermore, the average results show that there is still significant room for improvement, which remains the case because even in 2017 the overall average score was below 50%.
Given the scope for further improvement, the dramatic slowing down of the pace of increase – which was ten percent between 2014 and 2016 but only three percent between 2016 and 2017 – is a matter of some concern. At the same time, it is possible that part of the explanation for this is due to the different methodologies applied in 2014 and 2016, on the one hand, and 2017, on the other. It would be very interesting to see what changes might occur in a future survey along the lines of the 2017 survey.
All of the core governance issues – access to information, public participation, accountability and complaints
Performance by Question Within Kabul Over Time

Perceptions of Key Services
CITIZEN REPORT CARD ON MUNICIPAL SERVICES IN AFGHANISTAN 2017 40
Table 6: Average Scores by Question in Kabul over Time
Number Question 2014 2016 2017 Diff. 2014-17 Diff. 2016-17
7 Solid Waste Management 2.2 2.4 2.4 0.2 0.0
8 Documents and Licensing 2.2 2.7 2.9 0.7 0.2
9 Wastewater Drainage 1.6 2.1 2.2 0.6 0.1
10 Sanitation 1.6 2.1 2.4 0.8 0.3
11 Roads and Sidewalks 1.9 2.2 2.6 0.7 0.4
12 Parks and Green Spaces 1.9 2.2 2.3 0.4 0.1
13 Car Parking 1.3 1.8 1.9 0.6 0.1
14 Bus Stands 1.4 1.9 2.3 0.9 0.4
15 Tax Collection 1.9 2.4 2.8 0.9 0.4
16 Infrastructure 1.4 2.0 2.5 1.1 0.5
17 Private Construction 1.4 2.1 2.4 1.0 0.3
18 Cooperation on Cleaning 2.4 2.8 3.3 0.9 0.5
19 Access to Information 1.4 2.0 1.8 0.4 (0.2)
20 Public Participation 1.5 2.2 2.0 0.5 (0.2)
21 Accountability 1.3 1.9 1.9 0.6 0.0
22 Complaints Mechanism 1.5 2.0 2.1 0.6 0.1
Averages 1.7 2.2 2.4 0.7 0.2
Averages as a Percentage 34 44 47 13 3
Every single column (question) includes at least one square of each colour. This suggests that the quality of the service being assessed improved significantly in some districts, deteriorated significantly in others and remained about the same in yet others. The only question to have an average ‘red’ score was question 20, on public participation. It tied with question 19 (access to information), which just avoided a red average scored, for the most red districts, at 11 out of 21.
Five questions earned an overall green score, with question 14 (bus stands) getting the highest positive rating, of nine percent, and also the largest number of green districts, also 14. The other questions to get an overall green score, showing strong overall improvement, where questions 11 (roads and sidewalks), 15 (tax collection), 16 (infrastructure) and 18 (cooperation on cleaning).
The other ten questions got a yellow score. These results
are consistent with the overall results, which showed an average improvement of three percent between 2016 and 2017. The single largest improvement was district 13 on question 14 (bus stands), with a whopping increase of 52%, while the largest decline was district 14 on question 13 (car parking), dropping 28%.
The results are somewhat more concentrated by district, with ten districts only recording two colours of scores. The poorer performers were districts 1, 10 and 14, which only recorded red and yellow scores, while the better performers were districts 2, 4, 5, 6, 8, 13 and 18, which only had yellow and green scores.

41
INTEGRITY WATCH AFGHANISTAN
CITIZEN REPORT CARD ON MUNICIPAL SERVICES IN AFGHANISTAN 2017
Tabl
e 7:
Cha
nge
of S
core
by
Dist
rict b
y Q
uesti
on F
rom
201
6 to
201
7
Q
7Q
8Q
9Q
10Q
11Q
12Q
13Q
14Q
15Q
16Q
17Q
18Q
19Q
20Q
21Q
22
MD1
-6-2
-10
-2-2
-6-8
-16
-12
-10
-80
-12
-12
-10
-6
MD2
0-2
410
-22
-416
610
26
86
1614
MD3
-40
46
02
42
-12
-60
-10
-12
-18
-10
-6
MD4
814
166
62
614
126
168
62
04
MD5
1218
2216
2216
814
1622
410
24
1610
MD6
146
1010
810
616
28
44
82
10-2
MD7
-2-2
82
124
016
812
-22
-10
-10
-2-1
0
MD8
1012
1412
148
-26
46
00
-2-2
4-2
MD9
-16
0-6
-40
06
46
48
12-6
-12
0-6
MD1
0-1
6-1
2-1
0-2
-8-8
-12
-6-1
2-6
-14
-12
-12
-12
-8-8
MD1
10
218
630
2018
1418
2220
64
-2-6
0
MD1
2-1
0-2
04
-4-2
-8-4
40
-68
-14
-10
-24
MD1
332
2226
2438
010
5228
3022
144
014
18
MD1
4-2
6-1
8-2
0-6
-18
-8-2
8-1
8-8
-4-1
2-1
0-1
2-1
6-1
2-6
MD1
58
4-2
62
-46
128
810
18-8
-2-4
-6
MD1
66
2-2
02
06
108
24
-2-2
-84
6
MD1
7-2
62
-810
-88
226
812
6-1
6-1
8-6
-10
MD1
80
80
1214
4-2
1020
1212
2410
86
12
MD1
9-1
8-2
-12
2-6
-20
-26
128
1422
-10
-10
-2-2
MD2
1-6
10-1
016
62
612
2816
3836
412
1212
MD2
2-2
6-2
2-1
4-4
-28
-8-2
-12
-10
-14
-14
-10
-22
-16
-20
Avra
ge-2
22
56
10
96
75
6-4
-60
0

Perceptions of Key Services
CITIZEN REPORT CARD ON MUNICIPAL SERVICES IN AFGHANISTAN 2017 42
Bamyan is a central province of Afghanistan. About three people in ten believe that municipality services have improved in Bamyan in last one year.

43
INTEGRITY WATCH AFGHANISTAN
CITIZEN REPORT CARD ON MUNICIPAL SERVICES IN AFGHANISTAN 2017
INTEGRITY WATCH AFGHANISTAN
Question 24 was an open question asking why the respondent had paid a bribe, and the twenty most common responses to this were recorded. From among these, the two most common were to obtain legal documents relating to one’s home (11.5%) and to obtain a tax declaration (7.4%). These were followed by getting approval for a new home (5.7%), getting a survey map of one’s home (4.9%) and getting a shop licence or identification card (each at 4.1%). Although, as noted, these are not statistically significant, they all seem to be fairly common reasons to have to pay a bribe (i.e. they line up with what common sense might suggest).
Finally, question 25 asked whether paying a bribe was successful, in terms of the service being provided. As one might expect, the results here were fairly conclusive in the sense that 92.6% of the substantive responses here indicated that the bribe was successful, while only 7.4% were unsuccessful.
The last section of the survey, comprising questions 23 to 25, looked at the issue of paying bribes for services. Question 23 asked whether or not respondents had paid a bribe for any municipal services in the last year. It is very encouraging that the vast majority of respondents, over 98% of those providing a substantive response to this question (and the number of non-substantive responses, such as ‘Do Not Know’, was tiny), said they had not paid a bribe, with just 1.6% indicating that they had.
This is somehow an encouraging result which would seem to suggest that the use of bribes to obtain municipal services is much lower than one might otherwise have suspected. At the same time, it is substantially inconsistent with information obtained in another survey conducted at about the same time as this CRC survey, focusing on Access to Information, in which 25% of all respondents indicated that they had paid a bribe to access information.15 While this is just one particular service from among 22 assessed in the current CRC exercise, the significant discrepancy in the results suggests that further assessment of this may be required.
There may be a number of explanations for the low percentage here. First, since only those who had obtained a service from the municipality could have paid a bribe, the number of those saying they did not would likely have been inflated by those who did not obtain a service in the first place (question 1 indicated that only 40% of all those surveyed had obtained a service). Second, from among those who did obtain a service, in many cases this might have been a very routine service, such as obtaining an ID card, for which one would not normally pay a bribe. The question does not, as a result, tell us what percentage of those obtaining larger services might have paid a bribe, which might be closer to the figures in the Access to Information survey.
Only those who answered in the affirmative to question 23, i.e. only 1.6% of all respondents, were directed to go on to answer questions 24 and 25. This tiny number means that the results for these questions are not statistically reliable. At the same time, it is interesting to at least review the results.
15 Integrity Watch Afghanistan, Report on Implementation of Access to Information in Afghanistan: Analysis of a Comprehensive Baseline Survey, 2017.
BRIBES

Cross-cutting Themes
CITIZEN REPORT CARD ON MUNICIPAL SERVICES IN AFGHANISTAN 2017 44
The detailed results of this CRC survey contain a wealth of useful information which can be broken down along various demographic lines or cross-cutting themes. The demographic information collected as part of this survey covered a wide range of issues such as the number of people living in the household, the marital status of the respondent, whether the respondent was the head of the household and the religion of the respondent. For current purposes, however, we focus on five demographic issues, namely the gender, age, ethnicity and level of education of the respondent and the total (monthly) income of the people living in the household.
We will also, for current purposes, focus mainly on the General Perceptions part of the survey, found in questions 1 to 6, leaving for future study a cross-cutting or demographically comparative analysis of the responses to the questions asking for a rating of different services or governance issues. As noted above, the tiny number of respondents indicating that they had paid a bribe for services means that the results from this part of the survey are not statistically relevant and breaking them down further along cross-cutting lines would render the results even less statistically relevant.
Gender OutlookAs noted above, unlike the Community Scorecard exercises undertaken in Kabul in 2014 and 2016, which attracted only limited engagement by women, the 2017 CRC survey was roughly gender balanced in terms of participation. On the key issue of whether the respondent had visited the municipality during the last year, assessed in question 1 of the survey, when the results are broken down by gender they show a remarkable skew in favour of men. Specifically, 48% of men had visited the municipality, whereas only 26% of women had (which, when averaged out gives the overall figure of 37% visiting, shown in Figure 13). Put differently, the number of men visiting the municipality was almost 85% greater than the number of women.
This is perhaps not surprising in a country like Afghanistan, which suffers from serious gender equality issues. At the same time, it is a major problem, not only for its implications in terms of gender equality but also because, given the core role played by women in the family, it suggests that families are not able to take full advantage of the services offered by municipalities.
Figure 13: Have you, or anyone in your family visited the Municipality in the past one year?
80%
60%
40%
20%
0%
48%
26%
52%
72%
0,394%
1,307%
0,219%
0,093%
Yes No Do not know Refused
Male Female
On the other hand, Figure 14, which shows the responses to question 3, assessing the level of satisfaction with services provided by the municipality, broken down by gender, shows that women tend to be far more satisfied than men with the services provided by municipalities. Specifically, 60% of women were satisfied with the services provided, while only 41% of men were, an increase of nearly 50%.
A similar difference was present in the responses to question 4, on whether respondents were fully or only partially satisfied, with 54% of women, compared to only 44% of men, saying they were fully satisfied. Combining these results, we can see that 32% of women were fully satisfied with the services they received, compared to just 18% of men, a rate of nearly 78% more among women. More study would be needed to understand why women were more satisfied with the services. It could be that women tend to be looking for different kinds of services, ones that tend to result in more satisfaction. For example, women may tend to focus more on services that relate to their domestic roles, whereas men interact across a wider range of services. It could also be that men tend to be more critical or there could be some other reason for this.
CROSS-CUTTING THEMES

45
INTEGRITY WATCH AFGHANISTAN
CITIZEN REPORT CARD ON MUNICIPAL SERVICES IN AFGHANISTAN 2017
possible explanation for this is that women tend to deal with the municipality in relation to a smaller cross-section of services.
Disparities Based on Income and EducationAnother cross cutting theme according to which the results of the survey were assessed was household income. For purposes of presenting these results, respondents were divided into eight different monthly income ranges, less than AFN 2,000, AFN 2-4,000, AFN 4-6,000, AFN 6-8,000, AFN 8-10,000, AFN 10-15,000, AFN 15-20,000 and AFN 20-25,000 (the small number of respondents with higher incomes meant that the results here were not statistically relevant).
The results for question 1, on visiting the municipality, did not show any consistent variation or trends according to income. Although the largest percentage of visits, namely 61%, was from the highest income group, the second largest percentage, 57%, was from the lowest but one income group and the range of percentages, from a low of 45% to the high of 61%, was in any case fairly small.
On the important question of how respondents rated the overall services provided by municipalities, question 5 of the survey, shown infigure 16, the results were again inconclusive. While the best rating came from the lowest income group, and there was a slight tendency for higher income groups to give lower ratings, the third lowest income group actually gave the worst rating here.
Figure 14:Generally speaking, are you satisfied or dissatisfied with the quality of the services provided by the Municipality?
100%
80%
60%
40%
20%
0%
41%59%
60%40%
Male Female
Satisfied Dissatisfied
Consistently with the above, women were also substantially more positive about the overall provision of services by municipalities, as assessed by question 5 of the survey. figure 15 shows the responses to this question broken down by gender. It is clear from the graph that while the number of ‘Fair/Just OK’ responses is roughly equal for both genders, men are far more heavily weighted in terms of ‘Bad’ and ‘Very Bad’ responses, while women are more heavily weighted in terms of ‘Good’ and especially ‘Very Good’ responses.
Figure 15: How do you rate the overall services provided by the Municipality?
30%
20%
10%
0%
23%
11%
28%
21%
29%
29%
17%
28% 3%
11%
Very Bad Bad Fair/Just OK Good Very good
Male Female
Finally, women are also far more positive on the question of whether the quality of services provided by municipalities has improved or worsened over the last year, as assessed by question 6 of the survey. 63% of women felt that it had improved, compared to just 46% of men. Once again, a
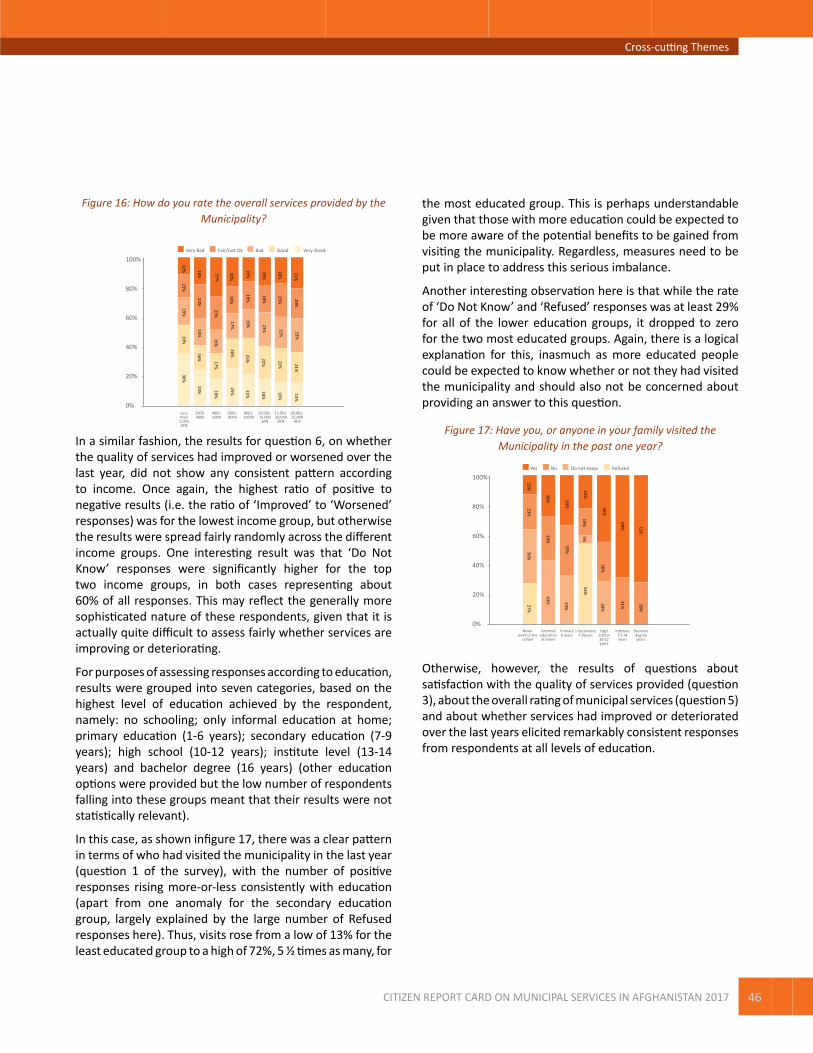
Cross-cutting Themes
CITIZEN REPORT CARD ON MUNICIPAL SERVICES IN AFGHANISTAN 2017 46
Figure 16: How do you rate the overall services provided by the Municipality?
100%
80%
60%
40%
20%
0%
12%15%
19%19%
36%
18%23%
19%16%
24%
27%23%
16%17%
18%
20%18%
17%20%
25%
16%19%
19%25%
21%
19%18%
23%22%
18%
18%23%
22%22%
16%
21%20%
23%21%
15%
Lessthan2,000AFN
2000-4000
4001-6000
6001-8000
8001-10000
15,001-20,000
AFN
20,001-25,000
AFN
10,001-15,000
AFN
Very Bad BadFair/Just Ok Good Very Good
In a similar fashion, the results for question 6, on whether the quality of services had improved or worsened over the last year, did not show any consistent pattern according to income. Once again, the highest ratio of positive to negative results (i.e. the ratio of ‘Improved’ to ‘Worsened’ responses) was for the lowest income group, but otherwise the results were spread fairly randomly across the different income groups. One interesting result was that ‘Do Not Know’ responses were significantly higher for the top two income groups, in both cases representing about 60% of all responses. This may reflect the generally more sophisticated nature of these respondents, given that it is actually quite difficult to assess fairly whether services are improving or deteriorating.
For purposes of assessing responses according to education, results were grouped into seven categories, based on the highest level of education achieved by the respondent, namely: no schooling; only informal education at home; primary education (1-6 years); secondary education (7-9 years); high school (10-12 years); institute level (13-14 years) and bachelor degree (16 years) (other education options were provided but the low number of respondents falling into these groups meant that their results were not statistically relevant).
In this case, as shown infigure 17, there was a clear pattern in terms of who had visited the municipality in the last year (question 1 of the survey), with the number of positive responses rising more-or-less consistently with education (apart from one anomaly for the secondary education group, largely explained by the large number of Refused responses here). Thus, visits rose from a low of 13% for the least educated group to a high of 72%, 5 ½ times as many, for
the most educated group. This is perhaps understandable given that those with more education could be expected to be more aware of the potential benefits to be gained from visiting the municipality. Regardless, measures need to be put in place to address this serious imbalance.
Another interesting observation here is that while the rate of ‘Do Not Know’ and ‘Refused’ responses was at least 29% for all of the lower education groups, it dropped to zero for the two most educated groups. Again, there is a logical explanation for this, inasmuch as more educated people could be expected to know whether or not they had visited the municipality and should also not be concerned about providing an answer to this question.
Figure 17: Have you, or anyone in your family visited the Municipality in the past one year?
100%
80%
60%
40%
20%
0%
13%23%
36%27%
43%29%
28% 34%33%
33%
54%5%
19%22%
45%26%
29%
69%31% 28%
72%
Neverwent to the
school
Informaleducationat home
Primary6 years
1-Secondary7-9years
HighSchool10-12years
Institute13-14years
Bachelordegreeyears
Yes No Do not know Refused
Otherwise, however, the results of questions about satisfaction with the quality of services provided (question 3), about the overall rating of municipal services (question 5) and about whether services had improved or deteriorated over the last years elicited remarkably consistent responses from respondents at all levels of education.
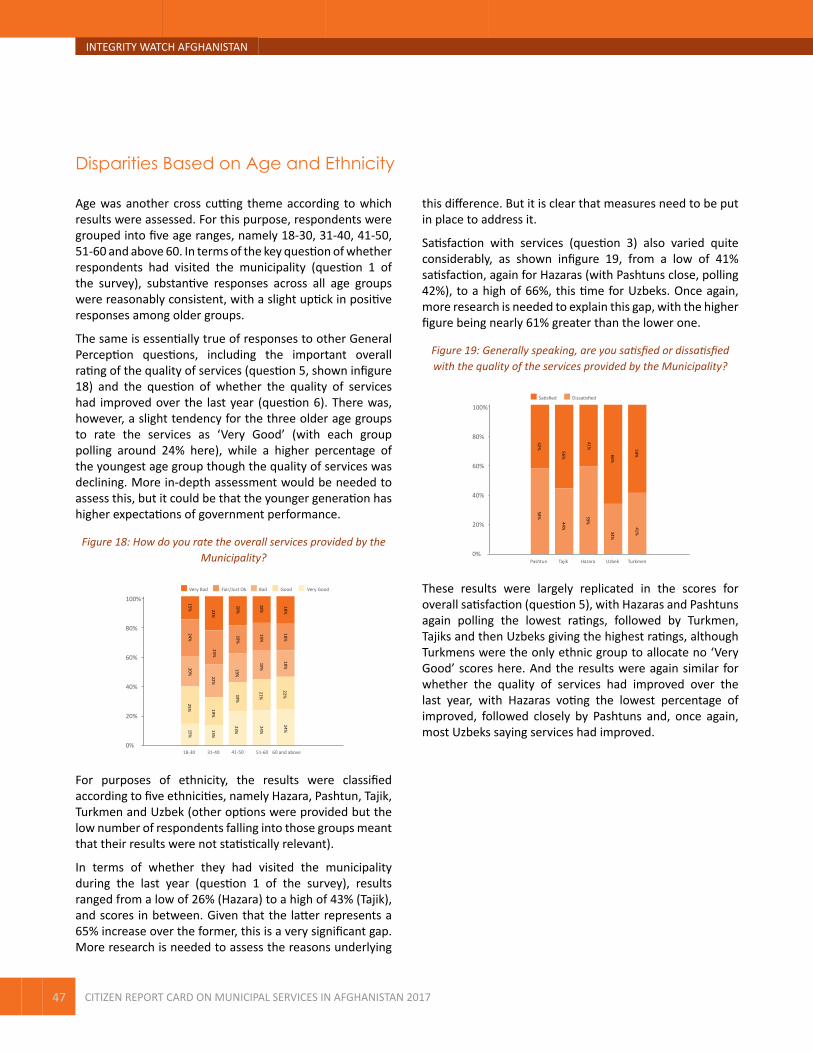
47
INTEGRITY WATCH AFGHANISTAN
CITIZEN REPORT CARD ON MUNICIPAL SERVICES IN AFGHANISTAN 2017
Age was another cross cutting theme according to which results were assessed. For this purpose, respondents were grouped into five age ranges, namely 18-30, 31-40, 41-50, 51-60 and above 60. In terms of the key question of whether respondents had visited the municipality (question 1 of the survey), substantive responses across all age groups were reasonably consistent, with a slight uptick in positive responses among older groups.
The same is essentially true of responses to other General Perception questions, including the important overall rating of the quality of services (question 5, shown infigure 18) and the question of whether the quality of services had improved over the last year (question 6). There was, however, a slight tendency for the three older age groups to rate the services as ‘Very Good’ (with each group polling around 24% here), while a higher percentage of the youngest age group though the quality of services was declining. More in-depth assessment would be needed to assess this, but it could be that the younger generation has higher expectations of government performance.
Figure 18: How do you rate the overall services provided by the Municipality?
100%
80%
60%
40%
20%
0%
15%24%
20%25%
15%
23%23%
22%19%
13%
20%19%
19%19%
23%
18%19%
19%21%
24%
18%18%
18%22%
24%
18-30 31-40 41-50 51-60 60 and above
Very Bad BadFair/Just Ok Good Very Good
For purposes of ethnicity, the results were classified according to five ethnicities, namely Hazara, Pashtun, Tajik, Turkmen and Uzbek (other options were provided but the low number of respondents falling into those groups meant that their results were not statistically relevant).
In terms of whether they had visited the municipality during the last year (question 1 of the survey), results ranged from a low of 26% (Hazara) to a high of 43% (Tajik), and scores in between. Given that the latter represents a 65% increase over the former, this is a very significant gap. More research is needed to assess the reasons underlying
this difference. But it is clear that measures need to be put in place to address it.
Satisfaction with services (question 3) also varied quite considerably, as shown infigure 19, from a low of 41% satisfaction, again for Hazaras (with Pashtuns close, polling 42%), to a high of 66%, this time for Uzbeks. Once again, more research is needed to explain this gap, with the higher figure being nearly 61% greater than the lower one.
Figure 19: Generally speaking, are you satisfied or dissatisfied with the quality of the services provided by the Municipality?
100%
80%
60%
40%
20%
0%
42%
56%
41%
66%
59%
58%
44%
59%
34%
41%
Pashtun Tajik Hazara Uzbek Turkmen
Satisfied Dissatisfied
These results were largely replicated in the scores for overall satisfaction (question 5), with Hazaras and Pashtuns again polling the lowest ratings, followed by Turkmen, Tajiks and then Uzbeks giving the highest ratings, although Turkmens were the only ethnic group to allocate no ‘Very Good’ scores here. And the results were again similar for whether the quality of services had improved over the last year, with Hazaras voting the lowest percentage of improved, followed closely by Pashtuns and, once again, most Uzbeks saying services had improved.
Disparities Based on Age and Ethnicity
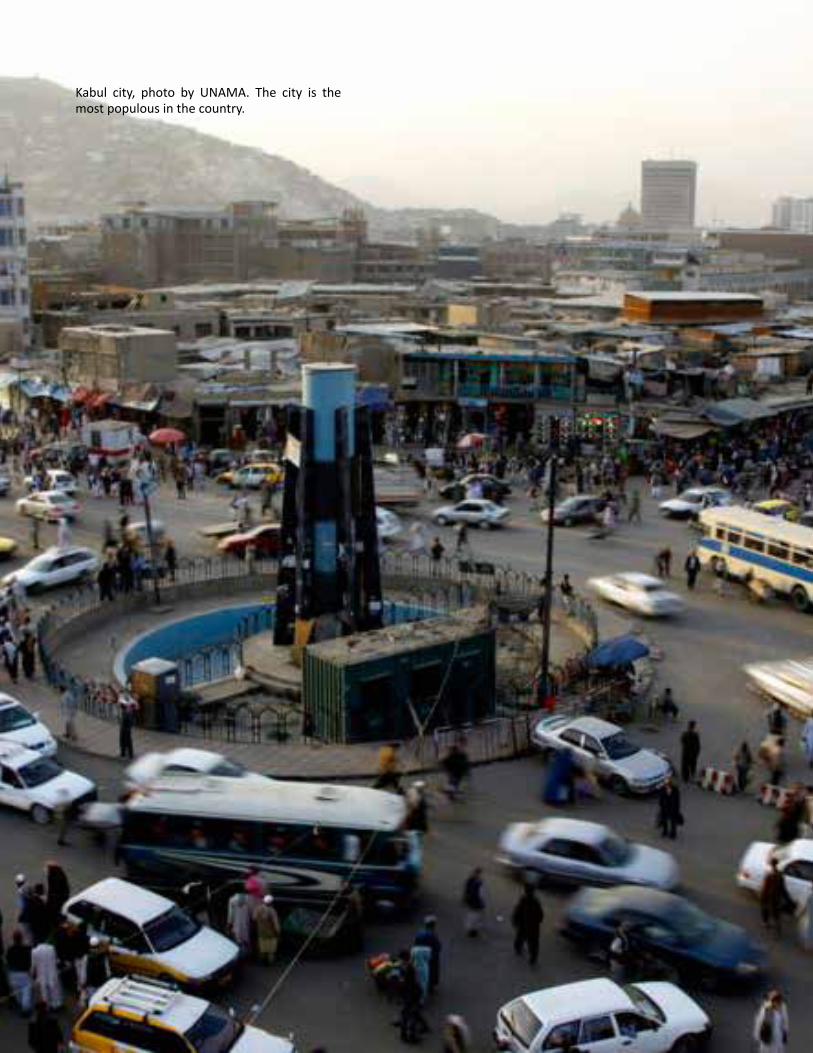
Cross-cutting Themes
CITIZEN REPORT CARD ON MUNICIPAL SERVICES IN AFGHANISTAN 2017 48
Kabul city, photo by UNAMA. The city is the most populous in the country.

49
INTEGRITY WATCH AFGHANISTAN
CITIZEN REPORT CARD ON MUNICIPAL SERVICES IN AFGHANISTAN 2017
and scores of 80% (i.e. ‘Good’) over the medium- to longer-term.
Table 5 shows the scores for each indicator by city, a total of 144 scores (16 indicators times 9 cities). Only three of these scores, or 2%, reached or exceeded 80%, or a ‘Good’ rating, which should be the goal for all indicators for all municipalities. Including those three, only 18 scores, or 13%, reached 70%, the mid-way point between ‘Fair/Just OK’ and ‘Good’. Even the modest 60% score, representing a ‘Fair/Just OK’ average rating, was achieved in only 62 cases, or 43% of the time.
Kabul had the dubious distinction of being the only city not to achieve a single 60%, or ‘Fair/Just OK’ rating for any indicator. The results for Kabul broken down by district are shown in Table 6. As one might expect from the city-wide result, when one breaks the results down by indicator and district they remain very weak. From among a total of 336 scores (16 indicators times 21 districts assessed), only one achieved a score of 80% or ‘Good’ and only 9, or about 2.5%, received scores of 70% or more (the mid-way point between ‘Fair/Just OK’ and ‘Good’). Even at the 60% level, there were only 57 scores, representing just 17% of the total.
Two districts – namely MD18 and MD21 – did not achieve even one 60% score and this was also the case for seven indicators within Kabul, namely Sanitation, Parks and Green Spaces, Car Parking, Access to Information, Public Participation, Accountability and Complaints Mechanism.
These results show clearly that every city and district of Kabul needs to do better on almost every indicator. In this case, even more clearly than for engagement, the responsibility lies with municipalities, although it is worth nothing that municipalities which take decisive steps to move forward will not be alone. Local and international civil society groups will undoubtedly pay attention, and provide support. Equally importantly, donors will orient their funds disproportionately towards those municipalities that are trying to effect real change.
Once again, what exactly is needed will depend on the specific service in question as well as the reasons why delivery is currently failing to deliver satisfaction. At a minimum, municipalities should adopt clear plans for improving service delivery, which include clear targets for doing better (i.e. moving to 60% then 70% and then 80% satisfaction ratings over a defined period of time).
A first, obvious, conclusion from this CRC exercise is that far too few Afghans are visiting municipalities. Overall, just 37% of all respondents indicated that they or anyone in their family had visited the municipality in the last year, and in only a few cities did the number go above 50%. Visiting the municipality is not the same thing as using municipal services, since everyone uses the roads, and benefits from garbage collection and enforcement of building rules, even if they never visit the municipality. At the same time, this figure is far too low given the large number of services – such as obtaining documents, making payments or applying for a licence – that do require a visit. Furthermore, many other types of engagement do require a visit, such as participating in planning, cooperating in the provision of services and making complaints.
It is equally clear that the responsibility for addressing this falls largely, albeit not exclusively, on municipalities themselves. The specific measures that will be most effective will vary depending on local circumstances. However, one fairly obvious measure would be to publicise the services that municipalities provide, the benefits that a visit to the municipality can bring and the options available for interacting with municipalities. Another might be looking at ways to make it easier to interact with municipalities. Setting up service desks, consumer hotlines and online systems for posing questions and even using services (e-government) might be options here.
The second obvious conclusion is that the quality of services provided needs to be substantially improved. Furthermore, this conclusion essentially applies across the board. The results do seem to suggest some improvement over time, based on a comparison with earlier results obtained for just Kabul and the positive response to question 6, where nearly two-thirds of respondents indicated that the quality of services had improved over the last year.
At the same time, there is clearly great room for improvement. As shown in Table 4, only two indicators received overall average scores above 60%, namely Cooperation on Cleaning (67%) and Documents and Licensing (61%). Given that 60% is only equivalent to a ‘Fair/Just OK’ rating, this is hardly impressive. No indicator reached a score of 70%, which is mid-way between ‘Fair/Just OK’ and ‘Good’, let alone a score of 80%, which is equivalent to ‘Good’. It is fair to suggest that all municipalities should be aiming to achieve at least 60% scores across the board in the short-term, 70% scores in the short- to medium-term
CONCLUSION AND RECOMMENDATIONS
Conclusion and Recommendations
CITIZEN REPORT CARD ON MUNICIPAL SERVICES IN AFGHANISTAN 2017 50
In most cases, consultation with affected populations will be needed to ensure that there is appropriate, targeted action to move forward. Training of staff may be needed, along with more resources in some cases. However, in many cases an enormous amount can be done simply by changing attitudes (including rooting out corruption).
There may be some grounds for the national government and donors to concentrate resources on the weaker performing cities, namely Gardez, Kabul and Konduz, as long as they demonstrate political will to effect changes. However, care is needed here both to ensure that political will is actually present and to avoid undue skews. It is almost certainly the case, for example, that Kabul already attracts far more donor attention than other cities. The same may also be warranted for indicators (i.e. focusing more attention on more weakly performing indicators).
There is a particular problem with four of the five governance indicators (i.e. excluding Cooperation on Cleaning which actually did best from among all of the indicators overall). Within Kabul, all four of these indicators were among the seven which did not achieve a single 60% score. Among all cities, not a single one of these four indicators achieved a 70%, let alone an 80%, score, and the number of 60% scores was also low (13 out of 36 scores or 36%, considerably lower than the 43% rate achieved among all indicators).
This represents both a challenge and an opportunity. It is a challenge because it can be difficult to improve governance, which requires changing attitudes and not just investing in infrastructure or systems, although these can also help. On the other hand, and by the same token, changing attitudes can be promoted through strong leadership and management measures, and often requires relatively little financial investment, which may not be readily available. Furthermore, once governance reforms have been achieved, this can have a substantial positive knock-on effect on the improvement of other services. This is because good governance systems, especially in the areas covered by the indicators included in the CRC exercise, are linked to engaging the public in a constructive way which, in turn, is key to improving service delivery.
Here, more than in any other area, what is needed will depend on the circumstances. Afghanistan has recently adopted an Access to Information Law which can provide substantial impetus to improving the Access to Information indicator. Simply becoming more service oriented is often
very important here. Putting in place more and more effective systems for public participation should have immediate impacts in terms of accountability, not to mention other services. More formal measures may be required in the area of complaints mechanisms, specifically in the sense of putting in place systems for this.
When measured over time, in Kabul, the results show a significant amount of change. There is no question that that direction is generally positive. At the same time, inasmuch as the relative ranking of different indicators or cities (or districts) changes rapidly, questions must be raised because radical changes of this sort are more likely to be based on perception than on real ‘on-the-ground’ change, if only because the latter does take some time. This view is reinforced by the fact that some of the indicators that swung heavily between the 2014 and 2016 Community Scorecard exercises swung heavily back in this CRC exercise, ending up close to where they started out in 2014. The reasons for this should be studied and, if relevant, changes should be introduced into the methodology to screen out factors which may be contributing to these swings.
More research is needed into the question of bribes. A body of research, including the baseline survey on the Access to Information Law which was conducted largely in parallel to this exercise, suggests that there is a significant problem of corruption, including through the payment of small bribes to obtain services, in Afghanistan.16 In stark contrast to this, the current CRC exercise suggests that the payment of bribes is actually very rare. More research is needed to clarify what the actual situation is.
The results of the CRC exercise show clearly that women are far less engaged at the municipal level than men. This is inherently a problem, inasmuch as it represents a gender equality failure. But it is even more serious than that, inasmuch as the role that women play in the family means that this failure is likely to have a disproportionate impact on all family members, and especially children. Despite their dramatically lower levels of engagement, women are far more positive about both the quality of municipal services and the direction in terms of improvement of those services than their male counterparts. This suggests that they would be open to activities which sought to engage them more fully.
16 See note 15.
51
INTEGRITY WATCH AFGHANISTAN
CITIZEN REPORT CARD ON MUNICIPAL SERVICES IN AFGHANISTAN 2017
In a similar fashion, since the CRC survey showed that engagement drops with education, more needs to be done to engage those with lower levels of education at the municipal level. Finally, certain ethnic groups – in particular Hazaras and Pashtuns –tend both to engage less with municipalities and to have a poorer view of the quality of services provided by municipalities. Targeted efforts need to be undertaken both to understand better why this is the case and then to address it.
The comments made above about general measures for engaging citizens are also relevant here, but more tailored measures may also be needed. For example, women tend to communicate using different tools, so municipalities need to make sure that any communications aimed at increasing engagement are reaching women. It is also likely that women are more oriented towards using certain types of services so again outreach needs to take that into account.

Conclusion and Recommendations
CITIZEN REPORT CARD ON MUNICIPAL SERVICES IN AFGHANISTAN 2017 52
▪ Municipalities should invest appropriately in measures to address the low level of engagement of citizens with municipalities. This should include publicising the services the municipality provides, the benefits of interacting with the municipality and options for doing this. It might also include putting in place new systems for making it easier to interact with the municipality.
▪ With very few exceptions, all cities and all districts in Kabul need to do much better in terms of delivering services across all of the 16 indicators covered by the CRC exercise. This should involve the adoption of clear plans, with clear targets, for improving service delivery. Beyond that, what is needed depends on the situation but options include:
▪ training for staff;
▪ greater resource allocation (financial and/or human);
▪ changing attitudes;
▪ rooting out corruption; and
▪ simply doing things better.
▪ To the extent that this is appropriate, external actors such as the national government and donors should focus more attention on the weaker performing cities and indicators.
▪ Municipalities should pay particular attention to improving performance on the governance indicators both because this is an area of particularly weak performance and because improvements here can have a positive knock-on effect on the delivery of other services. Key elements of a strategy here might include:
▪ implementing the Access to Information Law;
▪ providing more opportunities for genuine participation by citizens; and
▪ creating effective if simple systems for receiving and processing complaints.
▪ The reason for the major swings experienced in a number of districts of Kabul should be studied further. As relevant, changes should be introduced into the CRC methodology to make it more robust.
▪ More research should be done looking into the question of whether and to what extent local residents in municipalities pay small bribes to obtain services.
▪ Special efforts need to be made to reach out to women with a view to engaging them more at the municipal level. Such efforts need to be tailored to how women communicate and use municipal services. Similar efforts need to be made to reach out to citizens with lower levels of education.
▪ More study is needed to understand why certain ethnic groups both engage less with municipalities and are less satisfied with municipal services. Once this is better understood, measures should be taken to address it.
Recommendations
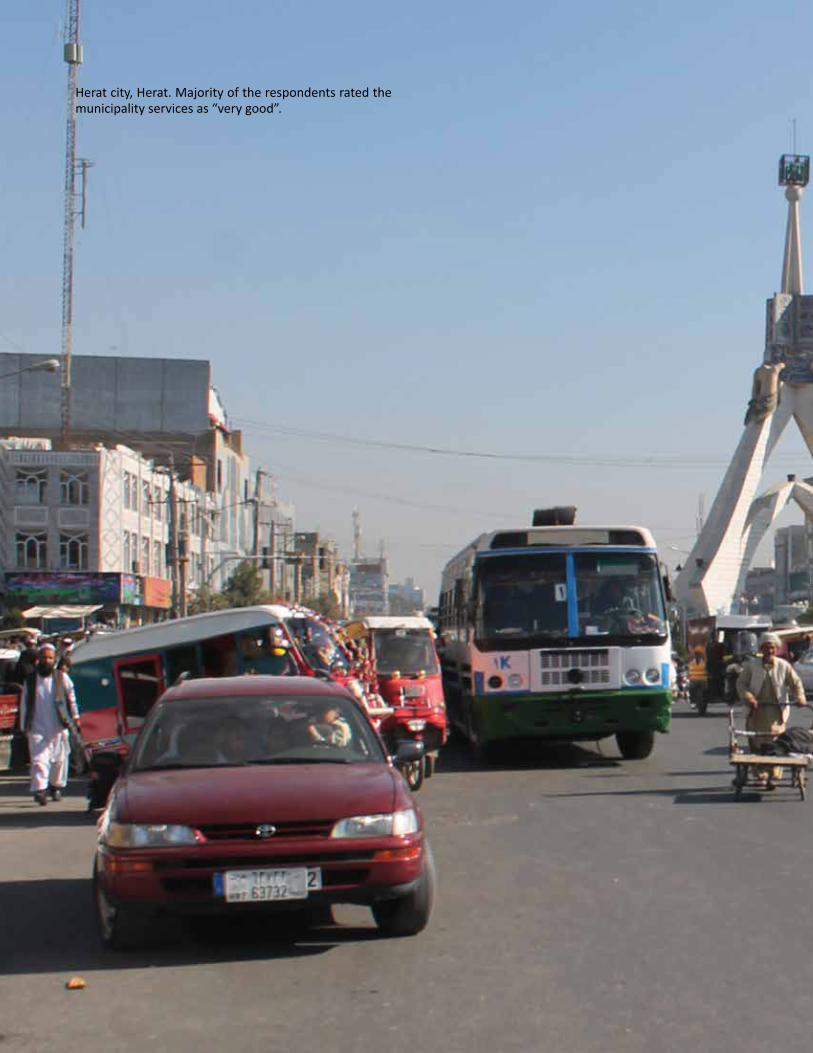
53
INTEGRITY WATCH AFGHANISTAN
CITIZEN REPORT CARD ON MUNICIPAL SERVICES IN AFGHANISTAN 2017
Herat city, Herat. Majority of the respondents rated the municipality services as “very good”.
Conclusion and Recommendations
CITIZEN REPORT CARD ON MUNICIPAL SERVICES IN AFGHANISTAN 2017 54

55
INTEGRITY WATCH AFGHANISTAN
CITIZEN REPORT CARD ON MUNICIPAL SERVICES IN AFGHANISTAN 2017
ANNEXES
GENERAL
1. Have you, or anyone in your family visited the Municipality in the past one year?
1. Yes
2. No – Go to question 3
3. 98. Do not know
4. 99. Refused
2. For what reason did you visit the Municipality?
3. Generally speaking, are you satisfied or dissatisfied with the quality of the services provided by the Municipality in your city?
1. Satisfied
2. Dissatisfied - Go to question 5
4. How satisfied are you?
1. Partly satisfied
2. Fully satisfied
5. How do you rate the overall services provided by the Municipality? (1 – 5)
1. Very Bad
2. Bad
3. Fair / Just Ok
4. Good
5. Very Good
6. 98. Do not Know
7. 99. Refused
6. In the past one year, have the quality of the services provided by the Municipality improved or worsened?
1. Improved
2. Worsened

Annexes
CITIZEN REPORT CARD ON MUNICIPAL SERVICES IN AFGHANISTAN 2017 56
KEY INDICATORS
Now, I would like to ask you some questions about the key responsibility indicators of the Municipality. For each of the key indicators, please tell me if Municipality is; Very Good, Good, Fair, Bad or Very Bad.
[For investigators: Please do not read the options; please explain the scoring method of the CRC to the respondent and ask him/her about the score for each indicator (Very Good = 5 – Very Bad = 1)].
7. How do you rate the “Solid Waste Management” service of the Municipality in your city?
1. Very Bad
2. Bad
3. Fair / Just Ok
4. Good
5. Very Good
6. 98. Do not Know
7. 99. Refused
8. How do you rate the “Documents registration and Licensing process” of the Municipality of your city?
1. Very Bad
2. Bad
3. Fair / Just Ok
4. Good
5. Very Good
6. 98. Do not Know
7. 99. Refused
9. How do you rate the “Drainage – removal of surface and sub-surface wastewater” services of the Municipality of your city.
1. Very Bad
2. Bad
3. Fair / Just Ok
4. Good
5. Very Good
6. 98. Do not Know
7. 99. Refused

57
INTEGRITY WATCH AFGHANISTAN
CITIZEN REPORT CARD ON MUNICIPAL SERVICES IN AFGHANISTAN 2017
10. How do you rate the “Sanitation” services of the Municipality in your city?
1. Very Bad
2. Bad
3. Fair / Just Ok
4. Good
5. Very Good
6. 98. Do not Know
7. 99. Refused
11. How do you rate the Municipality in “Construction of Roads, Streets, and Sidewalks”?
1. Very Bad
2. Bad
3. Fair / Just Ok
4. Good
5. Very Good
6. 98. Do not Know
7. 99. Refused
12. How do you rate the “Public Parks, Planting, and Green Spaces” services of the Municipality?
1. Very Bad
2. Bad
3. Fair / Just Ok
4. Good
5. Very Good
6. 98. Do not Know
7. 99. Refused
13. How do you rate the Municipality in providing “Car Parking” provisions in your city?
1. Very Bad
2. Bad
3. Fair / Just Ok
4. Good
5. Very Good
6. 98. Do not Know
7. 99. Refused
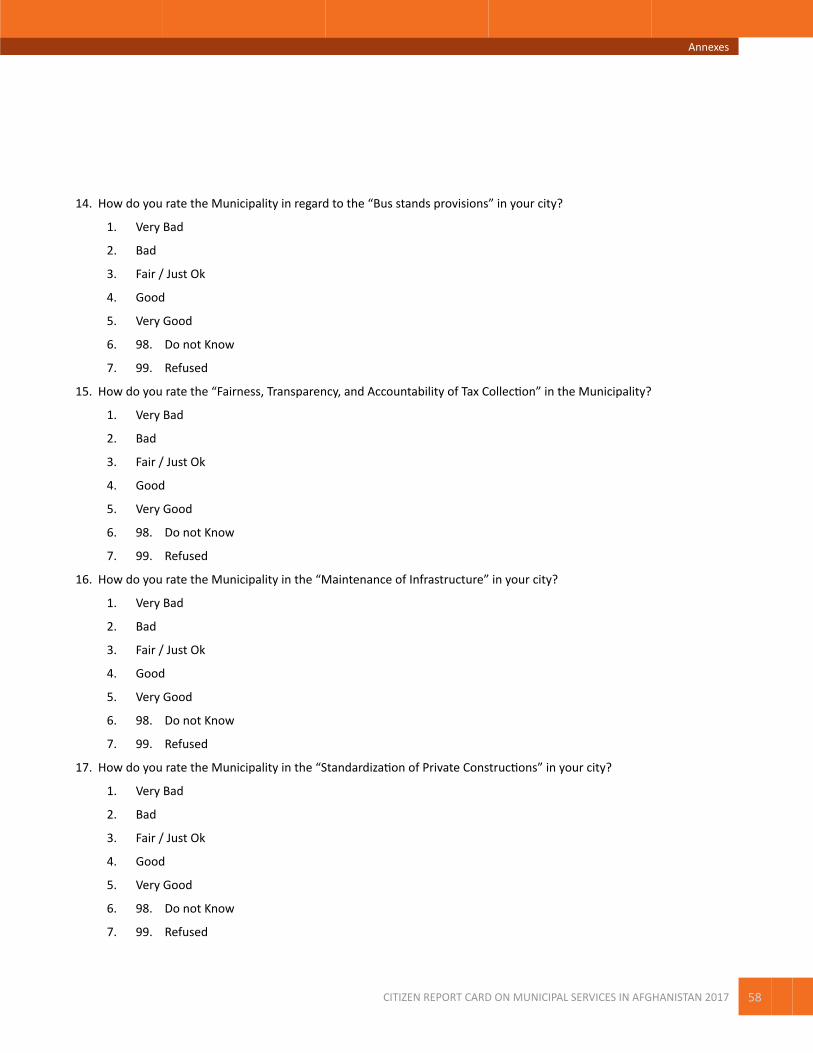
Annexes
CITIZEN REPORT CARD ON MUNICIPAL SERVICES IN AFGHANISTAN 2017 58
14. How do you rate the Municipality in regard to the “Bus stands provisions” in your city?
1. Very Bad
2. Bad
3. Fair / Just Ok
4. Good
5. Very Good
6. 98. Do not Know
7. 99. Refused
15. How do you rate the “Fairness, Transparency, and Accountability of Tax Collection” in the Municipality?
1. Very Bad
2. Bad
3. Fair / Just Ok
4. Good
5. Very Good
6. 98. Do not Know
7. 99. Refused
16. How do you rate the Municipality in the “Maintenance of Infrastructure” in your city?
1. Very Bad
2. Bad
3. Fair / Just Ok
4. Good
5. Very Good
6. 98. Do not Know
7. 99. Refused
17. How do you rate the Municipality in the “Standardization of Private Constructions” in your city?
1. Very Bad
2. Bad
3. Fair / Just Ok
4. Good
5. Very Good
6. 98. Do not Know
7. 99. Refused

59
INTEGRITY WATCH AFGHANISTAN
CITIZEN REPORT CARD ON MUNICIPAL SERVICES IN AFGHANISTAN 2017
18. How do you rate the “Public Cooperation with the Municipality in keeping the City Clean” in your City?
1. Very Bad
2. Bad
3. Fair / Just Ok
4. Good
5. Very Good
6. 98. Do not Know
7. 99. Refused
19. How is the “Public Access to Information – to the Municipality Services, Budget, Contracts, …) in the Municipality in your city?
1. Very Bad
2. Bad
3. Fair / Just Ok
4. Good
5. Very Good
6. 98. Do not Know
7. 99. Refused
20. How do you rate the “Public Participation in Municipal Planning and Decision Making Process” in the Municipality in your City?
1. Very Bad
2. Bad
3. Fair / Just Ok
4. Good
5. Very Good
6. 98. Do not Know
7. 99. Refused
21. How do you rate the Municipality in “Accountability to the Public” in your city?
1. Very Bad
2. Bad
3. Fair / Just Ok
4. Good
5. Very Good
6. 98. Do not Know
7. 99. Refused
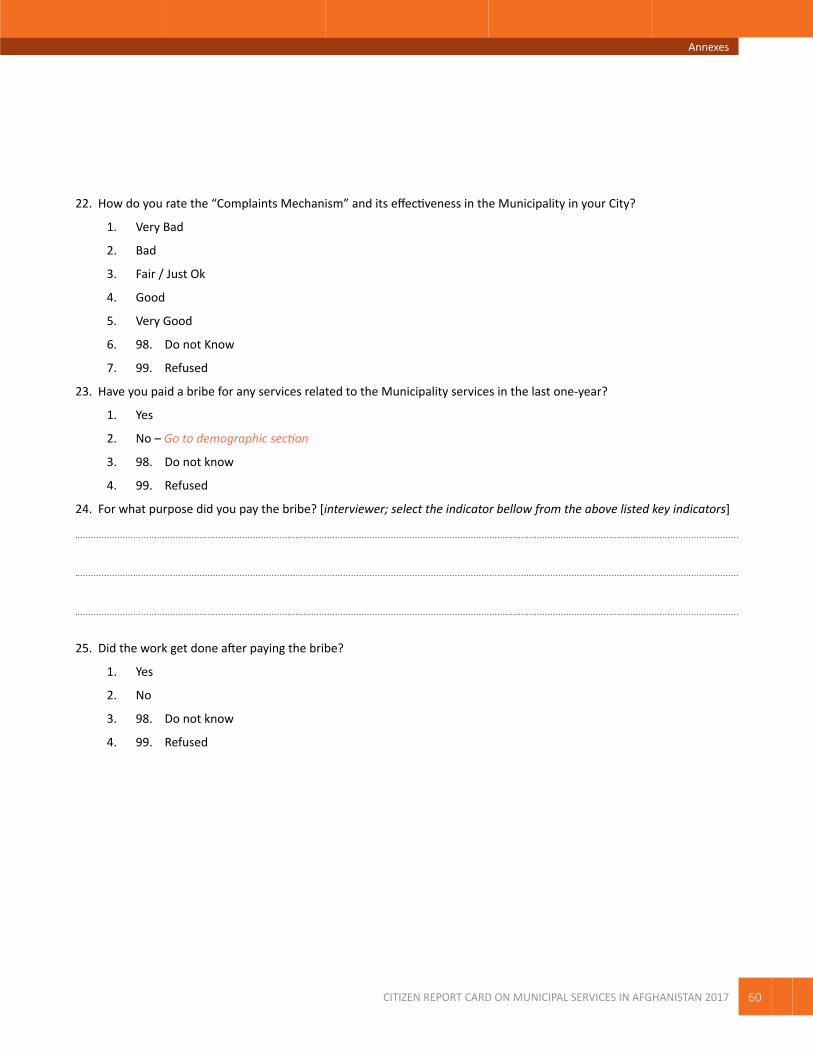
Annexes
CITIZEN REPORT CARD ON MUNICIPAL SERVICES IN AFGHANISTAN 2017 60
22. How do you rate the “Complaints Mechanism” and its effectiveness in the Municipality in your City?
1. Very Bad
2. Bad
3. Fair / Just Ok
4. Good
5. Very Good
6. 98. Do not Know
7. 99. Refused
23. Have you paid a bribe for any services related to the Municipality services in the last one-year?
1. Yes
2. No – Go to demographic section
3. 98. Do not know
4. 99. Refused
24. For what purpose did you pay the bribe? [interviewer; select the indicator bellow from the above listed key indicators]
25. Did the work get done after paying the bribe?
1. Yes
2. No
3. 98. Do not know
4. 99. Refused
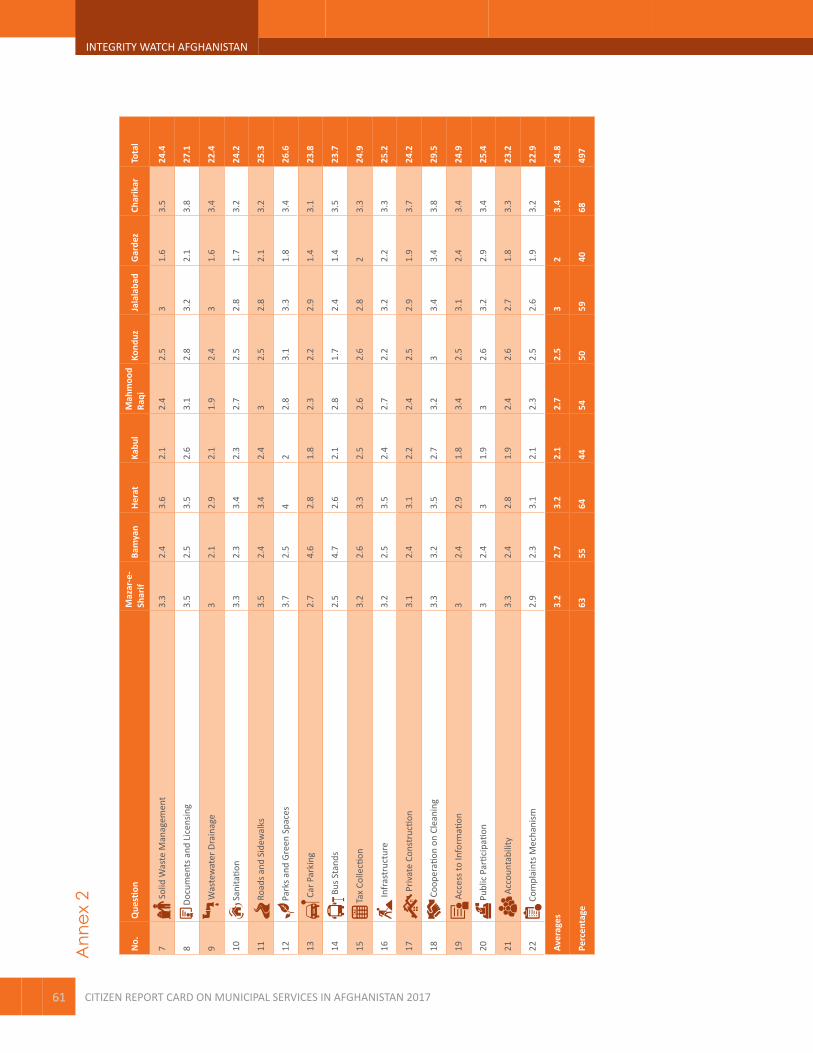
61
INTEGRITY WATCH AFGHANISTAN
CITIZEN REPORT CARD ON MUNICIPAL SERVICES IN AFGHANISTAN 2017
Ann
ex 2
No.
Que
stion
Maz
ar-e
-Sh
arif
Bamyan
Hera
tKa
bul
Mah
moo
d Ra
qiKo
nduz
Jala
laba
dG
arde
zCh
arik
arTo
tal
7 S
olid
Was
te M
anag
emen
t3.
32.
43.
62.
12.
42.
53
1.6
3.5
24.4
8 D
ocum
ents
and
Lic
ensin
g3.
52.
53.
52.
63.
12.
83.
22.
13.
827
.1
9 W
aste
wat
er D
rain
age
32.
12.
92.
11.
92.
43
1.6
3.4
22.4
10 S
anita
tion
3.3
2.3
3.4
2.3
2.7
2.5
2.8
1.7
3.2
24.2
11 R
oads
and
Sid
ewal
ks3.
52.
43.
42.
43
2.5
2.8
2.1
3.2
25.3
12 P
arks
and
Gre
en S
pace
s3.
72.
54
22.
83.
13.
31.
83.
426
.6
13 C
ar P
arki
ng2.
74.
62.
81.
82.
32.
22.
91.
43.
123
.8
14 B
us S
tand
s2.
54.
72.
62.
12.
81.
72.
41.
43.
523
.7
15 T
ax C
olle
ction
3.2
2.6
3.3
2.5
2.6
2.6
2.8
23.
324
.9
16 In
fras
truc
ture
3.2
2.5
3.5
2.4
2.7
2.2
3.2
2.2
3.3
25.2
17 P
rivat
e Co
nstr
uctio
n3.
12.
43.
12.
22.
42.
52.
91.
93.
724
.2
18 C
oope
ratio
n on
Cle
anin
g3.
33.
23.
52.
73.
23
3.4
3.4
3.8
29.5
19 A
cces
s to
Info
rmati
on3
2.4
2.9
1.8
3.4
2.5
3.1
2.4
3.4
24.9
20 P
ublic
Par
ticip
ation
32.
43
1.9
32.
63.
22.
93.
425
.4
21
Acc
ount
abili
ty
3.3
2.4
2.8
1.9
2.4
2.6
2.7
1.8
3.3
23.2
22 C
ompl
aint
s Mec
hani
sm2.
92.
33.
12.
12.
32.
52.
61.
93.
222
.9
Aver
ages
3.2
2.7
3.2
2.1
2.7
2.5
32
3.4
24.8
Percen
tage
6355
6444
5450
5940
6849
7

Perceptions of Key Services
CITIZEN REPORT CARD ON MUNICIPAL SERVICES IN AFGHANISTAN 2017 62
Solid
Was
te
Man
agem
ent
Docu
men
ts
and
Lice
nsin
g
Was
tew
ater
Dr
aina
geSa
nita
tion
Road
s and
Si
dew
alks
Park
s and
Gr
een
Spac
es
Car P
arki
ng
Bus S
tand
s
Tax
Colle
ction
Infr
astr
uctu
re
Priv
ate
Cons
truc
tion
Coop
erati
on
on C
lean
ing
Acce
ss to
In
form
ation
Publ
ic
Parti
cipa
tion
Acco
unta
bilit
y
Com
plai
nts
Mec
hani
sm
Avea
gePe
rcen
tage
Dist
rict 2
2.8
3.1
32.
73
2.7
2.3
2.9
3.2
2.7
2.4
3.6
2.6
2.6
2.6
2.6
2.8
56
Dist
rict 4
2.7
3.3
2.9
2.7
2.9
2.5
2.1
2.7
32.
53.
13.
42.
62.
72.
22.
32.
755
Dist
rict 1
13.
13.
62.
82.
53
2.8
2.3
33.
33
33.
52
2.1
1.8
2.2
2.8
55
Dist
rict 3
2.8
3.2
2.9
2.9
3.2
3.1
2.4
2.5
2.9
2.8
2.8
3.4
1.8
2.1
22.
32.
754
Dist
rict 1
33.
23.
22.
72.
63.
51.
81.
74
3.2
32.
63.
71.
61.
81.
92.
32.
754
Dist
rict 1
73
3.4
2.7
2.3
2.9
2.2
2.5
3.1
3.1
2.7
33.
61.
91.
92.
32.
22.
754
Dist
rict 5
2.2
32.
62.
13.
22.
91.
82.
52.
92.
82
3.2
1.7
2.2
2.1
22.
549
Dist
rict 9
2.3
3.2
22.
32.
52.
52.
62.
43.
12.
72.
73.
41.
71.
81.
91.
92.
449
Dist
rict 1
2.9
3.1
2.3
2.6
32.
52
22.
52.
42.
13
1.9
1.9
1.9
2.2
2.4
48
Dist
rict 6
2.6
32.
42.
32.
52.
41.
92.
42.
52.
42.
13.
22.
32.
22.
32
2.4
48
Dist
rict 7
2.4
2.9
2.5
2.3
2.9
2.3
1.8
2.8
2.8
2.7
2.2
3.3
1.8
22
22.
448
Dist
rict 8
2.2
32.
22.
52.
92.
81.
62.
42.
82.
72.
13
1.9
2.2
1.9
2.3
2.4
48
Dist
rict 1
53.
22.
92
2.4
2.5
1.9
2.1
2.3
2.9
2.6
2.5
3.7
1.6
21.
71.
92.
448
Dist
rict 1
02.
42.
92
2.4
2.6
2.4
1.7
1.7
2.7
2.3
2.1
3.1
22.
32
2.2
2.3
46
Dist
rict 1
62.
33
1.9
2.2
2.4
21.
92.
12.
72.
12.
33.
21.
92
22.
32.
345
Dist
rict 1
41.
62.
31.
82.
82.
12.
91.
51.
82.
32.
52.
13
1.9
1.9
1.8
2.1
2.2
43
Dist
rict 1
21.
92.
71.
92.
42.
12.
21.
71.
82.
52.
11.
93
1.5
1.8
1.7
2.1
2.1
42
Dist
rict 1
91.
92.
71.
72.
41.
71.
61.
51.
82.
72.
12.
73.
51.
41.
61.
81.
72
41
Dist
rict 2
11.
82.
71.
62.
41.
61.
21.
51.
72.
62
3.1
3.4
1.3
1.7
1.8
1.7
240
Dist
rict 2
21.
41.
91.
32.
11.
72.
21.
41.
72.
11.
72
2.6
1.7
1.6
1.5
1.8
1.8
36
Dist
rict 8
1.1
2.2
1.2
1.9
1.8
1.5
1.1
1.6
2.2
1.8
22.
61.
71.
71.
41.
81.
735
Aver
age
2.4
2.9
2.2
2.4
2.6
2.3
1.9
2.3
2.8
2.5
2.4
3.3
1.8
2.0
1.9
2.1
2.4
47

Kolola Poshta, Kabul, Afghanistan
+93 (0) 780 942 942 [email protected] www.iwaweb.org
@IntegrityWatchA
fb.me/iwaweb.org /IntegrityWatchAfghanistan /IntegrityWatchAfghanistan /IWACorruption