Citigroup Australia and New Zealand Investment Conference · Citigroup Australia and New Zealand...
16
Citigroup Australia and New Zealand Investment Conference March 2004 David Clarke Chief Executive Officer BT Financial Group
-
Upload
hoangthien -
Category
Documents
-
view
217 -
download
1
Transcript of Citigroup Australia and New Zealand Investment Conference · Citigroup Australia and New Zealand...
Citigroup Australia and New Zealand Investment Conference
March 2004
David Clarke Chief Executive Officer BT Financial Group
Citigroup Aust & NZ Investment Conference – Mar 20042
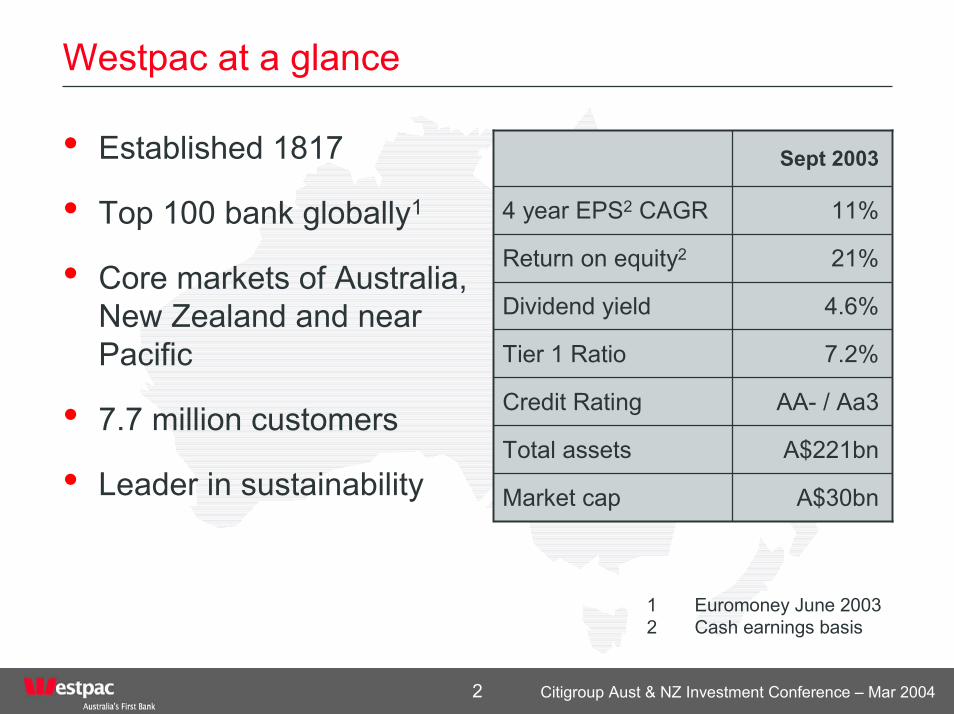
Westpac at a glance
• Established 1817
• Top 100 bank globally1
• Core markets of Australia, New Zealand and near Pacific
• 7.7 million customers
• Leader in sustainabilityA$221bnTotal assets
AA- / Aa3Credit Rating
7.2%Tier 1 Ratio
A$30bnMarket cap
4.6%Dividend yield
21%Return on equity2
11%4 year EPS2 CAGR
Sept 2003
1 Euromoney June 20032 Cash earnings basis

Citigroup Aust & NZ Investment Conference – Mar 20043
Driving the gap between revenue and expenses
500
1,000
1,500
2,000
2,500
3,000
3,500
4,000
1H99
2H99
1H00
2H00
1H01
2H01
1H02
2H02
1H03
2H03
Revenue 7.5%
Expenses 3.5%
Core earnings 12.5%
$m
1. Underlying basis (excl. significant items)2. Excluding goodwill
4 Year CAGR1
2
Citigroup Aust & NZ Investment Conference – Mar 20044
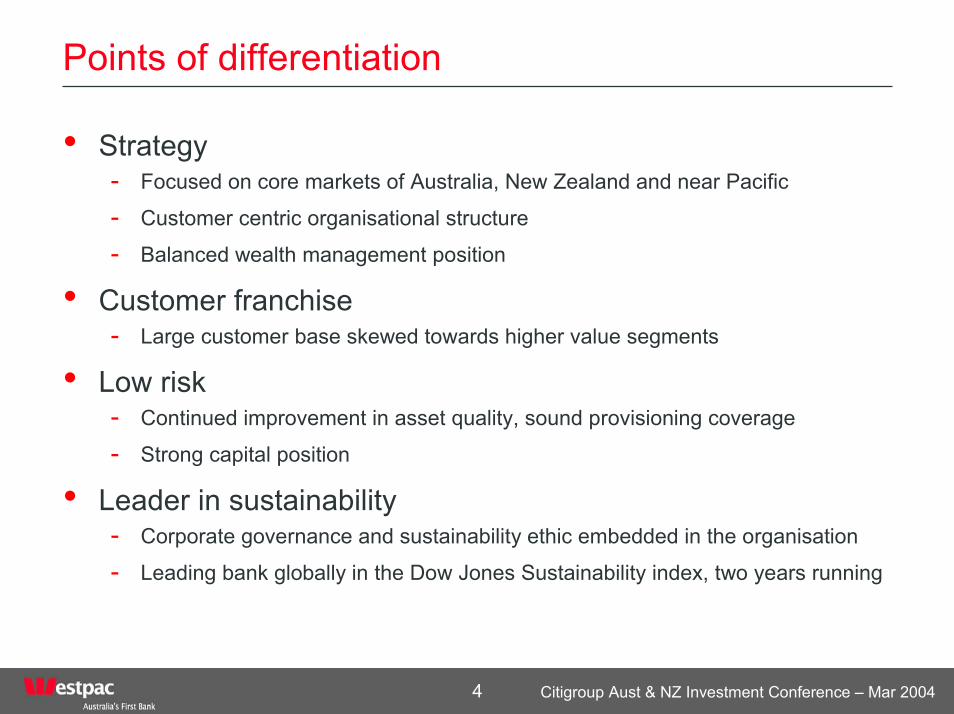
Points of differentiation
• Strategy- Focused on core markets of Australia, New Zealand and near Pacific
- Customer centric organisational structure
- Balanced wealth management position
• Customer franchise- Large customer base skewed towards higher value segments
• Low risk- Continued improvement in asset quality, sound provisioning coverage
- Strong capital position
• Leader in sustainability- Corporate governance and sustainability ethic embedded in the organisation
- Leading bank globally in the Dow Jones Sustainability index, two years running

Citigroup Aust & NZ Investment Conference – Mar 20045
BT Financial Group
• Investment consistent with the size of the wealth management opportunity
• Modern wealth management operation- Funds management- Life insurance and risk- Wrap and corporate
superannuation- Margin lending- Broking
• Only large bank with a major Wrap capability
$190mCash earnings
$251mIn force premiums
$13bnAssets under admin
$43bnFunds under mgt
Sept 2003
Funds Mgt61%
Life Insurance &
Risk35%
Other4%
Composition of cash earnings 2003
Citigroup Aust & NZ Investment Conference – Mar 20046
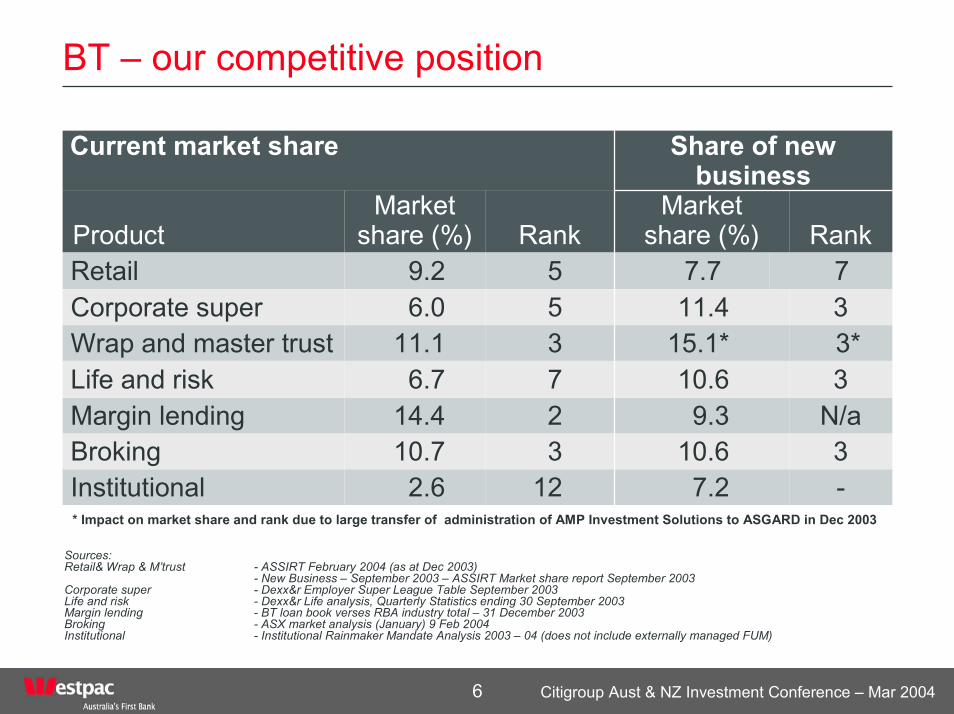
BT – our competitive position
7
-7.2122.6Institutional310.6310.7Broking
7.759.2Retail
N/a9.3214.4Margin lending310.676.7Life and risk3*15.1*311.1Wrap and master trust311.456.0Corporate super
RankMarket
share (%)RankMarket
share (%)Product
Share of new business
Current market share
* Impact on market share and rank due to large transfer of administration of AMP Investment Solutions to ASGARD in Dec 2003
Sources: Retail& Wrap & M’trust - ASSIRT February 2004 (as at Dec 2003)
- New Business – September 2003 – ASSIRT Market share report September 2003Corporate super - Dexx&r Employer Super League Table September 2003Life and risk - Dexx&r Life analysis, Quarterly Statistics ending 30 September 2003Margin lending - BT loan book verses RBA industry total – 31 December 2003Broking - ASX market analysis (January) 9 Feb 2004Institutional - Institutional Rainmaker Mandate Analysis 2003 – 04 (does not include externally managed FUM)

Citigroup Aust & NZ Investment Conference – Mar 20047
Meeting the challenges
• Integration
• Investment management performance
• Retail outflows
• Leveraging distribution
• Maintain momentum in core businesses

Citigroup Aust & NZ Investment Conference – Mar 20048
Integration – nearing completion
• Insulated core business from integration task
• Dedicated project management resource
• Resolved key people, roles and location issues quickly
• Synergies ahead of plan – over 85% of 2004 synergies locked-in
Integration progress
Jul-0
2
Oct
-02
Jan-
03
May
-03
Aug-
03
Nov
-03
Mar
-04
Jun-
04
Sep-
04
Dec
-04
People & Location
Systems
Customer Contact
Investment Management
Registry consolidation & selected back office insourcing
Customer MIS
Complete
In progress

Citigroup Aust & NZ Investment Conference – Mar 20049
Fund performance and outflows
• New team in place quickly
• Strict adherence to investment management disciplines with a focus on risk
• Built transparency and accountability into process
• Active communication with research houses

Citigroup Aust & NZ Investment Conference – Mar 200410
The benefits are now appearing in results
-2.5%
-2.0%
-1.5%
-1.0%
-0.5%
0.0%
0.5%
1.0%
1.5%
May-02
Jul-0
2Sep
-02Nov
-02Ja
n-03
Mar-03
May-03
Jul-0
3Sep
-03Nov
-03Ja
n-03
-8%
-6%
-4%
-2%
0%
2%
4%
6%
Monthly excess return(LHS)
One year excess return (RHS)
Excess investment returns Australian equities
(1,642)
(718)
(336)
26185
(2,500)
(2,000)
(1,500)
(1,000)
(500)
0
500
Dec 0
2
Mar
03
Jun
03
Sep 0
3
Dec 0
3
$m
Quarterly retail funds flows

Citigroup Aust & NZ Investment Conference – Mar 200411
Leveraging the Westpac customer base
• Sub-optimal cross sell
• Under resourced internal financial planner and advice (FP&A) network
- Internal review underway
• Corporate super already achieving significant wins
Citigroup Aust & NZ Investment Conference – Mar 200412
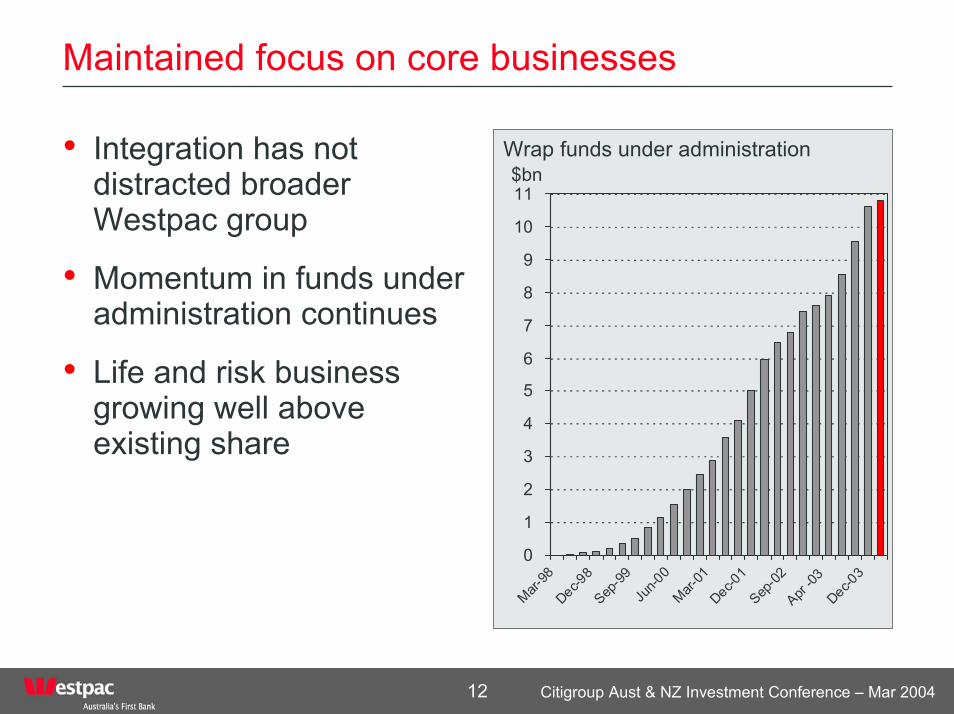
Maintained focus on core businesses
• Integration has not distracted broader Westpac group
• Momentum in funds under administration continues
• Life and risk business growing well above existing share
0
1
2
3
4
5
6
7
8
9
10
11
Mar-98
Dec-98
Sep-99
Jun-0
0Mar-
01Dec-0
1Sep
-02 A
pr -03
Dec-03
Wrap funds under administration$bn
Citigroup Aust & NZ Investment Conference – Mar 200413
The strategy going forward
• Complete integration
• Maintain investment management disciplines
• Increase focus on customer responsiveness
• Fully leverage the Westpac group planners

Citigroup Aust & NZ Investment Conference – Mar 200414
Credit growth
-8
-4
0
4
8
12
16
20
24
Jan-90 Jan-92 Jan-94 Jan-96 Jan-98 Jan-00 Jan-02 Jan-04
%
-8
-4
0
4
8
12
16
20
24
Housing Business Total Total period average
Forecasts
Australian Credit Growth
Source: RBA

Citigroup Aust & NZ Investment Conference – Mar 200415
Westpac’s on track
• BT Financial Group- Business in excellent shape - Integration on track, with higher synergies - Tapping power of the Westpac customer base
• Economic environment remains favourable
• Housing market beginning to soften
• Outlook for Westpac remains positive
Citigroup Aust & NZ Investment Conference – Mar 200416
Disclaimer
The material contained in this presentation is intended to be general background information on Westpac Banking Corporation and its activities as at 9 March 2004.
The information is supplied in summary form and is therefore not necessarily complete. Also, it is not intended that it be relied upon as advice to investors or potential investors, who should consider seeking independent professional advice depending upon their specific investment objectives, financial situation or particular needs.