Cisco Diagnostic Bridge Getting Started · PDF fileMy Diagnostics API ... • Windows 7 and...
42
Cisco Diagnostic Bridge Installation and User Guide Version 1.6 March 14, 2018 Americas Headquarters Cisco Systems, Inc. 170 West Tasman Drive San Jose, CA 95134-1706 http://www.cisco.com Tel: 408 526-4000 800 553-NETS(6387) Fax: 408 527-0883
Transcript of Cisco Diagnostic Bridge Getting Started · PDF fileMy Diagnostics API ... • Windows 7 and...

Cisco Diagnostic Bridge Installation and User Guide
Version 1.6
March 14, 2018
Americas Headquarters Cisco Systems, Inc. 170 West Tasman Drive San Jose, CA 95134-1706 http://www.cisco.com Tel: 408 526-4000 800 553-NETS(6387) Fax: 408 527-0883

CCDE, CCENT, CCSI, Cisco Eos, Cisco Explorer, Cisco HealthPresence, Cisco IronPort, the Cisco logo, Cisco Nurse Connect, Cisco Pulse, Cisco SensorBase, Cisco StackPower, Cisco StadiumVision, Cisco TelePresence, Cisco TrustSec, Cisco Unified Computing System, Cisco WebEx, DCE, Flip Channels, Flip for Good, Flip Mino, Flipshare (Design), Flip Ultra, Flip Video, Flip Video (Design), Instant Broadband, and Welcome to the Human Network are trademarks; Changing the Way We Work, Live, Play, and Learn, Cisco Capital, Cisco Capital (Design), Cisco:Financed (Stylized), Cisco Store, Flip Gift Card, and One Million Acts of Green are service marks; and Access Registrar, Aironet, AllTouch, AsyncOS, Bringing the Meeting To You, Catalyst, CCDA, CCDP, CCIE, CCIP, CCNA, CCNP, CCSP, CCVP, Cisco, the Cisco Certified Internetwork Expert logo, Cisco IOS, Cisco Lumin, Cisco Nexus, Cisco Press, Cisco Systems, Cisco Systems Capital, the Cisco Systems logo, Cisco Unity, Collaboration Without Limitation, Continuum, EtherFast, EtherSwitch, Event Center, Explorer, Follow Me Browsing, GainMaker, iLYNX, IOS, iPhone, IronPort, the IronPort logo, Laser Link, LightStream, Linksys, MeetingPlace, MeetingPlace Chime Sound, MGX, Networkers, Networking Academy, PCNow, PIX, PowerKEY, PowerPanels, PowerTV, PowerTV (Design), PowerVu, Prisma, ProConnect, ROSA, SenderBase, SMARTnet, Spectrum Expert, StackWise, WebEx, and the WebEx logo are registered trademarks of Cisco and/or its affiliates in the United States and certain other countries.
All other trademarks mentioned in this document or website are the property of their respective owners. The use of the word partner does not imply a partnership relationship between Cisco and any other company. (1002R)
Any Internet Protocol (IP) addresses and phone numbers used in this document are not intended to be actual addresses and phone numbers. Any examples, command display output, network topology diagrams, and other figures included in the document are shown for illustrative purposes only. Any use of actual IP addresses or phone numbers in illustrative content is unintentional and coincidental.
© 2018 Cisco Systems, Inc. All rights reserved.

i
Table of Contents
About the Cisco Diagnostic Bridge ............................................................................................................................... 1
Supported Technologies ............................................................................................................................................ 1
Supported Browsers ................................................................................................................................................... 2
Connected TAC ......................................................................................................................................................... 2
Service Levels............................................................................................................................................................ 2
Installation ..................................................................................................................................................................... 3 Customer Responsibility ............................................................................................................................................ 3
Verify Prerequisites ................................................................................................................................................... 3
OVA Installation ........................................................................................................................................................ 3
Download the OVA File ........................................................................................................................................ 4
Install the OVA ...................................................................................................................................................... 4
MSI Installation ......................................................................................................................................................... 9 Post Installation Setup ............................................................................................................................................. 11
Configure a Security Certificate .......................................................................................................................... 11
Verify JSON Files ............................................................................................................................................... 11
Configure Outbound Connections ....................................................................................................................... 12
Upgrade Diagnostic Bridge ................................................................................................................................. 12 Configure Application Settings ................................................................................................................................... 14
Diagnostic Bridge .................................................................................................................................................... 14
Notification Profiles ................................................................................................................................................ 15
SMTP Mail Sender .............................................................................................................................................. 16
ServiceNow Event ............................................................................................................................................... 17
Data Sources ............................................................................................................................................................ 17 Cisco CSP Collector ............................................................................................................................................ 18
Cisco Prime Infrastructure (PI) ............................................................................................................................ 19
General External Source ...................................................................................................................................... 20
Service Now ........................................................................................................................................................ 20
WhatsUp Gold Group .......................................................................................................................................... 21
Scan Schedule .......................................................................................................................................................... 22 Manual Device Defaults .......................................................................................................................................... 22
Users ........................................................................................................................................................................ 22
Features........................................................................................................................................................................ 24
Home Page ............................................................................................................................................................... 24
Devices Page............................................................................................................................................................ 25

ii
Device Details.......................................................................................................................................................... 27
Add Devices Manually ............................................................................................................................................ 28
Import Devices ........................................................................................................................................................ 28
Export Devices ........................................................................................................................................................ 29 Scan Devices Manually ........................................................................................................................................... 29
Enable Scheduled Scan for Devices ........................................................................................................................ 29
Events Page ............................................................................................................................................................. 30
View Event History ............................................................................................................................................. 31
Investigate Devices .................................................................................................................................................. 31
Work Items .............................................................................................................................................................. 33 View Notifications ................................................................................................................................................... 33
View Reports ........................................................................................................................................................... 34
CSPC Add-On for Cisco Diagnostic Bridge ................................................................................................................ 35
Code Installation ...................................................................................................................................................... 35
Troubleshooting ........................................................................................................................................................... 38
Network Connectivity from the Diagnostic Bridge ................................................................................................. 38 My Diagnostics API ................................................................................................................................................ 38

About the Cisco Diagnostic Bridge Cisco Diagnostic Bridge Installation and User Guide
1
About the Cisco Diagnostic Bridge The Cisco Diagnostic Bridge is software that can be installed in the customer network to provide device-level diagnostics of the network. It provides periodic automated scanning and problem detection for multiple network devices at the same time.
The bridge leverages digitized Intellectual Capital from Cisco’s Technical Assistance Center (TAC) to provide device analysis. Cisco technical experts are constantly developing, expanding and refreshing the library of intellectual capital based on thousands of customer cases they help resolve every day.
The Cisco Diagnostic Bridge helps to:
• Prevent the impact of device issues on network availability, performance and security
• Reduce the time spent on troubleshooting the devices
• Improve overall efficiency of the customer Network Operations Center (NOC)
This is achieved using three main steps:
1. Integrate with a specific set of network monitoring and management tools to learn about and connect to the network devices in order to run diagnostics.
2. Run periodic automated diagnostics on these devices and correlate the results with digitized Cisco Intellectual Capital, to identify device issues and recommended remediation.
3. Return diagnostic results and recommended remediation to customers via the My Diagnostics user interface or through infusion of these results directly into the customer’s existing Incident Management System via API.
Features include:
• Device Diagnostics: Utilizes Cisco TAC knowledge to analyze and detect device activities on the network.
• Data Sources: Allows the Diagnostic Bridge to integrate with multiple network management systems (NMS). You can add devices from these data sources.
• Scan Schedule: Allows you to schedule a scan on the devices daily or weekly.
• Notification Profiles: Allows you to configure notifications from the Diagnostic Bridge that are communicated outward to an existing ticketing system or email. You can add and manage notification profiles.
Note: You must have a valid Cisco.com account in order to use the Cisco Diagnostic Bridge Interface. If you do not have a valid Cisco.com account, you must register on the Cisco.com Registration page and associate a Service Contract to your Cisco.com profile.
Cisco will provide customers with specific instructions for on-boarding via email after you have signed-up.
Supported Technologies The Cisco Diagnostic Bridge supports the following technologies:
Scanning Devices (All Service Levels)
• ASA
• IOS
• IOS-XE
• IOS-XR
• NX-OS
• Wireless LAN Controller

About the Cisco Diagnostic Bridge Cisco Diagnostic Bridge Installation and User Guide
2
Opening Investigations (Premium Service Level)
• ACI
• CUCM
• UCCE
• UCS
Supported Browsers Supported browsers include:
• Google Chrome
• Mozilla Firefox
• Apple Safari
Connected TAC Connected TAC allows customers to leverage digitized Intellectual Capital and expertise from the Cisco Technical Assistance Center (TAC). It enables:
• Automated and proactive problem detection
• Faster resolution through remediation recommendations for the identified problems
• The infusion of diagnostic results directly into the most commonly used incident management systems
• Assistance from TAC to manage and resolve issues that are proactively identified and support new technologies
The Market Trial Components include:
• CLI Analyzer - Device Diagnostics based on digitized Intellectual Capital from Cisco TAC. Use your CCO credentials to login
• TAC Advisor - TAC engineer led device analysis
• Cisco Diagnostic Bridge - Automated device diagnostics for multiple devices in a network
• My Diagnostic User Interface - Provides the visualization of device history, events and configuration of Cisco Diagnostic Bridge
Service Levels The availability of some features of My Diagnostics depends on the service level of your contract. A summary of the service levels is provided below. For a full description of each service level, refer to:
http://www.cisco.com/c/dam/en/us/support/docs/services/connected-tac/Service_Description_connectedTAC.pdf
• Basic: Permits Diagnostic Bridge device scans one time per day for as many as 20 devices.
• Enhanced: Unlimited Diagnostic Bridge device scans.
• TAC Advisor Level 1: Optional add-on to Enhanced service level; provides 12 diagnostic analyses by a TAC advisor per year.
• Premium: Up to 24 TAC advisor engagements per year; provides a quarterly session with a Cisco engineer for analysis of up to 24 devices.
• TAC Advisor Level 2: Optional add-on to Premium service level; provides six one-hour sessions per year with a senior technical engineer.
Installation Cisco Diagnostic Bridge Installation and User Guide
3
Installation Cisco Diagnostic Bridge Installation includes:
• Open Virtual Appliance (OVA) Installation for Linux/VMWare
• MSI Installation for Microsoft Servers
Customer Responsibility NOTE: If Customer elects to host the Diagnostic Bridge database external to where the Diagnostic Bridge software is installed, Customer may be exposed to increased security risk if such database is not properly secured. Customer is responsible for the security of the Diagnostic Bridge and associated databases.
Verify Prerequisites OVA Requirements:
• Linux OVA running on VMware ESXi 5.0 or later that provides 2 CPU, 8GB RAM and 50 GB HDD
Windows Requirements:
• Microsoft Windows 7 and higher
• MySQL 5.7 or Microsoft SQL Server
• Microsoft .NET Core 1.1.6 Runtime (or a later version of the 1.1.x branch)
Network Requirements:
• By default, the Diagnostic Bridge listens on port 5001. It is mandatory to configure any firewall software to allow access to this port.
• In order to establish an outbound connection for Device Analyzer, your firewall must allow a TCP connection on port 443 to these sites:
o api.cisco.com,
o cway.cisco.com
o cloudsso.cisco.com
o cloudsso2.cisco.com
Note: If you intend to use WhatsUp Gold as a Data Source for the Cisco Diagnostic Bridge, the bridge and WhatsUp Gold must be installed on the same machine. Cisco Diagnostic Bridge supports WUG 2016 and 2017.
OVA Installation An Open Virtual Appliance (OVA) is a prebuilt software solution that comprises one or more virtual machines (VMs) that are packaged, maintained, updated, and managed as a single unit. The Cisco OVA has a preinstalled operating system (CentOS Linux) and includes application functionality that is necessary for Cisco Diagnostic Bridge. This OVA may be deployed on a VMWare client infrastructure.
This OVA includes:
– CentOS Linux release 7.3.1611 (Core). Special curl package is compliant with OpenSSL.
– MySQL 15.1 (10.0.33 MariaDB Distribution)
– Microsoft .NET Core 1.1.6 Runtime

Installation Cisco Diagnostic Bridge Installation and User Guide
4
Download the OVA File The first step to install the OVA is to download the latest version of the OVA file. You will point to that file on your computer when you deploy the OVF template.
In order to download the file, perform these steps:
1. Open this site in an internet browser: https://upload.cisco.com/cgi-bin/swc/fileexg/main.cgi?CONTYPES=Cisco_Diagnostic_Bridge
2. Locate the OVA Installer and click the Download button.
3. Save the file to your computer in a place that will be easy to find when you start to deploy the OVF template.
Install the OVA After you download the Open Virtual Appliance file, deploy the OVF template from the vCenter Client application.
Note: After installation is complete you must change the password and IP address in order to meet your requirements. The default credentials are: root/Cisco123, admin/Cisco123.
1. Launch your vCenter client application on your computer.
2. Connect to the vCenter Server with your vCenter user credentials.
3. Choose File > Deploy OVF Template in order to open the Deploy OVF Template window.
4. Choose the Source location:
a. Click Browse, locate the OVA file that you downloaded to your computer, and click Next.
b. Optionally, you can rename the VM to be deployed.

Installation Cisco Diagnostic Bridge Installation and User Guide
5
5. Select the host / datastore on which you will deploy the OVF template.
6. Select the disk format according to your setup requirements, such as Thin Provision (1.4 GB) or Thick Provision (50 GB).
7. If the selected host offers multiple networking adapters, you may be prompted to select your desired Network Mapping.
8. Refer to this figure for deployment settings:
9. After deployment is successful, this window appears:
10. After you have deployed the OVA file, use the VM client console in order to further provision the
Diagnostic Bridge VM:
– login: root
– Password: Cisco123
11. You will be prompted to change the password. (This is mandatory).
12. By default, the OVA runs on English/US settings. In order to change the language settings, use the localectl command:
Example: #localectl set-locale LANG=en_US.UTF-8

Installation Cisco Diagnostic Bridge Installation and User Guide
6
#localectl set-keymap us
13. Ensure that time settings and synchronization are accurate. The Network Time Protocol (NTP) service runs on the Diagnostic Bridge. NTP server settings are stored in the file /etc/chrony.conf. In order to modify the file, you must have root access and an editor tool such as vi or nano.
An example of NTP server configuration in the chrony.conf file follows: # Use public servers from the pool.ntp.org project. # Please consider joining the pool (http://www.pool.ntp.org/join.html). server cisco-ntp-1.cisco.com iburst # server 0.centos.pool.ntp.org iburst # server 1.centos.pool.ntp.org iburst # server 2.centos.pool.ntp.org iburst # server 3.centos.pool.ntp.org iburst
After you modify the file, you must restart the NTP service. Enter these commands in order to stop, start, and check the status of the service: systemctl stop chronyd systemctl start chronyd systemctl status chronyd
Enter these commands in order to verify that NTP server settings are correct: timedatectl chronyc sources –v
14. If necessary, modify the IP address and default gateway. There are two ways to do so:
a. Enter these commands:
nmcli c mod ens32 ipv4.address 192.168.1.2/24 ipv4.gateway 192.168.1.1
nmcli c down ens32
nmcli c up ens32
b. Use the NetworkManager TUI. In order to open the NetworkManager TUI, enter the command:
nmtui
The NetworkManager TUI window appears:
c. Select ‘Edit Connection’ and select the shown Ethernet interface (ens32):

Installation Cisco Diagnostic Bridge Installation and User Guide
7
d. Enter the desired IP address, network Gateway, DNS Server and Search Domain (example:
mycompany.com).
e. Click OK in order to continue.
15. Restart the Network Card in order to apply the changes.
systemctl restart network.service
16. Enter these commands in order to verify network connectivity:
route –n {only one default gateway}
ifconfig {your ip address}
ping {ping api.cisco.com} (If this fails check refer to Troubleshooting)
17. In order to start, stop, restart and verify the Diagnostic Bridge, enter these commands from the VM Client Console:
systemctl start rc-local
systemctl stop rc-local
systemctl restart rc-local
systemctl status rc-local

Installation Cisco Diagnostic Bridge Installation and User Guide
8
18. In order to verify the Diagnostic Bridge is running, enter this command:
ps -ef | grep dotnet
Note: Ensure that you configure the timezone and set up the date on your system before you access My Diagnostics.
19. In order to change the Diagnostic Bridge timezone settings, dependent upon the VM host settings, perform these steps:
a. Log in as admin and change to root.
b. In order to verify the settings, enter the command timedatectl.
c. In order to change the time and date, enter the commands timedatectl set-time and timedatectl set-timezone respectively. Refer to this example: timedatectl set-time "2017-04-28 06:00:00" timedatectl set-timezone America/New_York
d. In order to view the syntax for timezone, enter the command timedatectl list-timezones
Note: When you access the Diagnostic Bridge for the first time, you must accept the certificate for secured connection between the Diagnostic Bridge and the My Diagnostic Interface. In order to replace the certificate, refer to Configuring Self-Signed Certificate. The Diagnostic Bridge does not have direct communication to Cisco’s My Diagnostic Interface. It needs a web browser on the client PC in order to manage the Diagnostic Bridge. All the communication to port 5001 goes through the client PC that connects to My Diagnostics.
20. You can now add and analyze the devices. In order to configure settings, refer to Configure Application Settings.
Installation Cisco Diagnostic Bridge Installation and User Guide
9
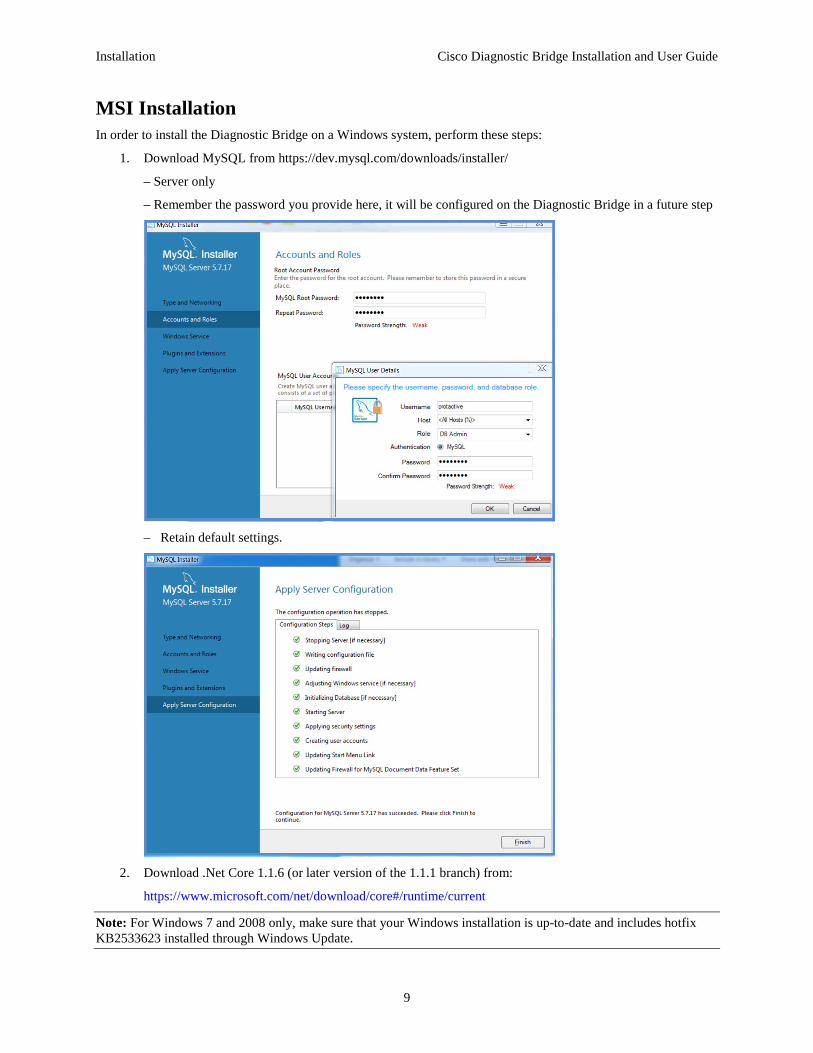
MSI Installation In order to install the Diagnostic Bridge on a Windows system, perform these steps:
1. Download MySQL from https://dev.mysql.com/downloads/installer/
– Server only
– Remember the password you provide here, it will be configured on the Diagnostic Bridge in a future step
– Retain default settings.
2. Download .Net Core 1.1.6 (or later version of the 1.1.1 branch) from:
https://www.microsoft.com/net/download/core#/runtime/current
Note: For Windows 7 and 2008 only, make sure that your Windows installation is up-to-date and includes hotfix KB2533623 installed through Windows Update.

Installation Cisco Diagnostic Bridge Installation and User Guide
10
3. Add this path in Windows for C:/Program Files/dotnet:
run : Advanced System Settings > Advanced > Environment Variables > Path > Edit : C:\Program Files\dotnet > OK
4. Download the latest MSI installer of the diagnostic bridge. Start the setup and follow the instructions on the wizard screens.
a. Click Next in order to continue past the Welcome screen.
b. Optionally, change the destination folder. Click Next in order to continue.
c. Select whether to use HTTP or HTTPS, enter the required information, and click Next.
d. Review the database settings. Change the user id and password in the connection string as required to match your SQL DB settings. Click Next in order to continue.
e. Click Install in order to start the installation. Wait for the installation process to complete.
f. Click Finish in order to close the installation wizard.
5. After successful installation, the Cisco Diagnostic Bridge starts as a Windows service.
– Link: https://<your IP address>:5001/home
Note: The MSI installation prompts you to enter port number and user credentials. It is recommended to change the default credentials. You can use the link (https://<your IP address>:5001/home) for debugging purposes.
6. Verify that the json files are present after installation is complete. Refer to
7. Verify JSON Files.
8. In order to access and configure the My Diagnostic Bridge Interface with a browser, go to https://cway.cisco.com/mydiagnostics.
Note: When you access the Diagnostic Bridge for the first time, you must accept the certificate for secured connection between the Diagnostic Bridge and the My Diagnostic Interface. In order to replace the certificate, refer to Configure a Security Certificate. The Diagnostic Bridge does not have direct communication to Cisco’s My Diagnostic Interface. It requires a web browser on the client PC in order to manage the Diagnostic Bridge. All communication to port 5001 goes through the host connected to My Diagnostics.

Installation Cisco Diagnostic Bridge Installation and User Guide
11
You can now add and analyze the devices. In order to configure settings, refer to Configure Application Settings.
Post Installation Setup
Configure a Security Certificate After the installation is complete, a TestCertificate is installed automatically in the following folder:
• OVA Installation: /DiagnosticBridge/etc
• MSI Installation: C:\Program Files (x86)\Cisco\DiagnosticBridge\etc
This test certificate allows you to connect to the Diagnostic Bridge using HTTPS, but endpoints will view the connection as untrusted unless you explicitly accept this test certificate as a trusted certificate.
You should replace this certificate with an official certificate from a trusted certificate signing authority.
Follow these steps in order to add an officially signed certificate:
1. Edit the file static-settings.json so that it points to the new certificate.
OVA Installation: /DiagnosticBridge/etc/static-settings.json
MSI Installation: C:\Program Files (x86)\Cisco\DiagnosticBridge\etc\static-settings.json
2. Restart the Diagnostic Bridge service
OVA Installation: service rc-local restart
MSI Installation: Restart the service Cisco Diagnostic Bridge in Windows Services manager.
If you choose to continue using the test certificate, or choose to install your own Self-Signed certificate, follow these steps in order to trust it from the browser:
1. Open a web connection to your Diagnostic Bridge (https://<your IP address>:5001).
2. If a security certificate error message appears in the browser, accept the message and continue.
• Chrome: Click Advanced and then click the link to proceed to the URL of your Diagnostic Bridge.
• Firefox: Click the Advanced button and then click Add Exception.
3. Refresh the My Diagnostics web page in order to confirm that the security certificate error is resolved.
You can now access My Diagnostics Interface (https://cway.cisco.com/mydiagnostics) with the officially signed or self-signed certificate.
Note: If you use a self-signed certificate, you must accept the certificate before the Cisco MyDiagnostics UI will be allowed to communicate with your bridge. If the installed certificate is signed by an approved Internet Certificate Assigning Authority, the browser will automatically trust the communication from Cisco MyDiagnostics UI to the bridge. You can also use the Diagnostic Bridge URL (https://<your IP address>:5001/home) for debugging purposes.
Verify JSON Files After the installation is complete, several json files are available for advanced configuration:
OVA Installation: /DiagnosticBridge/etc/
MSI Installation: C:\Program Files (x86)\Cisco\DiagnosticBridge\etc\
Installation Cisco Diagnostic Bridge Installation and User Guide
12
These files contain the following information:
• api-users.json: This file may contain credentials to access the Diagnostic Bridge API directly. Multiple user may be provisioned with different access Roles. It is not necessary to create users when you use the MyDiagnostics UI.
• static-settings.json: This file contains the Diagnostic Bridge default port, the location of the Certificate and the connection string to access the SQL database.
• settings.json: This file includes the Client ID and Client Secret details as well as information that is needed in order to access services that are deployed to the MyDiagnostics environment. It is overwritten by the MyDiagnostics application and should not be edited manually.
• outbound-connections.json: This file contains a list of outgoing connection configurations and may be used to specify proxy server information for external data sources.
Configure Outbound Connections The file outbound-connections.json contains proxy, certificate, and logging settings for outgoing HTTP(S) connections. When you add Data Sources such as Cisco Prime or Cisco CSP Collector, the MyDiagnostics UI will automatically create an entry in this file. If connectivity to these sources requires advanced settings (such as the use of a proxy server), you must manually configure that information in this file.
Each configuration entry can include these fields:
HostSelector (required): If the host portion of an outgoing URL contains this string, there is a match. The string is not case-sensitive. If the string is "*", it matches all outgoing URLs.
LoggingDirectory: HTTP logs are written to the directory in this field. It is recommended that you only include this field in order to troubleshoot an issue.
AllowInvalidCertificate: If set to "true", no certificate validation is performed for URLs that match the HostSelector string. This field must be set to "true" in order to support self-signed certificates.
ProxyAddress: The full address, including scheme and port, of the proxy to use for URLs that match the HostSelector string.
Note: If the ProxyAddress field is set, then these additional parameters are required: ProxyUseDefaultCredentials (Boolean), ProxyUsername, ProxyPassword, and ProxyCredentialDomain.
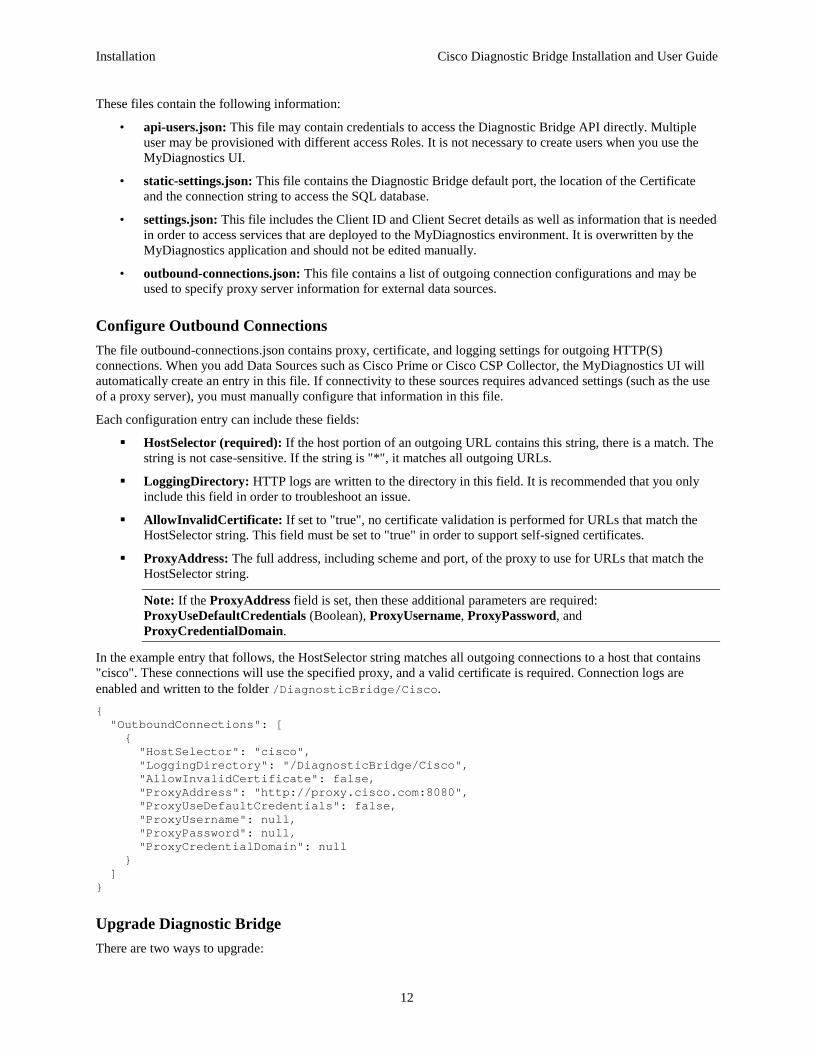
In the example entry that follows, the HostSelector string matches all outgoing connections to a host that contains "cisco". These connections will use the specified proxy, and a valid certificate is required. Connection logs are enabled and written to the folder /DiagnosticBridge/Cisco. { "OutboundConnections": [ { "HostSelector": "cisco", "LoggingDirectory": "/DiagnosticBridge/Cisco", "AllowInvalidCertificate": false, "ProxyAddress": "http://proxy.cisco.com:8080", "ProxyUseDefaultCredentials": false, "ProxyUsername": null, "ProxyPassword": null, "ProxyCredentialDomain": null } ] }
Upgrade Diagnostic Bridge There are two ways to upgrade:

Installation Cisco Diagnostic Bridge Installation and User Guide
13
• Use the My Diagnostic Interface • Manually copy the new version in place
Upgrade with the My Diagnostic Interface
In order to upgrade with the My Diagnostic Bridge Interface, click the Update button. Refer to this figure:
Upgrade Manually
In order to upgrade manually, replace the current ‘bin’ folder with the contents of the update ZIP:
1. Obtain the latest ZIP and download it to the Diagnostic Bridge:
https://cway.cisco.com/apps/mydiagnostics/vX.Y.Z/vX.Y.Z.zip
Replace X.Y.Z with the desired version number (example: 1.5.2)
2. Stop the Cisco Diagnostic Bridge service
OVA Installation: service rc-local stop
MSI Installation: Stop the ‘Cisco Diagnostic Bridge` in Windows Services manager
3. Optionally rename the Diagnostic Bridge ‘bin’ folder to keep a backup.
OVA Installation: /DiagnosticBridge/bin/
MSI Installation: C:\Program Files (x86)\Cisco\DiagnosticBridge\bin\
4. Replace the ‘bin’ folder with the contents of the download ZIP
Note: It is recommended that you keep previous versions in order to revert back if you face any issues. The previous configuration settings are retained after upgrade.

Configure Application Settings Cisco Diagnostic Bridge Installation and User Guide
14
Configure Application Settings Use the following URL in order to access My Diagnostics:
https://cway.cisco.com/mydiagnostics
The first time you open My Diagnostics, the interface opens with the Settings page displayed. Select a customer and enter the address and port of the Diagnostic Bridge and click Save. This will enable the remaining options on the Settings page so that you can configure the settings.
It is recommended that you configure the remaining settings in this order:
1. Notification Profiles
2. Data Sources
3. Scan Schedule
4. Manual Device Defaults
5. Users
Diagnostic Bridge Select a customer from the drop-down list in the Customer field. Enter the address and port of the Diagnostic Bridge and click Save.
Optionally, select the Session Logging toggle switch in order to turn session logs on or off. Normally, this feature should be turned on only temporarily, in order to help troubleshoot the application.

Configure Application Settings Cisco Diagnostic Bridge Installation and User Guide
15
Notification Profiles You can add and manage Notification Profiles in order to control email and event notifications for device check activities.
When the devices in the network are scanned and checked for alerts, the notification profiles help to notify customers about the events happening on the network devices via SMTP or ServiceNow plugins.
If you use ServiceNow to manage your network, you can configure the ServiceNow notification profile to integrate with the workflow of your ticket or incident management system.
Perform these steps in order to add a notification profile:
1. Click Add. The Add Notification Profile window appears.
2. Complete the required fields:
• Name: Enter a name for the Notification Profile.
• Description: Enter a description for the Notification Profile.
3. Click Next.
4. Complete the required fields:
• Plugin: Choose the plugin for the Notification Profile.
• Plugin Type: Choose the type of notification template.
Note: The Plugin Type option appears on selecting the Plugin from the drop-down list.
5. Click Save.
The sections that follow describe the supported notification plugins.

Configure Application Settings Cisco Diagnostic Bridge Installation and User Guide
16
SMTP Mail Sender The SMTP Mail Sender allows you to configure email notifications for device checks. Choose this option in order to configure email notifications for alerts with a successful run, when a device or a group of devices are scanned and any changes in the state of issues. Configure user credentials and the SMTP Server when you add SMTP Mail Sender Notification Profiles.
• Credentials: Click the toggle button in order to provision login credentials or view credentials that you
previously entered. When enabled, login credentials for each session tab persist until the session tab is closed. Enter the credentials (Username and Password) to login to the email system.
• Configuration: Click the toggle button in order to provision SMTP server details or view a configuration that you previously entered. When enabled, login credentials and server details for each session tab persist until the session tab is closed.
– SMTP Host: Enter the outgoing mail server IP address.
– SMTP Port 25: The standard SMTP port used to send out emails is port 25. To select any other port, use the up and down arrows.
– Mail From: Enter email address of the sender such as the Cisco bridge ([email protected]).
– Mail To: Enter email address of the receiver such as individual email/email alias used to create a case in Incident Management or Remedy.
– SSL: Click the toggle button in order to enable or disable. This setting elevates the connection to use TLS encryption immediately after reading the greeting and capabilities of the server, but only if the server supports the STARTTLS extension.
• Add a Handler: Click this button in order to add another handler to the notification profile.

Configure Application Settings Cisco Diagnostic Bridge Installation and User Guide
17
ServiceNow Event You can configure event notifications for every alert found during device check and when there is a change in the state of issues. This allows you to integrate with the customer’s incident/ticket management system.
• Credentials: Click the toggle button in order to provision login credentials or view credentials that you
previously entered. When enabled, login credentials for each session tab persist until the session tab is closed. Enter the credentials (Username and Password) to login to the ServiceNow at the customer’s network.
• Configuration: Click the toggle button in order to provision SMTP server details or view a configuration that you previously entered. When enabled, login credentials and server details for each session tab persist until the session tab is closed.
– Base URL: Enter the URL that is used to communicate with ServiceNow in order to accept the events received by the Customer.
• Add a Handler: Click this button in order to add another handler to the notification profile.
Data Sources Data sources provide ways for the Cisco Diagnostic Bridge to learn the Cisco devices in your network. The data sources that can be added are:
• Cisco CSP Collector • Cisco PI • General External Source • ServiceNow • WhatsUp Gold Group
You can use the synchronize option, available on the Devices page, in order to refresh the device list from the Data Source. The bridge will communicate to the Data Source and refresh the device list.
You can add and manage Data Sources using this option. You can select the collector and notification profiles to associate to the devices.
Perform these steps in order to add a data source:
1. Click Add. The Add Data Source window appears.

Configure Application Settings Cisco Diagnostic Bridge Installation and User Guide
18
2. Enter the Name of the data source.
3. In the Source field, select the source of device data. Additional fields appear when you select a source.
4. In the Collector Profile field, select a profile. All of the profiles that that have been created on the Bridge will appear in the drop-down list.
Note: Collector Profile lets you control the way device information is gathered for Cisco Diagnostic Bridge. Some Data Sources provide their own collection system and do not require a collector profile such as CSPC.
5. In the Notification Handler field, select the notification profile. All of the profiles that you have created appear in the drop-down list.
6. Enter source-specific information as required. Refer to the following sections for source specific setup.
Cisco CSP Collector The Cisco CSP Collector (CSPC) version 2.6.3.3 requires you to install and configure the cdbao add-on before you can add it as a data source. CSPC versions 2.7.2 and later do not require the add-on. See CSPC Add-On for Cisco Diagnostic Bridge for details about installations that require the add-on.
Note: For versions greater than 2.6.3 and less than 2.7, HTTPS TCP port 39386 is used for communication between the CSPC cdbao add-on and the My Diagnostics bridge. If you have a firewall, ensure that communication between the two is permitted.
When you are ready to add the CSPC as a data source, enter this information on the Add Data Source screen:
Notification Handler: Optionally, select a method to use in order to send analysis results.
Hostname: Enter the IP address of the CSPC.
Domain: Enter the domain used by the customer, such as cisco.com.
Allow Self-Signed Certificate: Check this box if the CSPC uses a self-signed certificate for the secure https connection. If you are using a certificate signed by a trusted Certificate Authority, leave this unchecked.
CSP Collector v2.6.3: Check this box only if you use version 2.6.3. If version 2.7.2 or later is installed, leave the box unchecked.

Configure Application Settings Cisco Diagnostic Bridge Installation and User Guide
19
Cisco Prime Infrastructure (PI) Cisco PI must be installed and configured using the REST API before you can add it as a data source.
In order to test whether the diagnostic bridge can receive device information from Cisco PI, use a browser to run an API query manually. Ensure that the query returns the device ID. Also validate the login credentials.
Note: Group NBI Read users are not allowed to log in via a browser, so use the root user.
Direct the browser to https://<myCiscoPI_ipaddr>/webacs/api/v1/data/Devices, where <myCiscoPI_ipaddr> is the IP address of the Cisco PI.
Next, run a detailed query that uses the device ID from the previous API query. Do this for each device.
Direct the browser to https://<myCiscoPI_ipaddr>/webacs/api/v1/data/Devices/<myDevice_ID>, where <myCiscoPI_ipaddr> is the IP address of the Cisco PI and <myDevice_ID> is the ID of the device.
Configure Application Settings Cisco Diagnostic Bridge Installation and User Guide
20
When you are ready to add the Cisco PI as a data source, enter this information on the Add Data Source screen:
Collector Profile: Select a profile. Long Poll Collector uses the diagnostic bridge API in order to provide device information from a system integration. SSH CLI Collector uses SSH in order to collect device information directly; you must configure local SSH credentials and enable the password.
Notification Handler: Optionally, select a method to use in order to send analysis results.
Username: Enter a user account that is configured on the Cisco PI. The account must have access to the Cisco PI REST API (such as an account to which the Group NBI Read is assigned).
Password: Enter the password for the user account.
URL: Enter the HTTPS URL for the Cisco PI.
Allow Self-Signed Certificate: Check this box if Cisco PI uses a self-signed certificate for the secure https connection. If you are using a certificate signed by a trusted Certificate Authority, leave this unchecked.
General External Source System integration is possible through use of the Diagnostic Bridge API.
You must configure the API user account in the file api-users.json, located in /DiagnosticBridge/etc.
By default, the diagnostic bridge uses a self-signed certificate. You can use a browser in order to validate the certificate; if a security warning appears, accept the certificate.
In order to check the diagnostic bridge API functionality, direct a browser to:
https://<diagnosticBridgeIP>:5001/swagger
...where <diagnosticBridgeIP> is the IP address of the bridge.
When you are ready to add a general external source as a data source, enter this information on the Add Data Source screen:
Collector Profile: Select a profile. Long Poll Collector uses the diagnostic bridge API in order to provide device information from a system integration. SSH CLI Collector uses SSH in order to collect device information directly; you must configure local SSH credentials and enable the password.
Notification Handler: Optionally, select a method to use in order to send analysis results.
Service Now You must have an active ServiceNow contract and user credentials in order to access your ServiceNow instance.
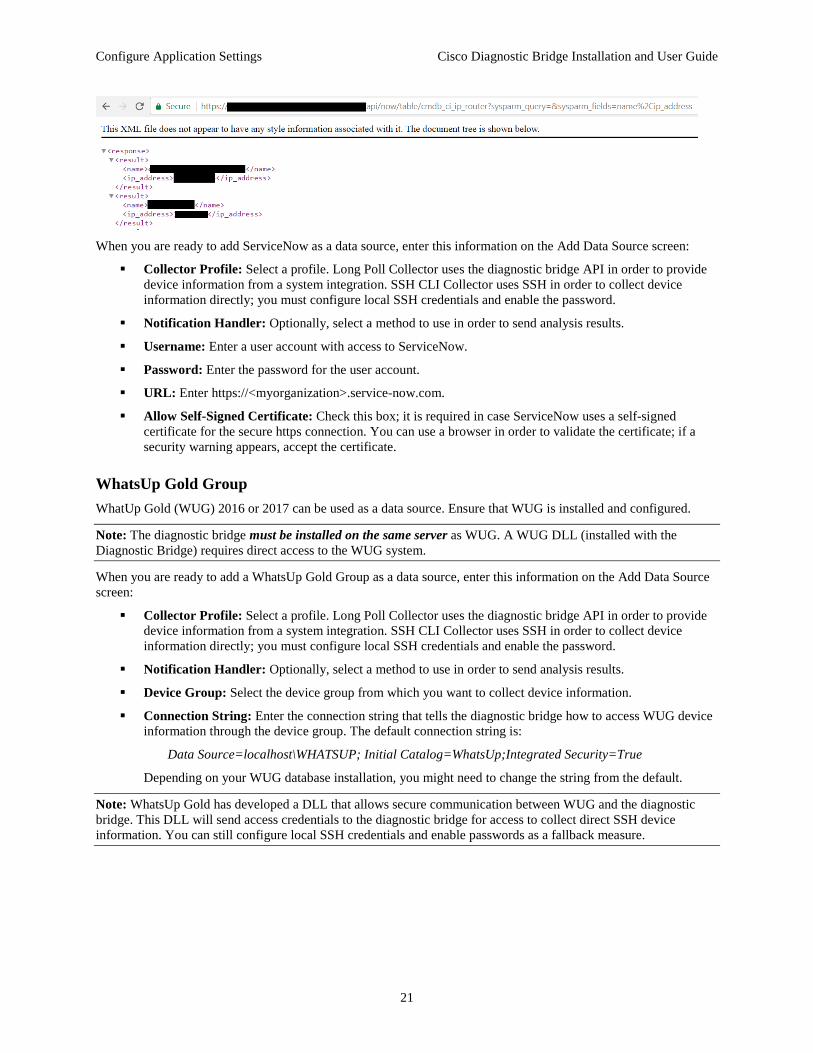
In order to test whether the diagnostic bridge can receive device information from ServiceNow, use a browser to run an API query manually. Ensure that the query returns the name and ip_address fields. Direct the browser to:
https://<myorganization>.service-now.com/api/now/table/cmdb_ci_ip_router ?sysparm_query=&sysparm_fields=name%2Cip_address
...where <myorganization> is the name of your organization that is used for your ServiceNow contract.
Configure Application Settings Cisco Diagnostic Bridge Installation and User Guide
21
When you are ready to add ServiceNow as a data source, enter this information on the Add Data Source screen:
Collector Profile: Select a profile. Long Poll Collector uses the diagnostic bridge API in order to provide device information from a system integration. SSH CLI Collector uses SSH in order to collect device information directly; you must configure local SSH credentials and enable the password.
Notification Handler: Optionally, select a method to use in order to send analysis results.
Username: Enter a user account with access to ServiceNow.
Password: Enter the password for the user account.
URL: Enter https://<myorganization>.service-now.com.
Allow Self-Signed Certificate: Check this box; it is required in case ServiceNow uses a self-signed certificate for the secure https connection. You can use a browser in order to validate the certificate; if a security warning appears, accept the certificate.
WhatsUp Gold Group WhatUp Gold (WUG) 2016 or 2017 can be used as a data source. Ensure that WUG is installed and configured.
Note: The diagnostic bridge must be installed on the same server as WUG. A WUG DLL (installed with the Diagnostic Bridge) requires direct access to the WUG system.
When you are ready to add a WhatsUp Gold Group as a data source, enter this information on the Add Data Source screen:
Collector Profile: Select a profile. Long Poll Collector uses the diagnostic bridge API in order to provide device information from a system integration. SSH CLI Collector uses SSH in order to collect device information directly; you must configure local SSH credentials and enable the password.
Notification Handler: Optionally, select a method to use in order to send analysis results.
Device Group: Select the device group from which you want to collect device information.
Connection String: Enter the connection string that tells the diagnostic bridge how to access WUG device information through the device group. The default connection string is:
Data Source=localhost\WHATSUP; Initial Catalog=WhatsUp;Integrated Security=True
Depending on your WUG database installation, you might need to change the string from the default.
Note: WhatsUp Gold has developed a DLL that allows secure communication between WUG and the diagnostic bridge. This DLL will send access credentials to the diagnostic bridge for access to collect direct SSH device information. You can still configure local SSH credentials and enable passwords as a fallback measure.

Configure Application Settings Cisco Diagnostic Bridge Installation and User Guide
22
Scan Schedule You can schedule a daily or weekly scan using the Schedule Scan option. Select the day and time to run device scans. The scan scheduled in this screen applies to all the devices that have the scan option enabled.
In order to schedule an automatic scan of devices in the network, choose Daily or Weekly. Use the up and down arrow buttons in order to select the hour, minutes and AM/PM.
Manual Device Defaults Set default credentials for devices that are added manually.
Enter the username and password, select the Notification Handler, and enter the port.
In order to reset the password, click the Reset Manual Defaults button.
Users On this tab, you can add and delete user accounts and assign access levels to each account. The tab displays a table of user accounts that shows the login ID and access levels.
Access levels, or roles, define what functions a user is allowed to perform within the application:
Admin: This access level can add user accounts, configure Diagnostic Bridge settings, and use all program features.
Operator: This access level can perform the operational functions that are required in order to support the Diagnostic Bridge.
ReadOnly: This access level can only view the data that is displayed on the My Diagnostics page.

Configure Application Settings Cisco Diagnostic Bridge Installation and User Guide
23
Perform these steps in order to create or modify a user account:
1. Click the Edit button. The Edit Users dialog opens and displays a table of user accounts.
2. In order to add a user account, click the button at the top of the dialog. A new row appears in the table.
a. Enter the login ID in the CCO column. The application validates the ID automatically.
b. In order to modify the access levels for a new or existing account, click the Edit button in the Access Levels column. In the dialog that opens, select ReadOnly, Admin, or Operator from the drop-down list and select the check box beside each additional role that is desired. Click Done.
c. In order to remove an account from My Diagnostics, click the trash can icon beside that account.
d. In order to disable an account (but not delete it), click the toggle button in the Disable Access column. Click the button a second time in order to re-enable the account.
3. Click Save when you are finished.

Features Cisco Diagnostic Bridge Installation and User Guide
24
Features Use the following URL in order to access My Diagnostics:
https://cway.cisco.com/mydiagnostics
Enter your Cisco user credentials.
Home Page The Home page displays the total count of:
• Open Events, categorized by alert severity (Information, Warning and Danger)
• Total Devices
• Events Resolved
Click on the count in order to view events and devices in detail on the Devices page.

Features Cisco Diagnostic Bridge Installation and User Guide
25
Devices Page The Devices page allows you to add, delete and manage devices, view event trends, conduct scans, and request investigations.
You can perform these actions on the Devices page:
• View the total device count, total number of open events, scanned devices and the scan schedule.
• View the trend of event details, based on severity.
• Type the name of a device in the search box and press Enter in order to search for matching devices.

Features Cisco Diagnostic Bridge Installation and User Guide
26
• Synchronize the bridge with external data sources in order to update any new devices to the existing list.
• Open an analysis investigation on the selected device. (Premium service level required.) Refer to
Investigate Devices for more details.
• Open a conversation. You can request a one-hour meeting with a TAC engineer in order to discuss
technology, deployment and so on. (Premium service level with TAC Advisor Level 2 required.)
• Request application support or submit feedback.
• Add devices manually. The selected device count appears on top of the device list table. Refer to Add
Devices Manually for more details.

Features Cisco Diagnostic Bridge Installation and User Guide
27
• Import devices from a CSV file. Refer to Import Devices for more details.
• Click the Play icon in order to begin a manual device scan. (Enhanced service level required.)
• Click the Pencil icon in order to edit information or tags for a device that was added manually.
• Click the Trash icon in order to delete a device that was added manually.
• Click the toggle button in the Scan column in order to enable or disable the scheduled scan for a device.
Device Details Click a device that is listed on the Devices page in order to open the Device Details page. Here, you can view and edit device information, initiate a manual device scan, and view events that affect the device.
Click the left and right arrows below the event graph in order to switch between a display of open events and checks performed, and events sorted by severity.
Features Cisco Diagnostic Bridge Installation and User Guide
28
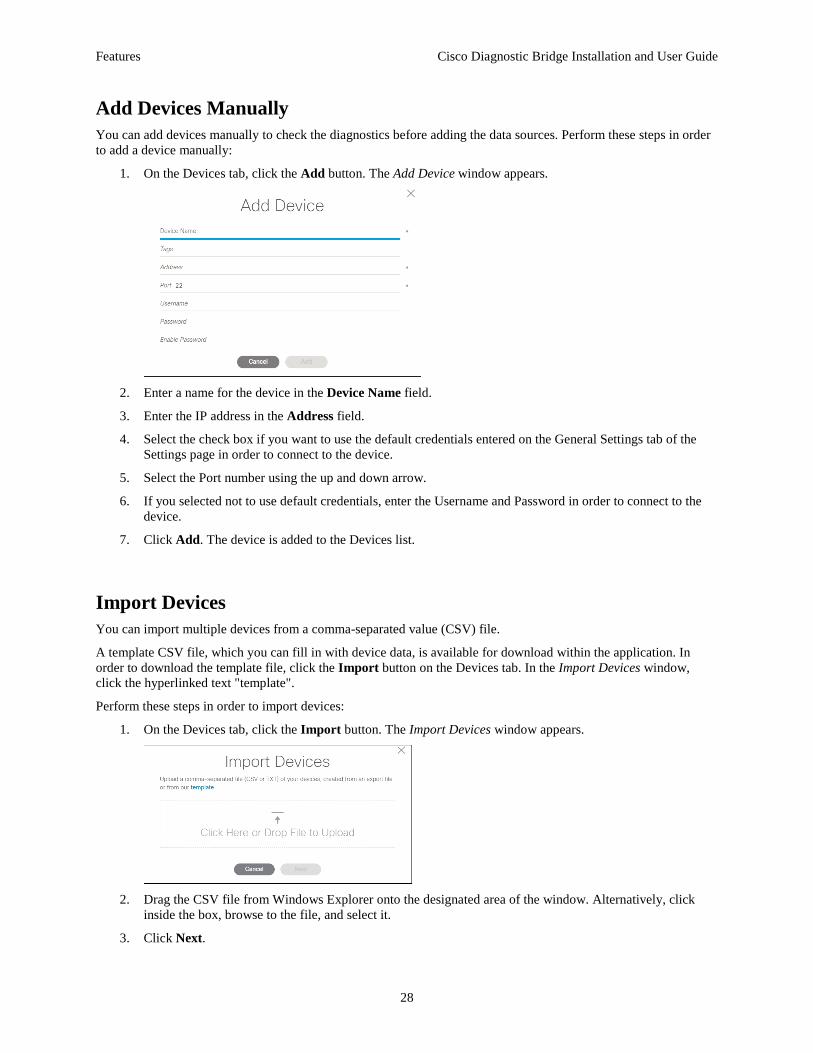
Add Devices Manually You can add devices manually to check the diagnostics before adding the data sources. Perform these steps in order to add a device manually:
1. On the Devices tab, click the Add button. The Add Device window appears.
2. Enter a name for the device in the Device Name field.
3. Enter the IP address in the Address field.
4. Select the check box if you want to use the default credentials entered on the General Settings tab of the Settings page in order to connect to the device.
5. Select the Port number using the up and down arrow.
6. If you selected not to use default credentials, enter the Username and Password in order to connect to the device.
7. Click Add. The device is added to the Devices list.
Import Devices You can import multiple devices from a comma-separated value (CSV) file.
A template CSV file, which you can fill in with device data, is available for download within the application. In order to download the template file, click the Import button on the Devices tab. In the Import Devices window, click the hyperlinked text "template".
Perform these steps in order to import devices:
1. On the Devices tab, click the Import button. The Import Devices window appears.
2. Drag the CSV file from Windows Explorer onto the designated area of the window. Alternatively, click
inside the box, browse to the file, and select it.
3. Click Next.

Features Cisco Diagnostic Bridge Installation and User Guide
29
4. Enter login credentials for the first device in the import file.
5. Optionally, click the Use for all further devices toggle button in order to use the same login credentials for all devices in the import file. (You can enable this option at any point in order to apply the credentials that you are currently entering to all remaining devices in the import file.) If you enable this option, click Import Devices in order to complete the import process.
6. If you have not enabled the Use for all further devices option, click Next. Enter login credentials for each device as required. When no further credentials are required, click Import Devices in order to complete the import process.
Export Devices You can export devices to a comma-separated value file.
If you want to export all the devices in the list, click the Export All button on the Devices tab. The file is generated and downloaded to your computer.
If you want to export specific devices, select the check boxes beside the desired devices on the Devices tab. Click the Bulk Actions button and select Export Devices. The file is generated and downloaded to your computer.
Scan Devices Manually Note: Manual device scans require Enhanced service level or higher. The scan button does not appear for Basic service level users.
In order to perform a manual device scan, click the Play button beside that device on the Devices page. Alternatively, select multiple devices, click the Bulk Actions button, and select Scan Devices.
Enable Scheduled Scan for Devices After you have used the Scan Schedule tab on the Settings page to set a day and time for automatic device scans, check the device list on the Devices page to ensure that the desired devices are enabled for the scheduled scan.
Click the toggle button in the Scan column of the device list to enable or disable the scan for each device.

Features Cisco Diagnostic Bridge Installation and User Guide
30
Events Page Click the Events tab in order to open the Events page. You can also open the Events page by clicking the box on the Home page that displays the number of open events.
The top area of the Events page displays a graph of the top 10 events by severity and number of affected devices.
The lower area of the page displays a table of events, initially sorted by severity. You can click column headers in the table in order to change the sort order. You can also select the filter check boxes beside the table in order to show or hide severity levels.
Click an event in the table in order to expand the row and show affected devices. You can then click a device in order to open the Device Details page.
Select the check box beside one or more events in the list in order to enable the Actions button. The Actions button provides options to label events as "work in progress", to ignore events, assign events to a support ticket, or export events to a CSV file.

Features Cisco Diagnostic Bridge Installation and User Guide
31
View Event History Click the History tab in order to view information about past events.
When the page opens, it displays all events in chronological order, from most recent to oldest. In order to locate specific events, click the Filter button and select the states and/or triggers for which you want to display matched events. You can also select a date range from the drop-down list in the Event Dates box in order to display only events that originated within the selected date range.
Investigate Devices Note: Premium service level is required in order to request an investigation. The Investigate button does not appear for Basic and Enhanced service level users.
You can submit a request to investigate a list of devices or a specific device. A Cisco Support Engineer will perform a detailed analysis and submit a report that is available on the Investigations page.
You can submit the investigation request from the Devices page or from the Individual device details page. A list of investigations that you have requested appears on the Investigations page.

Features Cisco Diagnostic Bridge Installation and User Guide
32
Complete these steps in order to investigate a device:
1. Select the device from the Devices page, or open the Details page for that device, and click the Open an Analysis Investigation button. The Open Analysis Request window appears.
2. Select the Resolution date and enter a Description. Click Submit in order to submit the request.
3. All of the investigations that you requested will appear on the Investigations page.
4. Click the Case link in order to view the case details. The case details page appears.

Features Cisco Diagnostic Bridge Installation and User Guide
33
5. Click the Title link in order to view the information provided by the TAC engineer. It includes Description, Plan, Impact, Output and Comments. In order to submit feedback, click the icon available under Actions.
Note: You can also request analysis for a single device from a TAC engineer. This is available to Enhanced customers who have purchased the TAC Add on Level 1 and Premium customers.
You can submit a request for analysis on the individual device details page.
Work Items The Work tab is a future capability that will help automate the collection and upload of Service Request data that is requested by TAC.
View Notifications Click the Notifications tab in order to view the messages that are associated with system events.
When the page opens, it displays all notifications in chronological order, from most recent to oldest. In order to locate specific notifications, enter text in the Search Events box, or click the Filter button and select the notification types that you want to display. You can also select a date range from the drop-down list in the Event Dates box in order to display only notifications that originated within the selected date range.

Features Cisco Diagnostic Bridge Installation and User Guide
34
View Reports My Diagnostics provides a suite of reports that allow you to view information about devices and events at a glance, and drill down in order to obtain more specific information that is of interest.
In the top right corner of the Reports page, click the Select Report button and choose the type of report that you want to view from the drop-down list. Available report types include:
Ignored Events Events Modified Device Scans Contract Renewal Product Lifecycle Software Version Device Health
In order to filter the information that is included in the report, click the Filter button and select the desired categories of information. The report updates automatically.
Many reports contain hyperlinked elements that provide more detailed information when you click them, or that open another page in the application (such as the Device Details page when you click the name of a device in a report).
You can export a report to a file in either PDF or CSV format. Click the button ( ) for the file format that you want to use.

CSPC Add-On for Cisco Diagnostic Bridge Cisco Diagnostic Bridge Installation and User Guide
35
CSPC Add-On for Cisco Diagnostic Bridge This section details the Installation and usage notes (cdbao-1.0.0 Installation/Usage Notes) for the add-on piece, which is installed in the same VM where the CSPC collector is installed.
CSPC host with CSPC 2.6.3.3 is required for Add-on. (CSPC 2.7 or later no longer requires this).
Code Installation These instructions assume that you have already configured and started the CSP Collector, v2.6.3.3.
Note: You require root access to the collector VM.
1. Download the version of the add-on from:
https://upload.cisco.com/cgi-bin/swc/fileexg/main.cgi?CONTYPES=Cisco_Diagnostic_Bridge
2. Copy the file, as root, into the collector's VM. This can be placed anywhere on the server:
Example: Downloads $ scp cdbao-1.0.0.tar.gz [email protected]:/tmp Warning private system unauthorized users will be prosecuted. [email protected]'s password: cdbao-1.0.0.tar.gz Downloads$ 100% 25MB 12.8MB/s 00:01
3. Use SSH in order to connect to the collector, as root, and shut down the collector:
Example: Downloads $ ssh [email protected] Warning private system unauthorized users will be prosecuted. [email protected]'s password: Warning: your password will expire in 82 days Last login: Tue Jan 31 19:22:32 2017 from 10.82.238.198 ######################################################################## # This system is hardened and for the use of authorized users only. # # Individuals using this computer system without authority, or in # # excess of their authority, are subject to having all of their # # activities on this system monitored and recorded by system # # personnel. # # # # In the course of monitoring individuals improperly using this # # system, or in the course of system maintenance, the activities # # of authorized users may also be monitored. # # # # Anyone using this system expressly consents to such monitoring # # and is advised that if such monitoring reveals possible # # evidence of criminal activity, system personnel may provide the # # evidence of such monitoring to law enforcement officials. # ######################################################################## [root@swtg-rtp-poc-206 ~]# service cspc stop Stopping tomcat: Stopped tomcat: Stopping Common Services Platform Collector: Shutting down Base Collector. waiting for add-ons to shutdown.............. Shutting down MySQL.. SUCCESS! nohup: ignoring input and appending output to 'nohup.out' Stopped tomcat service [root@swtg-rtp-poc-206 ~]#
Note: The SSH timeout must be set to 40 seconds in CSPC. In order to set the SSH timeout, go to Settings > Inventory Settings > Global timeouts. The default value is 10 seconds.

CSPC Add-On for Cisco Diagnostic Bridge Cisco Diagnostic Bridge Installation and User Guide
36
4. Remove any existing cdbao installation with the following command:
Example: [root@swtg-rtp-poc-206 ~]# rm –rf ${CSPHOME}/add-ons/cdbao [root@swtg-rtp-poc-206 ~]#
5. Extract the tar file in the $CSPCHOME/add-ons directory:
Example: [root@swtg-rtp-poc-206 ~]# tar xzf /tmp/cdbao-1.0.0.tar.gz –C ${CSPHOME}/add-ons --warning=no-timestamp [root@swtg-rtp-poc-206 ~]#
6. Open a port in the firewall in order to allow the Diagnostic Bridge to access the add-on's API's:
a. Shut down iptables with "service iptables stop" as root:
Note: The firewall is off at this point.
Example: [root@swtg-rtp-poc-206 ~]# service iptables stop iptables: Saving firewall rules to /etc/sysconfig/iptables:[ OK ] iptables: Setting chains to policy ACCEPT: filter [ OK ] iptables: Flushing firewall rules: [ OK ] iptables: Unloading modules: [ OK ] [root@swtg-rtp-poc-206 ~]#
b. Manually edit the /etc/sysconfig/iptables file in order to add the lines that are shown below that reference port 39386. These lines have to be at the end of the list of other ports that are allowed and before any drop statements.
Example: : -A INPUT –p tcp –m tcp –dport 2424 –j ACCEPT -A INPUT –p udp –m udp –dport 3478 –j ACCEPT -A INPUT –s 10.1.2.3/32 –p tcp –m tcp –dport 39386 –j ACCEPT -A INPUT –s 127.0.0.1/32 –j ACCEPT -A INPUT –i lo –j ACCEPT -A INPUT –s 127.0.0.1/32 –d 127.0.0.1/32 –j ACCEPT -A INPUT –p icmp –j icmp_packets -A INPUT –j LOG_DROP : : -A OUTPUT –p tcp –m tcp –dport 7337 –j ACCEPT -A OUTPUT –p udp –m udp –dport 7337 –j ACCEPT -A OUTPUT –d 10.1.2.3/32 –p tcp –m tcp –dport 39386 –j ACCEPT -A OUTPUT –d 127.0.0.1/32 –j ACCEPT -A OUTPUT –o lo –j ACCEPT -A OUTPUT –p tcp –j ACCEPT -A OUTPUT –p icmp –j icmp_packets -A OUTPUT –j LOG_DROP : :
c. Start iptables back up with "service iptables start".
Example: [root@swtg-rtp-poc-206 ~]# service iptables start iptables: Applying firewall rules: [ OK ]

CSPC Add-On for Cisco Diagnostic Bridge Cisco Diagnostic Bridge Installation and User Guide
37
9. Restart the collector. The add-on should start up automatically.
Example: [root@swtg-rtp-poc-206 ~]# service cspc start Starting Common Services Platform Collector: Starting MySQL.... SUCCESS! Starting Base Collector and add-ons Starting CSPC server with Java memory as 2200 nohup: ignoring input and appending output to 'nohup.out' Starting tomcat: Started tomcat: Started tomcat service [root@swtg-rtp-poc-206 ~]#

Troubleshooting Cisco Diagnostic Bridge Installation and User Guide
38
Troubleshooting
Network Connectivity from the Diagnostic Bridge 1. If the deployed OVA is unable to connect to the network, you may have provisioned the wrong VM
Network in vCenter:
2. If you are unable to communicate with other servers outside of your network, you may need to configure
additional proxy settings: [root@localhost]# more /etc/environment http_proxy="http://proxy-1.cisco.com:88" https_proxy="http://proxy-1.cisco.com:88" no_proxy="127.0.0.1,10.48.71.11"
[root@localhost]# more /etc/yum.conf [main] proxy=http://proxy-1.cisco.com:88
Note: in the above example, https_proxy uses http proxy settings to establish the connection. This may be different in your environment.
3. If the Cisco Diagnostic Bridge is unable to connect to defined Data Sources, you may need to configure proxy settings in the file outbound-connection.json, which is located in /Diagnostic Bridge/etc/. A configuration example follows: "HostSelector": "*", "AllowInvalidCertificate": true, "ProxyAddress": “http://proxy-1.cisco.com:88”, "ProxyUseDefaultCredentials": false, "ProxyUsername": “proxyusername”, "ProxyPassword": “proxypassword”, "ProxyCredentialDomain": null
My Diagnostics API System integrators can look into Cisco Diagnostic Bridge with this link:
https://your IP address:5001/swagger/
System integrators can view all the capabilities and can access the APIs to push the device list, analyze data and pull devices, and so on.