Circulation and Fluid Volume Control
24
43 From: Integrative Physiology in the Proteomics and Post-Genomics Age Edited by: W. Walz © Humana Press Inc., Totowa, NJ 4 Circulation and Fluid Volume Control Bruce N. Van Vliet and Jean-Pierre Montani 1. INTRODUCTION 1.1. The Kidney, Circulation, and Integrative Physiology The kidney and circulation provide an especially rich source of examples of integrative physiology. The regulation of blood pressure (BP), for example, involves many disparate tissues, ranging from the heart and vasculature to the brain, adrenal gland, and kidney. BP regulation also involves multiple layers of physiological organization—from the biophysics of renal transport to the regulation of flows and resistances to the overall architecture of the fluid volume control system. The value of a truly “integrative” approach is evident from the many properties and features of such systems that could not have been discovered even by the most detailed examination of their individual components. As we begin this century and millennium, technological advancements are not only lead- ing to new avenues of investigation and additional layers of knowledge, but also an explo- sive growth in physiological information and literature. The task of integrating the information—forming a comprehensive understanding of each system and the interactions between systems—will be a major challenge. Meeting this challenge will require new efforts and new approaches, but also an awareness of what has been done and what is possible. 1.2. Arthur C. Guyton’s Systems Analysis of Circulatory Dynamics and Their Control To instill a sense of what has and can be done, we can do no better than revisit some of our greatest successes. It is therefore both appropriate and timely to dedicate this chapter to the memory of Arthur C. Guyton (1919–2003) (1–3), exceptional in each of his many roles as scientist, inventor, teacher, and mentor, and one of the most accomplished and truly integra- tive physiologists of the past century. Although widely respected for his Textbook of Medi- cal Physiology, he also made a number of seminal contributions to cardiovascular physiology (Table 1) and effectively fathered the modern-day field of quantitative physiological sys- tems analysis (4–7). Guyton’s “quantitative systems analysis” approach not only led him to consider the most important aspects of various components of circulatory control, but especially how they fit together and interacted. Thus, to him, cardiac output represented the outcome of an interac-
Transcript of Circulation and Fluid Volume Control
Circulation and Fluid Volume Control 43
43
From: Integrative Physiology in the Proteomics and Post-Genomics AgeEdited by: W. Walz © Humana Press Inc., Totowa, NJ
4Circulation and Fluid Volume Control
Bruce N. Van Vliet and Jean-Pierre Montani
1. INTRODUCTION
1.1. The Kidney, Circulation, and Integrative Physiology
The kidney and circulation provide an especially rich source of examples of integrativephysiology. The regulation of blood pressure (BP), for example, involves many disparatetissues, ranging from the heart and vasculature to the brain, adrenal gland, and kidney. BPregulation also involves multiple layers of physiological organization—from the biophysicsof renal transport to the regulation of flows and resistances to the overall architecture of thefluid volume control system. The value of a truly “integrative” approach is evident from themany properties and features of such systems that could not have been discovered even bythe most detailed examination of their individual components.
As we begin this century and millennium, technological advancements are not only lead-ing to new avenues of investigation and additional layers of knowledge, but also an explo-sive growth in physiological information and literature. The task of integrating theinformation—forming a comprehensive understanding of each system and the interactionsbetween systems—will be a major challenge. Meeting this challenge will require new effortsand new approaches, but also an awareness of what has been done and what is possible.
1.2. Arthur C. Guyton’s Systems Analysis of Circulatory Dynamicsand Their Control
To instill a sense of what has and can be done, we can do no better than revisit some of ourgreatest successes. It is therefore both appropriate and timely to dedicate this chapter to thememory of Arthur C. Guyton (1919–2003) (1–3), exceptional in each of his many roles asscientist, inventor, teacher, and mentor, and one of the most accomplished and truly integra-tive physiologists of the past century. Although widely respected for his Textbook of Medi-cal Physiology, he also made a number of seminal contributions to cardiovascular physiology(Table 1) and effectively fathered the modern-day field of quantitative physiological sys-tems analysis (4–7).
Guyton’s “quantitative systems analysis” approach not only led him to consider the mostimportant aspects of various components of circulatory control, but especially how they fittogether and interacted. Thus, to him, cardiac output represented the outcome of an interac-

44 Van Vliet and Montani
tion of venous return and cardiac function, total peripheral resistance represented, in part, aconsequence of the effects of the effects of BP on tissue blood flow (i.e., autoregulation), andthe long-term BP level itself represented an interplay between renal perfusion pressure andrenal excretory function. Once revolutionary ideas, these and other concepts have proventheir value over time and now penetrate the very fabric of modern cardiovascular physiology.
The quantitative nature of Guyton’s systems analysis was conspicuously manifest in a “largecirculatory model” (Fig. 1) in which several hundred equations were used to quantify differentcomponents of the circulation and their control. Although model parameters were largely basedon empirical values, the overall architecture of the model was based on insight and intuition,trial and error, and repeated comparison and testing against experimental data. In addition toits ability to simulate the behaviour of the cardiovascular system (e.g., refs. 8 and 9), eachversion of the model essentially represented an explicitly stated theory or hypothesis: “Howwould a circulatory system of this design behave?” As Dr. Guyton pointed out, the most help-ful contribution of the model was when it failed to correctly predict an empirical outcome,since that clearly indicated a limitation in our understanding of the system.
Dr. Guyton’s influence lives on, his theories permeating our text books, his approachembedded in the careers and research programs of the many scientists who trained in hisdepartment and laboratory. Nevertheless, in an era of rapid advances in highly focused areasof cellular physiology, molecular biology, and genetics, there has perhaps never been greaterneed for his desire and ability to integrate the pieces into a quantitative and comprehensivemodel of the whole. In the remainder of this chapter, we focus on two concepts of cardiovas-cular regulation that arose from Guyton’s systems analysis and remain fundamentallyimportant today. These are the dominant role of the renal body fluid feedback mechanism insetting the long-term BP level, and the concept of “whole body autoregulation,” by which
Table 1Selected Accomplishments of Arthur C. Guyton
Influential books published
• Textbook of Medical Physiology (10 editions) and related texts.• Circulatory Physiology: Cardiac Output and Its Regulation (1973).• Circulatory Physiology II: Dynamics and Control of the Body Fluids (1975).• Circulatory Physiology III: Arterial Pressure and Hypertension (1980).
Important concepts and ideas championed by Dr. Guyton
• Dominant role of the kidney, pressure natriuresis, and the renal body fluid feedbackmechanism in long-term blood pressure control.
• Interstitial fluid dynamics, including concept of a negative interstitial fluid pressure.• Role of venous return and mean circulatory filling pressure in regulating cardiac
output.• Safety factor for pulmonary edema.• Whole body autoregulation.• Graphical analysis of physiological regulation (especially cardiac output and blood
pressure).• Quantitative computer modeling of physiological systems.

Circulation and Fluid Volume Control 45
the total peripheral resistance is considered to be, in part, a response to the BP level (and notthe other way around). If nothing else, this review may serve to illustrate the role of anintegrative approach in understanding physiological systems, and the contribution of “quan-titative systems analysis” to this end.
2. THE RENAL BODY-FLUID FEEDBACK MECHANISM
Of the various concepts championed by Guyton, perhaps the most influential was thedominance of the kidney in setting the long-term BP level. The basis for this concept was therenal body-fluid feedback mechanism (RBFFM) illustrated in Fig. 2. At the heart of theRBFFM lies the “pressure natriuresis relationship,” which describes the link between BP,salt intake, and salt excretion.
The acute pressure natriuresis relationship is determined in isolated kidneys (e.g., refs. 10and 11), anesthetized animals (e.g., ref. 12), or conscious animals (e.g., ref. 13) by varyingthe renal perfusion pressure and observing the resultant change in the rate of renal salt excre-tion. As shown in Fig. 3, acute manipulations of renal perfusion pressure elicit a correspond-ing change in the renal excretion of salt and water, with increases in BP causing increasedsodium excretion (i.e., natriuresis) and reductions in BP causing reduced sodium excretionor even complete cessation of urine flow at low BP levels. The mechanisms underlying thisphenomena have been reviewed elsewhere (14,15).
It is important to realize that the acute pressure–natriuresis relationship also predicts thelong-term level of BP that would arise for a given level of salt intake if the acute relationshipwas fixed and did not change with time. However, the acute pressure–natriuresis relation-ship is not fixed. It changes in response to many factors including changes in dietary saltintake. Thus, another approach is used to assess the chronic relationship between BP, saltintake, and renal salt excretion.
The chronic pressure–natriuresis relationship is measured in a different manner by impos-ing a level of salt intake on a subject for several days until salt balance is established (i.e.,until the rate of salt intake is matched by the rate of renal salt excretion) and then measuringthe resultant BP level. This process is repeated for a variety of salt intakes, each level of saltintake contributing one point to the chronic pressure–natriuresis relationship, also known asthe “chronic renal function curve” (Fig. 3). In contrast to the acute pressure–natriuresismechanism, which represents a property of the renal tissues that can be demonstrated even inisolated perfused kidneys, the chronic pressure–natriuresis relationship represents the per-formance of the entire RBFFM at equilibrium: that is, after the many control mechanismsaffecting renal function and BP have exerted their influence, after salt balance has beenestablished, and after BP has stabilized. Because the chronic renal function curve describesthe pressure–natriuresis relationship when salt intake and renal salt excretion are equal, they-axis on a chronic renal function curve simultaneously represents both salt intake and saltexcretion.
Several characteristics of the renal function curve are of fundamental importance. First,on each curve there is an equilibrium point corresponding to the one level of BP that canmaintain salt excretion at the level of salt intake. In Fig. 3, this is represented by point A inthe case of either the acute or chronic renal function curve at normal salt intake, point B inthe case of the acute renal function curve under the condition of high salt intake, and point Cin the case of the chronic renal function curve at high salt intake. BPs above the equilibrium

46 Van Vliet and Montani

Circulation and Fluid Volume Control 47
level will raise renal salt excretion above the rate of salt intake leading to a slow and progres-sive fall in of extracellular fluid (ECF) volume and cardiac output (Fig. 2). Given sufficienttime, these changes would return the BP to the equilibrium level at which salt balance wouldagain be achieved. Conversely, BP levels below the equilibrium value will lead to salt reten-tion and a slow rise in cardiac output which, in time, would slowly raise the BP back to theequilibrium level. In this manner, one can appreciate the principle of how the RBFFM oper-ates as a negative feedback controller of the equilibrium BP level (Fig. 2). It is important tonote that this equilibrium BP level is set only by the shape and position of the chronic renalfunction curve and the level of salt intake (4).
A second important characteristic of the renal function curve is its slope. Although theacute pressure–natriuresis relationship is relatively shallow, the slope of the chronic renalfunction curve is remarkably steep in most individuals (Fig. 3). The steepness of the chronicrenal function curve reflects the property of salt insensitivity—a lack of change of the long-term BP level despite changes in salt intake. The steepness of the chronic renal functioncurve, relative to the acute pressure–natriuresis relationship, is thought to be largely theresult of the actions of the renin-angiotensin system (RAS [16–18]). This system acts tofacilitate salt excretion at high levels of salt intake, and facilitate salt retention at low levelsof salt intake, thereby allowing salt balance to be re-established with little or no change inthe equilibrium BP level. These effects of the RAS are time-dependent and require an intactcirculation, and are therefore not apparent in the acute pressure–natriuresis curve of isolatedkidneys. In chronic situations in which the RAS is unresponsive to a change in salt intake,BP becomes salt sensitive, corresponding to a renal function curve with a shallow slope,reminiscent of the acute pressure–natriuresis relationship.
A third and final characteristic of the chronic renal function curve to mention is its posi-tion along the BP axis. Repositioning the curve along the BP axis shifts the equilibrium BPlevel that the system will defend. A shift of the curve to the left lowers the equilibrium BPlevel, causing increased salt excretion until BP reaches the new equilibrium level, whereasshifting the curve to the right will produce a state of hypertension (Fig. 4). In the case of acurve with a shallow slope (salt sensitivity), hypertension can also be produced by increas-ing the level of salt intake (moving the equilibrium BP point along the curve to the right). Insome cases, hypertension may be associated with a combination of a rightward shift andreduced slope of the renal function curve (Fig. 4).
Fig. 1. (continued from facing page) Guyton’s large circulatory model (5). The core of the largecirculatory model consisted of equations calculating the pressures, volumes, and flows within dif-ferent segments of the heart and circulation. Each additional section added to the complexity andrealism of the control system. For example, an autonomic control section allowed cardiovasculardynamics to be affected by reflex adjustments of sympathetic tone (e.g., baroreflex), sections onrenal dynamics and excretion and thirst and drinking allowed circulatory volumes to be governed bysodium and water balance. Other sections added specific fluid compartments, regional circulations,and additional control mechanisms (e.g., antidiuretic hormone, angiotensin, and aldosterone sys-tems). Atrial natriuretic peptide was included in the 1992 version of the model. (From ref. 5 withpermission.)

48 Van Vliet and Montani
3. DOMINANCE OF THE RBFFM IN CONTROLLING THE LONG-TERMBP LEVEL: ITS IMPLICATIONS AND SIGNIFICANCE
3.1. Effectiveness of the RBFFM as a BP ControllerOf the many feedback mechanisms affecting BP, the RBFFM is believed to be the most
powerful, capable of dominating all other mechanisms (4,5). The dominance of this mecha-nism in controlling the long-term BP level arises from the cumulative, progressive nature ofits actions. As long as the BP remains above the equilibrium level predicted by the chronicrenal function curve, renal sodium excretion will remain high. Because the ensuing loss ofECF volume is progressive, the longer the arterial pressure remains above the renal set point,the greater the loss of ECF volume will be. Thus, the RBFFM is unusual among BP regula-tory mechanisms in that its effectiveness grows with time. Given sufficient time, the RBFFMshould theoretically be capable of completely correcting any perturbation in BP. This abilityto completely correct a disturbance in arterial pressure is what Guyton often referred to asthe “infinite gain” of the RBFFM, “gain” being a control systems term for the power oreffectiveness of a regulatory mechanism.
The power of the RBFFM in BP control has many important implications for long-termBP control and hypertension. Several are discussed here.
3.1.1. Predictive Value of the Chronic Pressure–Natriuresis Relationship
A conclusion reached by Guyton’s systems analysis is that at equilibrium (i.e., salt andwater balance), the long-term BP level is solely determined by the value predicted by theintersection of the chronic pressure–natriuresis relationship and the level of salt intake (Fig.3 [4]). In many respects, this principle is self-evident because this is the only BP level at
Fig. 2. Regulation of the long-term level of arterial blood pressure by the renal body-fluid feed-back mechanism. (Modified from ref. 4.)
Circulation and Fluid Volume Control 49
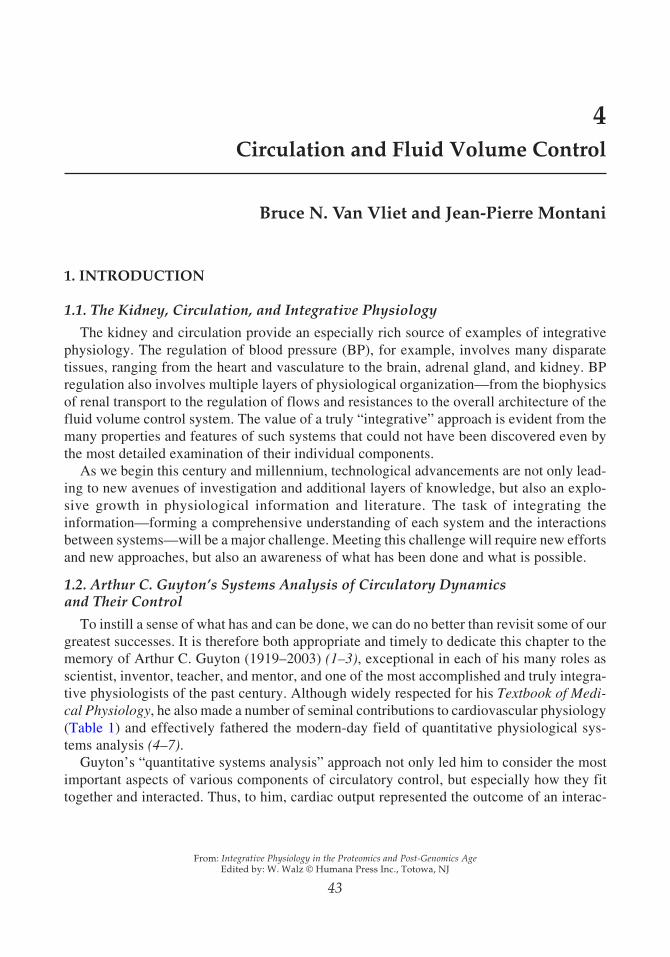
Fig. 3. The acute and chronic pressure–natriuresis relationships. The solid curve (acute curve)illustrates typical changes in salt excretion that quickly arise following acute changes in renal perfu-sion pressure in an isolated kidney. The dashed curve (chronic salt loading curve) indicates the long-term blood pressure level associated with salt balance (i.e., salt excretion = salt intake) at variouslevels of salt intake in intact animals. The solid and dashed horizontal lines indicate normal and sixtimes the normal levels of salt intake, respectively. Point A indicates the equilibrium point (the bloodpressure level at which salt balance can be achieved) for both the acute and chronic pressure–natri-uresis relationships under conditions of normal salt intake. Points B and C indicate the equilibriumpoint for the acute and chronic pressure–natriuresis relationships, respectively, when salt intake is sixtimes the normal. (Modified from ref. 4.)
Fig. 4. Effect of hypertension on the chronic renal function curve. Four different kinds of renalfunction curve associated with hypertension (reduced renal mass, aldosterone or angiotensin infu-sion, Goldblatt hypertension [i.e,. renal stenosis] or spontaneously hypertensive rats, and reducedglomerular filtration coefficient) and one form associated with hypotension (owing to renal medul-lary lesions) are compared with the normal curve. Equilibrium points for normal and elevated (threetimes normal) levels of salt intake are indicated on each curve. (From Guyton ref. 4 with permission.)
50 Van Vliet and Montani
which salt balance can be achieved. Any other BP level will lead to a change in salt andwater balance that will slowly drive the BP back to the predicted level. Thus, a shift in thechronic pressure–natriuresis relationship will lead to a change in the long-term BP level. Inturn, any change in the long-term BP level can be considered to reflect an underlying shift ofthe chronic renal function curve (assuming salt intake is approximately constant).
3.1.2. Dominant Role of the Chronic Pressure–Natriuresis Relationship in Hypertension
A closely related implication is the prediction that hypertension must reflect a change inthe chronic renal function curve. Thus, Guyton was well known for championing the con-cept of the “dominant role played by the kidney in hypertension.” Support for his view of thedominant role of the kidney and RBFFM in causing hypertension comes from several sourcesof which we mention just a few.
3.1.2.1. SUPPORT FOR THE DOMINANT ROLE OF THE KIDNEY AND PRESSURE–NATRIURESIS
MECHANISM
Shortly after Guyton’s prediction of a dominant role of the kidney in BP control waspublished, his prediction was tested by transplantation studies in various genetically hyper-tensive rat strains (SHR, SHRSP, Dahl, Milan, Prague) (19–21). Recent studies have refinedthe approach further, circumventing potential pitfalls such as rejection phenomena, the needfor immunosuppressants, and the use of indirect methods of BP assessment (22). In suchexperiments, the BP level of animals receiving a transplanted kidney was shown to bestrongly influenced by the BP level of the donor animal: implantation of a hypertensivekidney elevated the BP level of normotensive animals, whereas implantation of a normoten-sive kidney reduced the BP of hypertensive animals. This general finding has also beensupported by transplantation studies in humans (23,24). Recent studies have utilized thetransplantation approach to define the contribution of the kidney to the hypertension associ-ated with a considerably smaller number of hypertensive alleles located on a segment of ratchromosome-1 (25,26). The role of the kidney in human genetic hypertension has been sup-ported by observations of altered renal handling of sodium by hypertensive kidneys (27) andby our recent understanding of genetic disorders that directly affect renal transport mecha-nisms and lead to hypertension (28–30).
The kidney is also directly implicated in many well-known forms of acquired hyperten-sion, including that associated with renal stenosis (Goldblatt hypertension), ureteral obstruc-tion, renal wrap hypertension, reduced renal mass, infusion of various substances into therenal artery (e.g., ref. 31) or medulla (e.g., ref. 32), and a various renal pathologies. Theinvolvement of the kidney in acquired forms of BP change has also been demonstrated usingthe transplantation approach. For example, the persistent correction of hypertension inducedby high doses of an angiotensin-converting enzyme inhibitor in genetically hypertensive ratshas recently been shown to be transferable to untreated rats by renal transplantation (33).
Above all else, support for a dominant role of the kidney and renal function curve insetting the BP level in hypertension has come from a series of studies in which a resetting ofthe chronic renal function curve to higher pressures has been found to be a consistent featureof all models of hypertension examined (Fig. 4) (34). Again, this once controversial conceptappears almost self-evident, since without a resetting of the chronic renal function curve,hypertension would result in an increased rate of renal fluid and water excretion until BPreturned to normal.
In summary, the concept of the dominant role of the kidney (or RBFFM, or pressurenatriuresis relationship) in hypertension is supported by a wide variety of data. In its most

Circulation and Fluid Volume Control 51
basic form, this principle simply means that all forms of hypertension must include a mecha-nism that allows the renal function curve to be reset so that normal sodium and fluid balancecan be maintained at the elevated level of BP.
3.1.3. Non-Causes of Hypertension
A third important implication has to do with the “non-causes” of hypertension. Based onthe principles discussed previously, non-causes would include any factor that failed to affectthe chronic renal function curve (assuming salt intake remains approximately normal). Aparticularly important example is that this would exclude a contribution from changes invascular resistance that fail to influence the renal circulation (or chronic renal functioncurve). Thus, although an increase in the resistance of the renal microcirculation, renal artery,or aorta above the kidney (Guyton’s “resistance axis of hypertension” [35]) will shift therenal function curve rightward, resulting in a higher long-term BP level, an increase in theresistance to other parts of the arterial circulation do not directly affect the renal functioncurve, and are therefore presumed to be unable to influence the long-term BP level.
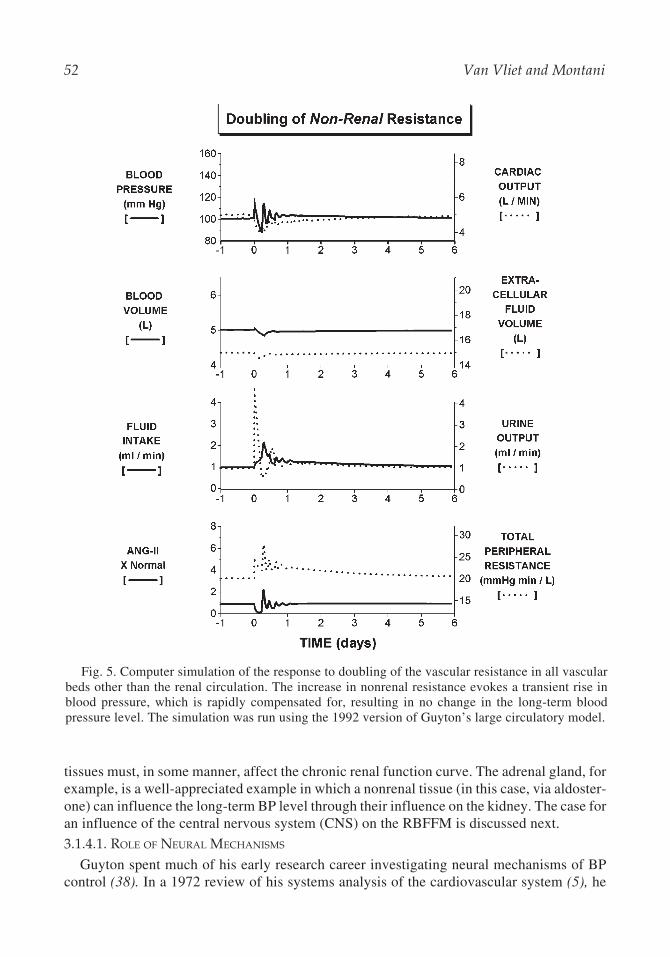
A comparison of the predicted effects of doubling vascular resistance in renal vs nonrenalcirculations is provided in computer simulations of Figs. 5 and 6. Doubling the nonrenalvascular resistance transiently raises the BP level but rapidly leads to compensatory mecha-nisms, including suppression of the RAS and sympathetic system and marked increases inrenal salt and water excretion (Fig. 5). Consequently, the long-term BP is unchanged despitethe initial doubling of resistance in the nonrenal vasculature. This result fits well with theexample frequently given by Guyton of war veterans who had undergone amputation of allfour limbs (thereby elevating their peripheral resistance by approx 20%) yet lacked hyper-tension. In marked contrast, doubling of the renal vascular resistance results in a promptmarked elevation of BP mediated initially by a rise in angiotensin-II and subsequently byincreases in fluid volumes and cardiac output (Fig. 6). As discussed in a later section, theseresponses are facilitated by the phenomena of whole body autoregulation.
A dramatic example also occurs in the presence of a large arteriovenous (AV) fistula(e.g., a communication between the abdominal aorta and vena cava). The creation of a largeAV fistula is associated with a profound fall in peripheral resistance and BP. With time,however, renal salt and water retention leads to elevation of cardiac output and a restorationof BP to approximately normal despite the maintenance of a profoundly reduced peripheralresistance (36). This demonstrates the ability of the RBFFM to control BP without regard forthe level of peripheral resistance. In rats with abdominal AV fistulas, treatment with deoxy-corticosterone acetate and salt (DOCA salt) can produce considerable hypertension despitethe fact that peripheral resistance remained well below the level seen in control rats (37).Thus, although hypertension is typically accompanied by an elevation of vascular resistance,it is not actually required for hypertension to occur. Indeed, as discussed in the subsequentsection on whole body autoregulation, Guyton’s system analysis led to a second provocativeconclusion that vascular resistance was largely a consequence, and not a cause, of the long-term BP level.
3.1.4. The Important Role of Nonrenal Tissues in Hypertension
An important misconception is that by acknowledging a dominant role for the kidney inlong-term BP control we are excluding a role for other tissues. On the contrary, the impor-tant role played by the kidney actually empowers other tissues with the ability to influencethe long-term BP level (4,5,38). The only caveat to this is that to do so, nonrenal tissues mustin some way reset renal function to agree with the new pressure level. That is, nonrenal
52 Van Vliet and Montani
tissues must, in some manner, affect the chronic renal function curve. The adrenal gland, forexample, is a well-appreciated example in which a nonrenal tissue (in this case, via aldoster-one) can influence the long-term BP level through their influence on the kidney. The case foran influence of the central nervous system (CNS) on the RBFFM is discussed next.
3.1.4.1. ROLE OF NEURAL MECHANISMS
Guyton spent much of his early research career investigating neural mechanisms of BPcontrol (38). In a 1972 review of his systems analysis of the cardiovascular system (5), he
Fig. 5. Computer simulation of the response to doubling of the vascular resistance in all vascularbeds other than the renal circulation. The increase in nonrenal resistance evokes a transient rise inblood pressure, which is rapidly compensated for, resulting in no change in the long-term bloodpressure level. The simulation was run using the 1992 version of Guyton’s large circulatory model.

Circulation and Fluid Volume Control 53
pointed out the potential for the CNS to influence the renal body fluid feedback control ofthe long-term BP level through several pathways including the renal sympathetic nerves.The physiology of the renal nerves and their role in hypertension has subsequently beenwidely investigated (39–41).
3.1.4.1.1. Effects of the Renal Nerves on Renal Function. As illustrated in Fig. 7, renalnerve activity has three direct actions on the kidney that may influence the long-term BP level.First, renal nerve activity facilitates and/or directly stimulates the release of renin from the
Fig. 6. Computer simulation of the response to doubling the renal vascular resistance. The in-crease in renal (afferent arteriolar) vascular resistance evokes a prompt and sustained rise in bloodpressure, which is accompanied by volume loading and whole body autoregulation of blood flow.The simulation was run using the 1992 version of Guyton’s large circulatory model.

54 Van Vliet and Montani
granular cells of the juxtaglomerular apparatus. This can influence the long-term BP levelthrough the formation of angiotensin peptides such as angiotensin-II, whose actions includevasoconstriction, reduced renal sodium excretion, and a stimulus for the secretion ofaldosterone, itself a potent antinatriuretic hormone. Second, renal nerve activity can directlystimulate the tubular reabsorption of sodium, thereby promoting an increase in ECF volumeand BP. Third, renal nerve activity can evoke renal vasoconstriction (e.g., ref. 41), therebydiminishing the rate of glomerular filtration and increasing the rate of tubular reabsorption ofsalt and water (via reduced peritubular capillary pressures).
Fig. 7. Effects of the renal sympathetic nerves on renal function and blood pressure control. (Modi-fied from ref. 96).

Circulation and Fluid Volume Control 55
3.1.4.1.2. Effect of the Renal Nerves on the Pressure–Natriuresis Mechanism. The effectof the renal nerves on renal salt excretion represents a shift of the acute pressure–natriuresisrelationship along the BP axis. For example, increases in renal sympathetic nerve activity(RSNA) shift the pressure–natriuresis relationship rightward along the BP axis (42,43).Overtime, a sustained shift would be expected to promote renal salt retention and fluid volumeexpansion until BP rises to meet the new set point level. In this manner, the sympatheticsystem could direct the kidneys to shift the BP level to a higher level. Once the newequilibrium BP level were achieved, renal salt excretion would return to normal, and saltbalance would again be achieved despite the sustained shift of the pressure–natriuresisrelationship.
It is interesting to consider that little or no change in the rate of renal sodium excretionwould occur if the pressure–natriuresis relationship and BP were to both shift at the sametime and by a similar amount. This may occur in fact occur during the course of the transientfluctuations in BP and RSNA that occur throughout the day. Although experimentally im-posed changes in renal perfusion pressure leads to corresponding changes in renal salt andwater excretion (i.e., pressure natriuresis) in anesthetized animals (e.g., ref. 12) and con-scious animals (e.g., ref. 13), spontaneous fluctuations in BP in conscious animals are gener-ally not associated with corresponding changes in renal salt and water excretion (13,44).However, spontaneous fluctuations in BP do lead to pressure–natriuresis in denervated kid-neys (13,44), and pressure–natriuresis associated with arousal is amplified following auto-nomic blockade (45). These results suggest that RSNA may act to reset thepressure–natriuresis relationship, thereby minimizing changes in renal salt excretion associ-ated with transient changes in BP. Such an arrangement is presumed to be highly advanta-geous in wild populations in which dietary salt intake is limited, and its conservation directlyimpacts on survival and reproduction.
3.1.4.1.3. The Renal Nerves and the Long-Term BP Level. Two important parametersdefine the ability of the renal nerves to influence the long-term BP level: the magnitude oftheir effect on the pressure–natriuresis mechanism and how well it is sustained with time. Therenal nerves normally provide a considerable restraint on renal sodium excretion as evidencedby the up to threefold increase in renal sodium excretion that can be produced by reflexunloading of RSNA in conscious animals (46–49). If such an effect were well sustained, renaldenervation would be expected to have a profound effect on the long-term BP level. However,in conscious dogs in which one of the two kidneys is chronically denervated, the 24-h sodiumexcretion of the denervated kidney is typically no more than about 12% greater than that of theinnervated kidney (50–54). This is far less than the threefold difference seen following acutereductions in RSNA, and suggests that the renal nerves are most effective in mediating short-term resetting of the pressure–natriuresis relationship. Nevertheless, even a modest effect onsodium excretion, if sustained, is expected to have significant consequences for the long-termBP level.
The impact of the renal nerves on long-term BP control has been investigated by studyingthe consequences of renal denervation. Whereas comparison of chronic renal-denervatedand sham-operated animals has generally not revealed differences in the BP level undercontrol conditions, there have been several exceptions (55,56). In a recent comparison ofrenal-denervated and sham-operated rats, for example, renal denervation was associated withsignificantly (approx 8–10 mmHg) lower 24-h telemetered BP level (55). In hypertension,renal denervation has been shown to reduce the final level of BP achieved in several modelsincluding spontaneously hypertensive rats (57,58), obesity-induced hypertension in dogs(59), and phenol-induced hypertension (60,61). Renal denervation has been reported to pre-
56 Van Vliet and Montani
vent salt-loading hypertension in rabbits (62), and increases in BP caused by central infusionof angiotensin-II in rats maintained on a high salt diet (63), although it does not appear togreatly impact on salt-induced hypertension in the Dahl rat model (64,65). Renal denerva-tion was reported to reduce the final BP level in the two-kidney one-clip and one-kidneyone-clip rat Goldblatt model (66,67), although negative results for the one-kidney one-clipmodel have also been reported (68,69).
In addition to the role played by renal sympathetic fibers, renal afferent (sensory) fibersare thought to provide critical contributions in several models including the one-kidney one-clip Goldblatt hypertension (70) and phenol-induced hypertension models (60,61). It is no-table that in man, lumbar sympathectomy was employed for many years as a method withwhich to relieve hypertension. Although the surgery resulted in a pronounced initial de-crease in BP, follow-up studies demonstrated the effects to be poorly sustained (possiblybecause of reinnervation) and the approach was abandoned (71).
4. WHOLE BODY AUTOREGULATION
Whole body autoregulation is an important concept that explains the role of tissue bloodflow in setting the total peripheral resistance (TPR). The concept of blood flow autoregula-tion is most widely understood in the context of the local or regional circulations wherebymechanisms intrinsic to the tissue or organ make adjustments to the local vascular resistancesuch that: (a) blood flow occurs at a level that is appropriate for the metabolic needs of theorgan or tissue, and (b) this level of blood flow is held relatively constant despite moderateincreases or decreases in the perfusion pressure. Alternately, autoregulation can also be iden-tified as a positive correlation between an imposed change in BP or flow and the resultantchange in vascular resistance, the increase in resistance serving to restrain the increase inblood flow that would otherwise occur. Autoregulatory adjustments of local vascular resis-tance can be clearly demonstrated in isolated tissues (72) and, to some extent, even in iso-lated vessels (e.g., ref. 73). Although autoregulation is presumed to involve myogenic controlof the vascular smooth muscle in combination with feedback provided by local metabolism,metabolites, or oxygen delivery (74–76), the mechanisms contributing to blood flow auto-regulation vary from tissue to tissue and remain incompletely understood.
Because autoregulation influences the control of vascular resistance in virtually all tis-sues within the systemic circulation (it is absent in the pulmonary circulation), it is notsurprising that autoregulation should be evident in the pressure-resistance and flow-resis-tance relationships of the entire circulation. In dogs and rats in which reflexes and otherregulatory systems have been disabled, progressive expansion of the blood volume leads toincreases in cardiac output (CO) and BP, which are accompanied by an increase in the TPR,whereas withdrawal of blood leads to reductions in CO and BP that are accompanied by afall in TPR (76–81). Such changes in TPR reflect the underlying whole body autoregulationof blood flow: essentially the summation of the local autoregulatory efforts in differenttissues and organs to sustain local blood flow at a normal and appropriate level despitechanges in the BP.
Whole body autoregulation is not apparent during acute manipulations of BP or CO in thenormal circulation in which circulatory reflexes (e.g., baroreflexes) and other regulatory mecha-nisms remain intact (e.g., ref. 80). Indeed, in such circumstances, manipulations of BP or COlead to changes in TPR in the opposite direction, reflecting the dominance of other mecha-nisms, including the passive effects of BP on resistance vessels (e.g., increased distending pres-
Circulation and Fluid Volume Control 57
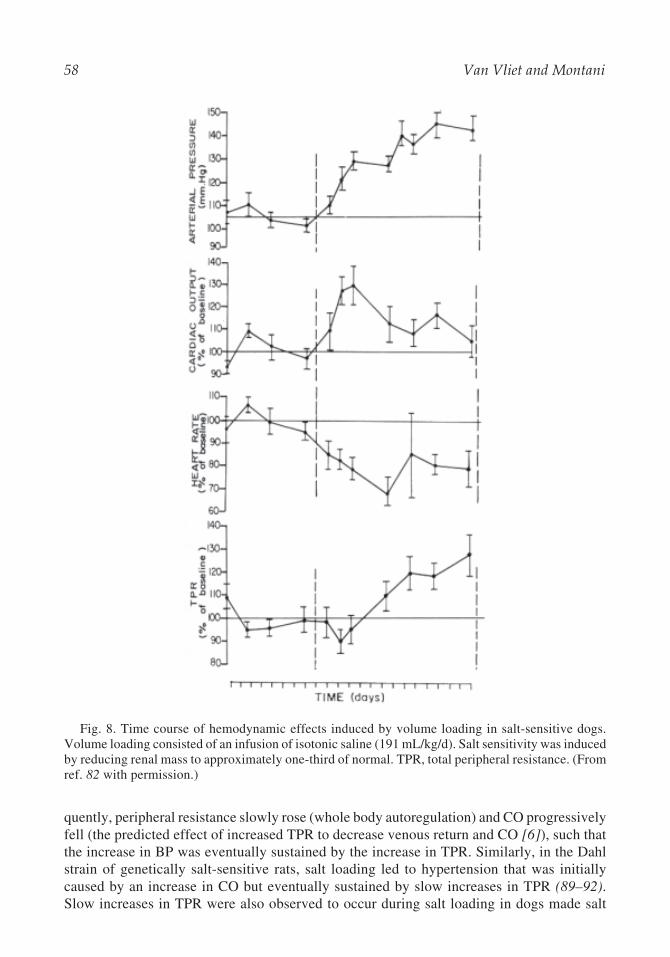
sure lowers resistance) and control mechanisms such as the baroreflex that adjust vascularresistance in an effort to hold BP near the normal level (e.g., elevated BP evoking reflex vasodi-lation). In time, however, local autoregulatory mechanisms become increasingly evident incirculatory control. In conscious, chronically instrumented dogs in which blood withdrawalwas used to lower BP by 25% for at least 8 h, whole body autoregulatory increases in TPRbecame apparent within 1 to 7 h following the reduction in BP (80). In dogs made salt sensitiveby reducing renal mass to 30% of normal, whole body autoregulatory adjustments of TPRslowly became apparent over several days of volume loading with saline (Fig. 8 [82,83]).
In considering the time course of whole body autoregulation, it is important to keep inmind that it is only one of a number of mechanisms that may simultaneously influence vas-cular resistance. At any point in time, the relationship between CO and TPR will reflect thesummation of the effects of mechanisms promoting a positive (e.g., autoregulation) vs nega-tive relationship (e.g., baroreflex, pressure-induced distension) in all the regions of the sys-tem circulation. Thus, the transition from negative to positive CO–TPR relationships reflectsthe shifting effectiveness of the underlying mechanisms, with autoregulation becoming moreeffective (and circulatory reflexes becoming less effective [4]), with time.
The precise contribution of whole body autoregulation in setting the long-term level ofTPR is difficult to assess for several reasons. First, as discussed previously, relationshipsbetween flow and resistance represent the net effect of a number of control mechanisms, notonly autoregulation. Second, the effectiveness of autoregulation and other phenomena af-fecting blood flow are often time-dependent. And third, because there is no selective way ofblocking autoregulation, the phenomena is difficult to manipulate experimentally. Despitethese limitations, several forms of indirect evidence suggest autoregulation is important insetting the long-term level of tissue blood flow and vascular resistance. In patients and ratsin which there is a narrowing (coarctation) of a segment of the aorta, the BP is considerablyhigher above the coarctation than it is below. Nevertheless, blood flow above and below thecoarctation are similar (84–86) suggesting that local autoregulatory mechanisms have thecapability of adjusting tissue blood flow to appropriate levels even in the face of large andchronic changes in the BP level. Such long-term forms of blood flow autoregulation appearto include a component of altered structural vascular resistance in which the number andcaliber of blood vessels is affected. Indeed, this may be the explanation for the increases instructural vascular resistance and rarefaction (87) of blood vessels in hypertension subjects,and for the normalizing of vascular resistance in regional vasculatures in which BP has beenlowered by restriction of the arterial supply (88).
5. WHOLE BODY AUTOREGULATION: IMPLICATIONSAND SIGNIFICANCE
The concept of whole body autoregulation of blood flow has several important implica-tions for circulatory control, which are briefly discussed next.
5.1. Autoregulation May Contribute to the Elevated Level of Vascular Resistancein Salt-Loading Hypertension
In studies of conscious, chronically instrumented dogs in which salt sensitivity was in-duced by reducing renal mass to 30% of normal (82,83), whole body autoregulation of TPRslowly became apparent over several days. As shown in Fig. 8, a sustained infusion of salineresulted in a prompt rise in BP that was initially mediated by an increase in CO (82). Subse-
58 Van Vliet and Montani
quently, peripheral resistance slowly rose (whole body autoregulation) and CO progressivelyfell (the predicted effect of increased TPR to decrease venous return and CO [6]), such thatthe increase in BP was eventually sustained by the increase in TPR. Similarly, in the Dahlstrain of genetically salt-sensitive rats, salt loading led to hypertension that was initiallycaused by an increase in CO but eventually sustained by slow increases in TPR (89–92).Slow increases in TPR were also observed to occur during salt loading in dogs made salt
Fig. 8. Time course of hemodynamic effects induced by volume loading in salt-sensitive dogs.Volume loading consisted of an infusion of isotonic saline (191 mL/kg/d). Salt sensitivity was inducedby reducing renal mass to approximately one-third of normal. TPR, total peripheral resistance. (Fromref. 82 with permission.)

Circulation and Fluid Volume Control 59
sensitive by a chronic infusion of angiotensin-II (93,94). In regular (i.e., salt-insensitive)dogs and in the Dahl strain of salt-resistant rats, although salt loading does not lead to anincrease in BP, it does produce an initial rise in CO counter-balanced by a fall in TPR(89,90,94). In time, CO and TPR returned to normal levels (89,91,92) as one might expect tooccur in the presence of whole body autoregulation but a normal (salt-insensitive) renalfunction curve.
Although a general discussion of the role of whole body autoregulation in essentiallyhypertension is well beyond the scope of this chapter, it is worth noting that a very slowtransition from elevated CO to elevated peripheral resistance has been described in a numberof longitudinal hemodynamic studies of patients with essential hypertension (see, e.g., Table1 in ref. 95). Thus, one view of the increased TPR that accompanies hypertension is that, asis the case with volume loading, it is an essential response to the elevated BP in order toprevent the over perfusion of the tissues that would otherwise occur. The precise mecha-nisms by which whole body autoregulation may occur remain to be worked out and stronglymerit further study.
5.2. Autoregulation Does Not Cause Long-Term Changes in BP or Hypertension
Because whole body autoregulation of blood flow is an important determinant of TPR,whole body autoregulation may be presumed to have an important effect on the long-termBP level. However, this is generally thought not to be the case. As discussed previously, theRBFFM is the dominant controller of the long-term BP level. As shown in Fig. 2, TPR (andtherefore autoregulation) lies outside of the main feedback loop of the RBFFM. Conse-quently, the RBFFM is expected to act to regulate the long-term BP level irrespective of thelevel of TPR. In other words, the RBFFM sets the long-term level of BP, the product of COand TPR; whole body autoregulation is simply responsible for adjusting the balance of COand TPR in a manner that provides an appropriate level of tissue perfusion.
5.3. Autoregulation Prevents the Large Changes in ECF Volume, Blood Volume,and Cardiac Output Otherwise Required to Achieve a Change in BP
Although whole body autoregulation of TPR does not directly influence the long-term BPlevel, it strongly influences which combination of TPR and CO will be used to achieve agiven BP level, and the extent of fluid accumulation required to achieve the increase in CO.To illustrate this role of whole body autoregulation, we have used Guyton’s large circulatorymodel to simulate the response to volume loading caused by a sixfold increase in salt intakein a salt-sensitive individual (caused by reduced renal mass) in the presence and absence ofblood-flow autoregulation (Figs. 9 and 10). The simulation demonstrates a valuable benefitof mathematical modeling: the ability to conduct experiments on the model that we (so far)have no way of conducting in real life.
In the presence of normal autoregulation (Fig. 9), a high level of salt intake leads to anincrease in fluid volumes (blood volume and ECF volume) associated with a rise in CO andBP and a fall in TPR (pressure-induced distension of the vasculature). In time, however,TPR progressively rises (whole body autoregulation), leading to reductions in the volumeloading and CO required to sustain the elevated BP level. Thus, in the long-term, the in-crease in salt intake leads to salt-sensitive hypertension with rather minor changes in fluidvolumes or cardiac output.
In contrast, Fig. 10 shows the results of the same simulation repeated with blood-flowautoregulation removed. In this situation, increases in fluid volumes, CO, and BP occur

60 Van Vliet and Montani
without any increase in TPR (which in fact falls, largely because of unopposed pressure-induced distension of the vasculature). In the absence of an increase in TPR, marked in-creases in fluid volumes and CO are required to elevate the BP toward the equilibrium level.Indeed, equilibrium is not achieved within the time course of this simulation: by the end of 1wk on salt, fluid volumes, CO, and BP continue to rise, and BP has not yet reached theequilibrium level that it achieved in the presence of autoregulation (Fig. 9).
This simulation illustrates that whole body autoregulation does more than ensure thatregional blood flow occurs at a rate that meets the metabolic needs of the tissues. When fluidvolumes are changed, it also serves to minimize the changes in fluid volume and cardiacoutput that are required to affect the long-term BP level. Because the ability of changes in
Fig. 9. Computer simulation of the hemodynamic response to volume loading in salt-sensitivesubjects with blood-flow autoregulation intact. The simulation was run using the 1992 version ofGuyton’s large circulatory model. Salt sensitivity was created by reducing renal mass to 30% ofnormal. Volume loading was commenced at time 0 by increasing salt intake to six times the normallevels. The progressive increase in total peripheral resistance (whole body autoregulation) slowlyreduces the volume loading and cardiac output required to sustain blood pressure at the new equilib-rium level.

Circulation and Fluid Volume Control 61
fluid volumes to affect BP lies at the heart of the RBFFM (Fig. 2), one can readily appreciatethe importance of whole body autoregulation in allowing the RBFFM to regulate the long-term BP level in a highly effective manner without the need for the large changes in fluidvolumes that would otherwise be necessary.
6. CONCLUSION
In this chapter we have touched on just two of the concepts that were developed andchampioned by Arthur C. Guyton, a founder of modern quantitative integrative physiology.Looking at the diagram of his large circulatory model (Fig. 1), it is hard to deny that hisapproach was integrative. However, perhaps the greatest evidence of his integrative approach
Fig. 10. Repeat of the computer simulation of the response to volume loading shown in Fig. 9 afterdisabling mechanisms of blood-flow autoregulation. In the absence of autoregulation, the rise inblood pressure induces a sustained fall in total peripheral resistance. Blood pressure does not reachthe new equilibrium level associated with the high salt intake during the course of the simulationdespite marked and progressive increases in fluid volumes and cardiac output.
62 Van Vliet and Montani
was its achievements: concepts and principles (e.g., Table 1) critical to the understanding ofthe system, yet largely unexpected from previous studies of the individual components.
Perhaps what we can take most from Guyton’s work is the understanding, even respect, forthe multitude of control mechanisms that are simultaneously at work in physiological sys-tems, with each mechanism providing a unique contribution to overall control. With this inmind, it is easy to understand Guyton’s emphasis on the need to consider the behavior ofentire systems (as systems do take on characteristics that are not apparent upon examinationof their components) and the use of a quantitative approach at all levels of physiologicalorganization (because not all control mechanisms are of equal importance, and because theimportance of individual mechanisms changes with time and circumstance). We hope thatsuch lessons will be helpful in advancing our understanding of physiological systems in thefuture.
REFERENCES
1. Brinson C. and Quinn J (1989) Arthur C. Guyton. His Life, His Family, His Achievements.Oakdale Press, Jackson, MI.
2. Hall, J.E., Cowley, A.W., Jr., Bishop, V.S., Granger, D.N., Navar, L.G. and Taylor, A.E. (2003)In Memoriam. Arthur C. Guyton (1919–2003). Physiologist 46, 126–128.
3. Quinn, J. (1989) Dr. A.C. Guyton: Builder. J. Miss. State Med. Assoc. 30(8):255–258.4. Guyton AC (1980) Circulatory Physiology III. Arterial Pressure and Hypertension. WB Saunders,
Toronto.5. Guyton, A.C., Coleman, T.G. and Granger, H.J. (1972) Circulation: Overall regulation. Ann.
Rev. Physiol. 34:13–46.6. Guyton, A.C., Jones, C.E. and Coleman, T.G. (1973) Circulatory Physiology: Cardiac Output
and Its Regulation, 2nd edition. WB Saunders, Philadelphia.7. Guyton, A.C., Taylor, A.E. and Granger, H.J. (1975) Circulatory Physiology II: Dynamics and
Control of the Body Fluids. WB Saunders, Philadelphia.8. Simanonok, K.E., Srinivasan, R.S., Myrick, E.E., Blomkalns, A.L. and Charles, J.B. (1994) A
comprehensive Guyton model analysis of physiologic responses to preadapting the blood vol-ume as a countermeasure to fluid shifts. J. Clin. Pharmacol. 34(5):440–453.
9. Srinivasan, R.S., Simanonok, K.E., Fortney, S.M. and Charles, J.B. (1993) Simulation of thefluid retention effects of a vasopressin analog using the Guyton model of circulation. Physiolo-gist 36(1 Suppl):S114–S115.
10. Selkurt, E.E. (1951) Effect of pulse pressure and mean arterial pressure on modification on renalhaemodynamics and electrolyte water excretion. Circulation 4:541–551.
11. Starling, E.H. and Verney, E.B. (1924–1925) The excretion of urine as studied in the isolatedkidney. Proc. R. Soc. Lond. 97:321–363.
12. Evans, R.G., Szenasi, G. and Anderson, W.P. (1995) Effects of N-nitro-l-arginine on pressurenatriuresis in anesthetized rabbits. Clin. Exp. Pharmacol. Physiol. 22:94–101.
13. Nafz, B., Ehmke, H., Wagner, C.D., Kirchheim, H.R. and Persson, P.B. (1998) Blood pressurevariability and urine flow in the conscious dog. Am. J. Physiol. Renal Physiol. 274:F680–F686.
14. Cowley, A.W., Jr. (1992) Long-term control of arterial blood pressure. Physiol. Rev. 72:231–300.15. Granger, J.P., Alexander, B.T. and Llinas, M (2002) Mechanisms of pressure natriuresis. Curr.
Hypertens. Rep. 4:152–15916. Hall, J.E. (1991) The renin-angiotensin system: renal actions and blood pressure regulation.
Compr. Ther. 17:8–17.17. Hall, J.E., Guyton, A.C. and Mizelle, H.L. (1990) Role of the renin-angiotensin system in con-
trol of sodium excretion and arterial pressure. Acta Physiol. Scand. Suppl. 1990;591:48–62.
Circulation and Fluid Volume Control 63
18. Montani, J.P. and VanVliet, B.N. (2004) General Physiology and Pathophysiology of the Renin-Angiotensin System. In Handbook of Experimental Pharmacology, Volume 163/1: Angiotensin(Thomas Unger and Bernward A. Schölkens, Eds.), Springer Verlag, Berlin, pp. 3–29.
19. Grisk, O. and Rettig, R. (2001) Renal transplantation studies in genetic hypertension. NewsPhysiol. Sci. 16:262–265.
20. Rettig, R. (1993) Does the kidney play a role in the aetiology of primary hypertension? Evidencefrom renal transplantation studies in rats and humans. J. Hum. Hypertens. 7(2):177–180.
21. Rettig, R., Bandelow, N., Patschan, O., Kuttler, B., Frey, B. and Uber, A. (1996) The importanceof the kidney in primary hypertension: insights from cross-transplantation. J. Hum. Hypertens.10(10):641–644.
22. Grisk, O., Klöting, I., Exner, J., et al. (2002) Long-term arterial pressure in spontaneously hyper-tensive rats is set by the kidney. J. Hypertens. 20:131–138.
23. Botero-Velez, M., Curtis, J.J. and Warnock, D.G. (1994) Liddle’s syndrome revisited—a disor-der of sodium reabsorption in the distal tubule. N. Eng. J. Med. 330:178–181.
24. Guidi, E., Menghetti, D., Milani, S., Montagnino, G., Palazzi, P. and Bianchi, G. (1996) Hyper-tension may be transplanted with the kidney in humans: a long-term historical prospective fol-low-up of recipients grafted with kidneys coming from donors with or without hypertension intheir families. J. Am. Soc. Nephrol. 7(8):1131–1138.
25. Churchill, P.C., Churchill, M.C., Bidani, A.K. and Kurtz, T.W. (2001) Kidney-specific chromo-some transfer in genetic hypertension: The Dahl hypothesis revisited. Kidney International60:705–714.
26. Clemitson, J-R., Pratt, J.R., Frantz, S., Sacks, S. and Samani, N.J. (2002) Kidney specificity ofrat chromosome 1 blood pressure quantitative trait locus region. Hypertens. 40:292–297.
27. Strazzullo, P., Galletti, F. and Barba, G. (2003) Altered renal handling of sodium in humanhypertension. Short review of the evidence. Hypertens. 41:1000–1005.
28. Luft, F.C. (2000) Molecular genetics of human hypertension. Curr. Opin. Nephrol. Hypertens.9:259–266.
29. Meneton, P., Oh, Y.S. and Warnock, D.G. (2001) Genetic renal tubular disorders of renal ionchannels and transporters. Semin. Nephrol. 21:81–93.
30. Warnock, D.G. (2001) Genetic forms of human hypertension. Curr. Opin. Nephrol. Hypertens.10:493–499.
31. Reinhart, G.A., Lohmeier, T.E. and Hord, C.E., Jr. (1995) Hypertension induced by chronicrenal adrenergic stimulation. Is angiotensin dependent. Hypertens. 25:940–949.
32. Mattson, D.L., Lu, S., Nakanishi, K., Papanek, P.E. and Cowley, A.C. (1994) Effect of chronicrenal medullary nitric oxide inhibition on blood pressure. Am. J. Physiol. Heart Circ. Physiol.266:H1918–H1926.
33. Smallegange, C., Kline,R.L. and Adams, M.A. (2003) Transplantation of enalapril-treated kid-neys confers persistent lowering of arterial pressure in SHR. Hypertens. 42(5):932–936.
34. Hall, J.E., Mizelle, H.L., Hildebrandt, D.A. and Brands, M.W. (1990) Abnormal pressure natri-uresis. A cause or a consequence of hypertension? Hypertens. 15:547–559.
35. Guyton, A.C. (1990) Long-term arterial pressure control: an analysis from animal experimentsand computer and graphic models. Am. J. Physiol. 259 (Regulatory Integrative Comp Physiol28):R865–R877.
36. Huang, M., Hester, R.L. and Guyton, A.C. (1992) Hemodynamic changes in rats after openingan arteriovenous fistula. Am. J. Physiol. 262:H846–H851.
37. Huang, M., Hester, R.L., Guyton, A.C. and Norman, R.A., Jr. (1992) Hemodynamic studies inDOCA-salt hypertensive rats after opening of an arteriovenous fistula. Am. J. Physiol. HeartCirc. Physiol. 262:H1802–H1808.
38. Guyton, A.C. (1988) Hypertenion. A neural disease? Arch. Neurol. 45:178.39. DiBona, G.F. and Kopp, U.C. (1997) Neural control of renal function. Physiol. Rev. 77:75–197.

64 Van Vliet and Montani
40. DiBona, G.F. (2002) Sympathetic nervous system and the kidney in hypertension. Curr. Opin.Nephrol. Hypertens. 11:197–200.
41. Van Vliet, B.N., Smith, M.J. and Guyton, A.C. (1991) The time course of renal responses togreater splanchnic nerve stimulation. Am. J. Physiol. 260:R894–R905.
42. Ehmke, H., Persson, P.B., Seyfarth, M. and Kirchheim, H.R. (1990) Neurogenic control of pres-sure natriuresis in conscious dogs. Am. J. Physiol. 259:F466–F473.
43. Golin, R., Genovesi, S. and Castoldi, G., et al. (1999) Role of the renal nerves and angiotensin IIin the renal function curve. Archiv Ital. Biol. 137:289–297.
44. Steele, J.E., Koch, L.G. and Brand, P.H. (2000) State-dependent expression of pressure diuresisin conscious rats. PSEBM 224:109–115.
45. Brand, P.H., Coyne, K.B., Kostrzewski, K.A., Shier, D., Metting, P.J. and Britton, S.L. (1991)Pressure diuresis and autonomic function in conscious dogs. Am. J. Physiol. 261:R802–R810.
46. Peterson, T.V., Benjamin, B.A. and Hurst, N.L. (1988) Renal nerves and renal responses tovolume expansion in conscious monkeys. Am. J. Physiol. 255:R388–R394.
47. Peterson, T.V., Benjamin, B.A., Hurst, N.L. and Euler, C.G. (1991) Renal nerves and postpran-dial renal excretion in the conscious monkey. Am. J. Physiol. 261:R1197–R1203.
48. Sadowski, J., Kurkus, J. and Gellert, R. (1979) Denervated and intact kidney responses to salineload in awake and anesthetized dogs. Am. J. Physiol. 237:F262–F267.
49. Smith, F.G., Sato, T., McWeeny, O.L., Torres, L. and Robillard, J.E. (1989) Role of renalnerves in response to volume expansion in conscious newborn lambs. Am. J. Physiol.257:R1519–R1525.
50. Lohmeier, T.E., Hildebrandt, D.A. and Hood, W.A. (1999) Renal nerves promote sodium excre-tion during long-term increases in salt intake. Hypertens. 33:487–492.
51. Lohmeier, T.E., Lohmeier, J.R., Reckelhoff, J.F. and Hildebrandt, D.A. (2001) Sustained influ-ence of the renal nerves to attenuate sodium retention in angiotensin hypertension. Am. J. Physiol.Regulatory Integrative Comp. Physiol. 281:R434–R443.
52. Mizelle, H.L., Hall, J.E. and Woods, L.L. (1988) Interactions between angiotensin II and renalnerves during chronic sodium deprivation. Am. J. Physiol. 255, F823–F827.
53. Mizelle, H.L., Hall, J.E., Woods, L.L., Montani, J–.P., Dzielak, D.J. and Pan, Y.–J. (1987) Roleof renal nerves in compensatory adaptation to chronic reductions in sodium intake. Am. J. Physiol.252, F291–F298.
54. Mizelle, H.L., Hall, J.E. and Montani, J–.P. (1989) Role of renal nerves in control of sodiumexcretion in chronic congestive heart failure. Am. J. Physiol. 256, F1084–F1093.
55. Jacob. F., Ariza, P. and Osborn JW (2003) Renal denervation chronically lowers arterial pres-sure independent of dietary sodium intake in normal rats. Am. J. Physiol. Heart. Circ. Physiol.284:H2302–H2310.
56. Janssen, B.J., van Essen, H., Vervoort-Peters, L.H., et al. (1989) Effects of complete renal dener-vation and selective afferent renal denervation on the hypertension induced by intrarenal norepi-nephrine infusion in conscious rats. J. Hypertens. 7:447–455.
57. Norman, R.A. Jr. and Dzielak, D.J. (1982) Role of renal nerves in onset and maintenance ofspontaneous hypertension. Am. J. Physiol. 243:H284–H288.
58. Säynävälammi, P., Vaalasti, A., Pyykönen, M.–L., Ylitalo, P. and Vapaatalo, H. (1982) Theeffect of renal sympathectomy on blood pressure and plasma renin activity in spontaneouslyhypertensive and normotensive rats. Acta Physiol. Scand. 115:289–293.
59. Kassab, S., Kato, T., Wilkins, F.C., Chen, R., Hall, J.E. and Granger, J.P. (1995) Renal denerva-tion attenuates the sodium retention and hypertension associated with obesity. Hypertens.25:893–897.
60. Ye, S., Gamburd, M., Mozayeni, P., Koss, M. and Campese, V.M. (1998) A limited renal injurymay cause a permanent form of neurogenic hypertension. Am. J. Hypertens. 11:723–728.
61. Ye, S., Ozgur, B. and Campese, V.M. (1997) Renal afferent impulses, the posterior hypothala-mus, and hypertension in rats with chronic renal failure. Kidney Int. 51(3):722–727.

Circulation and Fluid Volume Control 65
62. Weinstock, M., Gorodetsky, E. and Kalman, R. (1996) Renal denervation prevents sodium re-tention and hypertension in salt-sensitive rabbits with genetic baroreflex impairment. ClinicalScience 90:287–293.
63. Osborn, J.L. and Camara, A.K.S. (1997) Renal neurogenic mediation of intracerebroventricularangiotensin II hypertension in rats raised on high sodium chloride diet. Hypertens. 30(pt1):331–336.
64. Osborn, J.L., Roman, R.J. and Ewens, J.D. (1988) Renal nerves and the development of Dahlsalt-sensitive hypertension. Hypertens. 11:523–528.
65. Wyss, J.M., Sripairojthikoon, W. and Oparil, S. (1987) Failure of renal denervation to attenuatehypertension in Dahl NaCl-sensitive rats. Can. J. Physiol. Pharmacol. 65:2428–2432.
66. Katholi, R.E., Whitlow, P.L., Winternitz, S.R. and Oparil, S. (1982) Importance of the renalnerves in established two-kidney, one clip goldblatt hypertension. Hypertens. 4(Suppl. 2):II–166– II–174.
67. Katholi, R.E., Winternitz, S.R. and Oparil, S. (1981) Role of the renal nerves in the pathogenesisof one-kidney renal hypertension in the rat. Hypertens. 3:404–409
68. Norman, R.A., Jr., Murphy, W.R., Dzielak, D.J., Khraibi, A.A. and Carroll, R.G. (1984) Role ofthe renal nerves in one-kidney, one clip hypertension in rats. Hypertens. 6:622–626.
69. Villarreal, D., Freeman, R.H., Davis, J.O., Garoutte, G. and Sweet, W.D. (1984) Pathogenesis ofone-kidney, one-clip hypertension in rats after renal denervation. Am. J. Physiol. 247:H61–H66.
70. Wyss, J.M., Aboukarsh, N. and Oparil, S. (1986) Sensory denervation of the kidney attenuatesrenovascular hypertension in the rat. Am. J. Physiol. 250:H82–H86.
71. Smithwick, R.H. (1951) Hypertensive cardiovascular disease: The effect of thoracolumbarsplanchnicetomy upon mortality and survival rates. JAMA 147:1611 – 1615.
72. Walker, J.R. and Guyton, A.C. (1967) Influence of blood oxygen saturation on pressure-flowcurve of dog hindlimb. Am. J. Physiol. 212:506–509.
73. Davis, M.J. and Hill, M.A. (1999) Signaling mechanisms underlying the vascular myogenicresponse. Physiol. Rev. 79:387–423.
74. Borgstrom, P. and Gestrelius, S. (1987) Integrated myogenic and metabolic control of vasculartone in skeletal muscle during autoregulation of blood flow. Microvasc. Res. 33:353–376.
75. Borgstrom, P., Grande, P.O. and Mellander, S. (1984) An evaluation of the metabolic interactionwith myogenic vascular reactivity during blood flow autoregulation. Acta Physiol. Scand.122:275–284.
76. Morff, R.J. and Granger, H.J. (1982) Autoregulation of blood flow within individual arterioles inthe rat cremaster muscle. Circ. Res. 51(1):43–55. 77. Granger, H.J. and Guyton, A.C. (1969)Autoregulation of the total systemic circulation following destruction of the central nervous sys-tem. Circ. Res. 25:379–388.
78. Hinojosa-Laborde, C., Greene, A.S. and Cowley, A.W., Jr. (1988) Autoregulation of the sys-temic circulation in conscious rats. Hypertens. 11:685–691.
79. Liedtke, A.J., Urschel, C.W. and Kirk, E.S. (1973) Total systemic autoregulation in the dog andits inhibition by baroreceptor reflexes. Circ. Res. 32:673–677.
80. Metting, P.J., Strader, J.R. and Britton, S.L. (1988) Evaluation of whole body autoregulation inconscious dogs. Am. J. Physiol. 255:H44–H52.
81. Shepherd, A.P., Granger, H.J., Smith, E.E. and Guyton, A.C. (1973) Local control of tissue oxy-gen delivery and its contribution to the regulation of cardiac output. Am. J. Physiol. 225:747–755.
82. Coleman, T.G. and Guyton, A.C. (1969) Hypertension caused by salt loading in the dog. III.Onset transients of cardiac output and other circulatory variables. Circ. Res. 25:153–160.
83. Manning, R.D., Jr., Coleman, T.G., Guyton, A.C., Norman, R.A., Jr., McCaa, R.E. (1979)Essential role of mean circulatory filling pressure in salt-induced hypertension. Am. J. Physiol.236:R40–R47.
84. Patterson, G.C., Shepherd, J.T. and Whelan, R.F. (1957) The resistance to blood flow in theupper and lower limb vessels in patients with coarctation of the aorta. Clin. Sci. 16:627–632.
66 Van Vliet and Montani
85. Stanek, K.A., Coleman, T.G. and Murphy, W.R. (1987) Overall hemodynamic pattern in coarc-tation of the abdominal aorta in conscious rats. Hypertens. 9:611–618.
86. Wakim, K.G., Slaughter, O. and Clagett, O.T. (1948) Studies of the blood flow in the extremitiesin cases of coarctation of the aorta: determinations before and after excision of the coarctateregion. Mayo Clin. Proc. Staff Meetings 23:347–351.
87. Struijker Boudier, H.A., le Noble, J.L., Messing, M.W., Huijberts, M.S., le Noble, F.A. and vanEssen, H. (1992) The microcirculation and hypertension. J. Hypertens. Suppl. 10:S147–S156.
88. Folkow, B., Gurevich, M., Hallback, M., Lundgren, Y. and Weiss, L. (1971) The hemodynamicconsequences of regional hypotension in spontaneously hypertensive and normotensive rats. ActaPhysiol. Scand. 83:532–541.
89. Gangluli, M., Tobian, L. and Iwai, J. (1979) Cardiac output and peripheral resistance in strains ofrats sensitive and resistant to NaCl hypertension. Hyperten. 1:3–7.
90. Greene, A.S., Yu, Y., Roman, R.J. and Cowley, A.W. (1990) Role of blood volume expansion inDahl rat model of hypertension. Am. J. Physiol. (Heart Circ Physiol) 258:H508–H514.
91. Pfeffer, M.A., Pfeffer, J., Mirsky, I. and Iwai, J. (1984) Cardiac hypertrophy and performance ofDahl hypertensive rats on graded salt diets. Hypertens. 6:475–481.
92. Simchon, S., Manger, W.M. and Brown, T.W. (1991) Dual hemodynamic mechanisms for salt-induced hypertension in Dahl salt-sensitive rats. Hypertens. 17:1063–1071.
93. Krieger, J.E. and Cowley, A.W., Jr. (1990) Prevention of salt angiotensin II hypertension byservo control of body water. Am. J. Physiol. Heart Circ. Physiol. 258:H994–H1003.
94. Krieger, J.E., Liard, J-F. and Cowley, A.W., Jr. (1990) Hemodynamics, fluid volume, and hor-monal responses to chronic high salt intake in dogs. Am. J. Physiol. Heart Circ. Physiol.259:H1629–H1636.
95. Lund-Johansen, P. (1986) Hemodynamic patterns in the natural history of borderline hyperten-sion. J. Cardiovasc. Pharmacol. 8 (Suppl 5):S8–S14.
96. Van Vliet, B.N., Lohmeier, T.E., Mizelle, L. and Hall, J.E. (1996) The Kidney. In: NervousControl of Blood Vessels. The Autonomic Nervous System, Vol. 8. (T. Bennet and S. Gardiner,Eds.). Harwood Academic Publishers, London, pp. 371–433.