Circulating Tumor DNA Genomics Correlate with Resistance ... · Circulating Tumor DNA Genomics...
15
444 | CANCER DISCOVERY APRIL 2018 www.aacrjournals.org Circulating Tumor DNA Genomics Correlate with Resistance to Abiraterone and Enzalutamide in Prostate Cancer Matti Annala 1,2 , Gillian Vandekerkhove 1 , Daniel Khalaf 3 , Sinja Taavitsainen 2 , Kevin Beja 1 , Evan W. Warner 1 , Katherine Sunderland 3 , Christian Kollmannsberger 3 , Bernhard J. Eigl 3 , Daygen Finch 4 , Conrad D. Oja 5 , Joanna Vergidis 6 , Muhammad Zulfiqar 7 , Arun A. Azad 8 , Matti Nykter 2 , Martin E. Gleave 1 , Alexander W. Wyatt 1 , and Kim N. Chi 1,3 RESEARCH ARTICLE ABSTRACT Primary resistance to androgen receptor (AR)–directed therapies in metastatic castration-resistant prostate cancer (mCRPC) is poorly understood. We randomized 202 patients with treatment-naïve mCRPC to abiraterone or enzalutamide and performed whole-exome and deep targeted 72-gene sequencing of plasma cell-free DNA prior to therapy. For these agents, which have never been directly compared, time to progression was similar. Defects in BRCA2 and ATM were strongly associated with poor clinical outcomes independently of clinical prognostic factors and circulating tumor DNA abundance. Somatic alterations in TP53, previously linked to reduced tumor dependency on AR signaling, were also independently associated with rapid resistance. Although detection of AR amplifications did not outperform standard prognostic biomarkers, AR gene structural rearrangements truncating the ligand binding domain were identified in several patients with primary resistance. These findings establish genomic drivers of resistance to first-line AR-directed therapy in mCRPC and identify potential minimally invasive biomarkers. SIGNIFICANCE: Leveraging plasma specimens collected in a large randomized phase II trial, we report the relative impact of common circulating tumor DNA alterations on patient response to the most widely used therapies for advanced prostate cancer. Our findings suggest that liquid biopsy analysis can guide the use of AR-targeted therapy in general practice. Cancer Discov; 8(4); 444–57. ©2018 AACR. See related commentary by Jayaram et al., p. 392. 1 Vancouver Prostate Centre, Department of Urologic Sciences, University of British Columbia, Vancouver, British Columbia, Canada. 2 Faculty of Med- icine and Life Sciences and Biomeditech Institute, University of Tampere, Tampere, Finland. 3 British Columbia Cancer Agency, Vancouver Centre, Van- couver, British Columbia, Canada. 4 British Columbia Cancer Agency, South- ern Interior Centre, Kelowna, British Columbia, Canada. 5 British Columbia Cancer Agency, Fraser Valley Centre, Vancouver, British Columbia, Canada. 6 British Columbia Cancer Agency, Vancouver Island Centre, Victoria, British Columbia, Canada. 7 British Columbia Cancer Agency, Abbotsford Centre, Vancouver, British Columbia, Canada. 8 Monash University, Monash, Australia. Note: Supplementary data for this article are available at Cancer Discovery Online (http://cancerdiscovery.aacrjournals.org/). A.W. Wyatt and K.N. Chi share senior authorship of this article. Corresponding Authors: Alexander W. Wyatt, University of British Colum- bia, 2660 Oak Street, Vancouver, BC V6H 3Z6, Canada. Phone: 604- 364-1940; Fax: 604-675-8019; E-mail: [email protected]; and K.N. Chi, Vancouver Prostate Centre, Department of Urologic Sciences, University of British Columbia, 2660 Oak Street, Vancouver, BC V6H 3Z6, Canada. Phone: 604-875-4818; Fax: 604-875-5654; E-mail: kchi@ bccancer.bc.ca doi: 10.1158/2159-8290.CD-17-0937 ©2018 American Association for Cancer Research. INTRODUCTION Recent years have seen a dramatic shift in the treatment of metastatic castration-resistant prostate cancer (mCRPC) with the potent androgen receptor (AR)–directed agents abirater- one acetate and enzalutamide currently indicated as first-line therapy (1, 2). Enzalutamide is a direct AR antagonist, whereas abiraterone depletes endogenous AR ligands through inhibi- tion of CYP17-mediated steroidogenesis. These agents have not been directly compared in a clinical trial, and predictive Research. on March 23, 2020. © 2018 American Association for Cancer cancerdiscovery.aacrjournals.org Downloaded from Published OnlineFirst January 24, 2018; DOI: 10.1158/2159-8290.CD-17-0937
Transcript of Circulating Tumor DNA Genomics Correlate with Resistance ... · Circulating Tumor DNA Genomics...
444 | CANCER DISCOVERY APRIL 2018 www.aacrjournals.org
Circulating Tumor DNA Genomics Correlate with Resistance to Abiraterone and Enzalutamide in Prostate Cancer Matti Annala1,2, Gillian Vandekerkhove1, Daniel Khalaf3, Sinja Taavitsainen2, Kevin Beja1, Evan W. Warner1, Katherine Sunderland3, Christian Kollmannsberger3, Bernhard J. Eigl3, Daygen Finch4, Conrad D. Oja5, Joanna Vergidis6, Muhammad Zulfiqar7, Arun A. Azad8, Matti Nykter2, Martin E. Gleave1, Alexander W. Wyatt1, and Kim N. Chi1,3
RESEARCH ARTICLE
ABSTRACT Primary resistance to androgen receptor (AR)–directed therapies in metastatic castration-resistant prostate cancer (mCRPC) is poorly understood. We randomized
202 patients with treatment-naïve mCRPC to abiraterone or enzalutamide and performed whole-exome and deep targeted 72-gene sequencing of plasma cell-free DNA prior to therapy. For these agents, which have never been directly compared, time to progression was similar. Defects in BRCA2 and ATM were strongly associated with poor clinical outcomes independently of clinical prognostic factors and circulating tumor DNA abundance. Somatic alterations in TP53, previously linked to reduced tumor dependency on AR signaling, were also independently associated with rapid resistance. Although detection of AR amplifications did not outperform standard prognostic biomarkers, AR gene structural rearrangements truncating the ligand binding domain were identified in several patients with primary resistance. These findings establish genomic drivers of resistance to first-line AR-directed therapy in mCRPC and identify potential minimally invasive biomarkers.
SIGNIFICANCE: Leveraging plasma specimens collected in a large randomized phase II trial, we report the relative impact of common circulating tumor DNA alterations on patient response to the most widely used therapies for advanced prostate cancer. Our findings suggest that liquid biopsy analysis can guide the use of AR-targeted therapy in general practice. Cancer Discov; 8(4); 444–57. ©2018 AACR.
See related commentary by Jayaram et al., p. 392.
1Vancouver Prostate Centre, Department of Urologic Sciences, University of British Columbia, Vancouver, British Columbia, Canada. 2Faculty of Med-icine and Life Sciences and Biomeditech Institute, University of Tampere, Tampere, Finland. 3British Columbia Cancer Agency, Vancouver Centre, Van-couver, British Columbia, Canada. 4British Columbia Cancer Agency, South-ern Interior Centre, Kelowna, British Columbia, Canada. 5British Columbia Cancer Agency, Fraser Valley Centre, Vancouver, British Columbia, Canada. 6British Columbia Cancer Agency, Vancouver Island Centre, Victoria, British Columbia, Canada. 7British Columbia Cancer Agency, Abbotsford Centre, Vancouver, British Columbia, Canada. 8Monash University, Monash, Australia.Note: Supplementary data for this article are available at Cancer Discovery Online (http://cancerdiscovery.aacrjournals.org/).
A.W. Wyatt and K.N. Chi share senior authorship of this article.Corresponding Authors: Alexander W. Wyatt, University of British Colum-bia, 2660 Oak Street, Vancouver, BC V6H 3Z6, Canada. Phone: 604-364-1940; Fax: 604-675-8019; E-mail: [email protected]; and K.N. Chi, Vancouver Prostate Centre, Department of Urologic Sciences, University of British Columbia, 2660 Oak Street, Vancouver, BC V6H 3Z6, Canada. Phone: 604-875-4818; Fax: 604-875-5654; E-mail: [email protected]: 10.1158/2159-8290.CD-17-0937©2018 American Association for Cancer Research.
INTRODUCTION
Recent years have seen a dramatic shift in the treatment of metastatic castration-resistant prostate cancer (mCRPC) with the potent androgen receptor (AR)–directed agents abirater-
one acetate and enzalutamide currently indicated as first-line therapy (1, 2). Enzalutamide is a direct AR antagonist, whereas abiraterone depletes endogenous AR ligands through inhibi-tion of CYP17-mediated steroidogenesis. These agents have not been directly compared in a clinical trial, and predictive
Research. on March 23, 2020. © 2018 American Association for Cancercancerdiscovery.aacrjournals.org Downloaded from
Published OnlineFirst January 24, 2018; DOI: 10.1158/2159-8290.CD-17-0937
APRIL 2018 CANCER DISCOVERY | 445
biomarkers for the 20% of first-line patients who exhibit pri-mary or rapidly acquired resistance are lacking.
The abundance of plasma circulating tumor DNA (ctDNA) in patients with mCRPC has invigorated biomarker development previously hampered by the impracticality of routinely sampling osseous metastatic tissue. Using so-called liquid biopsies, primary and acquired resistance to AR-tar-geted therapy has been linked to amplification or mutation of the AR gene (3–7) and also to the expression (in circulat-ing tumor cells) of truncated AR splice variants that display ligand-independent activity (8, 9). The impact of these bio-markers in patients with first-line mCRPC has not been ade-quately studied, and it is unclear whether the detection of AR alterations in patient ctDNA can outperform standard clini-cal prognostic factors. The relative impact of other genomic alterations on resistance and patient outcomes also remains to be elucidated in standardized clinical cohorts.
Here, we applied a combination of whole-exome and/or deep targeted sequencing to perform an opportunistic explora-tory analysis of plasma-derived cell-free DNA (cfDNA) sam-ples from 202 patients with first-line mCRPC enrolled in a randomized phase II trial of abiraterone versus enzalutamide (NCT02125357). We propose new genomic drivers of resist-ance to AR-directed therapy and show that cfDNA sequenc-ing provides a practical means for assaying these potential treatment-guiding biomarkers.
RESULTSEnzalutamide Elicits Superior PSA Responses but No Difference in Progression-Free Survival
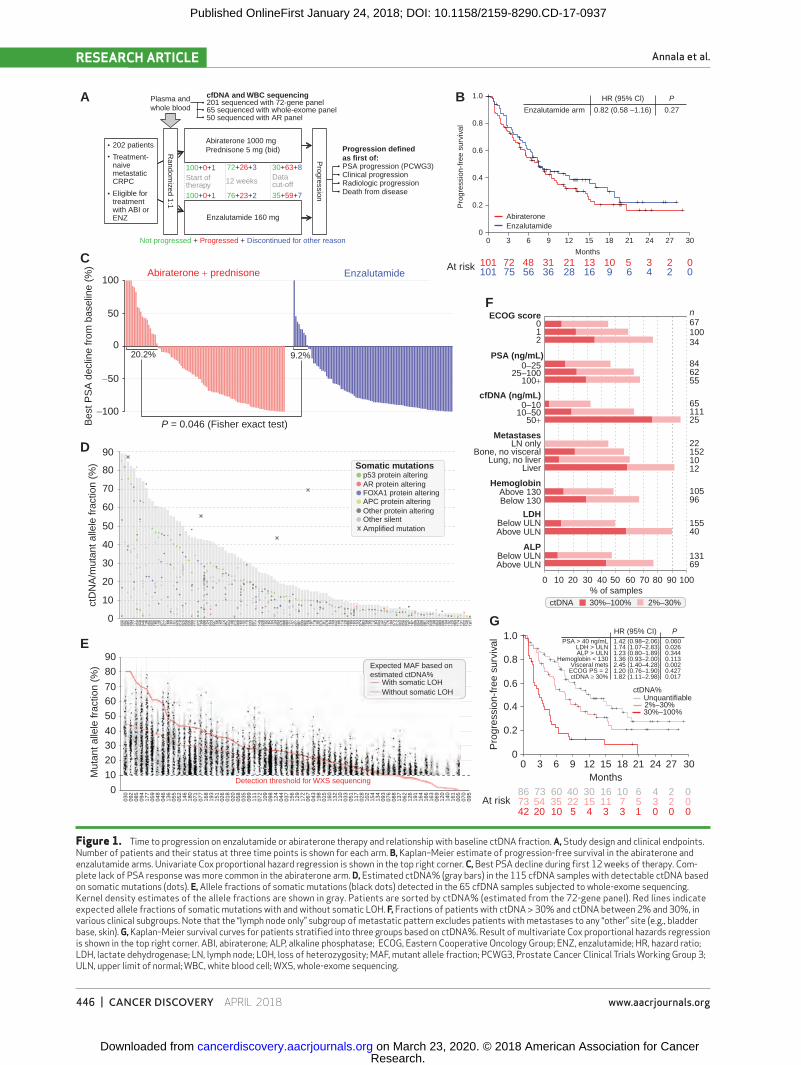
Two hundred two patients with treatment-naïve mCRPC were randomized to abiraterone plus prednisone (n = 101) or enzalutamide (n = 101) between November 2014 and October 2016 (Fig. 1A; Supplementary Table S1). Median follow-up at time of analysis was 12.9 months (range, 0–32.1 months). Baseline characteristics were similar between arms, except for age (Table 1). Time to progression [TTP; first of con-firmed prostate-specific antigen (PSA) progression, clinical or radiologic progression, or death from disease] did not dif-fer between arms (median 7.5 vs. 7.5 months, HR = 0.82 for enzalutamide; 95% CI, 0.58–1.16, P = 0.27, univariate; Fig. 1B). However, enzalutamide achieved greater PSA responses than abiraterone, including a higher proportion of patients with PSA decline ≥ 50% from baseline within 12 weeks (75% vs. 54%, P = 0.004, Fisher exact test), and a lower proportion of patients with rising PSA as best response within the first 12 weeks of therapy (9% vs. 20%, P = 0.046, Fisher exact test; Fig. 1C).
ctDNA Fraction Is Associated with Tumor Burden and Clinical Outcomes
The majority of patients with mCRPC studied to date have plasma ctDNA fractions (ctDNA%, the proportion of
Research. on March 23, 2020. © 2018 American Association for Cancercancerdiscovery.aacrjournals.org Downloaded from
Published OnlineFirst January 24, 2018; DOI: 10.1158/2159-8290.CD-17-0937
Annala et al.RESEARCH ARTICLE
446 | CANCER DISCOVERY APRIL 2018 www.aacrjournals.org
A Plasma andwhole blood
Random
ized 1:1
Progression
202 patients
Treatment-naivemetastaticCRPC
Eligible fortreatmentwith ABI orENZ
cfDNA and WBC sequencing
Progression definedas first of:
Death from diseaseRadiologic progressionClinical progressionPSA progression (PCWG3)
1.0
100
50
−50
−100
0
90Somatic mutations
p53 protein alteringAR protein alteringFOXA1 protein alteringAPC protein alteringOther protein alteringOther silentAmplified mutation
Expected MAF based onestimated ctDNA%
With somatic LOHWithout somatic LOH
80
70
60
50
40
30
20
10
0
90
80
7060
50
Mut
ant a
llele
frac
tion
(%)
Bes
t PS
A d
eclin
e fr
om b
asel
ine
(%)
ctD
NA
/mut
ant a
llele
frac
tion
(%)
4030
20
10
0
030
092
094
085
177
059
048
046
136
055
052
180
146
071
077
168
193
151
026
018
020
058
035
099
111
072
109
098
124
044
037
156
129
172
067
043
198
015
160
132
110
033
051
117
028
102
154
134
093
076
088
137
062
126
191
164
166
163
069
120
140
161
005
070
095
20.2% 9.2%
P = 0.046 (Fisher exact test)
0.8
0.6
0.4
0.2
Abiraterone
Months
0 3 6 9 12 15 18 21 24 27 30
Enzalutamide
At risk
ECOG score n6710034
846255
6511125
221521012
105
15540
13169
96
PSA (ng/mL)
cfDNA (ng/mL)
0–2525–100
100+
0–1010–50
50+
MetastasesLN only
Bone, no visceralLung, no liver
Liver
HemoglobinAbove 130Below 130
LDHBelow ULNAbove ULN
ALPBelow ULNAbove ULN
0
1.0 HR (95% CI)PSA > 40 ng/mL 0.060
0.0260.3440.1130.0020.4270.017
1.74 (1.07–2.83)1.42 (0.98–2.06)
1.23 (0.80–1.89)1.36 (0.93–2.00)2.45 (1.40–4.28)1.20 (0.76–1.90)1.82 (1.11–2.98)
LDH > ULNALP > ULN
Hemoglobin < 130Visceral metsECOG PS = 2ctDNA ≥ 30%
P
0.8
0.6
Pro
gres
sion
-fre
e su
rviv
al
0.4
0.2
ctDNA%Unquantifiable2%–30%30%–100%
00
At risk867342 20 10 5 4 3 3 1 0 0 0
54 35 22 15 11 7 5 3 2 073 60 40 30 16 10 6 4 2 0
3 6 9 12 15Months
18 21 24 27 30
ctDNA 30%–100% 2%–30%
10 20 30 40 50% of samples
60 70 80 90 100
012
0
Pro
gres
sion
-fre
e su
rviv
al
201 sequenced with 72-gene panel
Abiraterone 1000 mgPrednisone 5 mg (bid)
100+0+1 72+26+3 30+63+8
35+59+7
Datacut-off
76+23+2100+0+1
Not progressed + Progressed + Discontinued for other reason
Abiraterone + prednisone Enzalutamide 101 75 56 36 28 16 9 6 4 2 0101
Detection threshold for WXS sequencing
72 48 31 21 13 10 5 3 2 0
Start of therapy 12 weeks
Enzalutamide 160 mg
65 sequenced with whole-exome panel50 sequenced with AR panel
BEnzalutamide arm
HR (95% Cl) P
0.82 (0.58 –1.16) 0.27
C
D
E
F
G
Figure 1. Time to progression on enzalutamide or abiraterone therapy and relationship with baseline ctDNA fraction. A, Study design and clinical endpoints. Number of patients and their status at three time points is shown for each arm. B, Kaplan–Meier estimate of progression-free survival in the abiraterone and enzalutamide arms. Univariate Cox proportional hazard regression is shown in the top right corner. C, Best PSA decline during first 12 weeks of therapy. Com-plete lack of PSA response was more common in the abiraterone arm. D, Estimated ctDNA% (gray bars) in the 115 cfDNA samples with detectable ctDNA based on somatic mutations (dots). E, Allele fractions of somatic mutations (black dots) detected in the 65 cfDNA samples subjected to whole-exome sequencing. Kernel density estimates of the allele fractions are shown in gray. Patients are sorted by ctDNA% (estimated from the 72-gene panel). Red lines indicate expected allele fractions of somatic mutations with and without somatic LOH. F, Fractions of patients with ctDNA > 30% and ctDNA between 2% and 30%, in various clinical subgroups. Note that the “lymph node only” subgroup of metastatic pattern excludes patients with metastases to any “other” site (e.g., bladder base, skin). G, Kaplan–Meier survival curves for patients stratified into three groups based on ctDNA%. Result of multivariate Cox proportional hazards regression is shown in the top right corner. ABI, abiraterone; ALP, alkaline phosphatase; ECOG, Eastern Cooperative Oncology Group; ENZ, enzalutamide; HR, hazard ratio; LDH, lactate dehydrogenase; LN, lymph node; LOH, loss of heterozygosity; MAF, mutant allele fraction; PCWG3, Prostate Cancer Clinical Trials Working Group 3; ULN, upper limit of normal; WBC, white blood cell; WXS, whole-exome sequencing.
Research. on March 23, 2020. © 2018 American Association for Cancercancerdiscovery.aacrjournals.org Downloaded from
Published OnlineFirst January 24, 2018; DOI: 10.1158/2159-8290.CD-17-0937
ctDNA and Resistance to AR-Targeted Therapy RESEARCH ARTICLE
APRIL 2018 CANCER DISCOVERY | 447
tumor-derived cfDNA) above 2% (3, 5, 6, 10, 11). cfDNA sequencing involves a tradeoff between cost, genome cov-erage, and sensitivity to low ctDNA%. We used a targeted sequencing strategy capturing all exons of 72 mCRPC driver genes (Supplementary Table S2). We have previously dem-onstrated that this approach identifies over 90% of somatic mutations present in matched metastatic tissue in patients with ctDNA > 2% (11). Consistent with this result, tumor DNA spike-in experiments suggested greater than 90% sen-sitivity for somatic variants with an allele fraction above 3.5% (Supplementary Fig. S1). Copy-number changes were detected at ctDNA fractions above ∼30%, although exact sen-sitivity varied depending on the nature of the alteration (e.g., monoallelic versus biallelic deletion; Supplementary Fig. S2).
Baseline cfDNA samples from 201 patients (one sam-ple failed cfDNA extraction) were sequenced to a median depth of 688× (Supplementary Figs. S3–S4). ctDNA fraction was quantifiable in 115 of 201 (57%) cfDNA samples based on the presence of detectable somatic mutations (Fig. 1D; Supplementary Table S3). Two additional patients had AR amplifications but no somatic mutations above our detection threshold (Supplementary Fig. S5). Estimated ctDNA% in the 115 patients ranged between 2% and 89% (median 17%). The highest ctDNA% (89%) was observed in patient 030, sup-ported by two somatic mutations with loss of heterozygosity (LOH; Supplementary Table S3). The sample yielded 175 ng cfDNA/mL plasma, 13-fold more than the cohort median.
To confirm estimated ctDNA fractions, 65 baseline cfDNA and germline pairs were subjected to whole-exome sequenc-ing at a median depth of 163× (Supplementary Fig. S6 and Supplementary Table S1). All somatic mutations detected with the 72-gene panel were confirmed by exome sequencing, and allele fractions were highly concordant (R2 = 0.90; Sup-plementary Fig. S7). Allele fractions of somatic mutations outside the 72-gene panel were also consistent with estimated ctDNA% (Fig. 1E).
Leveraging the approximate ctDNA fraction where single copy-number changes in individual genes are detected, we sub-divided patients into three classes: high ctDNA (30%–100%), low ctDNA (2%–30%), and undetectable ctDNA (<2%). High ctDNA fraction was associated with clinical markers of tumor burden, including higher plasma concentrations of cfDNA, PSA, lactate dehydrogenase (LDH), and alkaline phosphatase (ALP; Fig. 1F; Supplementary Fig. S8). Importantly, ctDNA% > 30% was strongly related to poor therapy response even after adjustment for clinical prognostic factors, suggesting that ctDNA% reflects aspects of tumor biology or disease volume that are not captured by typical clinical parameters (Fig. 1G; Table 2).
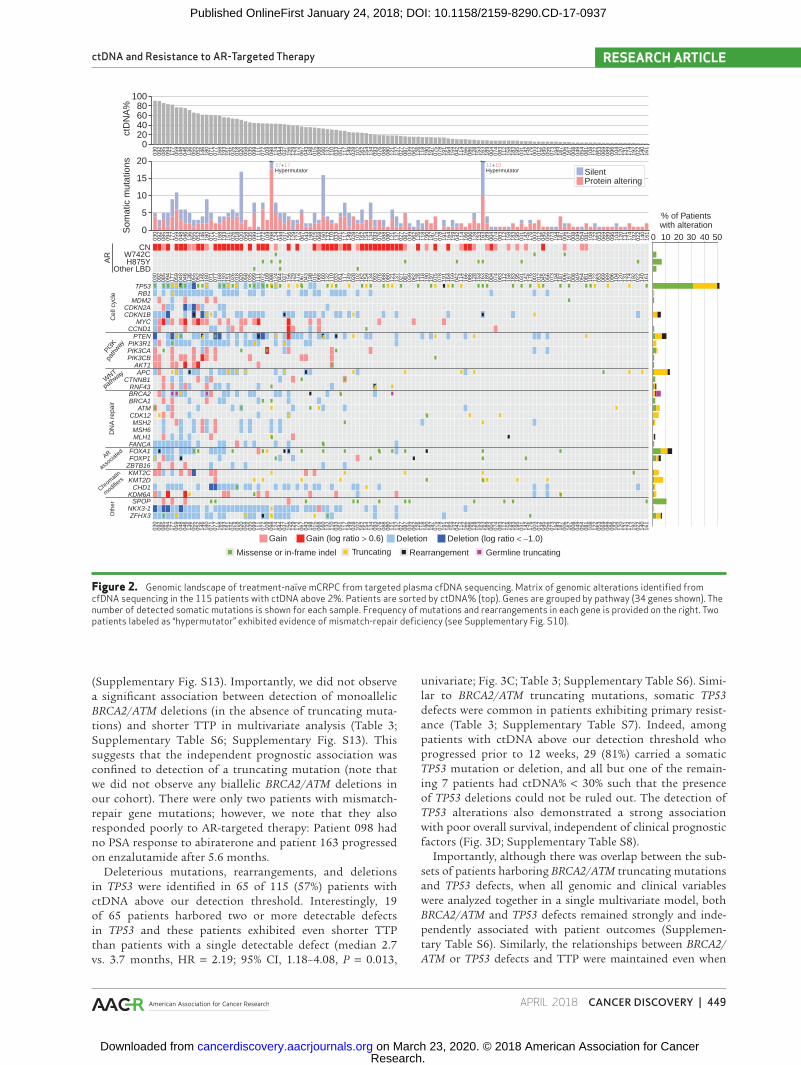
ctDNA Recapitulates the Somatic Landscape of mCRPC
A total of 457 somatic mutations (54% protein altering) were detected in the 115 samples with ctDNA above our detection threshold (Fig. 2; Supplementary Table S4). The most commonly mutated genes were TP53 (56% of patients), AR (11%), FOXA1 (10%), APC (10%), PTEN (10%), and SPOP (10%), in accordance with tissue-based CRPC studies (Sup-plementary Fig. S9; ref. 12). Although copy-number calling is challenging in patients with low ctDNA% (3, 10), the copy-number landscape in patients with ctDNA% > 30% was charac-teristic of mCRPC (13), including recurrent loss of the tumor suppressors TP53, RB1, and PTEN and amplification of the oncogenes MYC and AR (Fig. S2). Copy-number calls in mCRPC driver genes were concordant between the 72-gene panel and exome sequencing (Supplementary Fig. S7). Several genomic rearrangements affecting TP53, PTEN, FOXA1, APC, as well as ETS family genes were identified (Fig. 2; Supple-mentary Table S5), despite our exon-limited approach. Two patients exhibited an exceptionally high mutational burden in targeted sequencing (Fig. 2). Patient 098 (37.9 mutations/Mb) harbored biallelic somatic loss of mismatch repair genes
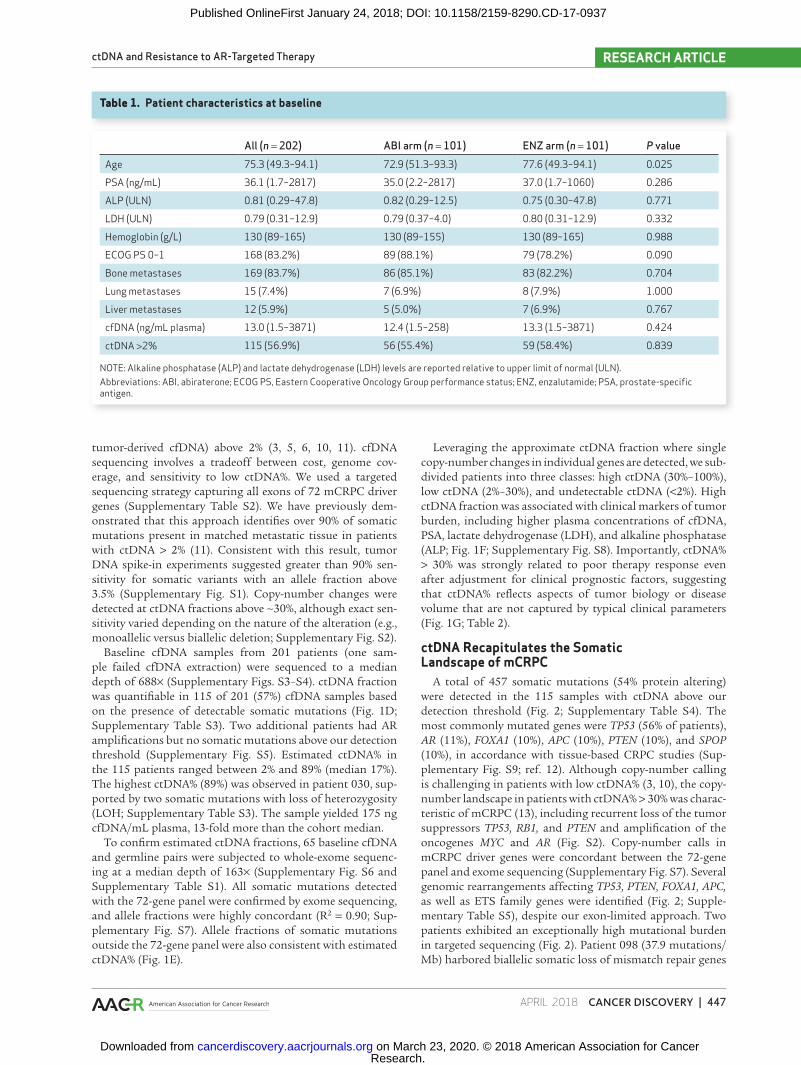
Table 1. Patient characteristics at baseline
All (n = 202) ABI arm (n = 101) ENZ arm (n = 101) P valueAge 75.3 (49.3–94.1) 72.9 (51.3–93.3) 77.6 (49.3–94.1) 0.025
PSA (ng/mL) 36.1 (1.7–2817) 35.0 (2.2–2817) 37.0 (1.7–1060) 0.286
ALP (ULN) 0.81 (0.29–47.8) 0.82 (0.29–12.5) 0.75 (0.30–47.8) 0.771
LDH (ULN) 0.79 (0.31–12.9) 0.79 (0.37–4.0) 0.80 (0.31–12.9) 0.332
Hemoglobin (g/L) 130 (89–165) 130 (89–155) 130 (89–165) 0.988
ECOG PS 0–1 168 (83.2%) 89 (88.1%) 79 (78.2%) 0.090
Bone metastases 169 (83.7%) 86 (85.1%) 83 (82.2%) 0.704
Lung metastases 15 (7.4%) 7 (6.9%) 8 (7.9%) 1.000
Liver metastases 12 (5.9%) 5 (5.0%) 7 (6.9%) 0.767
cfDNA (ng/mL plasma) 13.0 (1.5–3871) 12.4 (1.5–258) 13.3 (1.5–3871) 0.424
ctDNA >2% 115 (56.9%) 56 (55.4%) 59 (58.4%) 0.839
NOTE: Alkaline phosphatase (ALP) and lactate dehydrogenase (LDH) levels are reported relative to upper limit of normal (ULN).Abbreviations: ABI, abiraterone; ECOG PS, Eastern Cooperative Oncology Group performance status; ENZ, enzalutamide; PSA, prostate-specific antigen.
Research. on March 23, 2020. © 2018 American Association for Cancercancerdiscovery.aacrjournals.org Downloaded from
Published OnlineFirst January 24, 2018; DOI: 10.1158/2159-8290.CD-17-0937
Annala et al.RESEARCH ARTICLE
448 | CANCER DISCOVERY APRIL 2018 www.aacrjournals.org
MSH2 and MSH6, plus a frameshift in MLH1. Whole-exome sequencing confirmed the high somatic mutation rate, and both panels showed a mutation signature consistent with mismatch repair deficiency (Supplementary Fig. S10). Patient 163 (16.8 mutations/Mb) carried a somatic MSH2 frameshift, but low ctDNA% precluded LOH assessment. Both patients carried an AR H875Y mutation and no AR amplification (Fig. 2). Monoallelic deletion of mismatch repair genes was not associated with elevated mutation rates (Supplementary Fig. S10).
Specific Classes of Genomic Alteration Are Independently Associated with Poor Clinical Outcomes
To explore the interaction between common genomic alterations and clinical outcomes, we first catalogued del-eterious alterations in major prostate cancer driver genes and pathways covered by our panel (Fig. 3A; Supplemen-tary Table S6). The majority (67%) of patients with ctDNA above 2% had defects in two or more of these pathways (Supplementary Fig. S11). We observed established pat-terns of mutual exclusivity between molecular subtypes (e.g., TP53 defects vs. SPOP missense mutations; P = 0.008, Fisher exact test). In univariate analysis of each alteration class, hazard ratios for TTP ranged between 1.00 and 6.14
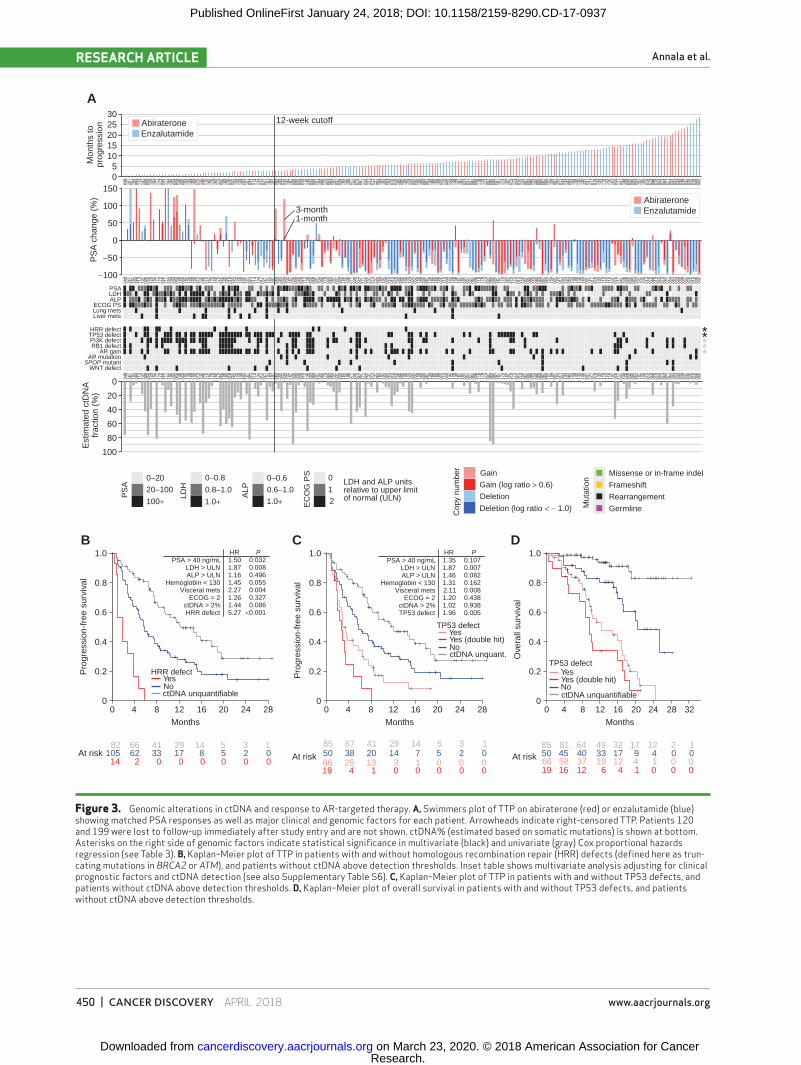
(Table 3). We did not observe evidence for differential efficacy between abiraterone and enzalutamide within any genomic or clinical subgroup (Supplementary Fig. S12). Therefore, we merged the trial arms and performed a multivariate analysis for each individual gene or pathway, incorporating both clinical prognostic factors and pres-ence of ctDNA as covariates. In this multivariate model, only deleterious alterations in homologous recombination repair genes (BRCA2 or ATM) and TP53 remained sig-nificantly associated with shorter TTP (Table 3; Fig. 3A–D; Supplementary Table S6).
The strongest prognostic association was observed for the 14 patients with truncating germline or somatic muta-tions in homologous recombination repair genes BRCA2 or ATM (no truncating changes were detected in BRCA1, PALB2, or FANCA in the germline or somatic genomes). A remarkable 9 of 14 progressed before 12 weeks, sug-gesting a link with primary resistance (Fig. 3B; Supple-mentary Table S7). Four patients with germline mutations did not have ctDNA above our detection thresholds, but 8 of the remaining 10 patients with either germline or somatic BRCA2/ATM mutations had detectable LOH in ctDNA (Supplementary Fig. S13). The exceptions were two patients where LOH assessment was precluded due to low ctDNA fraction or somatic mutation subclonality
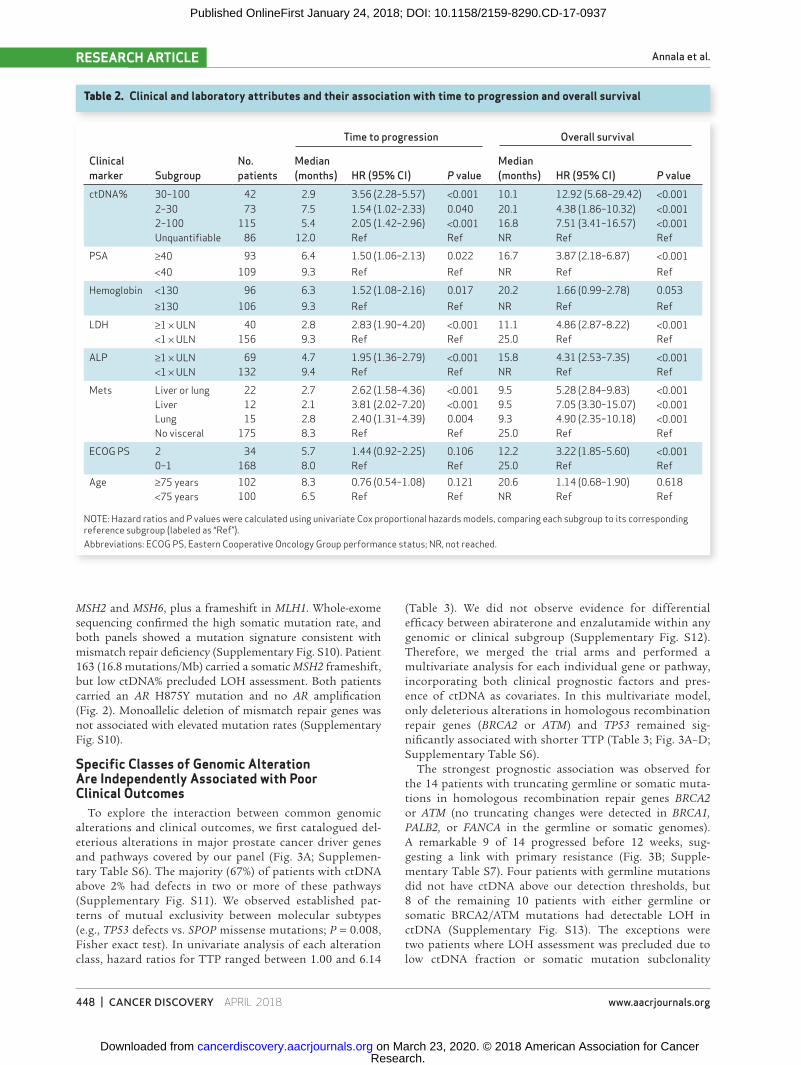
Table 2. Clinical and laboratory attributes and their association with time to progression and overall survival
Clinical marker Subgroup
No. patients
Time to progression Overall survival
Median (months) HR (95% CI) P value
Median (months) HR (95% CI) P value
ctDNA% 30–100 42 2.9 3.56 (2.28–5.57) <0.001 10.1 12.92 (5.68–29.42) <0.0012–30 73 7.5 1.54 (1.02–2.33) 0.040 20.1 4.38 (1.86–10.32) <0.0012–100 115 5.4 2.05 (1.42–2.96) <0.001 16.8 7.51 (3.41–16.57) <0.001Unquantifiable 86 12.0 Ref Ref NR Ref Ref
PSA ≥40 93 6.4 1.50 (1.06–2.13) 0.022 16.7 3.87 (2.18–6.87) <0.001<40 109 9.3 Ref Ref NR Ref Ref
Hemoglobin <130 96 6.3 1.52 (1.08–2.16) 0.017 20.2 1.66 (0.99–2.78) 0.053≥130 106 9.3 Ref Ref NR Ref Ref
LDH ≥1 × ULN 40 2.8 2.83 (1.90–4.20) <0.001 11.1 4.86 (2.87–8.22) <0.001<1 × ULN 156 9.3 Ref Ref 25.0 Ref Ref
ALP ≥1 × ULN 69 4.7 1.95 (1.36–2.79) <0.001 15.8 4.31 (2.53–7.35) <0.001<1 × ULN 132 9.4 Ref Ref NR Ref Ref
Mets Liver or lung 22 2.7 2.62 (1.58–4.36) <0.001 9.5 5.28 (2.84–9.83) <0.001Liver 12 2.1 3.81 (2.02–7.20) <0.001 9.5 7.05 (3.30–15.07) <0.001Lung 15 2.8 2.40 (1.31–4.39) 0.004 9.3 4.90 (2.35–10.18) <0.001No visceral 175 8.3 Ref Ref 25.0 Ref Ref
ECOG PS 2 34 5.7 1.44 (0.92–2.25) 0.106 12.2 3.22 (1.85–5.60) <0.0010–1 168 8.0 Ref Ref 25.0 Ref Ref
Age ≥75 years 102 8.3 0.76 (0.54–1.08) 0.121 20.6 1.14 (0.68–1.90) 0.618<75 years 100 6.5 Ref Ref NR Ref Ref
NOTE: Hazard ratios and P values were calculated using univariate Cox proportional hazards models, comparing each subgroup to its corresponding reference subgroup (labeled as “Ref”).Abbreviations: ECOG PS, Eastern Cooperative Oncology Group performance status; NR, not reached.
Research. on March 23, 2020. © 2018 American Association for Cancercancerdiscovery.aacrjournals.org Downloaded from
Published OnlineFirst January 24, 2018; DOI: 10.1158/2159-8290.CD-17-0937
ctDNA and Resistance to AR-Targeted Therapy RESEARCH ARTICLE
APRIL 2018 CANCER DISCOVERY | 449
Figure 2. Genomic landscape of treatment-naïve mCRPC from targeted plasma cfDNA sequencing. Matrix of genomic alterations identified from cfDNA sequencing in the 115 patients with ctDNA above 2%. Patients are sorted by ctDNA% (top). Genes are grouped by pathway (34 genes shown). The number of detected somatic mutations is shown for each sample. Frequency of mutations and rearrangements in each gene is provided on the right. Two patients labeled as “hypermutator” exhibited evidence of mismatch-repair deficiency (see Supplementary Fig. S10).
10080604020
003
009
208
509
417
705
904
804
613
605
505
214
618
007
107
716
819
315
102
601
802
005
803
509
911
107
210
909
812
404
403
715
612
917
206
704
319
801
506
816
013
2
20
15
10
5
0
CNW742CH875Y
Other LBD
TP53RB1
MDM2CDKN2ACDKN1B
MYCCCND1
PTENPIK3R1PIK3CAPIK3CB
AKT1APC
CTNNB1RNF43BRCA2BRCA1
ATMCDK12MSH2MSH6MLH1
FANCAFOXA1FOXP1
ZBTB16KMT2CKMT2D
CHD1KDM6A
SPOPNKX3-1ZFHX3
ctD
NA
%S
omat
ic m
utat
ions
AR
Cel
l cyc
leD
NA
rep
air
AR
associa
ted
Chromatin
modifiers
PI3K
path
way
WNT
pathway
Oth
er
110
033
051
117
149
028
102
162
154
134
093
076
088
080
121
137
027
087
039
062
126
118
190
197
075
078
191
164
159
042
114
166
086
128
153
163
189
004
074
083
112
158
183
195
031
142
176
003
012
045
056
073
194
187
006
167
008
049
054
081
108
122
053
069
089
096
104
120
131
174
192
022
140
161
030
092
085
094
177
059
048
046
136
055
052
146
180
071
077
168
193
151
026
018
020
058
035
099
111
072
109
098
124
044
037
156
129
172
067
043
198
015
068
160
132
110
033
051
117
149
028
102
162
154
134
093
076
088
080
121
137
027
087
039
062
126
118
190
197
075
078
191
164
159
042
114
166
086
128
153
163
189
004
074
083
112
158
183
195
031
142
176
003
012
045
056
073
194
187
006
167
008
049
054
081
108
122
053
069
089
096
104
120
131
174
192
022
140
161
% of Patientswith alteration
Gain Gain (log ratio > 0.6) Deletion Deletion (log ratio < −1.0)
Missense or in-frame indel Truncating Rearrangement Germline truncating
0 10 20 30 40 50
Protein alteringSilent
37+17Hypermutator
11+10Hypermutator
(Supplementary Fig. S13). Importantly, we did not observe a significant association between detection of monoallelic BRCA2/ATM deletions (in the absence of truncating muta-tions) and shorter TTP in multivariate analysis (Table 3; Supplementary Table S6; Supplementary Fig. S13). This suggests that the independent prognostic association was confined to detection of a truncating mutation (note that we did not observe any biallelic BRCA2/ATM deletions in our cohort). There were only two patients with mismatch-repair gene mutations; however, we note that they also responded poorly to AR-targeted therapy: Patient 098 had no PSA response to abiraterone and patient 163 progressed on enzalutamide after 5.6 months.
Deleterious mutations, rearrangements, and deletions in TP53 were identified in 65 of 115 (57%) patients with ctDNA above our detection threshold. Interestingly, 19 of 65 patients harbored two or more detectable defects in TP53 and these patients exhibited even shorter TTP than patients with a single detectable defect (median 2.7 vs. 3.7 months, HR = 2.19; 95% CI, 1.18–4.08, P = 0.013,
univariate; Fig. 3C; Table 3; Supplementary Table S6). Simi-lar to BRCA2/ATM truncating mutations, somatic TP53 defects were common in patients exhibiting primary resist-ance (Table 3; Supplementary Table S7). Indeed, among patients with ctDNA above our detection threshold who progressed prior to 12 weeks, 29 (81%) carried a somatic TP53 mutation or deletion, and all but one of the remain-ing 7 patients had ctDNA% < 30% such that the presence of TP53 deletions could not be ruled out. The detection of TP53 alterations also demonstrated a strong association with poor overall survival, independent of clinical prognostic factors (Fig. 3D; Supplementary Table S8).
Importantly, although there was overlap between the sub-sets of patients harboring BRCA2/ATM truncating mutations and TP53 defects, when all genomic and clinical variables were analyzed together in a single multivariate model, both BRCA2/ATM and TP53 defects remained strongly and inde-pendently associated with patient outcomes (Supplemen-tary Table S6). Similarly, the relationships between BRCA2/ATM or TP53 defects and TTP were maintained even when
Research. on March 23, 2020. © 2018 American Association for Cancercancerdiscovery.aacrjournals.org Downloaded from
Published OnlineFirst January 24, 2018; DOI: 10.1158/2159-8290.CD-17-0937
Annala et al.RESEARCH ARTICLE
450 | CANCER DISCOVERY APRIL 2018 www.aacrjournals.org
Figure 3. Genomic alterations in ctDNA and response to AR-targeted therapy. A, Swimmers plot of TTP on abiraterone (red) or enzalutamide (blue) showing matched PSA responses as well as major clinical and genomic factors for each patient. Arrowheads indicate right-censored TTP. Patients 120 and 199 were lost to follow-up immediately after study entry and are not shown. ctDNA% (estimated based on somatic mutations) is shown at bottom. Asterisks on the right side of genomic factors indicate statistical significance in multivariate (black) and univariate (gray) Cox proportional hazards regression (see Table 3). B, Kaplan–Meier plot of TTP in patients with and without homologous recombination repair (HRR) defects (defined here as trun-cating mutations in BRCA2 or ATM), and patients without ctDNA above detection thresholds. Inset table shows multivariate analysis adjusting for clinical prognostic factors and ctDNA detection (see also Supplementary Table S6). C, Kaplan–Meier plot of TTP in patients with and without TP53 defects, and patients without ctDNA above detection thresholds. D, Kaplan–Meier plot of overall survival in patients with and without TP53 defects, and patients without ctDNA above detection thresholds.
A
B C D
3025201510
50
150
100
50
0
−50
−100
0−20 0−0.8 0−0.6
0.8−1.0 0.6−1.0LDH and ALP unitsrelative to upper limitof normal (ULN)
Gain Missense or in-frame indel
Frameshift
Rearrangement
Germline
Gain (log ratio > 0.6)
Deletion (log ratio < − 1.0)
Deletion
0
12
20−100
100+ 1.0+
HRR defect
TP53 defect
TP53 defect
Yes
Yes
No
No
ctDNA unquant.
ctDNA unquantifiable
Yes (double hit)
Yes (double hit)YesNoctDNA unquantifiable
1.0+
1.501.871.161.452.271.261.445.27
1.351.871.461.312.111.201.021.96
0.0320.0080.4960.0550.0040.3270.086
<0.001
0.1070.0070.0820.1620.0080.4380.9380.005
PS
A
LDH
ALP
EC
OG
PS
Cop
y nu
mbe
r
Mut
atio
n
0
20
40
60
80
100
1.0
0.8
0.6
0.4
0.2
0
1.0
0.8
0.6
0.4
0.2
0
1.0
0.8
0.6
0.4
0.2
0
Mon
ths
topr
ogre
ssio
nP
SA
cha
nge
(%)
Est
imat
ed c
tDN
Afr
actio
n (%
)P
rogr
essi
on-f
ree
surv
ival
Pro
gres
sion
-fre
e su
rviv
al
Ove
rall
surv
ival
Abiraterone 12-week cutoff
3-month1-month
Enzalutamide
AbirateroneEnzalutamide
PSALDHALP
ECOG PSLung metsLiver mets
HRR defectTP53 defectPI3K defectRB1 defect
AR gainAR mutation
SPOP mutantWNT defect
HR PHR PPSA > 40 ng/mL
LDH > ULNALP > ULN
Hemoglobin < 130Visceral mets
ECOG = 2ctDNA > 2%HRR defect
PSA > 40 ng/mLLDH > ULNALP > ULN
Hemoglobin < 130Visceral mets
ECOG = 2ctDNA > 2%TP53 defect
0 4 8 12 16 20 24 28Months
0 4 8 12 16 20 24 28
82 66 41 29 14 5 3 1 85 67 41 29 14 5 3 1 85 81 64 49 32 17 12 2 1
14 2 0 0 0 0 0 019 4 1 0 0 0 0 0 19 16 12 6 4 1 0 0 066 25 13 3 1 0 0 0 66 58 37 19 12 4 1 0 0
105 62 33 17 8 5 2 0 50 38 20 14 7 5 2 0 50 45 40 33 17 9 4 0 0
Months
At risk At risk At risk
0 4 8 12 16 20 24 28 32Months
Research. on March 23, 2020. © 2018 American Association for Cancercancerdiscovery.aacrjournals.org Downloaded from
Published OnlineFirst January 24, 2018; DOI: 10.1158/2159-8290.CD-17-0937
ctDNA and Resistance to AR-Targeted Therapy RESEARCH ARTICLE
APRIL 2018 CANCER DISCOVERY | 451
restricting analyses to high-risk patient subgroups based on clinical prognostic factors (Supplementary Fig. S14).
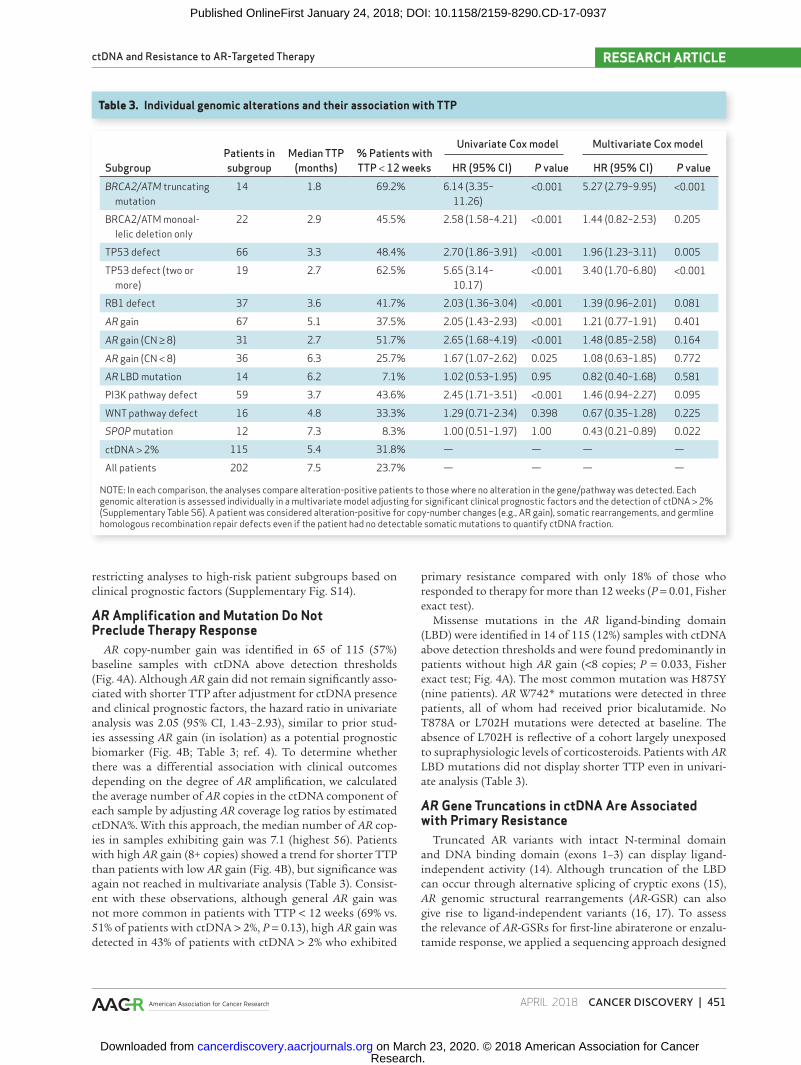
AR Amplification and Mutation Do Not Preclude Therapy Response
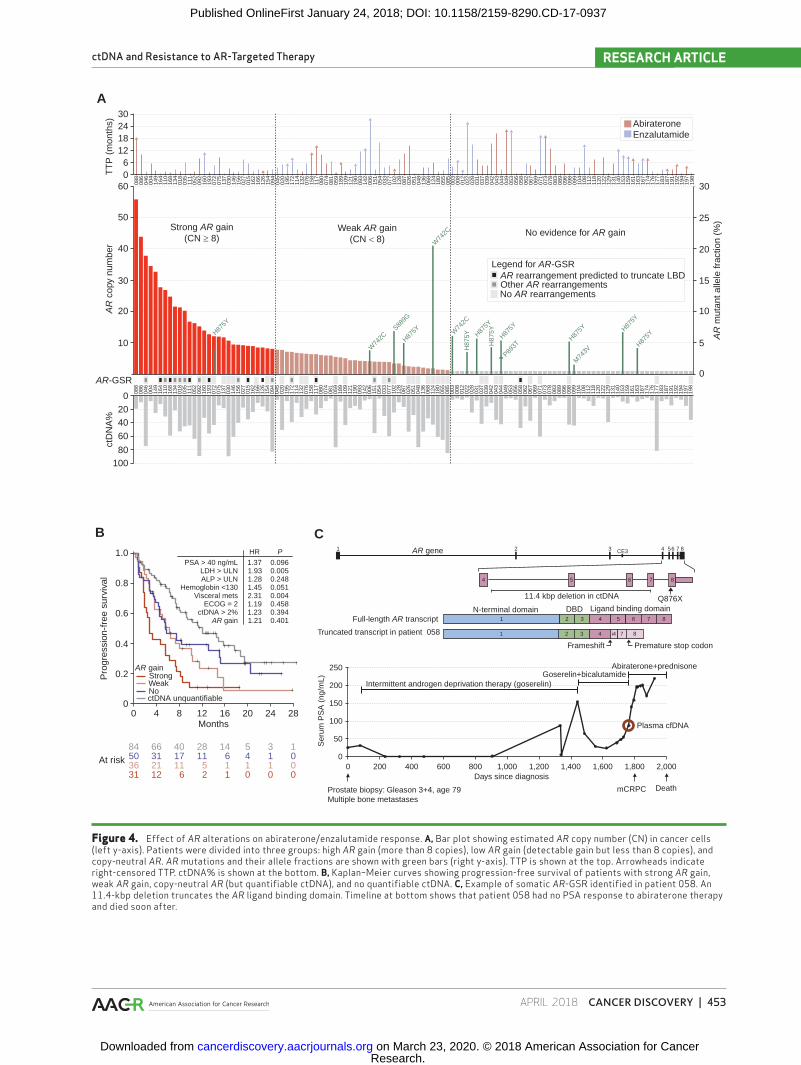
AR copy-number gain was identified in 65 of 115 (57%) baseline samples with ctDNA above detection thresholds (Fig. 4A). Although AR gain did not remain significantly asso-ciated with shorter TTP after adjustment for ctDNA presence and clinical prognostic factors, the hazard ratio in univariate analysis was 2.05 (95% CI, 1.43–2.93), similar to prior stud-ies assessing AR gain (in isolation) as a potential prognostic biomarker (Fig. 4B; Table 3; ref. 4). To determine whether there was a differential association with clinical outcomes depending on the degree of AR amplification, we calculated the average number of AR copies in the ctDNA component of each sample by adjusting AR coverage log ratios by estimated ctDNA%. With this approach, the median number of AR cop-ies in samples exhibiting gain was 7.1 (highest 56). Patients with high AR gain (8+ copies) showed a trend for shorter TTP than patients with low AR gain (Fig. 4B), but significance was again not reached in multivariate analysis (Table 3). Consist-ent with these observations, although general AR gain was not more common in patients with TTP < 12 weeks (69% vs. 51% of patients with ctDNA > 2%, P = 0.13), high AR gain was detected in 43% of patients with ctDNA > 2% who exhibited
primary resistance compared with only 18% of those who responded to therapy for more than 12 weeks (P = 0.01, Fisher exact test).
Missense mutations in the AR ligand-binding domain (LBD) were identified in 14 of 115 (12%) samples with ctDNA above detection thresholds and were found predominantly in patients without high AR gain (<8 copies; P = 0.033, Fisher exact test; Fig. 4A). The most common mutation was H875Y (nine patients). AR W742* mutations were detected in three patients, all of whom had received prior bicalutamide. No T878A or L702H mutations were detected at baseline. The absence of L702H is reflective of a cohort largely unexposed to supraphysiologic levels of corticosteroids. Patients with AR LBD mutations did not display shorter TTP even in univari-ate analysis (Table 3).
AR Gene Truncations in ctDNA Are Associated with Primary Resistance
Truncated AR variants with intact N-terminal domain and DNA binding domain (exons 1–3) can display ligand-independent activity (14). Although truncation of the LBD can occur through alternative splicing of cryptic exons (15), AR genomic structural rearrangements (AR-GSR) can also give rise to ligand-independent variants (16, 17). To assess the relevance of AR-GSRs for first-line abiraterone or enzalu-tamide response, we applied a sequencing approach designed
Table 3. Individual genomic alterations and their association with TTP
SubgroupPatients in subgroup
Median TTP (months)
% Patients with TTP < 12 weeks
Univariate Cox model Multivariate Cox model
HR (95% CI) P value HR (95% CI) P valueBRCA2/ATM truncating
mutation14 1.8 69.2% 6.14 (3.35–
11.26)<0.001 5.27 (2.79–9.95) <0.001
BRCA2/ATM monoal-lelic deletion only
22 2.9 45.5% 2.58 (1.58–4.21) <0.001 1.44 (0.82–2.53) 0.205
TP53 defect 66 3.3 48.4% 2.70 (1.86–3.91) <0.001 1.96 (1.23–3.11) 0.005
TP53 defect (two or more)
19 2.7 62.5% 5.65 (3.14–10.17)
<0.001 3.40 (1.70–6.80) <0.001
RB1 defect 37 3.6 41.7% 2.03 (1.36–3.04) <0.001 1.39 (0.96–2.01) 0.081
AR gain 67 5.1 37.5% 2.05 (1.43–2.93) <0.001 1.21 (0.77–1.91) 0.401
AR gain (CN ≥ 8) 31 2.7 51.7% 2.65 (1.68–4.19) <0.001 1.48 (0.85–2.58) 0.164
AR gain (CN < 8) 36 6.3 25.7% 1.67 (1.07–2.62) 0.025 1.08 (0.63–1.85) 0.772
AR LBD mutation 14 6.2 7.1% 1.02 (0.53–1.95) 0.95 0.82 (0.40–1.68) 0.581
PI3K pathway defect 59 3.7 43.6% 2.45 (1.71–3.51) <0.001 1.46 (0.94–2.27) 0.095
WNT pathway defect 16 4.8 33.3% 1.29 (0.71–2.34) 0.398 0.67 (0.35–1.28) 0.225
SPOP mutation 12 7.3 8.3% 1.00 (0.51–1.97) 1.00 0.43 (0.21–0.89) 0.022
ctDNA > 2% 115 5.4 31.8% — — — —
All patients 202 7.5 23.7% — — — —
NOTE: In each comparison, the analyses compare alteration-positive patients to those where no alteration in the gene/pathway was detected. Each genomic alteration is assessed individually in a multivariate model adjusting for significant clinical prognostic factors and the detection of ctDNA > 2% (Supplementary Table S6). A patient was considered alteration-positive for copy-number changes (e.g., AR gain), somatic rearrangements, and germline homologous recombination repair defects even if the patient had no detectable somatic mutations to quantify ctDNA fraction.
Research. on March 23, 2020. © 2018 American Association for Cancercancerdiscovery.aacrjournals.org Downloaded from
Published OnlineFirst January 24, 2018; DOI: 10.1158/2159-8290.CD-17-0937
Annala et al.RESEARCH ARTICLE
452 | CANCER DISCOVERY APRIL 2018 www.aacrjournals.org
to capture AR introns in 50 patient samples with high ctDNA (median 43%, range, 12%–89%; Supplementary Fig. S15). Nineteen of 50 (38%) patient samples showed evidence for somatic AR-GSRs (Supplementary Figs. S16–S17; Sup-plementary Tables S8–S9). AR-GSRs were more common in samples with AR gain (46% vs. 9%, P = 0.050, Fisher exact test). Patients with truncating AR-GSRs downstream of exon 3 were more likely to have rising PSA as best response to therapy than patients with only non–LBD-truncating AR-GSRs (4/8 vs. 0/11; P = 0.036, Fisher exact test). Of the five patients with poorest PSA response to abiraterone/enzaluta-mide therapy, four carried truncating AR-GSRs downstream of exon 3 (Supplementary Fig. S16). Two more patients (126 and 168) with such AR-GSRs had rapid clinical progression (death within 3.2 and 4.7 months, respectively) despite an initial PSA response.
Only patient 058 carried an AR rearrangement in the absence of AR amplification: an 11.4-kb intragenic deletion from 23 bp downstream of exon 4 to within exon 7 (Fig. 4C). The deletion was detected by both the 72-gene sequencing panel and the AR panel. Using a PCR and Sanger sequencing approach applied to cDNA from patient 058’s matched whole-blood RNA sample, we identified a unique AR transcript composed of exons 1 to 4, followed by 23 bp from the begin-ning of intron 4, followed by the last 70 bp of exon 7 and full exon 8 (Fig. 4C; Supplementary Fig. S16). The noncanonical junction between exons 4 and 7 resulted in a frameshift and premature stop codon 41 aa after the junction, truncating the AR protein before the LBD. In accordance with the absence of intact AR in his tumor cells, patient 058 displayed no response to abiraterone (83% PSA increase during first month; Fig. 4C).
DISCUSSIONEnzalutamide and abiraterone were developed to over-
come reactivated AR signaling after clinical progression on standard hormonal therapies (18–20). Consistent with their strong activity in preclinical models of CRPC, we report that in patients unexposed to prior therapy for their mCRPC, enzalutamide and abiraterone elicit clinical responses in the context of AR amplifications and LBD mutations (specifically W742C and H875Y). Nevertheless, AR amplifications were associated with shorter TTP in univariate analyses, with a haz-ard ratio similar to that identified in a recent study leveraging droplet digital PCR to examine plasma cfDNA AR amplifica-tion status in first-line mCRPC (4). In our study, detection of AR amplification lost its prognostic effect after adjustment for routine prognostic clinical markers and ctDNA presence, diminishing its potential as an independent biomarker in first-line mCRPC. Pertinently, most of the poorest responders with AR gains were patients with high AR copy number (>8). This implies a dose effect for overcoming potent inhibition. A recent patient-derived tumor xenograft study demonstrated sequential ERK signaling inhibitor monotherapy selects for a progressively higher BRAF copy number that enables resist-ance (21). It is plausible that continuing evolution of AR copy number in mCRPC during first-line therapy contributes to cross-resistance between AR-targeted agents.
We detected diverse AR-GSRs, enriched in patients with additional AR copies. Specific AR-GSRs resulting in
“hard-wired” ligand independence have been observed in model systems, but only recently in patients (17, 22). Although a prior study of 30 patients with heavily pretreated mCRPC suggested an association between detection of any AR-GSR and poor clinical response to AR-targeted therapy (22), the relevance for patients with treatment-naïve mCRPC remained unclear. In our study, only a subset of AR-GSRs appeared to have the potential to truncate the LBD without compromis-ing the DNA binding and transactivation domains critical to AR protein function. Our data suggest that this AR-GSR subset contributes to primary resistance to first-line AR-targeted therapy in mCRPC. Previous studies have reported associations between truncated AR splice variants, particu-larly ARV7, and poor response to AR-targeted therapy (8, 9). However, most ARV7-positive patients also express high levels of full-length AR, and expression of ARV7 in first-line mCRPC is rare and does not preclude response to AR-targeted therapy (9, 23). Given the diversity of AR-GSRs, and the potential impact of mRNA surveillance on their translation, it will be important to accurately identify the subset of AR-GSRs that genuinely lead to truncated AR proteins. We demonstrate that a novel AR transcript was robustly detected in matched whole blood from a patient with an LBD truncating AR-GSR. This suggests that whole blood or circulating tumor cell AR transcript profiling can help augment cfDNA screening for identification of clinically relevant AR-GSRs. Future studies are needed to assess the relative impact of ARV7 and AR-GSRs on therapy response.
The association between homologous recombination repair (HRR) defects and primary resistance to AR-targeted therapy is consistent with reports of poor prognosis in this patient popu-lation (24). In a previous retrospective study we demonstrated a link between germline HRR defects and poor response to AR-targeted therapies (10). The current study represents a pro-spective validation and suggests that the association extends to somatic mutations in BRCA2 and ATM. It is plausible that the increased tumor heterogeneity and adaptability enabled by a truncal DNA repair defect fosters the generation of clones with de novo resistance. Patients with mCRPC with HRR defects appear to benefit from treatment with PARP inhibitors or platinum-based chemotherapy (25, 26). Importantly, truncat-ing mutations in BRCA2/ATM exhibited somatic LOH in all assessable cases, suggesting that accurate copy-number calling (often impossible at low ctDNA%) may not be an absolute requirement in guiding the use of these therapies. It should be noted however that there is a potential bias from examining only patients with a high tumor burden (i.e., those with high ctDNA fraction). Nevertheless, as liquid biopsies are also show-ing great promise in monitoring patients for reversion muta-tions linked to PARP inhibitor resistance (27, 28), they are likely to have broad clinical utility in patients with HRR-defective tumors. Future studies must assess the degree to which defects in other HRR genes (e.g., CDK12) are linked to poor outcomes with AR-directed therapies, but will require larger cohorts.
p53 and PI3K pathway defects were associated with poor response to AR-targeted therapy, with TP53 defects retaining significance in multivariate models. This is consistent with data from experimental systems and human tissue studies suggesting that defects in TP53 or PI3K reduce prostate can-cer dependency on AR signaling (29–32). Complete TP53 loss,
Research. on March 23, 2020. © 2018 American Association for Cancercancerdiscovery.aacrjournals.org Downloaded from
Published OnlineFirst January 24, 2018; DOI: 10.1158/2159-8290.CD-17-0937
ctDNA and Resistance to AR-Targeted Therapy RESEARCH ARTICLE
APRIL 2018 CANCER DISCOVERY | 453
Figure 4. Effect of AR alterations on abiraterone/enzalutamide response. A, Bar plot showing estimated AR copy number (CN) in cancer cells (left y-axis). Patients were divided into three groups: high AR gain (more than 8 copies), low AR gain (detectable gain but less than 8 copies), and copy-neutral AR. AR mutations and their allele fractions are shown with green bars (right y-axis). TTP is shown at the top. Arrowheads indicate right-censored TTP. ctDNA% is shown at the bottom. B, Kaplan–Meier curves showing progression-free survival of patients with strong AR gain, weak AR gain, copy-neutral AR (but quantifiable ctDNA), and no quantifiable ctDNA. C, Example of somatic AR-GSR identified in patient 058. An 11.4-kbp deletion truncates the AR ligand binding domain. Timeline at bottom shows that patient 058 had no PSA response to abiraterone therapy and died soon after.
088
086
046
088
086
046
004
149
164
110
168
134
018
035
111
052
092
160
193
072
075
137
030
146
156
027
015
162
166
126
154
094
045
020
195
172
114
132
076
158
117
080
074
081
059
189
109
121
190
093
142
006
151
054
033
077
102
128
087
026
051
048
136
068
124
180
055
085
003
008
012
022
028
031
037
039
042
043
044
049
053
056
058
062
067
069
071
073
078
083
089
096
098
099
104
108
112
118
120
122
129
131
140
153
159
161
163
167
174
176
177
183
187
191
192
194
197
198
004
149
164
110
168
134
018
035
111
052
092
1.37
HR
PSA > 40 ng/mLLDH > ULNALP > ULN
Hemoglobin <130Visceral mets
ECOG = 2ctDNA > 2%
AR gain
P
0.0960.0050.2480.0510.0040.4580.3940.401
Pro
gres
sion
-fre
e su
rviv
al
1.931.281.452.311.191.231.21
160
193
072
075
137
030
146
156
027
015
162
166
126
154
094
045
020
195
172
114
132
076
158
117
080
074
081
059
189
109
121
190
093
142
006
151
054
033
077
102
128
087
026
051
048
136
068
124
180
055
085
003
008
012
022
028
031
037
039
042
043
044
049
053
056
058
062
067
069
071
073
078
083
089
096
098
099
104
108
112
118
120
122
129
131
140
153
159
161
163
167
174
176
177
183
187
191
192
194
197
198
30AbirateroneEnzalutamide
TT
P (
mon
ths)
AR
cop
y nu
mbe
rA
B C1 432
4
1 2 3
3
4
4
5 6 7 8
i4 7 821
6 7
CE3AR gene
11.4 kbp deletion in ctDNA
Full-length AR transcript
Truncated transcript in patient 058
Q876XN-terminal domain
Frameshift Premature stop codon
Abiraterone+prednisone
Plasma cfDNA
Goserelin+bicalutamideIntermittent androgen deprivation therapy (goserelin)
250
200
150
100
50
00 200 400 600 800 1,000 1,200 1,400
DeathmCRPC
Days since diagnosis
Prostate biopsy: Gleason 3+4, age 79Multiple bone metastases
Ser
um P
SA
(ng
/mL)
1,600 2,0001,800
DBD Ligand binding domain
56 7 8
AR-GSR
24181260
60 30
25
20
15
AR
mut
ant a
llele
frac
tion
(%)
10
5
0
Strong AR gain(CN ≥ 8)
Weak AR gain(CN < 8)
No evidence for AR gain
AR rearrangement predicted to truncate LBDOther AR rearrangementsNo AR rearrangements
Legend for AR-GSR
H875Y
S889G
W74
2C
W74
2C
W74
2C
H875Y
50
40
30
20
10
ctD
NA
%
0204060
80100
1.0
0.8
0.6
0.4
0.2
00 4 8
AR gainStrongWeakNoctDNA unquantifiable
12
At risk66 40 14 5 3 12884
50 31 17 6 4 1 01136 21 11 1 1 1 0531 12 6 1 0 0 02
16Months
20 24 28
H87
5Y
H87
5YH875Y
H875Y H87
5YH87
5Y
M74
3V
H875Y
P893T
5 8
Research. on March 23, 2020. © 2018 American Association for Cancercancerdiscovery.aacrjournals.org Downloaded from
Published OnlineFirst January 24, 2018; DOI: 10.1158/2159-8290.CD-17-0937
Annala et al.RESEARCH ARTICLE
454 | CANCER DISCOVERY APRIL 2018 www.aacrjournals.org
in conjunction with RB1 loss, contributes to lineage plasticity and evolution toward an AR-negative state (31, 32). AR activ-ity is reduced upon PTEN loss, and PI3K pathway activation can compensate for AR inhibition (29). The detection of PI3K defects in liquid biopsies offers opportunities for combin-ing AR-targeted therapy with AKT/PI3K/mTOR inhibitors, because recent phase II data suggest patients with PTEN loss respond better to abiraterone plus AKT inhibition than abi-raterone alone (33). Although our data do not propose that patients harboring TP53 defects should entirely avoid AR-targeted therapy, we posit that the detection of a TP53 defect has clinical utility: precipitating closer disease monitoring, preparing the patient for rapid progression, and encouraging the physician to ready future lines of therapy.
Our study reveals the relative impact of common genomic alterations on patient response to the most widely used thera-pies for advanced prostate cancer. Importantly, this work was performed within the framework of a large randomized phase II trial, leveraging minimally invasive liquid biopsies in a patient population representative of clinical practice. Key limitations include the exploratory nature of our analyses (in the absence of a prospective analysis plan) and the fact that we cannot put results in context of other prognostic biomarkers such as ARV7 expression and CTC enumeration (9, 34). Furthermore, only 115 patients had sufficient ctDNA for genomic evaluation, which prevented us from assessing the clinical relevance of differing combinations of genomic alterations, and whether any specific combinations may be associated with complete lack of benefit from abiraterone or enzalutamide. Use of unique molecular identifiers and higher sequencing depths in the future will increase the proportion of patients with detectable ctDNA, but it is important to note that low ctDNA fraction was associated with good prognosis. Larger prospective randomized studies enrolling thousands of patients are required to address these questions and to vali-date potential predictive ctDNA biomarkers, but the results described here provide a crucial foundation for their design. Future studies must assess how these potential biomarkers generalize to castration-sensitive disease.
METHODSStudy Design and Patients
Two hundred two patients with treatment-naïve mCRPC who were eligible for treatment with abiraterone and enzalutamide were randomized 1:1 to a multicenter, phase II study of abiraterone and prednisone versus enzalutamide, with crossover at PSA progression. Approval for this study was granted by the University of British Columbia Research Ethics Board (Number H14-00738). The study was conducted in accordance with the Declaration of Helsinki, and written informed consent was obtained from all participants prior to enrollment. Patients received either abiraterone (1000 mg daily) + prednisone (5 mg twice daily) or enzalutamide (160 mg daily). Treat-ment continued until disease progression, death, or unacceptable toxicity. For the present analysis, we evaluated the following clinical endpoints with first-line therapy: PSA decline ≥ 50% (PSA50) from baseline, time to PSA progression with first-line therapy, and TTP [defined as first of confirmed PSA progression (Prostate Cancer Clinical Trials Working Group 3), clinical or radiologic progression, or death from disease]. A prespecified secondary objective of this trial was the identification of potential plasma-based biomarkers that are
associated with treatment efficacy and/or resistance among patients with mCRPC receiving abiraterone acetate and enzalutamide.
Target Capture and SequencingA custom NimbleGen SeqCap EZ Choice target capture panel
was used to capture the coding regions of 72 genes (Supplementary Table S2). For each sample, 10 to 100 ng of DNA was used for library preparation. All germline DNA samples were sheared into 180-bp fragments with a Covaris focused ultrasonicator. A-tailing, end-repair, Illumina-compatible adapter ligation and PCR amplification (between 12 and 17 cycles) was performed. Library quantification was carried out with the NanoDrop spectrophotometer, and each library was run on an ethidium bromide gel to confirm success. Up to 25 purified sample libraries at a time were multiplexed to obtain single pools with a combined mass of 1 μg, allowing a minimum 40 ng input for each sample library. These pools were hybridized to the capture panel for a minimum of 16 hours at 47°C. The subsequent wash, recovery, and amplification of the captured regions were performed according to the NimbleGen SeqCap EZ system protocols. Final libraries were purified with Agencourt AMPure beads and quantitated using either the KAPA qPCR kit, or the Qubit 2.0 Fluorometer (Life Technologies) and Qubit dsDNA HS Assay Kit. Pools were diluted to 20 pmol/L and were sequenced on Illumina MiSeq (V3 600 cycle kit) or HiSeq 2500 (V4 250 cycle kit) machines. Exome capture and sequencing was per-formed using libraries previously prepared for targeted sequencing, and following the identical protocols described above, utilizing the Roche Nimblegen SeqCap EZ MedExome kit. Sequencing data have been deposited to the European Genome–phenome Archive (EGA) under accession EGAS00001003113 (as patients PC-001 to PC-202).
Sequence Alignment and Quality ControlPaired-end reads were aligned against the hg38 reference genome
using Bowtie-2.3.0 (35). Optical and PCR duplicates were removed using samblaster 0.1.24 (36). Adapters were trimmed in paired mode using cutadapt 1.11 (37). Low-quality read tails (smoothed baseq <30) were trimmed using an in-house algorithm. Per-base read coverages in target regions were counted using bedtools 2.25.0 (38). cfDNA/white blood cell (WBC) sample pairings were verified based on SNP genotypes.
Analysis of Somatic MutationsSomatic mutations were called in cfDNA samples by searching for
variants with an alternate allele fraction of at least 1% and at least 10 supporting reads. Additionally, the allele fraction was required to be 25 times higher than the background error rate (i.e., the average allele fraction across all WBC samples), and 3 times higher than the allele fraction in the paired WBC sample. The paired WBC sample was required to have at least 20 reads covering the site. Protein-level consequences of variants were predicted using ANNOVAR (39).
Analysis of Germline VariantsGermline variants were called in WBC samples by searching for
variants with an alternate allele fraction of at least 15% and at least 5 supporting reads. Germline variants with a population allele fre-quency of 0.5% or higher in the KAVIAR or ExAC databases were ignored. Protein-level consequences of variants were predicted using ANNOVAR (39).
Estimation of ctDNA FractionctDNA fractions (ctDNA%) were estimated based on the allele
fractions of autosomal somatic mutations. We first observed that the mutant allele fraction (MAF) in diploid chromosomes is high-est when the mutation is combined with LOH (somatic mutations in genes with a detectable amplification were ignored in ctDNA% estimation). In this situation, the MAF and ctDNA% are related as
Research. on March 23, 2020. © 2018 American Association for Cancercancerdiscovery.aacrjournals.org Downloaded from
Published OnlineFirst January 24, 2018; DOI: 10.1158/2159-8290.CD-17-0937
ctDNA and Resistance to AR-Targeted Therapy RESEARCH ARTICLE
APRIL 2018 CANCER DISCOVERY | 455
MAF = (ctDNA × 1)/[(1 − ctDNA) × 2 + ctDNA × 1], and so ctDNA = 2/(1/MAF + 1). Because deletions and LOH are not detectable from low ctDNA fractions, we conservatively assumed that all mutations could have associated LOH. To deal with stochastic variation in observed mutant allele read counts, we modeled the mutant read count as arising from a binomial distribution, and conservatively calculated what the true MAF would be if the highest observed MAF was a 95% quantile outlier.
Copy-Number CallingReads were counted in all capture regions using bedtools 2.25.0
(38). Coverage log ratios were calculated against a median reference derived from all WBC samples. Guanine-cytosine (GC) fraction was calculated for all target regions, and Loess regression was applied to bait log ratios to correct for GC content bias. After GC bias correc-tion, read counts were corrected for residual differences in overall coverage using median-of-ratios normalization.
Because hemizygous copy-number changes are associated with a loss of one allele at heterozygous bases, we used WBC samples to find all heterozygous germline SNPs in captured regions, and then calcu-lated the allele fractions of those SNPs in the corresponding cfDNA samples. We then calculated a median divergence from heterozygosity, defined as median [abs(AF − 0.5)], for each gene and cfDNA sample.
A deletion was called for a gene when coverage log ratio ≤ −0.1 and MAF ≥ 0.6, or regardless of MAF if coverage log ratio ≤ −0.3. A gain was called for a gene when coverage log ratio ≥ 0.1 and MAF ≥ 0.6, or regardless of MAF if log ratio ≥ 0.3. These conservative thresholds were determined empirically by studying a plot of coverage log ratios and heterozygous SNP allele fractions in samples with and without detectable ctDNA (Supplementary Fig. S14).
ctDNA fraction–corrected absolute AR copy numbers were esti-mated using the formula Cabs = (2L − 1)/F + 1, where Cabs is the abso-lute copy number, L is the read coverage log ratio inside the gene, and F is the ctDNA fraction. cfDNA samples showing evidence for AR gain were dichotomized into low and high AR gain subgroups, using eight absolute AR copies (the median) as the threshold.
Analysis of Somatic Genomic RearrangementsUnaligned reads from each sample were split into two 30-bp anchors
(from the 5′ and 3′ ends of the read) and aligned to the hg38 genome. Discordant anchor pairs were grouped by position and breakpoint signature. Duplicate reads arising from the same original cfDNA frag-ment (or from PCR/optical duplicates of the same original cfDNA fragment) were discarded based on read IDs and read start positions. Rearrangement candidates supported by three or more unique cfDNA fragments were manually curated using IGV and BLAT.
Identification of Truncated AR Transcripts from Whole Blood
All patients were subjected to a peripheral blood (2.5 mL) collec-tion in a PAXgene RNA tube, matched to the time of baseline plasma cfDNA collection. This system has previously been used for the discov-ery of whole-blood RNA gene expression profiles that correlate with mCRPC prognoses, as well as for determining presence or absence of the truncated AR splice variant ARV7 (40–42). Tubes were stored at −80°C. We thawed blood overnight and extracted RNA using the PAXgene blood RNA kit. Reverse transcription was performed with the SuperScript II enzyme using 10 μL of total RNA. We used a stand-ard PCR and Sanger sequencing approach with primers designed flanking the rearrangement.
Statistical Framework for Survival AnalysisFor each clinical and genomic variable, hazard ratios and P val-
ues were calculated using Cox proportional hazards models, as implemented in the “survival” package (version 2.41.3) for the R
programming language (version 3.4.0). We assessed the independ-ent biomarker potential of each genomic alteration by constructing multivariate Cox proportional hazards models assessing each indi-vidual alteration (positive vs. negative) together with baseline ctDNA% (dichotomized at 2%), baseline LDH [dichotomized at upper limit of normal (ULN)], baseline ALP (dichotomized at ULN), presence of visceral metastases, baseline PSA (dichotomized at 40 ng/mL), hemoglobin (dichotomized at 130 g/L), and high Eastern Cooperative Oncology Group performance status (2 vs. 0–1) as binary covariates. Patients’ age (dichotomized at 75 years) was excluded from multi-variate models as it did not reach significance in univariate analysis (Table 2). Additionally, to test whether the prognostic effect of a given genomic alteration was independent of all other detected alterations, we constructed a single multivariate Cox proportional hazards model including all genomic variables together with the clinical prognostic factors described above. The statistical framework is illustrated in Supplementary Fig. S18.
Disclosure of Potential Conflicts of InterestC. Kollmannsberger is a consultant/advisory board member for
Pfizer, BMS, Ipsen, Astellas, Bayer, and Merck. D. Finch has received honoraria from the speakers bureaus of Janssen and Astellas and is a consultant/advisory board member for Janssen and Astellas. A.A. Azad reports receiving a commercial research grant from Astellas, has received honoraria from the speakers bureaus of Astellas and Janssen, and is a consultant/advisory board member for Astellas and Janssen. K.N. Chi reports receiving commercial research grants from Janssen and Astellas and is a consultant/advisory board member for Janssen and Astellas. No potential conflicts of interest were disclosed by the other authors.
Authors’ ContributionsConception and design: C. Kollmannsberger, A.A. Azad, M.E. Gleave, A.W. Wyatt, K.N. ChiDevelopment of methodology: M. Annala, A.A. Azad, A.W. Wyatt, K.N. ChiAcquisition of data (provided animals, acquired and managed patients, provided facilities, etc.): G. Vandekerkhove, D. Khalaf, K. Beja, E.W. Warner, C. Kollmannsberger, B.J. Eigl, D. Finch, C.D. Oja, J. Vergidis, M. Zulfiqar, A.A. Azad, M.E. Gleave, K.N. ChiAnalysis and interpretation of data (e.g., statistical analysis, bio-statistics, computational analysis): M. Annala, G. Vandekerkhove, S. Taavitsainen, K. Sunderland, C. Kollmannsberger, A.W. Wyatt, K.N. ChiWriting, review, and/or revision of the manuscript: M. Annala, G. Vandekerkhove, K. Sunderland, C. Kollmannsberger, B.J. Eigl, M. Zulfiqar, M.E. Gleave, A.W. Wyatt, K.N. ChiAdministrative, technical, or material support (i.e., reporting or organizing data, constructing databases): D. Khalaf, K. Beja, E.W. Warner, K. Sunderland, M. ZulfiqarStudy supervision: C.D. Oja, M. Zulfiqar, M. Nykter, A.W. Wyatt, K.N. Chi
AcknowledgmentsThis work was supported by CCSRI Innovation Grant #702837
(K.N. Chi and A.W. Wyatt), Prostate Cancer Canada through Movem-ber Discovery Grants #D2015-06 (A.W. Wyatt and K.N. Chi) and #D2014-13 (K.N. Chi and A.W. Wyatt) and the Movember Rising Star in Prostate Cancer research program (A.W. Wyatt), the Emil Aaltonen Foundation (M. Annala), the Prostate Cancer Foundation (A.W. Wyatt and K.N. Chi), Terry Fox New Frontiers Program Project grant #TFF116129 (M.E. Gleave, A.W. Wyatt, and K.N. Chi), and clinical trials funding from Janssen and Astellas. The study funders had no role in the design of the study; the collection, analysis, and interpre-tation of the data; the writing of the manuscript; or the decision to
Research. on March 23, 2020. © 2018 American Association for Cancercancerdiscovery.aacrjournals.org Downloaded from
Published OnlineFirst January 24, 2018; DOI: 10.1158/2159-8290.CD-17-0937
Annala et al.RESEARCH ARTICLE
456 | CANCER DISCOVERY APRIL 2018 www.aacrjournals.org
submit the manuscript for publication. We thank Lejla Gavranovic and Leanne Chiu (clinical coordinators) as well as Kelly Halvorsen and Nikita Ivanov (research nurses).
Received August 17, 2017; revised October 19, 2017; accepted January 18, 2018; published first January 25, 2018.
REFERENCES 1. Beer TM, Armstrong AJ, Rathkopf DE, Yohann L, Sternberg CN,
Higano CS, et al. Enzalutamide in metastatic prostate cancer before chemotherapy. N Engl J Med 2014;371:424–33.
2. Ryan CJ, Smith MR, de Bono JS, Arturo M, Logothetis CJ, de Souza P, et al. Abiraterone in metastatic prostate cancer without previous chemotherapy. N Engl J Med 2013;368:138–48.
3. Romanel A, Tandefelt DG, Conteduca V, Jayaram A, Casiraghi N, Wetterskog D, et al. Plasma AR and abiraterone-resistant prostate cancer. Sci Transl Med 2015;7:312re10–312re10.
4. Conteduca V, Wetterskog D, Sharabiani MTA, Grande E, Fernandez-Perez MP, Jayaram A, et al. Androgen receptor gene status in plasma DNA associates with worse outcome on enzalutamide or abiraterone for castration-resistant prostate cancer: a multi-institution correla-tive biomarker study. Ann Oncol 2017;28:1508–16.
5. Wyatt AW, Azad AA, Volik SV, Annala M, Beja K, McConeghy B, et al. Genomic alterations in cell-free DNA and enzalutamide resist-ance in castration-resistant prostate cancer. JAMA Oncol 2016;2: 1598–606.
6. Ulz P, Belic J, Graf R, Auer M, Lafer I, Fischereder K, et al. Whole-genome plasma sequencing reveals focal amplifications as a driving force in metastatic prostate cancer. Nat Commun 2016;7:12008.
7. Azad AA, Volik SV, Wyatt AW, Haegert A, Le Bihan S, Bell RH, et al. Androgen receptor gene aberrations in circulating cell-free DNA: biomarkers of therapeutic resistance in castration-resistant prostate cancer. Clin Cancer Res 2015;21:2315–24.
8. Antonarakis ES, Lu C, Wang H, Luber B, Nakazawa M, Roeser JC, et al. AR-V7 and resistance to enzalutamide and abiraterone in prostate cancer. N Engl J Med 2014;371:1028–38.
9. Scher HI, Lu D, Schreiber NA, Louw J, Graf RP, Vargas HA, et al. Association of AR-V7 on circulating tumor cells as a treatment-specific biomarker with outcomes and survival in castration-resistant prostate cancer. JAMA Oncol 2016;2:1441–9.
10. Annala M, Struss WJ, Warner EW, Beja K, Vandekerkhove G, Wong A, et al. Treatment outcomes and tumor loss of heterozy-gosity in germline DNA repair-deficient prostate cancer. Eur Urol 2017;72:34–42.
11. Wyatt AW, Annala M, Aggarwal R, Beja K, Feng F, Youngren J, et al. Concordance of circulating tumor DNA and matched metastatic tis-sue biopsy in prostate cancer. J Natl Cancer Inst 2017;109.
12. Robinson D, Van Allen EM, Wu Y-M, Schultz N, Lonigro RJ, Mosquera J-M, et al. Integrative clinical genomics of advanced prostate cancer. Cell 2015;161:1215–28.
13. Grasso CS, Wu Y-M, Robinson DR, Cao X, Dhanasekaran SM, Khan AP, et al. The mutational landscape of lethal castration-resistant prostate cancer. Nature 2012;487:239–43.
14. Ho Y, Dehm SM. Androgen receptor rearrangement and splicing vari-ants in resistance to endocrine therapies in prostate cancer. Endocri-nology 2017;158:1533–42.
15. Hu R, Dunn TA, Wei S, Isharwal S, Veltri RW, Humphreys E, et al. Ligand-independent androgen receptor variants derived from splic-ing of cryptic exons signify hormone-refractory prostate cancer. Cancer Res 2009;69:16–22.
16. Li Y, Chan SC, Brand LJ, Hwang TH, Silverstein KAT, Dehm SM. Androgen receptor splice variants mediate enzalutamide resistance in castration-resistant prostate cancer cell lines. Cancer Res 2013; 73:483–9.
17. Henzler C, Li Y, Yang R, McBride T, Ho Y, Sprenger C, et al. Truncation and constitutive activation of the androgen receptor by
diverse genomic rearrangements in prostate cancer. Nat Commun 2016;7:13668.
18. Chen CD, Welsbie DS, Tran C, Baek SH, Chen R, Vessella R, et al. Molecular determinants of resistance to antiandrogen therapy. Nat Med 2004;10:33–9.
19. Tran C, Ouk S, Clegg NJ, Chen Y, Watson PA, Arora V, et al. Develop-ment of a second-generation antiandrogen for treatment of advanced prostate cancer. Science 2009;324:787–90.
20. Attard G, Belldegrun AS, de Bono JS. Selective blockade of andro-genic steroid synthesis by novel lyase inhibitors as a therapeutic strategy for treating metastatic prostate cancer. BJU Int 2005;96: 1241–6.
21. Xue Y, Martelotto L, Baslan T, Vides A, Solomon M, Mai TT, et al. An approach to suppress the evolution of resistance in BRAFV600E-mutant cancer. Nat Med 2017;23:929–37.
22. De Laere B, van Dam P-J, Whitington T, Mayrhofer M, Diaz EH, Van den Eynden G, et al. Comprehensive profiling of the androgen recep-tor in liquid biopsies from castration-resistant prostate cancer reveals novel intra-AR structural variation and splice variant expression pat-terns. Eur Urol 2017;72:192–200.
23. Bernemann C, Schnoeller TJ, Luedeke M, Steinestel K, Boegemann M, Schrader AJ, et al. Expression of AR-V7 in circulating tumour cells does not preclude response to next generation androgen deprivation therapy in patients with castration resistant prostate cancer. Eur Urol 2017;71:1–3.
24. Castro E, Goh C, Olmos D, Saunders E, Leongamornlert D, Tymrakiewicz M, et al. Germline BRCA mutations are associated with higher risk of nodal involvement, distant metastasis, and poor survival outcomes in prostate cancer. J Clin Oncol 2013;31: 1748–57.
25. Mateo J, Carreira S, Sandhu S, Miranda S, Mossop H, Perez-Lopez R, et al. DNA-repair defects and olaparib in metastatic prostate cancer. N Engl J Med 2015;373:1697–708.
26. Cheng HH, Pritchard CC, Boyd T, Nelson PS, Montgomery B. Biallelic inactivation of BRCA2 in platinum-sensitive metastatic castration-resistant prostate cancer. Eur Urol 2016;69:992–5.
27. Goodall J, Mateo J, Yuan W, Mossop H, Porta N, Miranda S, et al. Circulating Free DNA to guide prostate cancer treatment with PARP inhibition. Cancer Discov 2017;7:1006–17.
28. Quigley D, Alumkal JJ, Wyatt AW, Kothari V, Foye A, Lloyd P, et al. Analysis of circulating cell-free DNA identifies multi-clonal hetero-geneity of BRCA2 reversion mutations associated with resistance to PARP inhibitors. Cancer Discov 2017;7:999–1005.
29. Carver BS, Chapinski C, Wongvipat J, Hieronymus H, Chen Y, Chan-darlapaty S, et al. Reciprocal feedback regulation of PI3K and andro-gen receptor signaling in PTEN-deficient prostate cancer. Cancer Cell 2011;19:575–86.
30. Beltran H, Prandi D, Mosquera JM, Benelli M, Puca L, Cyrta J, et al. Divergent clonal evolution of castration-resistant neuroendocrine prostate cancer. Nat Med 2016;22:298–305.
31. Mu P, Zhang Z, Benelli M, Karthaus WR, Hoover E, Chen C-C, et al. SOX2 promotes lineage plasticity and antiandrogen resistance in TP53- and RB1-deficient prostate cancer. Science 2017;355: 84–8.
32. Ku SY, Rosario S, Wang Y, Mu P, Seshadri M, Goodrich ZW, et al. Rb1 and Trp53 cooperate to suppress prostate cancer lineage plas-ticity, metastasis, and antiandrogen resistance. Science 2017;355: 78–83.
33. de Bono JS, De Giorgi U, Massard C, Bracarda S, Nava Rodrigues D, Kocak I, et al. PTEN loss as a predictive biomarker for the Akt inhibi-tor ipatasertib combined with abiraterone acetate in patients with metastatic castration-resistant prostate cancer (mCRPC). Ann Oncol 2016;27:7180
34. Scher HI, Heller G, Molina A, Attard G, Danilla DC, Jia X, et al. Cir-culating tumor cell biomarker panel as an individual-level surrogate for survival in metastatic castration-resistant prostate cancer. J Clin Oncol 2015;33:1348–55
35. Langmead B, Salzberg SL. Fast gapped-read alignment with Bowtie 2. Nat Methods 2012;9:357–9.
Research. on March 23, 2020. © 2018 American Association for Cancercancerdiscovery.aacrjournals.org Downloaded from
Published OnlineFirst January 24, 2018; DOI: 10.1158/2159-8290.CD-17-0937

ctDNA and Resistance to AR-Targeted Therapy RESEARCH ARTICLE
APRIL 2018 CANCER DISCOVERY | 457
36. Faust GG, Hall IM. SAMBLASTER: fast duplicate marking and struc-tural variant read extraction. Bioinformatics 2014;30:2503–5.
37. Martin M. Cutadapt removes adapter sequences from high-through-put sequencing reads. EMBnet.J 2011;17:10–2.
38. Quinlan AR, Hall IM. BEDTools: a flexible suite of utilities for com-paring genomic features. Bioinformatics 2010;26:841–2.
39. Wang K, Li M, Hakonarson H. ANNOVAR: functional annotation of genetic variants from high-throughput sequencing data. Nucleic Acids Res 2010;38:e164.
40. Olmos D, Brewer D, Clark J, Danila DC, Parker C, Attard G, et al. Prognostic value of blood mRNA expression signatures in castration-
resistant prostate cancer: a prospective, two-stage study. Lancet Oncol 2012;13:1114–24.
41. Danila DC, Anand A, Schultz N, Heller G, Wan M, Sung CC, et al. Analytic and clinical validation of a prostate cancer-enhanced mes-senger RNA detection assay in whole blood as a prognostic biomarker for survival. Eur Urol 2014;65:1191–7.
42. Todenhöfer T, Azad A, Stewart C, Gao J, Eigl BJ, Gleave ME, et al. AR-V7 transcripts in whole blood RNA of patients with metastatic castra-tion resistant prostate cancer correlate with response to abiraterone acetate. J Urol 2017;197:135–42.
Research. on March 23, 2020. © 2018 American Association for Cancercancerdiscovery.aacrjournals.org Downloaded from
Published OnlineFirst January 24, 2018; DOI: 10.1158/2159-8290.CD-17-0937
2018;8:444-457. Published OnlineFirst January 24, 2018.Cancer Discov Matti Annala, Gillian Vandekerkhove, Daniel Khalaf, et al. Abiraterone and Enzalutamide in Prostate CancerCirculating Tumor DNA Genomics Correlate with Resistance to
Updated version
10.1158/2159-8290.CD-17-0937doi:
Access the most recent version of this article at:
Material
Supplementary
http://cancerdiscovery.aacrjournals.org/content/suppl/2018/01/24/2159-8290.CD-17-0937.DC1
Access the most recent supplemental material at:
Cited articles
http://cancerdiscovery.aacrjournals.org/content/8/4/444.full#ref-list-1
This article cites 41 articles, 11 of which you can access for free at:
Citing articles
http://cancerdiscovery.aacrjournals.org/content/8/4/444.full#related-urls
This article has been cited by 12 HighWire-hosted articles. Access the articles at:
E-mail alerts related to this article or journal.Sign up to receive free email-alerts
Subscriptions
Reprints and
To order reprints of this article or to subscribe to the journal, contact the AACR Publications
Permissions
Rightslink site. Click on "Request Permissions" which will take you to the Copyright Clearance Center's (CCC)
.http://cancerdiscovery.aacrjournals.org/content/8/4/444To request permission to re-use all or part of this article, use this link
Research. on March 23, 2020. © 2018 American Association for Cancercancerdiscovery.aacrjournals.org Downloaded from
Published OnlineFirst January 24, 2018; DOI: 10.1158/2159-8290.CD-17-0937