CIRCULAR LAMB AND LINEAR SHEAR HORIZONTAL GUIDED WAVE …ultrasonics/s/cicrular lamb and... ·...
6
CIRCULAR LAMB AND LINEAR SHEAR HORIZONTAL GUIDED WAVE ARRAYS FOR STRUCTURAL HEALTH MONITORING Thomas R. Hay, Jason Van Velsor, Joseph L. Rose The Pennsylvania State University Engineering Science and Mechanics Department 212 Earth and Engineering Science Building University Park, Pa 16802 ABSTRACT Piezoelectric ultrasonic sensors are currently being used for long term monitoring of helicopter components for fatigue cracking. While the current sensors are field proven, new sensors are required for larger area inspections from a single probe position. Circular PVDF arrays show potential for large area inspection as they flood the entire structure with guided waves in the vicinity of the sensor. The circular array can be divided into elements to provide a circumferential image of the damage in the vicinity of the sensor. The paper also discusses work on piezoelectric sensors used to excite shear horizontal guided waves. The presented design is similar to the inter-digital transducers used to excite Lamb waves. This design is favored for embedded and leave-in-place sensors applications due to the low profile, cost, and weight compared to EMATs. KEY WORDS Ultrasound, guided wave, circular array, large area damage detection. INTRODUCTION The inherent advantage associated with using guided waves in structural health monitoring (SHM) applications is their ability to monitor extensive structural area from a single sensor position. In the pipeline industry, for example, guided waves are now being used to detect damage hundreds of feet away from the excitation and receiving sensors. Similar applications also exist in the aerospace industry; fatigue cracks can be detected from a remotely located transducer [1-5], lap-splice and multi-layer structures [6] may be inspected without direct access to the region of interest, and honeycomb – skin interfaces [7] may be evaluated in a line scan fashion versus a point by point method. To further advance the of current state-of-the-art in guided wave SHM new sensor designs must be conceived, existing sensors must be modified for the SHM philosophy versus periodic monitoring designs, and robust data acquisition and signal processing schemes must be developed and/or modified to provide defect location and classification. This paper discusses the potential for large area inspection using piezopolymer circular Lamb wave arrays as well as piezoelectric inter-digital shear-horizontal (SH) wave transducers. The main emphasis in this paper is the circular array while more discussion on the SH wave sensor is given in the presentation.
Transcript of CIRCULAR LAMB AND LINEAR SHEAR HORIZONTAL GUIDED WAVE …ultrasonics/s/cicrular lamb and... ·...

CIRCULAR LAMB AND LINEAR SHEAR HORIZONTAL GUIDED WAVE ARRAYS FOR STRUCTURAL HEALTH MONITORING
Thomas R. Hay, Jason Van Velsor, Joseph L. Rose
The Pennsylvania State University Engineering Science and Mechanics Department
212 Earth and Engineering Science Building University Park, Pa 16802
ABSTRACT
Piezoelectric ultrasonic sensors are currently being used for long term monitoring of helicopter components for fatigue cracking. While the current sensors are field proven, new sensors are required for larger area inspections from a single probe position. Circular PVDF arrays show potential for large area inspection as they flood the entire structure with guided waves in the vicinity of the sensor. The circular array can be divided into elements to provide a circumferential image of the damage in the vicinity of the sensor. The paper also discusses work on piezoelectric sensors used to excite shear horizontal guided waves. The presented design is similar to the inter-digital transducers used to excite Lamb waves. This design is favored for embedded and leave-in-place sensors applications due to the low profile, cost, and weight compared to EMATs.
KEY WORDS Ultrasound, guided wave, circular array, large area damage detection.
INTRODUCTION The inherent advantage associated with using guided waves in structural health monitoring (SHM) applications is their ability to monitor extensive structural area from a single sensor position. In the pipeline industry, for example, guided waves are now being used to detect damage hundreds of feet away from the excitation and receiving sensors. Similar applications also exist in the aerospace industry; fatigue cracks can be detected from a remotely located transducer [1-5], lap-splice and multi-layer structures [6] may be inspected without direct access to the region of interest, and honeycomb – skin interfaces [7] may be evaluated in a line scan fashion versus a point by point method. To further advance the of current state-of-the-art in guided wave SHM new sensor designs must be conceived, existing sensors must be modified for the SHM philosophy versus periodic monitoring designs, and robust data acquisition and signal processing schemes must be developed and/or modified to provide defect location and classification. This paper discusses the potential for large area inspection using piezopolymer circular Lamb wave arrays as well as piezoelectric inter-digital shear-horizontal (SH) wave transducers. The main emphasis in this paper is the circular array while more discussion on the SH wave sensor is given in the presentation.

EXPERIMENTAL PROCEDURE The circular Lamb wave array was constructed using patterned circular electrodes and 100um PVDF film. The device has and extermely flat profile as and can be coated with a protective epoxy with little or no performance trade-off. The array shown in Fig. 1 consists of 4 individual elements connected via a common electrode. In this case all the elements are activated in phase. The spacing between the elements is equal to the wavelength of the desired Lamb wave mode in the plate which is caluated using the phase velocity dispersion curves. The element width is generally equal to half the wavelength.
Figure 1. Lamb wave circular array.
The actual array used for the testing discussed in this paper was segmented into 16 individual circumferential elements. Each element was individually addressed through a 16 channel multi-plexer. The motivation for using the segmented area was to provide information on defect distance from the sensors as well as the polar location of the defect. The unsegmented array show in Fig. 1 can only provide information on the distance to the defect from the outer circular element of the array. The segmented array was bonded to an 0.040” thick aluminum plate 4’x8’ wide. This thickness was used since it is representative of aircraft skin. The dimensions of the plate were based on the largest commercially available sheet size. The sensor was bonded to the center of the plate. The plate was segmented into 16 sectors based on the dimensions of the segmented circular array as shown in Fig. 2. Seven simulated defects were introduced into sectors 3,6,8,10, 12, and 13. The defects included holes, wall thinning, and notches. The defects were located at different distances from the array. The testing was performed using a toneburst signal generator with a 300 V output. The receiver has an output of 4 V and a dynamic range of 70 dB. The maximum pulse width of the gated sinusoid is 13 us. For the experiment described above, the A0 mode was used at 1.25 MHz. Detailed information on the defect type, size, and sector are given in Table 1.

Figure 2. Sectored 0.040” aluminum skin with simulated defects. Circular array is located in the center of the plate.
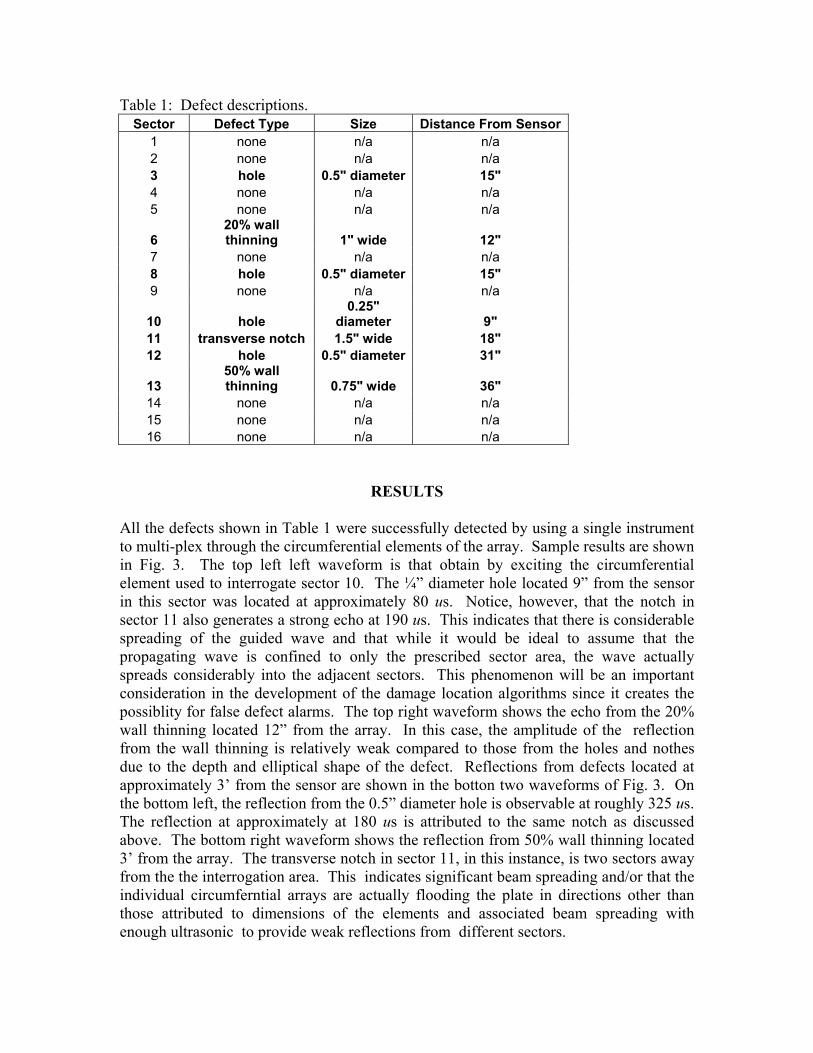
Table 1: Defect descriptions. Sector Defect Type Size Distance From Sensor
1 none n/a n/a 2 none n/a n/a 3 hole 0.5" diameter 15" 4 none n/a n/a 5 none n/a n/a
6 20% wall thinning 1" wide 12"
7 none n/a n/a 8 hole 0.5" diameter 15" 9 none n/a n/a
10 hole 0.25"
diameter 9" 11 transverse notch 1.5" wide 18" 12 hole 0.5" diameter 31"
13 50% wall thinning 0.75" wide 36"
14 none n/a n/a 15 none n/a n/a 16 none n/a n/a
RESULTS All the defects shown in Table 1 were successfully detected by using a single instrument to multi-plex through the circumferential elements of the array. Sample results are shown in Fig. 3. The top left left waveform is that obtain by exciting the circumferential element used to interrogate sector 10. The ¼” diameter hole located 9” from the sensor in this sector was located at approximately 80 us. Notice, however, that the notch in sector 11 also generates a strong echo at 190 us. This indicates that there is considerable spreading of the guided wave and that while it would be ideal to assume that the propagating wave is confined to only the prescribed sector area, the wave actually spreads considerably into the adjacent sectors. This phenomenon will be an important consideration in the development of the damage location algorithms since it creates the possiblity for false defect alarms. The top right waveform shows the echo from the 20% wall thinning located 12” from the array. In this case, the amplitude of the reflection from the wall thinning is relatively weak compared to those from the holes and nothes due to the depth and elliptical shape of the defect. Reflections from defects located at approximately 3’ from the sensor are shown in the botton two waveforms of Fig. 3. On the bottom left, the reflection from the 0.5” diameter hole is observable at roughly 325 us. The reflection at approximately at 180 us is attributed to the same notch as discussed above. The bottom right waveform shows the reflection from 50% wall thinning located 3’ from the array. The transverse notch in sector 11, in this instance, is two sectors away from the the interrogation area. This indicates significant beam spreading and/or that the individual circumferntial arrays are actually flooding the plate in directions other than those attributed to dimensions of the elements and associated beam spreading with enough ultrasonic to provide weak reflections from different sectors.

-0.6
-0.4
-0.2
0
0.2
0.4
0.6
0 50 100 150 200 250 300 350 400 450
time (µs)
ampl
itude
(mV
)
Defect
0.25” Diameter Hole9” from sensor
-0.6
-0.4
-0.2
0
0.2
0.4
0.6
0 50 100 150 200 250 300 350 400 450
time (µs)
ampl
itude
(mV
)
Backwall Defect
20% Wall Thinning12” from sensor 1” long
BackwallNotch (13)
-0.6
-0.4
-0.2
0
0.2
0.4
0.6
0 50 100 150 200 250 300 350 400 450
time (µs)
ampl
itude
(mV
)
-0.6
-0.4
-0.2
0
0.2
0.4
0.6
0 50 100 150 200 250 300 350 400 450
time (µs)
ampl
itude
(mV
)
Notch (13)Defect
1.5” Notch 18” from sensor
Defect
0.5” Diameter Hole 15” from sensor
-0.6
-0.4
-0.2
0
0.2
0.4
0.6
0 50 100 150 200 250 300 350 400 450
time (µs)
ampl
itude
(mV
)
-0.6
-0.4
-0.2
0
0.2
0.4
0.6
0 50 100 150 200 250 300 350 400 450
time (µs)
ampl
itude
(mV
)
Sidewall Notch (13)
50% Wall Thinning36” from sensor 3/4” long
Defect Notch (13)
0.5” Diameter Hole 31” from sensor
Defect
Figure 3. Multiple defect detection using circular Lamb wave array.

CONCLUSIONS The work in this paper focuses mainly on large area damage detection from a single sensor position using a circumfernetially segmented circular Lamb wave array. A 16 element circular array was controlled via a data acauisition system with a 16 channel multi-plexer. A 0.040” thick aluminum skin, 4’x 8’ in size, was divided up into 16 equal sectors. Seven of the sectors had defects at different distances from the array. The array successfully detected and located the defects summarized in Table 1. It was noted, however, that reflections from defects located in other sectors than that being evaluated are registered due to the spreading of the guided wave in the aluminum skin. While the assumption that the wave travels in an area defined by the dimensions of the circumferential element is appropriate for demonstration purposes, future work will focus on quantifying the beam spreading phenomenon associated with the segmented array elements. This will improve the damage location algorithm and minimize the possiblity of false defect alarms.
REFERENCES
1.
2.
3.
4.
5.
6.
7.
Rose, J.L., Hay, T.R., Recent Progress and Future Work On Small Crack Detection in Aircraft, 5th International Aircraft Corrosion Workshop Proceedings, Solomons, MD, 2002. Rose, J.L., Hay. T.R., A Leave-in-place Sensor For Damage Detection in an SH-60 Helicopter Transmission Beam, USAF Aircraft Structural Integrity Program, Williamsburg, Va, Dec. 11-13, 2001. Hay, T.R., Rose, J.L., Agarwala. V., Stephenson, J.E., New technological challenges for guided wave NDE, Tri-Service Corrosion Conference, San Antonio, Tx, Jan 14-18, 2002. J.L. Rose, L. Soley, “Ultrasonic guided waves for the detection of anomalies in aircraft components”, Materials Evaluation, Vol. 50, No. 9, Pgs. 1080-1086, Sept. 2000. Hay, T.R. and Rose, J.L. (2002) Guided Wave Testing Optimization. Materials Evaluation, 60 (10), 1239-1344. 5. Rose, J.L., Barshinger, J.N., Meyer, P. “Ultrasonic Guided Wave Inspection of a 747 Tear Strap Structure”, ASNT 1997 Fall Conference and Quality Testing Show, Pittsburgh, Pa 1997, pp 171-173. Hay, T.R., Wei Lou, Hayashi, Takahiro, and Rose, J.L. (2003) Rapid Inspection of Composite Skin-Honeycomb Core Structures with Ultrasonic Guided Waves, Journal of Composite Materials, Vol. 37, No. 10, 929-939.