CINEPLEX INC. Reports Third Quarter...
23
FOR IMMEDIATE RELEASE CINEPLEX INC. Reports Third Quarter Results TORONTO, Canada, November 7, 2017 (TSX: CGX) - Cineplex Inc. (“Cineplex”) today released its financial results for the three and nine months ended September 30, 2017. Unless otherwise specified, all amounts are in Canadian dollars. Third Quarter Results 2017 2016 Period over Period Change (i) Total revenues $ 370.4million $ 376.0 million -1.5% Attendance 16.8million 19.2million -12.8% Net income $ 17.2million $ 26.0 million -33.8% Box office revenues per patron (“BPP”) (ii) (iii) $ 9.81 $ 9.65 1.7% Concession revenues per patron (“CPP”) (ii) $ 6.01 $ 5.69 5.6% Adjusted EBITDA (ii) $ 58.8million $ 67.3 million -12.6% Adjusted EBITDA margin (ii) 15.9 % 17.9 % -2.0% Adjusted free cash flow (ii) $ 37.9million $ 46.9 million -19.1% Adjusted free cash flow per common share of Cineplex (“Share”) (ii) $ 0.597 $ 0.739 -19.2% Earnings per Share (“EPS”) - basic $ 0.27 $ 0.42 -35.7% EPS excluding change in fair value of financial instrument - basic (ii) $ 0.24 $ 0.42 -42.9% EPS - diluted $ 0.27 $ 0.41 -34.1% EPS excluding change in fair value of financial instrument - diluted (ii) $ 0.24 $ 0.41 -41.5% Year to Date Results 2017 2016 Period over Period Change (i) Total revenues $ 1,128.8million $ 1,092.9 million 3.3% Attendance 52.8million 56.7 million -6.7% Net income $ 41.6million $ 54.7 million -24.0% Box office revenues per patron (“BPP”) (ii) (iii) $ 10.04 $ 9.72 3.3% Concession revenues per patron (“CPP”) (ii) $ 5.90 $ 5.61 5.2% Adjusted EBITDA (ii) $ 156.3million $ 167.2 million -6.5% Adjusted EBITDA margin (ii) 13.8 % 15.3 % -1.5% Adjusted free cash flow (ii) $ 99.3million $ 116.4 million -14.7% Adjusted free cash flow per common share of Cineplex (“Share”) (ii) $ 1.563 $ 1.835 -14.8% Earnings per Share (“EPS”) - basic $ 0.66 $ 0.88 -25.0% EPS excluding change in fair value of financial instrument - basic (ii) $ 0.62 $ 0.88 -29.5% EPS - diluted $ 0.66 $ 0.88 -25.0% EPS excluding change in fair value of financial instrument - diluted (ii) $ 0.62 $ 0.88 -29.5%
-
Upload
truongmien -
Category
Documents
-
view
217 -
download
2
Transcript of CINEPLEX INC. Reports Third Quarter...

FOR IMMEDIATE RELEASE
CINEPLEX INC.
Reports Third Quarter Results
TORONTO, Canada, November 7, 2017 (TSX: CGX) - Cineplex Inc. (“Cineplex”) today released its financial results for the three
and nine months ended September 30, 2017. Unless otherwise specified, all amounts are in Canadian dollars.
Third Quarter Results
2017 2016 Period over Period
Change (i)
Total revenues $ 370.4 million $ 376.0 million -1.5 %
Attendance 16.8 million 19.2 million -12.8 %
Net income $ 17.2 million $ 26.0 million -33.8 %
Box office revenues per patron (“BPP”) (ii) (iii) $ 9.81 $ 9.65 1.7 %
Concession revenues per patron (“CPP”) (ii) $ 6.01 $ 5.69 5.6 %
Adjusted EBITDA (ii) $ 58.8 million $ 67.3 million -12.6 %
Adjusted EBITDA margin (ii) 15.9 % 17.9 % -2.0 %
Adjusted free cash flow (ii) $ 37.9 million $ 46.9 million -19.1 %
Adjusted free cash flow per common share of Cineplex (“Share”) (ii) $ 0.597
$ 0.739
-19.2 %
Earnings per Share (“EPS”) - basic $ 0.27
$ 0.42
-35.7 %
EPS excluding change in fair value of financial instrument - basic (ii) $ 0.24
$ 0.42
-42.9 %
EPS - diluted $ 0.27 $ 0.41 -34.1 %
EPS excluding change in fair value of financial instrument - diluted (ii) $ 0.24
$ 0.41
-41.5 %
Year to Date Results
2017 2016 Period over Period
Change (i)
Total revenues $ 1,128.8 million $ 1,092.9 million 3.3 %
Attendance 52.8 million 56.7 million -6.7 %
Net income $ 41.6 million $ 54.7 million -24.0 %
Box office revenues per patron (“BPP”) (ii) (iii) $ 10.04 $ 9.72 3.3 %
Concession revenues per patron (“CPP”) (ii) $ 5.90 $ 5.61 5.2 %
Adjusted EBITDA (ii) $ 156.3 million $ 167.2 million -6.5 %
Adjusted EBITDA margin (ii) 13.8 % 15.3 % -1.5 %
Adjusted free cash flow (ii) $ 99.3 million $ 116.4 million -14.7 %
Adjusted free cash flow per common share of Cineplex (“Share”) (ii) $ 1.563
$ 1.835
-14.8 %
Earnings per Share (“EPS”) - basic $ 0.66
$ 0.88
-25.0 %
EPS excluding change in fair value of financial instrument - basic (ii) $ 0.62
$ 0.88
-29.5 %
EPS - diluted $ 0.66 $ 0.88 -25.0 %
EPS excluding change in fair value of financial instrument - diluted (ii) $ 0.62
$ 0.88
-29.5 %

i. Period over period change calculated based on thousands of dollars except percentage and per share values. Changes in percentage amounts are
calculated as 2017 value less 2016 value.
ii. Adjusted EBITDA, adjusted EBITDA margin, adjusted free cash flow per common share of Cineplex, BPP, CPP and EPS excluding change in fair
value of financial instrument items are measures that do not have a standardized meaning under generally accepted accounting principles
("GAAP"). These measures as well as other Non-GAAP financial measures reported by Cineplex are defined in the 'Non-GAAP Financial
Measures' section at the end of this news release.
iii. Prior period figures have been reclassified to conform to current period presentation. See section ‘Financial statement presentation’ for further
details.
“Total revenue for the third quarter decreased 1.5% to $370.4 million, primarily due to decreased attendance as a result of weaker
film product during the period,” said Ellis Jacob, President and CEO, Cineplex. “Despite the proactive cost control measures, the
attendance decline coupled with incremental costs related to the opening, ramp-up and integration of our new business initiatives
resulted in a 12.6% decrease in Adjusted EBITDA to $58.8 million for the quarter.”
Although attendance was down, box office per patron of $9.81 and concession per patron of $6.01, represented new third quarter
records. Media revenue decreased 11.1% to $39.9 million, primarily due to a decline in cinema advertising and the timing of digital
signage installations. Amusement revenue of $48.9 million increased 81.5% versus the prior year period, largely due to the 2016
acquisitions of Tricorp Amusements and SAW LLC, and of Dandy Amusements in the second quarter of 2017.
Key accomplishments during the quarter included the opening of our third location of The Rec Room at West Edmonton Mall and
the continued rollout of luxury recliners in select theatres across the country. Our SCENE loyalty program continues to grow its
membership, reaching 8.7 million members during the quarter. In addition, we increased our credit facility capacity and announced
a normal course issuer bid.
Although our third quarter results were adversely affected by the quality of film product and the integration and ramp-up of new
businesses, we are encouraged by the outlook for the fourth quarter film product and are confident that we are positioning the
company for success in the future.
KEY DEVELOPMENTS IN THE THIRD QUARTER OF 2017
The following describes certain key business initiatives undertaken and results achieved during the third quarter of 2017 in each of
Cineplex’s core business areas:
FILM ENTERTAINMENT AND CONTENT
Theatre Exhibition
• Reported third quarter box office revenues of $164.5 million, a decrease of $20.9 million (11.3%) from the $185.4 million
reported in the prior year period due to a 12.8% decrease in attendance.
• BPP was $9.81, a third quarter record for Cineplex, $0.16 (1.7%) higher than the $9.65 reported during the prior year
period.
• Converted 18 auditoriums to recliner seating during the quarter.
• Announced a partnership with IMAX to install the first IMAX VR Centre in Canada at Cineplex’s Scotiabank Theatre
Toronto. The VR Centre consists of multiple “pods” to allow players to enjoy interactive VR experiences in a social
environment.
• Announced the installation of D-BOX VR motion seats and VR Systems at Cineplex’s Scotiabank Theatre Ottawa.
Theatre Food Service
• Reported third quarter food service revenues of $100.7 million, a decrease of $8.5 million or 7.8% from the prior year
period as a result of the decrease in attendance.
• CPP was $6.01, a third quarter record for Cineplex, $0.32 (5.6%) higher than the $5.69 reported during the prior year
period.
Alternative Programming
• Presented the live Mayweather vs. McGregor match featured in VIP Cinemas and concerts including André Rieu’s
Maastricht Concert and David Gilmour live in Pompeii.
• Featured numerous strong performing international films, including Mandarin, Hindi and Punjabi in select markets
across the country.
Digital Commerce
• Cineplex.com registered an 18% increase in visits during the third quarter of 2017 compared to the prior year period.

• Online and mobile ticketing represented 20.2% of total admissions during the third quarter.
• Monthly active users of the Cineplex Store increased 73% as compared to the prior year period.
• Cineplex store registered a 66% increase in device activations over the prior year period.
MEDIA
• Reported third quarter total media revenues of $39.9 million, a decrease of $5.0 million, or 11.1% compared to the prior
year period.
Cinema Media
• Reported third quarter revenues of $27.4 million, compared to $29.1 million in the prior year period, a decrease of 5.8%
primarily due to a decrease in onscreen advertising.
Digital Place-Based Media
• Reported third quarter revenues of $12.5 million, a decrease of $3.3 million compared to the prior year period due to lower
project installation revenues partially offset by higher advertising revenue generated from an expanded client base.
AMUSEMENT AND LEISURE
Amusement Solutions
• Reported third quarter revenues of $48.9 million, an increase of $22.0 million over the prior year period. The increase was
primarily due to the acquisitions of Tricorp and SAW, which were acquired in the fourth quarter of 2016 and Dandy, which
was acquired in the second quarter of 2017.
Location Based Entertainment
• The Rec Room reported third quarter food service revenues of $6.3 million and amusement revenues of $4.3 million.
• Opened the third location of The Rec Room in Edmonton at the West Edmonton Mall on August 23, 2017.
• Announced an exclusive partnership with Topgolf to bring multiple Topgolf sports entertainment complexes to markets
across Canada. Topgolf brings together golfers of all ages and skill levels for competitive play in the comfort of a climate-
controlled sports and entertainment destination.
eSports
• In September 2017, WGN hosted the finals of the Counter-Strike: Global Offensive Canadian Championship Series at the
Scotiabank Theatre Toronto, Ontario.
LOYALTY
• Membership in the SCENE loyalty program increased by 0.2 million members in the period, reaching 8.7 million at
September 30, 2017.
• Announced the launch of a new program for SCENE members, which will allow them to earn and redeem SCENE points
for food and drink purchases within Cineplex theatres.
CORPORATE
• During the quarter, Cineplex filed for a normal course issuer bid (“NCIB”) with the Toronto Stock Exchange allowing
Cineplex to purchase up to 6,308,955 shares through September 2018. All of the shares purchased will be cancelled.
During the three months ended September 30, 2017, 157,192 shares were purchased and cancelled by Cineplex for $6.0
million.
• Cineplex was once again the entertainment sponsor for WE Day Family which was held at the Air Canada Centre in
Toronto, Ontario.
• During the quarter, under provisions in its Credit Facility (defined and discussed in Section 6.4, Credit Facilities), Cineplex
increased the Revolving Facility by $75.0 million with the Term Facility remaining unchanged.

OPERATING RESULTS FOR THE THREE AND NINE MONTHS ENDED SEPTEMBER 30, 2017
Total revenues
Total revenues for the three months ended September 30, 2017, decreased $5.5 million (1.5%) to $370.4 million as compared to the
prior year period. Total revenues for the nine months ended September 30, 2017 increased $35.9 million (3.3%) to $1.1 billion as
compared to the prior year period. A discussion of the factors affecting the changes in box office, food service, media, amusement
and other revenues for the period is provided below.
Non-GAAP measures discussed throughout this MD&A, including adjusted EBITDA, adjusted free cash flow, attendance, BPP,
premium priced product, same theatre metrics, CPP, film cost percentage, food service cost percentage and concession margin per
patron are defined and discussed in the Non-GAAP measures section of this news release.
Box office revenues
The following table highlights the movement in box office revenues, attendance and BPP for the quarter and the year to date (in
thousands of dollars, except attendance reported in thousands of patrons and per patron amounts, unless otherwise noted):
Box office revenues Third Quarter Year to Date
2017 2016 Change 2017 2016 Change
Box office revenues (i) $ 164,493 $ 185,412 -11.3 % $ 530,557 $ 550,780 -3.7 %
Attendance (ii) 16,766 19,219 -12.8 % 52,843 56,660 -6.7 %
Box office revenue per patron (i) (ii) $ 9.81 $ 9.65 1.7 % $ 10.04 $ 9.72 3.3 %
BPP excluding premium priced product (ii) $ 8.40 $ 8.20 2.4 % $ 8.52 $ 8.26 3.1 %
Canadian industry revenues (iii) -10.1 % -1.9 %
Same theatre box office revenues (i) (ii) $ 162,332 $ 184,690 -12.1 % $ 518,151 $ 545,733 -5.1 %
Same theatre attendance (ii) 16,562 19,138 -13.5 % 51,793 56,183 -7.8 %
% Total box from premium priced product (i) (ii) 43.8 % 48.1 % -4.3 % 46.7 % 47.1 % -0.4 %
(i) Prior period figures have been reclassified to conform to current period presentation. See section ‘Financial statement presentation’ for further details.
(ii) See Non-GAAP measures section of this news release.
(iii) Source: The Movie Theatre Association of Canada industry data adjusted for calendar quarter dates.
Box office continuity (i) Third Quarter Year to Date
Box Office Attendance Box Office Attendance
2016 as reported $ 185,412 19,219 $ 550,780 56,660 Same theatre attendance change (24,854 ) (2,575 ) (42,639 ) (4,390 )
Impact of same theatre BPP change 2,495 — 15,057 —
New and acquired theatres (ii) 1,546 137 8,197 693
Disposed and closed theatres (ii) (106 ) (15 ) (838 ) (120 )
2017 as reported $ 164,493 16,766 $ 530,557 52,843
(i) Prior period figures have been reclassified to conform to current period presentation. See section ‘Financial statement presentation’ for further details.
(i) See Non-GAAP measures section of this news release. Represents theatres opened, acquired, disposed or closed subsequent to the start of the prior year comparative period.
Third Quarter
Third Quarter 2017 Top Cineplex Films 3D % Box Third Quarter 2016 Top Cineplex Films 3D % Box
1 Spider-Man: Homecoming 13.8 % 1 Suicide Squad 12.0 %
2 It 10.1 % 2 The Secret Life of Pets 11.2 %
3 Despicable Me 3 9.1 % 3 Star Trek Beyond 6.9 %
4 Dunkirk 9.1 % 4 Jason Bourne 6.6 %
5 War For The Planet Of The Apes 5.4 % 5 Finding Dory 5.8 %
Box office revenues decreased $20.9 million, or 11.3%, to $164.5 million during the period, compared to $185.4 million reported in
the strong third quarter in 2016. The decrease was due to a 12.8% decrease in attendance to 16.8 million guests, partially offset by
the higher BPP. The attendance decrease was due to the weaker film slate in the third quarter of 2017 compared to the third quarter
of 2016 in addition to the impact of auditorium closures during recliner conversions.
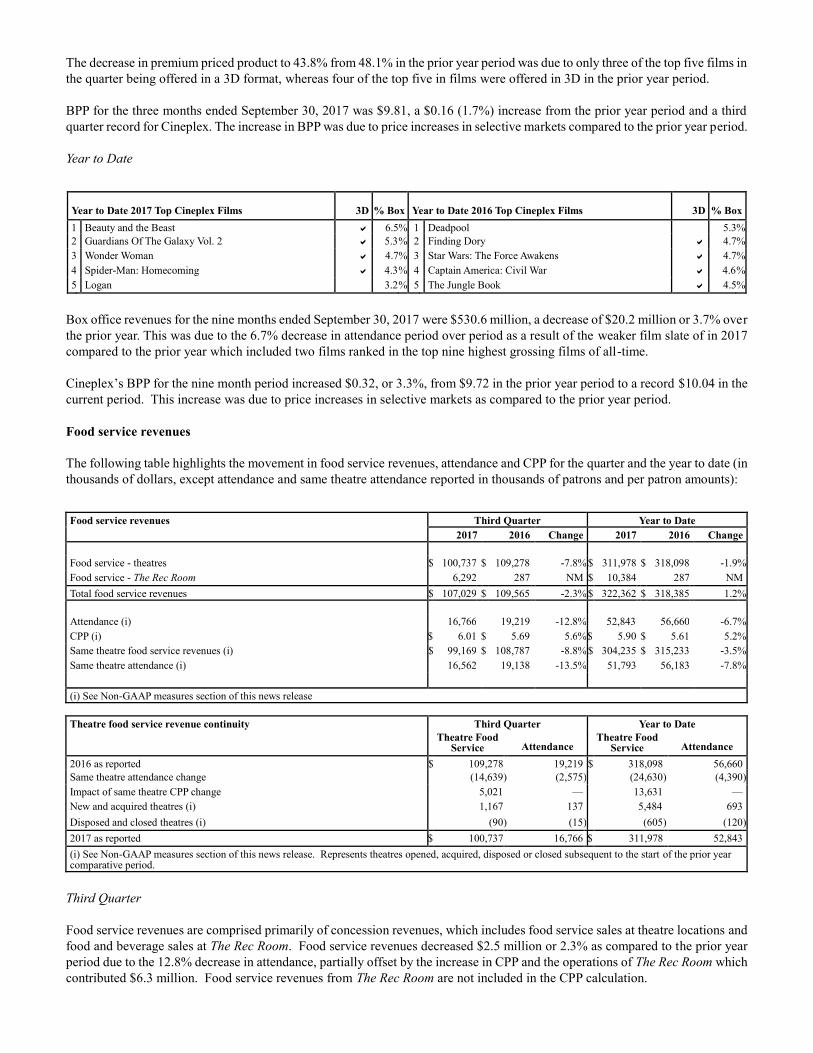
The decrease in premium priced product to 43.8% from 48.1% in the prior year period was due to only three of the top five films in
the quarter being offered in a 3D format, whereas four of the top five in films were offered in 3D in the prior year period.
BPP for the three months ended September 30, 2017 was $9.81, a $0.16 (1.7%) increase from the prior year period and a third
quarter record for Cineplex. The increase in BPP was due to price increases in selective markets compared to the prior year period.
Year to Date
Year to Date 2017 Top Cineplex Films 3D % Box Year to Date 2016 Top Cineplex Films 3D % Box
1 Beauty and the Beast 6.5 % 1 Deadpool 5.3 %
2 Guardians Of The Galaxy Vol. 2 5.3 % 2 Finding Dory 4.7 %
3 Wonder Woman 4.7 % 3 Star Wars: The Force Awakens 4.7 %
4 Spider-Man: Homecoming 4.3 % 4 Captain America: Civil War 4.6 %
5 Logan 3.2 % 5 The Jungle Book 4.5 %
Box office revenues for the nine months ended September 30, 2017 were $530.6 million, a decrease of $20.2 million or 3.7% over
the prior year. This was due to the 6.7% decrease in attendance period over period as a result of the weaker film slate of in 2017
compared to the prior year which included two films ranked in the top nine highest grossing films of all-time.
Cineplex’s BPP for the nine month period increased $0.32, or 3.3%, from $9.72 in the prior year period to a record $10.04 in the
current period. This increase was due to price increases in selective markets as compared to the prior year period.
Food service revenues
The following table highlights the movement in food service revenues, attendance and CPP for the quarter and the year to date (in
thousands of dollars, except attendance and same theatre attendance reported in thousands of patrons and per patron amounts):
Food service revenues Third Quarter Year to Date
2017 2016 Change 2017 2016 Change
Food service - theatres $ 100,737 $ 109,278 -7.8 % $ 311,978 $ 318,098 -1.9 %
Food service - The Rec Room 6,292 287 NM $ 10,384 287 NM
Total food service revenues $ 107,029 $ 109,565 -2.3 % $ 322,362 $ 318,385 1.2 %
Attendance (i) 16,766 19,219 -12.8 % 52,843 56,660 -6.7 %
CPP (i) $ 6.01 $ 5.69 5.6 % $ 5.90 $ 5.61 5.2 %
Same theatre food service revenues (i) $ 99,169 $ 108,787 -8.8 % $ 304,235 $ 315,233 -3.5 %
Same theatre attendance (i) 16,562 19,138 -13.5 % 51,793 56,183 -7.8 %
(i) See Non-GAAP measures section of this news release
Theatre food service revenue continuity Third Quarter Year to Date
Theatre Food
Service Attendance Theatre Food
Service Attendance
2016 as reported $ 109,278 19,219 $ 318,098 56,660 Same theatre attendance change (14,639 ) (2,575 ) (24,630 ) (4,390 )
Impact of same theatre CPP change 5,021 — 13,631 —
New and acquired theatres (i) 1,167 137 5,484 693
Disposed and closed theatres (i) (90 ) (15 ) (605 ) (120 )
2017 as reported $ 100,737 16,766 $ 311,978 52,843
(i) See Non-GAAP measures section of this news release. Represents theatres opened, acquired, disposed or closed subsequent to the start of the prior year comparative period.
Third Quarter
Food service revenues are comprised primarily of concession revenues, which includes food service sales at theatre locations and
food and beverage sales at The Rec Room. Food service revenues decreased $2.5 million or 2.3% as compared to the prior year
period due to the 12.8% decrease in attendance, partially offset by the increase in CPP and the operations of The Rec Room which
contributed $6.3 million. Food service revenues from The Rec Room are not included in the CPP calculation.
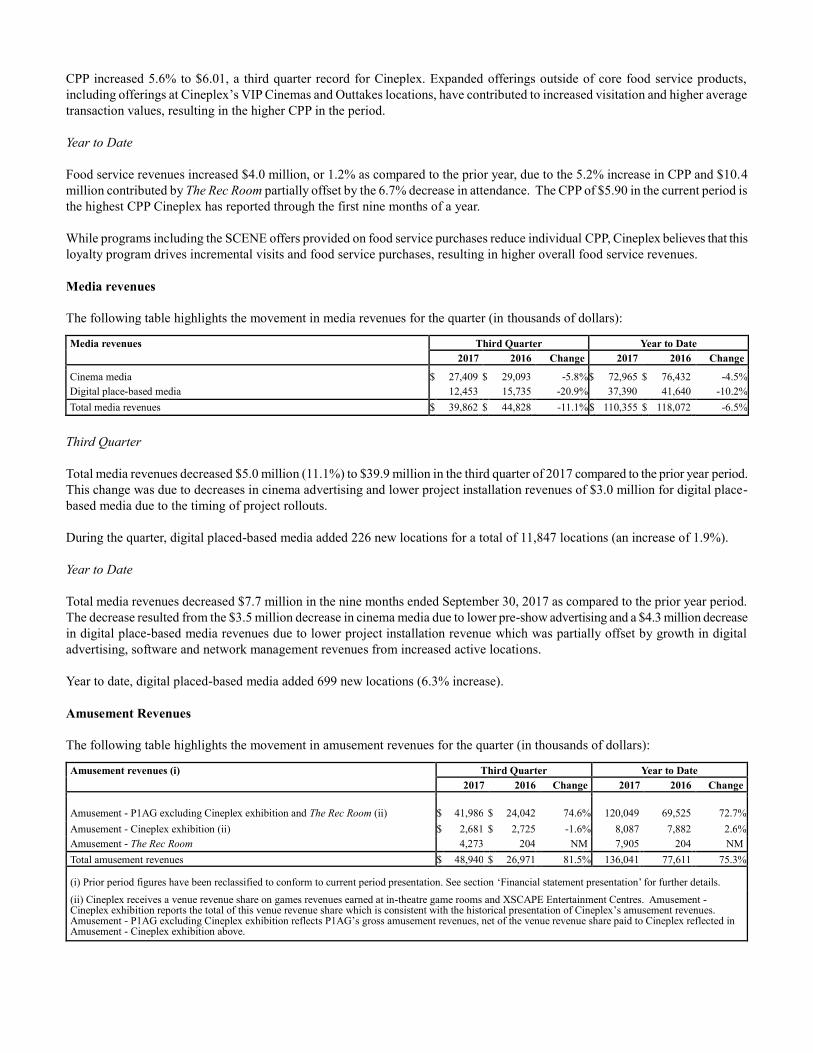
CPP increased 5.6% to $6.01, a third quarter record for Cineplex. Expanded offerings outside of core food service products,
including offerings at Cineplex’s VIP Cinemas and Outtakes locations, have contributed to increased visitation and higher average
transaction values, resulting in the higher CPP in the period.
Year to Date
Food service revenues increased $4.0 million, or 1.2% as compared to the prior year, due to the 5.2% increase in CPP and $10.4
million contributed by The Rec Room partially offset by the 6.7% decrease in attendance. The CPP of $5.90 in the current period is
the highest CPP Cineplex has reported through the first nine months of a year.
While programs including the SCENE offers provided on food service purchases reduce individual CPP, Cineplex believes that this
loyalty program drives incremental visits and food service purchases, resulting in higher overall food service revenues.
Media revenues
The following table highlights the movement in media revenues for the quarter (in thousands of dollars):
Media revenues Third Quarter Year to Date
2017 2016 Change 2017 2016 Change
Cinema media $ 27,409 $ 29,093 -5.8 % $ 72,965 $ 76,432 -4.5 %
Digital place-based media 12,453 15,735 -20.9 % 37,390 41,640 -10.2 %
Total media revenues $ 39,862 $ 44,828 -11.1 % $ 110,355 $ 118,072 -6.5 %
Third Quarter
Total media revenues decreased $5.0 million (11.1%) to $39.9 million in the third quarter of 2017 compared to the prior year period.
This change was due to decreases in cinema advertising and lower project installation revenues of $3.0 million for digital place-
based media due to the timing of project rollouts.
During the quarter, digital placed-based media added 226 new locations for a total of 11,847 locations (an increase of 1.9%).
Year to Date
Total media revenues decreased $7.7 million in the nine months ended September 30, 2017 as compared to the prior year period.
The decrease resulted from the $3.5 million decrease in cinema media due to lower pre-show advertising and a $4.3 million decrease
in digital place-based media revenues due to lower project installation revenue which was partially offset by growth in digital
advertising, software and network management revenues from increased active locations.
Year to date, digital placed-based media added 699 new locations (6.3% increase).
Amusement Revenues
The following table highlights the movement in amusement revenues for the quarter (in thousands of dollars):
Amusement revenues (i) Third Quarter Year to Date
2017 2016 Change 2017 2016 Change
Amusement - P1AG excluding Cineplex exhibition and The Rec Room (ii) $ 41,986
$ 24,042
74.6 % 120,049
69,525
72.7 %
Amusement - Cineplex exhibition (ii) $ 2,681 $ 2,725 -1.6 % 8,087 7,882 2.6 %
Amusement - The Rec Room 4,273 204 NM 7,905 204 NM
Total amusement revenues $ 48,940 $ 26,971 81.5 % 136,041 77,611 75.3 %
(i) Prior period figures have been reclassified to conform to current period presentation. See section ‘Financial statement presentation’ for further details.
(ii) Cineplex receives a venue revenue share on games revenues earned at in-theatre game rooms and XSCAPE Entertainment Centres. Amusement - Cineplex exhibition reports the total of this venue revenue share which is consistent with the historical presentation of Cineplex’s amusement revenues. Amusement - P1AG excluding Cineplex exhibition reflects P1AG’s gross amusement revenues, net of the venue revenue share paid to Cineplex reflected in Amusement - Cineplex exhibition above.

Third Quarter
Amusement revenues increased 81.5%, or $22.0 million, to $48.9 million in the third quarter of 2017 compared to the prior year
period primarily due to the acquisitions of Tricorp and SAW in the fourth quarter of 2016 and Dandy in Q2.
Year to Date
For the year to date period, amusement revenues increased 75.3% or $58.4 million, to $136.0 million primarily due to the
acquisitions of Tricorp and SAW in the fourth quarter of 2016 and Dandy in the current period.
Other revenues
The following table highlights the other revenues which includes revenues from the Cineplex Store, promotional activities,
screenings, private parties, corporate events, breakage on gift card sales and revenues from management fees for the quarter and the
year to date (in thousands of dollars):
Other revenues (i) Third Quarter Year to Date
2017 2016 Change 2017 2016 Change
Other revenues $ 10,124 $ 9,176 10.3 % $ 29,459 $ 28,042 5.1 %
(i) Prior period figures have been reclassified to conform to current period presentation. See section ‘Financial statement presentation’ for further details.
Film cost
The following table highlights the movement in film cost and the film cost percentage for the quarter and the year to date (in
thousands of dollars, except film cost percentage):
Film cost Third Quarter Year to Date
2017 2016 Change 2017 2016 Change
Film cost $ 83,268 $ 95,471 -12.8 % $ 278,025 $ 293,534 -5.3 %
Film cost percentage (i) (ii) 50.6 % 51.5 % -0.9 % 52.4 % 53.3 % -0.9 %
(i) See Non-GAAP measures section of this news release.
(ii) Prior period figures have been reclassified to conform to current period presentation. See section ‘Financial statement presentation’ for further details.
Third Quarter
Film cost varies primarily with box office revenues and can vary from quarter to quarter usually based on the relative strength of the
titles exhibited during the period. This is due to film cost terms varying by title and distributor. Film cost percentage during the third
quarter of 2017 was 50.6%, a 0.9% decrease from the prior year period.
Year to Date
The year to date decrease in film cost expense was due a combination of the 0.9% decrease in the film cost percentage and the lower
box office revenues in the current period compared to the prior year period. The decrease in film cost percentage is attributable to the
top films in the current period having lower settlement rates compared to the prior year period.
Cost of food service
The following table highlights the movement in cost of food service and food service cost as a percentage of food service revenues
(“concession cost percentage”) for the quarter and the year to date (in thousands of dollars, except percentages and margins per
patron):
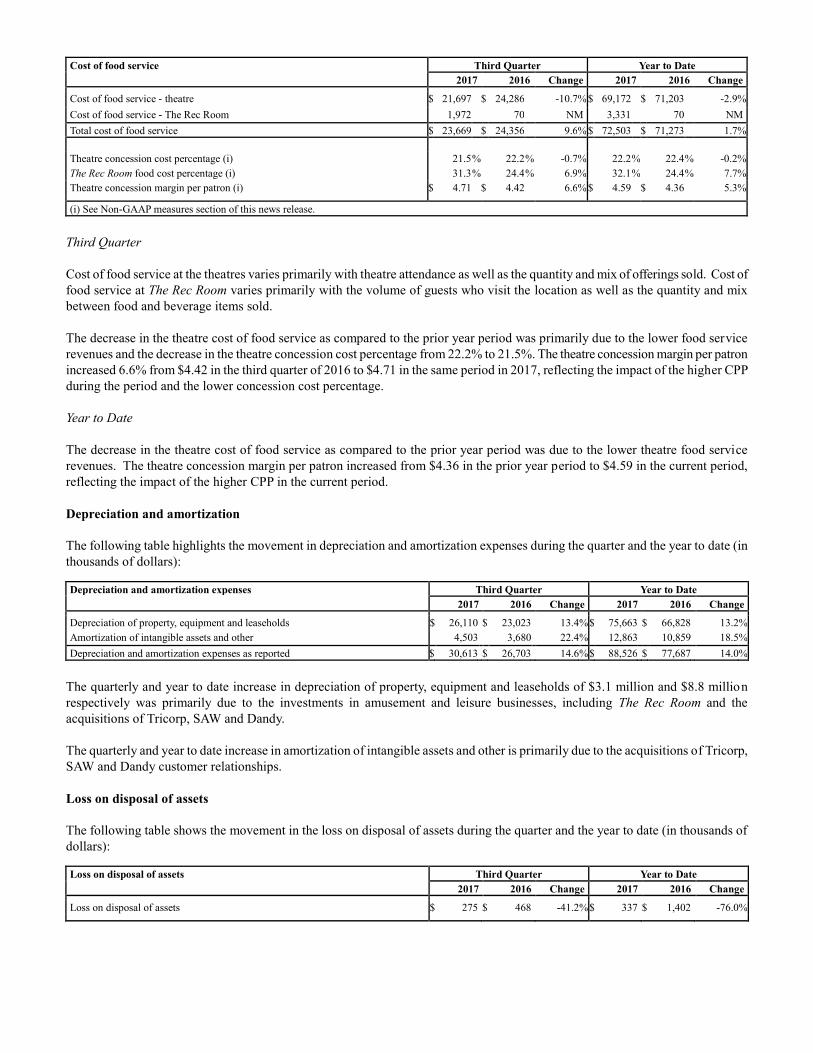
Cost of food service Third Quarter Year to Date
2017 2016 Change 2017 2016 Change
Cost of food service - theatre $ 21,697 $ 24,286 -10.7 % $ 69,172 $ 71,203 -2.9 %
Cost of food service - The Rec Room 1,972 70 NM 3,331 70 NM
Total cost of food service $ 23,669 $ 24,356 9.6 % $ 72,503 $ 71,273 1.7 %
Theatre concession cost percentage (i) 21.5 % 22.2 % -0.7 % 22.2 % 22.4 % -0.2 %
The Rec Room food cost percentage (i) 31.3 % 24.4 % 6.9 % 32.1 % 24.4 % 7.7 %
Theatre concession margin per patron (i) $ 4.71 $ 4.42 6.6 % $ 4.59 $ 4.36 5.3 %
(i) See Non-GAAP measures section of this news release.
Third Quarter
Cost of food service at the theatres varies primarily with theatre attendance as well as the quantity and mix of offerings sold. Cost of
food service at The Rec Room varies primarily with the volume of guests who visit the location as well as the quantity and mix
between food and beverage items sold.
The decrease in the theatre cost of food service as compared to the prior year period was primarily due to the lower food service
revenues and the decrease in the theatre concession cost percentage from 22.2% to 21.5%. The theatre concession margin per patron
increased 6.6% from $4.42 in the third quarter of 2016 to $4.71 in the same period in 2017, reflecting the impact of the higher CPP
during the period and the lower concession cost percentage.
Year to Date
The decrease in the theatre cost of food service as compared to the prior year period was due to the lower theatre food service
revenues. The theatre concession margin per patron increased from $4.36 in the prior year period to $4.59 in the current period,
reflecting the impact of the higher CPP in the current period.
Depreciation and amortization
The following table highlights the movement in depreciation and amortization expenses during the quarter and the year to date (in
thousands of dollars):
Depreciation and amortization expenses Third Quarter Year to Date
2017 2016 Change 2017 2016 Change
Depreciation of property, equipment and leaseholds $ 26,110 $ 23,023 13.4 % $ 75,663 $ 66,828 13.2 %
Amortization of intangible assets and other 4,503 3,680 22.4 % 12,863 10,859 18.5 %
Depreciation and amortization expenses as reported $ 30,613 $ 26,703 14.6 % $ 88,526 $ 77,687 14.0 %
The quarterly and year to date increase in depreciation of property, equipment and leaseholds of $3.1 million and $8.8 million
respectively was primarily due to the investments in amusement and leisure businesses, including The Rec Room and the
acquisitions of Tricorp, SAW and Dandy.
The quarterly and year to date increase in amortization of intangible assets and other is primarily due to the acquisitions of Tricorp,
SAW and Dandy customer relationships.
Loss on disposal of assets
The following table shows the movement in the loss on disposal of assets during the quarter and the year to date (in thousands of
dollars):
Loss on disposal of assets Third Quarter Year to Date
2017 2016 Change 2017 2016 Change
Loss on disposal of assets $ 275 $ 468 -41.2 % $ 337 $ 1,402 -76.0 %

Other costs
Other costs include three main sub-categories of expenses; theatre occupancy expenses, which capture the rent and associated
occupancy costs for Cineplex’s theatre operations; other operating expenses, which include the costs related to running Cineplex’s
film entertainment and content, media, amusement and leisure as well as Cineplex’s ancillary businesses; and general and
administrative expenses, which includes costs related to managing Cineplex’s operations, including head office expenses. Please see
the discussions below for more details on these categories. The following table highlights the movement in other costs for the
quarter and the year to date (in thousands of dollars):
Other costs Third Quarter Year to Date
2017 2016 Change 2017 2016 Change
Theatre occupancy expenses $ 52,320 $ 51,699 1.2 % $ 156,897 $ 155,052 1.2 %
Other operating expenses 143,375 120,398 19.1 % 414,310 352,425 17.6 %
General and administrative expenses 9,067 17,030 -46.8 % 51,082 54,386 -6.1 %
Total other costs $ 204,762 $ 189,127 8.3 % $ 622,289 $ 561,863 10.8 %
Theatre occupancy expenses
The following table highlights the movement in theatre occupancy expenses for the quarter and the year to date (in thousands of
dollars):
Theatre occupancy expenses Third Quarter Year to Date
2017 2016 Change 2017 2016 Change
Rent $ 34,882 $ 34,192 2.0 % $ 103,853 $ 102,568 1.3 %
Other occupancy 17,802 18,009 -1.1 % 54,273 54,933 -1.2 %
One-time items (i) (364 ) (502 ) -27.5 % (1,229 ) (2,449 ) -49.8 %
Total $ 52,320 $ 51,699 1.2 % $ 156,897 $ 155,052 1.2 %
(i) One-time items include amounts related to both rent and other theatre occupancy costs. They are isolated here to illustrate Cineplex’s theatre rent and other theatre occupancy costs excluding these one-time, non-recurring items.
Theatre occupancy continuity Third Quarter Year to Date
Occupancy Occupancy
2016 as reported $ 51,699 $ 155,052 Impact of new and acquired theatres 275 1,022
Impact of disposed theatres (91 ) (383 )
Same theatre rent change (i) 603 1,077
One-time items 139 1,220
Other (305 ) (1,091 )
2017 as reported $ 52,320 $ 156,897
(i) See Non-GAAP measures section of this news release.
Third Quarter
Theatre occupancy expenses increased $0.6 million during the third quarter of 2017 compared to the prior year period. This increase
was primarily due to the impact of one time charges of $0.1 million in addition to the impact of new and acquired theatres net of
disposed theatres and rent increases partially offset by lower other expenses (including real estate taxes).
Year to Date
The increase in theatre occupancy expenses of $1.8 million for the 2017 period compared to the prior year was due to the impact of
one time charges of $1.2 million in addition to the impact of new and acquired theatres, net of disposed theatres and rent increases
net of a decrease in other costs including real estate taxes as compared to the prior year period.
Other operating expenses
The following table highlights the movement in other operating expenses during the quarter and the year to date (in thousands of
dollars):

Other operating expenses Third Quarter Year to Date
2017 2016 Change 2017 2016 Change
Theatre payroll $ 32,944 $ 35,532 -7.3 % $ 104,021 $ 107,430 -3.2 %
Media 16,612 17,929 -7.3 % 51,793 50,399 2.8 %
P1AG 36,197 20,421 77.3 % 103,695 60,165 72.4 %
The Rec Room (i) 7,835 357 NM 13,516 357 NM
Other 49,787 46,159 7.9 % 141,285 134,074 5.4 %
Other operating expenses $ 143,375 $ 120,398 19.1 % $ 414,310 $ 352,425 17.6 %
(i) Includes operating costs of The Rec Room location in Edmonton and Toronto. Pre-opening costs relating to The Rec Room locations and overhead relating to management of The Rec Room portfolio are included in the ‘Other’ line.
Other operating continuity Third Quarter Year to Date
Other Operating Other Operating
2016 as reported $ 120,398 $ 352,425 Impact of new and acquired theatres 532 2,771
Impact of disposed theatres (106 ) (495 )
Same theatre payroll change (i) (2,912 ) (4,834 )
Marketing change (765 ) (4,078 )
Media change (1,317 ) 1,394
P1AG change 15,776 43,530
Amusement gaming and leisure, excluding P1AG 12,188 23,262 Other (419 ) 335
2017 as reported $ 143,375 $ 414,310
(i) See Non-GAAP measures section of this news release.
Third Quarter
Other operating expenses during the third quarter of 2017 increased $23.0 million or 19.1% compared to the prior year period. The
increase is primarily due to higher amusement and leisure costs, including higher P1AG costs due to the acquisitions of Tricorp and
SAW in the fourth quarter of 2016 and Dandy in the second quarter of 2017. Excluding P1AG, the increase to other operating
expenses primarily included increased operating expenses for The Rec Room (which did not have a full period of operations in the
prior year). These increases were partially offset by proactive cost control measures including a $2.9 million decrease in same
theatre payroll due to a decline in attendance, in addition to a $1.3 million decrease in media due to a decrease in media revenues.
Other costs include an increase of $3.4 million in pre-opening costs at The Rec Room and integration costs incurred by P1AG, to
$4.4 million during the quarter.
Year to Date
For the nine months ended September 30, 2017, other operating expenses increased $61.9 million or 17.6% compared to the prior
year period. The increase is primarily due to higher amusement and leisure costs, including higher P1AG costs due to the
acquisitions of Tricorp and SAW in the fourth quarter of 2016 and Dandy in the second quarter of 2017. Excluding P1AG, other
operating expenses increased primarily due to operating expenses for The Rec Room, which did not have a full year of operations in
the prior year, and increases to Media cost due to high payments to third party networks which were partially offset by a $4.0
million decrease in marketing costs and $4.8 million decrease in same theatre payroll due to the decline in attendance. Other costs
include an increase of $7.9 million in pre-opening costs at The Rec Room and integration costs incurred by P1AG, to $9.1 million
during the year to date.
General and administrative expenses
The following table highlights the movement in general and administrative (“G&A”) expenses during the quarter and the year to
date, including Share based compensation costs and G&A net of these costs (in thousands of dollars):

G&A expenses Third Quarter Year to Date
2017 2016 Change 2017 2016 Change
G&A excluding LTIP and option plan expense $ 15,021 $ 15,039 -0.1 % $ 49,404 $ 44,835 10.2 %
LTIP (i) (6,424 ) 1,579 NM 323 8,314 -96.1 %
Option plan 470 412 14.1 % 1,355 1,237 9.5 %
G&A expenses as reported $ 9,067 $ 17,030 -46.8 % $ 51,082 $ 54,386 -6.1 % (i) LTIP includes the expense for the LTIP program as well as the expense for the executive and Board deferred share unit plans.
Third Quarter
G&A expenses decreased $8.0 million during the third quarter of 2017 compared to the prior year period due to a $8.0 million
decrease in LTIP expense. The LTIP expense decrease was mainly due to Cineplex’s lower Share price at September 30, 2017, of
$39.04, compared to $52.86 at June 30, 2017.
Year to Date
G&A expenses for the year to date period decreased $3.3 million compared to the prior year period primarily due to the decrease in
LTIP expense partially offset by higher head office payroll and including non-recurring $1.6 million past-service costs associated
with the supplemental executive retirement plan. The LTIP expense decrease was mainly due to Cineplex’s lower Share price of
$39.04 at September 30, 2017 compared to $51.22 at December 31, 2016.
EARNINGS BEFORE INTEREST, INCOME TAXES, DEPRECIATION AND AMORTIZATION (“EBITDA”) (see
non-GAAP measures section of this news release)
The following table presents EBITDA and adjusted EBITDA for the three and nine months ended September 30, 2017 as compared
to the prior year periods (in thousands of dollars, except adjusted EBITDA margin):
EBITDA Third Quarter Year to Date
2017 2016 Change 2017 2016 Change
EBITDA (i) $ 60,324 $ 67,362 -10.4 % $ 160,073 $ 166,914 -4.1 %
Adjusted EBITDA $ 58,811 $ 67,260 -12.6 % $ 156,315 $ 167,168 -6.5 %
Adjusted EBITDA margin 15.9 % 17.9 % -2.0 % 13.8 % 15.3 % -1.5 %
(i) Prior period figures have been reclassified to conform to current period presentation. See section ‘Financial statement presentation’ for further details.
Adjusted EBITDA for the third quarter of 2017 decreased $8.4 million, or 12.6%, as compared to the prior year period. Adjusted
EBITDA margin, calculated as adjusted EBITDA divided by total revenues, was 15.9% in the current period. The decrease as
compared to the prior year period was due in part to higher costs attributable to Cineplex’s emerging businesses including startup
costs at The Rec Room and integration costs at P1AG totaling $4.4 million as it continues to execute its diversification strategy.
Adjusted EBITDA for the nine months ended September 30, 2017 decreased $10.9 million, or 6.5%, as compared to the prior year
period. The decrease was due in part to Cineplex’s continued higher costs attributable to Cineplex’s emerging businesses including
startup costs at The Rec Room and integration costs at P1AG totaling $9.1 million as it continues to execute its diversification
strategy. Adjusted EBITDA margin for the period was 13.8%, a decrease of 1.5% from 15.3% in the prior year period.
ADJUSTED FREE CASH FLOW (see non-GAAP measures section of this news release)
For the third quarter of 2017, adjusted free cash flow per common share of Cineplex was $0.60 as compared to $0.74 in the prior
year period. The declared dividends per common share of Cineplex were $0.42 in the third quarter of 2017 and $0.41 in the prior
year period. During the 12 months ended September 30, 2017, Cineplex generated adjusted free cash flow per Share of $2.18,
compared to $2.67 per Share in the 12 months ended September 30, 2016. Cineplex declared dividends per Share of $1.65 and
$1.59, respectively, in each period. The payout ratios for these periods were approximately 75.3% and 59.3%, respectively.

FINANCIAL STATEMENT PRESENTATION
Cineplex has reclassified box office, amusement and other revenues to reflect the growth of its Amusement and Leisure
business and to enhance comparability with exhibition peers in the United States. Certain revenues from Cineplex’s enhanced
guest experience initiatives were previously included in other revenues and are now included with box office revenues. This
presentation is consistent with other exhibitors and better reflects how Cineplex management measures and operates the
business. This affects the BPP, film cost percentage and percentage of premium priced products due to the increase in box
office revenues reported. Prior period financial statement figures have been reclassified to conform to current period
presentation. The following table presents the reclassified box office revenues for the three and nine months ended September
30, 2016 (in thousands of dollars):
Three months ended September 30, 2016
Nine months ended September 30, 2016
Box office - previous presentation $ 180,146 $ 534,930
Reclassification from other revenues 5,266 15,850
Box Office - new presentation $ 185,412 $ 550,780
Other revenues also previously contained all amusement revenue. Due to the growth of Cineplex’s amusement solutions and
location based entertainment businesses, these revenues are now separately reported as amusement revenues. The following table
presents the reclassified other revenues for the three and nine months ended September 30, 2016 (in thousands of dollars):
Three months ended September 30, 2016
Nine months ended September 30, 2016
Other revenues - previous presentation $ 41,413 $ 121,503
Reclassification to box office revenues (5,266 ) (15,850 )
Reclassification to amusement revenues (26,971 ) (77,611 )
Other revenues - new presentation $ 9,176 $ 28,042
Cineplex had previously included foreign exchange gain and losses in interest expense. As of January 1, 2017, the foreign exchange
gains and losses are reported separately on the statements of operations. The prior year period figures have been reclassified to
conform to current period presentation. The following table reflects the changes to the interest expense due to the change in
presentation for the three and nine months ended September 30, 2016 (in thousands of dollars):
Three months ended September 30, 2016
Nine months ended September 30, 2016
Interest expense - previous presentation $ 4,575 $ 14,296
Reclassification to foreign exchange (79 ) 16
Interest expense - new presentation $ 4,496 $ 14,312
NON-GAAP FINANCIAL MEASURES
EBITDA and Adjusted Free Cash Flow
EBITDA and adjusted free cash flow are not measures recognized by GAAP and do not have standardized meanings in accordance
with such principles. Therefore, EBITDA and adjusted free cash flow may not be comparable to similar measures presented by
other issuers. Management uses adjusted EBITDA and adjusted free cash flow to evaluate performance primarily because of the
significant effect certain unusual or non-recurring charges and other items have on EBITDA from period to period.
EBITDA is calculated by adding back to net income, income tax expense, depreciation and amortization expense, and interest
income. Adjusted EBITDA is calculated by adjusting EBITDA for the change in fair value of financial instrument, losses on
disposal of assets, foreign exchange (loss) gain, the equity income of CDCP, the non-controlling interests’ share of adjusted EBITDA
of WGN and Brady Starburst LLC, and depreciation, amortization, interest and taxes of Cineplex’s other joint ventures. Adjusted
EBITDA margin is calculated by dividing adjusted EBITDA by total revenues.

Adjusted free cash flow is a non-GAAP measure generally used by Canadian corporations, as an indicator of financial performance
and it should not be seen as a measure of liquidity or a substitute for comparable metrics prepared in accordance with GAAP.
For a detailed reconciliation of net income to EBITDA and adjusted EBITDA and from cash provided by operating activities to
adjusted free cash flow, please refer to Cineplex’s management’s discussion and analysis filed on www.sedar.com.
Earnings per Share Metrics
The nine months ended September 30, 2017 includes the gain associated with the change in fair value of financial instrument
relating to the WGN put option and the revaluation of certain financial assets. Cineplex has presented basic and diluted earnings per
share net of this item to provide a more comparable earnings per share metric between the current periods and prior year periods. In
the non-GAAP measure, earnings is defined as net income excluding the change in fair value of financial instrument.
Per Patron Revenue Metrics
Cineplex reviews per patron metrics as they relate to box office revenue and theatre food service revenue such as BPP, CPP, BPP
excluding premium priced product, and concession margin per patron, as these are key measures used by investors to value and
assess Cineplex’s performance, and are widely used in the theatre exhibition industry. Management of Cineplex defines these
metrics as follows:
Attendance: Attendance is calculated as the total number of paying patrons that frequent Cineplex’s theatres during the period.
BPP: Calculated as total box office revenues divided by total paid attendance for the period.
BPP excluding premium priced product: Calculated as total box office revenues for the period, less box office revenues from 3D,
4DX, UltraAVX, VIP and IMAX product; divided by total paid attendance for the period, less paid attendance for 3D, 4DX,
UltraAVX, VIP and IMAX product.
CPP: Calculated as total theatre food service revenues divided by total paid attendance for the period.
Premium priced product: Defined as 3D, 4DX, UltraAVX, IMAX and VIP film product.
Theatre concession margin per patron: Calculated as total food service revenues less total food service cost, divided by
attendance for the period.
Same Theatre Analysis
Cineplex reviews and reports same theatre metrics relating to box office revenues, theatre food service revenues, theatre rent
expense and theatre payroll expense, as these measures are widely used in the theatre exhibition industry as well as other retail
industries.
Same theatre metrics are calculated by removing the results for all theatres that have been opened, acquired, closed or otherwise
disposed of subsequent to the start of the prior year comparative period. For the three months ended September 30, 2017 the impact
of the three locations that have been opened or acquired and three locations that have been closed have been excluded, resulting in
157 theatres being included in the same theatre metrics. For the nine months ended September 30, 2017 the impact of the four
locations that have been opened or acquired and the three locations that have been closed have been excluded, resulting in 156
theatres being included in the same theatre metrics.
Cost of sales percentages
Cineplex reviews and reports cost of sales percentages for its two largest revenue sources, box office revenues and theatre food
service revenues as these measures are widely used in the theatre exhibition industry. These measures are reported as film cost
percentage and concession cost percentage, respectively, and are calculated as follows:
Film cost percentage: Calculated as total film cost expense divided by total box office revenues for the period.
Theatre concession cost percentage: Calculated as total theatre food service costs divided by total theatre food service revenues for
the period.
The Rec Room food cost percentage: Calculated as total The Rec Room food costs divided by total The Rec Room food service
revenues for the period.

Certain information included in this news release contains forward-looking statements within the meaning of applicable securities
laws. These forward-looking statements include, among others, statements with respect to Cineplex’s objectives, goals and
strategies to achieve those objectives and goals, as well as statements with respect to Cineplex’s beliefs, plans, objectives,
expectations, anticipations, estimates and intentions. The words “may”, “will”, “could”, “should”, “would”, “suspect”,
“outlook”, “believe”, “plan”, “anticipate”, “estimate”, “expect”, “intend”, “forecast”, “objective” and “continue” (or the
negative thereof), and words and expressions of similar import, are intended to identify forward-looking statements.
By their very nature, forward-looking statements involve inherent risks and uncertainties, including those described in Cineplex’s
Annual Information Form (“AIF”), Cineplex’s management’s discussion and analysis (“MD&A”) and in this news release. Those
risks and uncertainties, both general and specific, give rise to the possibility that predictions, forecasts, projections and other
forward-looking statements will not be achieved. Certain material factors or assumptions are applied in making forward-looking
statements and actual results may differ materially from those expressed or implied in such statements. Cineplex cautions readers
not to place undue reliance on these statements, as a number of important factors, many of which are beyond Cineplex’s control,
could cause actual results to differ materially from the beliefs, plans, objectives, expectations, anticipations, estimates and intentions
expressed in such forward-looking statements. These factors include, but are not limited to, risks generally encountered in the
relevant industry, competition, customer, legal, taxation and accounting matters.
The foregoing list of factors that may affect future results is not exhaustive. When reviewing Cineplex’s forward-looking statements,
readers should carefully consider the foregoing factors and other uncertainties and potential events. Additional information about
factors that may cause actual results to differ materially from expectations and about material factors or assumptions applied in
making forward-looking statements may be found in the “Risks and Uncertainties” section of Cineplex’s MD&A.
Cineplex does not undertake to update or revise any forward-looking statements, whether as a result of new information, future
events or otherwise, except as required by applicable Canadian securities law. Additionally, we undertake no obligation to comment
on analyses, expectations or statements made by third parties in respect of Cineplex, its financial or operating results or its
securities. All forward-looking statements in this news release are made as of the date hereof and are qualified by these cautionary
statements. Additional information, including Cineplex’s AIF and MD&A, can be found on SEDAR at www.sedar.com.
About Cineplex
A leading entertainment and media company, Cineplex (TSX:CGX) is a top-tier Canadian brand that operates in the Film
Entertainment and Content, Amusement and Leisure, and Media sectors. As Canada’s largest and most innovative film exhibitor,
Cineplex welcomes 75 million guests annually through its circuit of 163 theatres across the country. Cineplex also operates
successful businesses in digital commerce (CineplexStore.com), food service, alternative programming (Cineplex Events), cinema
media (Cineplex Media), digital place-based media (Cineplex Digital Media), amusement solutions (Player One Amusement Group)
and an online eSports platform for competitive and passionate gamers (WorldGaming.com). Additionally, Cineplex operates a
location based entertainment business through Canada’s newest destination for ‘Eats & Entertainment’ (The Rec Room), and will
also be opening new complexes specially designed for teens and families (Playdium) as well as exciting new sports and
entertainment venues in communities across the country (Topgolf). Cineplex is a joint venture partner in SCENE, Canada’s largest
entertainment loyalty program.
Proudly recognized as having one of the country’s Most Admired Corporate Cultures, Cineplex employs approximately 13,000
people in its offices across Canada and the United States. To learn more visit Cineplex.com or download the Cineplex App.

You are cordially invited to participate in a teleconference call with the management of Cineplex (TSX: CGX) to review our
quarterly results. Ellis Jacob, President and Chief Executive Officer, Gord Nelson, Chief Financial Officer and Pat
Marshall, Investor Relations Officer will host the call. The teleconference call is scheduled for:
Tuesday November 7, 2017
10:00 a.m. Eastern Time
In order to participate in the conference call, please dial 416-849-1847 or outside Toronto and from the U.S. dial 1-800-274-
0251 at least five to ten minutes prior to 10:00 a.m. ET. Please quote the conference confirmation code 9252966 to access the
call.
If you cannot participate in a live mode, a replay will be available. Please dial 647-436-0148 or outside Toronto and from the
U.S. 1-888-203-1112. The replay passcode is 236679.
The replay will begin at 1:00 pm ET on Tuesday November 7, 2017, and end at 1:00 pm ET on Tuesday November 14, 2017.
Note that media will be participating in the call in listen-only mode.
- 30 -
For further information:
Gord Nelson Pat Marshall
Chief Financial Officer Vice President Communications and Investor Relations
(416) 323-6602 (416) 323-6648

Cineplex Inc.
Interim Condensed Consolidated Balance Sheets
(Unaudited)
(expressed in thousands of Canadian dollars)
September 30, December 31,
2017 2016
Assets
Current assets
Cash and cash equivalents $ 18,747 $ 33,553
Trade and other receivables 82,214 115,903
Income taxes receivable 1,478 463
Inventories 28,307 21,412
Prepaid expenses and other current assets 21,039 10,856
Fair value of interest rate swap agreements 249 —
152,034 182,187
Non-current assets
Property, equipment and leaseholds 617,120 564,879
Deferred income taxes 7,284 5,891
Fair value of interest rate swap agreements 3,324 756
Interests in joint ventures 34,484 35,487
Intangible assets 120,891 125,492
Goodwill 816,445 813,494
$ 1,751,582 $ 1,728,186
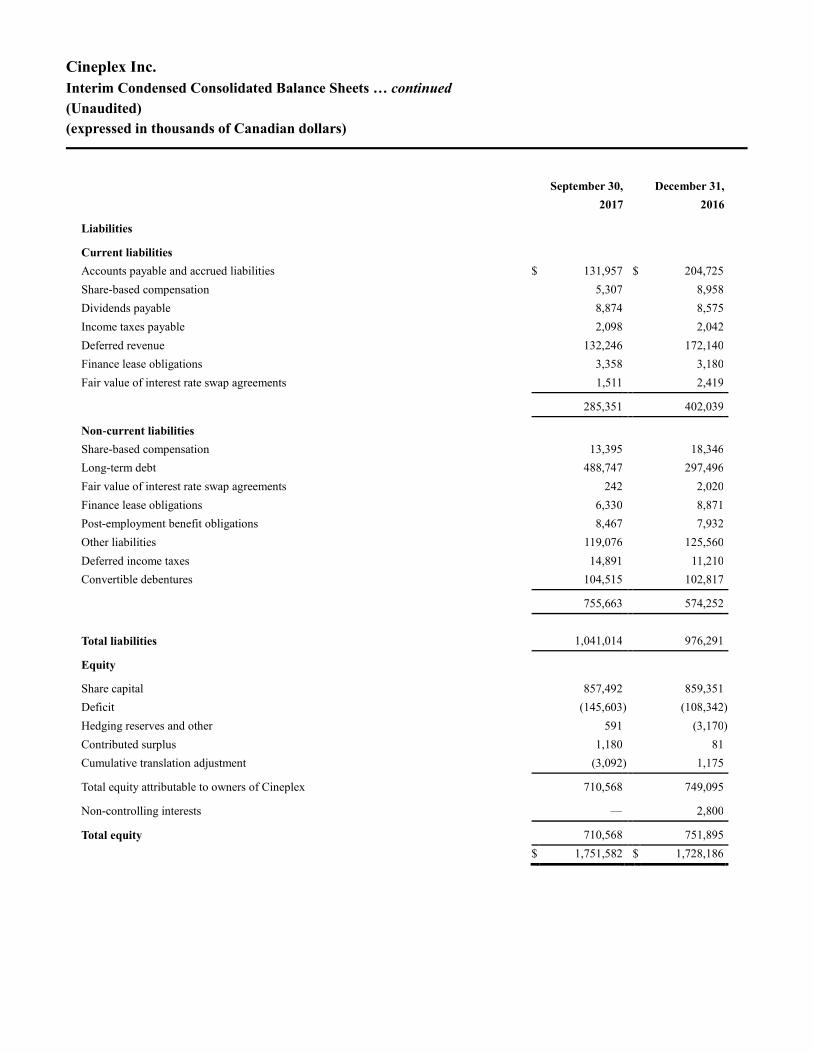
Cineplex Inc.
Interim Condensed Consolidated Balance Sheets … continued
(Unaudited)
(expressed in thousands of Canadian dollars)
September 30, December 31,
2017 2016
Liabilities
Current liabilities
Accounts payable and accrued liabilities $ 131,957 $ 204,725
Share-based compensation 5,307 8,958
Dividends payable 8,874 8,575
Income taxes payable 2,098 2,042
Deferred revenue 132,246 172,140
Finance lease obligations 3,358 3,180
Fair value of interest rate swap agreements 1,511 2,419
285,351 402,039
Non-current liabilities
Share-based compensation 13,395 18,346
Long-term debt 488,747 297,496
Fair value of interest rate swap agreements 242 2,020
Finance lease obligations 6,330 8,871
Post-employment benefit obligations 8,467 7,932
Other liabilities 119,076 125,560
Deferred income taxes 14,891 11,210
Convertible debentures 104,515 102,817
755,663 574,252
Total liabilities 1,041,014 976,291
Equity
Share capital 857,492 859,351
Deficit (145,603 ) (108,342 )
Hedging reserves and other 591 (3,170 )
Contributed surplus 1,180 81
Cumulative translation adjustment (3,092 ) 1,175
Total equity attributable to owners of Cineplex 710,568 749,095
Non-controlling interests — 2,800
Total equity 710,568 751,895
$ 1,751,582 $ 1,728,186
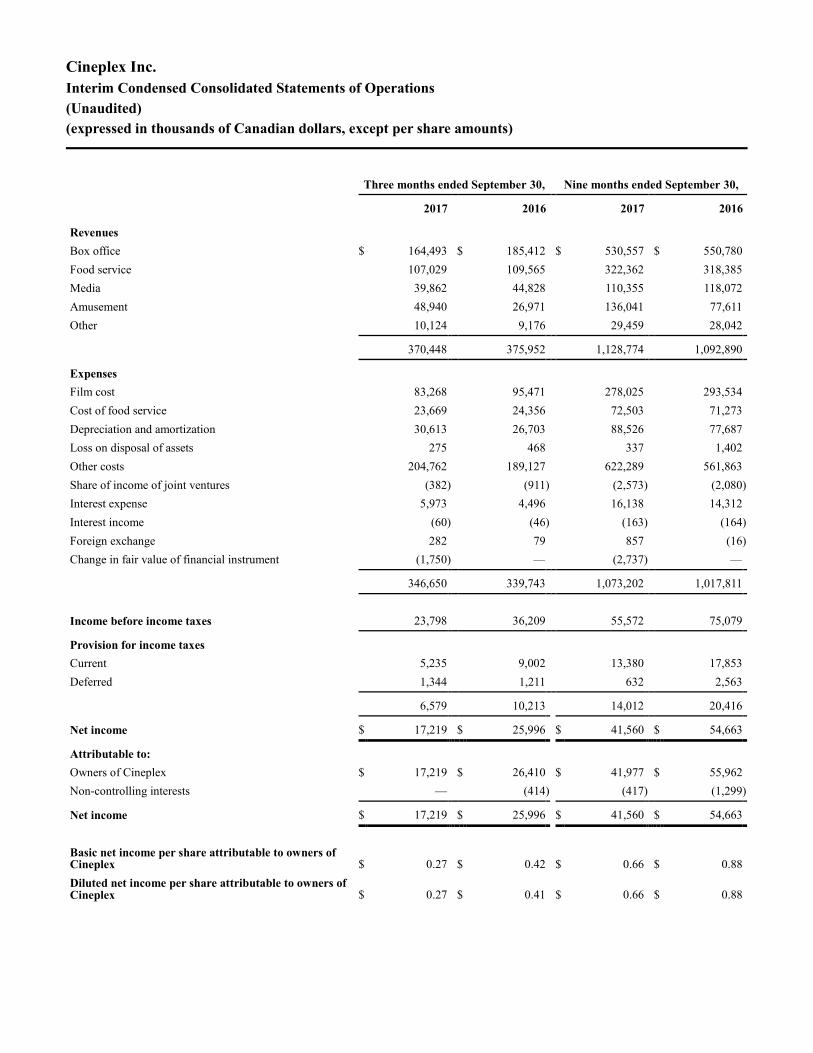
Cineplex Inc.
Interim Condensed Consolidated Statements of Operations
(Unaudited)
(expressed in thousands of Canadian dollars, except per share amounts)
Three months ended September 30, Nine months ended September 30,
2017 2016 2017 2016
Revenues
Box office $ 164,493 $ 185,412 $ 530,557 $ 550,780
Food service 107,029 109,565 322,362 318,385
Media 39,862 44,828 110,355 118,072
Amusement 48,940 26,971 136,041 77,611
Other 10,124 9,176 29,459 28,042
370,448 375,952 1,128,774 1,092,890
Expenses
Film cost 83,268 95,471 278,025 293,534
Cost of food service 23,669 24,356 72,503 71,273
Depreciation and amortization 30,613 26,703 88,526 77,687
Loss on disposal of assets 275 468 337 1,402
Other costs 204,762 189,127 622,289 561,863
Share of income of joint ventures (382 ) (911 ) (2,573 ) (2,080 )
Interest expense 5,973 4,496 16,138 14,312
Interest income (60 ) (46 ) (163 ) (164 )
Foreign exchange 282 79 857 (16 )
Change in fair value of financial instrument (1,750 ) — (2,737 ) —
346,650 339,743 1,073,202 1,017,811
Income before income taxes 23,798 36,209 55,572 75,079
Provision for income taxes
Current 5,235 9,002 13,380 17,853
Deferred 1,344 1,211 632 2,563
6,579 10,213 14,012 20,416
Net income $ 17,219 $ 25,996 $ 41,560 $ 54,663
Attributable to:
Owners of Cineplex $ 17,219 $ 26,410 $ 41,977 $ 55,962
Non-controlling interests — (414 ) (417 ) (1,299 )
Net income $ 17,219 $ 25,996 $ 41,560 $ 54,663
Basic net income per share attributable to owners of Cineplex $ 0.27
$ 0.42
$ 0.66
$ 0.88
Diluted net income per share attributable to owners of Cineplex $ 0.27
$ 0.41
$ 0.66
$ 0.88

Cineplex Inc.
Interim Condensed Consolidated Statements of Comprehensive Income
(Unaudited)
(expressed in thousands of Canadian dollars)
Three months ended
September 30, Nine months ended
September 30,
2017 2016 2017 2016
Net income $ 17,219 $ 25,996 $ 41,560 $ 54,663
Other comprehensive income (loss)
Items that will be reclassified subsequently to net income:
Income (loss) on hedging instruments 3,088 467 5,135 (881 )
Associated deferred income taxes (expense) recovery (825 ) (125 ) (1,374 ) 246
Foreign currency translation adjustment (2,203 ) 539 (4,193 ) (1,209 )
Items that will not be reclassified to net income:
Actuarial gains of post-employment benefit obligations — — 1,298 —
Associated deferred income taxes expense — — (348 ) —
Other comprehensive income (loss) 60 881 518 (1,844 )
Comprehensive income $ 17,279 $ 26,877 $ 42,078 $ 52,819
Attributable to:
Owners of Cineplex $ 17,279 $ 27,244 $ 42,484 $ 54,354
Non-controlling interests — (367 ) (406 ) (1,535 )
Comprehensive income $ 17,279 $ 26,877 $ 42,078 $ 52,819

Cineplex Inc.
Interim Condensed Consolidated Statements of Changes in Equity
(Unaudited)
(expressed in thousands of Canadian dollars)
For the periods ended September 30, 2017 and 2016
Share
capital Contributed
surplus
Hedging reserves and
other
Cumulative translation adjustment Deficit
Non-controlling
interests Total
Balance - January 1, 2017 $ 859,351
$ 81
$ (3,170 ) $ 1,175
$ (108,342 ) $ 2,800
$ 751,895
Net income — — — — 41,977 (417 ) 41,560
Other comprehensive income —
—
3,761
(4,204 ) 950 11
518
Total comprehensive income —
—
3,761
(4,204 ) 42,927 (406 ) 42,078
Dividends declared — — — — (78,753 ) — (78,753 )
Share option expense — 1,355 — — — — 1,355
Issuance of shares on exercise of options 256 (256 ) — — — — —
Shares repurchased and cancelled (2,115 ) — — — (3,892 ) — (6,007 )
WGN non-controlling interests acquired —
—
—
(63 ) 2,457
(2,394 ) —
Balance - September 30, 2017 $ 857,492
$ 1,180
$ 591
$ (3,092 ) $ (145,603 ) $ —
$ 710,568
Balance - January 1, 2016 $ 858,305
$ (491 ) $ (4,979 ) $ 934
$ (86,296 ) $ 5,024
$ 772,497
Net income — — — — 55,962 (1,299 ) 54,663
Other comprehensive loss — —
(635 ) (973 ) —
(236 ) (1,844 )
Total comprehensive income — —
(635 ) (973 ) 55,962
(1,535 ) 52,819
Dividends declared — — — — (75,815 ) — (75,815 )
Share option expense — 1,237 — — — — 1,237
Issuance of shares on exercise of options 905 (905 ) — — — — —
CSI non-controlling interests acquired — — — — — (336 ) (336 )
Balance - September 30, 2016 $ 859,210
$ (159 ) $ (5,614 ) $ (39 ) $ (106,149 ) $ 3,153
$ 750,402

Cineplex Inc.
Interim Condensed Consolidated Statements of Cash Flows
(Unaudited)
(expressed in thousands of Canadian dollars)
Three months ended September 30, Nine months ended September 30,
2017 2016 2017 2016
Cash (used in) provided by
Operating activities
Net income $ 17,219 $ 25,996 $ 41,560 $ 54,663
Adjustments to reconcile net income to net cash provided by operating activities
Depreciation and amortization of property, equipment and leaseholds, and intangible assets 30,613
26,703
88,526
77,687
Amortization of tenant inducements, rent averaging liabilities and fair value lease contract liabilities (2,443 ) (2,657 ) (7,500 ) (7,143 )
Accretion of debt issuance costs and other non-cash interest, net 156 259 441 402
Loss on disposal of assets 275 468 337 1,402
Deferred income taxes 1,344 1,211 632 2,563
Interest rate swap agreements - non-cash interest 62 (39 ) (244 ) 767
Non-cash share-based compensation 470 412 1,355 1,237
Change in fair value of financial instruments (1,750 ) — (2,737 ) —
Accretion of convertible debentures 565 531 1,697 1,583
Net change in interests in joint ventures 1,275 (1,553 ) (2,612 ) (1,851 )
Tenant inducements 2,594 1,291 2,992 3,685
Changes in operating assets and liabilities (12,675 ) (16,025 ) (88,928 ) (100,395 )
Net cash provided by operating activities 37,705 36,597 35,519 34,600
Investing activities
Proceeds from sale of assets — — 310 108
Purchases of property, equipment and leaseholds (47,869 ) (28,787 ) (123,640 ) (76,325 )
Acquisition of businesses, net of cash acquired (735 ) — (30,422 ) (407 )
Intangible assets additions (1,160 ) (329 ) (3,742 ) (610 )
Net cash received from CDCP 2,246 1,568 3,615 2,370
Net cash used in investing activities (47,518 ) (27,548 ) (153,879 ) (74,864 )
Financing activities
Dividends paid (26,688 ) (25,713 ) (78,454 ) (75,482 )
Borrowings under credit facilities, net 41,000 5,798 191,000 107,634
Payments under finance leases (802 ) (746 ) (2,363 ) (2,197 )
Deferred financing fees (183 ) (22 ) (183 ) (1,426 )
Shares repurchased and cancelled (6,007 ) — (6,007 ) —
Net cash provided by (used in) financing activities 7,320 (20,683 ) 103,993 28,529
Effect of exchange rate differences on cash (184 ) 231 (439 ) (293 )
Decrease in cash and cash equivalents (2,677 ) (11,403 ) (14,806 ) (12,028 )
Cash and cash equivalents - Beginning of period 21,424 35,088 33,553 35,713
Cash and cash equivalents - End of period $ 18,747 $ 23,685 $ 18,747 $ 23,685
Supplemental information
Cash paid for interest $ 4,401 $ 2,965 $ 16,232 $ 10,839
Cash paid for income taxes, net $ 588 $ (712 ) $ 14,986 $ 45,434

Cineplex Inc.
Interim Consolidated Supplemental Information
(Unaudited)
(expressed in thousands of Canadian dollars)
Reconciliation to Adjusted EBITDA
Three months ended September 30, Nine months ended September 30,
2017 2016 2017 2016
Net income $ 17,219 $ 25,996 $ 41,560 $ 54,663
Depreciation and amortization 30,613 26,703 88,526 77,687
Interest expense (i) 5,973 4,496 16,138 14,312
Interest income (60 ) (46 ) (163 ) (164 )
Current income tax expense 5,235 9,002 13,380 17,853
Deferred income tax expense 1,344 1,211 632 2,563
EBITDA $ 60,324 $ 67,362
$ 160,073 $ 166,914
Loss on disposal of assets 275 468 337 1,402
CDCP equity income (ii) (342 ) (889 ) (2,469 ) (1,945 )
Foreign exchange loss (gain) (i) 282 79 857 (16 )
Non-controlling interest EBITDA of WGN and BSL — 218 189 746
Depreciation and amortization - joint ventures (iii) 9 10 27 29
Joint venture taxes and interest (iii) 13 12 38 38
Change in fair value of financial instrument (1,750 ) — (2,737 ) —
Adjusted EBITDA $ 58,811 $ 67,260 $ 156,315 $ 167,168
(i) Prior period figures have been reclassified to conform to current period presentation. See section ‘Financial statement presentation’ for further
details.
(ii) CDCP equity income not included in adjusted EBITDA as CDCP is a limited-life financing vehicle that is funded by virtual print fees
collected from distributors.
(iii) Includes the joint ventures with the exception of CDCP (see (ii) above).

Cineplex Inc.
Interim Consolidated Supplemental Information
(Unaudited)
(expressed in thousands of Canadian dollars, except number of shares and per share data)
Adjusted Free Cash Flow
Three months ended September 30, Nine months ended September 30,
2017 2016 2017 2016
Cash provided by operating activities $ 37,705 $ 36,597 $ 35,519 $ 34,600
Less: Total capital expenditures net of proceeds on sale of assets (47,869 ) (28,787 ) (123,330 ) (76,217 )
Standardized free cash flow (10,164 ) 7,810 (87,811 ) (41,617 )
Add/(Less):
Changes in operating assets and liabilities (i) 12,675 16,025 88,928 100,395
Changes in operating assets and liabilities of joint ventures (i) (1,657 ) 642 39 (229 )
Tenant inducements (ii) (2,594 ) (1,291 ) (2,992 ) (3,685 )
Principal component of finance lease obligations (802 ) (746 ) (2,363 ) (2,197 )
Growth capital expenditures and other (iii) 38,149 22,621 99,484 60,438
Share of income of joint ventures, net of non-cash depreciation (iv) 62 44 169 202
Non-controlling interests of WGN and BSL — 218 189 746
Net cash received from CDCP (iv) 2,246 1,568 3,615 2,370
Adjusted free cash flow $ 37,915 $ 46,891 $ 99,258 $ 116,423
Average number of Shares outstanding 63,508,418 63,491,658 63,515,158 63,436,252
Adjusted free cash flow per Share $ 0.597 $ 0.739 $ 1.563 $ 1.835
Dividends declared $ 0.420 $ 0.405 $ 1.240 $ 1.195
(i) Changes in operating assets and liabilities are not considered a source or use of adjusted free cash flow.
(ii) Tenant inducements received are for the purpose of funding new theatre capital expenditures and are not considered a source of
adjusted free cash flow.
(iii) Growth capital expenditures and other represent expenditures on Board approved projects, exclude maintenance capital
expenditures, and are net of proceeds on asset sales. Cineplex’s revolving facility is available to fund Board approved projects.
(iv) Excludes the share of income of CDCP, as CDCP is a limited-life financing vehicle funded by virtual print fees collected from
distributors. Cash invested into CDCP, as well as cash distributions received from CDCP, are considered to be uses and sources of
adjusted free cash flow.